predicting success in college: the importance of placement ... · predicting success in college:...
TRANSCRIPT
Predicting Success in College: The Importance of Placement Tests and High School Transcripts
Clive R. Belfield Queens College, The City University of New York
Peter M. Crosta
Community College Research Center Teachers College, Columbia University
February 2012
CCRC Working Paper No. 42
Address correspondence to: Clive R. Belfield Associate Professor of Economics Queens College, The City University of New York 65-30 Kissena Blvd Flushing, NY 11367 Email: [email protected] The authors gratefully acknowledge community college personnel for access to the data; research support from Emma Garcia; comments from Judith Scott-Clayton, Davis Jenkins and Tom Bailey; and editorial assistance from Betsy Yoon and Amy Mazzariello. This work draws significantly on prior research by Judith Scott-Clayton, Teachers College, Columbia University. The research reported here was supported by the community college system and by the Institute of Education Sciences, U.S. Department of Education, through Grant R305A06060010 to the National Center for Postsecondary Research, Teachers College, Columbia University. The opinions expressed are those of the authors and do not necessarily represent the views of the community college system, the Institute, or the U.S. Department of Education.

Abstract
This paper uses student-level data from a statewide community college system to
examine the validity of placement tests and high school information in predicting course
grades and college performance. We consider the ACCUPLACER and COMPASS
placement tests, using two quantitative and two literacy tests from each battery.
We find that placement tests do not yield strong predictions of how students will
perform in college. Placement test scores are positively�—but weakly�—associated with
college grade point average (GPA). When we control for high school GPA, the
correlation disappears. Placement test scores are positively associated with college credit
accumulation even after controlling for high school GPA. After three to five semesters, a
student with a placement test score in the highest quartile has on average nine credits
more than a student with a placement test score in the lowest quartile.
In contrast, high school GPAs are useful for predicting many aspects of students�’
college performance. High school GPA has a strong association with college GPA;
students�’ college GPAs are approximately 0.6 units below their high school GPAs. High
school GPA also has a strong association with college credit accumulation. A student
whose high school GPA is one grade higher will have accumulate approximately four
extra credits per semester. Other information from high school transcripts is modestly
useful; this includes number of math and English courses taken in high school, honors
courses, number of F grades, and number of credits. This high school information is not
independently useful beyond high school GPA, and collectively it explains less variation
in college performance.
We also calculate accuracy rates and four validity metrics for placement tests. We
find high �“severe�” error rates using the placement test cutoffs. The severe error rate for
English is 27 to 33 percent; i.e., three out of every ten students is severely misassigned.
For math, the severe error rates are lower but still nontrivial. Using high school GPA
instead of placement tests reduces the severe error rates by half across both English and
math.
Table of Contents
1. Introduction................................................................................................................... 1
2. Framework .................................................................................................................... 2 2.1 Placement Tests........................................................................................................ 2 2.2 High School Transcripts........................................................................................... 3 2.3 Prior Literature ......................................................................................................... 4
3. Method ........................................................................................................................... 6 3.1 Data .......................................................................................................................... 6 3.2 Analysis.................................................................................................................... 9
4. Results .......................................................................................................................... 13 4.1 Correlations ............................................................................................................ 13 4.2 Validity Metrics ..................................................................................................... 25
5. Conclusion ................................................................................................................... 39
References........................................................................................................................ 41


1
1. Introduction
Increasing attention is being paid to the pathways that students take during college
and the obstacles they face in completing their diplomas. A critical step on the student
pathway is the placement of students as they enter college. According to Horn and Nevill
(2006; see Table 6.2), approximately two fifths of community college students take at
least one remedial or developmental education course; other estimates are even higher
(e.g., Office of Program Policy Analysis and Government Accountability, 2006). Many
of these students never transition from developmental education (DE) courses to college-
level courses. Bailey, Jeong, and Cho (2010) estimate that up to two thirds of these
students fail to complete the required DE course sequence that would enable them to take
college-level classes. Over their college careers, only a fraction of DE students graduate
with an award. It is therefore critical that in the short run, students are accurately placed
into developmental education and that in the long run, colleges advise students using
information that does in fact predict college success.
Yet the accuracy of placement decisions remains an open question. Many of these
decisions are made on the basis of placement test scores, but the accuracy of these
scores�—and how colleges interpret them�—has received little systematic research
attention (for an overview, see Hughes and Scott-Clayton, [2011]). Perhaps colleges
would be able to make more accurate placements by using alternative tests, interpreting
the tests differently, or supplementing test scores with additional information based on
students�’ prior education. For example, information on a student�’s high school transcript
could complement or substitute for that student�’s placement test scores. This would lead
to a faster and more successful progression through college.
A recent paper by Scott-Clayton (2012) addresses many of these validity issues.
Scott-Clayton develops a set of metrics by which to judge the validity of the placement
tests and then calculates these metrics for a large urban community college system. Scott-
Clayton�’s results show high error rates using placement tests and predict that using high
school grade point averages (GPA) instead would reduce the error rates significantly (by
10�–15 percent). Our investigation utilizes the same metrics, calculates them across a
statewide community college system, and contrasts them with assignment using high
2
school information. Thus, this paper serves as a replication and extension of Scott-
Clayton�’s analysis in a different context. As we show below our findings are similar and
raise further questions about what information is most valid for developmental education
placement decisions.
2. Framework
Colleges are responsible for deciding whether each student is ready for college-
level coursework. What information should be used to make this determination, and how
that information should be interpreted? In considering this question, we juxtapose two
sources of information: placement tests and high school transcripts.
2.1 Placement Tests
Colleges typically use placement tests as a binary indicator: does a student require
developmental education, or is the student ready for college-level courses in a particular
subject? If a student achieves a certain score on the placement test, that student is
considered college-ready.
However, there are many assumptions underlying this simple decision rule.
Critically, the validity of placement tests depends on how the results are interpreted and
the actual pass rate or cutoff score that colleges apply, how that rate is interpreted, and
what a college believes is needed for college-level courses. Also, developmental
education is often not binary; there are different levels and numbers of courses in
developmental education sequences. Therefore, it is the use of placement tests we are
investigating rather than the tests themselves.
Such an investigation involves two main methodological challenges. First, this
usage of placement tests implies all scores above the cutoff are equivalent�—it does not
matter whether the student scores 1 point above the cutoff or 20 points above.
Analogously, it does not matter whether the student scores 1 point below the cutoff or 20
points below. Either way, the resulting placement decision is the same.1 However, it is
reasonable to assume (as we do in this paper) that the actual placement score is
1 In the case of multiple levels of DE, the placement decisions are similarly discrete though not binary.

3
meaningful and that there is a continuous relationship between scores and college
outcomes, i.e., students who score higher are more prepared for college than those who
score lower. Second, this usage of placement tests means that it is difficult to identify the
underlying validity of the test. A student with a low placement test score will have to take
developmental education, and this will slow down progress through college. Thus, the
association between a placement test and performance in college is endogenous: The
placement test diverts the student to a longer academic path rather than simply
diagnosing the student�’s genuine needs. We consider this �“diversion effect�” by looking at
pathways of students above and below the cutoffs and by investigating longer term
outcomes in college. Particularly, the diversion effect might have less influence on
college GPA than on credits earned. We also use a set of evaluation metrics developed by
Scott-Clayton (2012) to address this second challenge.
2.2 High School Transcripts
High school transcripts may be an alternative to placement tests for deciding
whether students should enroll in developmental education. In contrast to a single-value
placement test score, high school transcripts may yield a wealth of information.
Potentially, they can reveal not only cognitive competence but also student effort and
college-level readiness. All of this information might be available on a full high school
transcript, which a traditional student should already possess before applying to college.
Due to its relationship to cognitive competence, a useful piece of information for
predicting college success is high school GPA (sometimes referred to in this paper as HS
GPA). This measure should be readily available, at least for younger and American-born
college enrollees. Given that HS GPA could serve as a proxy for many other traits,
including effort, we analyze this measure separately from other information that might be
included on a typical high school transcript.
A full high school transcript contains more detailed information that may indicate
a student�’s readiness for college-level coursework. Information on the number of English
and math courses taken and credits earned may be used to determine whether a student
has a balanced portfolio of academic skills. Effort in high school�—as indicated by the
total number of courses taken and credits earned�—may also be a useful predictor.

4
Likewise, proficiency in college-level course material may be valuable. This can be
determined by the number of college-level courses taken in high school, as well as the
credits earned in these courses, and rates of Honors course-taking. Finally, course
failure�—F grades�—may indicate a student is deficient in a particular subject.
There are some practical concerns about using high school transcripts for making
placement decisions. Some students may not have transcripts, or they may have
incomplete transcripts. Some students may have completed high school many years ago,
such that their high school performance is no longer applicable to present-day
performance. Evaluating transcripts may slow down the placement process. It is easier to
process a single cutoff score value for a placement test than to read a transcript, although
of course the placement test has to be taken by the student and then graded (and not
always by a computer, in the case of writing tests). Finally, a placement decision based
on the interpretation of multiple sources of information may be contested by the student;
a single, pre-announced cutoff score is less open to arbitration. Our analysis does not
address these concerns. However, using high school performance for determining college
placement may have one important benefit�—an increased incentive for doing well in high
school. Currently, placement into college-level classes is not directly related to high
school performance.
Of course, placement tests and school transcript measures might be thought of as
substitutes for each other, or they may capture different underlying traits. Student
knowledge and effort are also expected to be important, as is college readiness. Whereas
placement tests provide information that is primarily centered on subject-specific
knowledge and general cognitive ability, high school transcripts may yield more
information across the range of attributes. Thus, the optimal decision rule may be to
combine information from a placement test and a high school transcript.
2.3 Prior Literature
Some studies have looked at the accuracy of placement tests. For the COMPASS,
ACT (2006) reported accuracy rates of 63�–68 percent when the criterion for success is a
C or higher in the college-level class. This accuracy rate is an improvement of between 2
and 20 percent (average 6 percent) over the predicted pass rate from placing all students

5
in the college-level class. If the criterion for success is a B or higher, the improvement in
accuracy rates by using COMPASS is 10�–43 percent. For the ACCUPLACER, Mattern
and Packman (2009) report accuracy rates of 73�–84 percent with success defined as a C
or higher. Instead of increases in accuracy over an alternative placement, Mattern and
Packman (2009) report correlation coefficients between tests and success; these
coefficients range from 0.10�–0.25.
Generally, accuracy rates tended to be higher for math tests than for reading or
writing tests. Over the longer run, placement tests tended to be better predicting which
students will do well (get high college grades) than which students will do satisfactorily
(get average grades). However, the extent to which these tests were an improvement over
placing all students into college work varied dramatically; the accuracy rate of
COMPASS was an improvement of between 2 percent and 43 percent, depending on the
definition of college success. Looking across the Virginia Community College System,
Jenkins, Jaggars, and Roksa (2009) found weak correlations between placement test
scores and student pass rates for both developmental courses and college-level gatekeeper
courses. Jenkins et al. also found no correlation between reading and writing placement
test scores and performance in gatekeeper college-level English courses after adjusting
for student and institutional characteristics; however, math scores and success in college-
level math were positively associated. For North Carolina, Michaelides (2005) examined
the ACCUPLACER test at 19 colleges and found that students with higher placement test
scores had only slightly better college grades.2
Overall, the existing literature�—albeit limited and mostly conducted by the test
makers�—suggests that the validity of the placement test is extremely context- and test-
specific.
2 For ACCUPLACER Sentence Skills, students who received a B or better in developmental English had an average placement test score of 76; among those who received a grade less than a B, the average score was 74. For ACCUPLACER Arithmetic, the discriminatory power of the test was somewhat greater. Of those students who earned a B or better in developmental math, the average placement test score was 71; for students with grades less than a B, the average ACCUPLACER Arithmetic score was 61.

6
3. Method
3.1 Data
The data for this study come from several administrative datasets provided by a
statewide community college system (hereafter SWCCS). The SWCCS data includes
students�’ college transcripts (including GPAs). Most of these SWCCS students were
enrolled in associate degree programs. Placement score data was available in a separate
file. This data was merged with high school data from transcripts (including GPAs) of
individual students attending public schools across the state. The series of datasets were
from the late 2000s and were matched using a unique student identifier.
We began with a sample of students who took a college placement test and were
enrolled in the SWCCS between fall 2008 and summer 2010. For this cohort, we used
data on full college transcripts through the fall 2010 term in combination with some
limited demographic information. For a subset of students, we were able to match the
college transcript data to the high school database that provided transcript and GPA
information. However, missing data and discrepancies in matches of the available
datasets reduced the sample available for analysis.
Actual analysis sample sizes vary considerably, as students took several different
placement tests. In the SWCCS, over 40 placement tests are used, including SAT and
Advanced Placement (AP) tests as well as the ACCUPLACER, COMPASS, and ASSET
tests. Most entering students, however, took one of the �“big three�” standard tests, as
placement decisions generally are based on their resulting scores. To capture the range of
tests used in the SWCCS, we analyzed four tests, each from the ACCUPLACER and
COMPASS.3 These tests are subject-specific: an algebra test, a general math skills test, a
reading test, and a writing test. These subject-specific tests are used to assign students
into three possible DE math courses and two DE English courses or into college-level
classes for two possible math levels and one English level.4
3 For the purposes of this analysis, we excluded several test scores that may have been used in placement decisions, such as the SAT, ACT, AP, International Baccalaureate (IB), and other subject tests. Most students did not present scores from these tests. Also, the ASSET test is not considered here. Preliminary analysis showed this test to have low predictive power.4 Given the variation in placement practices and course offerings across the colleges in the state, the two math levels are not individual courses (e.g., Math 101) but combinations of equivalent courses. The

7
The SWCCS uses several placement tests for determining which courses students
should take, and these are applied in diverse ways across the state�’s colleges. Each
college within the SWCCS chooses which tests to offer. There are state-approved cutoff
scores for each test, and scores on these tests are the only information used for placement
into college-level courses. However, some students can be exempted through SAT or
ACT waivers, which are set by individual colleges. Other exemptions exist for students
who have already taken college courses in English or math, or who have taken
developmental courses at another SWCCS college. There are also prerequisite overrides
that colleges and departments may apply. Finally, students are allowed to retake their
placement tests. Thus, across the SWCCS, there is variation in how a placement test
might influence a student�’s progress.
In general, a score below the cutoff routes the student into developmental
education, and a score above the cutoff routes the student into college classes.
Nevertheless, noncompliance may be a concern. At the subject-specific level, DE
enrollment followed subject-specific placement test scores reasonably closely (e.g., low
scores on the math placement test led students to enroll in DE math courses).
Nevertheless, there were some students who took DE despite their placement scores
exempting them, and there were some students who did not take DE despite their
placement scores indicating that they should do so. For this sample, less than 13 percent
were noncompliers; among these students, approximately four fifths enrolled directly into
college-level classes despite their low placement test scores, and the remainder enrolled
in DE despite passing the placement test.
Critically, being assigned to DE induces a very low probability of ever taking
college-level courses. In part, this is because students fail DE courses, but an equally
important part is that students never follow through on the DE sequence. Also, as we
show below, many students take some DE courses. However, our estimation samples are
defined as students who met the cutoff criteria and did not take DE in a specific subject.
About half of our sample of students was matched with high school achievement
data. This was a subset of younger students who recently attended a public secondary
distinction between our two math levels is that college-level Math 2 requires a higher test score or a lower college math prerequisite.

8
school within the state. Though GPA and detailed transcript data were available for most
students, for some we only had GPA information. From the high school transcripts, we
focused on 11th and 12th grade data to count the total number of courses taken, the
number of Honors or advanced courses, the number of college-level courses (from dual
enrollment and similar programs), the number of high school math and English courses,
the number of failed courses, and the total number of secondary credits earned.
One concern when comparing placement rules is nonrandom missing information
on students. Here, we would be concerned if the students who took placement tests were
on average of lower ability than the students for whom that information is not available;
the lower ability students might be more variable in attributes. Similarly, if the students
with HS GPAs were on average of lower ability than those students with missing data,
this might bias our analysis. However, the differences between our sample and the
students without HS GPAs were not large. Students with HS GPA information had higher
math but lower English placement test scores than students without HS GPAs. Similarly,
there was some attrition by placement score; students with placement test scores had
slightly lower HS GPAs than students without placement test scores. (The mean HS GPA
for students with placement scores was 2.52; the mean HS GPA for students without
placement scores was 2.69.) Overall, this nonrandom attrition is unlikely to be driving
our results.
Student college transcript data allow us to consider various measures of
performance. We begin by looking at grades in DE courses. Analysis of these grades is
only suggestive because of the diversion effect, but we might expect these grades to be
associated with placement scores. Next, we define college performance using two general
measures: GPA in college classes and number of college credits accumulated.5 For
college GPA, withdrawals and incompletes are counted as fails, and only college courses
apply toward a student�’s GPA. College credit accumulation does not include
developmental education credits. These measures are for all entering students with
credits, not just for students who persist into their third semester or beyond.6 Finally, we
5 Bettinger, Evans, and Pope (2011) examine how ACT scores are associated with college GPA. 6 One issue is how to interpret students with zero credits. Zero college credits could mean that the student either never enrolled, failed the college courses they took, or took DE but never got to the college-level
9
follow Scott-Clayton (2012) and consider performance in terms of passing college-level
gatekeeper courses in English and math.7
Because we looked at multiple cohorts of students, staggered over multiple years,
our outcome measures should be interpreted as reflecting students�’ status after three to
five semesters of college (or their ability to pass a gatekeeper course within that time
frame). This increases our sample sizes but should not bias our results unless there are
different relationships each year.
Overall, these data allow for a replication of the analysis by Scott-Clayton (2012),
albeit in a different context in terms of the tests used and how they are applied. The data
also allow us to extend our investigation to consider correlations between placement tests
and other measures of student performance. In addition, we are able to compare two
placement tests to see if the results apply more generally. However, we emphasize that
we are not comparing the placement tests per se but how the colleges use these tests.
3.2 Analysis
Our analysis has two parts, the first of which is correlational and the second of
which relies on the formal framework set out in Scott-Clayton (2012). Although the
correlational analysis may be less accurate and less informative for policymakers, it may
still be useful for making comparisons across placement tests or between such tests and
other sources of information about students. For each part of the analysis, we focus on
how the placement tests work, and then we undertake a parallel investigation using high
school information instead. Finally, we combine the measures together to see how well
we can explain outcomes with the maximal amount of information.
We begin by looking at the correlations between placement tests and grades in
developmental education courses. These correlations can only be suggestive. With an
ideal placement rule and full compliance in DE enrollment, there should be no
association between placement test scores and grades in DE courses.8 Full compliance is
courses. The second and third groups should be included in our analysis, but the first group should not. As a robustness check, we estimate the college credit outcome with and without students with zero credits.7 As noted above, the two college-level gatekeeper math courses are actually a set of equivalent courses across the colleges. We refer to them as courses for simplicity. 8 Noncompliers who pass the placement test but take the DE course anyway may be simply excluded from the analysis.

10
necessary, such that all students who fail the placement test have a DE grade. Bias can be
introduced if students who score just below the cutoff avoid DE or if students with low
placement test scores do not even take DE. More fundamentally, the placement test is not
intended to predict DE grades. Even if it were, the intent could only be applied to DE
grades ex ante, since the intent of DE is to raise all students up to a college-ready level,
and a student predicted to have a low DE grade should receive more resources in order to
reach that level. In practice, it is unlikely that colleges can do a perfect job of providing
remediation and, as noted above, we assume that the placement tests do measure
students�’ college readiness along a continuum rather than in a binary way. Therefore, we
might expect some association between placement test scores and DE grades and subject-
specific congruence, i.e., that math placement tests should have stronger associations than
English placement tests with grades in DE math courses.
Next, we consider correlations between placement test scores and student
outcomes for all students passing or failing the placement test. The first set of outcomes
includes college GPA and college credits earned. These are longer term outcomes and
may be closely associated with the key outcome of graduation.9 Of course, these
outcomes may also be subject to similar criticisms as those noted above. Again, however,
we assume that the remediation is not perfect. Also, by looking at longer term outcomes,
the diversion effect may be attenuated, particularly for college GPA. That is, if a student
is diverted to DE, it may affect the number of credits they can accumulate within the first
few semesters of college, but they will still have a college GPA. More strictly, we report
correlations between placement tests and college outcomes separately for those who pass
the test and are not subject to the diversion effect. We might expect an association
between these students�’ scores and their college GPA and credits accumulated.
The final set of correlations is between the placement tests and success in the
gatekeeper English and math courses. For these gatekeeper courses, success may be
defined in various ways, so we report the associations for passing with at least a B grade
( B), at least a C grade ( C) and passing the course ( D). For comparability purposes,
9 We recognize that we are using only intermediate outcomes, which do not guarantee that students will complete their courses. In fact, Jenkins et al. (2009) found that the association between placement test scores and completion of an award appears to be more robust than that between placement scores and college grades.

11
we report the R-squared value from a series of linear probability models instead of the
correlation coefficient. Again, the same cautions apply, even as we analyze correlations
for only the subject-specific placement tests (e.g., COMPASS Algebra with gatekeeper
math).
In light of these concerns about the validity of correlation coefficients, the second
part of our investigation derives alternative measures to evaluate the accuracy placement
tests (and high school information). This part of our investigation draws heavily on Scott-
Clayton (2012).
One way to evaluate placement tests is to derive the accuracy rate of assignment
for each gatekeeper college-level course, i.e., the proportion of students assigned
correctly to DE and the proportion assigned correctly to college-level classes (Sawyer,
2007). This accuracy rate (AR) is calculated as follows. Course success (defined as B,
C, or D) is estimated using a probit equation against the placement test score for all
students scoring above the test cutoff (in some specifications, we include high school
information). This equation is then used to predict the probability of success for those
above and, by extrapolation, for those scoring below the test cutoff.10 The AR is
calculated as the mean of the predicted probability of success for those who score above
the cutoff and one minus the predicted probability of failure for those who score below
the cutoff.11 To provide context, other studies also report accuracy rates assuming that all
students are assigned either to DE or to college-level classes (i.e., that DE is not offered).
These are estimated by computing the mean predicted probability of success under the
assumption that all scores are below or above the cutoff, respectively.12 We compute all
ARs using the three definitions of success in college-level English and math, and we
estimate separate models for ACCUPLACER and COMPASS.
10 The validity of extrapolation depends on whether there are enough observations from which to extrapolate. As discussed in Scott-Clayton (2012), extrapolation is considered valid if only one quarter of observations are extrapolated, yet very few studies meet this threshold. In most college systems, more than half of all students are placed into DE. For the SWCCS, the extrapolation sample varies between 95 percent (COMPASS Math 2) and 63 percent (COMPASS English).11 Formally, denoting Si as the student�’s placement test score and Sc as the cutoff, the AR is the average predicted pass probability of the following categories: �“true negatives�” if Si < SC and �“true positives�” if Si > SC. True negative is defined as 1 - Prob (success) if Si < SC and zero otherwise. True positive is defined as Prob (success) if Si > SC and zero otherwise.12 Instead of taking the mean of some combination of true negative and true positive rates, we assume all predictions are either true positives (with all students in college-level) or true negatives (with all students in DE).
12
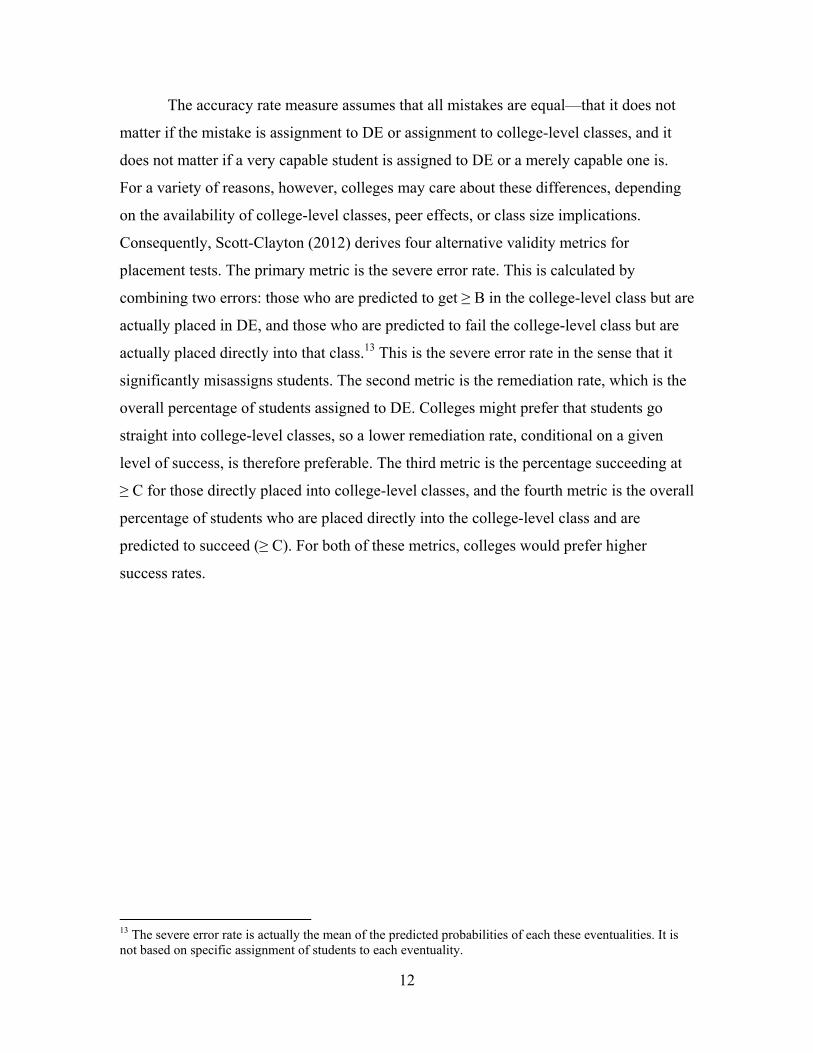
The accuracy rate measure assumes that all mistakes are equal�—that it does not
matter if the mistake is assignment to DE or assignment to college-level classes, and it
does not matter if a very capable student is assigned to DE or a merely capable one is.
For a variety of reasons, however, colleges may care about these differences, depending
on the availability of college-level classes, peer effects, or class size implications.
Consequently, Scott-Clayton (2012) derives four alternative validity metrics for
placement tests. The primary metric is the severe error rate. This is calculated by
combining two errors: those who are predicted to get B in the college-level class but are
actually placed in DE, and those who are predicted to fail the college-level class but are
actually placed directly into that class.13 This is the severe error rate in the sense that it
significantly misassigns students. The second metric is the remediation rate, which is the
overall percentage of students assigned to DE. Colleges might prefer that students go
straight into college-level classes, so a lower remediation rate, conditional on a given
level of success, is therefore preferable. The third metric is the percentage succeeding at
C for those directly placed into college-level classes, and the fourth metric is the overall
percentage of students who are placed directly into the college-level class and are
predicted to succeed ( C). For both of these metrics, colleges would prefer higher
success rates.
13 The severe error rate is actually the mean of the predicted probabilities of each these eventualities. It is not based on specific assignment of students to each eventuality.

13
4. Results
4.1 Correlations
Placement tests and course grades. To capture the range of tests used in the
SWCCS, we analyzed the ACCUPLACER and COMPASS tests. Within each test type,
we examined four subject-specific tests: algebra, general math skills, reading, and
writing. We expect a positive relationship between placement test scores and grades in
specific developmental education courses, not least because of the diversion effect.14
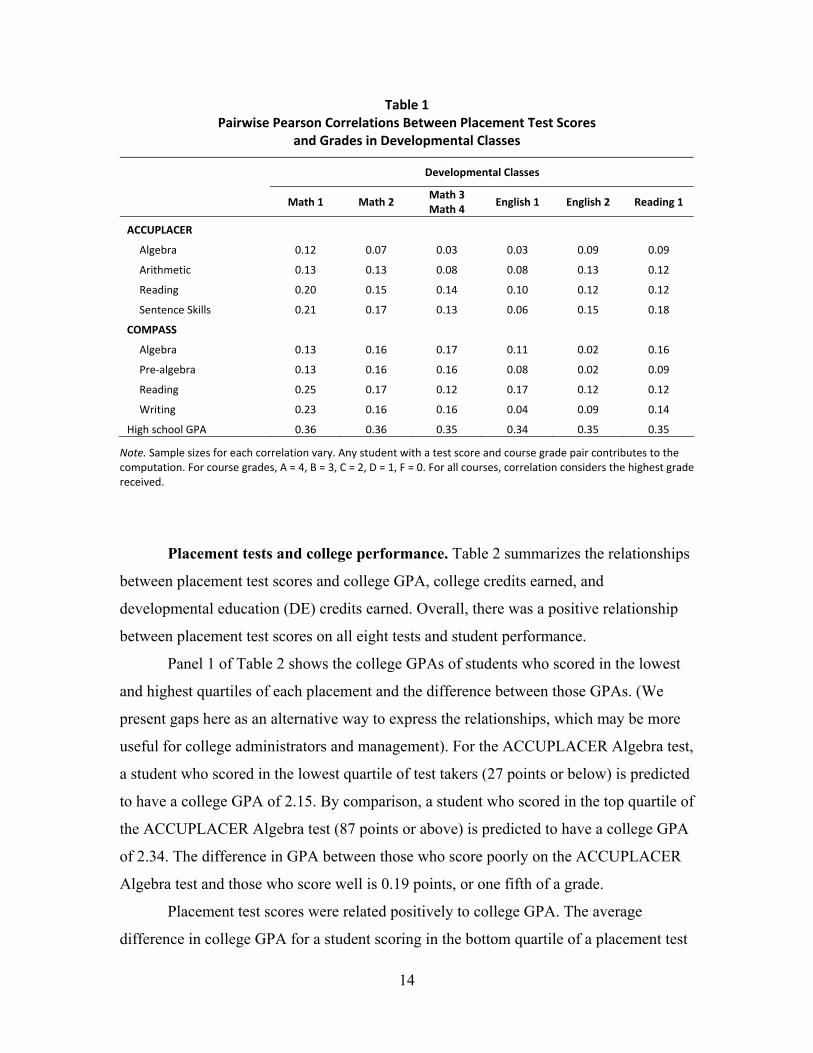
Table 1 shows correlation coefficients for six developmental education courses
offered within the state system. A number of results stand out, suggesting that even at this
level of analysis, placement tests do not yield straightforward predictions of student
grades. First, overall correlations between placement test scores and DE grades are low.
For Math 1, for example, the average correlation is 0.17. For English 1, the correlation is
even lower, at 0.06. Second, placement test scores and grade associations are much
stronger for math DE courses than for English or reading DE courses. Surprisingly,
subject-specific congruence is extremely weak. Looking at Math 1, for example, the
English placement test score correlates more strongly than the math placement test score
with the Math 1 grade.15 Finally, some tests perform poorly. Broadly, the COMPASS
tests appear to exhibit stronger and more consistent associations with DE grades. The
general math placement tests show somewhat stronger correlations than the algebra tests.
These results stand in marked contrast to the correlations for high school GPA,
given in the bottom row of Table 1. Whereas the correlation across the eight placement
tests and the six DE courses ranged between 0.08 and 0.18 on average, the correlation
across HS GPA and the six DE courses ranged between 0.34 and 0.36. HS GPA is not
only a better predictor but also more consistent than the placement tests.
14 Grades A, B, C, D, and F are represented numerically as 4, 3, 2, 1, and 0, respectively.15 These two conclusions are not contradictory. It is easier to explain math DE grades than English DE grades, but the easiest way to explain math DE grades is to use English placement test scores.
14
Table 1Pairwise Pearson Correlations Between Placement Test Scores
and Grades in Developmental Classes
Developmental Classes
Math 1 Math 2Math 3Math 4
English 1 English 2 Reading 1
ACCUPLACER
Algebra 0.12 0.07 0.03 0.03 0.09 0.09
Arithmetic 0.13 0.13 0.08 0.08 0.13 0.12
Reading 0.20 0.15 0.14 0.10 0.12 0.12
Sentence Skills 0.21 0.17 0.13 0.06 0.15 0.18
COMPASS
Algebra 0.13 0.16 0.17 0.11 0.02 0.16
Pre algebra 0.13 0.16 0.16 0.08 0.02 0.09
Reading 0.25 0.17 0.12 0.17 0.12 0.12
Writing 0.23 0.16 0.16 0.04 0.09 0.14
High school GPA 0.36 0.36 0.35 0.34 0.35 0.35
Note. Sample sizes for each correlation vary. Any student with a test score and course grade pair contributes to thecomputation. For course grades, A = 4, B = 3, C = 2, D = 1, F = 0. For all courses, correlation considers the highest gradereceived.
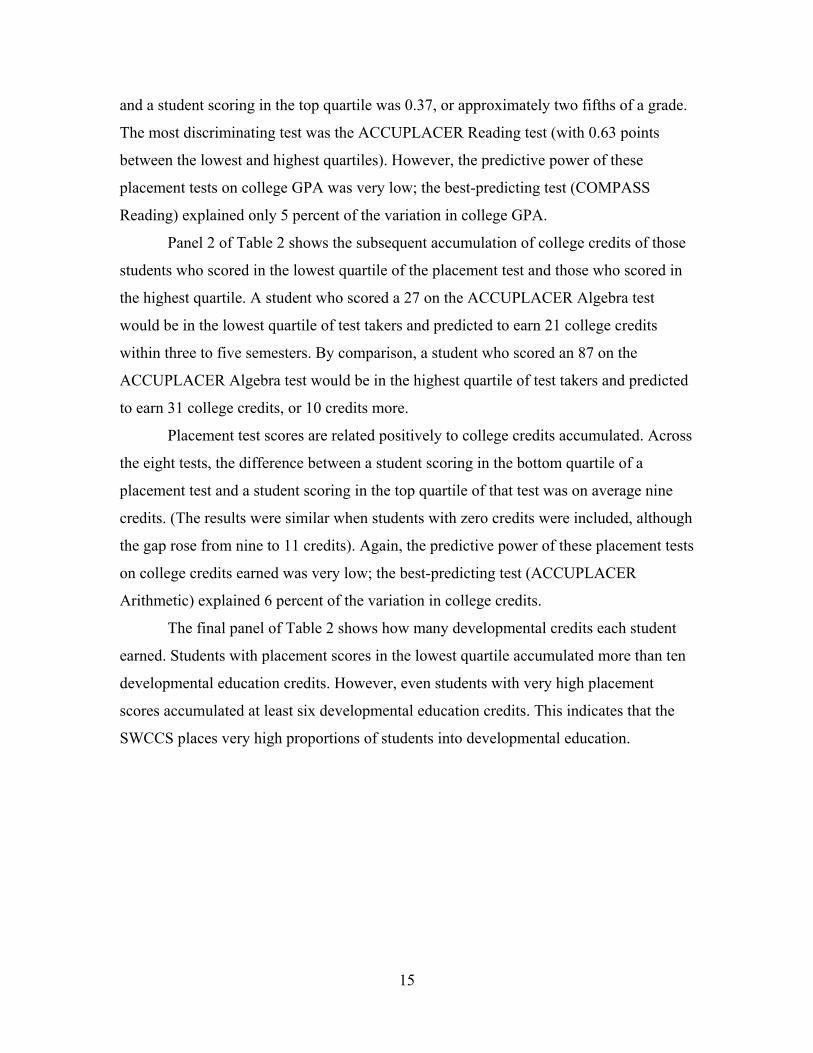
Placement tests and college performance. Table 2 summarizes the relationships
between placement test scores and college GPA, college credits earned, and
developmental education (DE) credits earned. Overall, there was a positive relationship
between placement test scores on all eight tests and student performance.
Panel 1 of Table 2 shows the college GPAs of students who scored in the lowest
and highest quartiles of each placement and the difference between those GPAs. (We
present gaps here as an alternative way to express the relationships, which may be more
useful for college administrators and management). For the ACCUPLACER Algebra test,
a student who scored in the lowest quartile of test takers (27 points or below) is predicted
to have a college GPA of 2.15. By comparison, a student who scored in the top quartile of
the ACCUPLACER Algebra test (87 points or above) is predicted to have a college GPA
of 2.34. The difference in GPA between those who score poorly on the ACCUPLACER
Algebra test and those who score well is 0.19 points, or one fifth of a grade.
Placement test scores were related positively to college GPA. The average
difference in college GPA for a student scoring in the bottom quartile of a placement test
15
and a student scoring in the top quartile was 0.37, or approximately two fifths of a grade.
The most discriminating test was the ACCUPLACER Reading test (with 0.63 points
between the lowest and highest quartiles). However, the predictive power of these
placement tests on college GPA was very low; the best-predicting test (COMPASS
Reading) explained only 5 percent of the variation in college GPA.
Panel 2 of Table 2 shows the subsequent accumulation of college credits of those
students who scored in the lowest quartile of the placement test and those who scored in
the highest quartile. A student who scored a 27 on the ACCUPLACER Algebra test
would be in the lowest quartile of test takers and predicted to earn 21 college credits
within three to five semesters. By comparison, a student who scored an 87 on the
ACCUPLACER Algebra test would be in the highest quartile of test takers and predicted
to earn 31 college credits, or 10 credits more.
Placement test scores are related positively to college credits accumulated. Across
the eight tests, the difference between a student scoring in the bottom quartile of a
placement test and a student scoring in the top quartile of that test was on average nine
credits. (The results were similar when students with zero credits were included, although
the gap rose from nine to 11 credits). Again, the predictive power of these placement tests
on college credits earned was very low; the best-predicting test (ACCUPLACER
Arithmetic) explained 6 percent of the variation in college credits.
The final panel of Table 2 shows how many developmental credits each student
earned. Students with placement scores in the lowest quartile accumulated more than ten
developmental education credits. However, even students with very high placement
scores accumulated at least six developmental education credits. This indicates that the
SWCCS places very high proportions of students into developmental education.
16
Table 2Placement Tests and College Outcomes
(1)College GPA
(2)College Credits Earned
(3)Developmental Credits Earned
PlacementTest Score in
Lowestquartile QL
PlacementTest Score in
HighestQuartile QH
DifferenceQH QL
PlacementTest Score in
LowestQuartile QL
PlacementTest Score in
HighestQuartile QH
DifferenceQH QL
PlacementTest Score in
LowestQuartile QL
PlacementTest Score in
HighestQuartile QH
DifferenceQH QL
ACCUPLACER
Algebra 2.15 2.34 0.19 21.4 31.4 10.0 11.0 8.1 2.9
Arithmetic 2.00 2.49 0.49 19.2 31.9 12.7 12.3 6.9 5.4
Reading 1.91 2.54 0.63 19.6 30.2 10.6 13.5 6.4 7.1
Writing 1.95 2.51 0.56 19.9 30.9 11.0 13.2 6.5 6.7
COMPASS
Algebra 2.19 2.53 0.34 23.0 31.7 8.7 9.3 7.1 2.2
Pre algebra 2.15 2.55 0.40 20.0 29.7 9.7 11.4 6.7 4.7
Reading 1.97 2.58 0.61 19.0 29.2 10.2 13.2 6.4 6.8
Writing 2.00 2.52 0.52 19.1 29.2 10.1 13.3 5.9 7.4
Average of 8 tests 0.47 10.4 5.4
Note. Sample includes all students from 2008 and 2009; college data from years 2008�–2010. Table does not include students with zero credits.
17
High school performance and college performance. There was a positive relationship
between performance in high school and performance in college. Here, we distinguish between
high school GPA and other information about students that can be obtained from the students�’
high school transcripts.
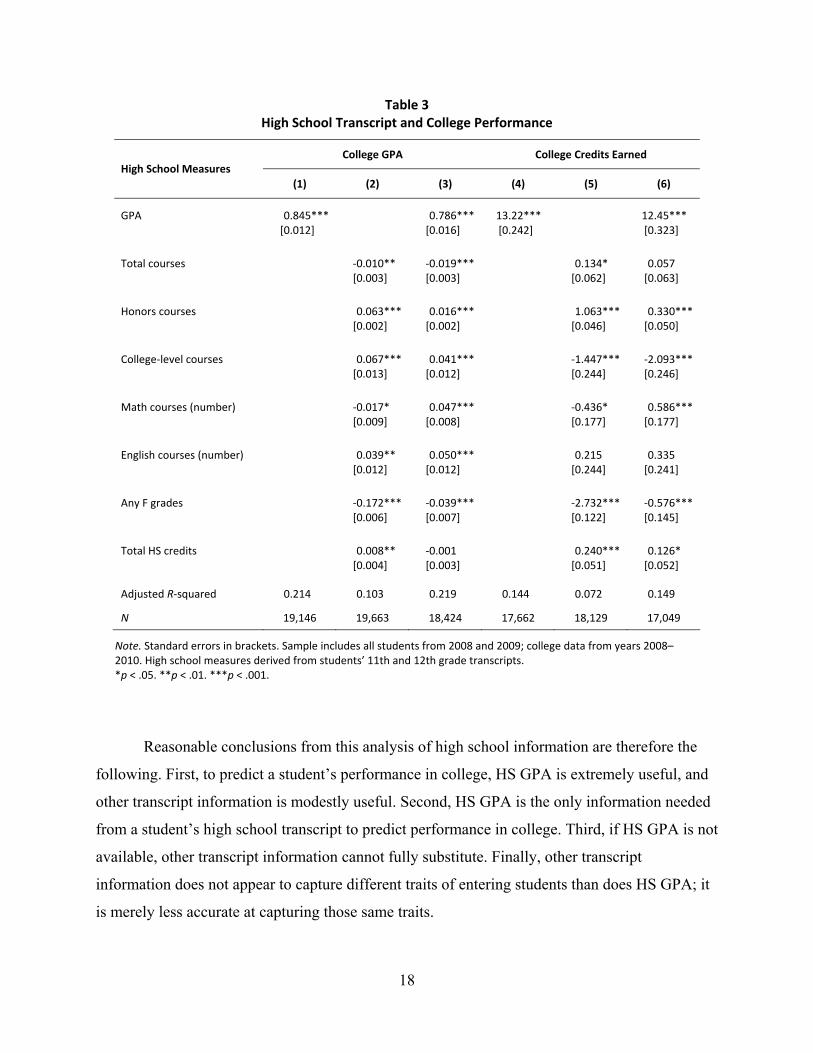
Table 3 shows the relationship between college performance (as measured by GPA and
credits) and high school performance. Models 1 and 4 show the strength of high school GPA,
which explains approximately 21 percent of the variation in college GPA and 14 percent of the
variation in credits earned. On average, a student who entered the SWCCS with a HS GPA of C
will, after three to five semesters, have a college GPA of 1.6. A student with a HS GPA of B will
have a college GPA will be 2.5. An A student in high school will have a college GPA of 3.3. In
general, a student�’s college GPA was about 0.6 units lower than the student�’s HS GPA. A similar
pattern exists for college credits. A student entering college with a HS GPA of C will have
accumulated 18 college credits after three to five semesters. This credit total rose to 31 for B
students and 44 for A students. Approximately, each unit increase in HS GPA (e.g., B to A) was
associated with earning four more credits per semester.
Table 3 also shows that high school transcripts were informative about performance in
college. Both college GPA and college credits were strongly correlated with high school
measures of ability�—number of Honors courses attempted, number of college-level credits
earned in high school, and whether the student ever received an F. The number of foundation
courses�—math and English courses�—taken in high school was also correlated with college
performance. However, there was no clear or independent relationship between the number of
courses or total credits earned in high school and a student�’s college GPA or college credits
earned (see Table 3, columns 2 and 5). In sum, the transcript information had modest predictive
power. Altogether, these measures of ability, foundational courses, and course loads explained
10 percent of the variation in college GPA and 7 percent of the variation in college credits
earned.
Combining HS GPA and transcript information does not generate additional power.
Alone, HS GPA was a better predictor of college performance than all the other measures put
together.
18
Table 3High School Transcript and College Performance
College GPA College Credits EarnedHigh School Measures
(1) (2) (3) (4) (5) (6)
GPA 0.845*** 0.786*** 13.22*** 12.45***[0.012] [0.016] [0.242] [0.323]
Total courses 0.010** 0.019*** 0.134* 0.057[0.003] [0.003] [0.062] [0.063]
Honors courses 0.063*** 0.016*** 1.063*** 0.330***[0.002] [0.002] [0.046] [0.050]
College level courses 0.067*** 0.041*** 1.447*** 2.093***[0.013] [0.012] [0.244] [0.246]
Math courses (number) 0.017* 0.047*** 0.436* 0.586***[0.009] [0.008] [0.177] [0.177]
English courses (number) 0.039** 0.050*** 0.215 0.335[0.012] [0.012] [0.244] [0.241]
Any F grades 0.172*** 0.039*** 2.732*** 0.576***[0.006] [0.007] [0.122] [0.145]
Total HS credits 0.008** 0.001 0.240*** 0.126*[0.004] [0.003] [0.051] [0.052]
Adjusted R squared 0.214 0.103 0.219 0.144 0.072 0.149
N 19,146 19,663 18,424 17,662 18,129 17,049
Note. Standard errors in brackets. Sample includes all students from 2008 and 2009; college data from years 2008�–2010. High school measures derived from students�’ 11th and 12th grade transcripts.*p < .05. **p < .01. ***p < .001.
Reasonable conclusions from this analysis of high school information are therefore the
following. First, to predict a student�’s performance in college, HS GPA is extremely useful, and
other transcript information is modestly useful. Second, HS GPA is the only information needed
from a student�’s high school transcript to predict performance in college. Third, if HS GPA is not
available, other transcript information cannot fully substitute. Finally, other transcript
information does not appear to capture different traits of entering students than does HS GPA; it
is merely less accurate at capturing those same traits.

19
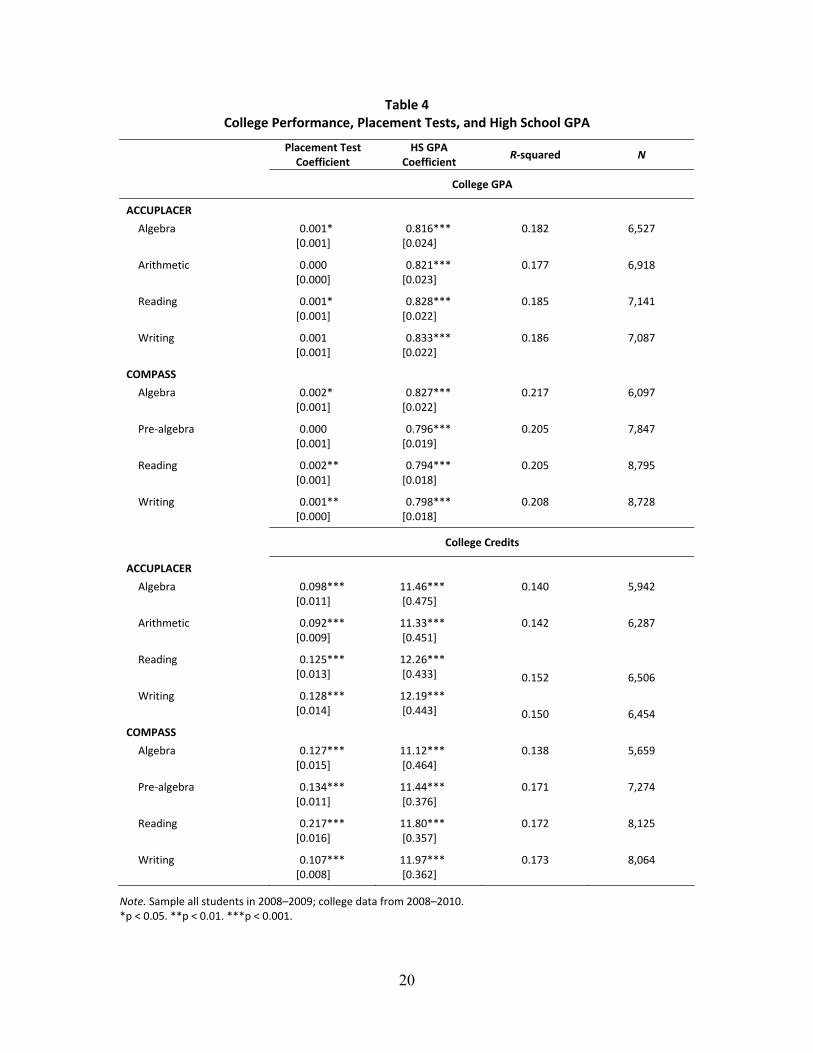
Comparing placement tests and high school GPA for college performance. We now
examine the relative strength of placement tests compared to high school information as
predictors of college performance. We report the association between each performance measure
and the placement test by itself, after controlling for HS GPA and all other transcript
information. The results of this analysis are summarized in Table 4.
For college GPA, the placement test score by itself was a strong predictor. However,
when we controlled for a student�’s HS GPA, the effect of the placement test was significantly
smaller. In particular, the ACCUPLACER tests had almost no independent explanatory power.
When high school transcript information was included, none of the placement tests had any
strong explanatory power for college. In contrast, in every specification represented in Table 4,
HS GPA had a strong and statistically significant association with college GPA. HS GPA alone
explained approximately 21 percent of the variation in college GPA; adding the placement test
did not increase this explained variation.
Similarly, for college credits earned, the placement test by itself was a strong predictor
for all tests. This association was maintained when we controlled for HS GPA and transcript
information. Again, however, HS GPA consistently had a positive and statistically significant
association with college credits earned. Overall, HS GPA explained 14 percent of the variation in
college credits earned; adding placement test information raised the explanatory power to
approximately 17 percent.
From these results, we might infer the following. To predict college GPA, all that is
needed is HS GPA. To predict college credits earned, both the placement test and HS GPA are
valuable, but HS GPA is more valuable than the placement test.
Analysis above and below the placement test cutoffs. The effect of the placement test
should vary according to whether the student scores above or below the cutoff. The former group
enrolls directly in college courses (in theory), and the �“diversion effect�” should not matter. For
those scoring above the cutoff, we should expect placement test scores and college performance
to be straightforwardly related. However, those below the cutoff are diverted and will proceed
more slowly toward college completion. We expect this diversion effect to be more marked for
college credits than for college GPA.
20
Table 4College Performance, Placement Tests, and High School GPA
Placement TestCoefficient
HS GPACoefficient
R squared N
College GPA
ACCUPLACER
Algebra 0.001* 0.816*** 0.182 6,527[0.001] [0.024]
Arithmetic 0.000 0.821*** 0.177 6,918[0.000] [0.023]
Reading 0.001* 0.828*** 0.185 7,141[0.001] [0.022]
Writing 0.001 0.833*** 0.186 7,087[0.001] [0.022]
COMPASS
Algebra 0.002* 0.827*** 0.217 6,097[0.001] [0.022]
Pre algebra 0.000 0.796*** 0.205 7,847[0.001] [0.019]
Reading 0.002** 0.794*** 0.205 8,795[0.001] [0.018]
Writing 0.001** 0.798*** 0.208 8,728[0.000] [0.018]
College Credits
ACCUPLACER
Algebra 0.098*** 11.46*** 0.140 5,942[0.011] [0.475]
Arithmetic 0.092*** 11.33*** 0.142 6,287[0.009] [0.451]
Reading 0.125*** 12.26***[0.013] [0.433] 0.152 6,506
Writing 0.128*** 12.19***[0.014] [0.443] 0.150 6,454
COMPASS
Algebra 0.127*** 11.12*** 0.138 5,659[0.015] [0.464]
Pre algebra 0.134*** 11.44*** 0.171 7,274[0.011] [0.376]
Reading 0.217*** 11.80*** 0.172 8,125[0.016] [0.357]
Writing 0.107*** 11.97*** 0.173 8,064[0.008] [0.362]
Note. Sample all students in 2008�–2009; college data from 2008�–2010.*p < 0.05. **p < 0.01. ***p < 0.001.

21
To investigate these associations, we estimated separate equations for students above and
below the cutoffs for each of our eight placement tests. These equations included placement tests
and HS GPAs only (as per model 2 from Table 4). The coefficients for each placement test score
are given in Table 5. The first row shows that ACCUPLACER Algebra scores were positively
associated with college GPA for students who scored above the ACCUPLACER Algebra cutoff
score (with a coefficient of 0.007). But for students who scored below the cutoff there is no
association between placement test score and college GPA (with a coefficient of 0.001). Overall,
these results suggest that placement tests are not good predictors even when there is no diversion
effect.
Table 5Placement Test Coefficients Above and Below Cutoffs and College Performance
College GPA College Credits Earned
Above Cutoff:Placement TestCoefficient
Below Cutoff:Placement TestCoefficient
Above Cutoff:Placement TestCoefficient
Below Cutoff:Placement TestCoefficient
ACCUPLACER
Algebra 0.007*** 0.001 0.021 0.150***[0.002] [0.001] [0.042] [0.017]
Arithmetic 0.000 0.001 0.041* 0.144***[0.001] [0.002] [0.017] [0.030]
Reading 0.002 0.002 0.018 0.172***[0.002] [0.001] [0.040] [0.019]
Writing 0.004* 0.002 0.009 0.167***[0.002] [0.001] [0.040] [0.022]
COMPASS
Algebra 0.002 0.005* 0.011 0.195***[0.001] [0.002] [0.086] [0.020]
Pre algebra 0.001 0.003 0.059** 0.158***[0.001] [0.003] [0.018] [0.035]
Reading 0.006* 0.002 0.079 0.144***[0.003] [0.001] [0.054] [0.020]
Writing 0.004** 0.000 0.007 0.096***[0.001] [0.001] [0.030] [0.013]
Note. Separate estimation for each cell. HS GPA included in all specifications. Sample includes all students from 2008and 2009; college data from years 2008�–2010. Standard errors are in brackets.*p < .05. **p < .01. ***p < .001.
22
First, we look at college GPAs. For students above the cutoff, only a few placement test
scores were associated with college GPA (ACCUPLACER Algebra and COMPASS Reading
and Writing). For students below the cutoff, there was almost no association between placement
test scores and college GPA. Thus, the null relationship between placement test and college GPA
is not driven by the diversion effect; it holds even for students who pass the placement test and
are not diverted.
The results for college credits are even more confounding. There was no association
between college credits and placement test score for students scoring above the cutoff. For
students scoring below the cutoff, there was a strong positive association: Higher scores were
correlated with more college credits.
All the equations in Table 5 include HS GPA as an explanatory variable. Associations
between HS GPA and both college GPA and college credits earned were always strongly
statistically significant. However, the effect of HS GPA was stronger above the cutoff than it was
below the cutoff. Failing the placement test therefore interfered with the association between HS
GPA and college GPA. Correspondingly, we were able to explain much more of the variation in
college GPA above the cutoff (R-squared 24 percent) than below it (R-squared 14 percent). Thus,
the diversion effect is interfering with the relationship between HS GPA and college
performance.
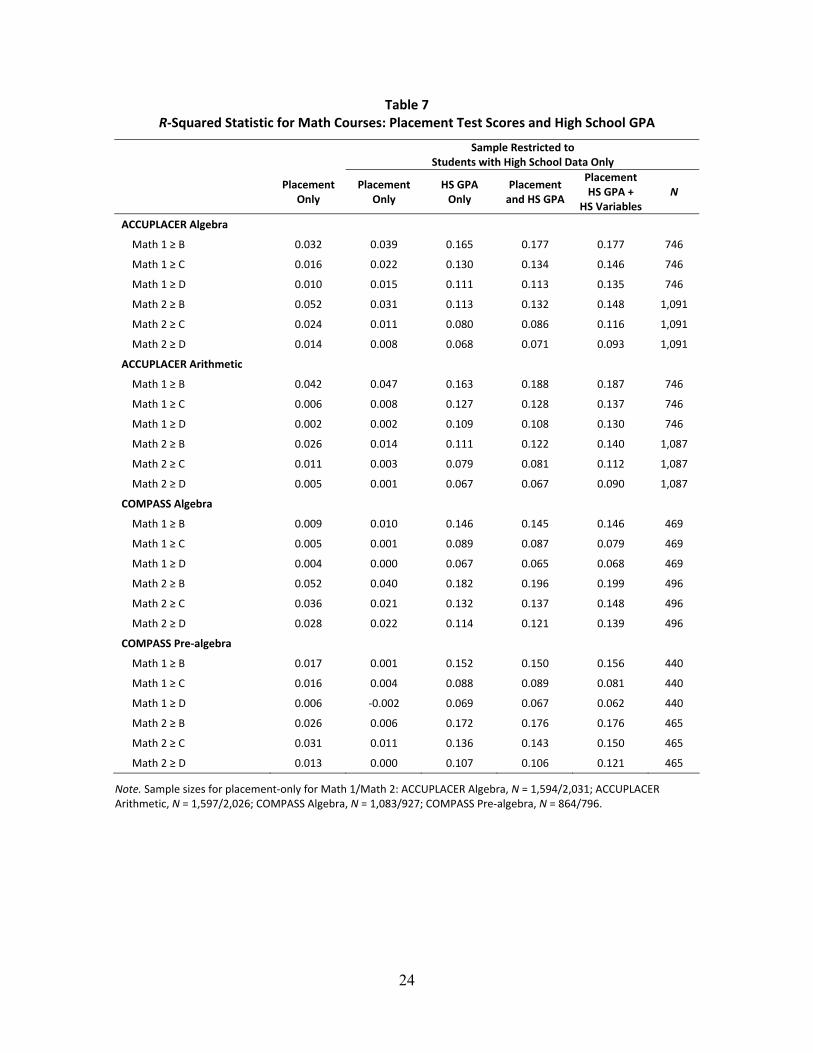
Placement tests and gatekeeper class success. We now examine the correlations
between placement test scores and success in gatekeeper college-level courses. These
correlations are equivalent to those in Scott-Clayton (2012, Table 4). Tables 6 and 7 show the R-
squared values for the English and math courses respectively. Column 1 shows the values for all
students with placement test scores; column 2 shows values from the same specification but
restricted to the sample of students with high school information. Column 3 shows the values
using high school GPA and columns 4 and 5 show combined models.
Several results are notable. Strikingly, placement scores explain almost none�—and in
some cases actually none�—of the variation in college-level grades. But there are other findings
within this context of general weakness of association. First, the placement test R-squared values
are higher for math than for English. This is consistent with Scott-Clayton (2012), as well as
prior research (see Table 1 of Scott-Clayton�’s report for a summary). Second, the placement tests
are better predictors when the success criterion is more stringent ( B). Third, high school GPA

23
is by far a better predictor of success than the placement test. The R-squared value is higher in all
36 comparisons in Tables 6 and 7. The average R-squared value is 0.11 using high school GPA
(compared to 0.01 for the placement tests), and it is the same size for both English and math.
Both of these findings are in accord with those in Scott-Clayton.
Table 6R Squared Statistic for English Courses: Placement Test Scores and High School GPA
Sample Restricted toStudents with High School Data Only
PlacementOnly
PlacementOnly
HS GPAOnly
Placementand HS GPA
PlacementHS GPA +
HS VariablesN
ACCUPLACER Reading
English B 0.008 0.000 0.107 0.107 0.114 2,253
English C 0.001 0.000 0.099 0.101 0.114 2,253
English D 0.000 0.003 0.086 0.091 0.103 2,253
ACCUPLACER Sentence Skills
English B 0.008 0.004 0.105 0.105 0.112 2,270
English C 0.002 0.000 0.099 0.099 0.114 2,270
English D 0.001 0.000 0.087 0.087 0.103 2,270
COMPASS Reading
English B 0.014 0.002 0.144 0.144 0.146 3,719
English C 0.003 0.000 0.120 0.121 0.124 3,719
English D 0.001 0.000 0.092 0.092 0.096 3,719
COMPASS Writing
English B 0.008 0.005 0.144 0.144 0.146 3,765
English C 0.002 0.003 0.116 0.116 0.119 3,765
English D 0.001 0.002 0.088 0.088 0.092 3,765
Note. Sample sizes for placement only: ACCUPLACER Reading, N = 6,180; ACCUPLACER Sentence Skills, N = 6,123;COMPASS Reading, N = 11,151; COMPASS Writing, N = 11,171.
24
Table 7R Squared Statistic for Math Courses: Placement Test Scores and High School GPA
Sample Restricted toStudents with High School Data Only
PlacementOnly
PlacementOnly
HS GPAOnly
Placementand HS GPA
PlacementHS GPA +
HS VariablesN
ACCUPLACER Algebra
Math 1 B 0.032 0.039 0.165 0.177 0.177 746
Math 1 C 0.016 0.022 0.130 0.134 0.146 746
Math 1 D 0.010 0.015 0.111 0.113 0.135 746
Math 2 B 0.052 0.031 0.113 0.132 0.148 1,091
Math 2 C 0.024 0.011 0.080 0.086 0.116 1,091
Math 2 D 0.014 0.008 0.068 0.071 0.093 1,091
ACCUPLACER Arithmetic
Math 1 B 0.042 0.047 0.163 0.188 0.187 746
Math 1 C 0.006 0.008 0.127 0.128 0.137 746
Math 1 D 0.002 0.002 0.109 0.108 0.130 746
Math 2 B 0.026 0.014 0.111 0.122 0.140 1,087
Math 2 C 0.011 0.003 0.079 0.081 0.112 1,087
Math 2 D 0.005 0.001 0.067 0.067 0.090 1,087
COMPASS Algebra
Math 1 B 0.009 0.010 0.146 0.145 0.146 469
Math 1 C 0.005 0.001 0.089 0.087 0.079 469
Math 1 D 0.004 0.000 0.067 0.065 0.068 469
Math 2 B 0.052 0.040 0.182 0.196 0.199 496
Math 2 C 0.036 0.021 0.132 0.137 0.148 496
Math 2 D 0.028 0.022 0.114 0.121 0.139 496
COMPASS Pre algebra
Math 1 B 0.017 0.001 0.152 0.150 0.156 440
Math 1 C 0.016 0.004 0.088 0.089 0.081 440
Math 1 D 0.006 0.002 0.069 0.067 0.062 440
Math 2 B 0.026 0.006 0.172 0.176 0.176 465
Math 2 C 0.031 0.011 0.136 0.143 0.150 465
Math 2 D 0.013 0.000 0.107 0.106 0.121 465
Note. Sample sizes for placement only for Math 1/Math 2: ACCUPLACER Algebra, N = 1,594/2,031; ACCUPLACERArithmetic, N = 1,597/2,026; COMPASS Algebra, N = 1,083/927; COMPASS Pre algebra, N = 864/796.
25
A final result from Tables 6 and 7 is particularly interesting. Combining high school GPA
with placement tests and with other high school variables does not substantially improve�—and in
many cases does not at all improve�—the R-squared values beyond a model that just relies on
high school GPA. This result holds for both English and math, both ACCUPLACER and
COMPASS, and across all three definitions of success in college-level courses.
In summary, these correlations suggest that the placement tests are not strongly
associated with college performance and that high school performance is. However, such
analysis does not yield a direct metric of their respective validities for assigning students.
4.2 Validity Metrics
Validity metrics for placement tests and categorical rules. To test for validity, this
analysis replicates that in Tables 4�–8 of Scott-Clayton (2012). Here, success is defined as getting
a particular grade ( B, C, or D) in gatekeeper English or math. In this replication, our initial
estimation is restricted to those who place directly into college-level courses. Using those
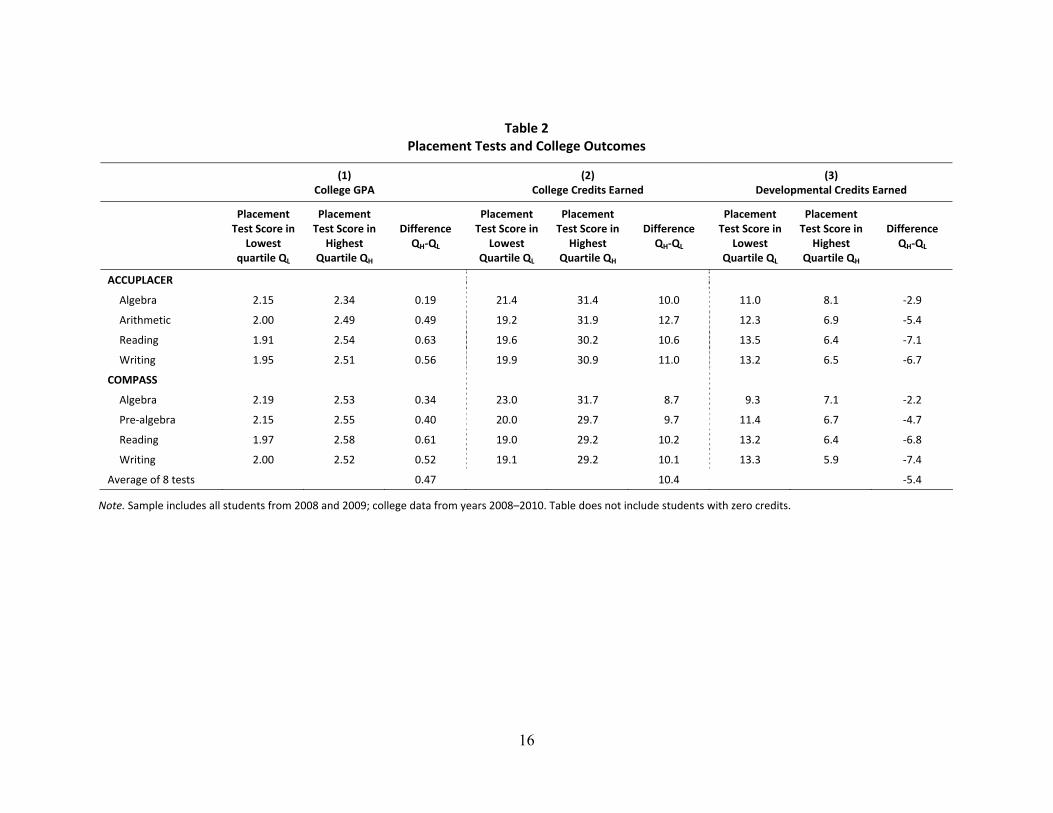
students, we extrapolate to predict the probabilities of passing each course for those students
scoring below the cutoff. An example is given in Figure 1, using ACCUPLACER Algebra to
predict success in college-level math (Math 2).
First, we derive accuracy rates (ARs) of three assignment rules: placement based on the
test score cutoffs, categorical assignment of all students into DE, and categorical assignment of
all students into the college-level course. Next, we calculate the four validity metrics.
Throughout, we express the estimates as percentages, although they are actually predicted
probabilities.
Table 8 shows the predicted accuracy rates, i.e., the predicted probability of success for
students placed directly into the college-level class and for those who are placed into DE.
Column 1 shows the placement test ARs. For English, when the definition of success is B, the
accuracy rate is 59 percent for ACCUPLACER and 61 percent for COMPASS. When success is
defined as passing college-level English ( D), the ARs of the placement tests fall to 38 percent
and 50 percent, respectively. The same pattern is evident for college-level math courses,
although the ARs are considerably higher. With success as B in Math 2, the AR of the
ACCUPLACER is 76, and the AR of the COMPASS is 82 percent; as success is relaxed to
passing ( D) Math 2, those ARs decrease to 46 percent and 50 percent, respectively. There is no

26
clear preference for one test. For English, ARs for COMPASS are modestly higher than those for
ACCUPLACER. For Math 1, ACCUPLACER ARs are higher than COMPASS ARs, but the
reverse is true for Math 2.
Figure 1Estimated Pass Probability by ACCUPLACER Algebra Score

27
Table 8Predicted Accuracy Rates Using Placement Tests,
All Remedial, and All College Assignment
Accuracy RateIncremental Validity ofPlacement Test Cutoffs
Based onPlacement Test
Cutoffs
All Studentsin Dev. Ed.
All StudentsCollege Level
OverDev. Ed.
Over CollegeLevel
English
ACCUPLACER (N = 1,983)
B 58.8 56.8 43.2 2.0 15.6
C 42.1 26.2 73.8 15.9 31.7
D 37.9 18.8 81.2 19.0 43.3
COMPASS (N = 3,425)
B 60.5 61.2 38.9 0.7 21.6
C 53.2 34.0 66.0 19.3 12.8
D 50.4 25.5 74.5 24.9 24.1
Math 1
ACCUPLACER (N = 696)
B 64.6 66.3 33.7 1.7 30.9
C 58.0 38.3 61.7 19.7 3.8
D 55.2 28.4 71.6 26.8 16.5
COMPASS (N = 330)
B 62.6 58.9 41.1 3.6 21.5
C 49.0 30.3 69.7 18.7 20.7
D 39.5 17.0 83.0 22.5 43.5
Math 2
ACCUPLACER (N = 964)
B 75.5 79.3 20.7 3.9 54.8
C 57.1 50.1 49.9 7.0 7.2
D 50.4 39.9 60.1 10.5 9.7
COMPASS (N = 271)
B 82.0 80.4 19.6 1.6 62.3
C 52.7 47.5 52.5 5.2 0.1
D 46.3 40.1 59.9 6.1 13.6

28
Columns 2 and 3 show ARs for the two categorical rules�—either placing all students in
DE or placing all students in college-level classes. As these ARs are the inverse of each other,
their respective validities are a function of how strictly success is defined. When success is
harder ( B), more students will benefit from DE, and when it is easier ( D), more students
should enroll directly into college-level classes.16 As shown in column 2, if the definition of
success is B, the AR of placing all students in DE is 57 percent for the ACCUPLACER group
and 61 percent for the COMPASS group�—almost exactly equal to the ARs achieved with
placement tests. This equality holds for college-level math also. Unsurprisingly, as the definition
of success is relaxed to C or D, the AR of placing all students in DE falls significantly. But
the AR of placing all students in college-level classes correspondingly rises. If success is defined
as D, the AR of placing all students in college-level English is 81 percent for the
ACCUPLACER group and 75 percent for the COMPASS group, in contrast with the ARs of 38
percent and 50 percent attained with the placement tests. These results also hold for math, with a
very similar gain of almost 30 percentage points for Math 1 from categorical assignment to
college-level courses over using a placement test.
Overall, at best, the placement test cutoffs work as well as the categorical assignment rule
of placing all students in DE when the standards for success are high ( B).17 For lower
standards, placing all students directly into college-level courses always results in higher ARs.
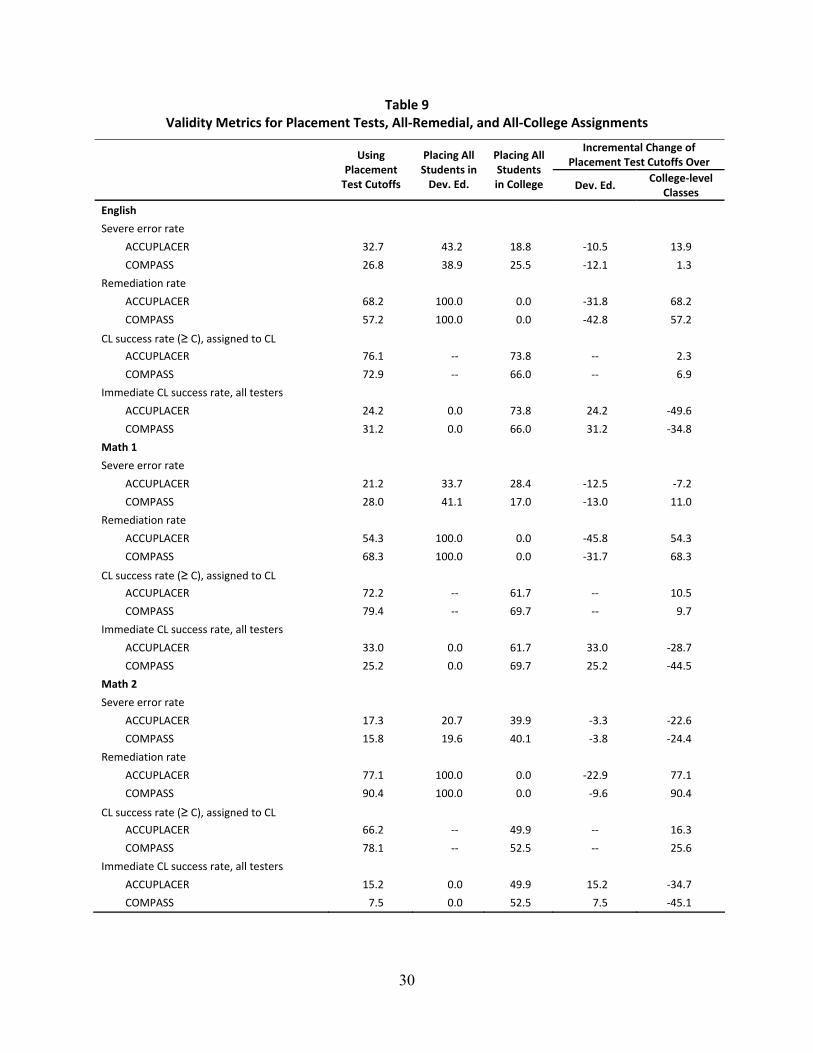
Table 9 reports the four validity metrics for these three placement assignments. The first
metric is the severe error rate (ER): the predicted probabilities of success for those students who
are placed in DE but predicted to get a B in the college-level course and those who are placed
in the college-level course but predicted to fail it. Using the placement test cutoffs, the severe
error rate for English is 33 percent for ACCUPLACER and 27 percent for COMPASS�—i.e.,
three out of every ten students is severely misassigned. For math, the severe ERs are slightly
lower but still nontrivial, especially for Math 1 (21 percent for ACCUPLACER and 28 percent
for COMPASS). However, the severe ER is also high using either of the categorical assignment
rules. Assigning all students to DE yields a severe ER of 39 percent for the COMPASS group
and 43 percent the ACCUPLACER group for English, which is one third worse than the severe
16 The ARs are predicted from the placement test score relationships, such that the categorical rules will produce different ARs for each test. Samples and sample sizes differ across the placement tests.17 In a similar exercise using the ACT, Noble and Sawyer (2004, Table 3) find that the ACT is a better predictor when the college success criteria are higher.

29
ER for placement tests. For math, also, assigning all students to DE yields higher severe ERs.
Categorical assignment to college-level classes yields severe ERs that are lower for English (18
for ACCUPLACER and 25 percent for COMPASS). But for math, this categorical assignment
rule yields very high severe error rates of up to 40 percent.
The second validity metric is the remediation rate. Certainly, using placement tests will
result in a lower remediation rate than using a categorical rule to put all students in remediation.
Nevertheless, the rates are still high when using the placement tests, rising up to 90 percent for
the COMPASS Math 2 college-level class. Interestingly, they are not especially similar across
the two tests. Colleges using ACCUPLACER have higher remediation rates for English, setting
more strict cutoffs than those using COMPASS. But the reverse is true for math: Colleges that
use the COMPASS set stricter cutoffs, leading to more remediation. Across the subjects, these
remediation rates are 11 to 13 percentage points apart between the two tests.
The third validity metric is the college-level success rate (CLSR): the percentage of all
students directly assigned to college-level courses who earned C in that course. On this metric,
the placement tests outperform a categorical rule of placing all students directly into college-
level courses. For English, the CLSRs are 73 for the COMPASS group and 76 percent for the
ACCUPLACER group using the placement tests, compared with 66 percent and 74 percent,
respectively, using the categorical assignment. However, this comes at the cost of a higher severe
error rate in English. For math, the gain from using the placement tests is much greater: the
CLSR is higher by at least 10 percentage points and up to 26 percentage points for Math 2.
Finally, Table 9 shows the immediate success rate (ISR): the percentage of students assigned
directly to college and predicted to succeed ( C). These rates are low across all placement tests:
24 for ACCUPLACER and 31 percent COMPASS for English, and 15 percent for
ACCUPLACER and 8 percent for COMPASS for Math 2. Placing students in DE at very high
rates significantly reduces the college�’s immediate success rate.
There is no obvious reason to prefer one placement test to the other. The severe error
rates for COMPASS are lower than those for ACCUPLACER for English but higher for math.
Also, there is no evidence one particular test�—or how the SWCCS uses that test�—is more likely
to place students in remediation, even as the remediation rates vary significantly.
30
Table 9Validity Metrics for Placement Tests, All Remedial, and All College Assignments
Incremental Change ofPlacement Test Cutoffs Over
UsingPlacementTest Cutoffs
Placing AllStudents inDev. Ed.
Placing AllStudentsin College Dev. Ed.
College levelClasses
English
Severe error rate
ACCUPLACER 32.7 43.2 18.8 10.5 13.9
COMPASS 26.8 38.9 25.5 12.1 1.3
Remediation rate
ACCUPLACER 68.2 100.0 0.0 31.8 68.2
COMPASS 57.2 100.0 0.0 42.8 57.2
CL success rate ( C), assigned to CL
ACCUPLACER 76.1 73.8 2.3
COMPASS 72.9 66.0 6.9
Immediate CL success rate, all testers
ACCUPLACER 24.2 0.0 73.8 24.2 49.6
COMPASS 31.2 0.0 66.0 31.2 34.8
Math 1
Severe error rate
ACCUPLACER 21.2 33.7 28.4 12.5 7.2
COMPASS 28.0 41.1 17.0 13.0 11.0
Remediation rate
ACCUPLACER 54.3 100.0 0.0 45.8 54.3
COMPASS 68.3 100.0 0.0 31.7 68.3
CL success rate ( C), assigned to CL
ACCUPLACER 72.2 61.7 10.5
COMPASS 79.4 69.7 9.7
Immediate CL success rate, all testers
ACCUPLACER 33.0 0.0 61.7 33.0 28.7
COMPASS 25.2 0.0 69.7 25.2 44.5
Math 2
Severe error rate
ACCUPLACER 17.3 20.7 39.9 3.3 22.6
COMPASS 15.8 19.6 40.1 3.8 24.4
Remediation rate
ACCUPLACER 77.1 100.0 0.0 22.9 77.1
COMPASS 90.4 100.0 0.0 9.6 90.4
CL success rate ( C), assigned to CL
ACCUPLACER 66.2 49.9 16.3
COMPASS 78.1 52.5 25.6
Immediate CL success rate, all testers
ACCUPLACER 15.2 0.0 49.9 15.2 34.7
COMPASS 7.5 0.0 52.5 7.5 45.1
31
Restriction of range. One concern is that the placement tests are being used to
extrapolate across too wide a spread of student ability. It may be appropriate to predict student
success from the performance of students with similar scores but not from the performance of
students with very high or very low scores.
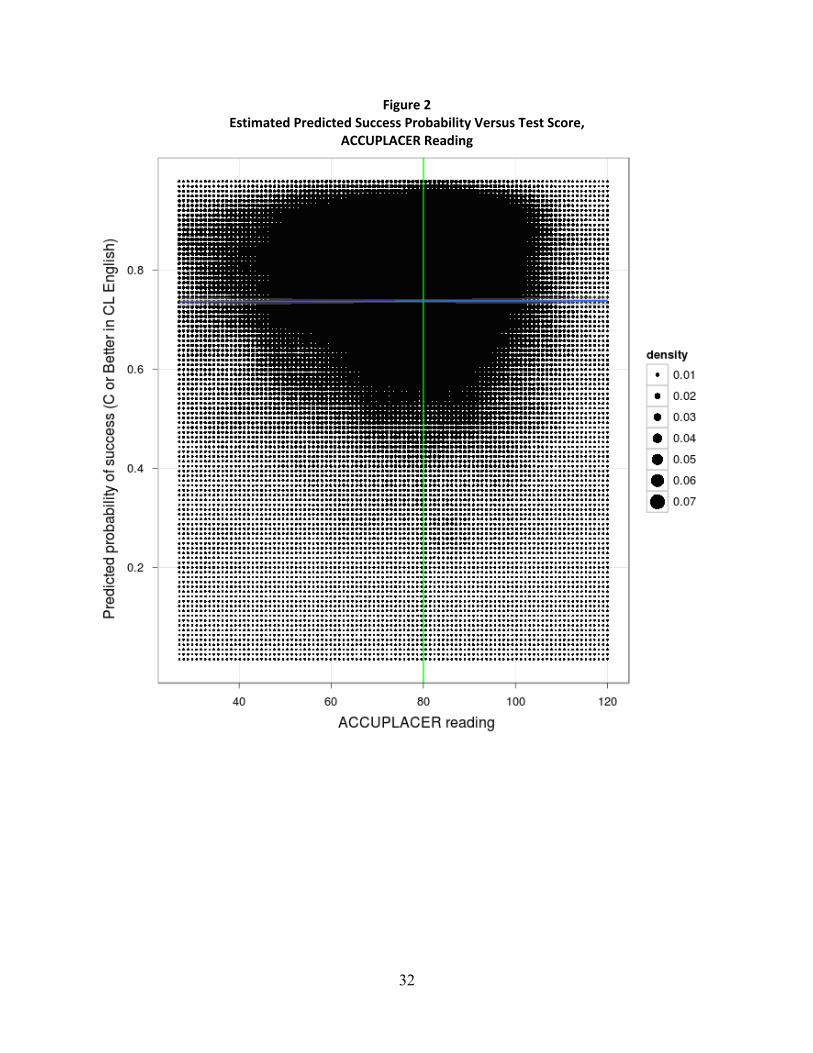
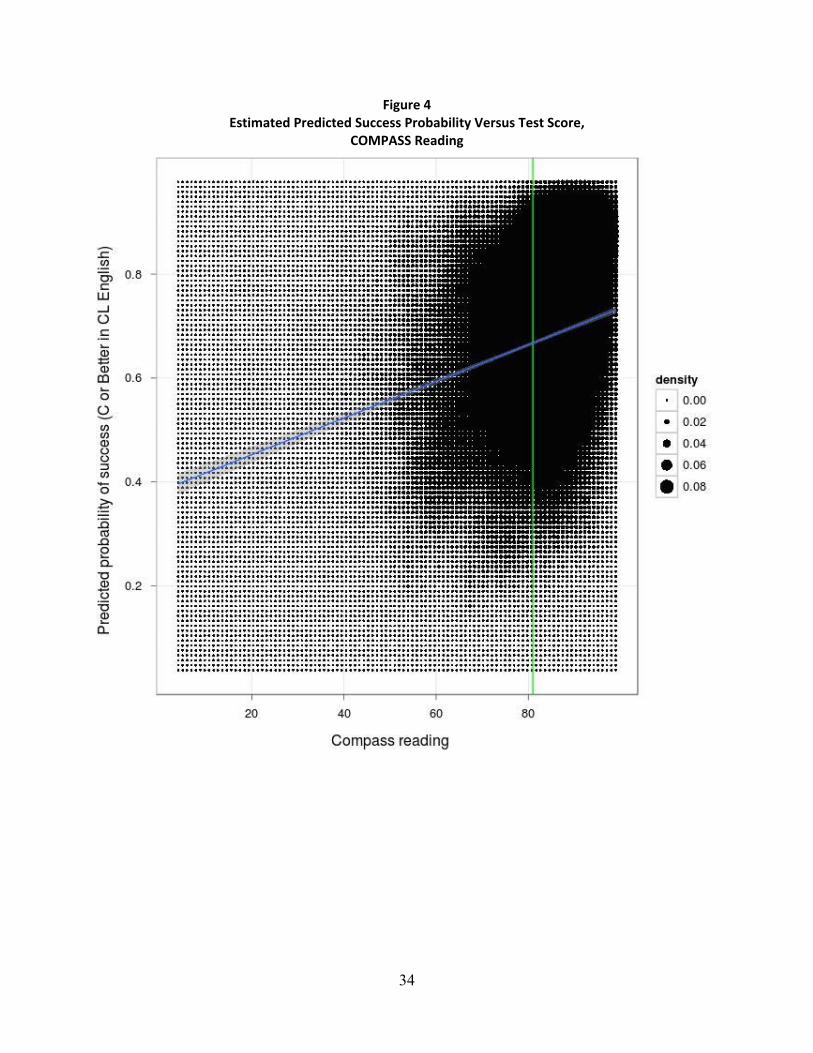
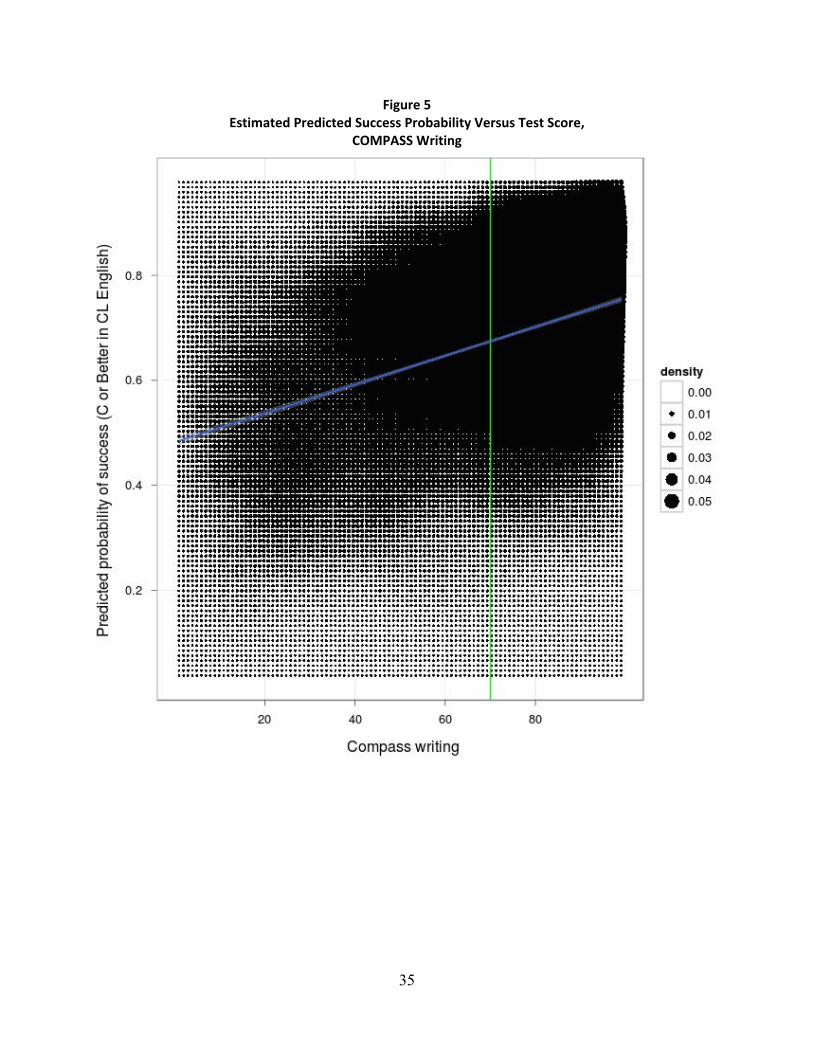
Figures 2 through 5 illustrate the predicted probabilities of success ( C) in college-level
English. The vertical line indicates the placement test cutoff, and the horizontal line indicates a
simple regression line. The density plot of Figure 2 is for ACCUPLACER Reading. The
probability of success in English appears to be constant across the range of placement test scores.
The mass is clustered more closely above the cutoff than below, where there is a greater range of
scores. Figure 3 shows a similar pattern for ACCUPLACER Sentence Skills. The density plot for
COMPASS Reading, in contrast, shows how all scores are close to the cutoff, which is very high
(Figure 4). Finally, the COMPASS Writing density plot in Figure 5 shows a sizeable mass of
students with very low placement scores (around 20 points) and a large mass of students with
maximum scores. Overall, these mixed patterns suggest that it is important to re-estimate the
validity metrics for subsamples of test scores.
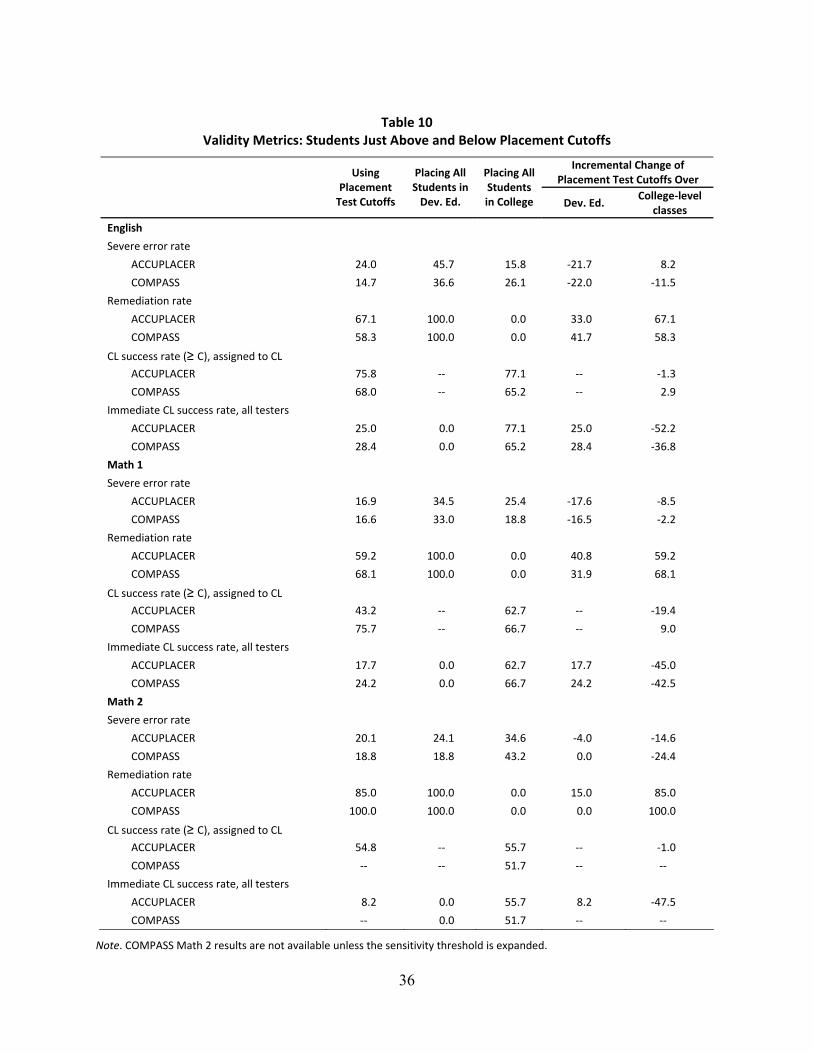
Therefore, we re-estimate Table 9 using only students close to the placement test cutoff
(within ten points on either side). These results are given in Table 10. Restricting the
applicability of the placement tests to those close to the cutoff yields some improvement in the
severe ER. For English, this results in a severe ER of 15 percent for the COMPASS and 24
percent for the ACCUPLACER. For Math 1, restricting the sample results in a severe ER of 17
percent for both tests. For Math 2, however, the severe ER is higher by three percentage points,
compared to Table 9. For the categorical assignment rules, in contrast, there is no gain from
restricting the sample. For the severe error rate and the success rate metrics, some differences are
positive and some negative; all are changes of only a few points. Thus, the results presented in
Table 9 are unlikely to be driven by students with very low or very high test scores.
32
Figure 2Estimated Predicted Success Probability Versus Test Score,
ACCUPLACER Reading

33
Figure 3Estimated Predicted Success Probability Versus Test Score,
ACCUPLACER Sentence Skills
34
Figure 4Estimated Predicted Success Probability Versus Test Score,
COMPASS Reading
35
Figure 5Estimated Predicted Success Probability Versus Test Score,
COMPASS Writing
36
Table 10
Validity Metrics: Students Just Above and Below Placement Cutoffs
Incremental Change ofPlacement Test Cutoffs Over
UsingPlacementTest Cutoffs
Placing AllStudents inDev. Ed.
Placing AllStudentsin College Dev. Ed.
College levelclasses
English
Severe error rate
ACCUPLACER 24.0 45.7 15.8 21.7 8.2
COMPASS 14.7 36.6 26.1 22.0 11.5
Remediation rate
ACCUPLACER 67.1 100.0 0.0 33.0 67.1
COMPASS 58.3 100.0 0.0 41.7 58.3
CL success rate ( C), assigned to CL
ACCUPLACER 75.8 77.1 1.3
COMPASS 68.0 65.2 2.9
Immediate CL success rate, all testers
ACCUPLACER 25.0 0.0 77.1 25.0 52.2
COMPASS 28.4 0.0 65.2 28.4 36.8
Math 1
Severe error rate
ACCUPLACER 16.9 34.5 25.4 17.6 8.5
COMPASS 16.6 33.0 18.8 16.5 2.2
Remediation rate
ACCUPLACER 59.2 100.0 0.0 40.8 59.2
COMPASS 68.1 100.0 0.0 31.9 68.1
CL success rate ( C), assigned to CL
ACCUPLACER 43.2 62.7 19.4
COMPASS 75.7 66.7 9.0
Immediate CL success rate, all testers
ACCUPLACER 17.7 0.0 62.7 17.7 45.0
COMPASS 24.2 0.0 66.7 24.2 42.5
Math 2
Severe error rate
ACCUPLACER 20.1 24.1 34.6 4.0 14.6
COMPASS 18.8 18.8 43.2 0.0 24.4
Remediation rate
ACCUPLACER 85.0 100.0 0.0 15.0 85.0
COMPASS 100.0 100.0 0.0 0.0 100.0
CL success rate ( C), assigned to CL
ACCUPLACER 54.8 55.7 1.0
COMPASS 51.7
Immediate CL success rate, all testers
ACCUPLACER 8.2 0.0 55.7 8.2 47.5
COMPASS 0.0 51.7
Note. COMPASS Math 2 results are not available unless the sensitivity threshold is expanded.
37
Validity metrics for high school information. To compare the validity of using high
school information with the placement tests, we estimate a linear probability model for success
in college using high school information for those who place directly into college-level classes.
This yields the predicted probabilities of success. A cutoff level is then derived, such that the
remediation rate remains the same as under the placement test decision rule. Based on this cutoff
level, we calculate the accuracy rates and error rates.
Table 11 shows the validity metrics after incorporating information from students�’ high
school transcripts. (For comparison, column 1 reprints the validity metrics for the placement tests
shown in Table 9, column 1). Clearly, using high school GPA for assignment results in much
lower severe error rates. For English, the severe ER is 12 percent for the ACCUPLACER group
and 17 percent for the COMPASS group, or approximately half of the severe ER that arises from
the use of placement tests. Similar improvements in the severe ER are evident for math. Using
high school GPA reduces the severe error rate to one in ten, which is also half that of the
placement tests. (For remediation, the rates are the same for HS GPA as when using the
placement tests by construction).
For the college-level success rate, assignment based on high school GPA also has higher
validity. For English, the rate is 83 percent for the COMPASS group and 89 percent for the
ACCUPLACER group, or 11 percentage points better than using placement tests. For math, the
college-level success rate is 7 to 9 percentage points higher than using the placement tests.
Similarly, the immediate success rate is higher using HS GPA as a predictor by 4 to 5 percentage
points in English and 1 to 4 percentage points in math. These are nontrivial differences.
Finally, as found in the correlations, high school GPA appears to contain all the available
explanatory power. Column 3 of Table 11 shows the results of using placement tests in
combination with HS GPA. Combining these two sources of information to yield a new
placement test rule is not an improvement over using HS GPA alone. The severe ER is higher, as
is the college-level success rate. Similarly, combining the placement test with other HS transcript
information (as shown in column 4) does not yield better results than HS GPA alone.

38
Table 11Validity Metrics Using Alternative Placement Rules
Placement TestScores Only
HS GPA OnlyPlacement Tests
+ HS GPAPlacement Tests+ HS Variables
English
Severe error rate
ACCUPLACER 32.7 16.5 25.7 25.9
COMPASS 26.8 12.3 18.8 19.0
Remediation rate
ACCUPLACER 68.2 67.5 68.9 70.0
COMPASS 57.2 56.3 56.4 57.4
CL success rate ( C), assigned to CL
ACCUPLACER 76.1 89.0 88.3 88.8
COMPASS 72.9 82.9 82.5 82.8
Immediate CL success rate, all testers
ACCUPLACER 24.2 28.9 27.5 26.6
COMPASS 31.2 36.2 36.0 35.3
Math 1
Severe error rate
ACCUPLACER 21.2 8.2 15.3 15.1
COMPASS 28.0 10.9 22.2 22.5
Remediation rate:
ACCUPLACER 54.3 53.2 54.1 55.3
COMPASS 68.3 67.6 68.1 69.1
CL success rate ( C), assigned to CL
ACCUPLACER 72.2 79.8 78.9 79.6
COMPASS 79.4 86.9 88.3 89.6
Immediate CL success rate, all testers
ACCUPLACER 33.0 37.4 36.2 35.6
COMPASS 25.2 28.2 28.2 27.7
Math 2
Severe error rate
ACCUPLACER 17.3 9.2 14.2 13.7
COMPASS 15.8 11.1 14.0 14.0
Remediation rate
ACCUPLACER 77.1 76.5 77.1 77.8
COMPASS 90.4 90.1 90.4 90.7
CL success rate ( C), assigned to CL
ACCUPLACER 66.2 74.1 73.4 75.8
COMPASS 78.1 86.6 89.6 90.1
Immediate CL success rate, all testers
ACCUPLACER 15.2 17.4 16.8 16.8
COMPASS 7.5 8.6 8.6 8.4
Note. High school variables as per Table 3.
39
5. Conclusion
Our analysis, by using detailed student information from a statewide community college
system, adds to the debate on the validity of placement tests in terms of how they are used by the
colleges. Our findings suggest that placement test scores are not especially good predictors of
course grades in developmental education classes. More importantly, the tests do not have much
explanatory power across a range of measures of performance including college GPA, credit
accumulation, and success in gatekeeper English and math classes. The null correlation between
college outcomes and placement test scores above the cutoff is of particular concern. These
findings are not restricted to one particular test or one subject but apply across all placement
tests. These results gain salience when contrasted with an alternative rule for making placement
decisions: use of high school GPA. High school GPA is an extremely good and consistent
predictor of college performance, and it appears to encapsulate all the predictive power of a full
high school transcript in explaining college outcomes.
The same broad conclusions can be drawn from our replication of Scott-Clayton�’s
analysis (2012, Tables 4�–8). Accuracy rates using placement tests are not high, and in some
cases, they could be improved simply by the use of a categorical rule placing all students into
developmental education or directly into college classes. Placement tests are associated with
severe error rates; three out of every ten test takers is either assigned to developmental education,
despite being predicted to get at least a B in college-level English, or assigned to college-level
English, despite being predicted to fail the course. Again, these results are in stark contrast with
those of high school GPA, which yields error rates half as big.
The relationship between HS GPA and college GPA is so powerful that it would seem
important for colleges to more fully consider this measure in deciding on placement. Our rule-of-
thumb association is that a student�’s college GPA tends to be one grade notch below that
student�’s HS GPA. If success is defined as a C average in college, we expect this would be
attained by all students with at least a C+ average in high school. It might therefore be justifiable
to waive college placement tests�—and so waive developmental education�—for students who
have HS GPAs above this threshold. Other high school transcript information is unlikely to be
helpful in determining whether students should be exempt from the college placement test.

40
However, there are some key cautions to our analysis. First, we emphasize that the
validity of the placement tests depends on how they are used. In the SWCCS, this usage may not
be consistent across test takers or tests, and this inconsistency could undermine our ability to
identify clear patterns. Second, large numbers of students take DE credits in at least one subject,
even when they have high HS GPAs. These students may succeed with fewer DE courses, but we
have not established which DE courses might be waived. A final caution is that we only have
data on a subset of SWCCS students. Those with missing data�—especially those students who
place directly into the college-level classes without taking a placement test�—may exhibit
different patterns.

41
References
ACT. (2006). COMPASS/ESL reference manual. Iowa City, IA: Author.
Bailey, T., Jeong, D. W., & Cho, S. W. (2010). Referral, enrollment and completion in developmental education sequences in community colleges. Economics of Education Review, 29(2), 255�–270.
Bettinger, E. P., Evans, B. J., & Pope, D. G. (2011). Improving college performance and retention the easy way: Unpacking the ACT exam (NBER Working Paper 17119). Cambridge, MA: National Bureau of Economic Research.
Office of Program Policy Analysis and Government Accountability. (2006). Steps can be taken to reduce remediation rates; 78% of community college students, 10% of university students need remediation (Report No. 06-40). Tallahassee, FL: Author. Retrieved from http://www.oppaga.state.fl.us/MonitorDocs/Reports/pdf/0640rpt.pdf
Horn, L., & Nevill, S. (2006). Profile of undergraduates in U.S. postsecondary education institutions: 2003–04, with a special analysis of community college students (NCES Report No. 2006-184). Washington, DC: U.S. Department of Education, Institute of Education Sciences, National Center for Education Statistics.
Hughes, K. L. & Scott-Clayton, J. (2011). Assessing developmental assessment in community colleges. Community College Review, 39(4), 327�–351.
Jenkins, D., Jaggars, S. S., & Roksa, J. (2009). Promoting gatekeeper course success among community college students needing remediation: Findings and recommendations from a Virginia study (Summary Report). New York, NY: Columbia University, Teachers College, Community College Research Center.
Mattern, K. D., & Packman, S. (2009). Predictive validity of ACCUPLACER scores for course placement: A meta-analysis (Research Report No. 2009-2). New York, NY: College Board.
Michaelides, M. P. (2005). North Carolina Community College System placement validity study [Monograph]. New York, NY: College Board.
Noble, J. P., & Sawyer, R. L. (2004). Is high school GPA better than admission test scores for predicting academic success in college? College and University Journal, 79(4), 17�–22.
Sawyer, R. (2007). Indicators of usefulness of test scores. Applied Measurement in Education, 20(3), 255�–271.
Scott-Clayton, J. (2012). Do high-stakes placement exams predict college success? (CCRC Working Paper No. 41). New York, NY: Columbia University, Teachers College, Community College Research Center.