predicting student success based on interaction with...
TRANSCRIPT

EPO-271
1
Predicting student success based on interaction with virtual learning environment Vivek Doijode, Neha Singh, Oklahoma State University
ABSTRACT Online learning can be called the millennial sister of classroom learning; tech savvy, always connected,
and flexible. These features offer a convenient alternative to students with constraints and working
professionals to learn on demand. According to National Center for Education Statistics, over 5 million
students are currently enrolled in distance education courses. The growing trend and popularity of
MOOCs (Massive Open Online Courses) and distance learning makes it an interesting area of research.
We plan to work on OULA (Open University Learning Analytics) dataset. Learning analytics provides
many insights on the learning pattern of students and on module assessments. These insights may be
researched to enhance participants’ learning experience. In this paper, we predict students’ success in
an online course using regression, clustering and classification methods. We have a mix of categorical
and numeric inputs present in the OULA datasets that are in csv file formats and contain information for
more than 30,000 students pertaining to 7 distance learning courses, student demographics, course
assessments and student interaction with virtual learning environment. We have merged tables
together using unique identifiers. We will first explore the merged data using SAS® to generate insights
and then build appropriate predictive models.
INTRODUCTION Open university is the one of the largest distance learning university in United Kingdom(UK). It offers
various courses for the undergraduate and graduate students and is vastly popular among the students
who cannot be on campus for various reasons. It has more than 250,000 students enrolled making it
largest academic institute in the country. With the advent of internet, it has become possible for
distance learning universities to provide course materials online in different formats. Students can
access these study materials anywhere and even give exams online. Universities can capture and record
the way students interact with the learning material. Many students end up failing courses or
withdrawing. Such data can provide useful and actionable insights into students’ learning behavior
which universities can use to improve student performance by providing them with additional help
wherever necessary.

EPO-271
2
DATA DESCRIPTION & METADATA The database schema depicts information collected for students in different categories:
Student Demographics
Student Activities
Module Presentations
The below data dictionary provides details about each field in the table and the database schema
Fig 1: Database Schema Final dataset is obtained by joining 7 different tables. The Student Info table contains demographic
details of students, Student Registration contains information on when the students
registered/unregistered for the courses, StudentVLE and VLE tables contain virtual learning environment
information, Student Assessment, Assessment tables contain information on assessments.
EPO-271
3
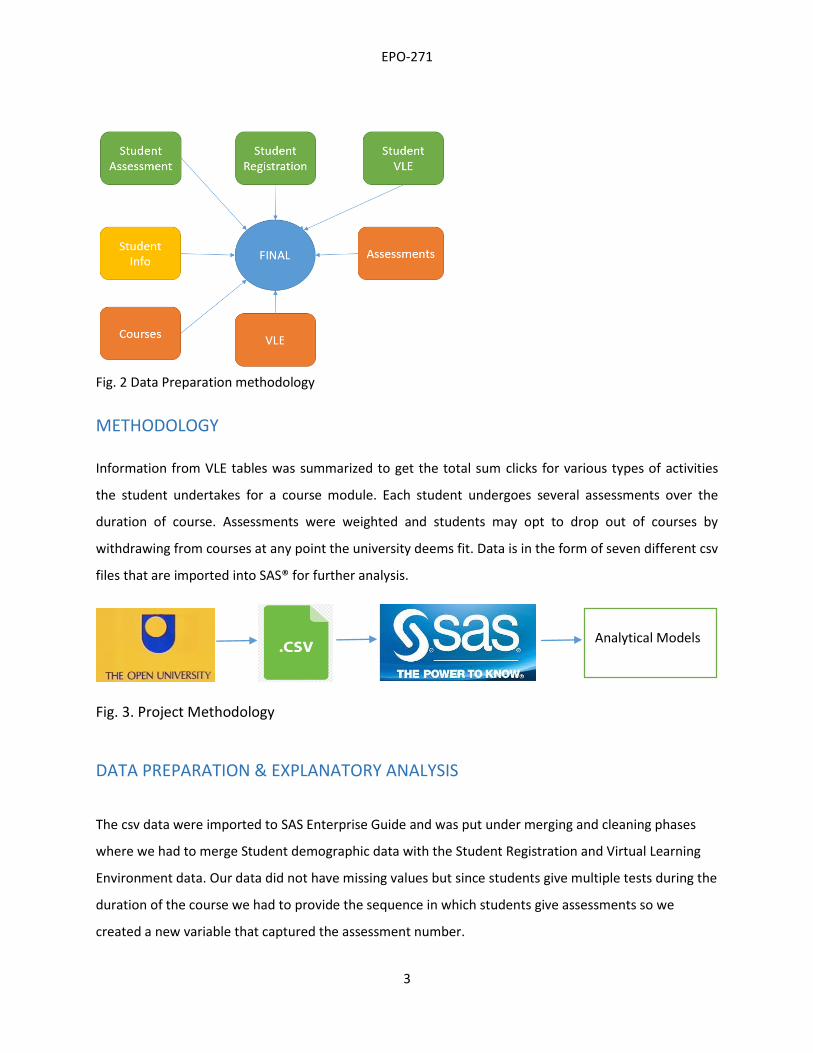
Fig. 2 Data Preparation methodology
METHODOLOGY Information from VLE tables was summarized to get the total sum clicks for various types of activities
the student undertakes for a course module. Each student undergoes several assessments over the
duration of course. Assessments were weighted and students may opt to drop out of courses by
withdrawing from courses at any point the university deems fit. Data is in the form of seven different csv
files that are imported into SAS® for further analysis.
Fig. 3. Project Methodology
DATA PREPARATION & EXPLANATORY ANALYSIS
The csv data were imported to SAS Enterprise Guide and was put under merging and cleaning phases
where we had to merge Student demographic data with the Student Registration and Virtual Learning
Environment data. Our data did not have missing values but since students give multiple tests during the
duration of the course we had to provide the sequence in which students give assessments so we
created a new variable that captured the assessment number.
Analytical Models

EPO-271
4
Information from VLE tables was summarized to get the total sum clicks for various types of activities
the student undertakes for a course module. Each student undergoes several assessments over the
duration of course. Assessments were weighted and students may opt to drop out of courses by
withdrawing. The final dataset contains 26 variables with Final_result as the target.
Fig 4. shows percentage rates of results by regions. South region had the highest pass percentage
whereas Wales had the highest failure percentage and North Western region with highest percentage of
withdraws.
Fig. 4 Percentage of Pass/Fail/Withdrawn by region
Fig 5. represents percentages of Pass, Fail and withdraws for each of the modules. Module AAA had the
highest pass percentage and lowest percentage of failure whereas module CCC had the lowest pass
percentage and highest percent withdraws.

EPO-271
5
Fig. 5 Module wise percentages of Pass/Fail/Withdrawn Fig. 6 Provides frequencies of Pass, Fail and Withdraws for each assessment number.
Fig. 6 Frequencies of Pass/Fail/Withdrawn In Fig 7. Students who passed the modules had the most number of total clicks on materials compared to students who failed or withdrew from the courses.

EPO-271
6
Fig. 7 Sum clicks for each student for the finalresult
DECISION TREE
Using decision tree, we would be able to explain the most important variables of our analysis by
observing the top segment of the decision tree and analyzing the variable importance matrix.
Fig 8 : Variable Importance From fig 8. we can see that date_unregistration , latest_date_of_interaction, score, module and
total_clicks are important variables and later we will use these to build the decision tree. Target
variable like ours which is categorical require data to be partitioned a chi square statistics is computed.
The logworth statistic is used for pruning or growing a tree. The first split is done on the
date_unregistration which splits the data into two groups. Here this first split separates the 2 groups on
3 levels of the target variable. Other criteria used for splitting are Gini coefficient and Entropy. Gini
coefficient identifies between the heterogeneous and homogenous groups.

EPO-271
7
The best split will be something that differentiates data into more homogenous groups. Here we
look at probability value or p value of Pearson chi-squared statistic because we have a multi-
outcome target variable.
Fig. 9:Decision Tree
Fig 9. represents an interactive decision tree model which uses the classifying variables based on
their (logworth) value. Misclassification rate of the train and validation data is close and is less as
0.10, so that is a fair estimate of a good model but if we look at the data split, this split results into
homogenous groups of withdrawn and pass students which at this point is not desirable. Hence we
ignore this variable and instead do our first split on the second most important variable. i.e.
latest_date_of_interaction.

EPO-271
8
Fig. 10: Decision Tree Split
It splits into 2 child nodes based on if the student had the latest interaction with the course
material in greater than 206 days from the start of lesser. It gives us some interesting results and
which is aligned to previous research done of the similar subject. Students greater than 206 days
had as low as 1.4% withdrawn percent rate. 2nd split was done on the score variable which is a
cumulative of all the TMA (Tutor Marked Assessment) for that module per student. Group of
students who scored greater than 57 on any assessment had a high pass percentage of 90.01 as
compared to the other group who scored less than 57 in any of the assessments.
Fig 11 : Variable Importance
With increasing complexity of tree, we need to plot the tree size and variation explained at
every level, we can find at which level the variation is minimum. Accordingly, we can prune the
tree to get the simplified version of the tree. Misclassification error for this model has similar
values for Train and validation and a values of 0.18.
Fig 12: Fit Statistics
EPO-271
9
CONCLUSIONS
• The most important variables are latest_date_of_interaction that is measured as number of
days relative to the start of module presentation, followed by Score, Code_module.
• Students who scored greater than 57 in initial assessments had a high pass percentage of 90.01
as compared to the other group who scored less than 57.
• Of the students who scored more than 73.5 and had total clicks greater than 1352 had the
greatest pass percentage of 96.14 whereas only 3.4% ended up failing.
• Of the students who scored less than 73.5 in any of the assessments and with sum clicks less
than 1352, 8.16% ended up failing the course.
FUTURE WORK The scope of this project will be extended to do back test of the model and implement the successful
validation results to identify students at risk, applicable to online learning websites such as Coursera,
and Udacity.
REFERENCES • Kuzilek, J., Hlosta, M., Zdrahal, Z. Open University Learning Analytics Dataset. Data Literacy For
Learning Analytics Workshop at Learning Analytics and Knowledge (LAK16)
• Decision Tree Models in Data Mining -Matthew J. Liberatore ,Thomas Coghlan
• Kuzilek, J., Hlosta, M., Herrmannova, D., Zdrahal, Z. and Wolff, A. OU Analyse: Analysing At-Risk
Students at The Open University. Learning Analytics Review, no. LAK15-1, March 2015, ISSN: 2057-
7494
ACKNOWLEDGEMENTS
• We thank Dr.Goutam Chakraborty, Professor, Department of Marketing, and founder of SAS and
OSU Data Mining Certificate Program, Oklahoma State University for his constant guidance
throughout the research.

EPO-271
10
CONTACT INFORMATION Your comments and questions are valued and encouraged. Contact the authors at: Vivek Doijode Oklahoma State University Email: [email protected] Vivek Doijode is a graduate student currently pursuing Master of Science degree in Business Analytics at the Spears School of Business, Oklahoma State University. Vivek has five years of professional experience working for Cognizant Technology Solutions as a developer and quality assurance analyst in healthcare and cards and payment domains. Neha Singh
Oklahoma State University
Email: [email protected]
Neha Singh is a graduate student currently pursuing Masters in Business Analytics at the Spears School of Business, Oklahoma State University.
SAS and all other SAS Institute Inc. product or service names are registered trademarks or trademarks of SAS Institute Inc. in the USA and other countries. ® indicates USA registration.
Other brand and product names are trademarks of their respective companies.