predicting performance through the elements of - …revad.uvvg.ro/files/nr14/5. ibudunni.pdf · 66...
TRANSCRIPT
66
PREDICTING PERFORMANCE THROUGH THE ELEMENTS OF
ORGANIZATIONAL CULTURE
Olanrewaju Samson IBIDUNNI
Covenant University, College of Development Studies, Department of Business
Management,
Canaanland, Ota, Ogun-State, Nigeria
Tel.: +234-08033323989 E-mail: [email protected]
Agboola Gbenga MAYOWA
Covenant University, College of Development Studies, Department of Business
Management,
Canaanland, Ota, Ogun-State, Nigeria
Tel.: +234-805-852-3404 E-mail: [email protected]
Abstract
Organizational culture is shaped by the leaders and by the purpose for which the
organization exist. There are many cultures and sub-cultures, which may be of
different strengths and which may have different levels of influence. The main aim
of this paper was to determine what elements of organizational culture predict the
performance of an organization. The objectives of the study were to determine if
the different elements of organizational culture have significant contribution on the
performances of Universities and to reveal which of the different elements of
organizational culture has the most significant contribution in predicting the
performances of Universities. To determine what elements of organizational
culture predict the performance of an organization, a sample of 100 staff
(academic and non-academic)each of Covenant University, Ota, Olabisi Onabanjo
University, Ago-Iwoye, University of Agriculture, Abeokuta, all in Ogun State were
drawn. Data was collected with the use of a Likert type questionnaire and were
analyzed using multiple regressions with the aid of Statistical Package for Social
Sciences (SPSS). The finding shows that Quality Consciousness, Role Clarity,
Employee Concern, Customer Care and Code of Conduct made the most
significant contribution in predicting performances of organizations. Conclusively,
there is no such thing as a ‘right’ or ‘best’ culture for all organizations. The most
appropriate culture for an organization is the one that best helps it cope with the
exigencies of its business environment. The most appropriate culture for an
organization is the one that best helps it cope with the exigencies of its business
environment.
Keywords: organizational culture, elements of organizational culture,
predicting and organizational performance
The Public Administration and Social Policies Review VII, 1(14) / June 2015
67
Introduction
In the beginning organizational culture is shaped by the leaders and by the
purpose for which the organization has been created. It then develops within the
constraints of the environment, technology, values of the leadership, and
performance expectations. “The initial culture is altered by the design variables of
the organization, experiences of the organization, management’s leadership style,
the structure of the organization, the nature of the tasks of the groups, the way
decisions are made, and the size of the organization. In addition, the developing
culture is affected by the internal integrity of the organization, the climate, and how
well the organization is competing in the marketplace, its effectiveness” (DeWitt,
2001).
Culture generates strong pressures on people to go along, to think and act
in ways consistent with the way employees dress and the amount of time allowed
to elapse before meetings begin, to the speed with which people are promoted.
Although, it is a known fact that culture has an effect on people’s
behaviour, management’s interest is likely to be prompted by curiosity about why
this happens than by its possible bottom-line effects on the commercial
performance of an organization. To a large extent this interest was kindled by the
writings of authors who view culture as a key component in the performance of
successful organizations. These ideas resulted in an increased awareness among
managers of the effects of culture but, as is often the case, a more dangerous turn of
events were set in motion.
When cultural characteristics of successful organizations were set out in
books in a catchy, marketable and easily grasped way, there was an understandable
tendency for some managers to believe that, at last, social science had come up
with something of immense practical use. Other than the writings of popular
authors, there is little evidence of a strong association between culture and
organizational performance, and none for a set of cultural characteristics that are
likely to be appropriate in all circumstances.
Later, when studies were conducted on firms that were said to have their
culture associated with performance, no coherent link between culture and
performance could be established and several of the firms were in serious
difficulties.
Conceptual Framework
Organizational culture is the basic pattern of shared assumptions, values
and beliefs considered to be correct way of thinking about and acting on problems
and opportunities facing the organization. McShane (2005) simply describes
organizational culture as an organization’s DNA not visible to the eye, but a very
powerful tool that shapes what happens in an organization.
Mowat (2002) put forward that organizational culture is the personality of
the organization: the shared beliefs, values and behaviors of the group. It is
symbolic, holistic, and unifying, stable, and difficult to change. Organizational
culture is made up of both the visible and invisible, conscious and unconscious
Olanrewaju Samson Ibidunni & Agboola Gbenga Mayowa - Predicting Performance …
68
learning and artifacts of an organization. Mowat also said that culture is the shared
mental model that is assumptions. This mental model that is assumptions are taken
for granted by those within the organization and it is difficult for people outside the
organization to decode it. It is important to note therefore that the organizational
culture is not the ideal, vision, and mission stated for the organization towards
achieving its goals and objectives, rather, it is the expression of the day-to-day
practices, communications, norms, values and beliefs that exist within an
organization.
According to Borgatti (1996) a strong culture:
• Is internally consistent
• Is widely shared, and
• Makes it clear what appropriate behavior is.
The result of an organization with a vision that everyone understands to
which everyone is committed to, When employees gather and particularly when
employees with a common purpose begin to work together, the strategies of work
and the processes of thinking will enlarge and the culture of the organization will
be created. No organization exist in a vacuum just as we know that “no man is an
island,” most organizational cultures have key features that are common with the
larger culture of the community or society in which the organization exist. For
example in Mowat (2002), organizational cultures in America all have some
similar underlying thread. Organizational cultures in other countries also have a
unifying, cross-organizational flavor. However, even within a social culture, each
organizational culture is unique.
Put more simply, organizational culture is the way things are getting done
in an organization. It is what determines the action in an organization, guides how
employees think, act and feel. It is the systematic set of assumptions that define
day-to-day working behaviour. “Culture can be described in a circular fashion
where philosophy expresses values; values are manifest in behavior; and behavior
gives meaning to the underlying philosophy. Philosophy, values, and behavior
describe an organization’s culture and culture is the glue that holds the organization
together.” (DeWitt, 2001)
Organizational culture can also be looked at as a system with inputs from
the environment and outputs such as behaviors, technologies and products. It “is
dynamic and fluid, and it is never static. A culture may be effective at one time,
under a given set of circumstances and ineffective at another time. There is no
generically good culture. There are however, generic patterns of health and
pathology.” (Hagberg et al, 2000).
According to BOLA (2001), culture is the shared beliefs, values and norms of a
group and it includes:
• The way work is organized and experienced
• How authority exercised and distributed
• How people are and feel rewarded, organized and controlled
• The values and work orientation of staff
The Public Administration and Social Policies Review VII, 1(14) / June 2015
69
• The degree of formalization, standardization and control through systems
there is/should be
• The value placed on planning, analysis, logic, fairness etc.
• How much initiative, risk-taking, scope for individuality and expression is
given
• Rules and expectations about such things as informality in interpersonal
relations, dress, personal eccentricity etc.
• Differential status
• Emphasis given to rules, procedures, specifications of performance and
results, team or individual working
There are many cultures and sub-cultures, which may be of different
strengths and which may have different levels of influence. “Subcultures may share
certain characteristics, norms, values and beliefs or be totally different. These
subcultures can function cooperatively or be in conflict with each other.” (Hagberg
et al, 2000).
The Organizational Culture Inventory (OCI) defines corporate culture as
“the sum of all moral concepts reflecting direct and indirect behavioral
expectations. The central question of the OCI is: How must an employee behave in
order to match the organization and meet the expectations?”
There is considerable overall agreement as to the general definition of
organizational culture and most questionnaires define culture as: "a set of
cognitions shared by members of a social unit" (O'Reilly et al, 1991), or more
fully: "a system of shared values and beliefs that produces norms of behavior and
establishes an organizational way of life" (Koberg et al, 1987). This latter
definition is important because it pinpoints that the culture construct can be
equivocally understood to deal with "major beliefs and values” (Goll et al, 1991),
or alternatively as “norms and patterns of behaviors and norms” (Gundry et
al,1994).
Employees are influenced by multiple cultural institutions such as family,
community, nation, state, church, educational system, and other work
organizations, and these associations shape their attitudes, behavior, and identity;
employees bring these influences with them when they join an organization, so it is
difficult to separate an organizational culture from the larger cultural processes
(Hatch, 1997).According to the work of Koteswara, P. K., Srinivasan, P. T. and
George J.P. (2005),Literatures have revealed that organizational culture have been
measured by various authors in terms of various elements. Koteswara et al
identified a total number of 123 elements from ten different authors in his work.
This does not connote that there are only 123 elements of organizational culture
that can be used to measure organizational culture; there is a possibility that there
may be some more which have not fallen into the 123 elements. Koteswara and his
colleagues went further to summarize the 123 elements into ten elements that can
be used in the measurement of organizational culture, which include, unity in
diversity, creativity-adaptability, culture nurturing, customer care, quality
Olanrewaju Samson Ibidunni & Agboola Gbenga Mayowa - Predicting Performance …
70
consciousness, collaboration, open communication, code of conduct, role clarity
and employee concern.
The objectives under consideration in this paper were:
a. To determine if the different elements of organizational culture has
significant contribution on the performances of Universities.
b. To reveal which of the different elements of organizational culture has the
most significant contribution in predicting the performances of
Universities.
Research Question:
a. Which of the elements of organizational culture has significant
contribution on the performances of Universities?
b. Which of the elements of organizational culture has the most significant
contribution in predicting the performances of Universities?
Research Hypothesis:
H0: There is no significant contribution of the elements of
organizational culture in predicting the performances of Universities.
H1: There is significant contribution of the elements of organizational
culture in predicting the performances of Universities.
Research method:
The method adopted in this study was the Survey Research Design, which
is to research on “Predicting Performance through the Elements of Organizational
Culture” using the questionnaire to harvest opinions on the culture and
performances of Universities. The population studied cuts across all staff of the
three Universities in Ogun State, Nigeria. The hierarchical structure of the study
population is made up of three tiers, which include top, middle and lower level
staff. The characteristic of the study population is that it was mixed at every level
of the organization irrespective of age, sex, educational background, employment
level, salary scale and marriage status.
The sample frame for this study covers all staff at various levels of the
three Universities in Ogun State. The sample size, which was determined
judgmentally, consisted of 100 staff of each of the Universities. Non-probability
sampling technique was the sample technique adopted and the sampling instrument
used was a structured questionnaire. The respondents to the questionnaire were
selected based on convenience sampling in each of the Universities.
The Questionnaire was the data collecting instrument used in this study.
The questionnaire had twenty major statements, which was intended to assess
“Predicting Performance through the Elements of Organizational Culture” of three
Universities in Ogun State, Nigeria. Twenty item statements of a five point Likert
Scale ranging from a “Strongly Agree to Strongly Disagree”, were asked to get
responses on 10 elements of Organizational Culture, which are: Culture Nurturing,
Creativity – Adaptability, Unity in Diversity, Customer Care, Collaboration, Open
Communication, Code of Conduct, Role of Clarity, Quality Consciousness and
Employee Concern; and responses on two Performance variables: Perceptions and
Effectiveness. The questionnaire was a structured one as the method of data
The Public Administration and Social Policies Review VII, 1(14) / June 2015
71
collection and field assistance was used in retrieving the questionnaires from the
respondents.
The data from the questionnaires were collected, collated, sorted, analyzed
and presented through the use of multiple regressions. The procedures for
processing the data was done through the use of analytical software called the
Statistical Package for Social Sciences (SPSS). All the items in the questionnaire
were analyzed.
Result
This section of the paper presents the data collected on the "Likert scale,"
through the use of Multiple Regression. A frequency table was used for analyzing
the monthly salary of the respondents from the three Universities. After the data
had been collected, the procedures for the processing of the collected data using
Likert scale was through the use of analytical software called the SPSS. The
hypothesis was tested using Multiple Regression.
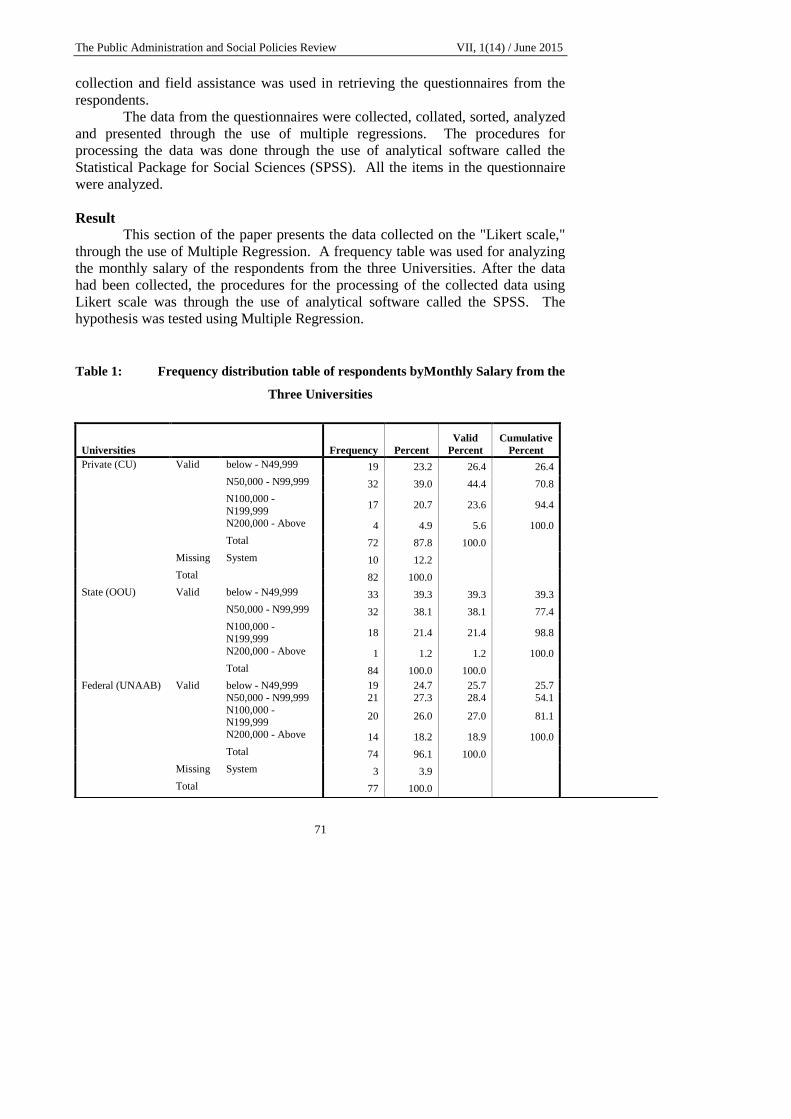
Table 1: Frequency distribution table of respondents byMonthly Salary from the
Three Universities
Universities Frequency Percent
Valid
Percent
Cumulative
Percent
Private (CU) Valid below - N49,999 19 23.2 26.4 26.4
N50,000 - N99,999 32 39.0 44.4 70.8
N100,000 -
N199,999 17 20.7 23.6 94.4
N200,000 - Above 4 4.9 5.6 100.0
Total 72 87.8 100.0
Missing System 10 12.2
Total 82 100.0
State (OOU) Valid below - N49,999 33 39.3 39.3 39.3
N50,000 - N99,999 32 38.1 38.1 77.4
N100,000 -
N199,999 18 21.4 21.4 98.8
N200,000 - Above 1 1.2 1.2 100.0
Total 84 100.0 100.0
Federal (UNAAB) Valid below - N49,999 19 24.7 25.7 25.7
N50,000 - N99,999 21 27.3 28.4 54.1
N100,000 - N199,999
20 26.0 27.0 81.1
N200,000 - Above 14 18.2 18.9 100.0
Total 74 96.1 100.0
Missing System 3 3.9
Total 77 100.0
Olanrewaju Samson Ibidunni & Agboola Gbenga Mayowa - Predicting Performance …
72
The table 1 shows the total number of respondents’ monthly salary and
their percentages. It reveals that from CU, 23.2% received the salary between
below – N49,999 every month, 39.0% received the salary between N50,000 –
N99,999 every month, 20.7% received the salary between N100,000 – N199,999
every month, 4.9% received the salary between N200,000 – above every month
and none were missing. From OOU, 39.3% received the salary between below –
N49,999 every month, 38.1% received the salary between N50,000 – N99,999
every month, 21.4% received the salary between N100,000 – N199,999 every
month, 1.2% received the salary between N200,000 – above every month and none
were missing. From UNAAB, 24.7% received the salary between below –
N49,999 every month, 27.3% received the salary between N50,000 – N99,999
every month, 26.0% received the salary between N100,000 – N199,999 every
month, 18.2% received the salary between N200,000 – above every month and
3.2% were missing.
Test of Hypothesis
The data from Covenant University (CU), Olabisi Onabanjo University
(OOU) and University of Agriculture (UNAAB) were also combined and analyzed
to determine the significant contribution of the elements of organizational culture
in predicting the performances of the three Universities on general terms. The
analysis of the three Universities combined is as presented below:
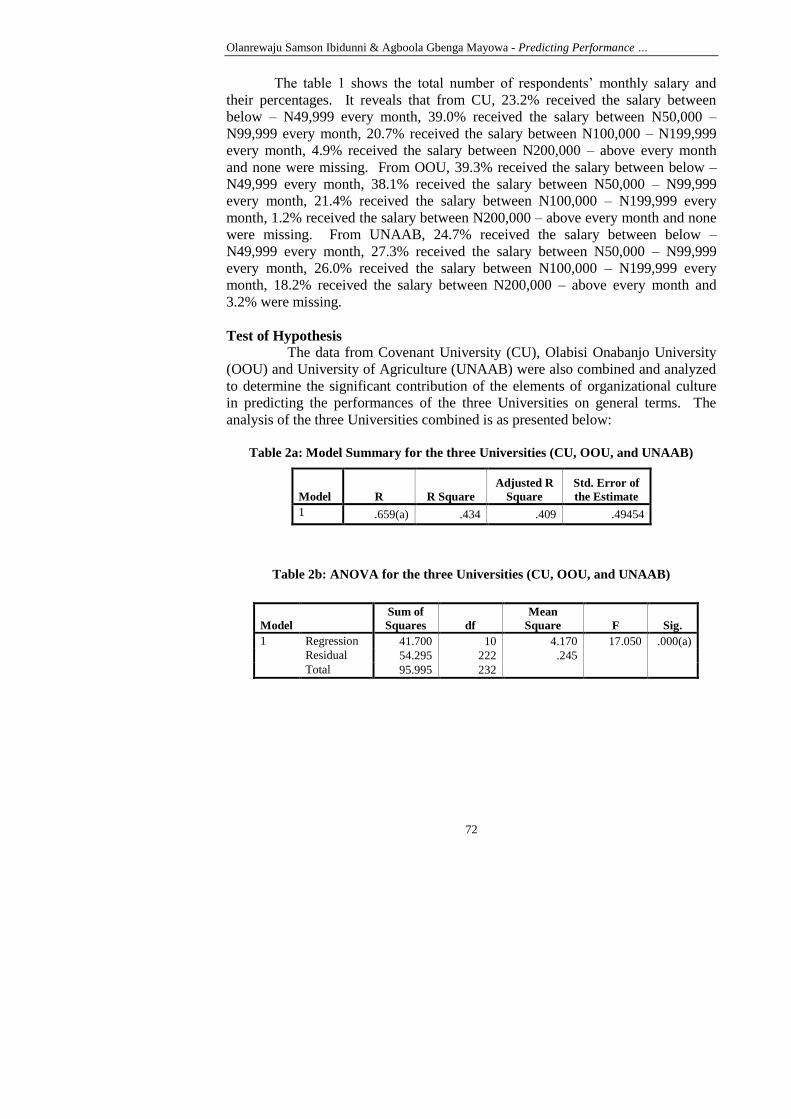
Table 2a: Model Summary for the three Universities (CU, OOU, and UNAAB)
Model R R Square
Adjusted R
Square
Std. Error of
the Estimate
1 .659(a) .434 .409 .49454
Table 2b: ANOVA for the three Universities (CU, OOU, and UNAAB)
Model
Sum of
Squares df
Mean
Square F Sig.
1 Regression 41.700 10 4.170 17.050 .000(a)
Residual 54.295 222 .245
Total 95.995 232
The Public Administration and Social Policies Review VII, 1(14) / June 2015
73
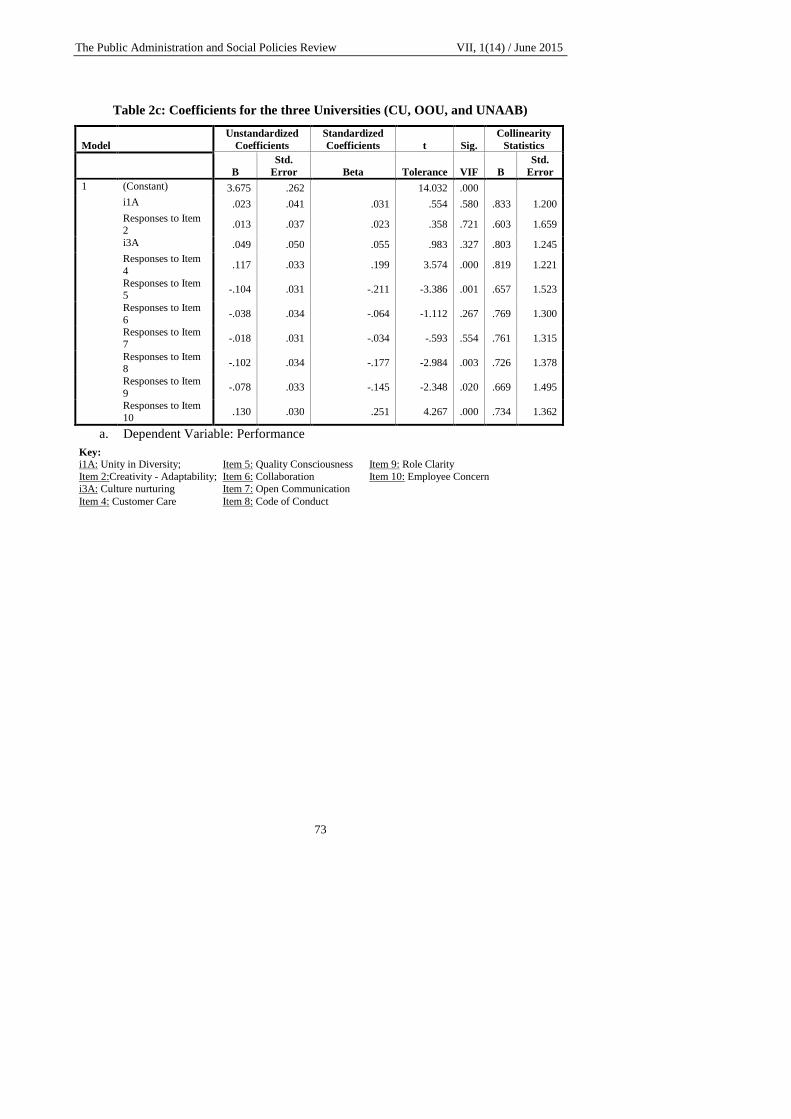
Table 2c: Coefficients for the three Universities (CU, OOU, and UNAAB)
Model
Unstandardized
Coefficients
Standardized
Coefficients t Sig.
Collinearity
Statistics
B
Std.
Error Beta Tolerance VIF B
Std.
Error
1 (Constant) 3.675 .262 14.032 .000
i1A .023 .041 .031 .554 .580 .833 1.200
Responses to Item 2
.013 .037 .023 .358 .721 .603 1.659
i3A .049 .050 .055 .983 .327 .803 1.245
Responses to Item
4 .117 .033 .199 3.574 .000 .819 1.221
Responses to Item 5
-.104 .031 -.211 -3.386 .001 .657 1.523
Responses to Item
6 -.038 .034 -.064 -1.112 .267 .769 1.300
Responses to Item
7 -.018 .031 -.034 -.593 .554 .761 1.315
Responses to Item 8
-.102 .034 -.177 -2.984 .003 .726 1.378
Responses to Item
9 -.078 .033 -.145 -2.348 .020 .669 1.495
Responses to Item
10 .130 .030 .251 4.267 .000 .734 1.362
a. Dependent Variable: Performance
Key:
i1A: Unity in Diversity; Item 5: Quality Consciousness Item 9: Role Clarity
Item 2:Creativity - Adaptability; Item 6: Collaboration Item 10: Employee Concern
i3A: Culture nurturing Item 7: Open Communication
Item 4: Customer Care Item 8: Code of Conduct
74
Table 2d:Multiple Regression Analysis for the three Universities (CU, OOU, and UNAAB)
Performanc
e i1A
Response
s to Item
2 i3A
Respons
es to
Item 4
Respons
es to
Item 5
Response
s to Item
6
Responses
to Item 7
Respons
es to
Item 8
Respons
es to
Item 9
Respons
es to
Item 10
Pearson
Correlation
Performance 1.000 .014 .352 .225 .393 -.482 -.300 .226 -.384 -.378 .395
i1A .014
1.00
0 .215 .128 -.021 -.011 .151 .251 .178 .045 .117
Responses to Item 2 .352 .215 1.000 .428 .341 -.362 -.070 .243 -.130 -.207 .417
i3A .225 .128 .428
1.00
0 .199 -.177 -.002 .068 -.089 -.114 .194
Responses to Item 4 .393 -.021 .341 .199 1.000 -.253 -.178 .196 -.132 -.180 .269
Responses to Item 5 -.482 -.011 -.362
-
.177 -.253 1.000 .351 -.258 .365 .423 -.249
Responses to Item 6 -.300 .151 -.070
-
.002 -.178 .351 1.000 -.113 .351 .354 -.079
Responses to Item 7 .226 .251 .243 .068 .196 -.258 -.113 1.000 -.123 -.263 .330
Responses to Item 8 -.384 .178 -.130
-
.089 -.132 .365 .351 -.123 1.000 .426 -.084
Responses to Item 9 -.378 .045 -.207
-
.114 -.180 .423 .354 -.263 .426 1.000 -.037
Responses to Item 10 .395 .117 .417 .194 .269 -.249 -.079 .330 -.084 -.037 1.000
Sig. (1-tailed) Performance . .415 .000 .000 .000 .000 .000 .000 .000 .000 .000
i1A .415 . .000 .023 .371 .434 .009 .000 .003 .244 .035
Responses to Item 2 .000 .000 . .000 .000 .000 .138 .000 .022 .001 .000
i3A .000 .023 .000 . .001 .003 .487 .145 .084 .039 .001
Responses to Item 4 .000 .371 .000 .001 . .000 .003 .001 .022 .003 .000
Responses to Item 5 .000 .434 .000 .003 .000 . .000 .000 .000 .000 .000
Responses to Item 6 .000 .009 .138 .487 .003 .000 . .040 .000 .000 .110
Responses to Item 7 .000 .000 .000 .145 .001 .000 .040 . .028 .000 .000
Responses to Item 8 .000 .003 .022 .084 .022 .000 .000 .028 . .000 .096
Responses to Item 9 .000 .244 .001 .039 .003 .000 .000 .000 .000 . .282
Responses to Item 10 .000 .035 .000 .001 .000 .000 .110 .000 .096 .282 .
N Performance 243 243 242 243 236 240 242 242 242 241 243
i1A 243 243 242 243 236 240 242 242 242 241 243
Responses to Item 2 242 242 242 242 235 239 241 241 241 240 242
i3A 243 243 242 243 236 240 242 242 242 241 243
Responses to Item 4 236 236 235 236 236 233 236 236 235 235 236
Responses to Item 5 240 240 239 240 233 240 239 239 239 238 240
Responses to Item 6 242 242 241 242 236 239 242 241 241 240 242
Responses to Item 7 242 242 241 242 236 239 241 242 241 241 242
Responses to Item 8 242 242 241 242 235 239 241 241 242 240 242
Responses to Item 9 241 241 240 241 235 238 240 241 240 241 241
Responses to Item 10 243 243 242 243 236 240 242 242 242 241 243
75
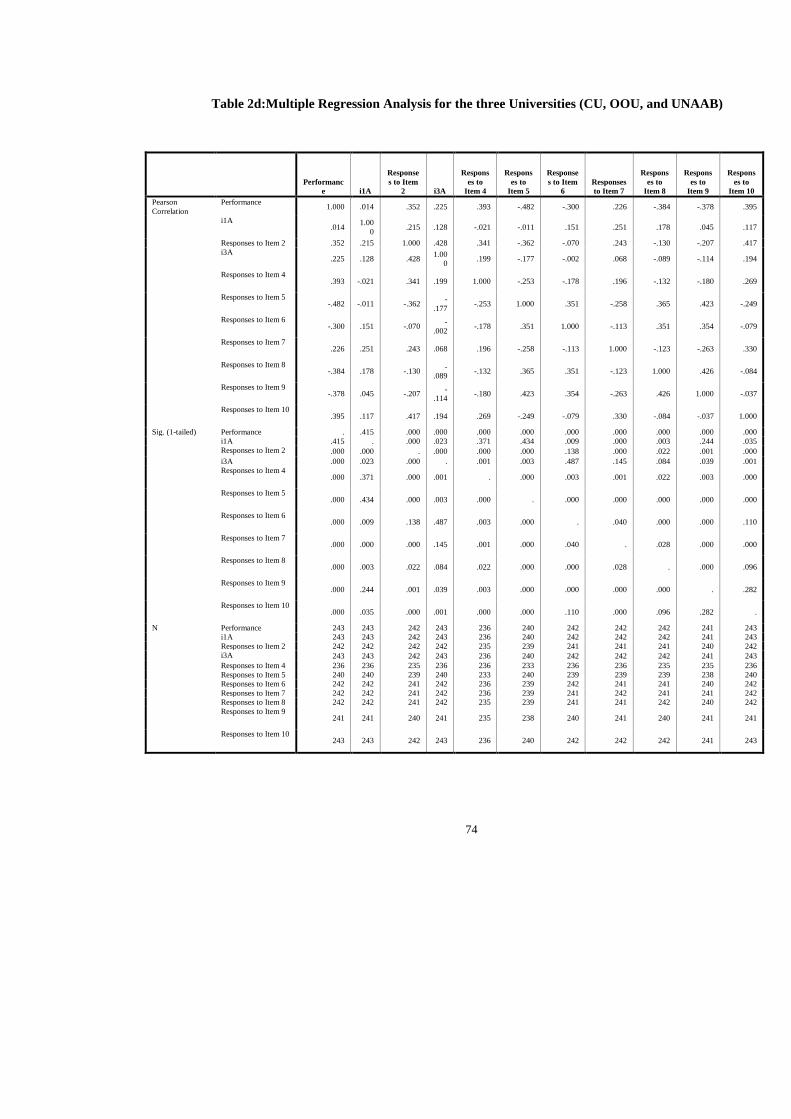
The above analysis is part of the results generated from the SPSS
package using multiple regression analysis. The three Universities were
investigated together as a whole. From the analysis, several tables were generated,
but for the basis of measuring the significant contribution of each element of
organizational culture in predicting performance, three tables will be used to
explain the significant contribution of each of the elements of organizational
culture on performance. These tables are model summary, correlation and
coefficient.
In the multiple regression analysis table (Table 2d), the column showing
i1A, responses to item 2, i3A, and responses item 4 to responses to item 10,
represent each of the cultural element analyzed. From the analysis in table 4.9,
items 2, 4, 5, 6, 8, 9 and 10, have moderately strong correlations with the
dependent variable (Performance), which is equal to and above “.300”. Also, the
correlation among each of the independent variables is not too high. Researchers
suggest that we do not include two variables with a bivariate correlation of “.7” or
more in the same analysis.
In table 2a (model summary), the result shows how much of the variance in
the dependent variable (Performance) is explained by the model, which includes
the variable item 1 to 10 (the elements of organizational culture). The “.434” in the
‘R’ square column is expressed in percentage. This means that our model (the
cultural elements) explains 43.4% of the variance on performances of the three
Universities, which is a weak relationship.
In comparing the contribution of each independent variable (cultural
elements), table 2c (coefficient table) will be used to determine this. In the “Beta”
column, the largest value is considered, that is “.251” for item 10. This means that,
the cultural element item 10 makes the strongest unique contribution in explaining
the dependent variable (Performance). The Beta values for the other elements
indicate that they made less contribution on performance. The “Sig.” column of
the same table shows, whether this variable is making a statistically significant
unique contribution. The decision rule is that if the “Sig.” value is less than .05,
then the variable is making a statistically significant unique contribution on the
dependent variable (Performance). Therefore, items 4, 5, 8, 9, and 10 made a
statistically significant unique contribution on performances of the three
Universities combined as a whole.
A further analysis was also done on each of the three Universities to check
the significant contribution of the elements of organizational culture in predicting
performance. The analysis below is a multiple regression analysis on Covenant
University:
Olanrewaju Samson Ibidunni & Agboola Gbenga Mayowa - Predicting Performance …
76
Key:
i1A: Unity in Diversity; Item 5: Quality Consciousness Item 9: Role Clarity
Item 2:Creativity - Adaptability; Item 6: Collaboration Item 10: Employee Concern
i3A: Culture nurturing Item 7: Open Communication
Item 4: Customer Care Item 8: Code of Conduct
Table 3a: Model Summary for Covenant University (CU)
Model R R Square
Adjusted R
Square
Std. Error of
the Estimate
1 .693(a) .480 .403 .40667
Table 3b: ANOVA for Covenant University (CU)
Model
Sum of
Squares df Mean Square F Sig.
1 Regression 10.368 10 1.037 6.269 .000(a)
Residual 11.246 68 .165
Total 21.614 78
Table 3c: Coefficients for Covenant University (CU)
Model
Unstandardized
Coefficients
Standardized
Coefficients t Sig.
Collinearity
Statistics
B
Std.
Error Beta Tolerance VIF B
Std.
Error
1 (Constant) 3.225 .467 6.909 .000
i1A .036 .069 .051 .524 .602 .797 1.255
Responses to
Item 2 .159 .061 .297 2.597 .012 .585 1.710
i3A -.013 .089 -.017 -.148 .883 .590 1.694
Responses to Item 4
.217 .066 .391 3.295 .002 .544 1.838
Responses to
Item 5 -.012 .051 -.028 -.238 .813 .559 1.790
Responses to
Item 6 .009 .063 .016 .146 .884 .657 1.522
Responses to Item 7
.015 .050 .034 .301 .765 .584 1.713
Responses to
Item 8 -.142 .050 -.283 -2.825 .006 .765 1.307
Responses to
Item 9 -.087 .059 -.168 -1.486 .142 .600 1.667
Responses to
Item 10 -.024 .057 -.050 -.422 .674 .538 1.858
77
Table 3d: Multiple Regression Analysis for Covenant University (CU)
Performance i1A
Responses
to Item 2 i3A
Responses
to Item 4
Responses
to Item 5
Responses
to Item 6
Responses
to Item 7
Responses
to Item 8
Responses
to Item 9
Responses
to Item 10
Pearson
Correlation
Performance 1.000 -.020 .484 .362 .471 -.297 -.316 .329 -.372 -.324 .300
i1A -.020 1.000 .164 .068 -.222 -.215 -.051 .099 .161 -.072 .153
Responses to Item 2 .484 .164 1.000 .389 .314 -.472 -.284 .424 -.063 -.272 .482
i3A .362 .068 .389 1.000 .464 -.267 -.190 .239 -.281 -.035 .395
Responses to Item 4 .471 -.222 .314 .464 1.000 -.057 -.297 .253 -.095 .029 .427
Responses to Item 5 -.297 -.215 -.472 -.267 -.057 1.000 .395 -.301 .100 .484 -.260
Responses to Item 6 -.316 -.051 -.284 -.190 -.297 .395 1.000 -.385 .211 .326 -.136
Responses to Item 7 .329 .099 .424 .239 .253 -.301 -.385 1.000 -.075 -.413 .488
Responses to Item 8 -.372 .161 -.063 -.281 -.095 .100 .211 -.075 1.000 .249 .049
Responses to Item 9 -.324 -.072 -.272 -.035 .029 .484 .326 -.413 .249 1.000 -.185
Responses to Item 10 .300 .153 .482 .395 .427 -.260 -.136 .488 .049 -.185 1.000
Sig. (1-
tailed)
Performance . .428 .000 .000 .000 .004 .002 .001 .000 .002 .003
i1A .428 . .072 .271 .024 .027 .326 .187 .074 .261 .086
Responses to Item 2 .000 .072 . .000 .002 .000 .005 .000 .287 .007 .000
i3A .000 .271 .000 . .000 .008 .044 .015 .005 .378 .000
Responses to Item 4 .000 .024 .002 .000 . .308 .004 .012 .200 .398 .000
Responses to Item 5 .004 .027 .000 .008 .308 . .000 .003 .187 .000 .009
Responses to Item 6 .002 .326 .005 .044 .004 .000 . .000 .029 .001 .111
Responses to Item 7 .001 .187 .000 .015 .012 .003 .000 . .251 .000 .000
Responses to Item 8 .000 .074 .287 .005 .200 .187 .029 .251 . .012 .330
Responses to Item 9 .002 .261 .007 .378 .398 .000 .001 .000 .012 . .048
Responses to Item 10 .003 .086 .000 .000 .000 .009 .111 .000 .330 .048 .
N Performance 82 82 81 82 80 81 82 82 82 82 82
i1A 82 82 81 82 80 81 82 82 82 82 82
Responses to Item 2 81 81 81 81 79 80 81 81 81 81 81
i3A 82 82 81 82 80 81 82 82 82 82 82
Responses to Item 4 80 80 79 80 80 79 80 80 80 80 80
Responses to Item 5 81 81 80 81 79 81 81 81 81 81 81
Responses to Item 6 82 82 81 82 80 81 82 82 82 82 82
Responses to Item 7 82 82 81 82 80 81 82 82 82 82 82
Responses to Item 8 82 82 81 82 80 81 82 82 82 82 82
Responses to Item 9 82 82 81 82 80 81 82 82 82 82 82
Responses to Item 10 82 82 81 82 80 81 82 82 82 82 82
78
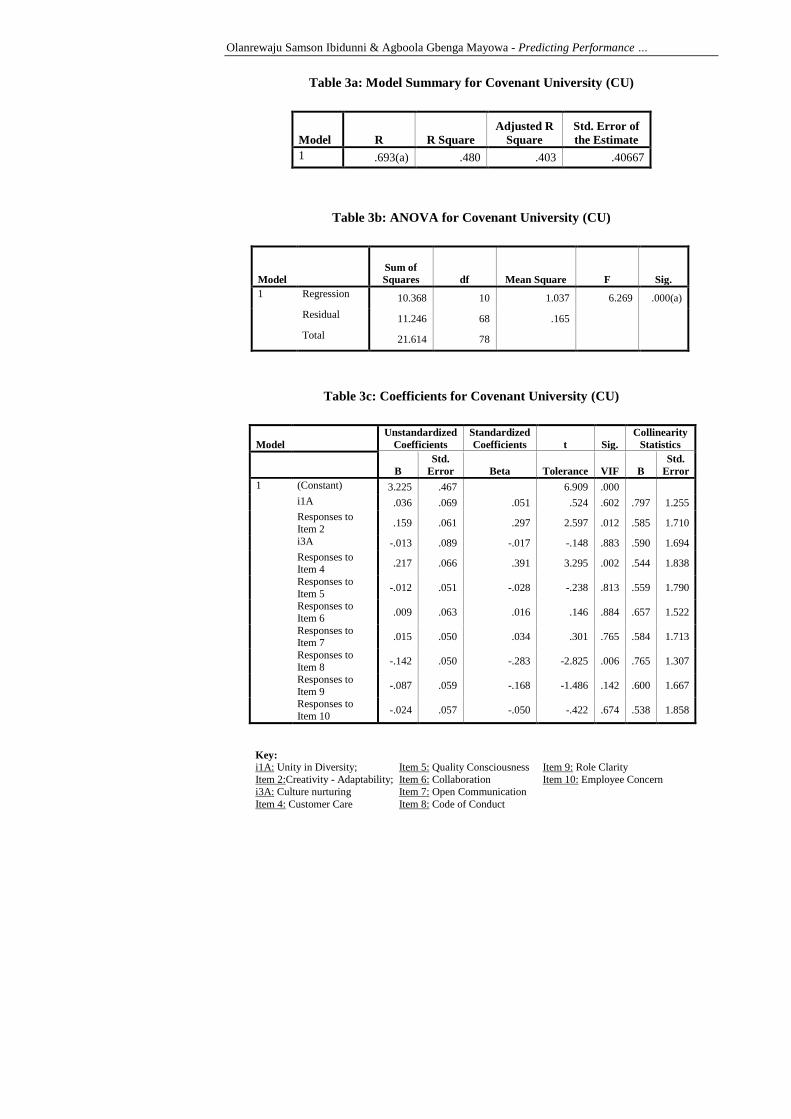
The tables above are the result from multiple regression analysis of the
contribution of the cultural elements on performance for Covenant University. In
the correlation table (Table 3d), the column showing i1A, responses to item 2, i3A,
and responses item 4 to responses to item 10, represent each of the cultural element
analyzed for Covenant University. From the analysis in table 4.13, items 2, i3A, 4,
6, 7, 8, 9 and 10, have moderately strong correlations with the dependent variable
(Performance), which is equal to and above “.300”. Also, the correlation among
each of the independent variables is not too high; therefore, we retain all the
independent variables for further analysis.
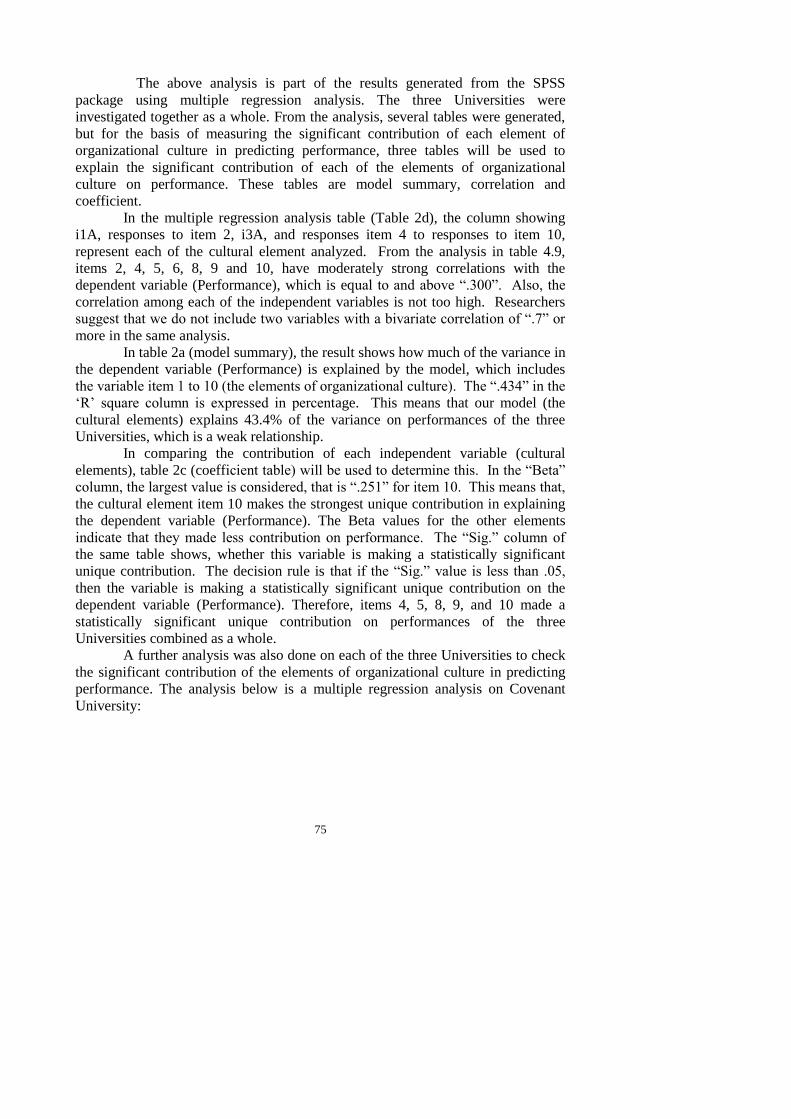
In table 3a (model summary), the result shows “.480” in the ‘R’ square
column, which means that our model (the cultural elements) explains 48.0% of the
variance on performances of Covenant University, meaning it is a weak
relationship.
In the “Beta” column of table 3c (coefficient table), the largest value is
considered, that is “.391” for item 4. This means that, the cultural element item 4
makes the strongest unique contribution on the dependent variable (Performance).
The Beta values for the other elements indicate that they made less contribution on
performance. The “Sig.” column of the same table 4.12 reflects that items 2, 4, and
8, made a statistically significant unique contribution on performances of Covenant
University.
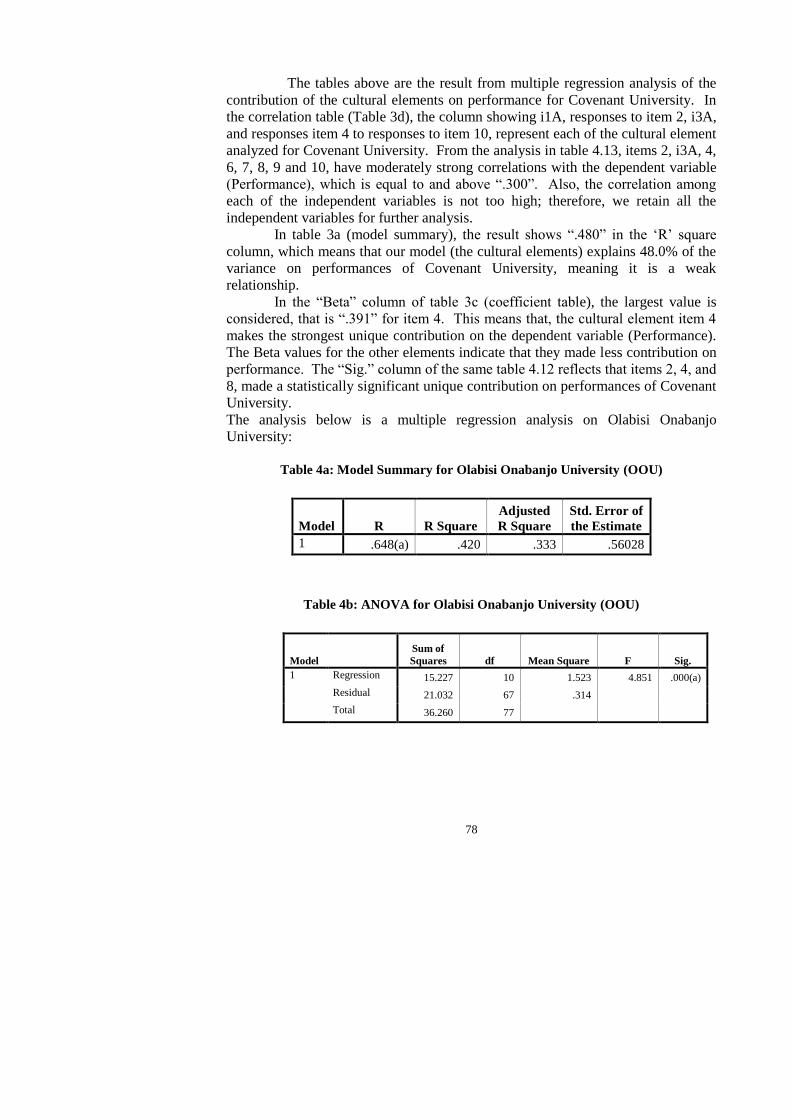
The analysis below is a multiple regression analysis on Olabisi Onabanjo
University:
Table 4a: Model Summary for Olabisi Onabanjo University (OOU)
Model R R Square
Adjusted
R Square
Std. Error of
the Estimate
1 .648(a) .420 .333 .56028
Table 4b: ANOVA for Olabisi Onabanjo University (OOU)
Model
Sum of
Squares df Mean Square F Sig.
1 Regression 15.227 10 1.523 4.851 .000(a)
Residual 21.032 67 .314
Total 36.260 77
The Public Administration and Social Policies Review VII, 1(14) / June 2015
79
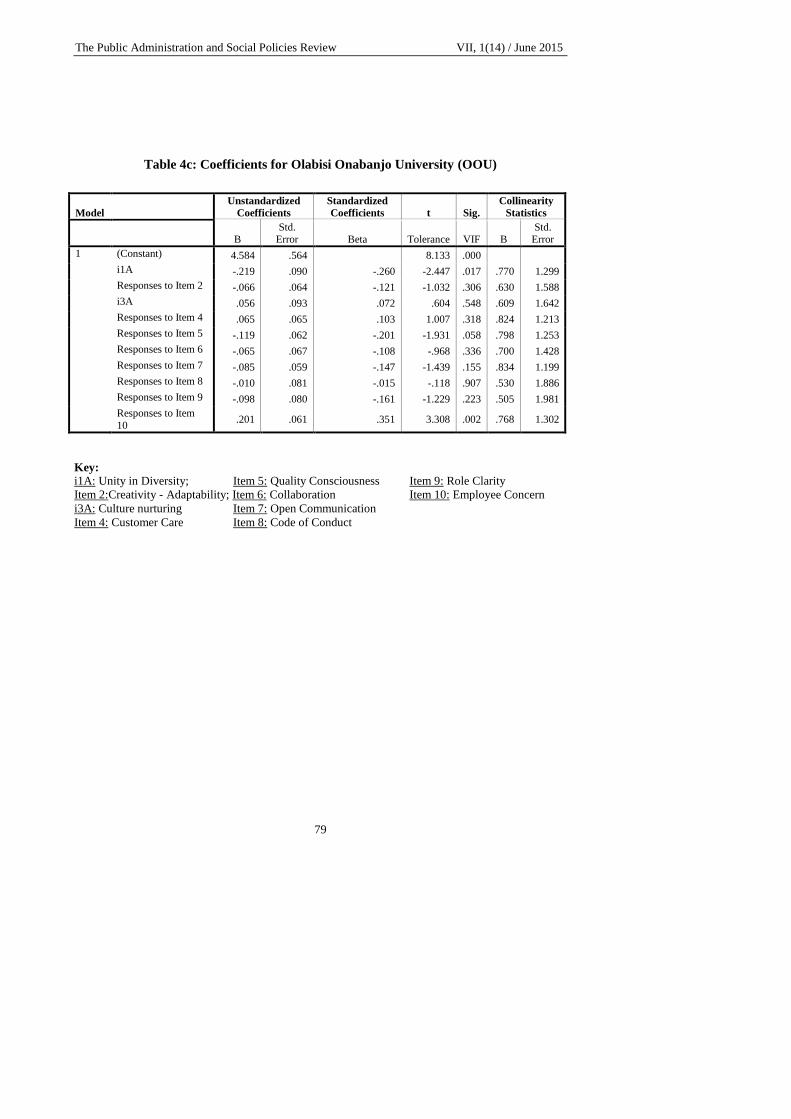
Table 4c: Coefficients for Olabisi Onabanjo University (OOU)
Model
Unstandardized
Coefficients
Standardized
Coefficients t Sig.
Collinearity
Statistics
B Std.
Error Beta Tolerance VIF B Std.
Error
1 (Constant) 4.584 .564 8.133 .000
i1A -.219 .090 -.260 -2.447 .017 .770 1.299
Responses to Item 2 -.066 .064 -.121 -1.032 .306 .630 1.588
i3A .056 .093 .072 .604 .548 .609 1.642
Responses to Item 4 .065 .065 .103 1.007 .318 .824 1.213
Responses to Item 5 -.119 .062 -.201 -1.931 .058 .798 1.253
Responses to Item 6 -.065 .067 -.108 -.968 .336 .700 1.428
Responses to Item 7 -.085 .059 -.147 -1.439 .155 .834 1.199
Responses to Item 8 -.010 .081 -.015 -.118 .907 .530 1.886
Responses to Item 9 -.098 .080 -.161 -1.229 .223 .505 1.981
Responses to Item
10 .201 .061 .351 3.308 .002 .768 1.302
Key:
i1A: Unity in Diversity; Item 5: Quality Consciousness Item 9: Role Clarity
Item 2:Creativity - Adaptability; Item 6: Collaboration Item 10: Employee Concern
i3A: Culture nurturing Item 7: Open Communication
Item 4: Customer Care Item 8: Code of Conduct
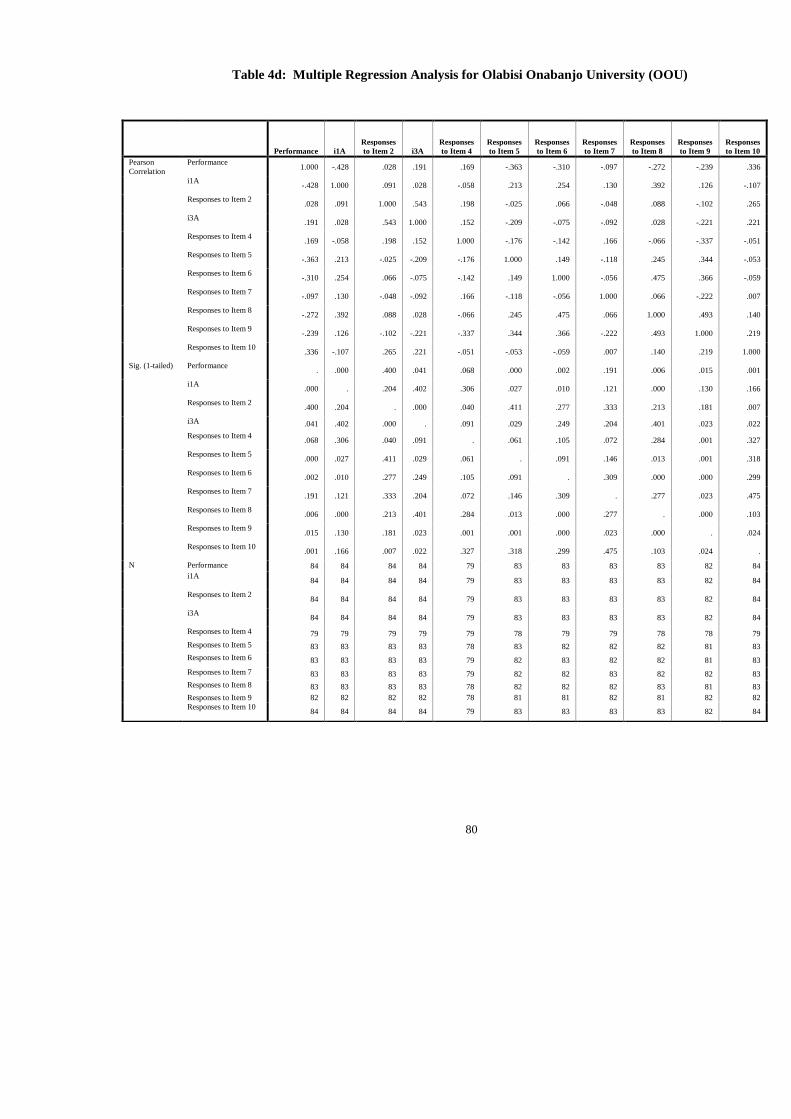
80
Table 4d: Multiple Regression Analysis for Olabisi Onabanjo University (OOU)
Performance i1A
Responses
to Item 2 i3A
Responses
to Item 4
Responses
to Item 5
Responses
to Item 6
Responses
to Item 7
Responses
to Item 8
Responses
to Item 9
Responses
to Item 10
Pearson
Correlation
Performance 1.000 -.428 .028 .191 .169 -.363 -.310 -.097 -.272 -.239 .336
i1A -.428 1.000 .091 .028 -.058 .213 .254 .130 .392 .126 -.107
Responses to Item 2 .028 .091 1.000 .543 .198 -.025 .066 -.048 .088 -.102 .265
i3A .191 .028 .543 1.000 .152 -.209 -.075 -.092 .028 -.221 .221
Responses to Item 4 .169 -.058 .198 .152 1.000 -.176 -.142 .166 -.066 -.337 -.051
Responses to Item 5 -.363 .213 -.025 -.209 -.176 1.000 .149 -.118 .245 .344 -.053
Responses to Item 6 -.310 .254 .066 -.075 -.142 .149 1.000 -.056 .475 .366 -.059
Responses to Item 7 -.097 .130 -.048 -.092 .166 -.118 -.056 1.000 .066 -.222 .007
Responses to Item 8 -.272 .392 .088 .028 -.066 .245 .475 .066 1.000 .493 .140
Responses to Item 9 -.239 .126 -.102 -.221 -.337 .344 .366 -.222 .493 1.000 .219
Responses to Item 10 .336 -.107 .265 .221 -.051 -.053 -.059 .007 .140 .219 1.000
Sig. (1-tailed) Performance . .000 .400 .041 .068 .000 .002 .191 .006 .015 .001
i1A .000 . .204 .402 .306 .027 .010 .121 .000 .130 .166
Responses to Item 2 .400 .204 . .000 .040 .411 .277 .333 .213 .181 .007
i3A .041 .402 .000 . .091 .029 .249 .204 .401 .023 .022
Responses to Item 4 .068 .306 .040 .091 . .061 .105 .072 .284 .001 .327
Responses to Item 5 .000 .027 .411 .029 .061 . .091 .146 .013 .001 .318
Responses to Item 6 .002 .010 .277 .249 .105 .091 . .309 .000 .000 .299
Responses to Item 7 .191 .121 .333 .204 .072 .146 .309 . .277 .023 .475
Responses to Item 8 .006 .000 .213 .401 .284 .013 .000 .277 . .000 .103
Responses to Item 9 .015 .130 .181 .023 .001 .001 .000 .023 .000 . .024
Responses to Item 10 .001 .166 .007 .022 .327 .318 .299 .475 .103 .024 .
N Performance 84 84 84 84 79 83 83 83 83 82 84
i1A 84 84 84 84 79 83 83 83 83 82 84
Responses to Item 2 84 84 84 84 79 83 83 83 83 82 84
i3A 84 84 84 84 79 83 83 83 83 82 84
Responses to Item 4 79 79 79 79 79 78 79 79 78 78 79
Responses to Item 5 83 83 83 83 78 83 82 82 82 81 83
Responses to Item 6 83 83 83 83 79 82 83 82 82 81 83
Responses to Item 7 83 83 83 83 79 82 82 83 82 82 83
Responses to Item 8 83 83 83 83 78 82 82 82 83 81 83
Responses to Item 9 82 82 82 82 78 81 81 82 81 82 82
Responses to Item 10 84 84 84 84 79 83 83 83 83 82 84
81
From the analysis above, the contribution of the cultural elements on
performance for Olabisi Onabanjo University (OOU) as reflected in the correlation
table (Table 4.17) shows that items i1A, 5, 6, and 10, have moderately strong
correlations with the dependent variable (Performance), which is equal to and
above “.300”. Also, the correlation among each of the independent variables is
also not too high; therefore, we retain all the independent variables for further
analysis.
In table 4.14 (model summary), the result shows “.420” in the ‘R’ square
column, which means that our model (the cultural elements) explains 42.0% of the
variance on performances of Olabisi Onabanjo University reflecting a weak
relationship.
In the “Beta” column of table 4.16 (coefficient table), the largest value is
considered, that is “.351” for item 10 meaning that, the cultural element item 10
makes the strongest unique contribution on the dependent variable (Performance).
The Beta values for the other elements indicate that they made less contribution on
performance. The “Sig.” column of the same table 4.12 reflects that items 1, and
10, made a statistically significant unique contribution on performances of
Covenant University.
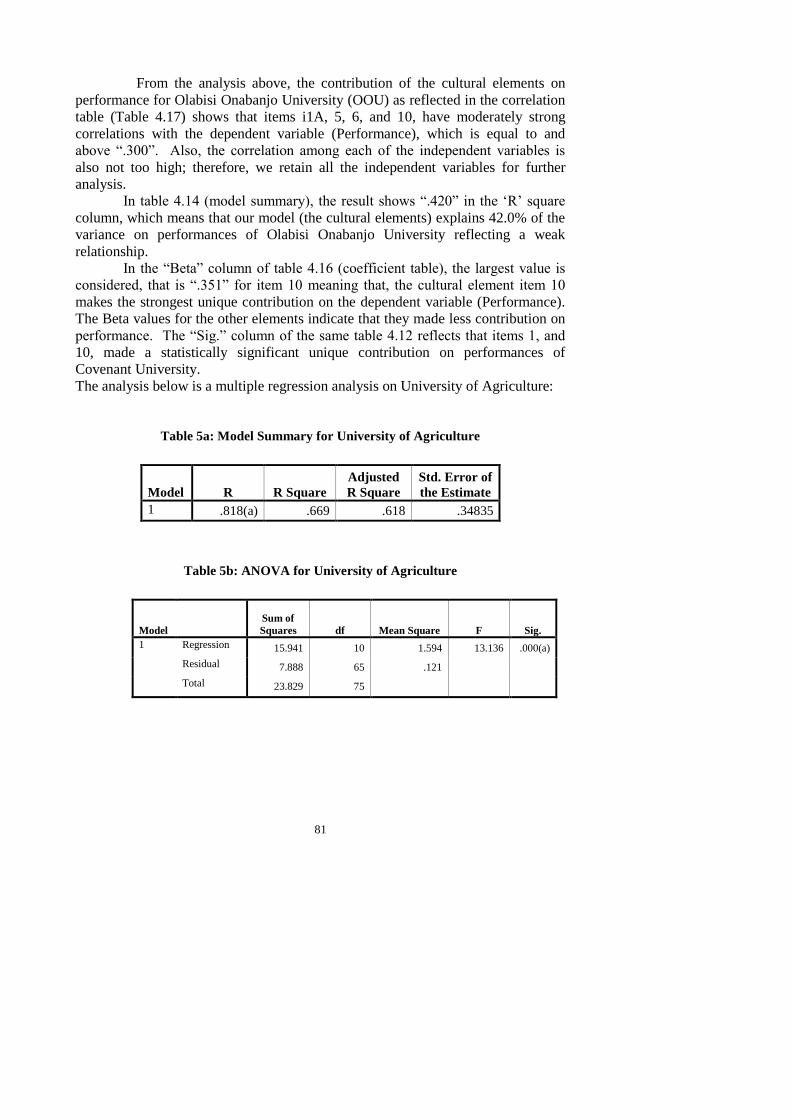
The analysis below is a multiple regression analysis on University of Agriculture:
Table 5a: Model Summary for University of Agriculture
Model R R Square
Adjusted
R Square
Std. Error of
the Estimate
1 .818(a) .669 .618 .34835
Table 5b: ANOVA for University of Agriculture
Model
Sum of
Squares df Mean Square F Sig.
1 Regression 15.941 10 1.594 13.136 .000(a)
Residual 7.888 65 .121
Total 23.829 75
Olanrewaju Samson Ibidunni & Agboola Gbenga Mayowa - Predicting Performance …
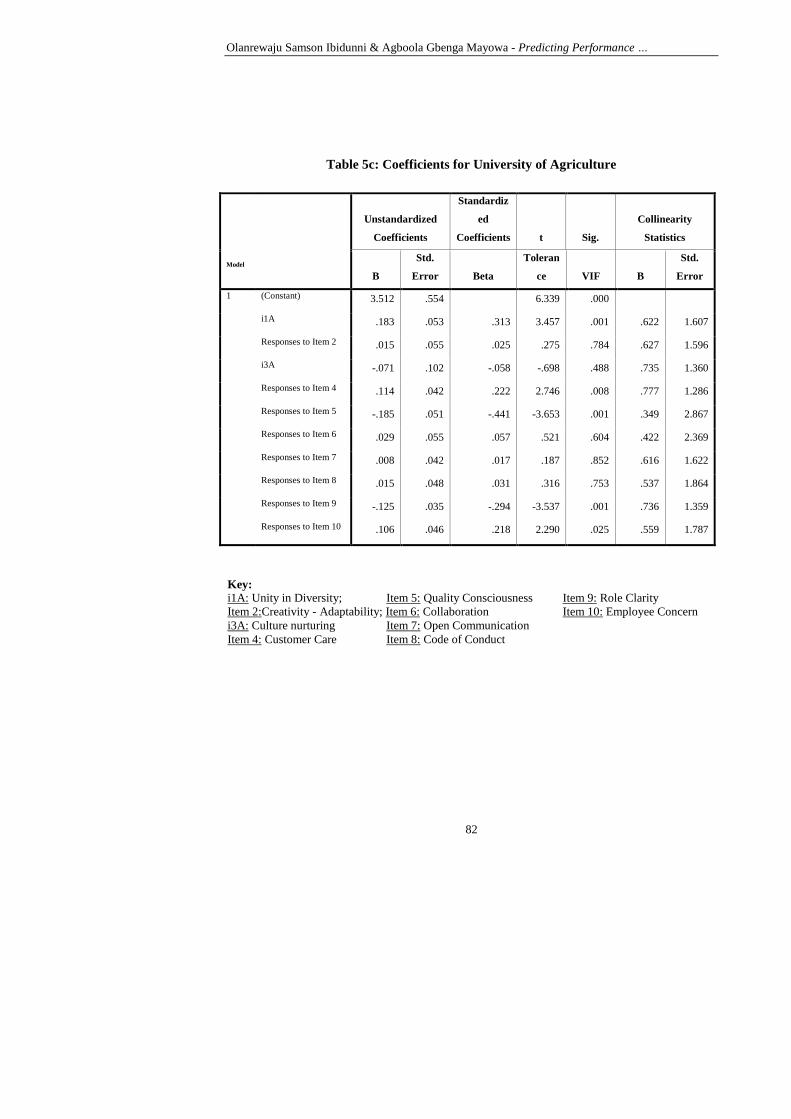
82
Table 5c: Coefficients for University of Agriculture
Model
Unstandardized
Coefficients
Standardiz
ed
Coefficients t Sig.
Collinearity
Statistics
B
Std.
Error Beta
Toleran
ce VIF B
Std.
Error
1 (Constant) 3.512 .554 6.339 .000
i1A .183 .053 .313 3.457 .001 .622 1.607
Responses to Item 2 .015 .055 .025 .275 .784 .627 1.596
i3A -.071 .102 -.058 -.698 .488 .735 1.360
Responses to Item 4 .114 .042 .222 2.746 .008 .777 1.286
Responses to Item 5 -.185 .051 -.441 -3.653 .001 .349 2.867
Responses to Item 6 .029 .055 .057 .521 .604 .422 2.369
Responses to Item 7 .008 .042 .017 .187 .852 .616 1.622
Responses to Item 8 .015 .048 .031 .316 .753 .537 1.864
Responses to Item 9 -.125 .035 -.294 -3.537 .001 .736 1.359
Responses to Item 10 .106 .046 .218 2.290 .025 .559 1.787
Key:
i1A: Unity in Diversity; Item 5: Quality Consciousness Item 9: Role Clarity
Item 2:Creativity - Adaptability; Item 6: Collaboration Item 10: Employee Concern
i3A: Culture nurturing Item 7: Open Communication
Item 4: Customer Care Item 8: Code of Conduct
83
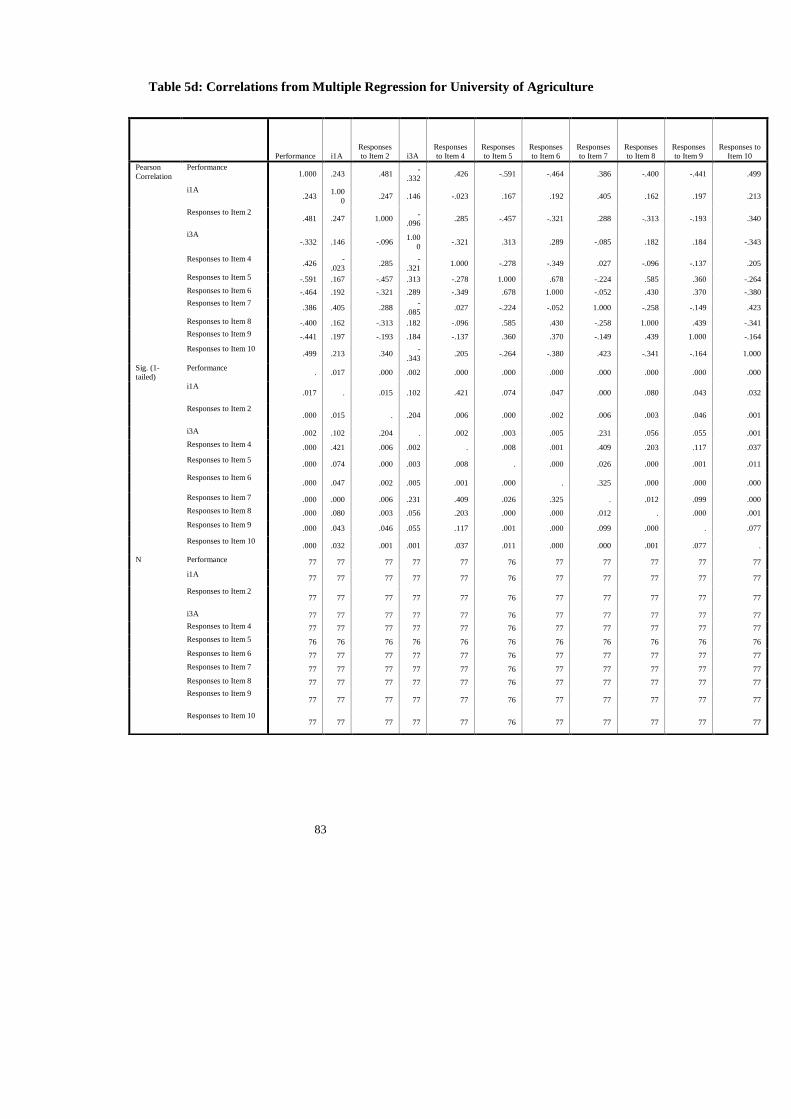
Table 5d: Correlations from Multiple Regression for University of Agriculture
Performance i1A
Responses
to Item 2 i3A
Responses
to Item 4
Responses
to Item 5
Responses
to Item 6
Responses
to Item 7
Responses
to Item 8
Responses
to Item 9
Responses to
Item 10
Pearson
Correlation
Performance 1.000 .243 .481
-
.332 .426 -.591 -.464 .386 -.400 -.441 .499
i1A .243
1.00
0 .247 .146 -.023 .167 .192 .405 .162 .197 .213
Responses to Item 2 .481 .247 1.000
-
.096 .285 -.457 -.321 .288 -.313 -.193 .340
i3A -.332 .146 -.096
1.00
0 -.321 .313 .289 -.085 .182 .184 -.343
Responses to Item 4 .426
-
.023 .285
-
.321 1.000 -.278 -.349 .027 -.096 -.137 .205
Responses to Item 5 -.591 .167 -.457 .313 -.278 1.000 .678 -.224 .585 .360 -.264
Responses to Item 6 -.464 .192 -.321 .289 -.349 .678 1.000 -.052 .430 .370 -.380
Responses to Item 7 .386 .405 .288
-
.085 .027 -.224 -.052 1.000 -.258 -.149 .423
Responses to Item 8 -.400 .162 -.313 .182 -.096 .585 .430 -.258 1.000 .439 -.341
Responses to Item 9 -.441 .197 -.193 .184 -.137 .360 .370 -.149 .439 1.000 -.164
Responses to Item 10 .499 .213 .340
-
.343 .205 -.264 -.380 .423 -.341 -.164 1.000
Sig. (1-
tailed)
Performance . .017 .000 .002 .000 .000 .000 .000 .000 .000 .000
i1A .017 . .015 .102 .421 .074 .047 .000 .080 .043 .032
Responses to Item 2 .000 .015 . .204 .006 .000 .002 .006 .003 .046 .001
i3A .002 .102 .204 . .002 .003 .005 .231 .056 .055 .001
Responses to Item 4 .000 .421 .006 .002 . .008 .001 .409 .203 .117 .037
Responses to Item 5 .000 .074 .000 .003 .008 . .000 .026 .000 .001 .011
Responses to Item 6 .000 .047 .002 .005 .001 .000 . .325 .000 .000 .000
Responses to Item 7 .000 .000 .006 .231 .409 .026 .325 . .012 .099 .000
Responses to Item 8 .000 .080 .003 .056 .203 .000 .000 .012 . .000 .001
Responses to Item 9 .000 .043 .046 .055 .117 .001 .000 .099 .000 . .077
Responses to Item 10 .000 .032 .001 .001 .037 .011 .000 .000 .001 .077 .
N Performance 77 77 77 77 77 76 77 77 77 77 77
i1A 77 77 77 77 77 76 77 77 77 77 77
Responses to Item 2 77 77 77 77 77 76 77 77 77 77 77
i3A 77 77 77 77 77 76 77 77 77 77 77
Responses to Item 4 77 77 77 77 77 76 77 77 77 77 77
Responses to Item 5 76 76 76 76 76 76 76 76 76 76 76
Responses to Item 6 77 77 77 77 77 76 77 77 77 77 77
Responses to Item 7 77 77 77 77 77 76 77 77 77 77 77
Responses to Item 8 77 77 77 77 77 76 77 77 77 77 77
Responses to Item 9 77 77 77 77 77 76 77 77 77 77 77
Responses to Item 10 77 77 77 77 77 76 77 77 77 77 77
84
From the analysis above for University of Agriculture (UNAAB), the
correlation table (Table 4.21) shows that items 2, i3A, 4, 5, 6, 7, 8, 9, and 10, have
moderately strong correlations with the dependent variable (Performance), which is
equal to and above “.300”. Also, the correlation among each of the independent
variables is also not too high; therefore, we retain all the independent variables for
further analysis.
In table 4.18 (model summary), the result shows “.669” in the ‘R’ square
column, which means that the model (the cultural elements) explains 66.9% of the
variances on performances of University of Agriculture revealing a strong
relationship.
In the “Beta” column of table 4.20 (coefficient table), the largest value is
considered, that is “- .441” (ignoring the negative sign) for item 5 meaning that, the
cultural element item 5 makes the strongest unique contribution on the dependent
variable (Performance). The Beta values for the other elements indicate that they
made less contribution on performance. The “Sig.” column of the same table 4.20
reflects that items 1, 4, 5, 9, and 10, made a statistically significant unique
contribution on performances of University of Agriculture.
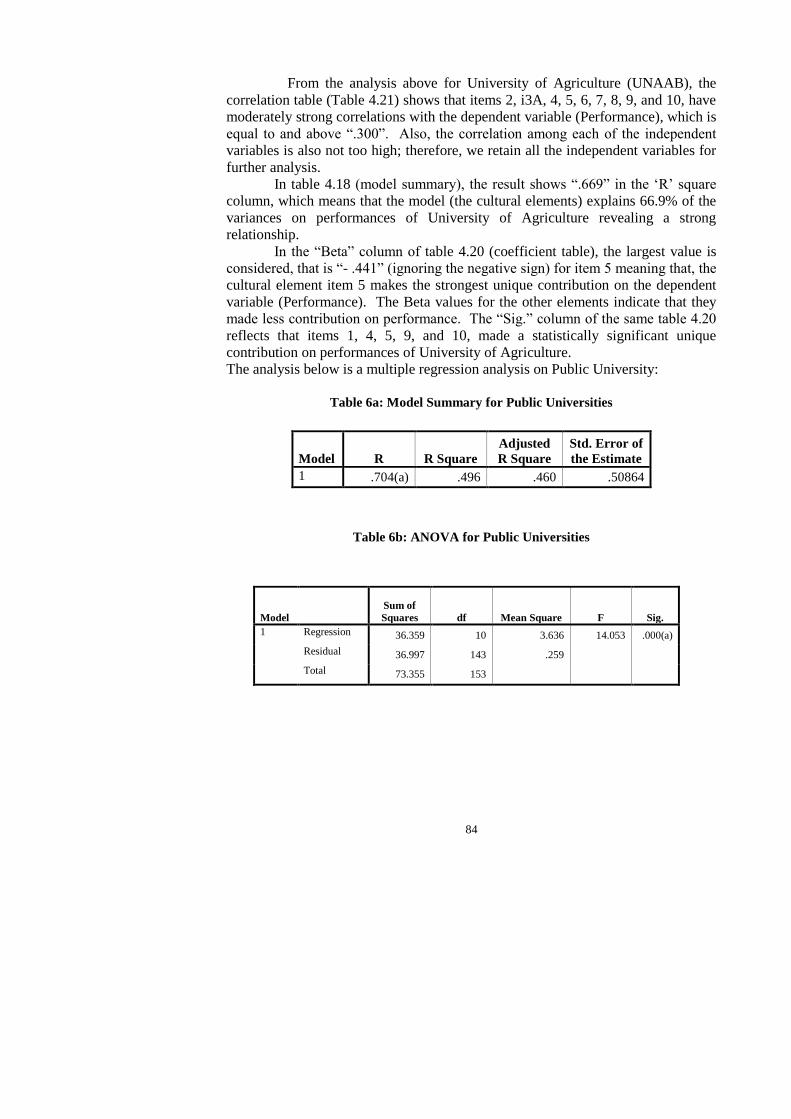
The analysis below is a multiple regression analysis on Public University:
Table 6a: Model Summary for Public Universities
Model R R Square
Adjusted
R Square
Std. Error of
the Estimate
1 .704(a) .496 .460 .50864
Table 6b: ANOVA for Public Universities
Model
Sum of
Squares df Mean Square F Sig.
1 Regression 36.359 10 3.636 14.053 .000(a)
Residual 36.997 143 .259
Total 73.355 153
The Public Administration and Social Policies Review VII, 1(14) / June 2015
85
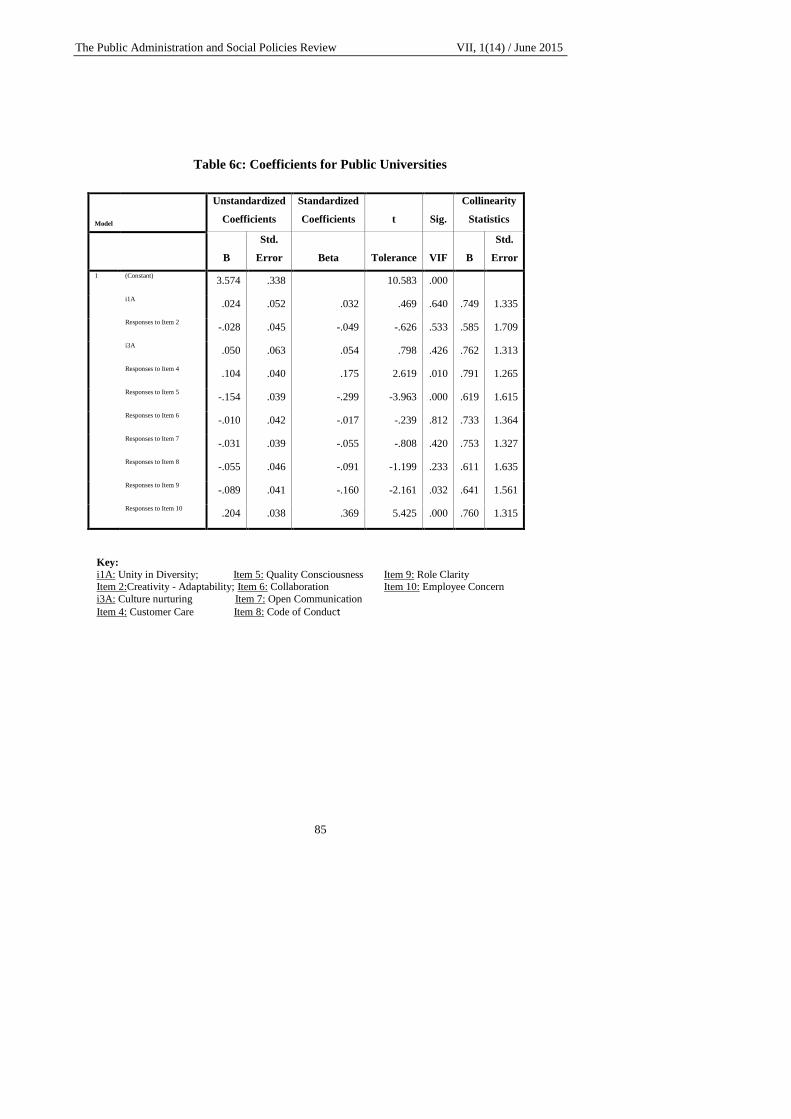
Table 6c: Coefficients for Public Universities
Model
Unstandardized
Coefficients
Standardized
Coefficients t Sig.
Collinearity
Statistics
B
Std.
Error Beta Tolerance VIF B
Std.
Error
1 (Constant) 3.574 .338 10.583 .000
i1A .024 .052 .032 .469 .640 .749 1.335
Responses to Item 2 -.028 .045 -.049 -.626 .533 .585 1.709
i3A .050 .063 .054 .798 .426 .762 1.313
Responses to Item 4 .104 .040 .175 2.619 .010 .791 1.265
Responses to Item 5 -.154 .039 -.299 -3.963 .000 .619 1.615
Responses to Item 6 -.010 .042 -.017 -.239 .812 .733 1.364
Responses to Item 7 -.031 .039 -.055 -.808 .420 .753 1.327
Responses to Item 8 -.055 .046 -.091 -1.199 .233 .611 1.635
Responses to Item 9 -.089 .041 -.160 -2.161 .032 .641 1.561
Responses to Item 10 .204 .038 .369 5.425 .000 .760 1.315
Key:
i1A: Unity in Diversity; Item 5: Quality Consciousness Item 9: Role Clarity Item 2:Creativity - Adaptability; Item 6: Collaboration Item 10: Employee Concern
i3A: Culture nurturing Item 7: Open Communication
Item 4: Customer Care Item 8: Code of Conduct
86
Table 6d: Correlations from Multiple Regression Analysis for Public Universities
Performance i1A
Responses
to Item 2 i3A
Responses
to Item 4
Responses
to Item 5
Responses
to Item 6
Responses
to Item 7
Responses
to Item 8
Responses
to Item 9
Responses
to Item 10
Pearson
Correlation
Performance 1.000 .014 .324 .172 .388 -.547 -.278 .196 -.385 -.381 .488
i1A .014 1.000 .243 .144 .057 .069 .248 .319 .191 .104 .142
Responses to Item 2 .324 .243 1.000 .451 .343 -.327 -.025 .170 -.162 -.208 .388
i3A .172 .144 .451 1.000 .113 -.137 .086 -.005 -.004 -.131 .147
Responses to Item 4 .388 .057 .343 .113 1.000 -.334 -.182 .171 -.157 -.285 .185
Responses to Item 5 -.547 .069 -.327 -.137 -.334 1.000 .338 -.240 .475 .401 -.270
Responses to Item 6 -.278 .248 -.025 .086 -.182 .338 1.000 -.019 .400 .329 -.148
Responses to Item 7 .196 .319 .170 -.005 .171 -.240 -.019 1.000 -.148 -.220 .267
Responses to Item 8 -.385 .191 -.162 -.004 -.157 .475 .400 -.148 1.000 .489 -.166
Responses to Item 9 -.381 .104 -.208 -.131 -.285 .401 .329 -.220 .489 1.000 -.054
Responses to Item 10 .488 .142 .388 .147 .185 -.270 -.148 .267 -.166 -.054 1.000
Sig. (1-tailed) Performance . .430 .000 .014 .000 .000 .000 .006 .000 .000 .000
i1A .430 . .001 .034 .239 .194 .001 .000 .008 .095 .037
Responses to Item 2 .000 .001 . .000 .000 .000 .375 .016 .021 .004 .000
i3A .014 .034 .000 . .080 .042 .141 .475 .478 .050 .031
Responses to Item 4 .000 .239 .000 .080 . .000 .011 .016 .025 .000 .011
Responses to Item 5 .000 .194 .000 .042 .000 . .000 .001 .000 .000 .000
Responses to Item 6 .000 .001 .375 .141 .011 .000 . .404 .000 .000 .031
Responses to Item 7 .006 .000 .016 .475 .016 .001 .404 . .032 .003 .000
Responses to Item 8 .000 .008 .021 .478 .025 .000 .000 .032 . .000 .018
Responses to Item 9 .000 .095 .004 .050 .000 .000 .000 .003 .000 . .251
Responses to Item 10 .000 .037 .000 .031 .011 .000 .031 .000 .018 .251 .
N Performance 161 161 161 161 156 159 160 160 160 159 161
i1A 161 161 161 161 156 159 160 160 160 159 161
Responses to Item 2 161 161 161 161 156 159 160 160 160 159 161
i3A 161 161 161 161 156 159 160 160 160 159 161
Responses to Item 4 156 156 156 156 156 154 156 156 155 155 156
Responses to Item 5 159 159 159 159 154 159 158 158 158 157 159
Responses to Item 6 160 160 160 160 156 158 160 159 159 158 160
Responses to Item 7 160 160 160 160 156 158 159 160 159 159 160
Responses to Item 8 160 160 160 160 155 158 159 159 160 158 160
Responses to Item 9 159 159 159 159 155 157 158 159 158 159 159
Responses to Item 10 161 161 161 161 156 159 160 160 160 159 161
87
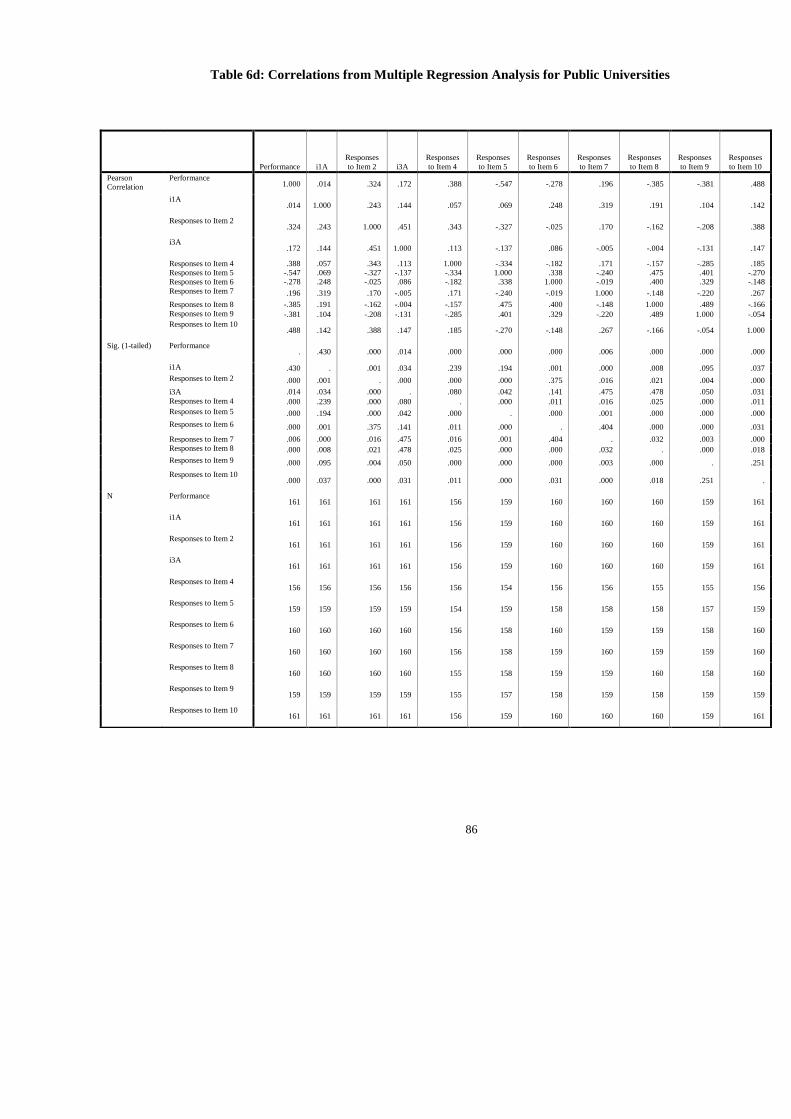
From the analysis above for Public Universities, the multiple regression
analysis table (Table 6d) shows that items 2, 4, 5, 8, 9 and 10, have moderately
strong correlations with the dependent variable (Performance), which is equal to
and above “.300”. Also, the correlation among each of the independent variables is
also not too high; therefore, we retain all the independent variables for further
analysis.
In table 6a (model summary), the result shows “.496” in the ‘R’ square
column, which means that the model (the cultural elements) explains 49.6% of the
variances on performances of Public Universities revealing a moderate
relationship.
In the “Beta” column of table 6c (coefficient table), the largest value is
“.369” for item 10 meaning that, the cultural element item 10 makes the strongest
unique contribution on the dependent variable (Performance). The Beta values for
the other elements indicate that they made less contribution on performance. The
“Sig.” column of the same table 4.24 reflects that items 4, 5, 9, and 10, made a
statistically significant unique contribution on performances of Public Universities.
Based on the above analysis therefore, we shall reject the null hypothesis
(H0) stating that “there is no significant contribution of elements of organizational
culture in predicting the performances of Universities” and accept the alternate
hypothesis (H1) stating that “there is significant contribution of organization
cultural elements on performances of Universities.”
Conclusion
Shani et al (2005) concluded that organizational cultures can have a
significant impact on an organization’s long term economic performance;
organizational cultures will probably be an even more important factor in
determining the success of failure of organizations in the next decade;
organizational cultures that inhibit strong long-term financial performance are not
rare, they develop easily, even in organizations that are full of reasonable and
intelligent people, and; although tough to change, organizational cultures can be
made more performance enhancing. A recent perspective of Rollinson (2005)
was firmly part of what is now known as the ‘excellence movement’, which holds
that culture is a key ingredient in the commercial success of an organization.
Because authors list cultural characteristics that are said to lead to this outcome of
success, it is easy to see why the ideas have an instant appeal to managers.
The challenge, however, is that this perspective and others like it imply a
‘one best culture’ suitable for all organizations. Since different organizations face
different circumstances, the most useful approach to the culture-performance
relationship is likely to be a contingency perspective; an assumption that there is no
such thing as a ‘right’ or ‘best’ culture for all organizations. The most appropriate
culture for an organization is the one that best helps it cope with the exigencies of
its business environment.
Many managers have attempted to revamp their business culture, some by
bench marking themselves against their most admired competitors. This offers few
Olanrewaju Samson Ibidunni & Agboola Gbenga Mayowa - Predicting Performance …
88
insights for those attempting a business turnaround and the task is all the more
daunting because culture is not just about ‘how we do things’, but also about ‘what
we do’.
REFERENCES
1. BOLA: Business Open Learning Archive. What is this thing called
organisational culture [online]. Available:
http://sol.brunel.ac.uk/~jarvis/bola/culture/culture.html; cited in Mowat, J.
(2002). Corporate Culture, The Herridge Group.
2. BORGATTI, S. P. Organizational Culture. [online]. Available:
http://www.analytictech.com/mb021/culture1.htm; cited in Mowat, J.
(2002). Corporate Culture, The Herridge Group, 1996.
3. DEWITT, D. J. The Changing Corporate Culture [on-line]. Available:
http://www.informanet.com/corpculture.htm; cited in Mowat, J. (2002).
Corporate Culture, The Herridge Group, 2001.
4. GOLL, I., & Zeitz, G., “Conceptualizing and measuring corporate
ideology. Organization Studies”, 12, 191-207; cited in Delobbe, N.,
Haccoun, R. R. and Vandenberghe, C. Measuring Core Dimensions of
Organizational Culture: A Review of Research and Development of a New
Instrument, 1991.
5. GUNDRY, L.K., & Rousseau, D.M., “Critical incidents in communicating
culture to newcomers: The meaning is the message” Human Relations, 47,
1063-1088; cited in Delobbe, N., Haccoun, R. R. and Vandenberghe, C.
Measuring Core Dimensions of Organizational Culture: A Review of
Research and Development of a New Instrument, 1994.
6. HAGBERG, R. and Heifetz, J. “Corporate Culture /Organizational Culture:
Understanding and Assessment”. [online]. Available:
http://www.hcgnet.com/html/articles/understanding-Culture/html; cited in
Mowat, J. (2002). Corporate Culture, The Herridge Group, 2000.
7. HATCH, M. J. “The Dynamics Of Organizational Culture”, Academy Of
Management Review, 18,Pp.657-693; cited in Koteswara, P. K.,
Srinivasan, P. T. and George J.P. (2002). A study on Development of a
Tool to Assess Organizational Culture in Indian Organizations,
India,1993, Available [online] http://www.google.com
8. KOBERG, C.S., & Chusmir, L.H., “Organizational culture relationships
with creativity and other job-related variables”. Journal of Business
Research, 15, 397-409; cited in Delobbe, N., Haccoun, R. R. and
Vandenberghe, C. Measuring Core Dimensions of Organizational Culture:
A Review of Research and Development of a New Instrument, 1987.
9. KOTESWARA, P. K., Srinivasan, P. T. and George J.P. A study on
Development of a Tool to Assess Organizational Culture in Indian
Organizations, India, 2002, Available [online] http://www.google.com
The Public Administration and Social Policies Review VII, 1(14) / June 2015
89
10. MCSHANE, S. L. and Von Glinow M. A. Organizational Behaviour,
Boston, McGraw Hill/Irwin, (3rd Edition)
11. MOWAT, J., Corporate Culture, The Herridge Group, 2002,. Retrieved
from www.herridgegroup.com/pdfs/corp_cultures.pdf
12. O'REILLY, C.A., CHATMAN, J., & CALDWELL, D. “People and
organizational culture: A profile comparison approach to assessing person-
organization fit” Academy of Management Journal, 34, 487-516; cited in
Delobbe, N., Haccoun, R. R. and Vandenberghe, C. Measuring Core
Dimensions of Organizational Culture: A Review of Research and
Development of a New Instrument.
13. ROLLINSON, D. Organizational Behaviour and Analysis: An Integrated
Approach, England, Pearson Education, (3rd Edition), 2005.
14. SHANI, A. B. and Lau, J. B. Behaviour in Organizations: An Experiential
Approach, USA, McGraw Hill Irwin, (8th Edition), 2005.