predicting missing expression values in gene regulatory networks
TRANSCRIPT
Predicting missing expression values in generegulatory networks using a discrete logic modelingoptimization guided by network stable statesIsaac Crespo1, Abhimanyu Krishna1, Antony Le Bechec2 and Antonio del Sol1,*
1Luxembourg Centre for Systems Biomedicine (LCSB), University of Luxembourg, L-4362 Esch-Belval and2Life Sciences Research unit (LSRU), University of Luxembourg, L-1511 Luxembourg, Luxembourg
Received May 7, 2012; Revised June 21, 2012; Accepted July 26, 2012
ABSTRACT
The development of new high-throughputtechnologies enables us to measure genome-widetranscription levels, protein abundance, metaboliteconcentration, etc. Nevertheless, these experimen-tal data are often noisy and incomplete, whichhinders data analysis, modeling and prediction.Here, we propose a method to predict expressionvalues of genes involved in stable cellular pheno-types from the expression values of the remaininggenes in a literature-based gene regulatory network.The consistency between predicted and knownstable states from experimental data is used toguide an iterative network pruning that contextual-izes the network to the biological conditions underwhich the expression data were obtained. Using thecontextualized network and the property of networkstability we predict gene expression values missingfrom experimental data. The prediction methodassumes a Boolean model to compute steadystates of networks and an evolutionary algorithmto iteratively prune the networks. The evolutionaryalgorithm samples the probability distribution ofpositive feedback loops or positive circuits and in-dividual interactions within the subpopulation of thebest-pruned networks at each iteration. The result-ing expression inference is based not only onprevious knowledge about local connectivity butalso on a global network property (stability),providing robustness in the predictions.
INTRODUCTION
The wealth of experimental data from high-throughputtechnologies in different areas of biology, and especially
at a transcriptomics level, allows us to incorporate suchdata as networks of interactions. These networks can bereconstructed based on knowledge resources such as lit-erature or specific databases (e.g. KEGG, Reactome,Transfac) or purely from experimental data by inferringinteractions between genes from their co-expressionpatterns (1) or mutual information (2).During the network reconstruction process from litera-
ture, genes and interactions are introduced by an expert orusing algorithms in the attempt to capture the essentialevents to describe a particular biological system.In addition, gene expression values are taken intoaccount in order to perform a network reconstruction.Nevertheless, it is often the case that gene expressionvalues of some genes are missing despite their relevancein gene regulation. Usually, the inference of expressionvalues of these genes based on regulation relationshipsextracted from literature is not correct, since this informa-tion can relate to different biological conditions, such asdifferent cellular types, tissues, pathological or physio-logical states or even organisms. Furthermore, the poten-tial introduction of ‘false’ interactions, even a few of them,could significantly modify predicted gene expressionstates.Here, we propose a method that uses network stability
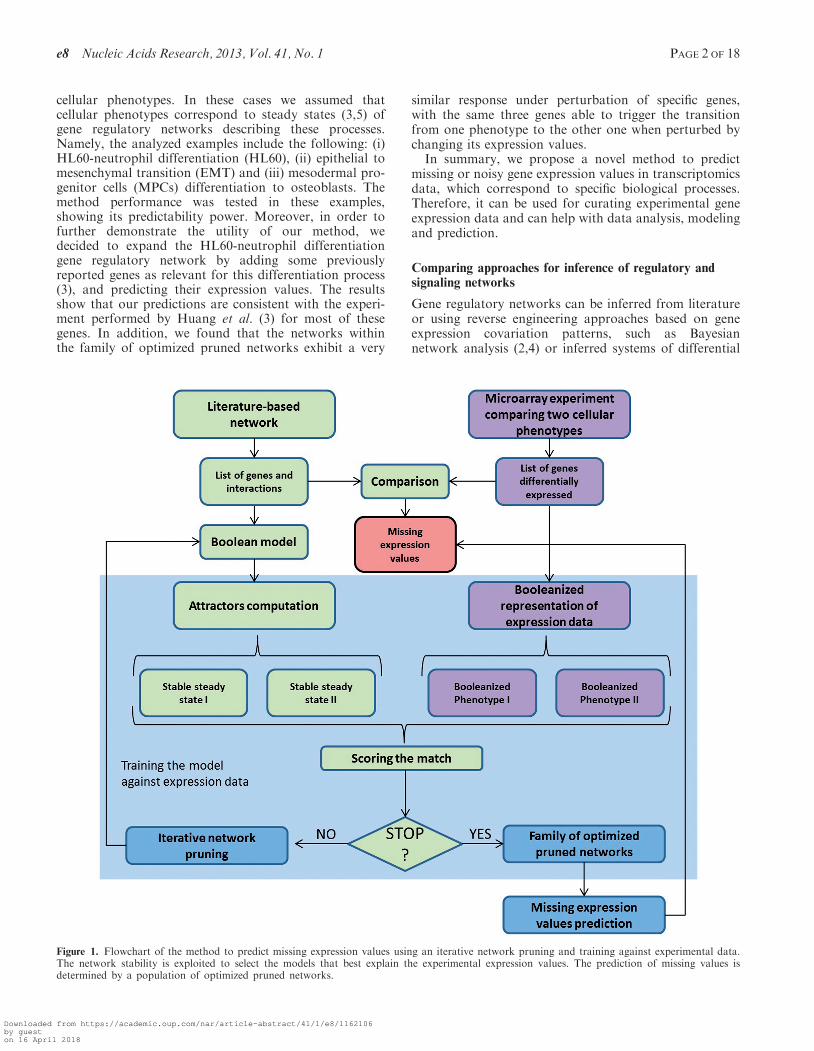
to guide the iterative network pruning of literature-basednetwork interactions, which are apparently not active inthe biological context under study according to expressiondata. This pruning is driven by the compatibility betweenpredicted and experimentally verified steady state gene ex-pression patterns. Hence, it is reasonable to assume thatinteractions removed by pruning are not present in thesesteady states. Once these interactions have been removed,we predict the missing expression values using theoptimized pruned networks explaining the best-known ex-pression values (Figure 1).Given that our method relies on network stability
analysis of different cellular conditions, we selected forour study examples of transitions between different
*To whom correspondence should be addressed. Tel: +352 46 66 44 6982; Fax: +352 46 66 44 6949; Email: [email protected]
The authors wish it to be known that, in their opinion, the first two authors should be regarded as joint First Authors.
Published online 31 August 2012 Nucleic Acids Research, 2013, Vol. 41, No. 1 e8doi:10.1093/nar/gks785
� The Author(s) 2012. Published by Oxford University Press.This is an Open Access article distributed under the terms of the Creative Commons Attribution Non-Commercial License (http://creativecommons.org/licenses/by-nc/3.0), which permits unrestricted non-commercial use, distribution, and reproduction in any medium, provided the original work is properly cited.
Downloaded from https://academic.oup.com/nar/article-abstract/41/1/e8/1162106by gueston 16 April 2018
cellular phenotypes. In these cases we assumed thatcellular phenotypes correspond to steady states (3,5) ofgene regulatory networks describing these processes.Namely, the analyzed examples include the following: (i)HL60-neutrophil differentiation (HL60), (ii) epithelial tomesenchymal transition (EMT) and (iii) mesodermal pro-genitor cells (MPCs) differentiation to osteoblasts. Themethod performance was tested in these examples,showing its predictability power. Moreover, in order tofurther demonstrate the utility of our method, wedecided to expand the HL60-neutrophil differentiationgene regulatory network by adding some previouslyreported genes as relevant for this differentiation process(3), and predicting their expression values. The resultsshow that our predictions are consistent with the experi-ment performed by Huang et al. (3) for most of thesegenes. In addition, we found that the networks withinthe family of optimized pruned networks exhibit a very
similar response under perturbation of specific genes,with the same three genes able to trigger the transitionfrom one phenotype to the other one when perturbed bychanging its expression values.
In summary, we propose a novel method to predictmissing or noisy gene expression values in transcriptomicsdata, which correspond to specific biological processes.Therefore, it can be used for curating experimental geneexpression data and can help with data analysis, modelingand prediction.
Comparing approaches for inference of regulatory andsignaling networks
Gene regulatory networks can be inferred from literatureor using reverse engineering approaches based on geneexpression covariation patterns, such as Bayesiannetwork analysis (2,4) or inferred systems of differential
Figure 1. Flowchart of the method to predict missing expression values using an iterative network pruning and training against experimental data.The network stability is exploited to select the models that best explain the experimental expression values. The prediction of missing values isdetermined by a population of optimized pruned networks.
e8 Nucleic Acids Research, 2013, Vol. 41, No. 1 PAGE 2 OF 18
Downloaded from https://academic.oup.com/nar/article-abstract/41/1/e8/1162106by gueston 16 April 2018
equations (5). Nevertheless, networks inferred purely fromexperimental data and those assembled from the literaturehave different limitations. In the first case, a wealth ofdata about interactions previously described in literatureis ignored. On the other hand, literature-based networksare too disconnected from experimental data to be able todescribe input–output relationships, such as cellular re-sponses under specific biological stimuli or mechanismsthat determine specific stable (long-term) expressionpatterns.
Although the main goal of our method is to predictmissing gene expression values, it requires the inferenceof a set of optimized networks underlying these genes ex-pression patterns. In this context, our network inferencestrategy contains several differences and similarities withpreviously introduced approaches.
An important characteristic of our method is that itexplores a reduced search space due to the fact that onlyinteractions previously reported in literature can beincluded in the network. Methods purely based on experi-mental data (2,4,6) rely on a large amount of data to stat-istically validate network interactions and explore largersearch spaces since interactions are not constrained byliterature information. In some cases, literature-basedmethods can also deal with large search spaces, especiallywhen additional interactions can be added and/or regula-tory logic rules are flexible (7,8).
A clear advantage of the method here we present is thatonly a single experiment is required—a microarray experi-ment comparing two stable states of a biological system.Other approaches combine literature information with ex-perimental data; however, they require a significantnumber of perturbation experiments, i.e. different combin-ations of inputs and outputs (8,7). In order to be able totrain the model these methods require perturbation experi-ments targeting different starting points in the networkincluding combinations of perturbations to solve thecross-talking between different pathways in the graphuntil the entire network is covered. More details areincluded in the Supplementary Data.
Another remarkable difference between the work pub-lished by Irit Gat-Viks et al. (8) and the approach wepresent consists on the complete confidence that thisprevious method has in the experimental data. The as-sumption is that this information is always correct, adjust-ing the regulation functions that define the state of aspecific node based on the states of its parents in anacyclic graph. If after this process some discrepancies orlocal inconsistencies still remain, the model is refined byaddition of novel regulatory hypothesis (with interactionsnot described in literature) using a learning algorithm. Inthe method we propose, a local inconsistency could beaccepted if the global consistency of the computednetwork state and experimental expression data isincreased, strategy suitable to deal with noisy expressiondata. Given that the main goal of our approach is topredict missing expression values and not to describe thespecific regulatory mechanism, we do not introduce inter-actions not described before in literature to refine themodel and we only work on the contextualization of
networks with enough connectivity to explain missing ex-pression values.Another important feature of the method here we
present is that it provides a strategy to increase thematch with expression data using an evolutionary algo-rithm that considers the probability distribution ofpositive circuits and individual edges in an iterativeprocess so it is not necessary to exhaustively explore theentire search space as in previously published works thatalso exploit the attractors of the system, as in the workpublished by Layek et al. (9). In this work the authorsproposed a method to infer regulatory networks using apriori information of biological pathways and the con-cordance between network attractors and experimentaldata. In their method, they integrate information frompathways described in literature to create a family ofpossible networks. Secondly they check if experimentallyobserved stable states agree with computed attractors ofthe family of possible networks and they select the topones (different alternative networks could fit expressiondata). If the match is not good they can question thevalidity of the pathway information, so the stable statesdistribution data can be used to assess the accuracy of thepathway information, but there is no method to improvethis match. Here, we distinguish our method by providinga systematic technique to improve the match between ex-perimental and computed steady states.Summarizing, the method presented here to predict
missing expression values rests on a strategy for networkinference that works on a reduced search space ofliterature-based networks, requires a reduced amount ofexperimental data as it exploits the stability of the networkand uses a strategy to increase the match between themodel and the experimental expression data.Finally, it is worth noting that our method exploits
global network information, i.e. network stability,whereas several other methods rely on local network in-formation, such as pairwise gene expression covariation(2,4), or response to perturbations of specific genes (5).Hence, our method constitutes a good compromisebetween robustness in predictions and the amount ofrequired experimental information.
MATERIALS AND METHODS
Principle of the approach
In order to illustrate the idea, let us consider a microarrayexperiment comparing two cellular phenotypes whichprovides a list of three genes differentially expressedbetween the phenotype 1 and phenotype 2—gene b isupregulated and genes a and c are downregulated.According to this description we can generate twoBooleanized phenotypes which are: the phenotype 1 withthe gene b in OFF (0) and genes a and c in ON (1); thephenotype 2 with the gene b in ON and genes a and c inOFF (Figure 2A) corresponding with the two classescompared in the microarray experiment. Let us pretendthat there are two interactions described in literaturethat allow us to reconstruct a small gene regulatorynetwork with the three differentially expressed genes and
PAGE 3 OF 18 Nucleic Acids Research, 2013, Vol. 41, No. 1 e8
Downloaded from https://academic.oup.com/nar/article-abstract/41/1/e8/1162106by gueston 16 April 2018
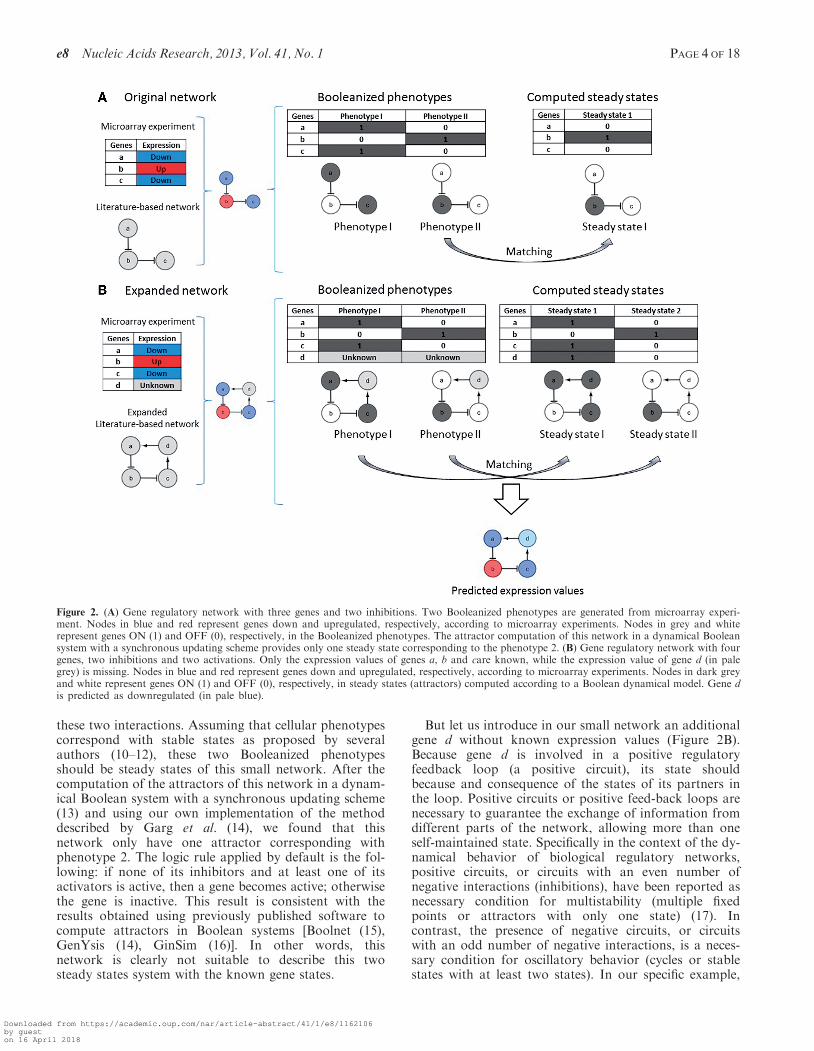
these two interactions. Assuming that cellular phenotypescorrespond with stable states as proposed by severalauthors (10–12), these two Booleanized phenotypesshould be steady states of this small network. After thecomputation of the attractors of this network in a dynam-ical Boolean system with a synchronous updating scheme(13) and using our own implementation of the methoddescribed by Garg et al. (14), we found that thisnetwork only have one attractor corresponding withphenotype 2. The logic rule applied by default is the fol-lowing: if none of its inhibitors and at least one of itsactivators is active, then a gene becomes active; otherwisethe gene is inactive. This result is consistent with theresults obtained using previously published software tocompute attractors in Boolean systems [Boolnet (15),GenYsis (14), GinSim (16)]. In other words, thisnetwork is clearly not suitable to describe this twosteady states system with the known gene states.
But let us introduce in our small network an additionalgene d without known expression values (Figure 2B).Because gene d is involved in a positive regulatoryfeedback loop (a positive circuit), its state shouldbecause and consequence of the states of its partners inthe loop. Positive circuits or positive feed-back loops arenecessary to guarantee the exchange of information fromdifferent parts of the network, allowing more than oneself-maintained state. Specifically in the context of the dy-namical behavior of biological regulatory networks,positive circuits, or circuits with an even number ofnegative interactions (inhibitions), have been reported asnecessary condition for multistability (multiple fixedpoints or attractors with only one state) (17). Incontrast, the presence of negative circuits, or circuitswith an odd number of negative interactions, is a neces-sary condition for oscillatory behavior (cycles or stablestates with at least two states). In our specific example,
Figure 2. (A) Gene regulatory network with three genes and two inhibitions. Two Booleanized phenotypes are generated from microarray experi-ment. Nodes in blue and red represent genes down and upregulated, respectively, according to microarray experiments. Nodes in grey and whiterepresent genes ON (1) and OFF (0), respectively, in the Booleanized phenotypes. The attractor computation of this network in a dynamical Booleansystem with a synchronous updating scheme provides only one steady state corresponding to the phenotype 2. (B) Gene regulatory network with fourgenes, two inhibitions and two activations. Only the expression values of genes a, b and care known, while the expression value of gene d (in palegrey) is missing. Nodes in blue and red represent genes down and upregulated, respectively, according to microarray experiments. Nodes in dark greyand white represent genes ON (1) and OFF (0), respectively, in steady states (attractors) computed according to a Boolean dynamical model. Gene dis predicted as downregulated (in pale blue).
e8 Nucleic Acids Research, 2013, Vol. 41, No. 1 PAGE 4 OF 18
Downloaded from https://academic.oup.com/nar/article-abstract/41/1/e8/1162106by gueston 16 April 2018
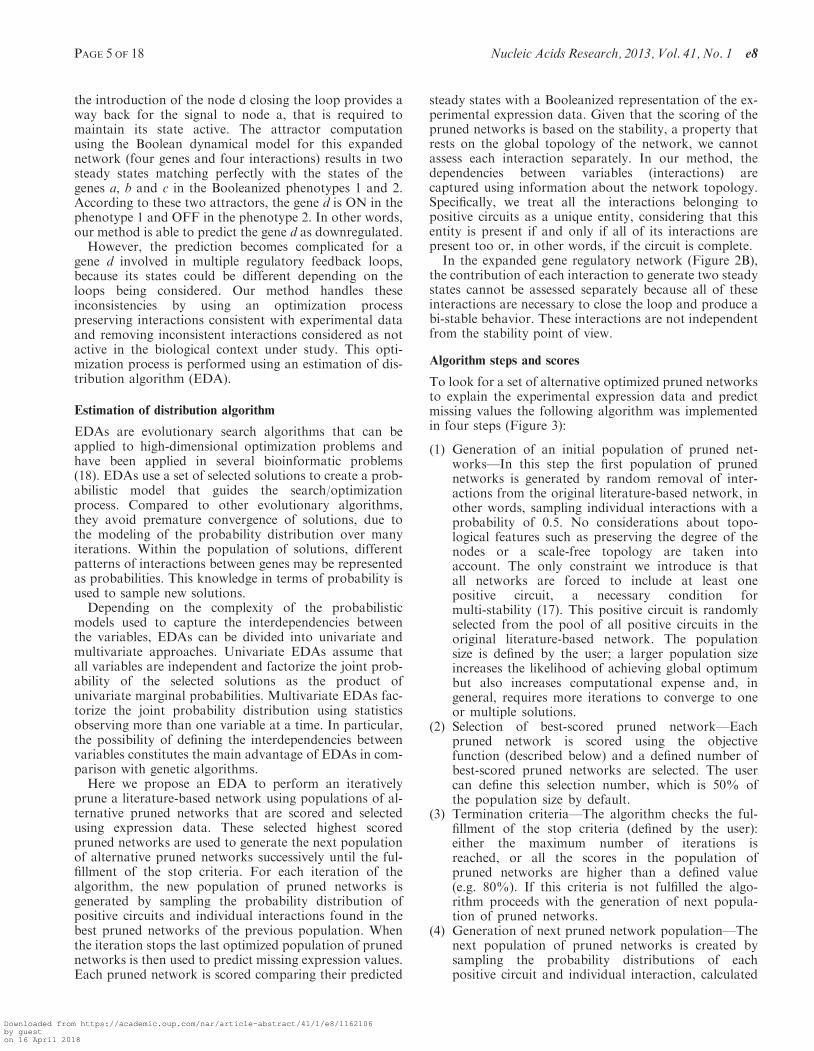
the introduction of the node d closing the loop provides away back for the signal to node a, that is required tomaintain its state active. The attractor computationusing the Boolean dynamical model for this expandednetwork (four genes and four interactions) results in twosteady states matching perfectly with the states of thegenes a, b and c in the Booleanized phenotypes 1 and 2.According to these two attractors, the gene d is ON in thephenotype 1 and OFF in the phenotype 2. In other words,our method is able to predict the gene d as downregulated.
However, the prediction becomes complicated for agene d involved in multiple regulatory feedback loops,because its states could be different depending on theloops being considered. Our method handles theseinconsistencies by using an optimization processpreserving interactions consistent with experimental dataand removing inconsistent interactions considered as notactive in the biological context under study. This opti-mization process is performed using an estimation of dis-tribution algorithm (EDA).
Estimation of distribution algorithm
EDAs are evolutionary search algorithms that can beapplied to high-dimensional optimization problems andhave been applied in several bioinformatic problems(18). EDAs use a set of selected solutions to create a prob-abilistic model that guides the search/optimizationprocess. Compared to other evolutionary algorithms,they avoid premature convergence of solutions, due tothe modeling of the probability distribution over manyiterations. Within the population of solutions, differentpatterns of interactions between genes may be representedas probabilities. This knowledge in terms of probability isused to sample new solutions.
Depending on the complexity of the probabilisticmodels used to capture the interdependencies betweenthe variables, EDAs can be divided into univariate andmultivariate approaches. Univariate EDAs assume thatall variables are independent and factorize the joint prob-ability of the selected solutions as the product ofunivariate marginal probabilities. Multivariate EDAs fac-torize the joint probability distribution using statisticsobserving more than one variable at a time. In particular,the possibility of defining the interdependencies betweenvariables constitutes the main advantage of EDAs in com-parison with genetic algorithms.
Here we propose an EDA to perform an iterativelyprune a literature-based network using populations of al-ternative pruned networks that are scored and selectedusing expression data. These selected highest scoredpruned networks are used to generate the next populationof alternative pruned networks successively until the ful-fillment of the stop criteria. For each iteration of thealgorithm, the new population of pruned networks isgenerated by sampling the probability distribution ofpositive circuits and individual interactions found in thebest pruned networks of the previous population. Whenthe iteration stops the last optimized population of prunednetworks is then used to predict missing expression values.Each pruned network is scored comparing their predicted
steady states with a Booleanized representation of the ex-perimental expression data. Given that the scoring of thepruned networks is based on the stability, a property thatrests on the global topology of the network, we cannotassess each interaction separately. In our method, thedependencies between variables (interactions) arecaptured using information about the network topology.Specifically, we treat all the interactions belonging topositive circuits as a unique entity, considering that thisentity is present if and only if all of its interactions arepresent too or, in other words, if the circuit is complete.In the expanded gene regulatory network (Figure 2B),
the contribution of each interaction to generate two steadystates cannot be assessed separately because all of theseinteractions are necessary to close the loop and produce abi-stable behavior. These interactions are not independentfrom the stability point of view.
Algorithm steps and scores
To look for a set of alternative optimized pruned networksto explain the experimental expression data and predictmissing values the following algorithm was implementedin four steps (Figure 3):
(1) Generation of an initial population of pruned net-works—In this step the first population of prunednetworks is generated by random removal of inter-actions from the original literature-based network, inother words, sampling individual interactions with aprobability of 0.5. No considerations about topo-logical features such as preserving the degree of thenodes or a scale-free topology are taken intoaccount. The only constraint we introduce is thatall networks are forced to include at least onepositive circuit, a necessary condition formulti-stability (17). This positive circuit is randomlyselected from the pool of all positive circuits in theoriginal literature-based network. The populationsize is defined by the user; a larger population sizeincreases the likelihood of achieving global optimumbut also increases computational expense and, ingeneral, requires more iterations to converge to oneor multiple solutions.
(2) Selection of best-scored pruned network—Eachpruned network is scored using the objectivefunction (described below) and a defined number ofbest-scored pruned networks are selected. The usercan define this selection number, which is 50% ofthe population size by default.
(3) Termination criteria—The algorithm checks the ful-fillment of the stop criteria (defined by the user):either the maximum number of iterations isreached, or all the scores in the population ofpruned networks are higher than a defined value(e.g. 80%). If this criteria is not fulfilled the algo-rithm proceeds with the generation of next popula-tion of pruned networks.
(4) Generation of next pruned network population—Thenext population of pruned networks is created bysampling the probability distributions of eachpositive circuit and individual interaction, calculated
PAGE 5 OF 18 Nucleic Acids Research, 2013, Vol. 41, No. 1 e8
Downloaded from https://academic.oup.com/nar/article-abstract/41/1/e8/1162106by gueston 16 April 2018
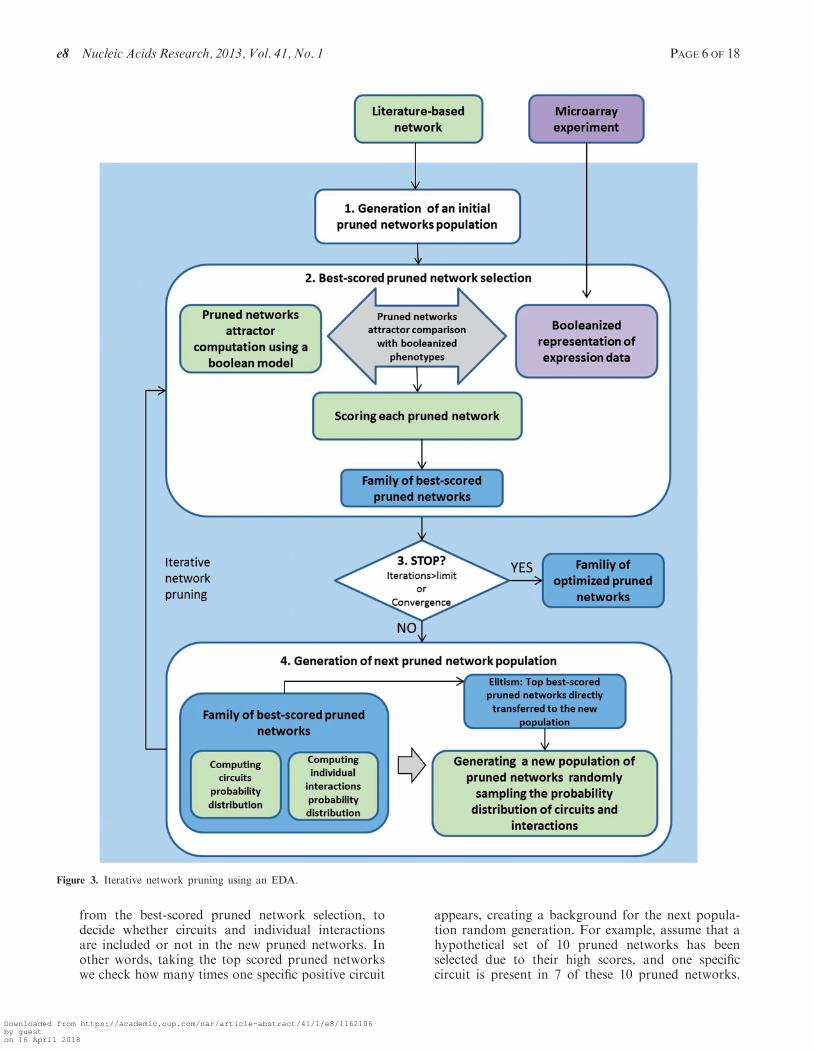
from the best-scored pruned network selection, todecide whether circuits and individual interactionsare included or not in the new pruned networks. Inother words, taking the top scored pruned networkswe check how many times one specific positive circuit
appears, creating a background for the next popula-tion random generation. For example, assume that ahypothetical set of 10 pruned networks has beenselected due to their high scores, and one specificcircuit is present in 7 of these 10 pruned networks.
Figure 3. Iterative network pruning using an EDA.
e8 Nucleic Acids Research, 2013, Vol. 41, No. 1 PAGE 6 OF 18
Downloaded from https://academic.oup.com/nar/article-abstract/41/1/e8/1162106by gueston 16 April 2018
Then, the probability of this circuit is 0.7 and whenwe generate the next population of pruned networks,on �70% of the new networks will have this circuit.Once the circuits are sampled we follow the samesampling on individual interactions to model inter-actions not present in selected circuits. Additionally,in order to retain the best scoring networks we im-plemented elitism—pruned networks with the bestscores within the subset of selected prunednetworks are directly transferred to the next gener-ation. The algorithm also introduces a certainamount of noise in the optimization process bysampling the truncated probability of both circuitsand interactions. These probability distributionvalues are truncated to 0.2, in the case of frequencies<0.2 and to 0.8 in the case of frequencies >0.8. Thisstrategy avoids convergence (all pruned networkswith or without a specific circuit or interaction) bychance, and enables efficient optimization for smallerpopulation size.
The objective function
The objective function assesses the match between pre-dicted steady states (see section on computation of attrac-tors) and a Booleanized representation of the experimentalexpression data assigning a score to each sampled prunednetwork (n). This score S uses the normalized Hammingdistance (h) to compare N Boolean gene expression values(s) between all calculated steady states (a) of a prunednetwork and the two known phenotypes (j1 and j2)defined by the expression data, in order to identifythe two best-matching phenotype/steady state couples(ja1 and ja2). Finally, the pruned network score (from0 to 1) is defined as:
Sn ¼ 1�ðh’�1+h’�2Þ
2
� �, with h’� ¼
1
N
XNi¼1
ð�’i ���i Þ
2
Prediction of gene expression
Once the iterative pruning terminates, we calculate fiveprediction scores for each gene. The scores correspondto five classifications—UP or DOWN (differentially ex-pressed genes), ON or OFF (invariant genes), or UNK(genes with unknown expression). For instance, the clas-sification score for UP (resp. DOWN, ON, OFF, UNK) isequal to the number of solutions with a steady state couple��2g , ��1g
� �equal to {1,0} (resp. {0,1}, {1,1},{0,0}, {�,�})
for this gene g divided by the total number of solutions.The classification with the highest score corresponds toour predicted gene expression for the gene g. In case ofmore than one highest score, we predict the gene expres-sion as UNK.
Computation of attractors and circuits
In order to compute the attractors, we model the networkas a dynamical system using a deterministic rule-basedapproach or, more specifically, a Boolean dynamical
model. Other possible dynamic models include continuousmodels, which have the benefit of being easily comparedto quantitative experimental data (19), and discretemodels with more than two possible values (20).However, since the continuous models would have to bestudied numerically as opposed to analytically, the com-putation of attractors becomes computationally expen-sive. Furthermore, biological regulatory processes aresuch that the graph of rate of expression between aregulated gene as a function of its regulator, commonlyexhibits a sharp sigmoid curve, which can beapproximated to a Boolean switch-like behavior (21).Within this Boolean dynamical model the network is
created as a graph, which is directed and signed, inorder to represent positive or negative regulation. Thenodes represent genes and the edges denote regulation.Each node has an associated value ‘1’ or ‘0’ encodingthe activation/presence or inactivation/absence, respect-ively. The logic functions that encode the regulation foreach specific node are represented using the disjunctivenormal form representation, that uses only AND, ORand NOT operators (22). Given the regulators (activatorsand inhibitors) for each node, the Boolean function isevaluated using rules proposed by (14): if none of its in-hibitors and at least one of its activators are active, then agene becomes active; otherwise, the gene is inactive.Finally, we use a synchronous updating scheme (13),where all genes in the network update their expressionlevels simultaneously in each time step. We use synchron-ous updating scheme as it facilitates computation due tothe smaller state space and yet preserves the generic quali-tative properties of the network (23). An alternativeupdating scheme, which we do not investigate, would bethe asynchronous scheme, which would have a muchlarger state space, leading to a higher complexity ofcomputing attractors (13). With this synchronousupdating scheme all the genes are updated from one stepto the next one at the same time.Using the set of Boolean functions for each node and
synchronous updating, we then compute the attractors ofthe network, i.e. the set of states towards which a dynam-ical system evolves over time. The attractors werecomputed using an efficient method to model thenetwork dynamics using Reduced Order Binary DecisionDiagrams (ROBDD or in short BDD), due to theircompact representation of Boolean functions and theease of computing complex Boolean operations(14).More details about attractor computation are includedin the Supplementary Data.The Johnsons algorithm (24) is used to detect all elem-
entary circuits in the network. A circuit is a path in whichthe first and the last nodes are identical. A path is elem-entary if no node appears twice. A circuit is elementary ifno node but the first and the last appears twice. Once wehave all elementary circuits, we select positive circuits, orcircuits for which the difference between the number ofactivating edges and the number of inhibiting edges iseven. Johnson’s algorithm uses backtracking to eliminatepartial candidate solutions, where the partial candidatesare created by building elementary paths. The algorithmbegins from a root node s and creates elementary paths
PAGE 7 OF 18 Nucleic Acids Research, 2013, Vol. 41, No. 1 e8
Downloaded from https://academic.oup.com/nar/article-abstract/41/1/e8/1162106by gueston 16 April 2018
from s. Additionally, the algorithm provides two advan-tages—it reduces the search space considerably byblocking nodes as they are added to an elementary pathand the method also reduces the search space by removingthe previous root nodes so that new cycles are generated.The algorithm runs in O(n+e)(c+1) time and requires astorage space of O(n+e), where n is the number of nodes,c is the number of elementary circuits and e is the numberof edges.
Availability and implementation
The computation of attractors and the detection ofcircuits were implemented in C++, the EDA algorithmwas developed in Perl and the interface was designed inPHP as a module of M@IA (25). The tool (named asXPred) and source code are freely available foracademic use at http://maia.uni.lu/XPred.
Simulations to test the consistency in response toperturbation within a family of optimized pruned networks
To perform these simulations we used a continuous dy-namical model based on a set of ordinary differentialequations (ODE) implementing the method described byMendoza et al. (19). In this continuous system the steadystate computed in the Boolean model is introduced asinitial state. Then we proceeded to perturb one by oneevery gene in the network, changing its state to ON (1)or to OFF(0) depending on the case and checking if such aperturbation is able to trigger the transition to the steadystate corresponding to the neutrophils phenotype or not.The results of these simulations were consistent with theresults obtained with a previous implementation of thismethod published by (26).
RESULTS
Approach optimizing pruned networks and predictingmissing expression values
Our method is designed for stable cellular phenotypes withknown expressions values. It means that, for microarrayexpression data, the two phenotypes should correspond tosteady states or long-term expression patterns. The threebiological examples used to illustrate and validate themethod correspond to three cellular differentiationnetworks (HL60–neutrophil differentiation, EMT andMPCs differentiation to osteoblasts). The list of differen-tially expressed genes provided by the expression dataanalysis is transformed to generate two Booleanizedphenotypes. Then, our method generates alternative con-figurations of the original network in order to select thosehaving attractors, computed with a Boolean model, withthe best fit to Booleanized phenotypes. Finally, theseoptimized pruned networks show interactions that bestexplain the known expression values, and the gene statesof its attractors are used to predict missing expressionvalues.
Illustration of the method using a toy network
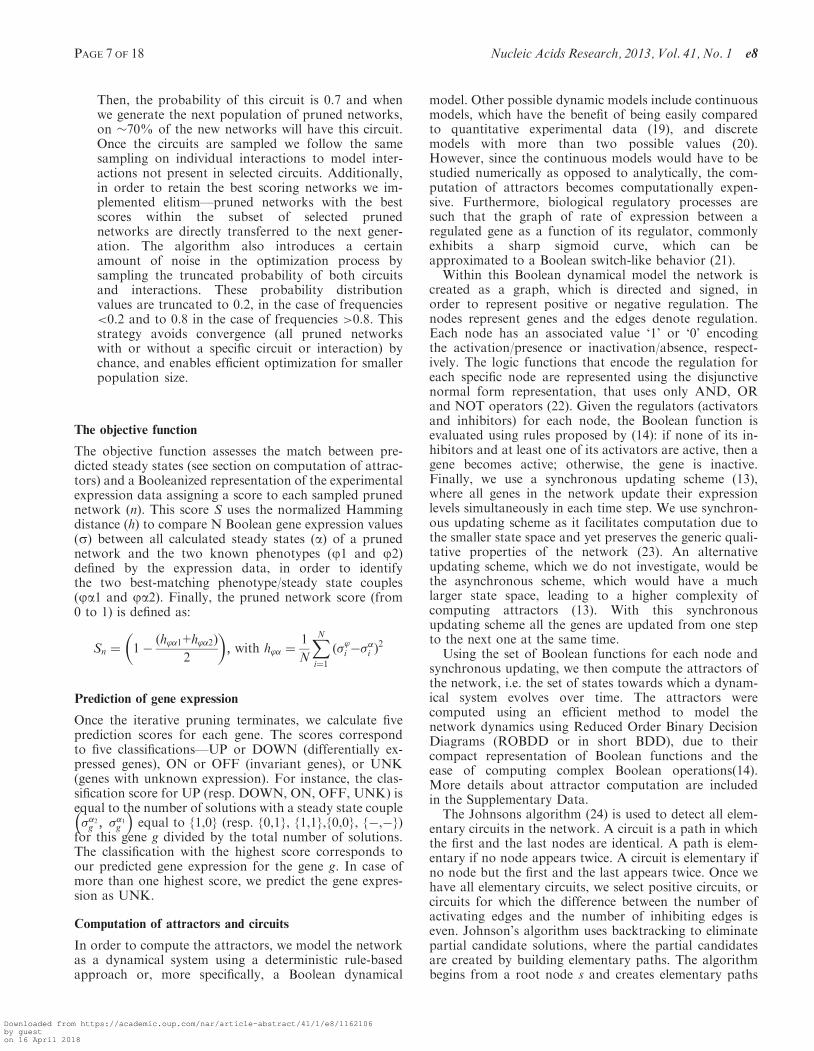
In order to illustrate the algorithm and to interpret theresults, we constructed a toy network with 18 nodes, 23edges and three positive circuits (Figure 4, up-left), and anincomplete gene expression dataset for two ‘experimental’stable states that represent a microarray experiment (nodeA, C and F without expression). The gene expressiondataset is used to generate two Booleanized phenotypes(Figure 4, up-right). This network has only one steadystate or fixed point according to a Boolean dynamicalmodel following the rules described in the ‘Materials andMethods’ section, so it is clearly not suitable to describe asystem with at least two steady states.
We run 40 iterations of the algorithm with a populationsize of 30 and a best-score network selection number of 12,that is, at each iteration, we selected 12 best-scoring indi-viduals from a population of 30. The new generation iscreated by sampling the probability distribution ofpositive feedback loops (positive circuits) and individualedges in these 12 selected individuals. The elitism methoddirectly transfers the best six solutions to the nextpopulation.
In the final population, some edges are removed by thealgorithm because they prevent a perfect match betweenthe Booleanized phenotypes and the computed attractors(considering only genes with known expression data, i.e.all of them but A, C and F). These edges represent inter-actions that are described in literature, but apparently arenot active in the context under study. According to thepredictions performed using the optimized prunednetwork, the algorithm predicts missing expressionvalues for genes A (downregulated), C (upregulated) andF (upregulated).
We noticed that the interactions B -j D, E -> P andQ -> J are correctly removed from all solutions with a100% matching score because their presence avoided theperfect match. Interestingly, we noticed that in such solu-tions, the interactions B -> C and G -> C could be missingbut not simultaneously. They constitute alternativepathways to guarantee the bi-stability of the system. Inother words, some of the perfect matching solutions haveone and only one of these interactions missing.Interestingly, the probability distribution of the circuits inthese 100% matching solutions shows that the circuit 1 isalways absent, but circuits 2 or 3 could be missing (but notboth at the same time) precisely because the missing B -> Cand G -> C interactions break them (Figure 4, down).
The interaction J -> Q can be present or absent accord-ing to our model and the logic gate that rules the regula-tion of Q, without change in the state of this node in theattractors. It highlights a limitation of our method, as wecannot remove this link due to a lack of evidence (it couldbe present or absent in a perfect matching solution). Thevalidation of such links in the specific biological contextdefined by the experimental data is out of the scope of thismethod.
Biological sample cases
We chose three cellular differentiation processesas examples to illustrate and validate the method
e8 Nucleic Acids Research, 2013, Vol. 41, No. 1 PAGE 8 OF 18
Downloaded from https://academic.oup.com/nar/article-abstract/41/1/e8/1162106by gueston 16 April 2018
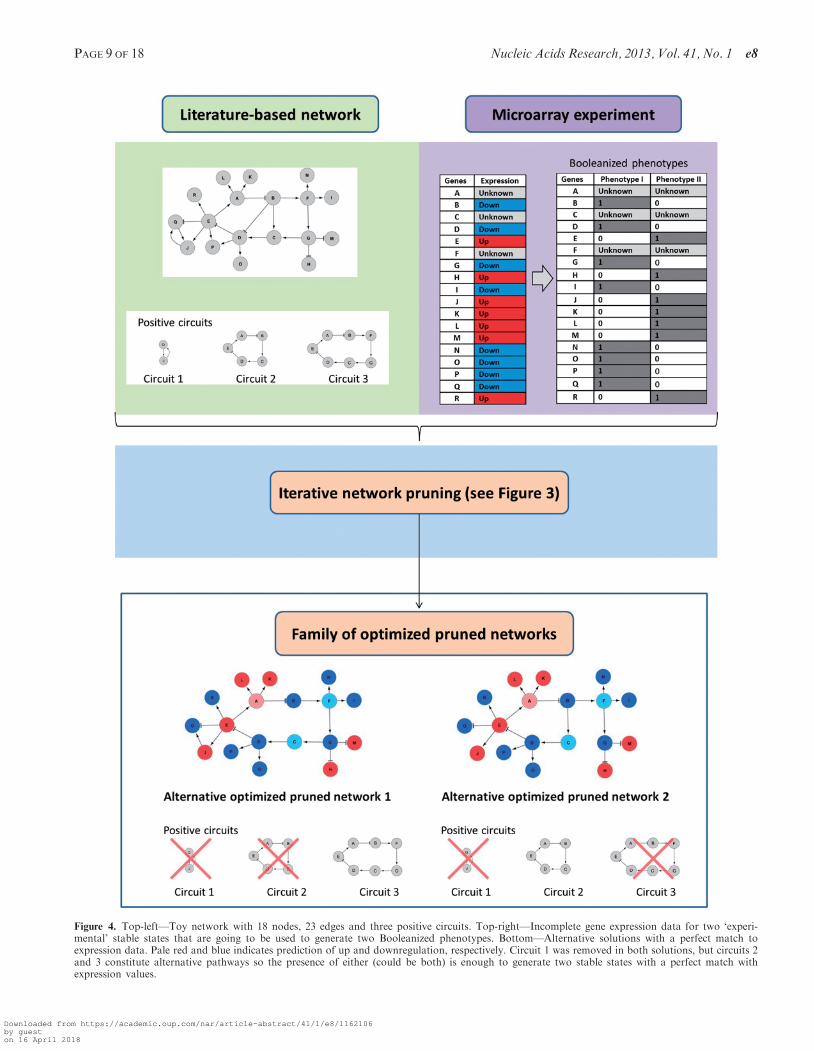
Figure 4. Top-left—Toy network with 18 nodes, 23 edges and three positive circuits. Top-right—Incomplete gene expression data for two ‘experi-mental’ stable states that are going to be used to generate two Booleanized phenotypes. Bottom—Alternative solutions with a perfect match toexpression data. Pale red and blue indicates prediction of up and downregulation, respectively. Circuit 1 was removed in both solutions, but circuits 2and 3 constitute alternative pathways so the presence of either (could be both) is enough to generate two stable states with a perfect match withexpression values.
PAGE 9 OF 18 Nucleic Acids Research, 2013, Vol. 41, No. 1 e8
Downloaded from https://academic.oup.com/nar/article-abstract/41/1/e8/1162106by gueston 16 April 2018

(Table 1): HL60–neutrophil differentiation (HL60), EMTand differentiation of MPCs to osteoblasts. The generegulatory network reconstruction process is described inthe Supplementary Data, and references about the inter-actions are included in the Supplementary Material SII.The multipotentpromyelocytic leukemia cell line HL60
was originally isolated by Dr Steven Collins from an acutepromyelocytic leukemia (APL) patient (27). The HL60system was used by Huang et al. (12) to demonstratethe correspondence between cell fates and high-dimensional attractor states of the underlying network.This cell line can be stimulated to differentiate into neu-trophils using different chemical agents. In order to recon-struct the HL60-neutrophil differentiation gene regulatorynetwork, we used a set of genes composed by genes dif-ferentially expressed between HL60 cells (precursor orphenotype 1) and neutrophils (phenotype 2), where thedifferentiation was induced by dimethyl sulfoxide(DMSO) in the experiment performed by Mollinedoet al. (28). We were able to reconstruct a gene regulatorynetwork with 18 genes and 38 interactions representingpositive or negative effect over gene expression.EMT plays a crucial role in cancerogenesis and metasta-
sis, by initiating by the breakdown of epithelial cell homeo-stasis correlated with the acquisition of invasive capacitiesand stemness properties. We used a set of differentiallyexpressed genes between epithelial and mesenchymal cellsobtained from an experiment performed by Vetter et al.(29) where the transition is triggered by the induced expres-sion of the EMT master transcription regulator SNAI1(human snail). We obtained a gene regulatory networkwith 46 genes and 129 interactions representing positiveor negative effect over gene expression.Single human bone marrow-derived MPCs differentiate
into osteoblasts, chondrocytes, adipocytes, myocytes andendothelial cells. In the experiment performed by Qi et al.(30), MPCs were induced to differentiate into osteoblasts,cells involved in bones formation, by adding dexametha-sone, ascorbic acid and b-glycerophosphate to the cellcultures. A microarray analysis performed afterwardsyielded a list of differentially expressed genes betweenosteoblasts and MPCs. The resulting network includes67 genes and 123 interactions representing positive ornegative effect over gene expression.Figure 5 shows the results after the application of our
method to the three biological examples. Using the
prediction scores described in ‘Material and Methods’section, we are able to obtain a consensus among a popu-lation of optimized pruned networks.
Statistical validation
In our biological examples, to statistically validate pre-dicted expression values, we compared the distributionof network scores generated by our optimized prunednetworks from multiple training sets, with the distributionof scores corresponding to a population of randomlygenerated expression patterns (Figure 6). This populationof random expression patterns was generated assigningrandomly one of the following values for each gene inthe network: upregulated, downregulated, invariant-upand invariant-down. These values correspond to genesthat in a Booleanized model changes from 0 to 1 andfrom 1 to 0 in the first two cases, and that remain invariantin 1 and 0 for the latter two cases, respectively. Once weassign values to all genes, expression patterns are scoredusing the Booleanized phenotypes from experimentaldata. This scoring scheme is the same used during theoptimization process, reflecting the match between therandom expression pattern and the experimentalBooleanized phenotypes. We repeated the process 10 000times, obtaining a population of random expressionpatterns with the respective scores. Then, we comparedthis population with the population of optimized prunednetworks (30 alternative pruned networks, which consti-tute the last population of optimized pruned networksafter the last iteration of the algorithm) for 20 differentand randomly selected training and predicted sets ofgenes. We use different training sets to perform thiscross-validation, since not all possible training sets areequally predictive due to the fact that not all genes areequally informative according to our method. Forexample, highly connected genes are in general more in-formative than genes with few interactions. Preliminarytests showed that the optimal percentage of genes forwhich gene expression values can be predicted was 35%,based on the expression values of the remaining 65%. Forinstance, in the HL60 network, that includes 18 genes, 12genes were used to predict the expression values of theremaining six genes for 20 different combinations oftraining and predicted genes. Then, we scored the matchbetween predictions and expression data using the samescoring process as in the pruning, but now considering all
Table 1. Gene regulatory networks of three biological examplesa
Network properties HL60–neutrophils EMT MPC–osteoblast
Number of nodes 18 46 67Number of edges 39 129 123Activations 37 92 72Inhibitions 2 37 51
Feed-back loops (circuits)Positive 5 38 5Negative 1 71 1
Feed;forward loops (up to 5 nodes) 326 1074 1121
aHL60–neutrophil differentiation network, epithelial–mesenchymal transition network, MPC–osteoblast differentiation network. Information aboutnumber of nodes, edges, circuits and feed-forward loops is shown in the table.
e8 Nucleic Acids Research, 2013, Vol. 41, No. 1 PAGE 10 OF 18
Downloaded from https://academic.oup.com/nar/article-abstract/41/1/e8/1162106by gueston 16 April 2018
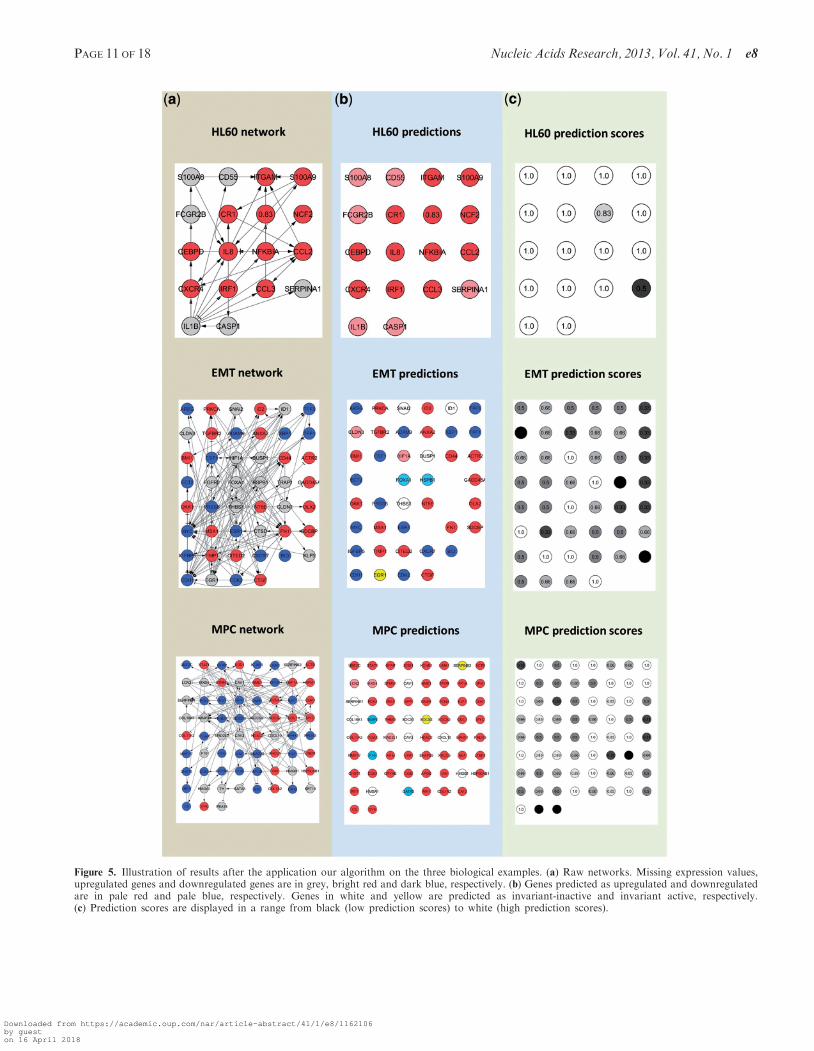
Figure 5. Illustration of results after the application our algorithm on the three biological examples. (a) Raw networks. Missing expression values,upregulated genes and downregulated genes are in grey, bright red and dark blue, respectively. (b) Genes predicted as upregulated and downregulatedare in pale red and pale blue, respectively. Genes in white and yellow are predicted as invariant-inactive and invariant active, respectively.(c) Prediction scores are displayed in a range from black (low prediction scores) to white (high prediction scores).
PAGE 11 OF 18 Nucleic Acids Research, 2013, Vol. 41, No. 1 e8
Downloaded from https://academic.oup.com/nar/article-abstract/41/1/e8/1162106by gueston 16 April 2018
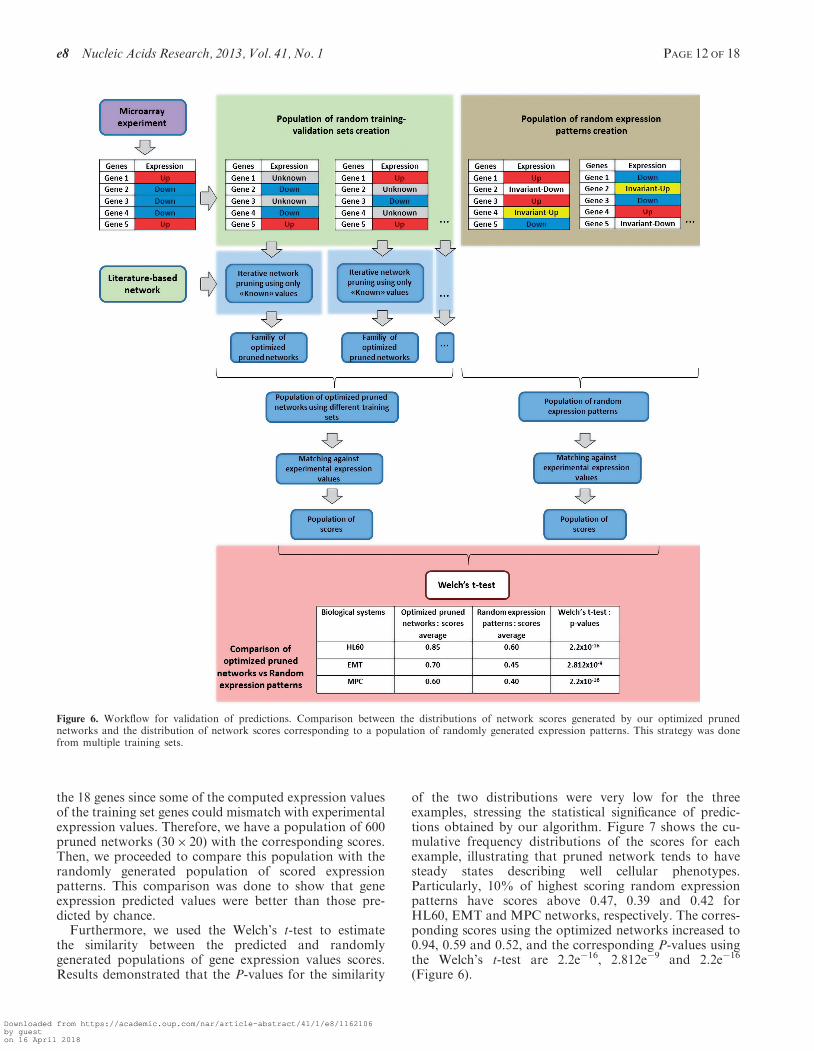
the 18 genes since some of the computed expression valuesof the training set genes could mismatch with experimentalexpression values. Therefore, we have a population of 600pruned networks (30� 20) with the corresponding scores.Then, we proceeded to compare this population with therandomly generated population of scored expressionpatterns. This comparison was done to show that geneexpression predicted values were better than those pre-dicted by chance.Furthermore, we used the Welch’s t-test to estimate
the similarity between the predicted and randomlygenerated populations of gene expression values scores.Results demonstrated that the P-values for the similarity
of the two distributions were very low for the threeexamples, stressing the statistical significance of predic-tions obtained by our algorithm. Figure 7 shows the cu-mulative frequency distributions of the scores for eachexample, illustrating that pruned network tends to havesteady states describing well cellular phenotypes.Particularly, 10% of highest scoring random expressionpatterns have scores above 0.47, 0.39 and 0.42 forHL60, EMT and MPC networks, respectively. The corres-ponding scores using the optimized networks increased to0.94, 0.59 and 0.52, and the corresponding P-values usingthe Welch’s t-test are 2.2e�16, 2.812e�9 and 2.2e�16
(Figure 6).
Figure 6. Workflow for validation of predictions. Comparison between the distributions of network scores generated by our optimized prunednetworks and the distribution of network scores corresponding to a population of randomly generated expression patterns. This strategy was donefrom multiple training sets.
e8 Nucleic Acids Research, 2013, Vol. 41, No. 1 PAGE 12 OF 18
Downloaded from https://academic.oup.com/nar/article-abstract/41/1/e8/1162106by gueston 16 April 2018
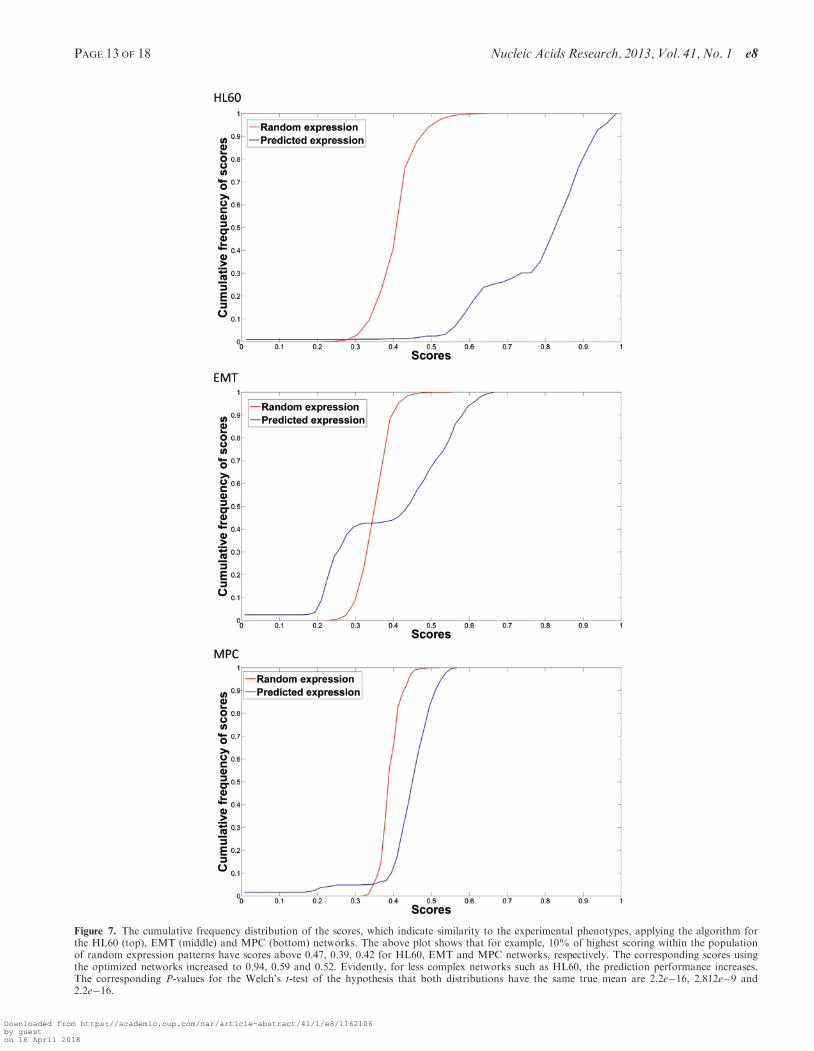
Figure 7. The cumulative frequency distribution of the scores, which indicate similarity to the experimental phenotypes, applying the algorithm forthe HL60 (top), EMT (middle) and MPC (bottom) networks. The above plot shows that for example, 10% of highest scoring within the populationof random expression patterns have scores above 0.47, 0.39, 0.42 for HL60, EMT and MPC networks, respectively. The corresponding scores usingthe optimized networks increased to 0.94, 0.59 and 0.52. Evidently, for less complex networks such as HL60, the prediction performance increases.The corresponding P-values for the Welch’s t-test of the hypothesis that both distributions have the same true mean are 2.2e�16, 2.812e�9 and2.2e�16.
PAGE 13 OF 18 Nucleic Acids Research, 2013, Vol. 41, No. 1 e8
Downloaded from https://academic.oup.com/nar/article-abstract/41/1/e8/1162106by gueston 16 April 2018
Expanded gene regulatory networks of HL60, EMT andMPC: prediction of missing expression values
Once we validated the method by predicting previouslyknown expression values using different training and pre-dicted sets, we applied this strategy to predict expressionvalues of new genes in expanded gene regulatory networksof HL60, EMT and MPC.The strategy to expand the networks was the following.
We looked in literature [using Ariadne’s Med Scan tech-nology (31,32)] for interactions that allow us to connectnew genes to our original networks in such a way that theyare included in regulatory circuits, i.e. the signal flowsfrom the original network to the genes and back, so allthe new genes have incoming and outgoing edges. The listof genes involved in such circuits was compared with a listof candidate genes. Genes present in both lists wereselected, and these genes and their corresponding inter-actions were used to obtain the expanded network. Thelists of candidate genes were obtained from a specific ex-periment in the case of the HL60 network (3). In the casesof the EMT and MPC networks the lists of candidategenes were obtained from Biograph, a data miningframe-work for the computational identification ofsuitable targets among candidate genes in a biomedicalcontext (33). Using Biograph we obtained two lists withthe 100 top scoring genes involved in the epithelial–mes-enchymal transition and mesodermal–osteoblast differen-tiation. The genes that were common between the listsobtained by Biograph, and those involved in the circuitsdescribed above, were used to expand the networks, andtheir expression values were predicted applying ourapproach.
HL60The list of candidate genes for the network expansion wasextracted from an experiment performed by Huang et al.(3). In this work the authors applied two different treat-ments (different in dosage and duration but using thesame agent, all-trans-retinoic acid or ATRA) to anHL60 multipotentpromyelocyticleukemia cell line,generating two populations at the apparently same stageof differentiation. However, once the treatments finished,one of the populations proceeded toward a differentiatedneutrophil population while the other one reverted backtoward the undifferentiated promyelocytic state. The listof genes differentially expressed between these two popu-lations (see Supplementary Data for details), potentiallyrelevant for the neutrophil differentiation process, wasused to expand our original HL60 gene regulatorynetwork constructed using only genes differentially ex-pressed between the undifferentiated promyelocytic anddifferentiated neutrophil states. Notice that genes differ-entially expressed according to the experiment performedby Huang et al. (3) constitute a comparison between twopopulations of cells in transient states, and they cannot beconsidered differentially expressed genes between the twostable phenotypes (HL60 and neutrophils). To illustratethe integration of the two experiments used to constructthe HL60 expanded example we included theSupplementary Figure S11.
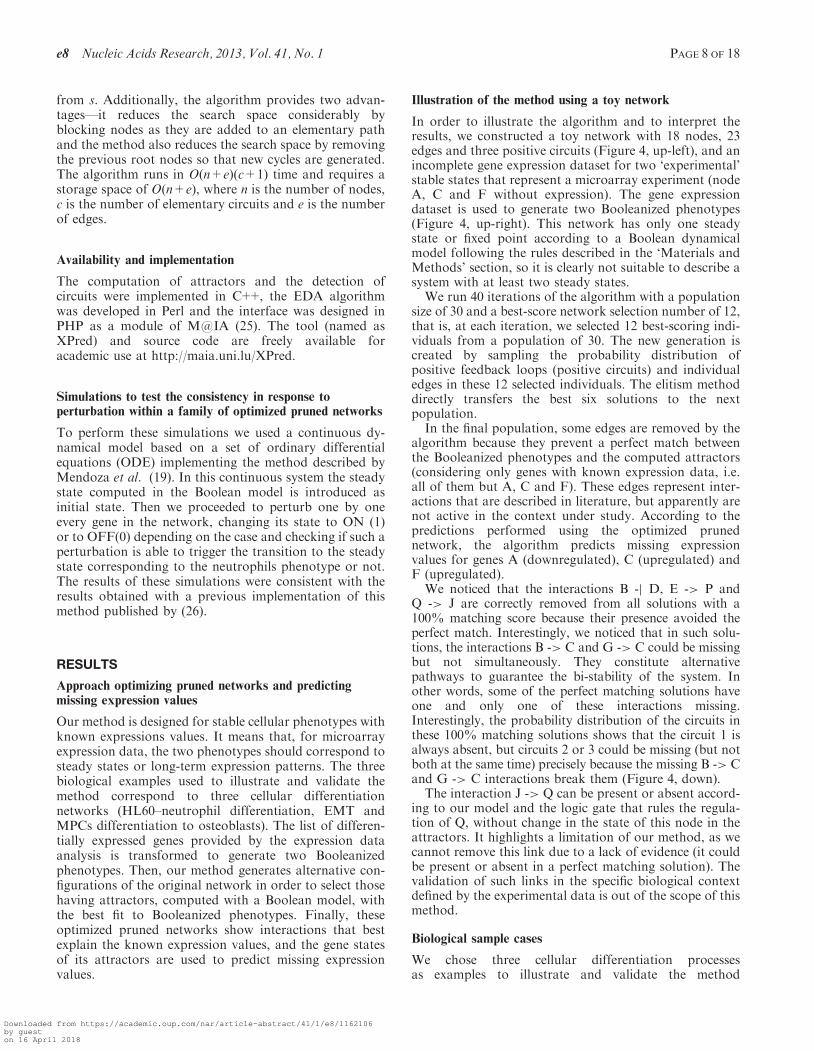
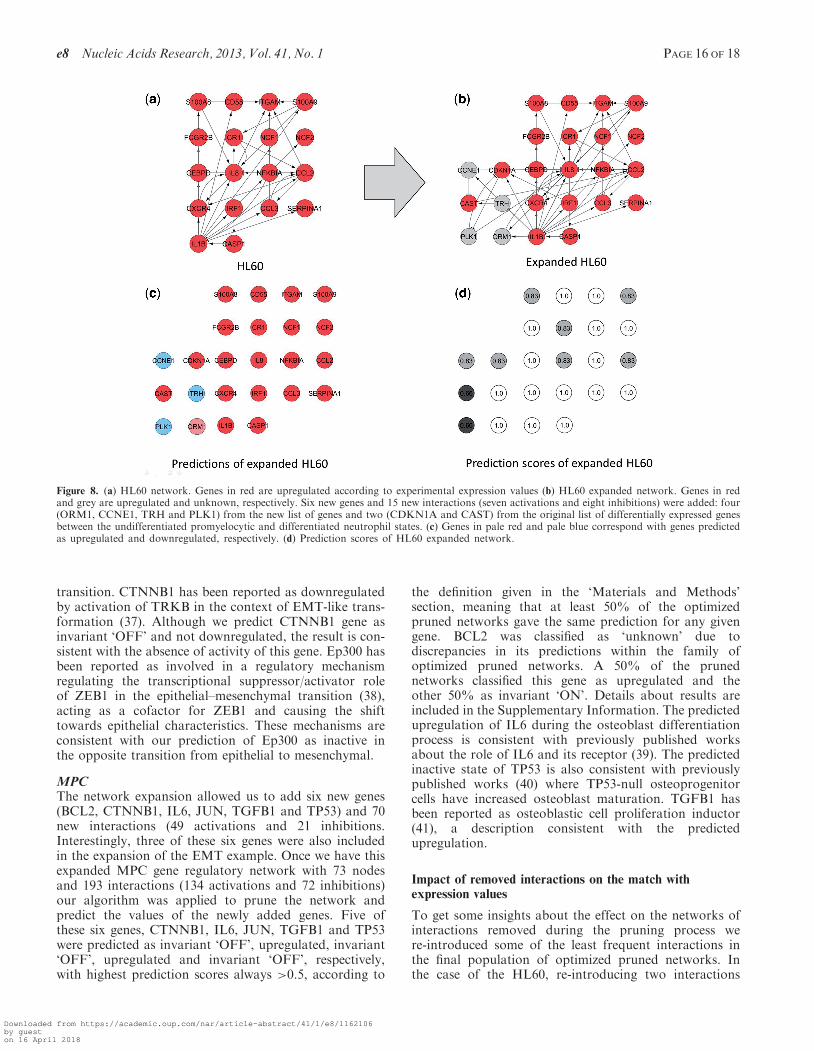
This procedure allowed us to add six new genes and 15new interactions (seven activations and eight inhibitions),four (ORM1, CCNE1, TRH and PLK1) from the new listof genes and two (CDKN1A and CAST) from the originallist of differentially expressed genes between the undiffer-entiated promyelocytic and differentiated neutrophilstates, that can be included in the gene regulatorynetwork now thanks to the connectivity with the otherfour new genes (see Table 3 and Figure 8a and b). Aftercomputing the attractors of this expanded network usingthe Boolean model with the synchronous updating schemewe obtained only one steady state or fixed point with allthe genes in ‘OFF’ but CAST, PLK1 and TRH. Clearlythis network is not suitable to describe a system with atleast two steady states or fixed points
Once we have this expanded HL60 gene regulatorynetwork with 24 nodes and 54 interactions (44 activationsand 10 inhibitions) our algorithm was applied to prune thenetwork and predict the values of the newly added genes(see Table 3 and Figure 8c and d).
The consistency of the predictions between differentpruned networks was very high (Table 2) due to the factthat the attractors are practically identical for all thenetworks, with highest prediction scores always> 0.66, ac-cording to the definition given in the ‘Materials andMethods’ section, meaning that at least 66% of theoptimized pruned networks gave the same prediction forany given gene. Discrepancies in the attractors are repre-sented in Table 3 (in bold).
Interestingly, the predicted expression for three of thesefour new genes, ORM1, CCNE1 and PLK1 is consistentwith the expression profile of the population of stimulatedpromyelocytic cells that are going to differentiate to neu-trophils in the experiment performed by Huang et al. (3)where ORM1 is upregulated and CCNE1 and PLK1 aredownregulated. There is a discrepancy between this ex-periment and our prediction concerning to TRH, whichis upregulated in the experiment but downregulated in thepredictions.
We also performed and experiment on the HL60expanded network to test if not only the steady statesbut also the network response under perturbation(change of expression values) of specific genes are consist-ent for different optimized pruned networks. Interestingly,in the six top-scored pruned networks CASP1, IRF1 andIL1B were the genes able to trigger the transition from theHL60 to the neutrophil phenotype when perturbed. Theperturbation of remaining genes failed to cause such atransition. These simulations showed that despite the dif-ferences in topology between different optimized prunednetworks, the response under specific perturbations wereconsistent. These three triggering genes are involved in apositive circuit without incoming edges but with a numberof genes directly or indirectly regulated by them, so theyconstitute a ‘head’ of regulation in a network that resem-bles the ‘medusa model’ described by Kauffman (34). Inparticular, IRF1 has been reported as an inductor of themyeloid differentiation of HL60 cells (35), which consti-tutes an experimental validation of the key role played bythis gene in HL60 differentiation processes.
e8 Nucleic Acids Research, 2013, Vol. 41, No. 1 PAGE 14 OF 18
Downloaded from https://academic.oup.com/nar/article-abstract/41/1/e8/1162106by gueston 16 April 2018
More details about these simulations and tables with theresults are available in the Supplementary Informationand Supplementary File SII, respectively.
EMTThe network expansion allowed us to add five new genes(BMP4, CTNNB1, EP300, TGFB1 and TP53) and 53 newinteractions (42 activations and 11 inhibitions). Once wehave this expanded EMT gene regulatory network with 50nodes and 182 interactions (134 activations and 48 inhib-itions) our algorithm was applied to prune the networkand predict the values of the newly added genes. Three ofthese five genes, BMP4, CTNNB1 and EP300 were pre-dicted as upregulated, invariant ‘OFF’ and invariant
‘OFF’, respectively, with highest prediction scoresalways >0.66, according to the definition given in the‘Materials and Methods’ section, meaning that at least66% of the optimized pruned networks gave the sameprediction for any given gene. TGFB1 and TP53 wereclassified as ‘unknown’ due to discrepancies in its predic-tions within the family of optimized pruned networks. Inboth cases 50% of the pruned networks classified thesegenes as upregulated and the other 50% as invariant‘ON’. Details about results are included in theSupplementary Information.The prediction of BMP4 as upregulated is consistent
with previously published work (36) where BMP4 wasreported as an inducer of the epithelial–mesenchymal
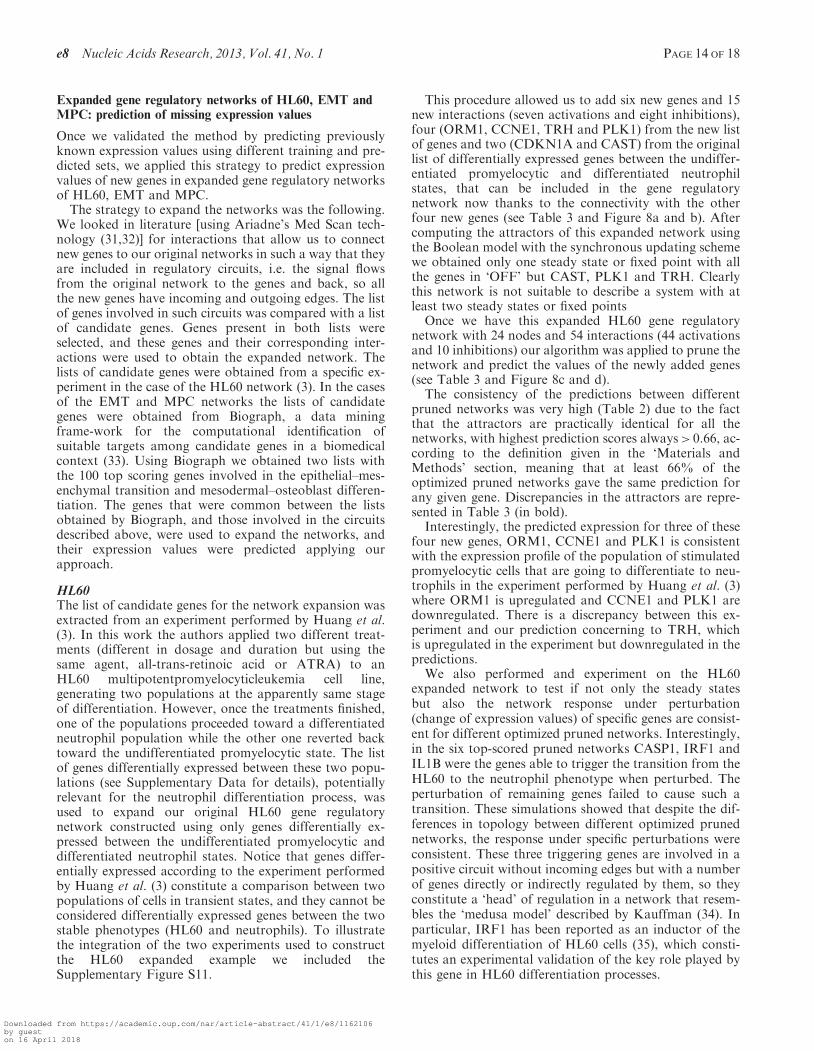
Table 3. HL60 expanded example
Genes Phenotypes Computed attractors of the alternative pruned networks Predictions Prediction scores
1&2 #0 #1 #2 #3 #4 #5 UP DOWN ON OFF UNK
CASP1 0 1 0 1 0 1 0 1 0 1 0 1 0 1 UP 1 0 0 0 0CAST 0 1 0 1 0 1 1 0 1 1 0 1 0 1 UP 0.6667 0.1667 0.1667 0 0CCL2 0 1 0 1 0 1 0 1 0 1 0 0 0 1 UP 0.8333 0 0 0.1667 0CCL3 0 1 0 1 0 1 0 1 0 1 0 1 0 1 UP 1 0 0 0 0CCNE1 – – 1 0 1 0 1 0 0 0 1 0 1 0 DOWN 0 0.8333 0 0.1667 0CD55 0 1 0 1 0 1 0 1 0 1 0 1 0 1 UP 1 0 0 0 0CDKN1A 0 1 0 1 0 1 0 1 0 0 0 1 0 1 UP 0.8333 0 0 0.1667 0CEBPD 0 1 0 1 0 1 0 1 0 1 0 1 0 1 UP 1 0 0 0 0CR1 0 1 0 1 0 1 0 1 0 0 0 1 0 1 UP 0.8333 0 0 0.1667 0CXCR4 0 1 0 1 0 1 0 1 0 1 0 1 0 1 UP 1 0 0 0 0FCGR2B 0 1 0 1 0 1 0 1 0 1 0 1 0 1 UP 1 0 0 0 0IL1B 0 1 0 1 0 1 0 1 0 1 0 1 0 1 UP 1 0 0 0 0IL8 0 1 0 1 0 1 0 1 0 0 0 1 0 1 UP 0.8333 0 0 0.1667 0IRF1 0 1 0 1 0 1 0 1 0 1 0 1 0 1 UP 1 0 0 0 0ITGAM 0 1 0 1 0 1 0 1 0 1 0 1 0 1 UP 1 0 0 0 0NCF1 0 1 0 1 0 1 0 1 0 1 0 1 0 1 UP 1 0 0 0 0NCF2 0 1 0 1 0 1 0 1 0 1 0 1 0 1 UP 1 0 0 0 0NFKBIA 0 1 0 1 0 1 0 1 0 1 0 1 0 1 UP 1 0 0 0 0ORM1 – – 0 1 0 1 0 1 0 1 0 1 0 1 UP 1 0 0 0 0PLK1 – – 1 0 1 0 1 0 1 1 0 0 1 0 DOWN 0 0.6667 0.1667 0.1667 0S100A8 0 1 0 1 0 1 0 1 0 0 0 1 0 1 UP 0.8333 0 0 0.1667 0S100A9 0 1 0 1 0 1 0 1 0 1 0 1 0 0 UP 0.8333 0 0 0.1667 0SERPINA1 0 1 0 1 0 1 0 1 0 1 0 1 0 1 UP 1 0 0 0 0TRH – – 1 0 1 0 1 0 1 0 1 0 1 0 DOWN 0 1 0 0 0
The table shows the computed attractors for the six best optimized pruned networks, the predicted expression values and the confidence scores.All predictions obtained high confidence scores that reflect a good consensus in the attractors of different optimized pruned networks. Discrepanciesin the attractors are represented in bold. Genes without experimental expression values are highlighted in grey.
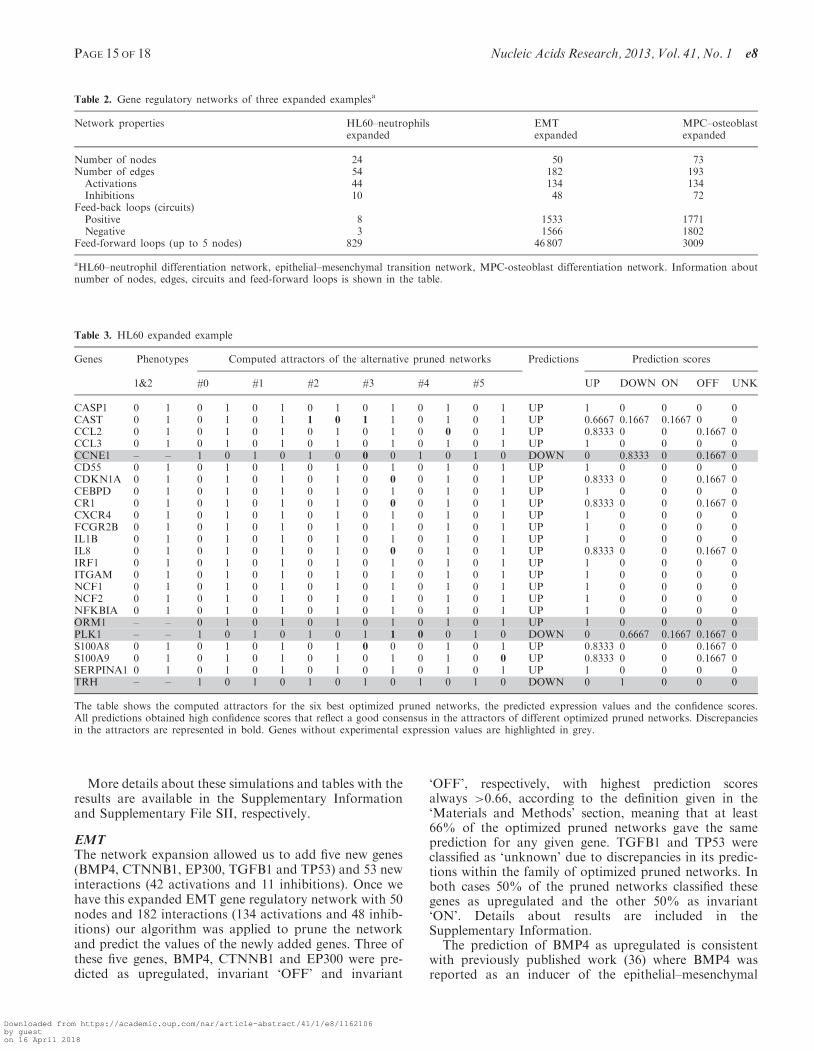
Table 2. Gene regulatory networks of three expanded examplesa
Network properties HL60–neutrophilsexpanded
EMTexpanded
MPC–osteoblastexpanded
Number of nodes 24 50 73Number of edges 54 182 193
Activations 44 134 134Inhibitions 10 48 72
Feed-back loops (circuits)Positive 8 1533 1771Negative 3 1566 1802
Feed-forward loops (up to 5 nodes) 829 46 807 3009
aHL60–neutrophil differentiation network, epithelial–mesenchymal transition network, MPC-osteoblast differentiation network. Information aboutnumber of nodes, edges, circuits and feed-forward loops is shown in the table.
PAGE 15 OF 18 Nucleic Acids Research, 2013, Vol. 41, No. 1 e8
Downloaded from https://academic.oup.com/nar/article-abstract/41/1/e8/1162106by gueston 16 April 2018
transition. CTNNB1 has been reported as downregulatedby activation of TRKB in the context of EMT-like trans-formation (37). Although we predict CTNNB1 gene asinvariant ‘OFF’ and not downregulated, the result is con-sistent with the absence of activity of this gene. Ep300 hasbeen reported as involved in a regulatory mechanismregulating the transcriptional suppressor/activator roleof ZEB1 in the epithelial–mesenchymal transition (38),acting as a cofactor for ZEB1 and causing the shifttowards epithelial characteristics. These mechanisms areconsistent with our prediction of Ep300 as inactive inthe opposite transition from epithelial to mesenchymal.
MPCThe network expansion allowed us to add six new genes(BCL2, CTNNB1, IL6, JUN, TGFB1 and TP53) and 70new interactions (49 activations and 21 inhibitions.Interestingly, three of these six genes were also includedin the expansion of the EMT example. Once we have thisexpanded MPC gene regulatory network with 73 nodesand 193 interactions (134 activations and 72 inhibitions)our algorithm was applied to prune the network andpredict the values of the newly added genes. Five ofthese six genes, CTNNB1, IL6, JUN, TGFB1 and TP53were predicted as invariant ‘OFF’, upregulated, invariant‘OFF’, upregulated and invariant ‘OFF’, respectively,with highest prediction scores always >0.5, according to
the definition given in the ‘Materials and Methods’section, meaning that at least 50% of the optimizedpruned networks gave the same prediction for any givengene. BCL2 was classified as ‘unknown’ due todiscrepancies in its predictions within the family ofoptimized pruned networks. A 50% of the prunednetworks classified this gene as upregulated and theother 50% as invariant ‘ON’. Details about results areincluded in the Supplementary Information. The predictedupregulation of IL6 during the osteoblast differentiationprocess is consistent with previously published worksabout the role of IL6 and its receptor (39). The predictedinactive state of TP53 is also consistent with previouslypublished works (40) where TP53-null osteoprogenitorcells have increased osteoblast maturation. TGFB1 hasbeen reported as osteoblastic cell proliferation inductor(41), a description consistent with the predictedupregulation.
Impact of removed interactions on the match withexpression values
To get some insights about the effect on the networks ofinteractions removed during the pruning process were-introduced some of the least frequent interactions inthe final population of optimized pruned networks. Inthe case of the HL60, re-introducing two interactions
Figure 8. (a) HL60 network. Genes in red are upregulated according to experimental expression values (b) HL60 expanded network. Genes in redand grey are upregulated and unknown, respectively. Six new genes and 15 new interactions (seven activations and eight inhibitions) were added: four(ORM1, CCNE1, TRH and PLK1) from the new list of genes and two (CDKN1A and CAST) from the original list of differentially expressed genesbetween the undifferentiated promyelocytic and differentiated neutrophil states. (c) Genes in pale red and pale blue correspond with genes predictedas upregulated and downregulated, respectively. (d) Prediction scores of HL60 expanded network.
e8 Nucleic Acids Research, 2013, Vol. 41, No. 1 PAGE 16 OF 18
Downloaded from https://academic.oup.com/nar/article-abstract/41/1/e8/1162106by gueston 16 April 2018
that were systematically removed in the pruning processproduced a dramatic decrease in the match with expres-sion data from 98.6% to 61.05%. In the case of EMT, there-introduction of the 10 least frequent interactions withinthe optimized pruned networks led to a decrease in thematch with expression data from 66.5% to 63.3%.Finally, in the MPC example the re-introduction of theten least frequent interactions within the optimizedpruned networks decreased the match with expressiondata from 57.5% to 55.8%. Details about re-introducedinteractions and scores are included in the SupplementaryInformation. As we can see, the removal of these inter-actions during the pruning process allows us to constructnetwork that better explain the experimental expressionvalues, increasing the reliability of the predictions.
DISCUSSION
Here we propose a method that enables us to generateoptimized pruned networks from literature to predict ex-pression values of a fraction of genes in a network basedon the knowledge of experimental stable gene expressionvalues of the remaining genes in the network. Thisapproach, which in particular searches for optimal popu-lations of solutions of pruned networks, overcomes thelimitations of classic optimization techniques that try toimprove a single solution exploring a limited portion ofthe solution space. This allows detecting alternativepruned network solutions caused by the multiplicity innetwork connectivity, which increases the probability ofachieving a global optimum that best fits theoretical geneexpression values to the experimental ones. It is worthnoting that the full agreement between experimental andpredicted gene expression values is limited by lack of in-formation on network connectivity.
In order to validate our method, we selected threeexamples (HL60–neutrophil differentiation, Epithelial–Mesenchymal transition, Mesodermal progenitor–Osteoblast differentiation) and showed the methodperformance in each case. Results show a good consist-ency between predicted and experimentally validated geneexpression values. Moreover, we expanded the HL60 generegulatory network with genes with no experimental geneexpression values in order to demonstrate the utility of ourmethod. Predicted expression values for these genes wereshown to be consistent with independent experimentalresults. In addition, we carried out an in silico perturb-ation analysis of each gene corresponding to thisexpanded HL60 gene regulatory network and found aconsistency in genes triggering the HL60-neutrophil dif-ferentiation. In particular, IRF1 has been reported asinductor of the myeloid differentiation of HL60 cells(35), which constitutes an experimental validation of thekey role played by this gene in HL60 differentiationprocesses.
A possible extension of the current method couldconsider not only the existence of steady states but alsocyclic stable states, which would require the existence ofnegative circuits. Such an extended method could be
applied to gene regulatory network inference in biologicalsystems with oscillatory behavior, such as cell cycles.In summary, the presented method constitutes a useful
tool for predicting missing or noisy gene expressionvalues, and therefore can be used for curating experimen-tal gene expression data and can help with data analysis,modeling and prediction.
SUPPLEMENTARY DATA
Supplementary Data are available at NAR Online:Supplementary Information, Supplementary Files I–Vand Supplementary References [10–14, 27–32,42–50].
ACKNOWLEDGEMENTS
I,C., A,K., A.L.B. and A.dS. participated in the design ofthe method and drafted the manuscript. IC constructedthe network data. I.C. and A.K. implemented the algo-rithms and performed data analysis. ALB coordinated thestudy. A.dS. conceived of the study, participated in itsdesign and coordination, and supervised the project.
FUNDING
Funding for open access charge: Luxembourg Centre forSystems Biomedicine (LCSB) and Life Sciences Researchunit (LSRU), University of Luxembourg.
Conflict of interest statement. None declared.
REFERENCES
1. Carro,M.S., Lim,W.K., Alvarez,M.J., Bollo,R.J., Zhao,X.,Snyder,E.Y., Sulman,E.P., Anne,S.L., Doetsch,F., Colman,H.et al. (2010) The transcriptional network for mesenchymaltransformation of brain tumours. Nature, 463, 318–325.
2. Margolin,A.A., Nemenman,I., Basso,K., Wiggins,C.,Stolovitzky,G., Dalla Favera,R. and Califano,A. (2006)ARACNE: an algorithm for the reconstruction of gene regulatorynetworks in a mammalian cellular context. BMC Bioinformatics,7(Suppl. 1), S7.
3. Huang,A.C., Hu,L., Kauffman,S.A., Zhang,W. and Shmulevich,I.(2009) Using cell fate attractors to uncover transcriptionalregulation of HL60 neutrophil differentiation. BMC Syst.Biol., 3, 20.
4. Sachs,K., Perez,O., Pe’er,D., Lauffenburger,D.A. and Nolan,G.P.(2005) Causal protein-signaling networks derived frommultiparameter single-cell data. Science, 308, 523–529.
5. Nelander,S., Wang,W., Nilsson,B., She,Q.B., Pratilas,C.,Rosen,N., Gennemark,P. and Sander,C. (2008) Models fromexperiments: combinatorial drug perturbations of cancer cells.Mol. Syst. Biol., 4, 216.
6. Gat-Viks,I. and Shamir,R. (2003) Chain functions and scoringfunctions in genetic networks. Bioinformatics, 19(Suppl. 1),i108–i117.
7. Saez-Rodriguez,J., Alexopoulos,L.G., Epperlein,J., Samaga,R.,Lauffenburger,D.A., Klamt,S. and Sorger,P.K. (2009) Discretelogic modelling as a means to link protein signalling networkswith functional analysis of mammalian signal transduction.Mol. Syst Biol., 5, 331.
8. Gat-Viks,I., Tanay,A. and Shamir,R. (2004) Modeling andanalysis of heterogeneous regulation in biological networks.J. Comput. Biol. J. Comput. Mol. Cell Biol., 11, 1034–1049.
9. Layek,R.K., Datta,A. and Dougherty,E.R. (2011) From biologicalpathways to regulatory networks. Mol. bioSyst., 7, 843–851.
PAGE 17 OF 18 Nucleic Acids Research, 2013, Vol. 41, No. 1 e8
Downloaded from https://academic.oup.com/nar/article-abstract/41/1/e8/1162106by gueston 16 April 2018
10. Kauffman,S.A. (1969) Metabolic stability and epigenesis inrandomly constructed genetic nets. J. Theor. Biol, 22, 437.
11. Kauffman,S.A. (1993) The Origins of Order. Oxford UniversityPress, New York, 1993.
12. Huang,S., Eichler,G., Bar-Yam,Y. and Ingber,D.E. (2005) Cellfates as high-dimensional attractor states of a complex generegulatory network. Phys Rev. Lett., 94, 128701.
13. Garg,A., Di Cara,A., Xenarios,I., Mendoza,L. and De Micheli,G.(2008) Synchronous versus asynchronous modeling of generegulatory networks. Bioinformatics, 24, 1917–1925.
14. Garg,A., Xenarios,I., Mendoza,L. and DeMicheli,G. (2007) Anefficient method for dynamic analysis of gene regulatory networksand in silico gene perturbation experimentsresearch incomputational molecular biology. In: Speed,T. and Huang,H.(eds), Lecture Notes in Computer Science, Vol. 4453. SpringerBerlin, Heidelberg, pp. , pp–76.
15. Mussel,C., Hopfensitz,M. and Kestler,H.A. (2010) BoolNet–an Rpackage for generation, reconstruction and analysis of Booleannetworks. Bioinformatics, 26, 1378–1380.
16. Gonzalez,A.G., Naldi,A., Sanchez,L., Thieffry,D. andChaouiya,C. (2006) GINsim: a software suite for the qualitativemodelling, simulation and analysis of regulatory networks. BioSystems, 84, 91–100.
17. Thomas,R., Thieffry,D. and Kaufman,M. (1995) Dynamicalbehavior of biological regulatory networks.1. Biological role offeedback loops and practical use of the concept of theloop-characteristic state. Bull. Mathemat. Biol., 57, 247–276.
18. Armananzas,R., Inza,I., Santana,R., Saeys,Y., Flores,J.L.,Lozano,J.A., Van de Peer,Y., Blanco,R., Robles,V., Bielza,C.et al. (2008) A review of estimation of distribution algorithms inbioinformatics. BioData mining, 1, 6.
19. Mendoza,L. and Xenarios,I. (2006) A method for the generationof standardized qualitative dynamical systems of regulatorynetworks. Theor. Biol. Med. Modelling, 3, 13.
20. Garg,A., Mendoza,L., Xenarios,I. and DeMicheli,G. (2007)Modeling of multiple valued gene regulatory networks. Conferenceproceedings: Annual International Conference of the IEEE Engineeringin Medicine and Biology Society IEEE Engineering in Medicine andBiology Society Conference 2007, Lyon, France, pp. 1398–1404.
21. Thomas,R. (1998) Laws for the dynamics of regulatory networks.Int. J. Dev. Biol., 42, 479–485.
22. Mendelson,E. (1970) Schaum’s Outline of Boolean Algebra andSwitching Circuits. McGraw-Hill, New York.
23. Speed,T.H.H. (2007) Regulatory networks and in-silico geneperturbation experiments. Research in Computational MolecularBiology. Springer Berlin, Heidelberg, pp. 62–76. Lect. NotesComput. Sci., 4453, 62–76.
24. Johnson,D.B. (1975) Finding all the elementary circuits of adirected graph. SIAM J. Comput., 4, 77–84.
25. Le Bechec,A., Zindy,P., Sierocinski,T., Petritis,D., Bihouee,A.,Le Meur,N., Leger,J. and Theret,N. (2008) M@IA: a modularopen-source application for microarray workflow and integrativedatamining. In Silico Biol., 8, 63–69.
26. Di Cara,A., Garg,A., De Micheli,G., Xenarios,I. and Mendoza,L.(2007) Dynamic simulation of regulatory networks using SQUAD.BMC Bioinformatics, 8, 462.
27. Gallagher,R., Collins,S., Trujillo,J., McCredie,K., Ahearn,M.,Tsai,S., Metzgar,R., Aulakh,G., Ting,R., Ruscetti,F. et al. (1979)Characterization of the continuous, differentiating myeloid cellline (HL-60) from a patient with acute promyelocytic leukemia.Blood, 54, 713–733.
28. Mollinedo,F., Lopez-Perez,R. and Gajate,C. (2008) Differentialgene expression patterns coupled to commitment and acquisitionof phenotypic hallmarks during neutrophil differentiation ofhuman leukaemia HL-60 cells. Gene, 419, 16–26.
29. Vetter,G., Le Bechec,A., Muller,J., Muller,A., Moes,M.,Yatskou,M., Al Tanoury,Z., Poch,O., Vallar,L. and Friederich,E.(2009) Time-resolved analysis of transcriptional events duringSNAI1-triggered epithelial to mesenchymal transition. Biochem.Biophys. Res. Commun., 385, 485–491.
30. Qi,H., Aguiar,D.J., Williams,S.M., La Pean,A., Pan,W. andVerfaillie,C.M. (2003) Identification of genes responsible forosteoblast differentiation from human mesodermal progenitorcells. Proc. Natl Acad. Sci. USA, 100, 3305–3310.
31. Novichkova,S., Egorov,S. and Daraselia,N. (2003) MedScan, anatural language processing engine for MEDLINE abstracts.Bioinformatics, 19, 1699–1706.
32. Daraselia,N., Yuryev,A., Egorov,S., Novichkova,S., Nikitin,A. andMazo,I. (2004) Extracting human protein interactions fromMEDLINE using a full-sentence parser. Bioinformatics, 20, 604–611.
33. Liekens,A.M., De Knijf,J., Daelemans,W., Goethals,B., DeRijk,P. and Del-Favero,J. (2011) BioGraph: unsupervisedbiomedical knowledge discovery via automated hypothesisgeneration. Genome Biol., 12, R57.
34. Kauffman,S. (2004) A proposal for using the ensemble approachto understand genetic regulatory networks. J. Theor. Biol., 230,581–590.
35. Shen,M., Bunaciu,R.P., Congleton,J., Jensen,H.A., Sayam,L.G.,Varner,J.D. and Yen,A. (2011) Interferon regulatory factor-1binds c-Cbl, enhances mitogen activated protein kinase signalingand promotes retinoic acid-induced differentiation of HL-60human myelo-monoblastic leukemia cells. Leukemia Lymphoma,52, 2372–2379.
36. Molloy,E.L., Adams,A., Moore,J.B., Masterson,J.C., Madrigal-Estebas,L., Mahon,B.P. and O’Dea,S. (2008) BMP4 induces anepithelial-mesenchymal transition-like response in adult airwayepithelial cells. Growth Factors, 26, 12–22.
37. Smit,M.A., Geiger,T.R., Song,J.Y., Gitelman,I. and Peeper,D.S.(2009) A twist-snail axis critical for TrkB-inducedepithelial-mesenchymal transition-like transformation, anoikisresistance, and metastasis. Mol. Cell. Biol., 29, 3722–3737.
38. Mizuguchi,Y., Specht,S., Lunz,J.G. 3rd, Isse,K., Corbitt,N.,Takizawa,T. and Demetris,A.J. (2012) Cooperation of p300 andPCAF in the control of microRNA 200c/141 transcription andepithelial characteristics. PloS One, 7, e32449.
39. Li,Y., Backesjo,C.M., Haldosen,L.A. and Lindgren,U. (2008) IL-6receptor expression and IL-6 effects change during osteoblastdifferentiation. Cytokine, 43, 165–173.
40. Lengner,C.J., Steinman,H.A., Gagnon,J., Smith,T.W.,Henderson,J.E., Kream,B.E., Stein,G.S., Lian,J.B. and Jones,S.N.(2006) Osteoblast differentiation and skeletal development areregulated by Mdm2-p53 signaling. J. Cell Biol., 172, 909–921.
41. Kassem,M., Kveiborg,M. and Eriksen,E.F. (2000) Production andaction of transforming growth factor-beta in human osteoblastcultures: dependence on cell differentiation and modulation bycalcitriol. Eur. J. Clin. Invest., 30, 429–437.
42. Breitman,T.R., Selonick,S.E. and Collins,S.J. (1980) Induction ofdifferentiation of the human promyelocytic leukemia cell line(HL-60) by retinoic acid. Proc. Natl Acad. Sci. USA, 77, 2936–2940.
43. Collins,S.J., Ruscetti,F.W., Gallagher,R.E. and Gallo,R.C. (1978)Terminal differentiation of human promyelocytic leukemia cellsinduced by dimethyl sulfoxide and other polar compounds.Proc. Natl Acad. Sci. USA, 75, 2458–2462.
44. McCarthy,D.M., San Miguel,J.F., Freake,H.C., Green,P.M.,Zola,H., Catovsky,D. and Goldman,J.M. (1983)1,25-dihydroxyvitamin D3 inhibits proliferation of humanpromyelocytic leukaemia (HL60) cells and inducesmonocyte-macrophage differentiation in HL60 and normalhuman bone marrow cells. Leukemia Res., 7, 51–55.
45. Rovera,G., Santoli,D. and Damsky,C. (1979) Humanpromyelocytic leukemia cells in culture differentiate intomacrophage-like cells when treated with a phorbol diester.Proc. Natl Acad. Sci. USA, 76, 2779–2783.
46. Smoot,M.E., Ono,K., Ruscheinski,J., Wang,P.L. and Ideker,T.(2011) Cytoscape 2.8: new features for data integration andnetwork visualization. Bioinformatics, 27, 431–432.
47. Somenzi,C.U.D.D. (2005) CU Decision Diagram Package Release2.4.1. University of Colorado at Boulder 2005.
48. Tomonaga,M., Golde,D.W. and Gasson,J.C. (1986) Biosynthetic(recombinant) human granulocyte-macrophage colony-stimulatingfactor: effect on normal bone marrow and leukemia cell lines.Blood, 67, 31–36.
49. Xie AaB,P.A. (1998) Efficient State Classification of Finite StateMarkov Chains. Proc of DAC, 1998.
50. Zinovyev,A., Viara,E., Calzone,L. and Barillot,E. (2008) BiNoM:a Cytoscape plugin for manipulating and analyzing biologicalnetworks. Bioinformatics, 24, 876–877.
e8 Nucleic Acids Research, 2013, Vol. 41, No. 1 PAGE 18 OF 18
Downloaded from https://academic.oup.com/nar/article-abstract/41/1/e8/1162106by gueston 16 April 2018