predicting biodiversity change and averting collapse in agricultural landscapes
TRANSCRIPT
LETTERdoi:10.1038/nature13139
Predicting biodiversity change and averting collapsein agricultural landscapesChase D. Mendenhall1,2, Daniel S. Karp1,2,3,4, Christoph F. J. Meyer5,6, Elizabeth A. Hadly2 & Gretchen C. Daily1,2,7,8,9
The equilibrium theory of island biogeography1 is the basis for esti-mating extinction rates2 and a pillar of conservation science3,4. Thedefault strategy for conserving biodiversity is the designation ofnature reserves, treated as islands in an inhospitable sea of humanactivity5. Despite the profound influence of islands on conservationtheory and practice3,4, their mainland analogues, forest fragments inhuman-dominated landscapes, consistently defy expected biodiver-sity patterns based on island biogeography theory6–13. Countrysidebiogeography is an alternative framework, which recognizes thatthe fate of the world’s wildlife will be decided largely by the hospi-tality of agricultural or countryside ecosystems12,14–17. Here we directlytest these biogeographic theories by comparing a Neotropical coun-tryside ecosystem with a nearby island ecosystem, and show thateach supports similar bat biodiversity in fundamentally differentways. The island ecosystem conforms to island biogeographic pre-dictions of bat species loss, in which the water matrix is not habitat.In contrast, the countryside ecosystem has high species richness andevenness across forest reserves and smaller forest fragments. Rela-tive to forest reserves and fragments, deforested countryside habitatsupports a less species-rich, yet equally even, bat assemblage. More-over, the bat assemblage associated with deforested habitat is com-positionally novel because of predictable changes in abundances bymany species using human-made habitat. Finally, we perform a globalmeta-analysis of bat biogeographic studies, spanning more than 700species. It generalizes our findings, showing that separate biogeo-graphic theories for countryside and island ecosystems are necessary.A theory of countryside biogeography is essential to conservationstrategy in the agricultural ecosystems that comprise roughly half ofthe global land surface and are likely to increase even further14.
The mark of humanity on the biosphere is now so widespread andprofound that many consider Earth to have entered a new geologicalepoch, the Anthropocene. This new epoch has brought an explosion ofcountryside ecosystems—arenas where villages, farmland and minimallyaltered habitats weave together to form intricate, human-dominatedecosystems—where the fate of much of the planet’s wildlife is beingdetermined14,15. Driven by the unrelenting pace of biodiversity loss andthe erosion of benefits that nature provides to society18, conservationscience has entered a new phase of prolific innovation19. Despite thebroadly defined and rapidly adapting framework of conservation science20,many of the biological theories at its centre persist, relatively unchanged.For example, theories from simple island ecosystems are still used in waysthat incorrectly estimate rates of species extinction21 and distort pro-jections of ecological risk in human-dominated ecosystems2,22, furtherexhausting an environmental, apocalyptic narrative23. Confusion andcontroversy surrounding the biodiversity crisis are substantially relatedto the overextension of the theory of island biogeography to human-dominated ecosystems, exacerbating a rift between conservation theoryand real-world practices20,24.
More than 30 years after the establishment of experiments6 designed totest the efficacy of island biogeographic theory in countryside ecosystems,we now know that wildlife often defies patterns predicted by islandbiogeography theory—emphasizing the critical role of human-madehabitats in ecosystems11,14–16,21,24. Despite its known shortcomings10,11,this theory persists as the basis for estimating extinction rates and mak-ing policy recommendations2,21,22. In response, a new, holistic view ofbiogeography is emerging for countryside ecosystems—one that incor-porates human-made habitats and their associated biodiversity14–17,24,25.
Here we predict that human-made habitats typical of many coun-tryside ecosystems will provide resources for many species to increasetheir abundances and mitigate the extirpation of populations and spe-cies. We propose three hypotheses to contrast countryside and islandbiogeographic theories empirically: first, that forest fragments in agri-cultural landscapes, in comparison with true islands, support more spe-cies and have lower rates of local extinction; second, that forest fragmentssurrounded by deforested habitat host more evenly distributed abundancesof species than do true islands surrounded by water because human-made habitats support individuals to differing degrees, through partor all of their life cycles; and third, that the expansion by many forestspecies into human-made habitats in the countryside ecosystem is gen-erating novel assemblages of biodiversity, whose members and theirabundances reflect species-specific responses to habitat change (Fig. 1).
We test these hypotheses by using data on Neotropical bat biodiver-sity, a group acutely sensitive to tropical deforestation9. First, we con-trast bat biodiversity within a mosaic of forest fragments embedded infarmland with that on true islands within a large, human-made lake.Second, we perform a meta-analysis of 29 studies of bat species rich-ness across countryside and island ecosystems worldwide, to assess thegenerality of our findings.
Specifically, we contrast bat biodiversity in a Costa Rican country-side dominated by coffee plantations and pastures with a Panamanianisland ecosystem dominated by water (Fig. 2). The two ecosystems areideal for testing biogeographic theories because of their approximatelysimilar ages, their close geographic proximity, their evolutionarily homol-ogous bat diversity and their similarly sized historical biogeographicspecies pools.
Bats were captured over a 2–4-year period in sites located in forestreserves, forest fragments and coffee plantations in the countryside eco-system and in mainland forests, mainland forest edges and true islandsin the island ecosystem26 (Fig. 2; see Methods). We captured 9,283 indi-vidual bats (4,282 and 5,001 individuals in the countryside and islandecosystem, respectively) and 62 bat species (43 and 33 species in thecountryside and island ecosystem, respectively; 14 species were sharedbetween the ecosystems). We found striking differences between eco-systems in three dimensions of biodiversity corresponding to our threehypotheses: species richness, species evenness and abundance-based assem-blage composition (Fig. 3 and Extended Data Tables 1–3; see Methods).
1Center for Conservation Biology, Stanford University, Stanford, California 94305, USA. 2Department of Biology, Stanford University, Stanford, California 94305, USA. 3Department of EnvironmentalScience, Policy & Management, University of California, Berkeley, California 94720, USA. 4The Nature Conservancy, Berkeley, California 94705, USA. 5Institute of Experimental Ecology, University of Ulm,89069 Ulm, Germany. 6Centre for Environmental Biology, University of Lisbon, 1749-016 Lisbon, Portugal. 7Woods Institute for the Environment, Stanford University, Stanford, California 94305, USA.8Global Economic Dynamics and the Biosphere, Royal Swedish Academy of Sciences, Stockholm SE-104 05, Sweden. 9Stockholm Resilience Centre, University of Stockholm, Stockholm SE-106 91,Sweden.
0 0 M O N T H 2 0 1 4 | V O L 0 0 0 | N A T U R E | 1
Macmillan Publishers Limited. All rights reserved©2014
To test our first hypothesis, we compared estimated species richnessin forest fragments with that in true islands (Fig. 3b). In agreement withthe species–area relationships that include human-made habitats12,13, thebest-fit statistical models that explained bat species richness in forestreserves and fragments in the countryside ecosystem suggested eitherno change in species richness between habitats (mean species estimated
per site 5 25 (s.d. 5 4); Extended Data Table 4) or little change (competingmodel with a difference in the corrected Akaike information criterion(DAICc) 5 0.220 yielded a mean species estimated per reserve site of28 (s.d. 5 5) and a mean species estimated per forest fragment site of23 (s.d. 5 3)). Fragment size and isolation distance were poor predictorsof species richness among countryside forest reserves and fragments(Extended Data Table 3).
Aligning with our first hypothesis and predictions of island biogeo-graphic theory, the estimated number of bat species in the island eco-system declined with isolation distance but increased with island size(Extended Data Table 4). The area of remaining tropical forest within1 km, a more ecologically relevant measure of habitat amount11, was the
!!!!!!!!!!!!!!!!!!!!!!!!!!!!!!!!!!!!!!!!!!!!!!!!!!!!!!!!!!!!!!!!!!!!!!!!!!!!!!!!!!!!!!!!!!!!!!!!!!!!!!!!!!!!!!!!!!!!!!!!!!!!!!!!!!!!!!!!!!!!!!!!!!!!!!!!!!!!!!!!!!!!!!!!!!!!!!!!!!!!!!!!!!!!!!!!!!!!!!!!!!!!!!!!!!!!!!!!!!!!!!!!!!!!!!!!!!!!!!!!!!!!!!!!!!!!!!!!!!!!!!!!!!!!!!!!!!!!!!!!!!!!!!!!!!!!!!!!!!!!!!!!!!!!!!!!!!!!!!!!!!!!!!!!!!!!!!!!!!!!!!!!!!!!!!!!!!!!!!!!!!!!!!!!!!!!!!!!!!!!!!!!!!!!!!!!!!!!!!!!!!!!!!!!!!!!!!!!!!!!!!!!!!!!!!!!!!!!!!!!!!!!!!!!!!!!!!!!!!!!!!!!!!!!!!!!!!!!!!!!!!!Countrysideecosystem
Reserve
Forest fragment
Coffee plantation
Mainland
Mainland edge
Island
Forest habitat
Deforested habitat
Water
Costa Rica
Panama
Islandecosystem
Sampling sites and habitats150 km
3 km3 km
Las Cruces Las Cruces Biological ReserveBiological Reserve
Costa RicaCosta Rica
PanamaPanama
3 km
Las Cruces Biological Reserve
Costa Rica
Panama
Barro ColoradoBarro ColoradoIslandIsland
3 km3 km
GatGatún Lake,n Lake,Panama CanalPanama Canal
Barro ColoradoIsland
3 km
Gatún Lake,Panama Canal
a ba b N
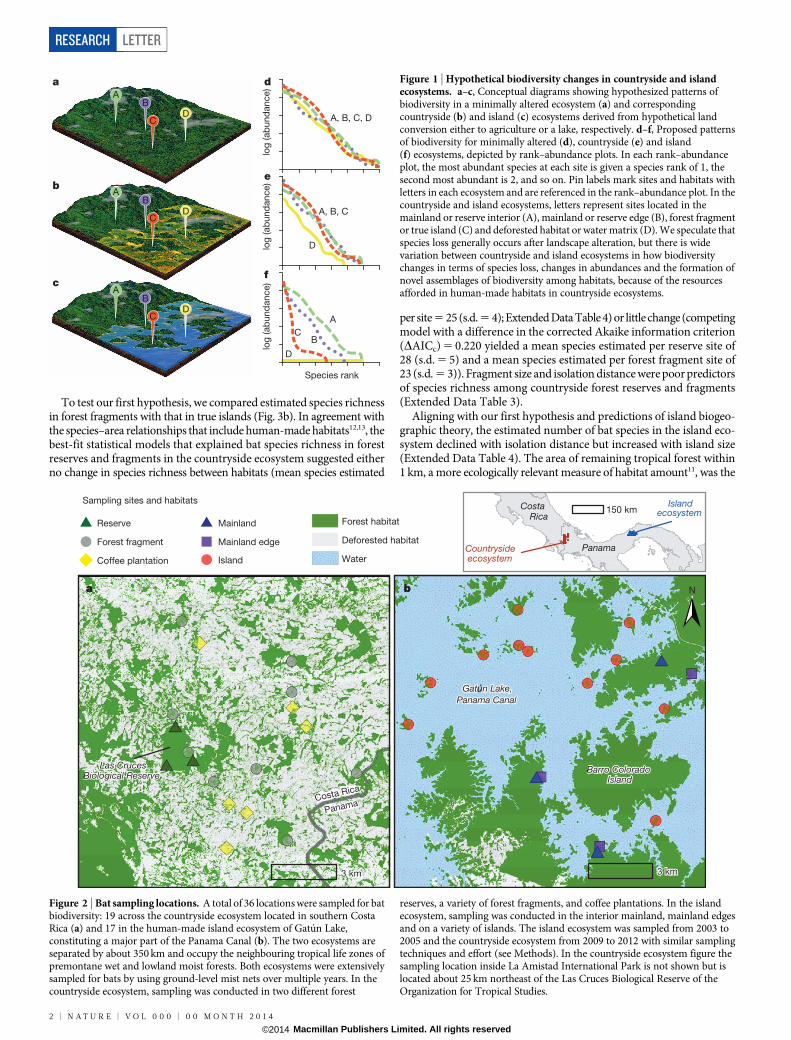
Figure 2 | Bat sampling locations. A total of 36 locations were sampled for batbiodiversity: 19 across the countryside ecosystem located in southern CostaRica (a) and 17 in the human-made island ecosystem of Gatun Lake,constituting a major part of the Panama Canal (b). The two ecosystems areseparated by about 350 km and occupy the neighbouring tropical life zones ofpremontane wet and lowland moist forests. Both ecosystems were extensivelysampled for bats by using ground-level mist nets over multiple years. In thecountryside ecosystem, sampling was conducted in two different forest
reserves, a variety of forest fragments, and coffee plantations. In the islandecosystem, sampling was conducted in the interior mainland, mainland edgesand on a variety of islands. The island ecosystem was sampled from 2003 to2005 and the countryside ecosystem from 2009 to 2012 with similar samplingtechniques and effort (see Methods). In the countryside ecosystem figure thesampling location inside La Amistad International Park is not shown but islocated about 25 km northeast of the Las Cruces Biological Reserve of theOrganization for Tropical Studies.
AB
CD
AB
CD
AB
CD
log
(ab
und
ance
)
A, B, C, D
log
(ab
und
ance
)lo
g (a
bun
dan
ce)
A, B, C
D
A
BC
D
Species rank
a
b
c
d
e
f
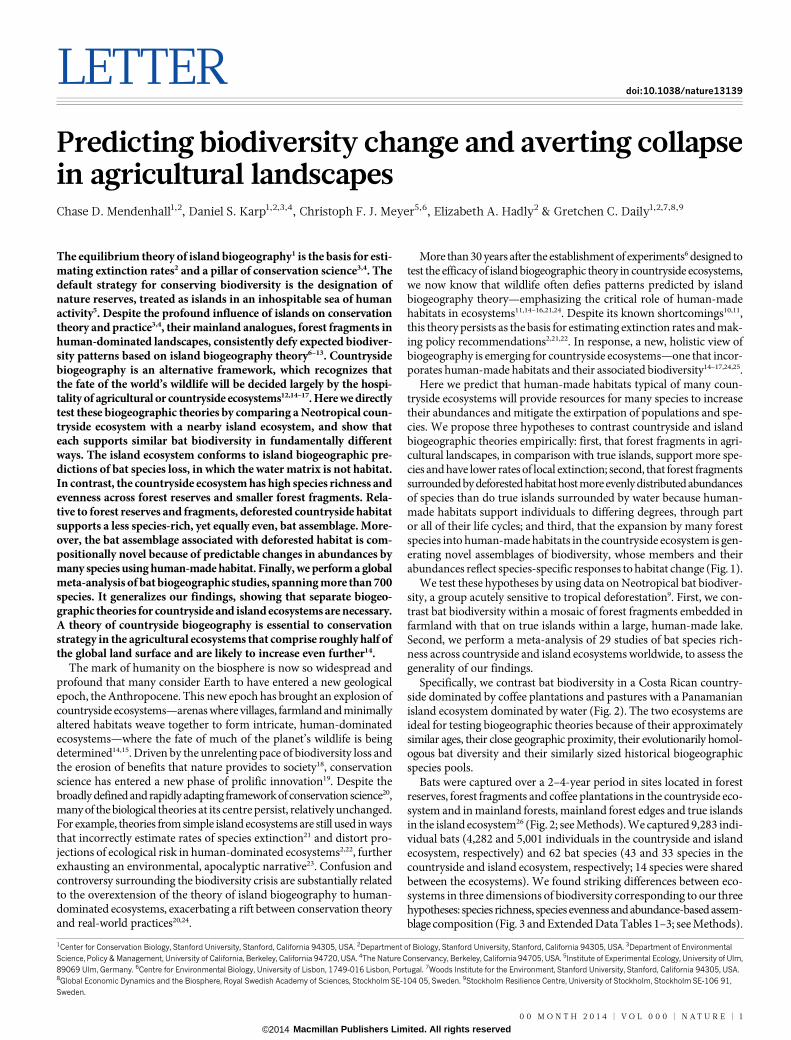
Figure 1 | Hypothetical biodiversity changes in countryside and islandecosystems. a–c, Conceptual diagrams showing hypothesized patterns ofbiodiversity in a minimally altered ecosystem (a) and correspondingcountryside (b) and island (c) ecosystems derived from hypothetical landconversion either to agriculture or a lake, respectively. d–f, Proposed patternsof biodiversity for minimally altered (d), countryside (e) and island(f) ecosystems, depicted by rank–abundance plots. In each rank–abundanceplot, the most abundant species at each site is given a species rank of 1, thesecond most abundant is 2, and so on. Pin labels mark sites and habitats withletters in each ecosystem and are referenced in the rank–abundance plot. In thecountryside and island ecosystems, letters represent sites located in themainland or reserve interior (A), mainland or reserve edge (B), forest fragmentor true island (C) and deforested habitat or water matrix (D). We speculate thatspecies loss generally occurs after landscape alteration, but there is widevariation between countryside and island ecosystems in how biodiversitychanges in terms of species loss, changes in abundances and the formation ofnovel assemblages of biodiversity among habitats, because of the resourcesafforded in human-made habitats in countryside ecosystems.
RESEARCH LETTER
2 | N A T U R E | V O L 0 0 0 | 0 0 M O N T H 2 0 1 4
Macmillan Publishers Limited. All rights reserved©2014
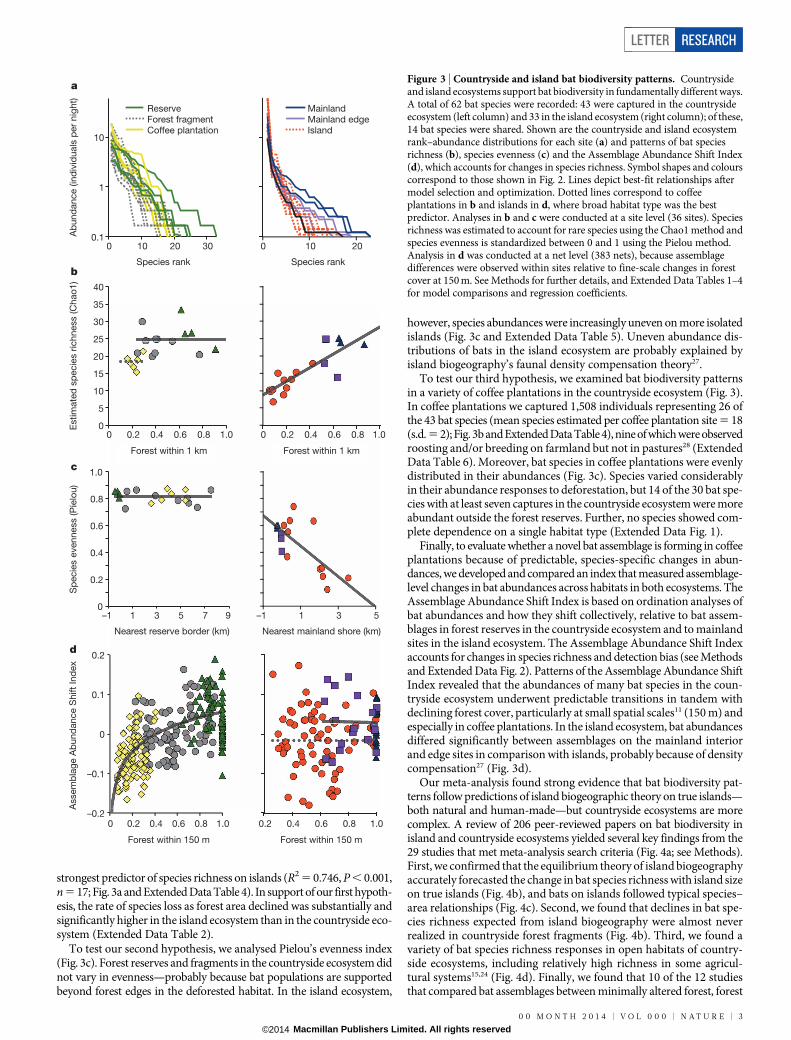
strongest predictor of species richness on islands (R2 5 0.746, P , 0.001,n 5 17; Fig. 3a and Extended Data Table 4). In support of our first hypoth-esis, the rate of species loss as forest area declined was substantially andsignificantly higher in the island ecosystem than in the countryside eco-system (Extended Data Table 2).
To test our second hypothesis, we analysed Pielou’s evenness index(Fig. 3c). Forest reserves and fragments in the countryside ecosystem didnot vary in evenness—probably because bat populations are supportedbeyond forest edges in the deforested habitat. In the island ecosystem,
however, species abundances were increasingly uneven on more isolatedislands (Fig. 3c and Extended Data Table 5). Uneven abundance dis-tributions of bats in the island ecosystem are probably explained byisland biogeography’s faunal density compensation theory27.
To test our third hypothesis, we examined bat biodiversity patternsin a variety of coffee plantations in the countryside ecosystem (Fig. 3).In coffee plantations we captured 1,508 individuals representing 26 ofthe 43 bat species (mean species estimated per coffee plantation site 5 18(s.d. 5 2); Fig. 3b and Extended Data Table 4), nine of which were observedroosting and/or breeding on farmland but not in pastures28 (ExtendedData Table 6). Moreover, bat species in coffee plantations were evenlydistributed in their abundances (Fig. 3c). Species varied considerablyin their abundance responses to deforestation, but 14 of the 30 bat spe-cies with at least seven captures in the countryside ecosystem were moreabundant outside the forest reserves. Further, no species showed com-plete dependence on a single habitat type (Extended Data Fig. 1).
Finally, to evaluate whether a novel bat assemblage is forming in coffeeplantations because of predictable, species-specific changes in abun-dances, we developed and compared an index that measured assemblage-level changes in bat abundances across habitats in both ecosystems. TheAssemblage Abundance Shift Index is based on ordination analyses ofbat abundances and how they shift collectively, relative to bat assem-blages in forest reserves in the countryside ecosystem and to mainlandsites in the island ecosystem. The Assemblage Abundance Shift Indexaccounts for changes in species richness and detection bias (see Methodsand Extended Data Fig. 2). Patterns of the Assemblage Abundance ShiftIndex revealed that the abundances of many bat species in the coun-tryside ecosystem underwent predictable transitions in tandem withdeclining forest cover, particularly at small spatial scales11 (150 m) andespecially in coffee plantations. In the island ecosystem, bat abundancesdiffered significantly between assemblages on the mainland interiorand edge sites in comparison with islands, probably because of densitycompensation27 (Fig. 3d).
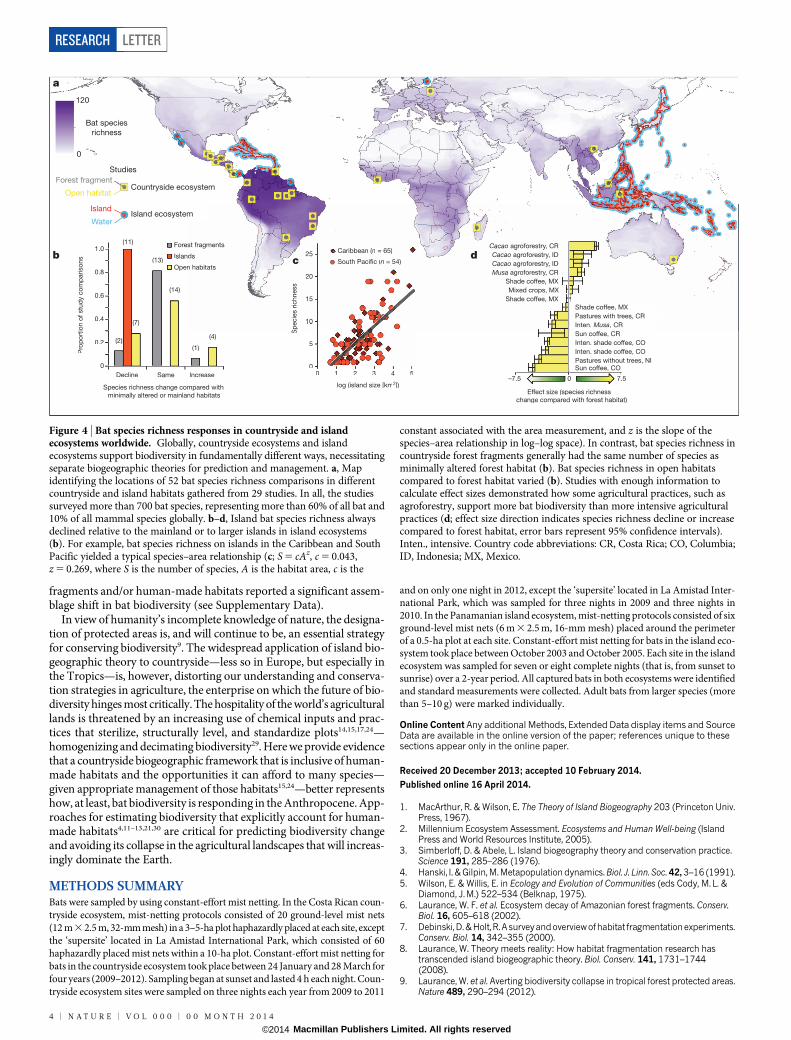
Our meta-analysis found strong evidence that bat biodiversity pat-terns follow predictions of island biogeographic theory on true islands—both natural and human-made—but countryside ecosystems are morecomplex. A review of 206 peer-reviewed papers on bat biodiversity inisland and countryside ecosystems yielded several key findings from the29 studies that met meta-analysis search criteria (Fig. 4a; see Methods).First, we confirmed that the equilibrium theory of island biogeographyaccurately forecasted the change in bat species richness with island sizeon true islands (Fig. 4b), and bats on islands followed typical species–area relationships (Fig. 4c). Second, we found that declines in bat spe-cies richness expected from island biogeography were almost neverrealized in countryside forest fragments (Fig. 4b). Third, we found avariety of bat species richness responses in open habitats of country-side ecosystems, including relatively high richness in some agricul-tural systems15,24 (Fig. 4d). Finally, we found that 10 of the 12 studiesthat compared bat assemblages between minimally altered forest, forest
–1 1 3 5
Nearest mainland shore (km)
0
0.2
0.4
0.6
0.8
1.0
–1 1 3 5 7 9
Nearest reserve border (km)
0 0.2 0.4 0.6 0.8 1.0 0
5
10
15
20
25
30
35
40
0 0.2 0.4 0.6 0.8 1.0
0.2 0.4 0.6 0.8 1.0 –0.2
–0.1
0
0.1
0.2
0 0.2 0.4 0.6 0.8 1.0
Ass
emb
lage
Ab
und
ance
Shi
ft In
dex
S
pec
ies
even
ness
(Pie
lou)
Forest within 1 km Forest within 1 km
Forest within 150 m Forest within 150 m
d
c
0 10 20
Mainland Mainland edge Island
0.1
1
10
0 10 20 30
Reserve Forest fragment Coffee plantation
Ab
und
ance
(ind
ivid
uals
per
nig
ht)
Species rank Species rank
a
b
Est
imat
ed s
pec
ies
richn
ess
(Cha
o1)
Figure 3 | Countryside and island bat biodiversity patterns. Countrysideand island ecosystems support bat biodiversity in fundamentally different ways.A total of 62 bat species were recorded: 43 were captured in the countrysideecosystem (left column) and 33 in the island ecosystem (right column); of these,14 bat species were shared. Shown are the countryside and island ecosystemrank–abundance distributions for each site (a) and patterns of bat speciesrichness (b), species evenness (c) and the Assemblage Abundance Shift Index(d), which accounts for changes in species richness. Symbol shapes and colourscorrespond to those shown in Fig. 2. Lines depict best-fit relationships aftermodel selection and optimization. Dotted lines correspond to coffeeplantations in b and islands in d, where broad habitat type was the bestpredictor. Analyses in b and c were conducted at a site level (36 sites). Speciesrichness was estimated to account for rare species using the Chao1 method andspecies evenness is standardized between 0 and 1 using the Pielou method.Analysis in d was conducted at a net level (383 nets), because assemblagedifferences were observed within sites relative to fine-scale changes in forestcover at 150 m. See Methods for further details, and Extended Data Tables 1–4for model comparisons and regression coefficients.
LETTER RESEARCH
0 0 M O N T H 2 0 1 4 | V O L 0 0 0 | N A T U R E | 3
Macmillan Publishers Limited. All rights reserved©2014
fragments and/or human-made habitats reported a significant assem-blage shift in bat biodiversity (see Supplementary Data).
In view of humanity’s incomplete knowledge of nature, the designa-tion of protected areas is, and will continue to be, an essential strategyfor conserving biodiversity9. The widespread application of island bio-geographic theory to countryside—less so in Europe, but especially inthe Tropics—is, however, distorting our understanding and conserva-tion strategies in agriculture, the enterprise on which the future of bio-diversity hinges most critically. The hospitality of the world’s agriculturallands is threatened by an increasing use of chemical inputs and prac-tices that sterilize, structurally level, and standardize plots14,15,17,24—homogenizing and decimating biodiversity29. Here we provide evidencethat a countryside biogeographic framework that is inclusive of human-made habitats and the opportunities it can afford to many species—given appropriate management of those habitats15,24—better representshow, at least, bat biodiversity is responding in the Anthropocene. App-roaches for estimating biodiversity that explicitly account for human-made habitats4,11–13,21,30 are critical for predicting biodiversity changeand avoiding its collapse in the agricultural landscapes that will increas-ingly dominate the Earth.
METHODS SUMMARYBats were sampled by using constant-effort mist netting. In the Costa Rican coun-tryside ecosystem, mist-netting protocols consisted of 20 ground-level mist nets(12 m 3 2.5 m, 32-mm mesh) in a 3–5-ha plot haphazardly placed at each site, exceptthe ‘supersite’ located in La Amistad International Park, which consisted of 60haphazardly placed mist nets within a 10-ha plot. Constant-effort mist netting forbats in the countryside ecosystem took place between 24 January and 28 March forfour years (2009–2012). Sampling began at sunset and lasted 4 h each night. Coun-tryside ecosystem sites were sampled on three nights each year from 2009 to 2011
and on only one night in 2012, except the ‘supersite’ located in La Amistad Inter-national Park, which was sampled for three nights in 2009 and three nights in2010. In the Panamanian island ecosystem, mist-netting protocols consisted of sixground-level mist nets (6 m 3 2.5 m, 16-mm mesh) placed around the perimeterof a 0.5-ha plot at each site. Constant-effort mist netting for bats in the island eco-system took place between October 2003 and October 2005. Each site in the islandecosystem was sampled for seven or eight complete nights (that is, from sunset tosunrise) over a 2-year period. All captured bats in both ecosystems were identifiedand standard measurements were collected. Adult bats from larger species (morethan 5–10 g) were marked individually.
Online Content Any additional Methods, Extended Data display items and SourceData are available in the online version of the paper; references unique to thesesections appear only in the online paper.
Received 20 December 2013; accepted 10 February 2014.
Published online 16 April 2014.
1. MacArthur, R. & Wilson, E. The Theory of Island Biogeography 203 (Princeton Univ.Press, 1967).
2. Millennium Ecosystem Assessment. Ecosystems and Human Well-being (IslandPress and World Resources Institute, 2005).
3. Simberloff, D. & Abele, L. Island biogeography theory and conservation practice.Science 191, 285–286 (1976).
4. Hanski, I. & Gilpin, M. Metapopulation dynamics. Biol. J. Linn. Soc. 42, 3–16 (1991).5. Wilson, E. & Willis, E. in Ecology and Evolution of Communities (eds Cody, M. L. &
Diamond, J.M.) 522–534 (Belknap, 1975).6. Laurance, W. F. et al. Ecosystem decay of Amazonian forest fragments. Conserv.
Biol. 16, 605–618 (2002).7. Debinski,D.&Holt, R.A surveyandoverviewofhabitat fragmentationexperiments.
Conserv. Biol. 14, 342–355 (2000).8. Laurance, W. Theory meets reality: How habitat fragmentation research has
transcended island biogeographic theory. Biol. Conserv. 141, 1731–1744(2008).
9. Laurance, W. et al. Averting biodiversity collapse in tropical forest protected areas.Nature 489, 290–294 (2012).
(2)
(13)
(1)
(11)
(7)
(14)
(4)
0
0.2
0.4
0.6
0.8
1.0
Decline Same Increase
Pro
por
tion
of s
tud
y co
mp
aris
ons
Forest fragments
Islands
Open habitats
0
5
10
15
20
25
0 1 2 3 4 5
Sp
ecie
s ric
hnes
s
log (island size [km2])
Caribbean (n = 65)
South Pacific (n = 54)
Sun coffee, CO Pastures without trees, NI Inten. shade coffee, CO Inten. shade coffee, CO Sun coffee, CR Inten. Musa, CR Pastures with trees, CR Shade coffee, MX
–7.5 0 7.5
Shade coffee, MX Mixed crops, MX
Shade coffee, MX Musa agroforestry, CR Cacao agroforestry, ID Cacao agroforestry, ID
Cacao agroforestry, CR
Effect size (species richness change compared with forest habitat)
Species richness change compared withminimally altered or mainland habitats
(2)
(13)
(1)
(11)
(7)
(14)
(4)
0
0.2
0.4
0.6
0.8
1.0
Decline Same Increase
Pro
por
tion
of s
tud
y co
mp
aris
ons
Forest fragments
Islands
Open habitats
0
5
10
15
20
25
0 1 2 3 4 5
Sp
ecie
s ric
hnes
s
log (island size [km2])
Caribbean (n(( = 65)
South Pacific (n (( = 54)
Sun coffee, CO Pastures without trees, NI Inten. shade coffee, CO Inten. shade coffee, CO Sun coffee, CR Inten. Musa, CR Pastures with trees, CR Shade coffee, MX
–7.5 0 7.5
Shade coffee, MX Mixed crops, MX
Shade coffee, MX Musa agroforestry, CR Cacao agroforestry, ID Cacao agroforestry, ID
Cacao agroforestry, CR
Effect size (species richness change compared with forest habitat)
Species richness change compared withminimally altered or mainland habitats
120
0
Bat speciesrichness
Studies
Countryside ecosystem
Island ecosystemIsland
Water
Forest fragment
Open habitat
a
b c d
Figure 4 | Bat species richness responses in countryside and islandecosystems worldwide. Globally, countryside ecosystems and islandecosystems support biodiversity in fundamentally different ways, necessitatingseparate biogeographic theories for prediction and management. a, Mapidentifying the locations of 52 bat species richness comparisons in differentcountryside and island habitats gathered from 29 studies. In all, the studiessurveyed more than 700 bat species, representing more than 60% of all bat and10% of all mammal species globally. b–d, Island bat species richness alwaysdeclined relative to the mainland or to larger islands in island ecosystems(b). For example, bat species richness on islands in the Caribbean and SouthPacific yielded a typical species–area relationship (c; S 5 cAz, c 5 0.043,z 5 0.269, where S is the number of species, A is the habitat area, c is the
constant associated with the area measurement, and z is the slope of thespecies–area relationship in log–log space). In contrast, bat species richness incountryside forest fragments generally had the same number of species asminimally altered forest habitat (b). Bat species richness in open habitatscompared to forest habitat varied (b). Studies with enough information tocalculate effect sizes demonstrated how some agricultural practices, such asagroforestry, support more bat biodiversity than more intensive agriculturalpractices (d; effect size direction indicates species richness decline or increasecompared to forest habitat, error bars represent 95% confidence intervals).Inten., intensive. Country code abbreviations: CR, Costa Rica; CO, Columbia;ID, Indonesia; MX, Mexico.
RESEARCH LETTER
4 | N A T U R E | V O L 0 0 0 | 0 0 M O N T H 2 0 1 4
Macmillan Publishers Limited. All rights reserved©2014
10. Lomolino,M.Acall for anewparadigmof islandbiogeography.Glob. Ecol. Biogeogr.9, 1–6 (2000).
11. Fahrig, L. Rethinking patch size and isolation effects. J. Biogeogr. 40, 1649–1663(2013).
12. Pereira, H. & Daily, G. Modeling biodiversity dynamics in countryside landscapes.Ecology 87, 1877–1885 (2006).
13. Guilherme, J. & Pereira, H. Adaptation of bird communities to farmlandabandonment in a mountain landscape. PLoS ONE 8, e73619 (2013).
14. Mendenhall, C., Kappel, C. & Ehrlich, P. in Encyclopedia of Biodiversity (ed. Levin, S.)347–360 (Elsevier, 2013).
15. Perfecto, I., Vandermeer, J. & Wright, A. Nature’s Matrix: Linking Agriculture,Conservation and Food Sovereignty 242 (Earthscan, 2009).
16. Daily, G. Ecological forecasts. Nature 411, 245 (2001).17. Daily, G., Ceballos, G., Pacheco, J., Suzan, G. & Sanchez-Azofeifa, A. Countryside
biogeography of Neotropical mammals. Conserv. Biol. 17, 1814–1826 (2003).18. Cardinale,B.et al. Biodiversity loss and its impactonhumanity. Nature 486,59–67
(2012).19. Kueffer, C. & Kaiser-Bunbury, C. Reconciling conflicting perspectives for
biodiversity conservation in the Anthropocene. Front. Ecol. Environ 10.1890/120201 (2013).
20. Kareiva, P. & Marvier, M. What is conservation science? Bioscience 62, 962–969(2012).
21. He, F. & Hubbell, S. Species–area relationships always overestimate extinctionrates from habitat loss. Nature 473, 368–371 (2011).
22. Gibson, L. et al. Near-complete extinction of native small mammal fauna 25 yearsafter forest fragmentation. Science 341, 1508–1510 (2013).
23. Heise, U. Sense of Place and Sense of Planet: The Environmental Imagination of theGlobal 250 (Oxford Univ. Press, 2008).
24. Tscharntke, T.et al.Global foodsecurity,biodiversity conservationand the futureofagricultural intensification. Biol. Conserv. 151, 53–59 (2012).
25. Rosenzweig, M.Win–Win Ecology: How the Earth’s SpeciesCan Survive in the Midst ofHuman Enterprise 211 (Oxford Univ. Press, 2003).
26. Meyer, C. & Kalko, E. Assemblage-level responses of phyllostomid bats to tropicalforest fragmentation. J. Biogeogr. 35, 1711–1726 (2008).
27. MacArthur, R., Diamond, J. & Karr, J. Density compensation in island faunas.Ecology 53, 330–342 (1972).
28. Reid, J., Holste, E. & Zahawi, R. Artificial bat roosts did not accelerate forestregeneration in abandoned pastures in southern Costa Rica. Biol. Conserv. 167,9–16 (2013).
29. Karp, D. et al. Intensive agriculture erodes b-diversity at large scales. Ecol. Lett. 15,963–970 (2012).
30. Rybicki, J. & Hanski, I. Species–area relationships and extinctions caused byhabitat loss and fragmentation. Ecol. Lett. 16, 27–38 (2013).
Supplementary Information is available in the online version of the paper.
Acknowledgements We thank P. Ehrlich, E. Kalko, F. Oviedo Brenes, R. Zahawi,L. Frishkoff, K. Holl, H. Kim Frank, M. Knope, J. L. Reid, A. Wrona, H. York and dozens offield assistants and Costa Rican landowners, and the communities and staffs of theOrganization for Tropical Studies, Las Cruces Biological Station, the SmithsonianTropical Research Institute and the Center for Conservation Biology at StanfordUniversity. Research was funded by the Winslow Foundation, the Moore FamilyFoundation, theGermanAcademicExchangeService, the GermanScienceFoundation,Peter and Helen Bing, Ralph and Louise Haberfeld, and a Restoration WorkshopResearch Grant through the Las Cruces Biological Station. C.D.M. and D.S.K. weresupported by National Science Foundation Graduate Research Fellowships.
Author Contributions C.D.M. and G.C.D. conceived the study. C.D.M. collected datafrom Costa Rica, performed analyses, and wrote the manuscript. C.F.J.M. collected datafrom Panama. D.S.K. assisted with key elements of analysis. All authors contributedideas to the manuscript.
Author Information Reprints and permissions information is available atwww.nature.com/reprints. The authors declare no competing financial interests.Readers are welcome to comment on the online version of the paper. Correspondenceand requests for materials should be addressed to C.D.M. ([email protected]).
LETTER RESEARCH
0 0 M O N T H 2 0 1 4 | V O L 0 0 0 | N A T U R E | 5
Macmillan Publishers Limited. All rights reserved©2014
METHODSCosta Rican countryside ecosystem bat sampling. The countryside investigationwas centred on the Las Cruces Biological Station and Wilson Botanical Gardenlocated in the Coto Brus Valley in southwestern Costa Rica. The Las Cruces Bio-logical Reserve (8u 479 N, 82u 579 W, 1,100 m above sea level), which serves as aregional biological baseline, protects about 280 ha of primary and mature secondaryforest (Fig. 2). The climate is characterized by a long rainy season (9–10 months)followed by a brief dry season, with an average annual rainfall of 3.4 m (ref. 31).Forests in the area are classified as premontane tropical wet forest32. More than60% of the Coto Brus Valley, once forested, has been converted into cropland andpasture since the 1950s (refs 33, 34). Despite relatively recent deforestation, sedi-ment core analyses reveal a robust, 3,000-year history of agriculture, forest clearingand fire in the region up to the sixteenth century35,36.
Bats were sampled in seven general habitat types at 19 locations within 25 km ofLas Cruces Biological Reserve (Fig. 2). All except one habitat type were representedby three sites located in (1) the Las Cruces Biological Reserve (three sites, located1.3, 1.8 and 1.8 km apart from their nearest neighbouring site in the reserve),(2) small forest fragments (1–20 ha, three sites), (3) 10–20-year-old secondary forestlocated in large forest fragments (50–75 ha, three sites), (4) thin strips of riparianremnant forests (10–100 m wide, three sites), (5) coffee plantations with about25% local tree cover on farms (three sites) and (6) coffee plantations with about 5%local tree cover (three sites). Moreover, one ‘supersite’, or a site equivalent in sam-pling effort to three sites (that is, 60 mist nets were deployed, instead of the normal20 mist nets at the other 18 sites), operated in La Amistad International Park locatedabout 25 km northeast of the Las Cruces Biological Reserve of the Organization forTropical Studies. Bat sampling was conducted using constant-effort mist netting.Mist-netting protocols consisted of 20 ground-level mist nets (12 m 3 2.5 m, 32-mmmesh) in a 3–5-ha plot haphazardly placed at each site, except the ‘supersite’ locatedin La Amistad International Park, which consisted of 60 haphazardly placed mistnets within a 10-ha plot. Constant-effort mist netting for bats took place between24 January and 28 March for four years (2009–2012). Sampling began at sunset andlasted for 4 h each night. Sites were sampled on three nights each year from 2009to 2011 and only one night in 2012, except the ‘supersite’ located in La AmistadInternational Park, which was sampled for three nights in 2009 and three nightsin 2010.
Captured bats were identified and standard measurements were collected by themethod of ref. 37. In 2009, bats were individually, but temporarily, marked by usingwing punches39. From 2010–2012 most bats (species weighing more than 5 g, exclud-ing juveniles) were marked with collars fashioned from self-locking cable ties andindividually numbered aluminium bands37. All bats were released on site shortlyafter identification, marking and measurement. All animals were handled andtreated ethically within the guidelines of the Institutional Animal Care and UseCommittee.Panamanian island ecosystem bat sampling. The island investigation was con-ducted on the human-made Gatun Lake (9u 119 N, 79u 539 W, 26 m above sea level)located in Central Panama. The 1914 damming of the Chagres River during con-struction of the Panama Canal created the lake and more than 200 islands rangingin size from less than 1 ha to the well-studied 1,560-ha Barro Colorado Island (BCI).Together with five adjacent mainland peninsulas, BCI forms the 5,400-ha BarroColorado Nature Monument and is contiguous with 22,000-ha Soberanıa NationalPark. The climate is strongly seasonal, with a long rainy season followed by a 4-monthdry season. Average annual rainfall is 2.1 m (ref. 41). Dry-season winds have affectedexposed islands, resulting in lower forest stature and tree species diversity40. Forestsin the area are classified as lowland tropical moist forest32.
Bats were sampled at six sites on the mainland peninsulas and at eleven sites onislands of various sizes and distances from the mainland. Bat sampling was con-ducted with constant-effort mist netting. Mist-netting protocols consisted of sixground-level mist nets (6 m 3 2.5 m, 16-mm mesh) placed around the perimeterof a 0.5-ha plot at each site. Constant-effort mist netting for bats took place betweenOctober 2003 and October 2005. Each site was sampled for seven or eight completenights (that is, sunset to sunrise) over a 2-year period. Bats were also captured witha single, large wall net. Bats captured in the wall net were excluded from this studybecause comparable sampling of the forest canopy was not conducted in the CostaRican countryside ecosystem.
Captured bats were identified, and standard measurements and demographicdata were collected as described in ref. 38. Most bats (species weighing more than10 g, excluding juveniles) were marked with individually numbered ball-chain neck-laces, or, in the case of larger species, with passive, subcutaneous transponders(EURO-ID). All bats were released on site shortly after marking and measurement.
Detailed site descriptions and additional methods and results in the Panama-nian island ecosystem can be found in ref. 26. All animals were handled and treatedethically within the guidelines of the Institutional Animal Care and Use Committee.
Landscape habitat classifications. To characterize landscape context in CostaRica we conducted a manual habitat classification by digitizing aerial photographs.Manual habitat classification was favoured over automated approaches to facilitatethe accurate identification of fine-scale landscape features in a complex country-side ecosystem32. Orthorectified aerial photographs used in the habitat classifica-tion were from Costa Rica Airborne Research and Technology Applications takenin 2003 and 2005 at 2 m spatial resolution. The habitat map covered 23,600 ha andincluded all sampling locations. The area was delineated to encompass all studylocations sampled by Stanford University’s Center for Conservation Biology (see,for example, refs 33, 42–48). The four ecosystem elements digitized at 2 m resolu-tion over this extent included forest elements (primary and secondary forest of allsizes, single trees, charral (early secondary forest), large shrubs, live fences, hedge-rows, non-native timber and fruit tree plantations, and non-native garden orna-mentals; Fig. 1); agricultural plots (the majority being sun coffee plantations, butalso including banana, plantain, tomato, and chili plantations); pasture; and houses,roads and other rural infrastructure. The final map was verified in the field frommultiple vantage points, compared with previous studies in the landscape and checkedwith 150 random samples across the landscape. Forest elements from the manualhabitat classification were used in analyses, whereas agricultural plots, pasture, houses,roads and other rural infrastructure were broadly treated as deforested habitat.
To characterize landscape context in Panama we used the ‘BCI Basemap’ dataset49 to delineate shorelines and islands of Lake Gatun with the ‘BCI LandcoverMap 2003’ data set50 to confirm forest, water and agriculture cover. Both data setswere accessed in early 2013 online through the Smithsonian Tropical ResearchInstitute GIS Data Portal (http://mapserver.stri.si.edu/geonetwork/). All islandswere completely forested except for 1 ha on a 16-ha island.Landscape explanatory variable calculations. Several relevant landscape metricswere calculated for the Costa Rican countryside ecosystem and the Panamanianisland ecosystem. The landscape metrics included measures that captured the relatedvariables of habitat area and habitat isolation. We also examined the importance ofspatial scale when measuring some of the landscape characteristics in this study. Thespecific landscape variables calculated and used in statistical modelling includedfragment/island size, isolation from contiguous tropical forest, general habitat type,and total forest area within a range of spatial scales. We do not report effects of forestor island fragmentation in this study because measures of fragmentation are oftenconfounded with area and merit a separate, in-depth analysis for clarity51.
First, we calculated forest fragment or island size in each ecosystem. In the Pana-manian island ecosystem each island was clearly distinct and the contiguous foresthabitat on each island was easily measured as the total size of the island. The forestfragments in the countryside ecosystem of Costa Rica, however, were slightly moredifficult to measure: forest fragments are not easily distinguished because of manyfine-scale forest connections across the farming landscape33 (Fig. 2). In the coun-tryside ecosystem nearly every forest fragment is connected to other forest rem-nants by live fences, riparian strips and fine-scale ribbons and clusters of trees thatweave across ridges, valleys and property boundaries. In most cases these fine-scaleforest connections are less than 20 m in width. We therefore arbitrarily omittedforest element connections that were less than 20 m in width to calculate forestfragment size in the countryside ecosystem.
Second, habitat isolation for the countryside and island ecosystems was mea-sured as the Euclidean distance from the centre of a site or mist net to the nearestedge of the Las Cruces Biological Reserve, La Amistad International Park or thenearest Panamanian mainland shore. Sites located inside reserves or mainland pen-insulas received negative values that measured their distances from reserve edgesand mainland shores.
Third, we included general and broad habitat types as discrete explanatoryvariables in our models. In the countryside ecosystem each site and net was labelledas reserve, forest fragment or coffee plantation. In the island ecosystem we assignedsites and nets into three categories: mainland interior, mainland edge or island,following ref. 26. Moreover, some categories were lumped during analysis to checkfor broader differences between islands and all mainland sites in the Panamanianisland ecosystem or between forest and non-forest sites in the Costa Rican country-side ecosystem.
Finally, we calculated the total forest area—contiguous or not—for each site andeach mist net at multiple spatial scales. For example, the total amount of forest areaat each site and mist net, including nearby forest fragments and neighbouring islands,was measured at radii ranging from 50 m to 1 km (measurements were calculatedat 50-m increments).Selecting spatial scales for measuring forest area. Countryside ecosystems andisland ecosystems differ substantially because of landscape context. Countrysideecosystems often contain high proportions of human-made habitat that, generally,includes considerable vegetative structure and, depending on the spatial scales usedto view habitat characteristics, many smaller ‘patches’ of habitat—often embodiedin the form of single trees or fallowed agricultural fields. The surrounding landscape
RESEARCH LETTER
Macmillan Publishers Limited. All rights reserved©2014
context in island ecosystems is strictly homogeneous, except for neighbouringislands and the mainland shore. In view of the substantial differences in landscapecontext and recently proposed ideas, specifically the habitat amount hypothesis11,we champion total habitat area within an appropriately selected spatial scale as amore ecologically relevant measure of habitat.
We used an established approach described in detail in ref. 33 to compare andselect appropriate spatial scales during analysis. All results were robust to forestarea measured at different spatial scales. For clarity, two spatial scales were selectedto measure forest area after a priori and post hoc analyses, and statistical modellingrevealed that few differences in results were observed when forest area was mea-sured among a broad range of spatial scales. We chose spatial scales that emergedas strong predictors after we verified that forest area measured at all spatial scalesgenerally agreed. Site-level analyses used forest area measured within a 1-km spatialscale, and net-level analyses used forest area measured within a 150-m spatial scale.We do not report the nuances observed between different spatial scales in this study,which merit a separate, in-depth analysis to determine their ecological relevance11.Dimensions of bat biodiversity: species richness estimates. Bat captures in thecountryside and island ecosystems were used to inform three dimensions of bio-diversity metrics at the resolution of a site or a mist net. The first dimension of batbiodiversity was an estimate of bat species richness at each site (that is, the estimatednumber of unique species at each site). Chao species richness estimates of batswere used because they perform well with small sample sizes and uneven samplingeffort52. Chao species richness estimates were used in analyses except when thestandard error surrounding the species richness estimate was undefined whencalculated in R v.2.15.2 with the vegan package. In cases in which species richnessestimates were obtuse, the observed species richness (that is, the observed numberof unique species captured at a given site) was used in analysis. In all, four sitesused observed species richness values (two Costa Rican coffee plantation sites, oneCosta Rican forest fragment site and one Panamanian island site). Results wereconsistent when observed species richness was used, but the inclusion of Chaospecies richness estimates dealt with differences in sampling effort between studiesin Costa Rica and Panama.Dimensions of bat biodiversity: species evenness estimates. The second dimen-sion of bat biodiversity is Pielou’s species evenness index; this was calculated foreach site. Species evenness refers to how equal the assemblage of bat species is numer-ically, or how close in abundance species at a site are. Pielou’s species evennessindex is based on the Shannon–Weaver diversity index (denoted by H’):
H0~{XS
i~1
pi ln pi ð1Þ
In the Shannon–Weaver diversity index, pi is the proportion of species i at a site,and S is the number of species at a site. Pielou’s species evenness index, J, was thencalculated for each site; it is defined as
J~H0
ln Sð2Þ
Dimensions of bat biodiversity: Assemblage Abundance Shift Index. The thirddimension of bat biodiversity in this study centred on changes in abundance-basedassemblages of bats relative to bat assemblages found in the baseline habitats foreach ecosystem. Bat assemblage abundance shifting was calculated for each mistnet because field observations and preliminary analyses of bat assemblages in thecountryside ecosystem suggested that differences in the bat assemblage existedbetween nets within the same site relative to a net’s proximity to nearby trees, coffeeplantations and pastures. For example, patterns of assemblage differences emergednightly at a given site when field assistants compared species and abundances ofbats extracted from groups of nets closer to habitat transitions with those of batscaptured in nets located uniformly in forested habitat or coffee plantations.
The degree of assemblage abundance shift was based on an index we developedthat compared a net’s abundance-based assemblage similarity to that of the set ofnets located in the Las Cruces Biological Reserve and La Amistad InternationalPark, in the countryside ecosystem, or the Panamanian mainland, in the islandecosystem. We used Chao abundance-based similarity coefficients to calculate thesimilarity of a net’s abundance-based assemblage to that of all the nets in each eco-system baseline. The Chao abundance-based similarity coefficient measures sim-ilarity between two samples, and implements a Jaccard-type index that accountsfor unseen, shared species; it is defined as
Jabd U ,Wð Þ~ UW
UzW{UWð3Þ
In equation (3), U and W represent estimates of each site in such a way that theyare adjusted for unseen shared species. To account for the effect of unseen shared
species, the index uses frequencies of observed, rare, shared species to estimate anappropriate adjustment term that accounts for the unseen, shared species. Theadjustment is achieved by using the following equations for each estimate:
U~XD12
i~1
Xi
nz
(m{1)
mfz1
2fz2
XD12
i~1
Xi
nI(Yi~1) ð4Þ
W~XD12
i~1
Yi
mz
(n{1)
nfz1
2fz2
XD12
i~1
Yi
mI(Xi~1) ð5Þ
In equations (4) and (5) each function accounts for unseen, shared species betweentwo sites by using the following logic: if a random sample of n individuals (sample 1)is taken from site 1 and a random sample of m individuals (sample 2) from site 2,and species frequencies in each sample are denoted as (X1, X2, …, XS1) and (Y1,Y2, …, YS2), respectively, with zero used where species were missing from the sam-ple. Then the pairs of frequencies for the S12 species truly shared by the two assem-blages are (X1, Y1)(X2, Y2) … (XS12, YS12). Assume that D12 of the S12 shared speciesavailable are actually observed in both samples and that their frequencies are thefirst D12 pairs. Thus, an additional S12 2 D12 species are shared by the two assem-blages but absent from one or both samples.
In equations (4) and (5) the indicator function I(expression) is defined such thatI 5 1 if the expression is true, and I 5 0 if false. Let f1z~
XD12
i~1I Xi~1,Yi§1½ � be
the observed number of shared species that are singletons (Xi 5 1) in sample 1(these species must be present in sample 2, but may have any abundance). Now, letf21 represent the observed number of shared species that are doubletons (Xi 5 2)in sample 1. Similarly, f11 and f12 are the observed number of shared species thatare, respectively, singletons (Yi 5 1) and doubletons (Yi 5 2) in sample 2. Iff12 5 0 or f21 5 0, replace f12 and f21 in the denominators by f12 1 1 or f21 1
1, respectively. If U or W is greater than 1, then it is replaced by 1. See ref. 53 formore details, explanations and derivation of equations.
The Chao abundance-based similarity coefficients were calculated for each net(denoted as k) with all nets in the Las Cruces Biological Reserve and La AmistadInternational Park in the countryside ecosystem, or the mainland in the Pana-manian island ecosystem (denoted as bi), using variations of equations (3) and (4)in R v.2.15.2 with the vegan package. The arithmetic means of all Chao abundance-based similarity coefficients for each net with each baseline sample were calculated(denoted as b):
Mb~1n:Xn
i~1
Jabd k,bið Þ ð6Þ
The mean Chao abundance-based similarity coefficients for each baseline werealso calculated relative to all baseline nets for each ecosystem. Finally, we standar-dized all values by dividing each Mb value by the maximum Mb value in eachecosystem (Mbmax):
M~Mb
Mbmaxð7Þ
The resulting values for each net (that is, M) are between 0 and 1, and represent theabundance-based assemblage similarity of a single net to all the nets located in thecorresponding ecosystem baseline, while accounting for detection biases of unseen,shared species. Therefore, the closer a net’s value is to 1 in the countryside eco-system, the more similar that net is in bat species composition and abundances tothose of all the nets located inside the Las Cruces Biological Reserve and La AmistadInternational Park. Similarly, the closer a net’s value is to 0 in the island ecosystem,the less similar that net is in bat species composition and abundances to those of allthe nets located on the Panamanian mainland.
As calculated in equations (3)–(7), the Abundance-Based Assemblage Simila-rity Index (that is, M) is dependent on changes in species richness and abundances.The Abundance-Based Assemblage Similarity Index was therefore modified toaccount for species richness. To account for the effect of species richness in theAbundance-Based Assemblage Similarity Index we performed a regression betweenthat index and the observed species richness values for each net and calculated theresiduals from the best-fit model (Extended Data Fig. 2). Nets with five or fewertotal captures were excluded from the Assemblage Shift Index (21 nets from thecountryside ecosystem and zero nets from the island ecosystem). Positive residualsindicate a greater similarity than expected in assemblage abundances of a net tothose of all nets in the corresponding baseline. Negative residuals indicate greaterdifferences in the assemblage abundances than expected.
In its final form, the Assemblage Abundance Shift Index was independent ofobserved species richness, estimated species richness, species evenness, and totalbat abundance. The Assemblage Abundance Shift Index is a holistic measure of howthe bat assemblage changes in abundances across space, independently of changesin species richness.
LETTER RESEARCH
Macmillan Publishers Limited. All rights reserved©2014
Statistical analyses. All statistical analyses were conducted in a GLMM (generalizedlinear mixed effects models) framework54. Analyses were conducted in R v.2.15.2(R Development Core Team 2012) and relied extensively on vegan, lme4, nlme andAICcmodavg packages. All variables were tested for normality to meet assump-tions of statistical tests.
In our first study contrasting a Costa Rican countryside ecosystem and an islandecosystem, we conducted three suites of analyses for each dimension of bat biodi-versity (that is, species richness estimates, species evenness estimates, and the Assem-blage Abundance Shift Index). Each set of analyses was designed to identify theeffects of ecosystem change on bat biodiversity—specifically concentrating on fragment/island size, isolation from contiguous tropical forest, general habitat type, and totalforest area within a wide range of spatial scales (see the section above on selectingspatial scales for measuring forest area). All models avoided collinearity of explan-atory variables by disqualifying any linear models that used multiple dependentvariables (for example, fragment or island size and total forest area are collinearand were therefore not used in the same statistical model to explain any of the batbiodiversity response variables).
At the onset of each suite of analyses we explicitly tested for interaction termsbetween landscape variables and the ecosystem type (that is, countryside ecosys-tem versus island ecosystem). The logic behind testing for interaction terms stemsfrom the fact that the countryside ecosystem and the island ecosystem are separatedby about 350 km; they have slightly different species pools and therefore differentintercepts within a linear modelling framework. We therefore tested statisticallyfor differences between ecosystems through differences in slopes of functions byusing interaction terms in our modelling, rather than only looking for differencesin the intercept value.
In each suite of analyses we first tested for differences between the countrysideecosystem and the island ecosystem and restricted our analysis to forested habitatsby excluding data from coffee plantations (Extended Data Tables 1 and 2). Afterdifferences were confirmed between the two ecosystem types, the second suite ofanalyses included data from coffee plantations and focused on fitting the best modeland selecting the best landscape variable or variables for predicting the bat biodi-versity response variable of interest (for example estimated species richness, esti-mated species evenness or the Assemblage Abundance Shift Index).
After differences between ecosystems were tested, each ecosystem was modelledindependently (that is, analyses were performed with data from only a single eco-system, rather than including a factor within each model that denoted ecosystemtype as countryside ecosystem or island ecosystem). Nonlinear functions were includedin ecosystem-specific analyses, and the most relevant models are presented inExtended Data Tables 3 and 4.
In all analyses, models were compared by using the corrected Akaike informa-tion criterion (AICc) and maximum likelihood. Because landscape forest areas mea-sured at multiple spatial scales were autocorrelated and collinear, we identified asingle appropriate spatial scale by comparing models using AICc and maximumlikelihood. Little differences in AICc values were observed between landscapevariables measured at different spatial scales.
In the GLMM framework we made use of spatial correlation structures to avoidissues of spatial autocorrelation31. The UTM (Universal Transverse Mercator) coor-dinates of each site or net, measured as the centre of each site or net, were used toaccount for spatial autocorrelation between sites and nets. Models were comparedthat used a variety of correlation structures, including ‘corSpher’, ‘corLin’, ‘corRatio’,‘corGaus’ and ‘corExp’ (see pp. 161–170 of ref. 54 for more information). The‘corRatio’ correlation structure, or the ratio correlation structure, consistently per-formed best in all models and in all analyses. All analyses make use of the ratio cor-relation structure with a ‘nugget’. Moreover, site identity was included as a fixed,random effect in analyses conducted at the net level.
The three suites of analyses focused on identifying how the response variablesof, respectively, bat species richness estimates, bat species evenness estimates, andthe bat Assemblage Abundance Shift Index respond to fragment or island size,isolation from contiguous tropical forest, general habitat type, and total forest areawithin a range of spatial scales. The model comparisons for each suite of analysesare presented in Extended Data Tables 1–4. Results from models that includedforest area measured at multiple spatial scales are not presented for clarity, but fewdifferences between models were observed (see the section above on selecting spa-tial scales for measuring forest area).Meta-analysis of studies of bat biodiversity across countryside and island eco-systems worldwide. We searched for all relevant research articles from any timeperiod by using the following Web of Science search query: Title 5 (bat) AND
Topic 5 (conservation and fragment*), Timespan 5 All years, Search language 5
English. Moreover, we asked authors of many of the research articles we reviewedto ensure that our list was representative—especially authors whose studies wereconducted outside the Neotropics (Fig. 4a). From this list we reviewed articles andretained studies that included comparisons between habitats, studies that sampleda minimum of ten different bat species, and studies with replicate sampling sitesand similar sampling effort in each habitat type.
For studies that met our criteria, we compared species richness between habitattypes in each study. Habitat types in each study fell into the following three broadcategories: minimally altered reference habitats (for example forest reserves or con-tiguous mainland forest); fragmented or isolated reference habitat (for exampleforest fragments and natural or human-made, true islands); or human-made ornaturally open habitat (for example cropland, pasture and, in one study, Africansavanna). When sufficient data were available, the bias-corrected Hedge’s g* wascalculated and used to determine whether bat species richness differed betweenhabitat types. Reported statistical differences in species richness were used instudies if there were insufficient data to calculate Hedge’s g*.
Wide arrays of metrics were used across studies to report bat assemblage shiftsbetween habitat types. Because it is difficult to compare multiple measures of batassemblage shift between studies, we chose to report assemblage shifts in eachstudy as observed or unobserved. The detailed list of studies used is presented inSupplementary Data.
31. Stiles, F. & Skutch, A. A Guide to the Birds of Costa Rica 632 (Instituto Nacional deBiodiversidad, 1989).
32. Holdridge, L. R. Life Zone Ecology 146 (Tropical Science Center, 1979).33. Mendenhall, C., Sekercioglu, C., Oviedo Brenes, F., Ehrlich, P. & Daily, G. Predictive
model for sustaining biodiversity in tropical countryside. Proc. Natl Acad. Sci. USA108, 16313–16316 (2011).
34. Sansonetti, V.QuemeMisNaves en estas Montanas: LaColonizacion de laAltiplaniciede Coto Brus y la Funcadion de San Vito de Java 99 (Jimenez & Tanzi, 1995).
35. Clement, R. & Horn, S. Pre-Columbian land-use history in Costa Rica. Holocene 11,419–426 (2001).
36. Mann, C. 1491: New Revelations of the Americas before Columbus 541 (Knopf,2005).
37. Kunz, T. & Parsons, P. Ecological and Behavioral Methods for the Study of Bats 920(Johns Hopkins Univ. Press, 2011).
38. Leigh, E. Jr, Rand, S. & Windsor, D. The Ecology of a Tropical Forest: SeasonalRhythms and Long-Term changes 480 (Smithsonian Institution Press, 1982).
39. Bonaccorso, F., Smythe, N.& Humphrey, S. Improved techniques for markingbats.J. Mamm. 57, 181–182 (1976).
40. Leigh, E. Jr, Wright, S., Herre, E. & Putz, F. The decline of tree diversity on newlyisolated tropical islands. Evol. Ecol. 7, 76–102 (1993).
41. Handley, C. Jr, Wilson, D. & Gardner, A. Demography and Natural History of theCommon Fruit Bat, Artibeus jamaicensis, on Barro Colorado Island, Panama 173(Smithsonian Institution Press, 1991).
42. Mendenhall, C., Daily, G. & Ehrlich, P. Improving estimates of biodiversity loss. Biol.Conserv. 151, 32–34 (2012).
43. Daily, G. C., Ehrlich, P. R. & Sanchez-Azofeifa, G. A. Countryside biogeography: useof human-dominated habitats by the avifauna of southern Costa Rica. Ecol. Appl.11, 1–13 (2001).
44. Ricketts, T., Daily, G., Ehrlich, P. & Fay, J. Countryside biogeography of moths in afragmented landscape. Conserv. Biol. 15, 378–388 (2001).
45. Horner-Devine, M., Daily, G., Ehrlich, P. & Boggs, C. Countryside biogeography oftropical butterflies. Conserv. Biol. 17, 168–177 (2003).
46. Mayfield, M. & Daily, G. Countryside biogeography of Neotropical herbaceous andshrubby plants. Ecol. Appl. 15, 423–439 (2005).
47. Brosi, B., Daily, G., Shih, T., Oviedo Brenes, F. & Duran, G. The effects of forestfragmentation on bee communities in tropical countryside. J. Appl. Ecol. 45,773–783 (2008).
48. Karp, D. et al. Forest bolsters bird abundance, pest control and coffee yield. Ecol.Lett. 16, 1339–1347 (2013).
49. Smithsonian Tropical Research Institute GIS Section. BCI Basemap. Scale1:50 000 (Smithsonian, 2012).
50. Panama Canal Authority Remote Sensing Unit. BCI Landcover Map 2003(Cobertura Boscosa 2003—Area de BCI). (Panama Canal Authority, 2003).
51. Fahrig, L. Rethinking patch size and isolation effects. J. Biogeogr. 40, 1649–1663(2013).
52. Chao, A. Estimating the population size for capture-recapture data with unequalcatchability. Biometrics 43, 783–791 (1987).
53. Chao,A.,Chazdon, R., Colwell, R.&Shen,T. A new statistical approach for assessingsimilarity of species composition with incidence and abundance data. Ecol. Lett. 8,148–159 (2005).
54. Zuur, A., Ieno, E., Walker, N., Saveliev, A. & Smith, G. Mixed Effects Models andExtensions in Ecology with R 574 (Springer, 2009).
RESEARCH LETTER
Macmillan Publishers Limited. All rights reserved©2014
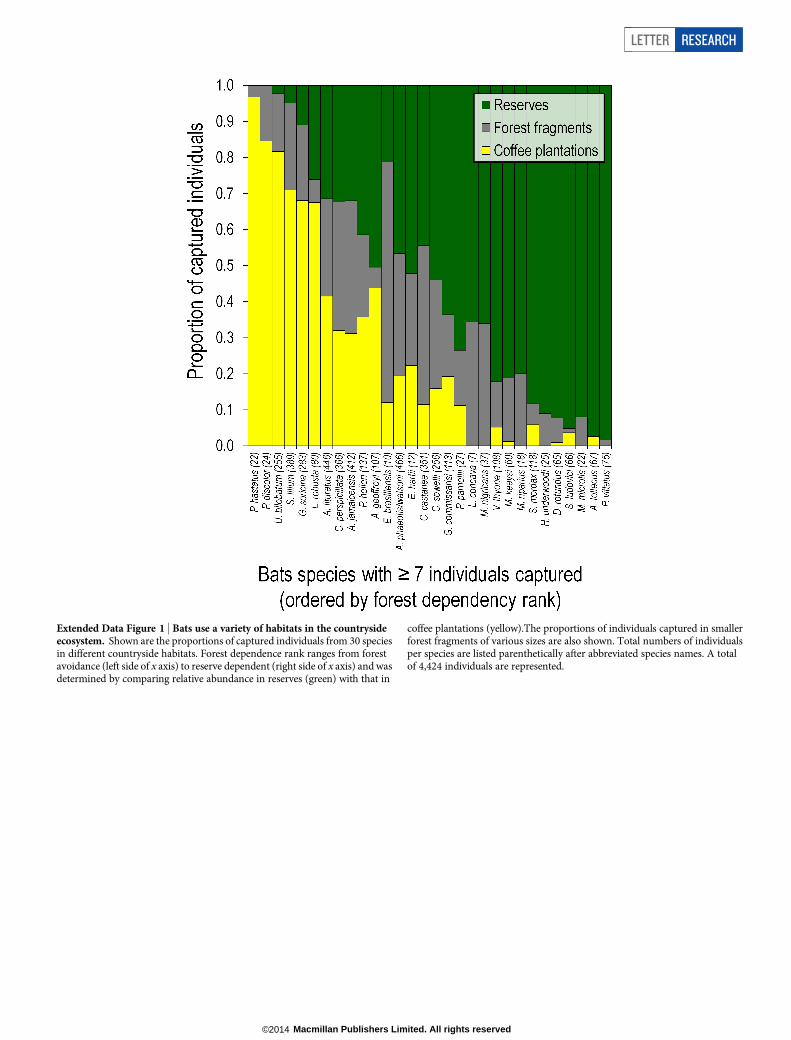
Extended Data Figure 1 | Bats use a variety of habitats in the countrysideecosystem. Shown are the proportions of captured individuals from 30 speciesin different countryside habitats. Forest dependence rank ranges from forestavoidance (left side of x axis) to reserve dependent (right side of x axis) and wasdetermined by comparing relative abundance in reserves (green) with that in
coffee plantations (yellow).The proportions of individuals captured in smallerforest fragments of various sizes are also shown. Total numbers of individualsper species are listed parenthetically after abbreviated species names. A totalof 4,424 individuals are represented.
LETTER RESEARCH
Macmillan Publishers Limited. All rights reserved©2014
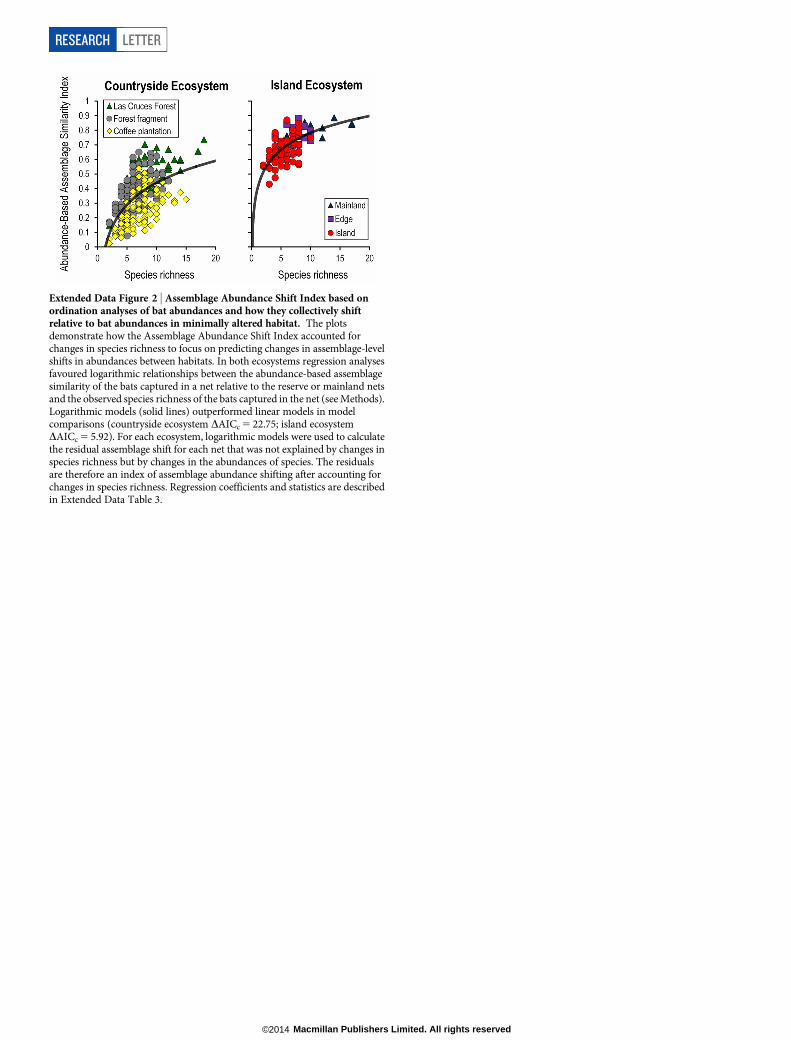
Extended Data Figure 2 | Assemblage Abundance Shift Index based onordination analyses of bat abundances and how they collectively shiftrelative to bat abundances in minimally altered habitat. The plotsdemonstrate how the Assemblage Abundance Shift Index accounted forchanges in species richness to focus on predicting changes in assemblage-levelshifts in abundances between habitats. In both ecosystems regression analysesfavoured logarithmic relationships between the abundance-based assemblagesimilarity of the bats captured in a net relative to the reserve or mainland netsand the observed species richness of the bats captured in the net (see Methods).Logarithmic models (solid lines) outperformed linear models in modelcomparisons (countryside ecosystem DAICc 5 22.75; island ecosystemDAICc 5 5.92). For each ecosystem, logarithmic models were used to calculatethe residual assemblage shift for each net that was not explained by changes inspecies richness but by changes in the abundances of species. The residualsare therefore an index of assemblage abundance shifting after accounting forchanges in species richness. Regression coefficients and statistics are describedin Extended Data Table 3.
RESEARCH LETTER
Macmillan Publishers Limited. All rights reserved©2014
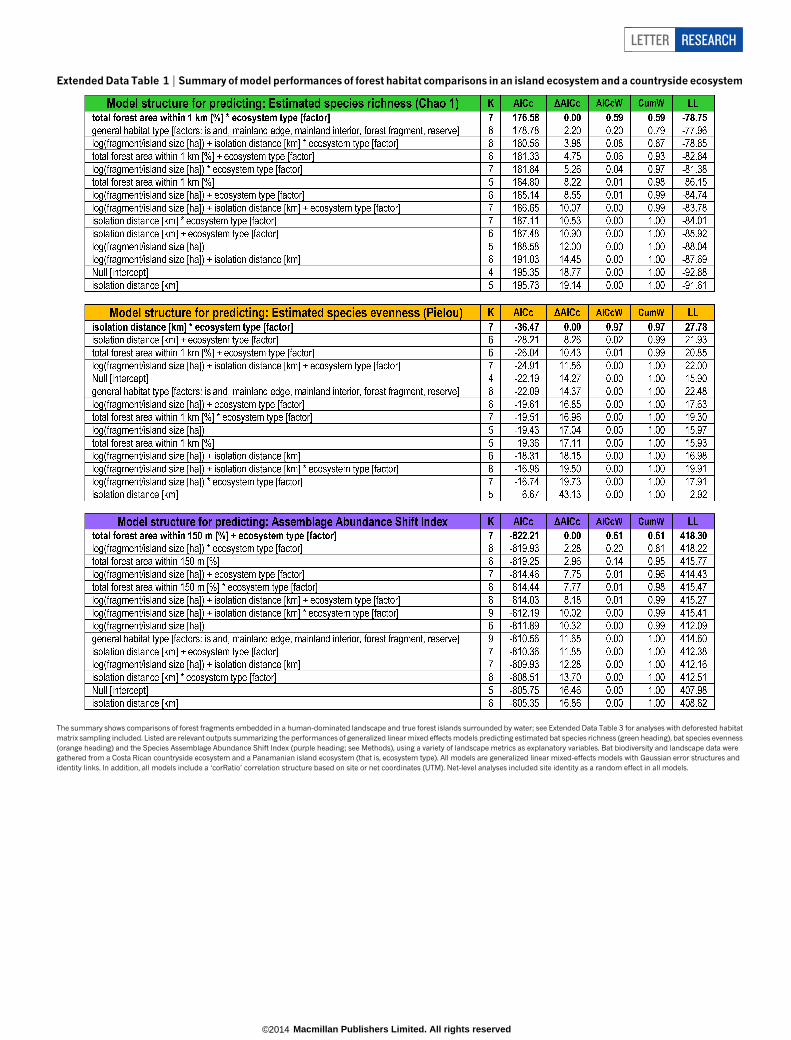
Extended Data Table 1 | Summary of model performances of forest habitat comparisons in an island ecosystem and a countryside ecosystem
The summary shows comparisons of forest fragments embedded in a human-dominated landscape and true forest islands surrounded by water; see Extended Data Table 3 for analyses with deforested habitatmatrix sampling included. Listed are relevant outputs summarizing the performances of generalized linear mixed effects models predicting estimated bat species richness (green heading), bat species evenness(orange heading) and the Species Assemblage Abundance Shift Index (purple heading; see Methods), using a variety of landscape metrics as explanatory variables. Bat biodiversity and landscape data weregathered from a Costa Rican countryside ecosystem and a Panamanian island ecosystem (that is, ecosystem type). All models are generalized linear mixed-effects models with Gaussian error structures andidentity links. In addition, all models include a ‘corRatio’ correlation structure based on site or net coordinates (UTM). Net-level analyses included site identity as a random effect in all models.
LETTER RESEARCH
Macmillan Publishers Limited. All rights reserved©2014
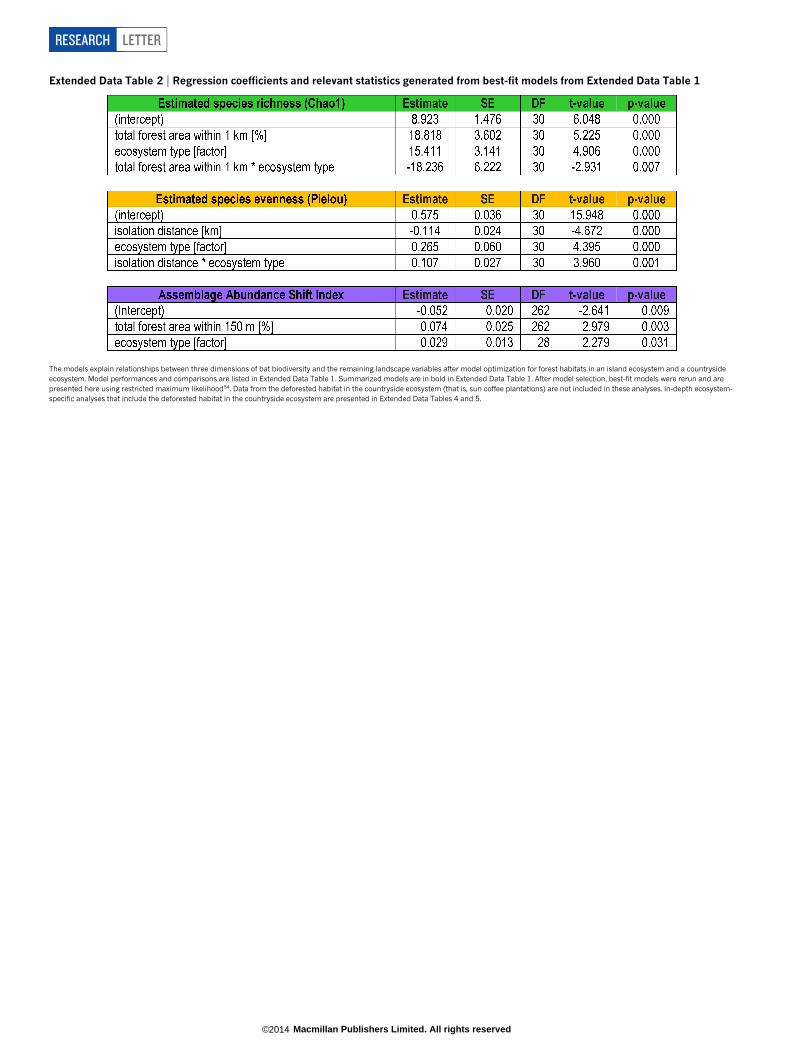
Extended Data Table 2 | Regression coefficients and relevant statistics generated from best-fit models from Extended Data Table 1
The models explain relationships between three dimensions of bat biodiversity and the remaining landscape variables after model optimization for forest habitats in an island ecosystem and a countrysideecosystem. Model performances and comparisons are listed in Extended Data Table 1. Summarized models are in bold in Extended Data Table 1. After model selection, best-fit models were rerun and arepresented here using restricted maximum likelihood54. Data from the deforested habitat in the countryside ecosystem (that is, sun coffee plantations) are not included in these analyses. In-depth ecosystem-specific analyses that include the deforested habitat in the countryside ecosystem are presented in Extended Data Tables 4 and 5.
RESEARCH LETTER
Macmillan Publishers Limited. All rights reserved©2014
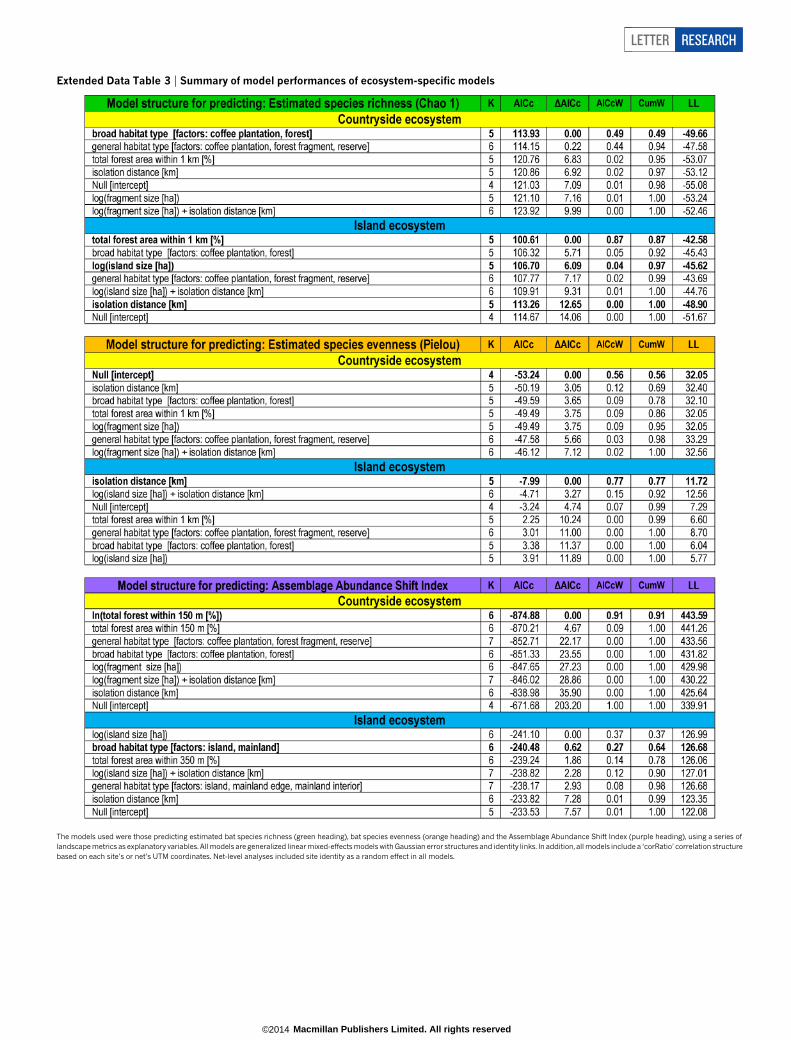
Extended Data Table 3 | Summary of model performances of ecosystem-specific models
The models used were those predicting estimated bat species richness (green heading), bat species evenness (orange heading) and the Assemblage Abundance Shift Index (purple heading), using a series oflandscape metrics as explanatory variables. All models are generalized linear mixed-effects models with Gaussian error structures and identity links. In addition, all models include a ‘corRatio’ correlation structurebased on each site’s or net’s UTM coordinates. Net-level analyses included site identity as a random effect in all models.
LETTER RESEARCH
Macmillan Publishers Limited. All rights reserved©2014
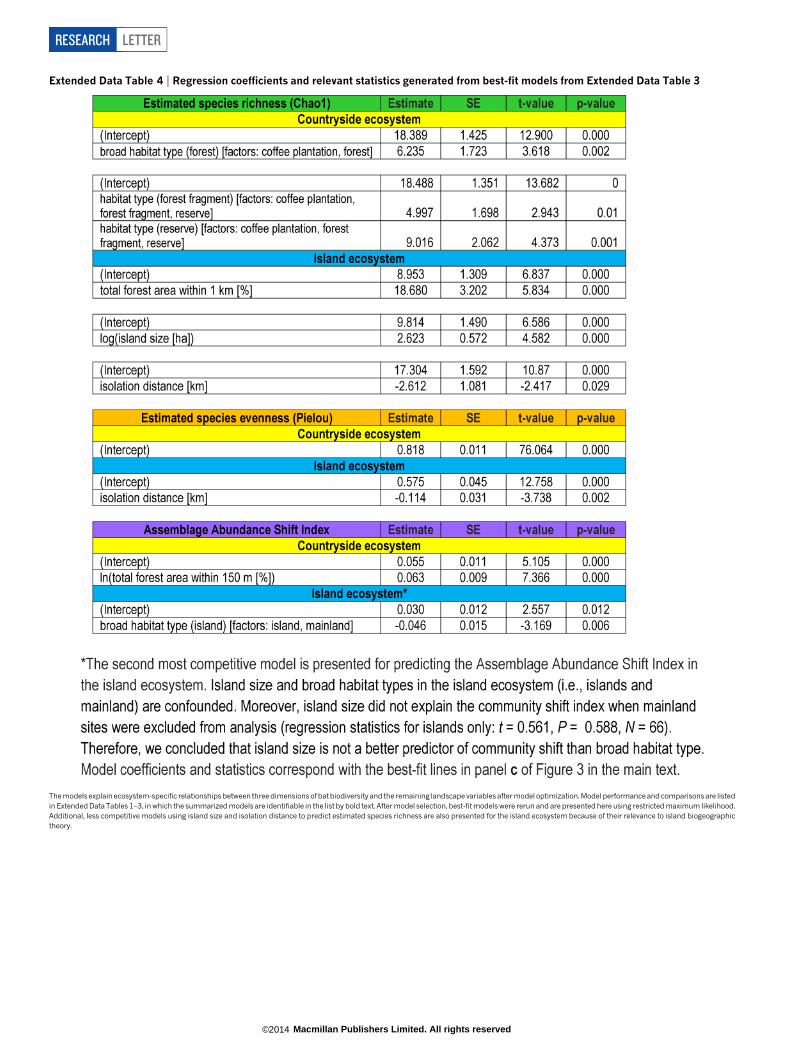
Extended Data Table 4 | Regression coefficients and relevant statistics generated from best-fit models from Extended Data Table 3
The models explain ecosystem-specific relationships between three dimensions of bat biodiversity and the remaining landscape variables after model optimization. Model performance and comparisonsare listedin Extended Data Tables 1–3, in which the summarized models are identifiable in the list by bold text. After model selection, best-fit models were rerun and are presented here using restricted maximum likelihood.Additional, less competitive models using island size and isolation distance to predict estimated species richness are also presented for the island ecosystem because of their relevance to island biogeographictheory.
RESEARCH LETTER
Macmillan Publishers Limited. All rights reserved©2014
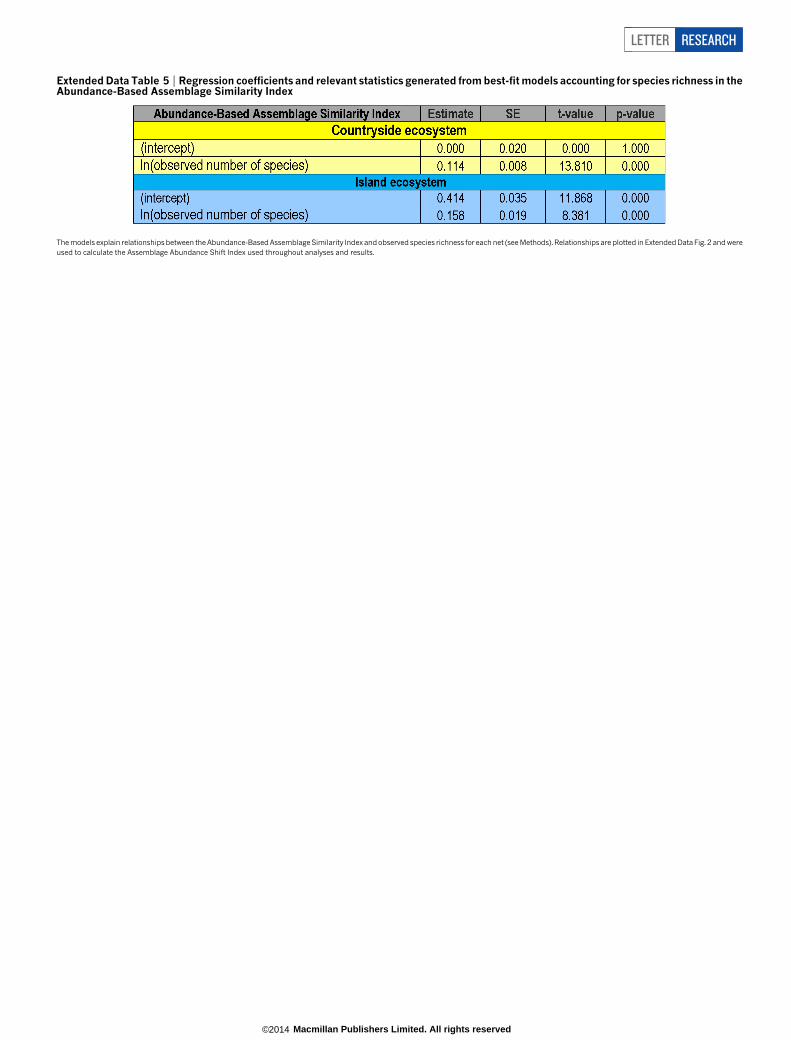
Extended Data Table 5 | Regression coefficients and relevant statistics generated from best-fit models accounting for species richness in theAbundance-Based Assemblage Similarity Index
The models explain relationships between the Abundance-Based Assemblage Similarity Index and observed species richness for each net (see Methods). Relationships are plotted in Extended Data Fig. 2 and wereused to calculate the Assemblage Abundance Shift Index used throughout analyses and results.
LETTER RESEARCH
Macmillan Publishers Limited. All rights reserved©2014
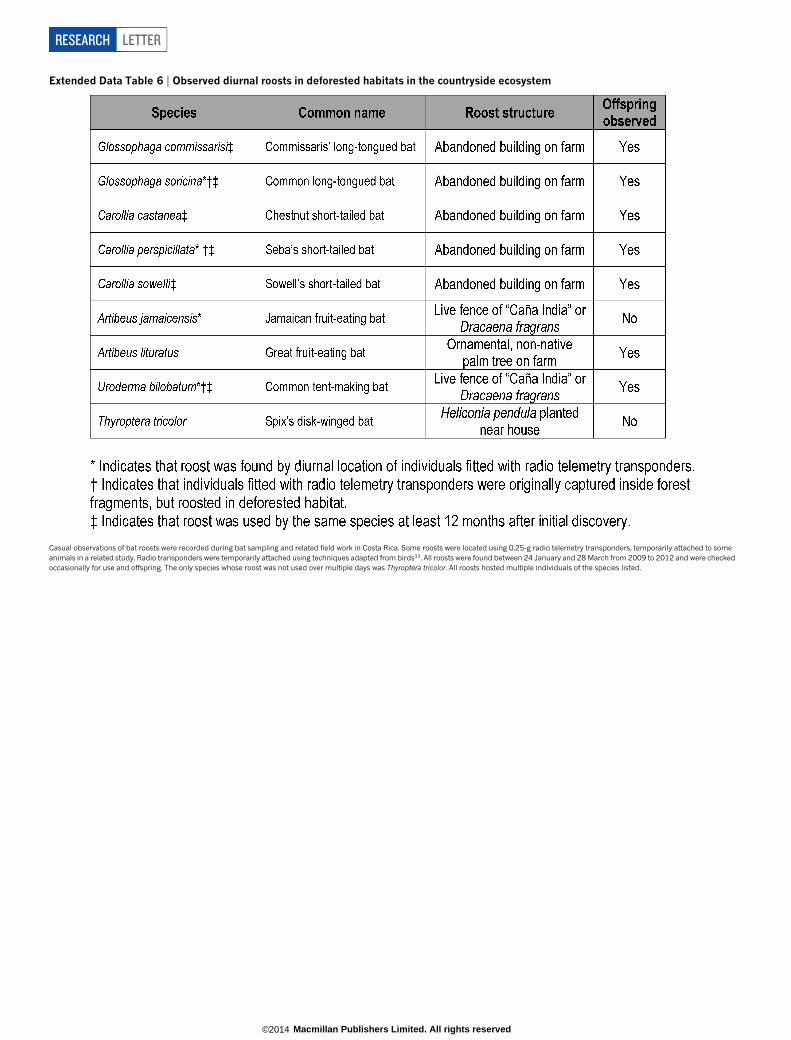
Extended Data Table 6 | Observed diurnal roosts in deforested habitats in the countryside ecosystem
Casual observations of bat roosts were recorded during bat sampling and related field work in Costa Rica. Some roosts were located using 0.25-g radio telemetry transponders, temporarily attached to someanimals in a related study. Radio transponders were temporarily attached using techniques adapted from birds33. All roosts were found between 24 January and 28 March from 2009 to 2012 and were checkedoccasionally for use and offspring. The only species whose roost was not used over multiple days was Thyroptera tricolor. All roosts hosted multiple individuals of the species listed.
RESEARCH LETTER
Macmillan Publishers Limited. All rights reserved©2014