predicting bankruptcy: if cash flow's not the bottom line, what is?
TRANSCRIPT

CFA Institute
Predicting Bankruptcy: If Cash Flow's Not the Bottom Line, What Is?Author(s): James A. Gentry, Paul Newbold and David T. WhitfordSource: Financial Analysts Journal, Vol. 41, No. 5 (Sep. - Oct., 1985), pp. 47-56Published by: CFA InstituteStable URL: http://www.jstor.org/stable/4478871 .
Accessed: 15/06/2014 22:11
Your use of the JSTOR archive indicates your acceptance of the Terms & Conditions of Use, available at .http://www.jstor.org/page/info/about/policies/terms.jsp
.JSTOR is a not-for-profit service that helps scholars, researchers, and students discover, use, and build upon a wide range ofcontent in a trusted digital archive. We use information technology and tools to increase productivity and facilitate new formsof scholarship. For more information about JSTOR, please contact [email protected].
.
CFA Institute is collaborating with JSTOR to digitize, preserve and extend access to Financial AnalystsJournal.
http://www.jstor.org
This content downloaded from 194.29.185.145 on Sun, 15 Jun 2014 22:11:25 PMAll use subject to JSTOR Terms and Conditions
by James A. Gentry, Paul Newbold and David T. Whitford
Predicting Bankruptcy: If Cash Flow's Not the Bottom Line, What IS?
Analysts are continuously searching for techniques or models that can successfully judge the condition of a company 's health and thereby reduce forecasting errors and improve predictive performance. Various financial ratios have traditionally been used to classify failed and nonfailed companies. But the addition of cash-based funds flow components to traditional ratios can provide superior results in the prediction of financial failure.
In particular, the dividend, investment and receivables components of funds flow provide significant information about a company's financial health. Having never been identified in prior ratio studies as significant factors in explaining bankruptcy, these funds flow components may supply unique information to the examination of corporate financial health.
Dividends and investment, of course, represent cash outflows for a company. For healthy companies, receivables also represent outflows. One implication of this finding is that outflow components are more closely related than inflow components to the explanation of financial failure.
S CIENTISTS, ASTRONAUTS, navigators, meteorologists, corporate management and financial analysts share a common
task-the continuous search for signals that will aid in predicting what lies ahead. A primary concern is the reliability of the signals being received.
Financial ratios have been shown to provide reliable signals for predicting corporate financial failure.' But net cash flow patterns also provide signals on a company's financial health.2 This article examines the ability of an expanded cash flow model to explain financial failure.3 It also combines cash flow components with leading financial ratios to determine if a more powerful model for predicting financial failure can be constructed.4
A Model In an accounting context, cash inflows equal cash outflows. The level and speed of the cash
flows reflect managements' operating, invest- ment and financing decisions. The distributions of the components generating the flows reflect management's resource allocation decisions. The trends of the changes in these components provide measures for discriminating between financially successful and financially failing firms.
Components To identify funds flow measures, we rede-
signed an existing model to allow for the inclu- sion of eight major net funds flow components:5
* operations (NOFF) * working capital (NWCFF) * financial (NFFF) * fixed coverage expenses, or interest and
lease payments, (FCE) * capital expenditures (NIFF) * dividends (DIV) * other asset and liability flows (NOTHER) * change in cash and marketable securities
(CC).
The relations between components are com- plex, but the following equation presents a rough formulation of the model:
1. Footnotes appear at end of article.
James Gentry is Professor of Finance, Paul Newbold is Professor of Economics and David Whitford is Assistant Professor of Finance at the University of Illinois at Urbana- Champaign.
FINANCIAL ANALYSTS JOURNAL / SEPTEMBER-OCTOBER 1985 D 47
This content downloaded from 194.29.185.145 on Sun, 15 Jun 2014 22:11:25 PMAll use subject to JSTOR Terms and Conditions
NOFF + NWCFF + NFFF + FCE + NIFF + + - + _ _
(S) (U) (S) (U) (U)
DIV + NOTHER - CC = 0.
(U) (U) (U)
Except for changes in cash and marketable secu- rities, a source of funds (S) is a positive number and a use of funds (U) negative.
The accounting convention underlying the funds statement results in total net inflow of funds (TNIF) being equal to the absolute value of total net outflow of funds (TNOF). We have simplified the notation by substituting the expression "total net cash flow" (TNCF) for TNIF and TNOF. By dividing each funds flow component by TNCF, therefore, one can deter- mine the percentage contribution of each com- ponent to the total.
An Example An example comparing Deere & Company to
Massey-Ferguson (MF) illustrates how the trends of funds flow components aid in deter- mining if a company is financially healthy or weak. Figure A illustrates the performance trends of the eight funds flow components over the 1978-8.2 period.
The upper left-hand corner presents the trend of the net operating funds flow components. Approximately 80 to 90 per cent of Deere's total net inflow from operations came in three years; only 45 to 55 per cent was generated in the other two years. Although Deere's operating inflow component was relatively erratic, its level was always markedly higher than Massey-Fergu- son's.
Massey's operating flows contributed 62 per cent of total inflows in 1979, but constituted 28 per cent of total outflows in 1982. (Net outflows are shown as negative values in the figure.) Although net operating flows of both compa- nies were on a downward trend, Deere, the financially stronger company, received a signifi- cantly higher percentage of inflows from opera- tions.
The largest percentage of a firm's total out- flows frequently goes to capital investment. Figure A shows that the percentage of Deere's total net outflows going to investment declined from 47 per cent in 1979 to 12 per cent in 1982. For Massey-Ferguson, this percentage dropped from 24 per cent in 1978 to approximately zero in 1980 and remained at that level through 1982.
Massey's decline in investment can be related to the shortage of operating inflows available for investment and, more than likely, to declining investment alternatives. The decrease in invest- ment at Deere was also related to a decline in operating inflows.
The interdependence of the cash flow compo- nents is most evident in the net financing flow component (NFFF), which measures the in- crease or decrease in total debt and common stock. The path of the net financing flows for Deere reflects an offset to the pattern of operat- ing inflows. When net operating flows declined, management increased outside financing in or- der to maintain its ongoing operations and dividends. Figure A highlights Massey's heavy commitment to outside financing in 1979-80.
The net working capital path has a particular significance for Deere and Massey-Ferguson. Although net operating inflows and net invest- ment outflows were declining as a percentage of the total, net working capital at Deere ranged from 15 to 30 per cent of total net outflow in three of the five years; in 1979 it was a small outflow and in 1981 a small inflow. In contrast, at Massey-Ferguson net working capital was a major inflow in three of the five years.
Disaggregating the five components of work- ing capital presents a better picture of funds flow. Figure B presents the five components of net working capital. Although short-term bor- rowing is included here, it is by definition a financing flow. In 1981, when Massey's fixed coverage expenses soared, and short-term bor- rowing had to be repaid, management reduced inventory and receivables, which constituted, respectively, 71 and 5 per cent of total net inflows. In 1982, receivables accounted for 66 per cent of total net inflows and inventories 28 per cent. In comparison, the change in receiv- ables at Deere constituted a primary net outflow in each year except 1979, while the change in inventories made for a small inflow in three of the five years.
The key observation is that receivables and inventories were major inflows for Massey when the financial crisis hit. In contrast, Deere's receivables required a major outflow of funds in four of the five years.
Figure A shows that dividends at Deere rep- resented between 9 and 16 per cent of the total outflow of funds. In contrast, the dividend outflow as a percentage of the total at Massey ranged from 1 to 9 per cent during the period- significantly smaller than the dividend outflow
FINANCIAL ANALYSTS JOURNAL / SEPTEMBER-OCTOBER 1985 C 48
This content downloaded from 194.29.185.145 on Sun, 15 Jun 2014 22:11:25 PMAll use subject to JSTOR Terms and Conditions
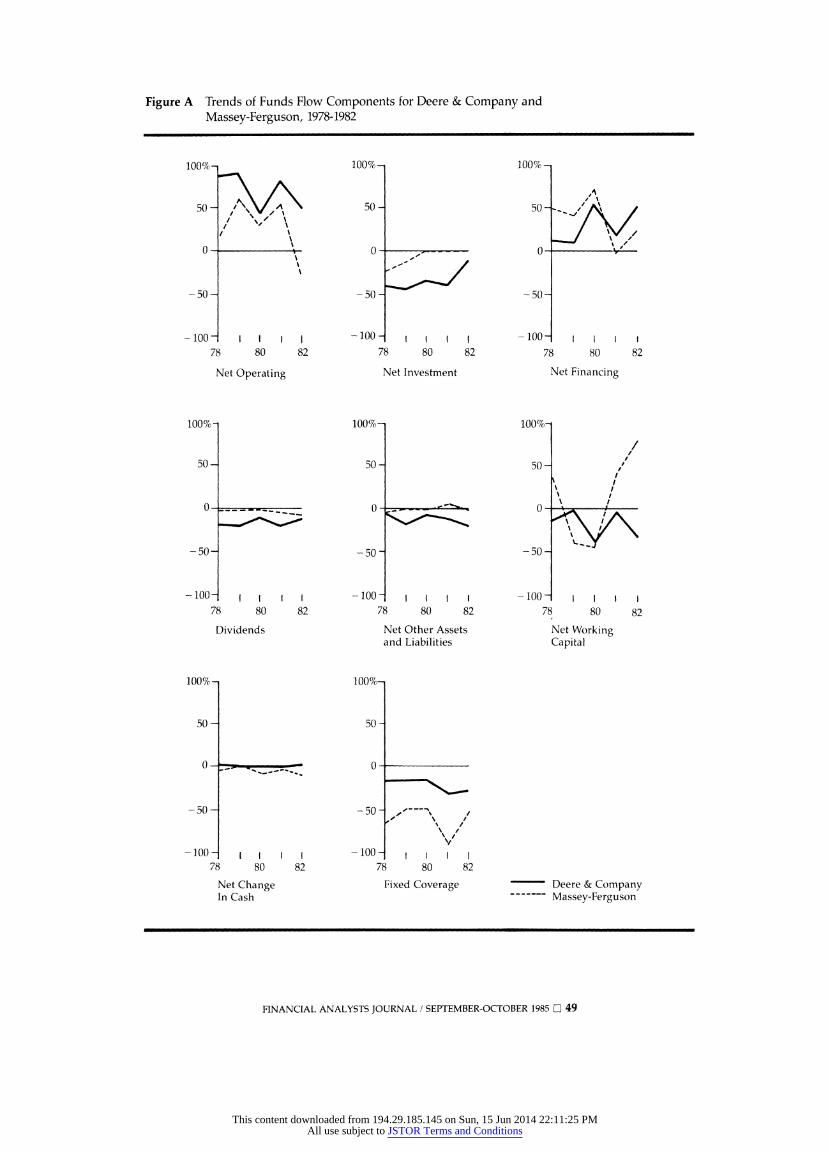
Figure A Trends of Funds Flow Components for Deere & Company and Massey-Ferguson, 1978-1982
100% x 100%_ 100%-
AA 50 / A 50 50
/~~~~~~~~~~~~~~~~~~~~~~~~~~~~~~~~~~~~~~~~1 0-0 0-
-50 - -50 --50
-100 1 1 1 1 -100 1 1 1 1 -100
78 80 82 78 80 82 78 80 82
Net Operating Net Investment Net Financing
100%o 100%7 100%-
50- 50- 50-
I I 1
0 ________ 00
-50- -50 -50 -
- 100- I -100 - I -100 - I
78 80 82 78 80 82 78 80 82
Dividends Net Other Assets Net Working and Liabilities Capital
100% 100%1
50 - 50 -
-0 0
- 50 - -50 - /
' //
- 100 -100 78 80 82 78 80 82
Net Change Fixed Coverage Deere & Company In Cash ------- Massey-Ferguson
FINANCIAL ANALYSTS JOURNAL / SEPTEMBER-OCTOBER 1985 O 49
This content downloaded from 194.29.185.145 on Sun, 15 Jun 2014 22:11:25 PMAll use subject to JSTOR Terms and Conditions
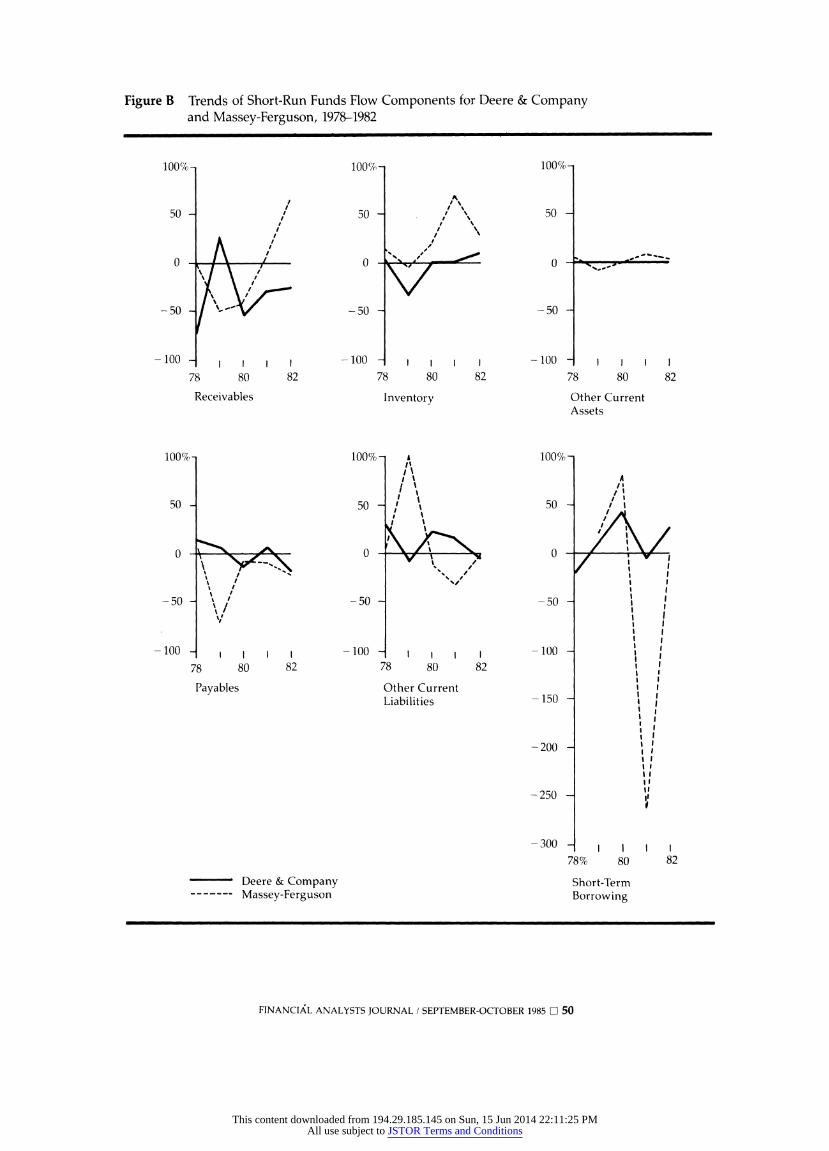
Figure B Trends of Short-Run Funds Flow Components for Deere & Company and Massey-Ferguson, 1978-1982
100%l 100% 100%_
50 -I 50 50 5
1 / 1 ''I
/
O~ ~ ~ ~~ I C,-^
0 0 0
-50 - -50 -50 -
-100 I -100 i I I -100 - I
78 80 82 78 80 82 78 80 82
Receivables Inventory Other Current Assets
100% 100%- A 100%?
I'\ A
50 50 50
0 0- v 0
-50 ' -50 -50
100 I i -100 t I I -100
78 80 82 78 80 82 I I
Payables Other Current Liabilities - 150 -
-200
-250
-300 I I
78% 80 82
Deere & Company Short-Term Massey-Ferguson Borrowing
FINANCIAL ANALYSTS JOURNAL / SEPTEMBER-OCTOBER 1985 O 50
This content downloaded from 194.29.185.145 on Sun, 15 Jun 2014 22:11:25 PMAll use subject to JSTOR Terms and Conditions
at Deere. Massey was paying dividends to the Canadian government for external financing received throughout the period.
The percentage of total outflow needed to cover fixed financial obligations highlights a major difference between Deere and Massey- Ferguson. The largest outflow of funds for Mas- sey went to meet fixed coverage expenditures. As Figure A indicates, fixed coverage ranged from 50 to 88 per cent of the total outflow of funds. Fixed coverage expenditures at Deere ranged from 15 per cent in 1979 to about 30 per cent in 1981.
Predicting Bankruptcy Our analysis uses 12 funds flow measures to distinguish between failed and nonfailed com- panies. We substituted the five working capital components for the single net working capital component, omitted the component CC/TNF to avoid a statistical problem of overidentification, and added a size measure-total net flows as a percentage of total assets (TNF/TA).
We searched leading information sources to determine why a company was deleted from Compustat's Annual Industrial Research File.6 There were 92 companies classified as failed; 68 were involved in bankruptcy proceedings and 24 were liquidated. These 92 companies com- prised the failed companies used in the study.
During the screening process, we compared the recorded date of failure with Compustat's date of the last reported annual report of the failed company. Although Compustat files do not report the precise date of release of the last annual report, they explicitly indicate if bank- ruptcy was declared before or after Compustat received the annual report. For all the failed companies selected for the study, the Compus- tat files indicated that bankruptcy was declared after Compustat received and recorded the last annual report.
We used balance sheet and income statement information from the failed companies to deter- mine the funds flow components.7 The relative components were computed for one, two and three years immediately prior to the date of failure for each of the 92 failed companies. Complete financial statement information for these years was available for only 33 of the 92 failed companies; of these 33 companies, 21 were industrial and 12 were a mixture of other industries.
We matched each of the 33 failed companies with a nonfailed company in the same industry,
Table I Mean Net Funds Flow Components/Total Net Flow for Failed and Nonfailed Companies
One Year Before Failure Net Funds Flow
Component Failed Nonfailed Divided by Total Net Flow (FNF) Mean S.D. Meani S.D.
Operating 0.163 0.528 0.556 0.247 Working Capital 0.130 0.453 -0.129 0.344 Other A&L - 0.044 0.258 0.047 0.178 Financing 0.167 0.490 0.140 0.369 Fixed Coverage - 0.152 0.127 - 0.080 0.095 Investment -0.163 0.288 - 0.367 0.267 Dividends -0.018 0.050 -0.092 0.103 Cash & M.S. - 0.081 0.290 - 0.074 0.243 Receivable 0.100 0.351 - 0.169 0.257 Inventory 0.013 0.485 - 0.126 0.246 Other CA 0.017 0.148 -0.020 0.065 Payables 0.170 0.559 0.101 0.393 Other CL - 0.172 0.680 0.085 0.241 TNF/TA 0.257 0.140 0.226 0.025
Mean of Variable for Three Years Before Failure Operating 0.288 0.344 0.588 0.228 Working Capital 0.007 0.291 -0.102 0.197 Other A&L - 0.018 0.202 0.029 0.064 Financing 0.120 0.342 0.090 0.211 Fixed Coverage - 0.126 0.100 - 0.079 0.062 Investment - 0.220 0.170 - 0.364 0.211 Dividends -0.002 0.049 -0.093 0.106 Cash & M. S. - 0.029 0.145 - 0.068 0.108 Receivables 0.013 0.304 - 0.151 0.195 Inventory - 0.061 0.211 - 0.117 0.167 Other CA - 0.002 0.022 - 0.015 0.032 Payables 0.147 0.260 0.139 0.212 Other CL - 0.089 0.389 0.041 0.250 TNF/TA 0.255 0.136 0.219 0.076
selecting matching companies that were similar in asset size and sales in the fiscal year three years before bankruptcy.8 The necessary finan- cial information on the matching nonfailed com- pany was available for all three years relevant to the failed company.
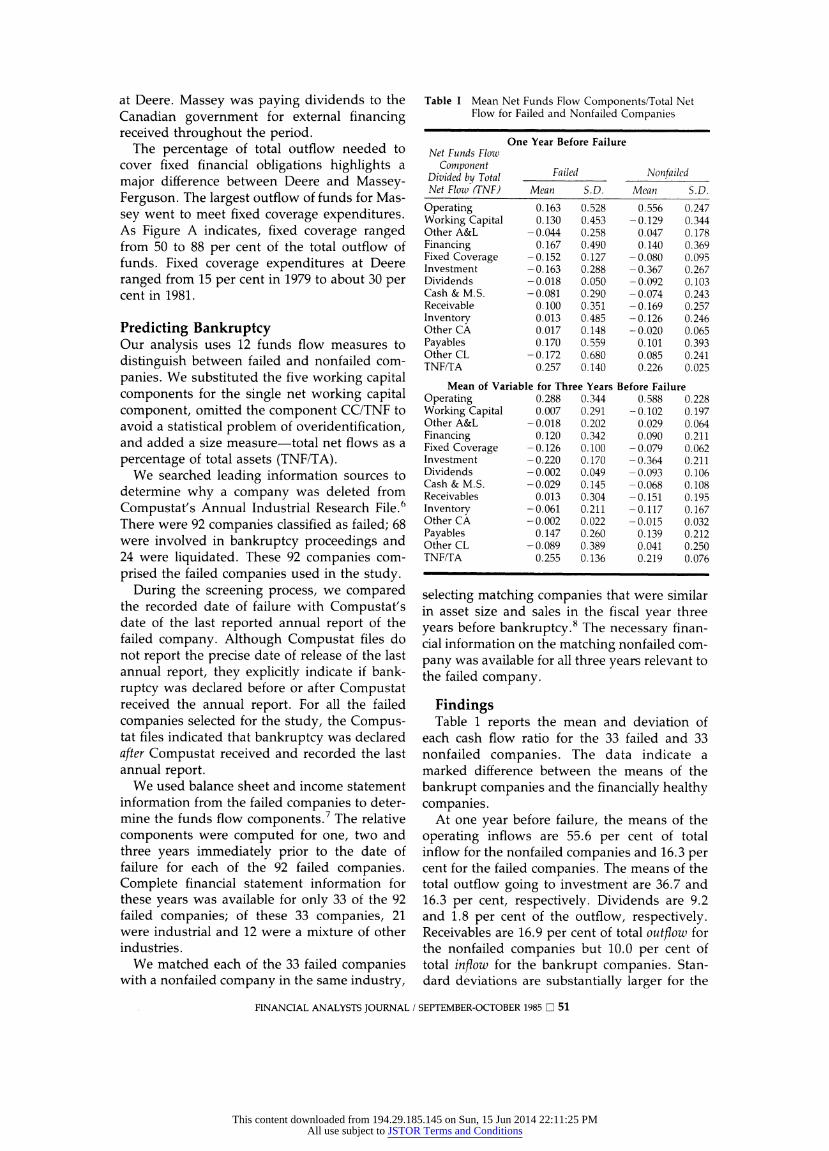
Findings Table 1 reports the mean and deviation of
each cash flow ratio for the 33 failed and 33 nonfailed companies. The data indicate a marked difference between the means of the bankrupt companies and the financially healthy companies.
At one year before failure, the means of the operating inflows are 55.6 per cent of total inflow for the nonfailed companies and 16.3 per cent for the failed companies. The means of the total outflow going to investment are 36.7 and 16.3 per cent, respectively. Dividends are 9.2 and 1.8 per cent of the outflow, respectively. Receivables are 16.9 per cent of total outflow for the nonfailed companies but 10.0 per cent of total inflow for the bankrupt companies. Stan- dard deviations are substantially larger for the
FINANCIAL ANALYSTS JOURNAL / SEPTEMBER-OCTOBER 1985 D 51
This content downloaded from 194.29.185.145 on Sun, 15 Jun 2014 22:11:25 PMAll use subject to JSTOR Terms and Conditions
failed companies than for the nonfailed compa- nies. It is not uncommon, especially among the working capital components, for the mean of the failed companies to be an inflow and the mean of the nonfailed companies to be an outflow.
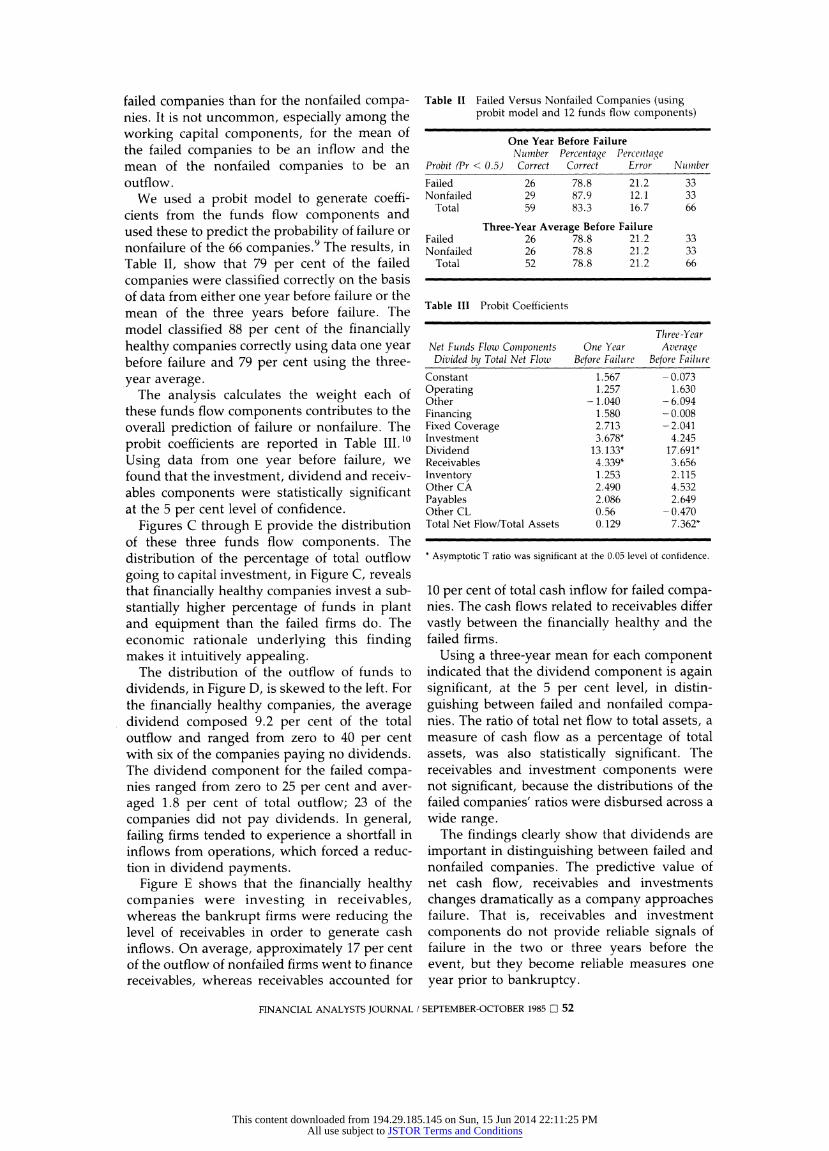
We used a probit model to generate coeffi- cients from the funds flow components and used these to predict the probability of failure or nonfailure of the 66 companies.9 The results, in Table II, show that 79 per cent of the failed companies were classified correctly on the basis of data from either one year before failure or the mean of the three years before failure. The model classified 88 per cent of the financially healthy companies correctly using data one year before failure and 79 per cent using the three- year average.
The analysis calculates the weight each of these funds flow components contributes to the overall prediction of failure or nonfailure. The probit coefficients are reported in Table III.") Using data from one year before failure, we found that the investment, dividend and receiv- ables components were statistically significant at the 5 per cent level of confidence.
Figures C through E provide the distribution of these three funds flow components. The distribution of the percentage of total outflow going to capital investment, in Figure C, reveals that financially healthy companies invest a sub- stantially higher percentage of funds in plant and equipment than the failed firms do. The economic rationale underlying this finding makes it intuitively appealing.
The distribution of the outflow of funds to dividends, in Figure D, is skewed to the left. For the financially healthy companies, the average dividend composed 9.2 per cent of the total outflow and ranged from zero to 40 per cent with six of the companies paying no dividends. The dividend component for the failed compa- nies ranged from zero to 25 per cent and aver- aged 1.8 per cent of total outflow; 23 of the companies did not pay dividends. In general, failing firms tended to experience a shortfall in inflows from operations, which forced a reduc- tion in dividend payments.
Figure E shows that the financially healthy companies were investing in receivables, whereas the bankrupt firms were reducing the level of receivables in order to generate cash inflows. On average, approximately 17 per cent of the outflow of nonfailed firms went to finance receivables, whereas receivables accounted for
Table II Failed Versus Nonfailed Companies (using probit model and 12 funds flow components)
One Year Before Failure Number Percentage Percentage
Probit (Pr < 0.5) Correct Correct Error Nlumber
Failed 26 78.8 21.2 33 Nonfailed 29 87.9 12.1 33
Total 59 83.3 16.7 66
Three-Year Average Before Failure Failed 26 78.8 21.2 33 Nonfailed 26 78.8 21.2 33
Total 52 78.8 21.2 66
Table III Probit Coefficients
T1hree-Year Net Funds Flow Components One Year Average
Divided by Total Net Flowv Before Failture Before Failure
Constant 1.567 - 0.073 Operating 1.257 1.630 Other -1.040 - 6.094 Financing 1.580 - 0.008 Fixed Coverage 2.713 -2.041 Investment 3.678* 4.245 Dividend 13.133* 17.691* Receivables 4.339* 3.656 Inventory 1.253 2.115 Other CA 2.490 4.532 Payables 2.086 2.649 Other CL 0.56 - 0.470 Total Net Flow/Total Assets 0.129 7.362*
* Asymptotic T ratio was significant at the 0.05 level of confidence.
10 per cent of total cash inflow for failed compa- nies. The cash flows related to receivables differ vastly between the financially healthy and the failed firms.
Using a three-year mean for each component indicated that the dividend component is again significant, at the 5 per cent level, in distin- guishing between failed and nonfailed compa- nies. The ratio of total net flow to total assets, a measure of cash flow as a percentage of total assets, was also statistically significant. The receivables and investment components were not significant, because the distributions of the failed companies' ratios were disbursed across a wide range.
The findings clearly show that dividends are important in distinguishing between failed and nonfailed companies. The predictive value of net cash flow, receivables and investments changes dramatically as a company approaches failure. That is, receivables and investment components do not provide reliable signals of failure in the two or three years before the event, but they become reliable measures one year prior to bankruptcy.
FINANCIAL ANALYSTS JOURNAL / SEPTEMBER-OCTOBER 1985 O 52
This content downloaded from 194.29.185.145 on Sun, 15 Jun 2014 22:11:25 PMAll use subject to JSTOR Terms and Conditions
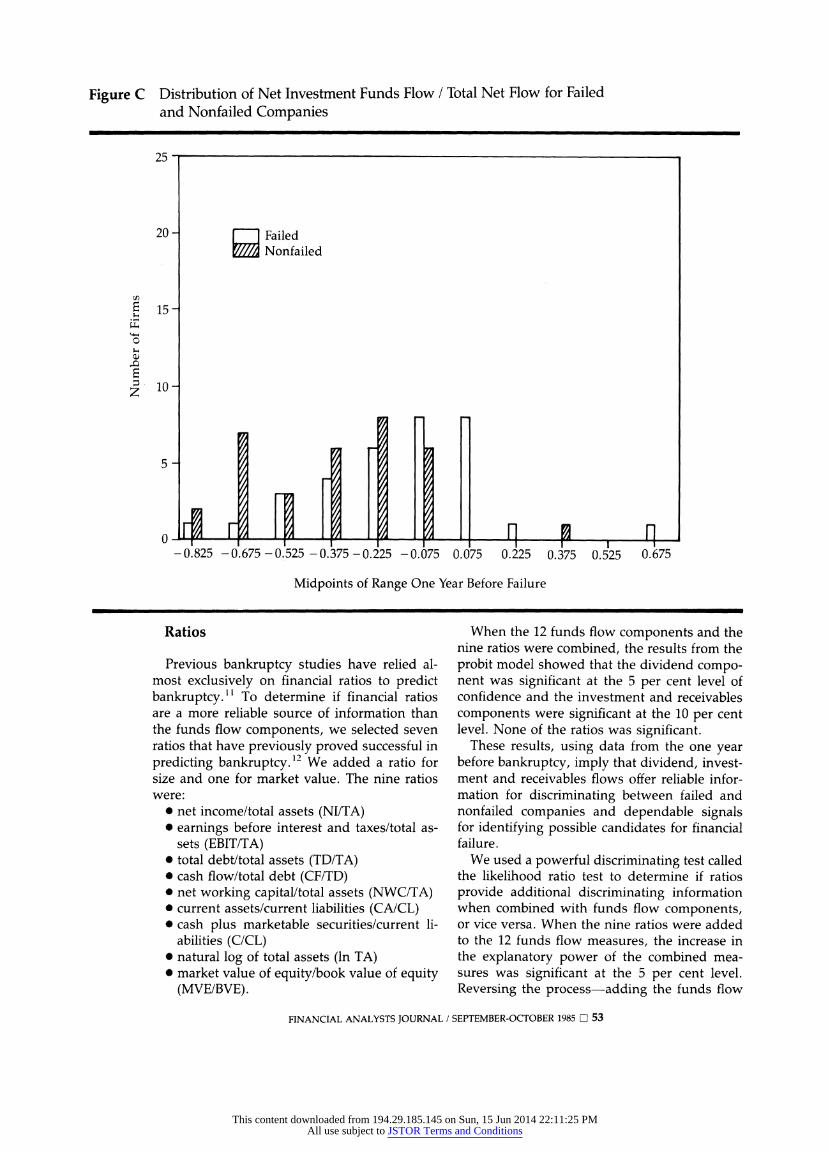
Figure C Distribution of Net Investment Funds Flow / Total Net Flow for Failed and Nonfailed Companies
25
20- Failed Nonfailed
E 15
io
0 ;
- 0.825 -0.675 - 0.525 - 0.375 - 0.225 -0.075 0.075 0.225 0.375 0.525 0.675
Midpoints of Range One Year Before Failure
Ratios
Previous bankruptcy studies have relied al- most exclusively on financial ratios to predict bankruptcy." To determine if financial ratios are a more reliable source of information than the funds flow components, we selected seven ratios that have previously proved successful in predicting bankruptcy.'2 We added a ratio for size and one for market value. The nine ratios were:
* net income/total assets (NI/TA) * earnings before interest and taxes/total as-
sets (EBIT/TA) * total debt/total assets (TD/TA) * cash flow/total debt (CF/TD) * net working capital/total assets (NWC/TA) * current assets/current liabilities (CA/CL) * cash plus marketable securities/current li-
abilities (C/CL) * natural log of total assets (ln TA) * market value of equity/book value of equity
(MVE/BVE).
When the 12 funds flow components and the nine ratios were combined, the results from the probit model showed that the dividend compo- nent was significant at the 5 per cent level of confidence and the investment and receivables components were significant at the 10 per cent level. None of the ratios was significant.
These results, using data from the one year before bankruptcy, imply that dividend, invest- ment and receivables flows offer reliable infor- mation for discriminating between failed and nonfailed companies and dependable signals for identifying possible candidates for financial failure.
We used a powerful discriminating test called the likelihood ratio test to determine if ratios provide additional discriminating information when combined with funds flow components, or vice versa. When the nine ratios were added to the 12 funds flow measures, the increase in the explanatory power of the combined mea- sures was significant at the 5 per cent level. Reversing the process-adding the funds flow
FINANCIAL ANALYSTS JOURNAL / SEPTEMBER-OCTOBER 1985 O 53
This content downloaded from 194.29.185.145 on Sun, 15 Jun 2014 22:11:25 PMAll use subject to JSTOR Terms and Conditions
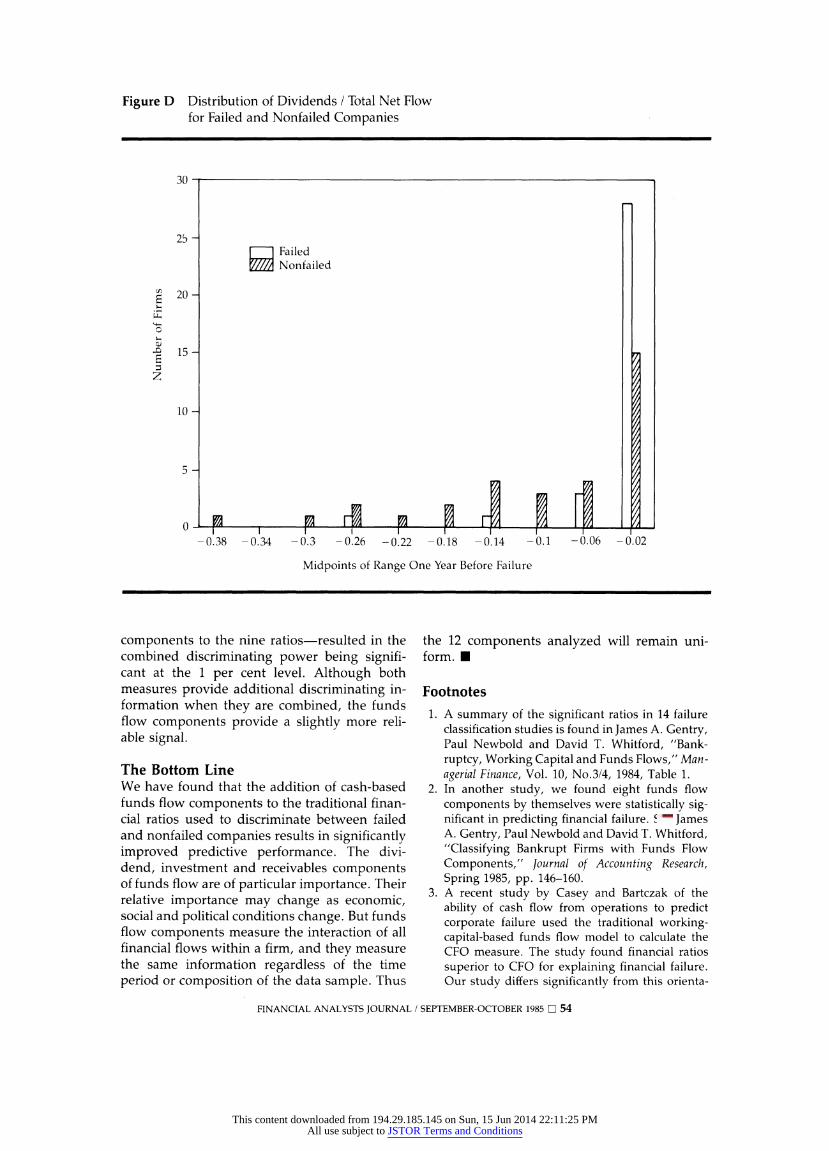
Figure D Distribution of Dividends / Total Net Flow for Failed and Nonfailed Companies
30-
25- H Failed
Nonfailed
20-
-1 15
10
5
-0.38 -0.34 -0.3 -0.26 -0.22 -0.18 -0.14 -0.1 -0.06 -0.02
Midpoints of Range One Year Before Failure
components to the nine ratios-resulted in the combined discriminating power being signifi- cant at the 1 per cent level. Although both measures provide additional discriminating in- formation when they are combined, the funds flow components provide a slightly more reli- able signal.
The Bottom Line We have found that the addition of cash-based funds flow components to the traditional finan- cial ratios used to discriminate between failed and nonfailed companies results in significantly improved predictive performance. The divi- dend, investment and receivables components of funds flow are of particular importance. Their relative importance may change as economic, social and political conditions change. But funds flow components measure the interaction of all financial flows within a firm, and they measure the same information regardless of the time period or composition of the data sample. Thus
the 12 components analyzed will remain uni- form. M
Footnotes
1. A summary of the significant ratios in 14 failure classification studies is found in James A. Gentry, Paul Newbold and David T. Whitford, "Bank- ruptcy, Working Capital and Funds Flows," Man- agerial Finance, Vol. 10, No.3/4, 1984, Table 1.
2. In another study, we found eight funds flow components by themselves were statistically sig- nificant in predicting financial failure. See James A. Gentry, Paul Newbold and David T. Whitford, "Classifying Bankrupt Firms with Funds Flow Components," Journal of Accounting Research, Spring 1985, pp. 146-160.
3. A recent study by Casey and Bartczak of the ability of cash flow from operations to predict corporate failure used the traditional working- capital-based funds flow model to calculate the CFO measure. The study found financial ratios superior to CFO for explaining financial failure. Our study differs significantly from this orienta-
FINANCIAL ANALYSTS JOURNAL / SEPTEMBER-OCTOBER 1985 D 54
This content downloaded from 194.29.185.145 on Sun, 15 Jun 2014 22:11:25 PMAll use subject to JSTOR Terms and Conditions
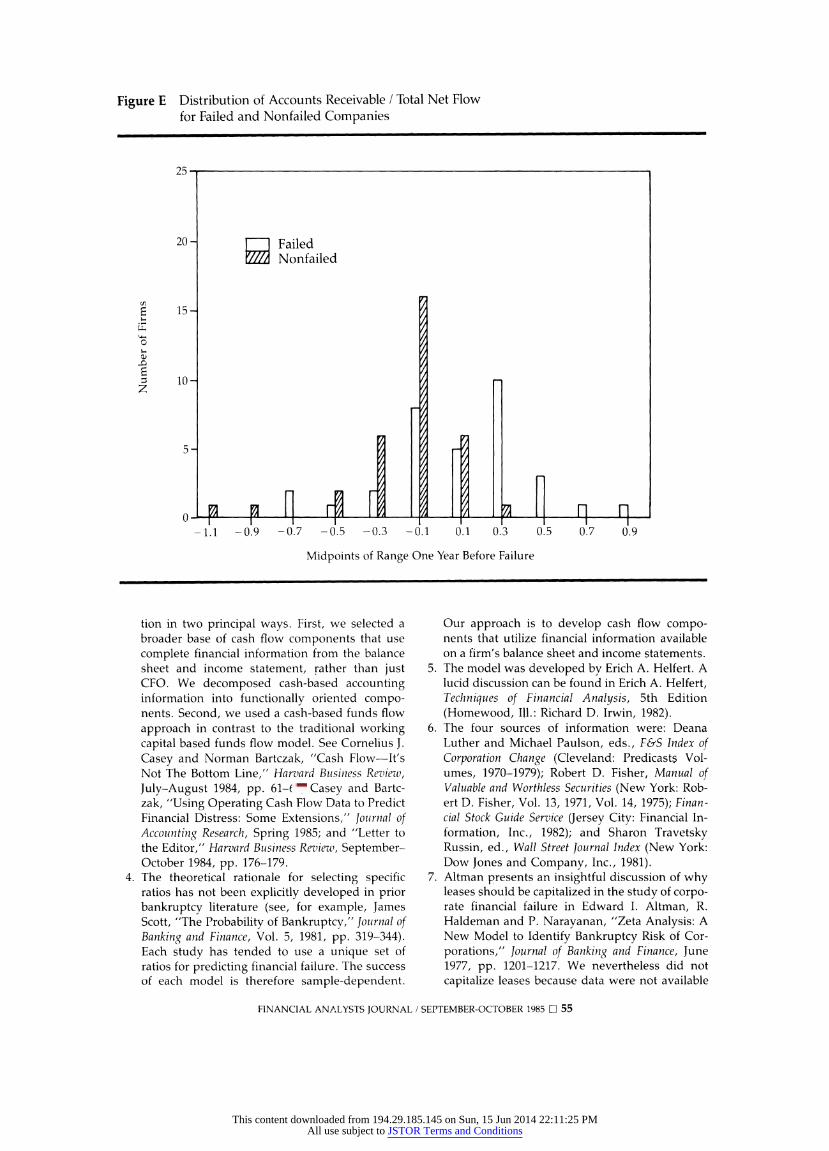
Figure E Distribution of Accounts Receivable / Total Net Flow for Failed and Nonfailed Companies
25 -
20 - Failed
tZSZ Nonfailed
15
0-
- 1.1 -0.9 -0.7 -0.5 -0.3 -0.1 0.1 0.3 0.5 0.7 0.9
Midpoints of Range One Year Before Failure
tion in two principal ways. First, we selected a broader base of cash flow components that use complete financial information from the balance sheet and income statement, rather than just CFO. We decomposed cash-based accounting information into functionally oriented compo- nents. Second, we used a cash-based funds flow approach in contrast to the traditional working capital based funds flow model. See Cornelius J. Casey and Norman Bartczak, "Cash Flow-It's Not The Bottom Line," Harzvard Buisiniess Reviezw, July-August 1984, pp. 61-66; Casey and Bartc- zak, "Using Operating Cash Flow Data to Predict Financial Distress: Some Extensions," journal of Accounting Research, Spring 1985; and "Letter to the Editor," Harvard Business Reviezw), September- October 1984, pp. 176-179.
4. The theoretical rationale for selecting specific ratios has not been explicitly developed in prior bankruptcy literature (see, for example, James Scott, "The Probability of Bankruptcy," Journal of Banking and Finance, Vol. 5, 1981, pp. 319-344). Each study has tended to use a unique set of ratios for predicting financial failure. The success of each model is therefore sample-dependent.
Our approach is to develop cash flow compo- nents that utilize financial information available on a firm's balance sheet and income statements.
5. The model was developed by Erich A. Helfert. A lucid discussion can be found in Erich A. Helfert, Techniques of Financial Analysis, 5th Edition (Homewood, Ill.: Richard D. Irwin, 1982).
6. The four sources of information were: Deana Luther and Michael Paulson, eds., F&S Index of Corporation Change (Cleveland: Predicasts Vol- umes, 1970-1979); Robert D. Fisher, Manual of Valuable and Worthless Securities (New York: Rob- ert D. Fisher, Vol. 13, 1971, Vol. 14, 1975); Finan- cial Stock Guide Service (Jersey City: Financial In- formation, Inc., 1982); and Sharon Travetsky Russin, ed., Wall Street journal Index (New York: Dow Jones and Company, Inc., 1981).
7. Altman presents an insightful discussion of why leases should be capitalized in the study of corpo- rate financial failure in Edward I. Altman, R. Haldeman and P. Narayanan, "Zeta Analysis: A New Model to Identify Bankruptcy Risk of Cor- porations," Journal of Banking and Finance, June 1977, pp. 1201-1217. We nevertheless did not capitalize leases because data were not available
FINANCIAL ANALYSTS JOURNAL / SEPTEMBER-OCTOBER 1985 C 55
This content downloaded from 194.29.185.145 on Sun, 15 Jun 2014 22:11:25 PMAll use subject to JSTOR Terms and Conditions
for all the selected companies for each year stud- ied.
8. A list of the 66 companies can be found in Gentry, Newbold and Whitford, "Bankruptcy Working Capital," op. cit., Tables 2 and 3.
9. The probit model is a conditional probability model that uses the coefficients of the indepen- dent variables to predict the probability of occur- rence of a dichotomous dependent variable. As a nonlinear model, probit provides unique insight vis-a-vis the linearly based MDA model used in previous bankruptcy studies. For an extensive discussion of probit see Richard D. McKelvey and William Zavoina, "A Statistical Model for the Analyses of Ordinal Level Development Varia- bles," Journal of Mathematical Sociology, Vol. 4, 1975, pp. 103-120.
10. Their contribution to an overall prediction of failure is analogous to the way Altman's Z-score contributes to the prediction of failure. See Ed- ward I. Altman, "Financial Ratios, Discriminant Analysis and the Prediction of Corporate Bank- ruptcy," Journal of Finance, September 1968, pp. 589-609.
11. Several authors found the ratio cash flow/total debt (CF/TD) to be statistically significant in pre- dicting financial failures. See William H. Beaver, "Financial Ratios as Predictors of Failure," Em- pirical Research in Accounting. Selected Studies 1967, Supplement to Vol. 5, Journal of Accouniting Re- search, January 1966, pp. 71-110; Marc Blum, "Failing Company Discriminant Analysis," Jour- nal of Accounting Researchl, Spring 1974, pp. 1-24; F. B. Deakin, "A Discriminant Analysis of Predic-
tors of Failure," journal of Accountinlg Research, Spring 1972, pp. 167-179; Rick Elam, "The Effect of Lease Data on the Predictive Ability of Finan- cial Ratios," The Accounting Reviewv, January 1975, pp. 24-43; Yaw M. Mensah, "The Differential Bankruptcy Predictive Ability of Specific Price Level Adjustments: Some Empirical Evidence," The Accounting Review, April 1983, pp. 228-246; R. Charles Moyer, "Forecasting Financial Failure: A Reexamination," Financial Management, Spring 1977, pp. 11-17. In the above listed studies, cash flow was defined as net income plus depreciation from the income statement. The ratio cash flow from operations/total debt (CFO/TD) was signifi- cant in James A. Ohlson, "Financial Ratios and the Probabilistic Prediction of Bankruptcy," Jour- nal of Accounting Research, Spring 1980, pp. 109- 131. Net income plus depreciation/current liabil- ities (CF/CL) was a significant ratio for Elam and Robert 0. Edmister, "An Empirical Test of Finan- cial Ratio Analysis for Small Business Failure," Journal of Financial and Quiantitative Analysis, March 1972, pp. 1477-1493. Our study encom- passes total interaction of cash inflows and out- flows within a company and provides a broader perspective than the more narrow CF/TD, CF/CL and CFO/TD. The shortcomings of net income plus depreciation as a proxy for cash flow are found in Michael J. Gombola and J. Edward Ketz, "A Note on Cash Flow and Classification Pat- terns of Financial Ratios," The Accounting Rev7iew, January 1983, pp. 105-114.
12. See footnote 1.
Rar b
Tlere aren't many electric utilities like PacifiCorp.
Like most, our cash flow has increased dramatically. In 1984 it completely financed a capital spending budget of nearly $400 million.
What makes us different is how we invest the money. In 1984 over two-thirds went to further diversification in non-electric areas.
Today our 89 percent in- terest in Pacific Telecom puts us among the top U.S. tele- communications companies.
Our 90 percent of NERCO makes us one of America's top ten producers of coal, silver and gold.
And our just-announced
acquisition of Northwest Acceptance Corporation puts us in equipment leasing and finance.
Meanwhile, our Pacific Power & Light unit remains the largest investor-owned electric service company in the Pacific Northwest.
PacifiCorp. A rare com- bination of financial strength plus leadership in diversified growth.
For further infonnation, contact Steve Rafoth, vice president PacifiCorp, 851 S.W. Sixth Avenue, Portland, Oregon 97204. Phone (503) 243-4565 or 243-4757.
* PACIFICORP Electricity. Mining. Telecommunications. Leasing.
This content downloaded from 194.29.185.145 on Sun, 15 Jun 2014 22:11:25 PMAll use subject to JSTOR Terms and Conditions