practitioner perspectives: children’s use of … · iv foreword this research, a collaboration...
TRANSCRIPT
Practitioner perspectives: Children’s use of technology in the
Early Years
Dr Susie Formby National Literacy Trust
March 2014

About the National Literacy Trust
We are a national charity dedicated to raising literacy levels in the UK. Our research and
analysis make us the leading authority on literacy. We run projects in the poorest communities,
campaign to make literacy a priority for politicians and parents, and support schools.
Visit www.literacytrust.org.uk to find out more, donate or sign up for a free email newsletter. You can also find us on Facebook and follow us on Twitter.
Copyright
© National Literacy Trust 2014. You may report on findings or statistics included in this report if you accredit them to the National Literacy Trust.
Suggested reference for this report is: Formby, S (2014). Practitioner perspectives: Children’s use of technology in the Early Years. London: National Literacy Trust.
We will consider requests to use extracts or data from this publication provided that you:
• Acknowledge that the content is the work of the National Literacy Trust and provide appropriate references in any publications or accompanying publicity;
• State that any views expressed are yours and not necessarily those of the National Literacy Trust.
i
Table of contents Table of contents .........................................................................................................................i Figures and Tables ......................................................................................................................i Foreword.................................................................................................................................... iv Executive summary.....................................................................................................................v Introduction ................................................................................................................................ 1 What practitioners do ................................................................................................................. 3 Access to books, tablet computers and technology.................................................................... 3 Activities in the setting................................................................................................................ 3
Reading-related and other activities in the setting .................................................................. 3 How often children look at or read books and how often they use tablet computers in early years setting........................................................................................................................... 5 Is there a difference in the frequency of print activities if settings have access to a tablet computer? .............................................................................................................................. 6 How are tablet computers used in early years settings? ......................................................... 7
Confidence and enjoyment......................................................................................................... 9 Children’s confidence and enjoyment ..................................................................................... 9
Why children enjoy books and technology ................................................................................11 Attitudes to using technology in the early years.........................................................................13 Supporting learning at home .....................................................................................................15 Access, activities and attitudes in different settings...................................................................16
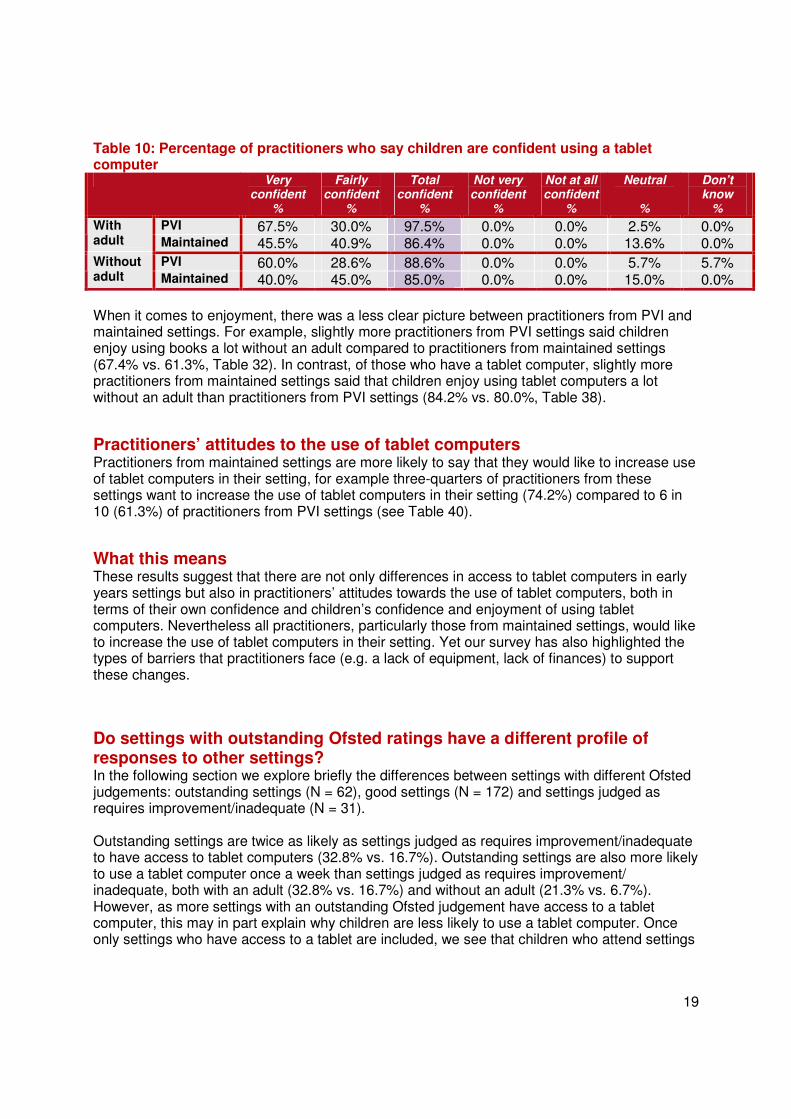
Access to books and looking at or reading stories .................................................................16 Access and use of tablet computers ......................................................................................16 Practitioners’ confidence using books and tablet computers with children .............................17 Children’s confidence and enjoyment using books and tablet computers ..............................18 Practitioners’ attitudes to the use of tablet computers............................................................19 What this means....................................................................................................................19 Do settings with outstanding Ofsted ratings have a different profile of responses to other settings?................................................................................................................................19
Conclusions ..............................................................................................................................20 Appendix...................................................................................................................................21
Tables and data.....................................................................................................................21 References ...............................................................................................................................52
Figures and Tables Figure 1: Access to books or tablet computers in early years settings........................................ 3 Figure 2: Percentage of practitioners who engage in reading-related activities with children at least once in a typical week........................................................................................................ 4 Figure 3: Percentage of practitioners that say they engage in other activities to support children's learning and development at least once in a typical week .......................................... 4 Figure 4: Activities on tablet computers...................................................................................... 7 Figure 5: Percentage of practitioners who use a tablet computer for creative activities, accessing resources, interactive activities or class activities....................................................................... 8 Figure 6: Percentage of practitioners who said they were very or fairly confident using books, tablet computers or technology .................................................................................................. 9

ii
Figure 7: Children’s confidence and enjoyment of looking at books and printed text or using tablet computers – with and without an adult.............................................................................10 Figure 8: Children’s confidence and enjoyment of looking at books and printed text or using tablet computers – with and without an adult.............................................................................11 Figure 9: Why do practitioners think children enjoy looking at or reading books........................12 Figure 10: Why do practitioners think children enjoy using tablet computers.............................12 Figure 11: Barriers to using technology in setting......................................................................13 Figure 12: Percentage of practitioners who agree with the statement that ‘to help them get on at school, it is important children learn to use computers and other technology from an early age’.................................................................................................................................................14 Figure 13: Percentage of practitioners who agree with the statement that 'traditional objects such as books, toys and alphabet blocks are more educational than computer-based games with sounds and letters'.............................................................................................................14 Figure 14: Parent’s barriers.......................................................................................................15 Figure 15: Percentage of practitioners that are very or fairly confident using books or tablet computers with children ............................................................................................................18
Table 1: Percentage of practitioners who say children look at books or stories with or without an adult in a typical week ................................................................................................................ 5 Table 2: Percentage of children that use a touch screen with or without an adult in a typical week .......................................................................................................................................... 5 Table 3: Percentage of children who have access to use of a touch screen with or without an adult in a typical week ................................................................................................................ 5 Table 4: Percentage of practitioners that support children in book-related activities with children in a typical week......................................................................................................................... 6 Table 5: Percentage of practitioners that engage in other activities to support children with children in a typical week ........................................................................................................... 6 Table 6: Percentage of children who look at stories in a typical week with or without an adult ..16 Table 7: Percentage of children who use a tablet computer with or without an adult in a typical week .........................................................................................................................................17 Table 8: Percentage of children who use a tablet computer with or without an adult in a typical week (those who have a tablet computer) .................................................................................17 Table 9: Percentage of children who are confident using books................................................18 Table 10: Percentage of practitioners who say children are confident using a tablet computer .19 Table 11: Sample characteristics ..............................................................................................22 Table 12: Books available in the setting ....................................................................................23 Table 13: Percentage of practitioners who have access to tablet computer and the mean number of tablet computers in settings......................................................................................24 Table 14: Percentage of practitioners who have access to resources such as technology, tablet computers and books in their setting.........................................................................................25 Table 15: Percentage of practitioners that support children with book-related activities in their setting in a typical week ............................................................................................................25 Table 16: Percentage of practitioners that support children with other activities in their setting in a typical week ...........................................................................................................................25 Table 17: Percentage of children who look at or read stories in a typical week with an adult.....26 Table 18: Percentage of children who look at or read stories in a typical week without an adult27 Table 19: Percentage of children who use a tablet computer with an adult in a typical week.....28 Table 20: Percentage of children who use a tablet computer without an adult in a typical week29
iii
Table 21: Percentage of children who have access to and use a tablet computer with an adult in a typical week ...........................................................................................................................30 Table 22: Percentage of children who have access to and use a tablet computer without an adult in a typical week ...............................................................................................................31 Table 23: Percentage of practitioners who are confident using books with children ..................32 Table 24: Percentage of practitioners who are confident using a tablet computer with children.33 Table 25: Percentage of practitioners who have a touch screen and are confident using it with children .....................................................................................................................................34 Table 26: Percentage of practitioners who are confident using technology in general with children .....................................................................................................................................35 Table 27: Percentage of children who are confident using books with an adult .........................36 Table 28: Percentage of children who are confident using books without an adult ....................37 Table 29: Percentage of children who are confident using a tablet computer with an adult .......38 Table 30: Percentage of children who are confident using a tablet computer without an adult ..39 Table 31: Percentage of children who enjoy looking at or reading books with an adult..............40 Table 32: Percentage of children who enjoy looking at or reading books without an adult.........41 Table 33: Percentage of children who enjoy using a tablet computer with an adult ...................42 Table 34: Percentage of children who enjoy using a tablet computer without an adult ..............43 Table 35: Percentage of children who have access to a tablet computer and are confident using it with an adult ...........................................................................................................................44 Table 36: Percentage of children who have access to a tablet computer and are confident using it without an adult ......................................................................................................................45 Table 37: Percentage of children who have access to a tablet computer and enjoy using it with an adult .....................................................................................................................................46 Table 38: Percentage of children who have access to a tablet computer and enjoy using a it without an adult.........................................................................................................................47 Table 39: Percentage of practitioners who think tablet computers are central or supplemental to structured activities or to free play.............................................................................................48 Table 40: Percentage of practitioners who would like to increase use of tablet computers in their setting .......................................................................................................................................49 Table 41: Percentage of practitioners who agree with the statement that ‘to help them get on at school, it is important children learn to use computers and other technology from an early age’.................................................................................................................................................50 Table 42: Percentage of practitioners who agree with the statement that ‘traditional objects such as books, toys and alphabet blocks are more educational than computer-based games with sounds and letters’....................................................................................................................51

iv
Foreword This research, a collaboration between Pearson and the National Literacy Trust, was designed to explore the use of technology by children in the early years. At Pearson and the National Literacy Trust we are keen to find out how young children’s communication and language skills are supported at home and in early years settings. With the introduction of technologies that are more suitable for use by children than ever before, there have been considerable changes in the way children’s language and communication skills may be supported. This is particularly the case for children in the early years for who touch-screen technology and tablet computers in particular have enabled them to communicate with the world using technology. We know that children’s use of tablet computers has increased considerably over the last year. For example, use of tablet computers by children aged five to 15 years has increased three-fold between 2012 and 2013, and over 1 child in 4 (28%) aged three to four uses a tablet computer at home (Ofcom, 2013). This project marks our first year-on-year research at the National Literacy Trust to explore how often children aged three to five years old use print and touch-screen technology with parents and with practitioners. We also explored how parents and practitioners support children’s use of print and touch-screen devices, their attitudes towards children’s use of different media, and whether this affects children’s attainment outcomes. Past research has shown that the early years are crucial to children’s development and it is what parents do rather than who parents are that has the biggest impact on children’s development (Sylva et al,. 2008). The majority of children (72%) are also supported outside the home in at least one form of early years childcare provision (DfE, 2013). We know that the quality of early years provision impacts on children’s later outcomes (Melhuish et al., 2004). Therefore, to build a complete picture of the early years it is important to explore the support children receive at home and outside the home. At Pearson and the National Literacy Trust we are interested in how changes in the use of screen-based activities might affect the ways parents and practitioners support children’s development at home and in early years settings, and their impact on children’s outcomes at age five. Never before have children had such a range of media available; how children are learning is changing fast and in a positive way, and all positive routes to learning should be supported.
v
Executive summary In 2013 we invited practitioners who work with three to five-year-olds to take part in an online survey to explore how they support children’s language and communication skills. One of our main interests was to explore how often practitioners and children engage in reading-related activities when in settings, and how often they use technology, in particular touch-screen devices, in their setting. 362 practitioners took part in the survey between May and July 2013.
As part of this research, we sought the views and explored the practices of parents of children aged three to five. The report on the findings from our parent survey can be found at http://www.literacytrust.org.uk/research/nlt_research/5953. This report focuses on the findings relating to practitioners only.
Access to books and tablet computers in early years settings All early years practitioners (100.0%) say children have access to books in their setting, and over a fifth say children have access to a tablet computer (22.0%). Reading-related and other activities We explored how often practitioners engage in a range of activities using books and printed texts with children. This included how often children look at books or stories, engage in book-related activities (e.g. talking about books) and other activities not using technology (e.g. singing songs or rhymes). In a typical week, practitioners tend to engage in reading-related and other activities supporting children’s communication and language development every day. For example, two-thirds (73.3%) of practitioners say they talk about books with children on a daily basis and more than three-quarters (83.3%) of practitioners say they sing songs and rhymes with children every day. When exploring reading-related activities, practitioners were asked how often children look at books or stories in their setting, both with and without an adult. Children are more likely to look at or read stories every day in a typical week without an adult than with an adult (84.8% vs. 74.4%). How often children use tablet computers When exploring children’s use of tablet computers in early years settings, practitioners are more likely to say that children use a tablet computer with an adult than without an adult once in a typical week (20.9% vs. 13.9%). Practitioners say that children use a tablet computer in their setting less frequently than they look at or read books. For example, practitioners say that more children use a tablet computer with an adult once or twice a week (8.7%) than daily (7.2%) or every few days (4.9%). However, 78.0% of practitioners say that children don’t have access to a tablet computer in their setting. Therefore it is important to explore how often children who have access to a tablet computer use the device for activities in their setting. Of those with access to a tablet computer, children are more likely to use the device at least once in a typical week with an adult than they are to use the device without an adult (94.7% vs. 63.2%). Children are also more likely to use tablet computers once or twice a week than every day (39.5% vs. 32.9%). Most practitioners say they support children’s use of tablet computers –

vi
for example, by showing children how to choose a programme (84.6%), how to use a programme (79.5%) and by offering help after errors (67.9%). Confidence and enjoyment Practitioners are confident in using both books (99.1%), and touch screens (88.1%) with children in their setting. More generally, all practitioners were confident in using technology in their setting (93.3%). Practitioners were also asked how confident they think children are when they look at books and when they use tablet computers, both with and without an adult. Interestingly, practitioners say that children are more confident engaging in these activities with an adult than without an adult (93.7% vs. 82.2%). Practitioners are also more likely to say that children are very confident or fairly confident using a tablet computer without an adult compared with looking at books without an adult (85.8% vs. 78.5%). Practitioners were also asked how much they think children enjoy looking at books or stories, and how much they enjoy using a tablet computer, both with and without an adult. Practitioners were more likely to say children enjoy looking at books a lot with an adult rather than without an adult (95.9% vs. 66.9%). However, practitioners say children enjoy using a tablet computer irrespective of whether they use the device with or without an adult (76.1% vs. 73.7%). Furthermore, practitioners are more likely to say children enjoy using a tablet computer a lot without an adult than they are to say children enjoy looking at or reading books a lot without an adult (73.7% vs. 66.9%). A similar profile of responses was found irrespective of whether children use a tablet computer with an adult (22.0%) or not (78.0%). What practitioners think about technology We asked practitioners about their attitudes to children’s use of technology in the early years, including how educational they think technology is and whether they would like to increase the use of tablet computers in their setting. More than 8 in 10 practitioners think that technology is supplemental rather than central to structured activities and free play (84.9%, 80.8%). Most practitioners have positive views about technology – for example, three-quarters of practitioners think it is important to learn to use technology from an early age (74.8%) and two-thirds would like to increase the use of tablet computers in their setting (65.8%). Practitioners say that a lack of equipment (43%) and financial reasons (38%) are the most common barriers to accessing technology in their setting. Type of early years provider We also explored if there are differences in access to tablet computers and their use in different early years settings – Private, Voluntary and Independent (PVI) or maintained settings. Practitioners from PVI settings have greater access to tablet computers than practitioners from maintained settings (23.8% vs. 18.7%). Practitioners from PVI settings are more likely to say that they use a tablet computer with children at least once a week (22.7% vs. 17.2%) and that children use a tablet computer without an adult at least once a week (15.5% vs. 11.2%). Practitioners from PVI settings not only use tablet computers more often than practitioners from maintained settings, they also have different attitudes towards their use. For example, of those who have access to a tablet computer, practitioners from PVI settings are more likely to say they are confident using the device with children than practitioners from maintained settings (97.7% vs. 68.0%). Similarly, of those with access to a tablet computer, practitioners from PVI
vii
settings are more likely to say that children are very confident using tablet computers than practitioners from maintained settings – both with an adult (67.5% vs. 45.5%) and without an adult (60.0% vs. 40.0%). However, practitioners from maintained settings are more likely than practitioners from PVI settings to say that they want to increase the use of tablet computers in their setting (74.2% vs. 61.3%). These findings not only suggest a divide in the availability of tablet computers between settings, but also a divide in practitioners’ attitudes towards children’s use of technology: more practitioners from maintained settings than from PVI settings would like to increase their use of tablet computers. Yet our survey has also highlighted the types of barriers that practitioners face – for example, a lack of equipment or finances to support these changes.
What this tells us Our research found that one in five early years practitioners say that children have access to a touch screen in their setting. Practitioners have positive attitudes to children’s use of touch-screen devices in their settings. For example, the majority of practitioners think it is important for children to learn to use technology from an early age. Yet, the majority of early years practitioners use books and non-technology for their daily activities with children. We have, however, identified that PVI settings have greater access to touch screens and use touch screens more frequently than practitioners from maintained settings. Not only do practitioners from PVI settings use touch screens more often, they also feel more confident using touch screens with children than practitioners from maintained settings. Nevertheless, the majority of practitioners would like to increase the use of touch screens in their setting. Yet there are a number of barriers (for example, lack of finances, lack of resources) to integrating touch-screen technology in early years settings.
1
Introduction In this research, we explore the use of touch-screen technology by practitioners and children in early years settings. Our report shows the way children’s learning takes place is changing fast. A fifth of early years practitioners say tablet computers are available for children to use in their setting and the majority of practitioners are keen to use more technology in their setting, for example two-thirds of practitioners (65.8%) would like to increase children’s use of tablet computers. Nevertheless, practitioners value the use of print-based media with children and think it is important to strike a balance between supporting learning using print-based books and introducing children to technology. We focus on the availability of technology and tablet computers in early years settings, the way practitioners use these devices with children, and practitioners’ attitudes towards the use of tablet computers. By exploring the use of technology with children aged three to five, we capture the range of activities and abilities that span the transition from the home to starting school. In our accompanying survey we explored parents’ use of technology with three to five-year-olds, as well as parents’ attitudes towards technology, available here: [Insert link]. A wide range of childcare provision is found within the early years (DfE, 2013). Children aged three and four are more likely to attend formal childcare providers such as nurseries, playgroups and childminders than informal providers such as family or friends (87% vs. 30%). Children in this age group attend the broadest range of providers, including reception classes (29%), nursery classes (17%), nursery schools (14%), playgroups (15%) and day nurseries (13%). Once children are of formal school age, they tend to access after-school clubs more frequently (37% of five to seven-year-olds). In the current research we focus on provision within a range of formal daycare providers, rather than exploring informal childcare provision with family or friends. Attending medium-quality or high-quality settings in the early years has a significant effect on children’s development, both at entry to primary school and on their later cognitive outcomes1. Quality of childcare settings encompasses both process elements (e.g. adult-child interactions, available activities and learning opportunities) and structural elements (e.g. adult-child ratios, teacher education and training)2. Similar to past research (e.g. Sylva et al., 2010), quality of process elements is explored, particularly available activities and learning opportunities for children in settings. Past research has explored a wide range of book-related and other activities that practitioners engage in with children in their setting3. Previous research highlights these activities impact on children’s cognitive outcomes, for example language play (e.g. singing songs and rhymes) is a precursor for children’s later phonological awareness4. Preschool quality
1 Sylva et al. (2004). Effective provision of preschool education (EPPE) Project: Findings from the
preschool period. Department for Education and Skills. Research Brief RBX15-03. Sylva, K. Et al. (2008). Final report from the primary phase: Preschool, School and Family Influences on Children’s Development during Key Stage 2 (Age 7-11). Research Report DCSF-RR061. 2 Sylva, K. (2010). Quality in early childhood settings. In Sylva, K., Melhuish, E., Sammons, P., Siraj-
Blatchford, I. & Taggart, B. (2010) Early Childhood Matters: Evidence from the Effective Preschool and Primary Education Project. Abingdon, Oxford, Routledge. Chapter 5: 70-89. 3 Green, S.D., Peterson, R., & Lewis, J.R. (2006). Language and Literacy Promotion in Early Childhood
Settings: A Survey of Centre-Based Practices. Early Childhood Research & Practice, 8 (1). 4 Singer, D.G., Golinkoff, R.M., & Hirsh-Pasek, K. (2006). Play = Learning: How play motivates and
enhances children’s cognitive and social-emotional growth. Oxford University Press: Oxford.
2
and effectiveness impacts on children’s reading and writing outcomes5, albeit more strongly for mathematics than reading at the end of Year 56. Indeed, research highlights that the effects of preschool provision are visible in subsequent stages of their education7. Children’s use of a broad range of technology in early years settings and practitioners’ attitudes to using this technology have been explored in past research. A range of electronic devices are typically available in nursery settings8. However, with the exception of supporting children with learning difficulties, electronic equipment was infrequently integrated into pedagogic planning. Practitioners reported a lack of confidence and uncertainty of the value of technology, and were concerned that technology may be damaging to children’s development. Nevertheless, they agreed technology would be central to children’s future lives. Practitioners’ view that technology is central to children’s future lives supports the proposal that to be literate today, children must learn to effectively use a range of media. However, within early years education there tends to be a focus on print-based mediums with guidance on how to develop core literacy skills rather than utilising and integrating new technologies in early years settings9. Yet touch-screen technology is more age appropriate for young children to use, particularly when compared with more traditional technologies such as television and video10. This report explores how much technology is used in settings and the activities that practitioners engage in within their setting to support children’s language and communication development. To explore the role of technology, practitioners were asked how often they engaged in activities using books and printed texts, and how often they engaged in activities using tablet computers. These questions are in the context of rapidly changing availability of tablet computers and other devices in children’s homes. A recent Ofcom survey found that tablet computer use by children aged five to 15 has increased three-fold between 2012 and 2013 and that over a quarter (28%) of children aged three to four years old use a tablet computer at home. It is therefore important to explore not only the use of technology but more specifically the use of tablet computers within early years settings. The current research will explore how much technology is available for use by children and whether settings are integrating the use of tablet computers or other touch-screen technologies into their everyday teaching and learning.
5 These included two standardised reading and mathematics from the British Ability Scales Second
Edition (Elliot, Smith and McCulloch, 1996). 6 Sammons, P., Sylva, K., Melhuish, E., Siraj-Blatchford, I., Taggart, B., Grabbe, Y., Barreau, S., (2007).
Influences on children’s attainment and progress in Key Stage 2: Cognitive outcomes in Year 5. 7 For example, Sammons, P., Sylva, K., Melhuish, E., Siraj-Blatchford, I., Taggart, B., Hunt, S. (2008).
Influences on children’s attainment and progress in Key Stage 2: Cognitive outcomes in Year 6. 8 Wolfe, S. and Flewitt, R. (2010). New technologies, new multimodal literacy practices and young
children’s metacognitive development. Cambridge Journal of education 40 (4), 387-399. 9 Flewitt, R. (2012). Multimodal literacies in the early years. The Centre for Research in Educational
Technology. The Open University, Milton Keynes. 10
Kirkorian, H.L. & Pempek, T.A. (2013). Toddlers and touch screens: Potential for Early Learning? Zero to Three Journal, 33, 4.

3
What practitioners do This survey explores access to books and tablet computers in early years settings, how often children look at print-based stories, and how often tablet computers are used for activities in early years settings. We explored not only if children engage in activities with a practitioner, but also if they engage in activities without an adult. A total of 362 practitioners took part in the online survey between May and July 2013.
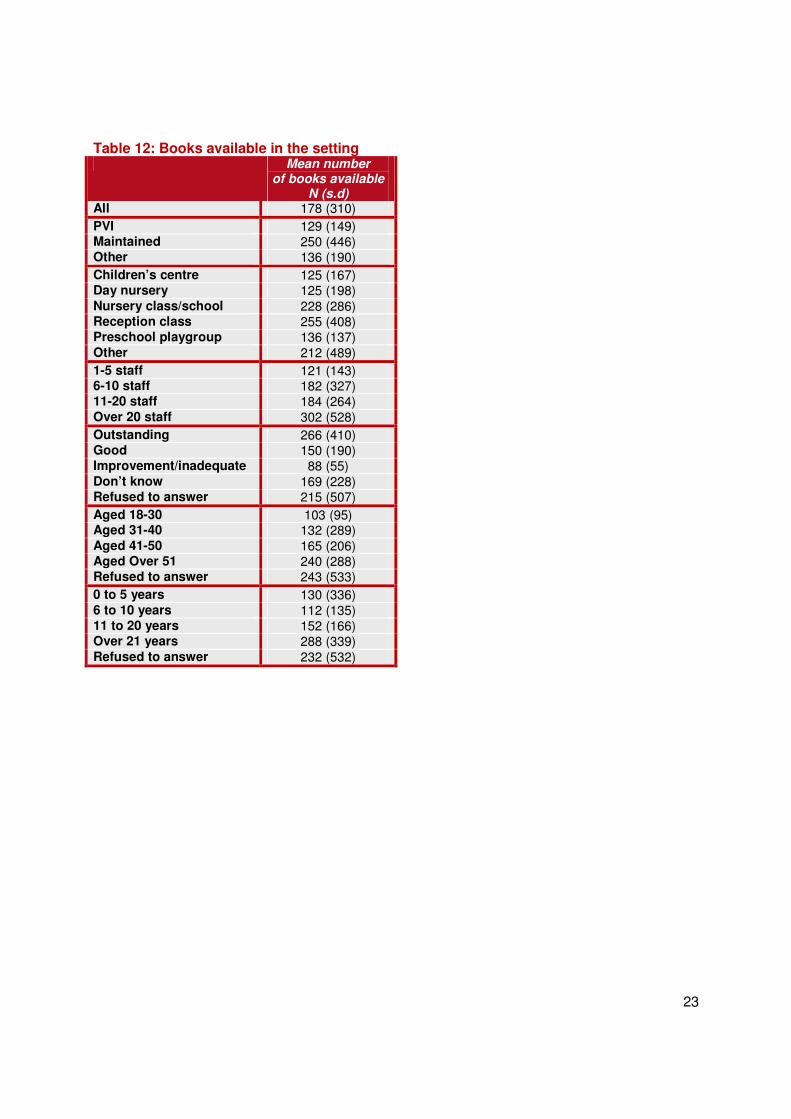
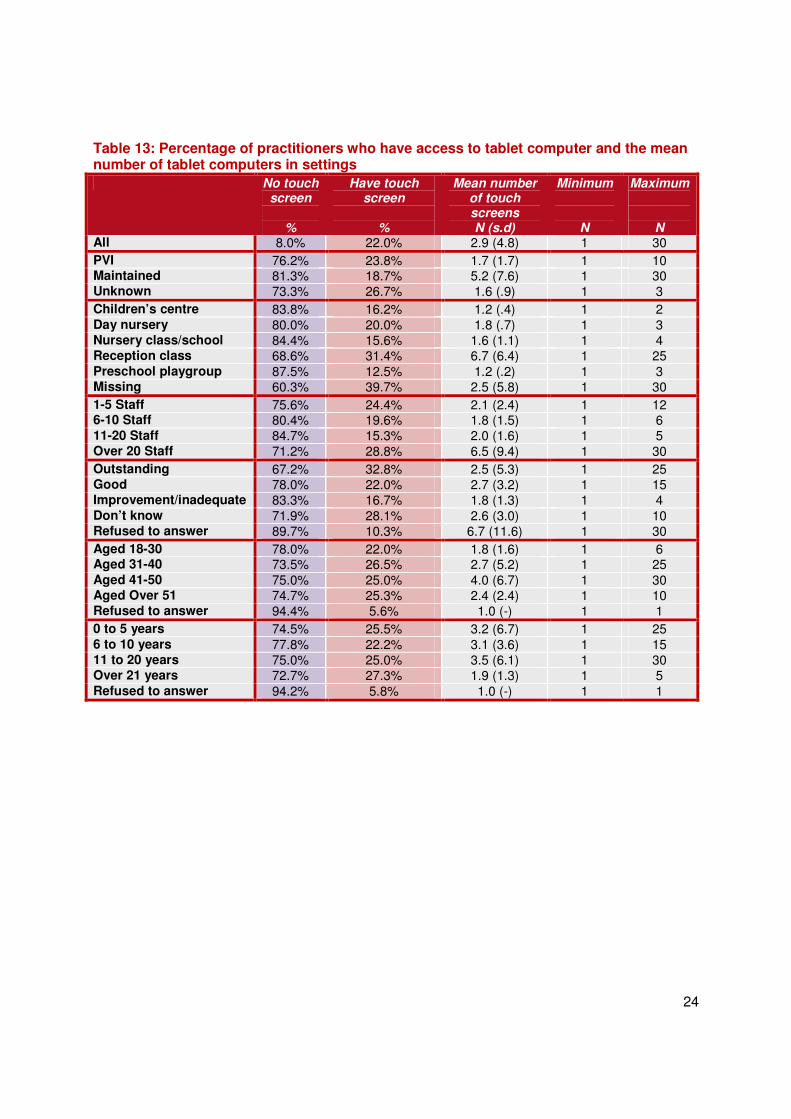
Access to books, tablet computers and technology As expected, all practitioners (100.0%) said children have access to books in their setting, and on average there are 178 books available (Table 12). Over a fifth (22.0%) of settings have access to a tablet computer, and on average there are three tablet computers available (see Table 13). Figure 1 shows how many practitioners say they have access to books and tablet computers in their setting. Figure 1: Access to books or tablet computers in early years settings
We also explored access to a range of technologies in early years settings. The most common types of technology available in settings are digital cameras (79.6%), desktop computers (65.5%) and laptops (41.7%, see Table 14).
Activities in the setting
Reading-related and other activities in the setting Practitioners were asked if they engage in the following reading-related activities to support children in their setting in a typical week: talk about books, teach children the features of books or help children to choose books at an appropriate level. As would be expected in a professional setting, practitioners engage in a variety of reading-related activities with children. Figure 2 shows that nearly all practitioners engage in reading-related activities at least once in a typical week.
4
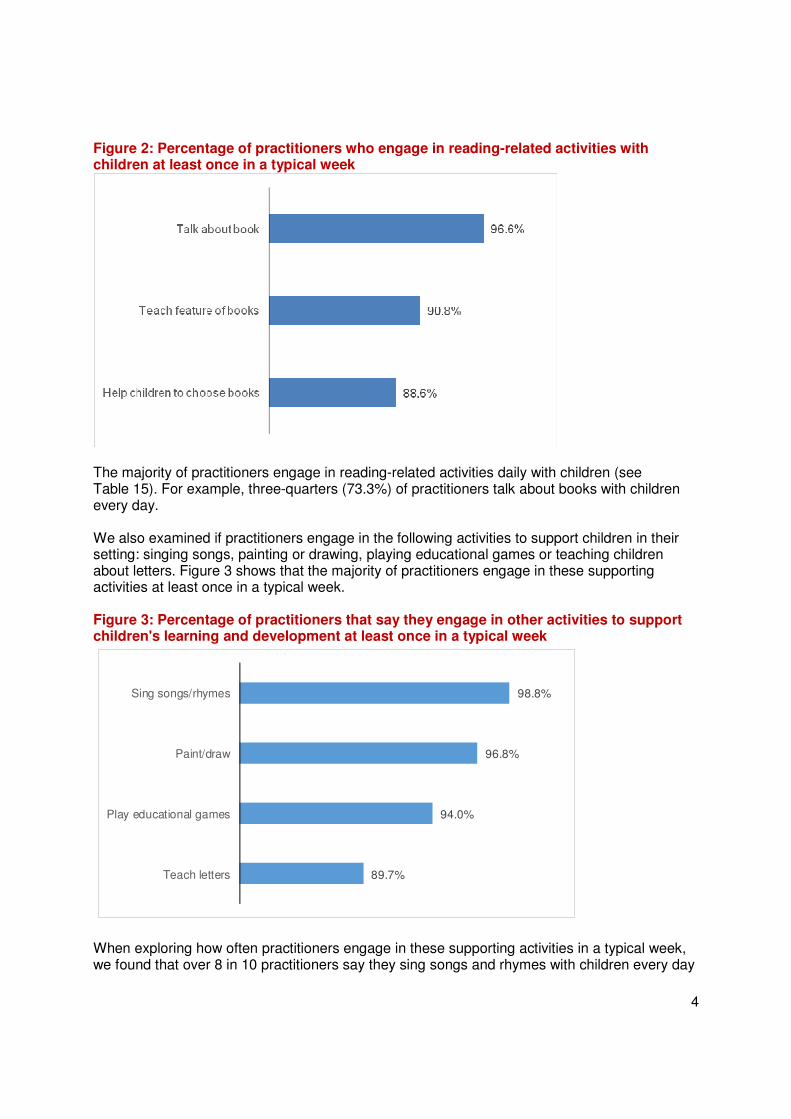
Figure 2: Percentage of practitioners who engage in reading-related activities with children at least once in a typical week
The majority of practitioners engage in reading-related activities daily with children (see Table 15). For example, three-quarters (73.3%) of practitioners talk about books with children every day. We also examined if practitioners engage in the following activities to support children in their setting: singing songs, painting or drawing, playing educational games or teaching children about letters. Figure 3 shows that the majority of practitioners engage in these supporting activities at least once in a typical week. Figure 3: Percentage of practitioners that say they engage in other activities to support children's learning and development at least once in a typical week
98.8%
96.8%
94.0%
89.7%
Sing songs/rhymes
Paint/draw
Play educational games
Teach letters
When exploring how often practitioners engage in these supporting activities in a typical week, we found that over 8 in 10 practitioners say they sing songs and rhymes with children every day
5
(83.3%), while over three-quarters (77.9%) paint or draw every day. Approximately 6 in 10 play educational games (61.8%) and teach children about letters (57.8%) every day in a typical week (see Table 15 and Table 16).
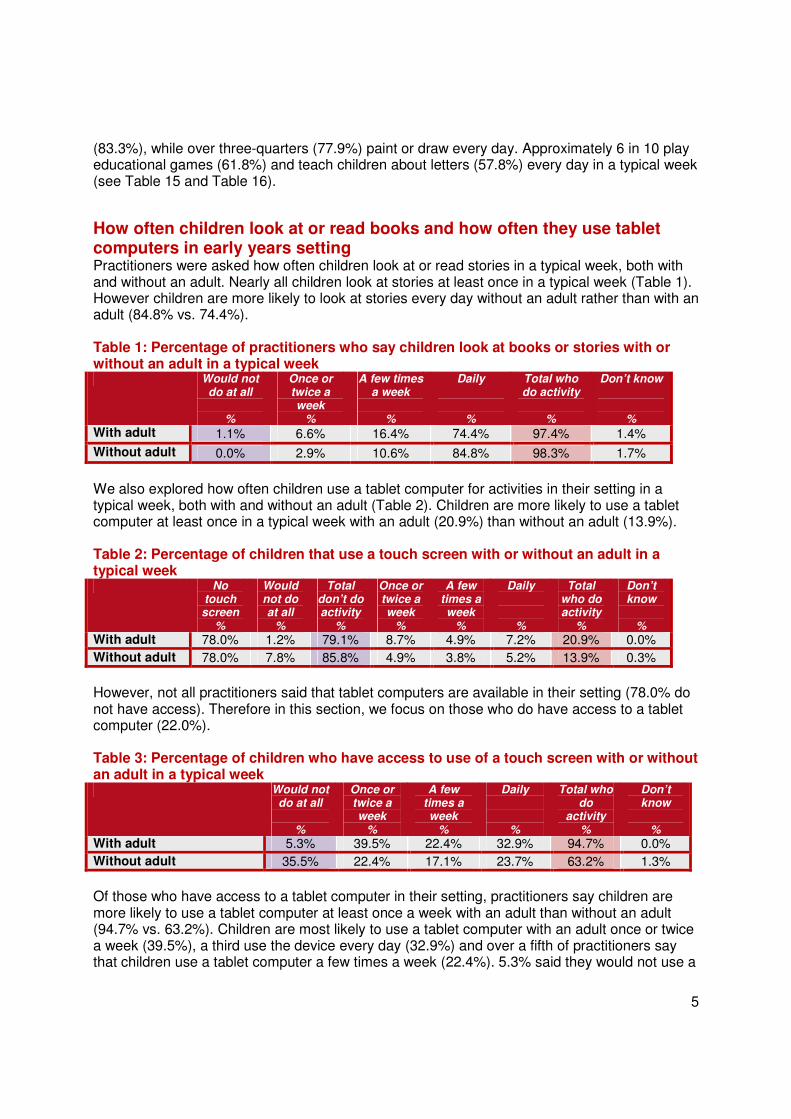
How often children look at or read books and how often they use tablet computers in early years setting Practitioners were asked how often children look at or read stories in a typical week, both with and without an adult. Nearly all children look at stories at least once in a typical week (Table 1). However children are more likely to look at stories every day without an adult rather than with an adult (84.8% vs. 74.4%). Table 1: Percentage of practitioners who say children look at books or stories with or without an adult in a typical week
Would not do at all
%
Once or twice a week
%
A few times a week
%
Daily
%
Total who do activity
%
Don’t know
%
With adult 1.1% 6.6% 16.4% 74.4% 97.4% 1.4%
Without adult 0.0% 2.9% 10.6% 84.8% 98.3% 1.7%
We also explored how often children use a tablet computer for activities in their setting in a typical week, both with and without an adult (Table 2). Children are more likely to use a tablet computer at least once in a typical week with an adult (20.9%) than without an adult (13.9%). Table 2: Percentage of children that use a touch screen with or without an adult in a typical week
No touch screen
%
Would not do at all
%
Total don’t do activity
%
Once or twice a week
%
A few times a week
%
Daily
%
Total who do activity
%
Don’t know
%
With adult 78.0% 1.2% 79.1% 8.7% 4.9% 7.2% 20.9% 0.0%
Without adult 78.0% 7.8% 85.8% 4.9% 3.8% 5.2% 13.9% 0.3%
However, not all practitioners said that tablet computers are available in their setting (78.0% do not have access). Therefore in this section, we focus on those who do have access to a tablet computer (22.0%). Table 3: Percentage of children who have access to use of a touch screen with or without an adult in a typical week
Would not do at all
%
Once or twice a week
%
A few times a week
%
Daily
%
Total who do
activity %
Don’t know
%
With adult 5.3% 39.5% 22.4% 32.9% 94.7% 0.0%
Without adult 35.5% 22.4% 17.1% 23.7% 63.2% 1.3%
Of those who have access to a tablet computer in their setting, practitioners say children are more likely to use a tablet computer at least once a week with an adult than without an adult (94.7% vs. 63.2%). Children are most likely to use a tablet computer with an adult once or twice a week (39.5%), a third use the device every day (32.9%) and over a fifth of practitioners say that children use a tablet computer a few times a week (22.4%). 5.3% said they would not use a

6
tablet computer in a typical week. Half as many children who have access to a tablet computer use it daily with a practitioner compared to children who look at or read stories daily without a practitioner (32.9% vs. 74.4%, also see Table 1).
Is there a difference in the frequency of print activities if settings have access to a tablet computer? In this section we explore if there is a difference in how often practitioners engage in reading-related (e.g. teach children the features of books) and other activities (e.g. singing songs and rhymes) according to whether settings have access to print only, or to print and tablet computers (mixed media). Table 4: Percentage of practitioners that support children in book-related activities with children in a typical week
Would not do at
all %
Once or twice a week
%
A few times a week
%
Daily
%
Total who do activity
%
Don’t know
%
Print only 4.4% 16.2% 21.0% 52.6% 89.8% 5.9% Feature of books
Mixed media 2.6% 22.4% 11.8% 60.5% 94.7% 2.6%
Print only 2.2% 6.6% 16.9% 72.4% 95.9% 2.2% Teach features of books Mixed media - 5.3% 17.1% 76.3% 98.7% 1.3%
Print only 6.6% 12.5% 18.4% 57.0% 87.9% 5.5% Books at appropriate level Mixed media 5.3% 10.5% 21.1% 59.2% 90.8% 3.9%
Practitioners who have access to mixed media are slightly more likely to engage in reading-related and other activities with children (Table 4). For example, practitioners who have access to mixed media are more likely to talk about the features of books daily than practitioners who have access to print only (94.7% vs. 89.8%). Table 5: Percentage of practitioners that engage in other activities to support children with children in a typical week
Would not do at
all %
Once or twice a week
%
A few times a week
%
Daily
%
Total who do activity
%
Don’t know
%
Print only 8.1% 13.6% 18.8% 55.5% 87.9% 4.1% Teach about letters Mixed media 2.6% 10.5% 19.7% 65.8% 96.0% 1.3%
Print only .4% 4.0% 10.3% 84.2% 98.5% 1.1% Sing songs and rhymes Mixed media - 5.3% 14.5% 80.3% 100.0% -
Print only 4.8% 13.2% 18.8% 60.7% 92.7% 2.6% Play educational games Mixed media 1.3% 11.8% 21.1% 65.8% 98.7% -
Print only 2.6% 3.7% 13.2% 79.4% 96.3% 1.1% Paint or draw Mixed media 1.3% 3.9% 22.4% 72.4% 98.7% -

7
Table 5 shows that practitioners who have access to mixed media are also slightly more likely to support children in other activities in a typical week. For example, practitioners who use mixed media in their setting are more likely to teach children the features of letters daily compared to practitioners who have access to print only (65.8% vs. 55.5%). There were smaller differences between how often practitioners engage in the remaining activities.
How are tablet computers used in early years settings? Figure 4 shows that the activity tablet computers are most frequently used for is gathering information, for example information associated with structured activities in the setting.
Figure 4: Activities on tablet computers
In our focus groups practitioners also provided clear examples of the ways in which tablet computers are used in their setting (see Box 1). Box 1: Focus groups: Practitioners’ use of tablet computers Creative activities “We retold a story, then innovated the story and made it our own, then voice-recorded on the iPad; we then created the scenes from the story and photographed the scenes. We edited the pictures as necessary, for example the children used a drawing programme to add flames to one picture. Then I put their work together as a ‘movie’.” Interactive activities “We use iPads for independent games that we select. The main apps I personally use are phonics and maths.”
We further divided the types of activities that practitioners engage in using a tablet computer into creative activities, accessing resources, interactive activities and class activities. Figure 5 shows that two-thirds of practitioners mentioned using tablet computers for creative activities (67%). Of those who mentioned creative activities, over a third mentioned taking photos (35.0%) and mark making (35.0%) and less than a third said they use a tablet computer for filming (30%).

8
Over half of practitioners (59%) say they use tablet computers for accessing resources. Of these practitioners, most likely to use a computer to research topics (43%), followed by visiting apps and websites with links to songs and rhymes (35%) and using apps for stories (22%). Figure 5: Percentage of practitioners who use a tablet computer for creative activities, accessing resources, interactive activities or class activities
67.0%
59.0%
54.0%
21.0%
Creative activities
Accessing resources
Interactive activities
Class activities
Over half of practitioners (54.0%) mentioned using a tablet computer for interactive activities. Of these, practitioners were most likely to say they use the device for educational games (38.0%), a third mentioned educational apps (33.0%) and nearly 3 in 10 mentioned accessing other games (29.0%). Practitioners use tablet computers for class activities less often (21.0%). Of these half use tablet computers as a tool for classroom activities (50.0%), a quarter said they use them as an assessment tool (25.0%) and a quarter use them as a motivational tool (25%). How practitioners support children’s use of technology Early years practitioners who said they had touch-screen technology available in their setting were asked if they engage in any of the following activities to scaffold children’s use of technology:
• Suggest or select appropriate programme
• Explain how to use technology
• Suggest alternative actions
• Demonstrate how to use tools, for example how to delete
• Move children to a more appropriate level
• Offer help after errors
• Provide feedback A third of practitioners (35.9%) engaged in all of the above activities when supporting children’s use of technology. The activities practitioners engaged in most frequently were suggesting a programme to use (84.6%), explaining how to use a programme (79.5%) and offering help after errors (67.9%). Practitioners also highlighted how they identify software to use on tablet computers in our focus group (see Box 2).
9
Box 2 - Focus group: Practitioners’ attitudes and experiences of Apps How to find Apps “There are so many [Apps] out there and a lot of phonics are American! I tend to use or download ones I’ve seen recommended from other teachers or networks.” “I tend to try them [Apps] out at home first, so we don’t waste time trying to find out what each one does.” “There are so many Apps available, but I couldn’t find a recommendations list, so I ended up downloading lots and trying them out.”
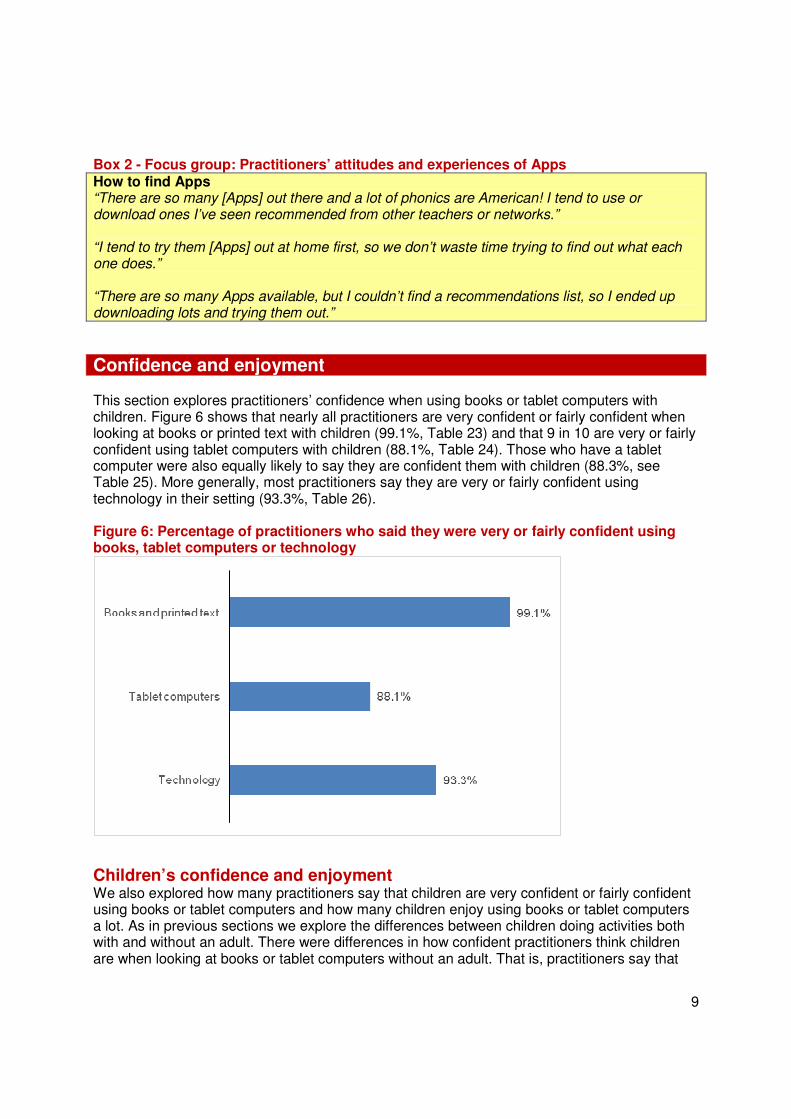
Confidence and enjoyment This section explores practitioners’ confidence when using books or tablet computers with children. Figure 6 shows that nearly all practitioners are very confident or fairly confident when looking at books or printed text with children (99.1%, Table 23) and that 9 in 10 are very or fairly confident using tablet computers with children (88.1%, Table 24). Those who have a tablet computer were also equally likely to say they are confident them with children (88.3%, see Table 25). More generally, most practitioners say they are very or fairly confident using technology in their setting (93.3%, Table 26). Figure 6: Percentage of practitioners who said they were very or fairly confident using books, tablet computers or technology
Children’s confidence and enjoyment We also explored how many practitioners say that children are very confident or fairly confident using books or tablet computers and how many children enjoy using books or tablet computers a lot. As in previous sections we explore the differences between children doing activities both with and without an adult. There were differences in how confident practitioners think children are when looking at books or tablet computers without an adult. That is, practitioners say that

10
more children are very confident or fairly confident using a tablet computer without an adult, compared to looking at or reading books without an adult (85.8% vs. 78.5%, Figure 7). There were also differences in how confident practitioners think children are when looking at books and printed texts with an adult. That is, practitioners are more likely to say that children are confident looking at books with an adult than without (95.3% vs. 78.5%, Table 27 and Table 28). To a lesser extent, practitioners also say that they think children are more confident using a tablet computer with an adult than without (92.1% vs. 85.8%, see Table 29 and Table 30). Figure 7: Children’s confidence and enjoyment of looking at books and printed text or using tablet computers – with and without an adult
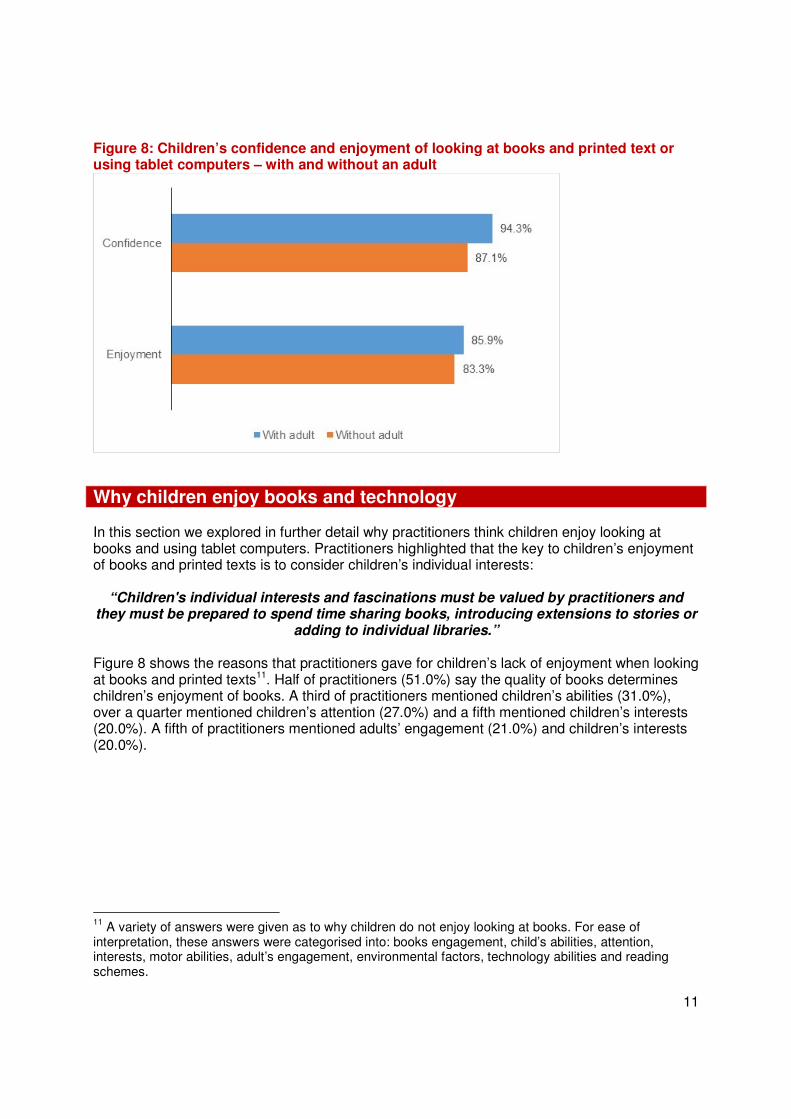
When children’s enjoyment of activities was explored, we also found differences between children doing activities with and without an adult. For example, practitioners are more likely to say that children enjoy looking at or reading books a lot, with an adult rather than without an adult (95.9% vs. 66.9%, see Table 31 and Table 32). In comparison, irrespective of whether children use a tablet computer with or without an adult, practitioners are equally likely to say children enjoy using a tablet computer a lot (76.1% vs. 73.7%, see Table 33 and Table 34). Practitioners are also more likely to say children enjoy looking at stories with an adult a lot, than they are to say children enjoy using a tablet computer a lot without an adult (95.9% vs. 76.1%). In contrast, they are more likely to say children enjoy using a tablet computer a lot without an adult than they are to say children enjoy looking at stories a lot without an adult (73.7% vs. 66.9%). However, not all children have access to a tablet computer, therefore it is also important to explore whether practitioners say children are confident or enjoy using a tablet computer a lot when they have access to a tablet computer. In comparison to the above data, Figure 8 shows that of those who use a tablet computer, slightly more practitioners say that children are very confident or fairly confident using the device, both with and without an adult (94.3% vs. 87.1% Table 35 and Table 36). It also shows that more practitioners say children enjoy using the device a lot, both with and without an adult (85.9% vs. 83.3%, see Table 37 and Table 38).
11
Figure 8: Children’s confidence and enjoyment of looking at books and printed text or using tablet computers – with and without an adult
Why children enjoy books and technology In this section we explored in further detail why practitioners think children enjoy looking at books and using tablet computers. Practitioners highlighted that the key to children’s enjoyment of books and printed texts is to consider children’s individual interests:
“Children's individual interests and fascinations must be valued by practitioners and they must be prepared to spend time sharing books, introducing extensions to stories or
adding to individual libraries.”
Figure 8 shows the reasons that practitioners gave for children’s lack of enjoyment when looking at books and printed texts11. Half of practitioners (51.0%) say the quality of books determines children’s enjoyment of books. A third of practitioners mentioned children’s abilities (31.0%), over a quarter mentioned children’s attention (27.0%) and a fifth mentioned children’s interests (20.0%). A fifth of practitioners mentioned adults’ engagement (21.0%) and children’s interests (20.0%).
11
A variety of answers were given as to why children do not enjoy looking at books. For ease of interpretation, these answers were categorised into: books engagement, child’s abilities, attention, interests, motor abilities, adult’s engagement, environmental factors, technology abilities and reading schemes.

12
Figure 9: Why do practitioners think children enjoy looking at or reading books
51.0%
31.0%
27.0%
21.0%
20.0%
5.0%
2.0%
1.0%
Books engagement
Child's abilities
Child's attention
Adult's engagement
Child's interest
Environment
Child's behaviour
Child's motor abilities
Why children enjoy using tablet computers In the previous section, practitioners said the quality of the book determines children’s enjoyment of books. Children’s enjoyment is also determined by their engagement (abilities, attention, interests) and how adults engage with books. We were also interested in why practitioners think children might enjoy using technology, such as tablet computers (Figure 10). Figure 10: Why do practitioners think children enjoy using tablet computers
36.0%
21.0%
21.0%
18.0%
18.0%
13.0%
11.0%
11.0%
7.0%
7.0%
Intuitive
Independent
Engaging
Familiar
Interactive
Enjoyable
Portable
Confident
Share
Visual
Figure 10 shows that over a third (36.0%) of practitioners say that children enjoy using tablet computers because they are intuitive to use. A fifth of practitioners (21.0%) mentioned children can use tablet computers independently and a fifth (21.0%) mentioned they are engaging. Nearly a fifth of practitioners say children enjoy using tablet computers because they are interactive (18.0%).

13
Attitudes to using technology in the early years In this section, we explored practitioners’ attitudes to the use of books and technology with children in their setting. We looked at how central technology is to structured activities and free play, if practitioners would like to increase use of technology in their setting and the barriers to this. We also explored how important practitioners think it is for children to learn to use technology from an early age to get on at school. Most practitioners think technology is supplemental rather than central to structured activities and to free play (84.9%, 80.8%, see Table 39). More practitioners think that technology should not be used in free play compared to structured activities (9.7% vs. 6.0%). Practitioners have positive views towards increasing the use of tablet computers in their setting. Two-thirds of practitioners (65.8%) would like to increase their use of tablet computers in their setting, but a third (34.2%) do not want to increase use in their setting (see Table 40). Of those who do not want to increase the use of tablet computers in their setting, the most common reasons were financial (24.0%), because language and communication skills are better supported by printed text (21.0%) and because a balance between technology and non-technology is needed (21.0%).
Barriers to using technology in settings Practitioners highlighted a lack of equipment and finances stop them from using technology in their setting (Figure 11). Figure 11: Barriers to using technology in setting
43.0%
38.0%
13.0%
7.0%
5.0%
3.0%
3.0%
2.0%
9.0%
Equipment
Money
Time
Support to integrate
Support from senior staff
Interest
Skill of children
Incentives
Other
Practitioners’ attitudes to children’s use of books and technology in early years settings To explore practitioners’ attitudes to children’s use of books and technology in early years settings, practitioners were asked how much they agree or disagree with the following two statements: 'To get on at school, it is important children learn to use technology from an early age’ and ‘Traditional objects such as books, toys and alphabet blocks are more educational than computer-based games with sounds and letters.’

14
Figure 12: Percentage of practitioners who agree with the statement that ‘to help them get on at school, it is important children learn to use computers and other technology from an early age’
28.8%
46.0%
7.7%
2.5%
14.7%
0.3%
Strongly agree
Agree
Disagree
Strongly disagree
Neutral
Don't know
As with our parent survey, we found practitioners had positive views: three-quarters (74.8%) of early years practitioners strongly agree or agree that to get on at school it is important for children to learn to use technology from an early age (Figure 12). Figure 13: Percentage of practitioners who agree with the statement that 'traditional objects such as books, toys and alphabet blocks are more educational than computer-based games with sounds and letters'
21.2%
18.4%
14.4%
2.8%
42.9%
0.3%
Strongly agree
Agree
Disagree
Strongly disagree
Neutral
Don't know
Similar to our parent survey, practitioners were most likely to say they neither agreed nor disagreed with the statement that books are more educational than technology (42.9%, Figure 13). A fifth of practitioners (21.2%) said they strongly agree and one in six said they agree that books are more educational than technology. However, one in six said that they disagree or strongly disagree (17.2%) with the proposal that books are more educational than technology.

15
Supporting learning at home Previous research has highlighted the importance of the home learning environment to children’s later cognitive development12. We therefore explored the reasons why practitioners thought parents might not support learning at home. Consistent with our parent survey, the majority of practitioners think that time is the main barrier that stops parents engaging in activities with their children at home (Figure 14). Figure 14: Parent’s barriers
In our focus group, practitioners said that with perseverance, parents can be supported to share activities in the home with their child (see Box 3). Practitioners support the home learning environment in a number of ways, such as encouraging communication and using home learning journals, as well as facilitating communication between the setting and parents. As this shows, practitioners engage in a variety of ways to support parents and the home learning environment and practitioners are keen to engage parents in these activities. Box 3 - Focus groups: Engaging parents Engaging parents “It's trial and error... Some parents are reluctant, but we have found with perseverance that all parents do begin to engage and we only choose activities that we know children are interested in (through observations) or that they have chosen themselves.” “Lots of communication with them about what they use at home...” Home learning journals “We send home ‘home learning journals’ for parents to stick in photos and comments about their children’s experiences and learning at home plus any pictures, writing or similar they may have done with their child or their child has done independently.” Communicating with parents “We send a weekly newsletter showing what overall learning we have done that week.”
12
For example Sylva et al. (2004).

16
“Parents forums are held once a month and parents evenings every 6 to 8 weeks. These meetings allow parents to discuss their child’s progress and talk about their next steps, as well as expressing any other views they may have.”
Access, activities and attitudes in different settings In this section, we explore the key differences in access, activities and attitudes towards books and technology of the practitioners who work in different settings – Private, Voluntary and Independent (PVI) settings, as well as maintained settings. We also explore the differences between settings with outstanding, good or requires improvement/inadequate Ofsted reports.
Access to books and looking at or reading stories We explored if PVI or maintained settings have a similar number of books available and how often children look at or read stories in a typical week. Practitioners from PVI settings have fewer books in their setting compared to practitioners from maintained settings (N = 129, N = 250). There are also pronounced differences in how often children look at or read stories between PVI and maintained settings. Despite fewer books being available in PVI settings, children are more likely to read daily in a typical week with an adult than children from maintained settings (75.8% vs. 70.8%). Across both PVI and maintained settings, children are more likely to look at stories daily without a practitioner than with a practitioner (PVI: 84.6% vs. 75.8%; maintained: 84.7% vs. 70.8%, also see Table 17 and Table 18). Table 6: Percentage of children who look at stories in a typical week with or without an adult
Setting type
Would not do at
all %
Once or twice a week
%
A few times a week
%
Daily
%
Total who do
activity %
Don’t know
%
PVI 1.6% 3.3% 17.6% 75.8% 96.7% 1.6% With adult Maintained .7% 10.9% 16.1% 70.8% 97.8% 1.5%
PVI 0.0% 2.7% 10.4% 84.6% 97.8% 2.2% Without adult Maintained 0.0% 3.6% 10.2% 84.7% 98.5% 1.5%
Access and use of tablet computers We explored if practitioners from PVI and maintained settings have similar access to tablet computers and if they use tablet computers in a typical week. More practitioners from PVI settings have access to tablet computers in their setting than practitioners from maintained settings (23.8% vs. 18.7%). Children from PVI settings are more likely to use a tablet computer at least once a week than children from maintained settings, both with an adult (22.7% vs. 17.2%) and without an adult (15.5% vs. 11.2%, also see Table 19 and Table 20).
17
Table 7: Percentage of children who use a tablet computer with or without an adult in a typical week
Setting type
No touch screen
%
Would not do at all
%
Total do not
do activity
%
Once or
twice a week
%
A few times a week
%
Daily
%
Total who do activity
%
Don’t know
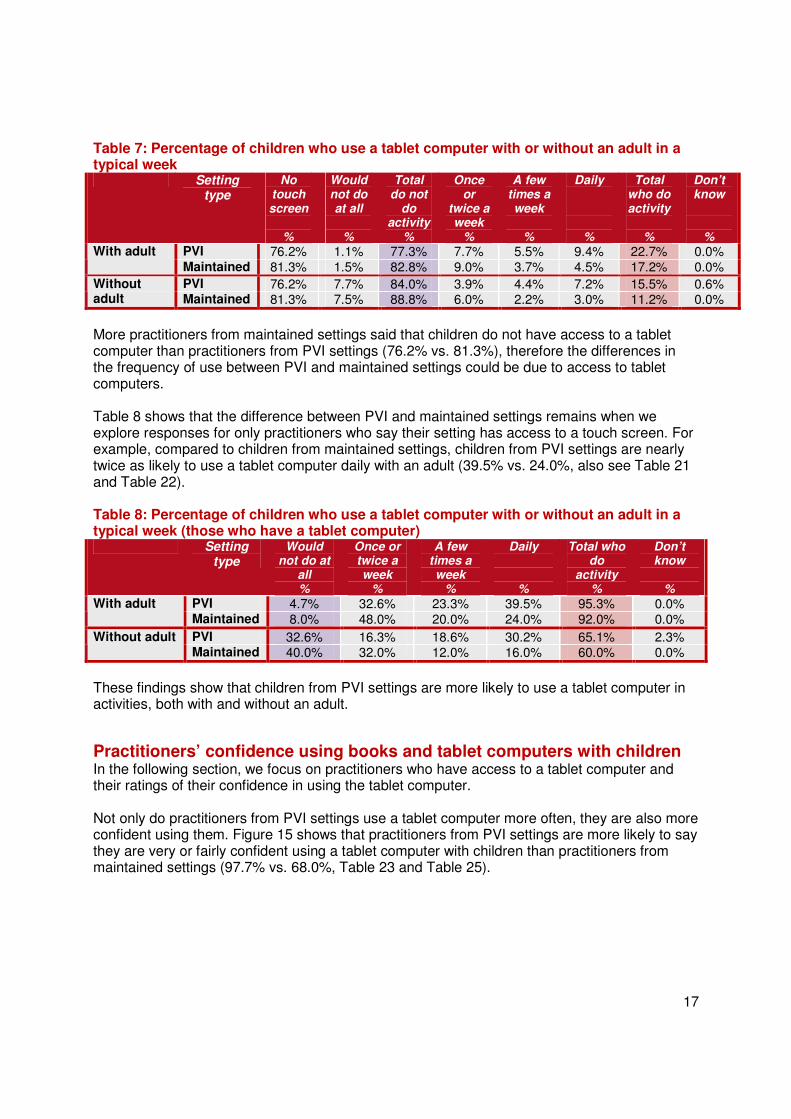
% PVI 76.2% 1.1% 77.3% 7.7% 5.5% 9.4% 22.7% 0.0% With adult
Maintained 81.3% 1.5% 82.8% 9.0% 3.7% 4.5% 17.2% 0.0%
PVI 76.2% 7.7% 84.0% 3.9% 4.4% 7.2% 15.5% 0.6% Without adult Maintained 81.3% 7.5% 88.8% 6.0% 2.2% 3.0% 11.2% 0.0%
More practitioners from maintained settings said that children do not have access to a tablet computer than practitioners from PVI settings (76.2% vs. 81.3%), therefore the differences in the frequency of use between PVI and maintained settings could be due to access to tablet computers. Table 8 shows that the difference between PVI and maintained settings remains when we explore responses for only practitioners who say their setting has access to a touch screen. For example, compared to children from maintained settings, children from PVI settings are nearly twice as likely to use a tablet computer daily with an adult (39.5% vs. 24.0%, also see Table 21 and Table 22). Table 8: Percentage of children who use a tablet computer with or without an adult in a typical week (those who have a tablet computer)
Setting type
Would not do at
all %
Once or twice a week
%
A few times a week
%
Daily
%
Total who do
activity %
Don’t know
%
PVI 4.7% 32.6% 23.3% 39.5% 95.3% 0.0% With adult Maintained 8.0% 48.0% 20.0% 24.0% 92.0% 0.0%
PVI 32.6% 16.3% 18.6% 30.2% 65.1% 2.3% Without adult Maintained 40.0% 32.0% 12.0% 16.0% 60.0% 0.0%
These findings show that children from PVI settings are more likely to use a tablet computer in activities, both with and without an adult.
Practitioners’ confidence using books and tablet computers with children In the following section, we focus on practitioners who have access to a tablet computer and their ratings of their confidence in using the tablet computer. Not only do practitioners from PVI settings use a tablet computer more often, they are also more confident using them. Figure 15 shows that practitioners from PVI settings are more likely to say they are very or fairly confident using a tablet computer with children than practitioners from maintained settings (97.7% vs. 68.0%, Table 23 and Table 25).

18
Figure 15: Percentage of practitioners that are very or fairly confident using books or tablet computers with children
98.9%
97.7%
99.3%
68.0%
Books
Tablet computers
PVI Maintained
Children’s confidence and enjoyment using books and tablet computers We also explored if practitioners from PVI or maintained settings are more likely to say children are confident or enjoy using books or tablet computers, both with and without an adult. As in the previous section, we explored practitioners’ ratings of confidence for children who have access to a tablet computer in their setting. More practitioners from PVI settings than from maintained settings say children are very confident using books or tablet computers. For example, 68.5% of practitioners from PVI settings said children are very confident looking at books with an adult, compared to 60.6% of practitioners from maintained settings (Table 9). Table 9: Percentage of children who are confident using books
Very confident
%
Fairly confident
%
Total confident
%
Not very confident
%
Not at all confident
%
Neutral
%
Don’t know
%
PVI 68.5% 25.8% 94.4% 0.6% 0.6% 3.4% 1.1% With adult Maintained 60.6% 35.8% 96.4% 1.5% 0.0% 1.5% 0.7%
PVI 46.1% 39.3% 85.4% 2.2% 0.6% 9.0% 2.8% Without adult Maintained 27.7% 40.9% 68.6% 6.6% 0.7% 23.4% 0.7%
Practitioners from PVI settings were also more likely than practitioners from maintained settings to say children are very confident using a tablet computer with an adult (67.5% vs. 45.5%, Table 10). Irrespective of whether they work for PVI or maintained settings, all practitioners say children are more confident using media with an adult rather than without an adult. The lower levels of confidence for practitioners from maintained settings are associated with tablet computers rather than technology in general as there were few differences in confidence in using technology for practitioners from different settings (maintained: 94.4% vs. PVI: 93.2%, see Table 26).
19
Table 10: Percentage of practitioners who say children are confident using a tablet computer
Very confident
%
Fairly confident
%
Total confident
%
Not very confident
%
Not at all confident
%
Neutral
%
Don’t know
%
PVI 67.5% 30.0% 97.5% 0.0% 0.0% 2.5% 0.0% With adult Maintained 45.5% 40.9% 86.4% 0.0% 0.0% 13.6% 0.0%
PVI 60.0% 28.6% 88.6% 0.0% 0.0% 5.7% 5.7% Without adult Maintained 40.0% 45.0% 85.0% 0.0% 0.0% 15.0% 0.0%
When it comes to enjoyment, there was a less clear picture between practitioners from PVI and maintained settings. For example, slightly more practitioners from PVI settings said children enjoy using books a lot without an adult compared to practitioners from maintained settings (67.4% vs. 61.3%, Table 32). In contrast, of those who have a tablet computer, slightly more practitioners from maintained settings said that children enjoy using tablet computers a lot without an adult than practitioners from PVI settings (84.2% vs. 80.0%, Table 38).
Practitioners’ attitudes to the use of tablet computers Practitioners from maintained settings are more likely to say that they would like to increase use of tablet computers in their setting, for example three-quarters of practitioners from these settings want to increase the use of tablet computers in their setting (74.2%) compared to 6 in 10 (61.3%) of practitioners from PVI settings (see Table 40).
What this means These results suggest that there are not only differences in access to tablet computers in early years settings but also in practitioners’ attitudes towards the use of tablet computers, both in terms of their own confidence and children’s confidence and enjoyment of using tablet computers. Nevertheless all practitioners, particularly those from maintained settings, would like to increase the use of tablet computers in their setting. Yet our survey has also highlighted the types of barriers that practitioners face (e.g. a lack of equipment, lack of finances) to support these changes.
Do settings with outstanding Ofsted ratings have a different profile of responses to other settings? In the following section we explore briefly the differences between settings with different Ofsted judgements: outstanding settings (N = 62), good settings (N = 172) and settings judged as requires improvement/inadequate (N = 31). Outstanding settings are twice as likely as settings judged as requires improvement/inadequate to have access to tablet computers (32.8% vs. 16.7%). Outstanding settings are also more likely to use a tablet computer once a week than settings judged as requires improvement/ inadequate, both with an adult (32.8% vs. 16.7%) and without an adult (21.3% vs. 6.7%). However, as more settings with an outstanding Ofsted judgement have access to a tablet computer, this may in part explain why children are less likely to use a tablet computer. Once only settings who have access to a tablet are included, we see that children who attend settings

20
judged as requires improvement/inadequate are twice as likely as children attending an outstanding setting to use a tablet computer daily with an adult (60% vs. 30.0%). More practitioners who work in outstanding settings say they are very confident using tablet computers with children compared to practitioners who work in settings judged as require improvement/inadequate (70% vs. 60%). There are less clear findings for how confident practitioners say children are using a tablet computer with or without an adult. For example, practitioners from outstanding settings are more likely to say children are very confident using a tablet computer with an adult (66.7% vs. 60.0%) than practitioners from settings judged as requires improvement/inadequate. In contrast, practitioners from settings judged as require improvement/inadequate are more likely to say children are very confident using a tablet computer without an adult (66.7% vs. 46.7%) than settings judged as outstanding. However, when we explore practitioners who said children are very confident and fairly confident, children from settings judged as requires improvement/inadequate fare less well than children from outstanding settings (66.7% vs. 93.3%). When exploring enjoyment, there were also differences in how many practitioners say that children enjoy looking at books or stories or using a tablet computer a lot, both with and without an adult. For example, practitioners who work in settings judged as requires improvement/ inadequate are more likely to say children enjoy using a tablet computer with an adult a lot (100.0% vs. 89.5%) compared to settings judged as outstanding. Yet practitioners from settings judged as outstanding are more likely than settings judged as requires improvement/inadequate to say children enjoy using a tablet computer a lot without an adult (93.3% vs. 66.7%). This shows not only that practices vary between settings, but practitioners’ attitudes towards books and technology also change, which may have important implications for how books and technology are integrated into children’s activities in different settings.
Conclusions Our research shows that technology is playing a large role in the lives of the under-fives. One in five early years practitioners say that children use touch-screen technology in their setting. We found that early years practitioners have positive attitudes to the use of tablet computers in their setting. For example, three-quarters of practitioners say that for children to get on at school it is important they learn to use technology from an early age. There were however differences in both children’s access to tablet computers and practitioners’ attitudes in different early years settings. Nevertheless, all practitioners, particularly those working in maintained settings, would like to increase the use of tablet computers in their setting. However, there are a variety of barriers (for example, a lack of equipment, lack of finances) to integrating tablet computers in early years settings. In our next annual survey we will explore not only if the use of tablet computers changes in settings over the next 12 months, but we will also expand to include questions on how and why practitioners use technology for activities in their setting.
21
Appendix
Tables and data The following pages present information for each of our survey questions in tables. Each table contains information showing the sample as a whole (top row) as well as information broken down by sociodemographic information according to setting and practitioner factors. Setting factors include the following categories: type of setting, PVI (Private, Voluntary or Independent), maintained, other settings, type of setting (children’s centre, day nursery, nursery class/school, reception class, preschool playgroup, other); number of staff in setting (1-5, 6-10, 11-20, over 20 staff); Ofsted grading (outstanding, good, requires improvement/inadequate, don’t know, refused to answer). Practitioner factors include: Practitioner age (aged 18-30, aged 31-40, aged 41-50, aged over 51, refused to answer); and the number of years practitioners have worked in early years education (0-5 years, 6-10 years, 11-20 years, over 21 years, refused to answer). For tables which present the frequency of activities, e.g. looking at or reading a book, the total percentage who do/do not engage in each activity at least once in a typical week are highlighted in the tables (shaded in pink and purple respectively). For ease of interpretation, categories were collapsed into once or twice a week, a few times a week and daily, where daily refers to five days a week. Please note that due to rounding, the data in the tables will not necessarily add up to 100 per cent exactly13.
13
Practitioners were not required to answer every question, therefore the total number of practitioners varies between individual questions.

22
Table 11: Sample characteristics Number Percentage
All 362 100.0%
PVI 189 52.2% Maintained 143 39.5% Other 30 8.3%
Children’s centre 40 11.0% Day nursery 47 13.0% Nursery class/school 45 12.4% Reception class 56 15.5% Preschool playgroup 105 29.0% Other 69 19.1%
1-5 staff 132 36.5% 6-10 staff 113 31.2% 11-20 staff 63 17.4% Over 20 staff 54 14.9%
Outstanding 62 17.1% Good 172 47.5% Improvement/inadequate 31 8.6% Don’t know 33 9.1% Refused to answer 64 17.7%
Aged 18-30 46 12.7% Aged 31-40 87 24.0% Aged 41-50 93 25.7% Aged Over 51 77 21.3% Refused to answer 59 16.3%
0 to 5 years 57 15.7% 6 to 10 years 74 20.4% 11 to 20 years 108 29.8% Over 21 years 66 18.2% Refused to answer 57 15.7%
23
Table 12: Books available in the setting Mean number
of books available N (s.d)
All 178 (310)
PVI 129 (149) Maintained 250 (446) Other 136 (190)
Children’s centre 125 (167) Day nursery 125 (198) Nursery class/school 228 (286) Reception class 255 (408) Preschool playgroup 136 (137) Other 212 (489)
1-5 staff 121 (143) 6-10 staff 182 (327) 11-20 staff 184 (264) Over 20 staff 302 (528)
Outstanding 266 (410) Good 150 (190) Improvement/inadequate 88 (55) Don’t know 169 (228) Refused to answer 215 (507)
Aged 18-30 103 (95) Aged 31-40 132 (289) Aged 41-50 165 (206) Aged Over 51 240 (288) Refused to answer 243 (533)
0 to 5 years 130 (336) 6 to 10 years 112 (135) 11 to 20 years 152 (166) Over 21 years 288 (339) Refused to answer 232 (532)
24
Table 13: Percentage of practitioners who have access to tablet computer and the mean number of tablet computers in settings
No touch screen
%
Have touch screen
%
Mean number of touch screens N (s.d)
Minimum
N
Maximum
N All 8.0% 22.0% 2.9 (4.8) 1 30
PVI 76.2% 23.8% 1.7 (1.7) 1 10 Maintained 81.3% 18.7% 5.2 (7.6) 1 30 Unknown 73.3% 26.7% 1.6 (.9) 1 3
Children’s centre 83.8% 16.2% 1.2 (.4) 1 2 Day nursery 80.0% 20.0% 1.8 (.7) 1 3 Nursery class/school 84.4% 15.6% 1.6 (1.1) 1 4 Reception class 68.6% 31.4% 6.7 (6.4) 1 25 Preschool playgroup 87.5% 12.5% 1.2 (.2) 1 3 Missing 60.3% 39.7% 2.5 (5.8) 1 30
1-5 Staff 75.6% 24.4% 2.1 (2.4) 1 12 6-10 Staff 80.4% 19.6% 1.8 (1.5) 1 6 11-20 Staff 84.7% 15.3% 2.0 (1.6) 1 5 Over 20 Staff 71.2% 28.8% 6.5 (9.4) 1 30
Outstanding 67.2% 32.8% 2.5 (5.3) 1 25 Good 78.0% 22.0% 2.7 (3.2) 1 15 Improvement/inadequate 83.3% 16.7% 1.8 (1.3) 1 4 Don’t know 71.9% 28.1% 2.6 (3.0) 1 10 Refused to answer 89.7% 10.3% 6.7 (11.6) 1 30
Aged 18-30 78.0% 22.0% 1.8 (1.6) 1 6 Aged 31-40 73.5% 26.5% 2.7 (5.2) 1 25 Aged 41-50 75.0% 25.0% 4.0 (6.7) 1 30 Aged Over 51 74.7% 25.3% 2.4 (2.4) 1 10 Refused to answer 94.4% 5.6% 1.0 (-) 1 1
0 to 5 years 74.5% 25.5% 3.2 (6.7) 1 25 6 to 10 years 77.8% 22.2% 3.1 (3.6) 1 15 11 to 20 years 75.0% 25.0% 3.5 (6.1) 1 30 Over 21 years 72.7% 27.3% 1.9 (1.3) 1 5 Refused to answer 94.2% 5.8% 1.0 (-) 1 1

25
Table 14: Percentage of practitioners who have access to resources such as technology, tablet computers and books in their setting
Do not have access
%
Have access
%
Mean N (s.d)
Minimum
N
Maximum
N Desktop 34.5% 65.5% 2.1 (2.5) 1 20 Laptop 58.3% 41.7% 2.5 (4.2) 1 30 Netbook 93.1% 6.9% 4.9 (8.4) 1 30 Tablet computer 78.0% 22.0% 2.9 (4.8) 1 30 Smartphone 92.8% 7.2% 2.0 (2.4) 1 10 Television 71.5% 28.5% 1.1 (.4) 1 3 Digital camera 20.4% 79.6% 2.2 (1.9) 1 15 Video recorder 67.1% 32.9% 1.8 (1.9) 1 15 E-reader 94.2% 5.8% 1.4 (.9) 1 5 Interactive whiteboard 65.2% 34.8% 1.5 (1.3) 1 12 Books 3.3% 96.7% 177.5 (309.8) 1 3000
Table 15: Percentage of practitioners that support children with book-related activities in their setting in a typical week
Would not do at
all %
Once or twice a week
%
A few times a week
%
Daily
%
Total who do activity
%
Don’t know
%
Feature of books 4.0% 17.5% 19.0% 54.3% 90.8% 5.2%
Talk about books 1.7% 6.3% 17.0% 73.3% 96.6% 1.7%
Books at appropriate level 6.3% 12.1% 19.0% 57.5% 88.6% 5.2%
Table 16: Percentage of practitioners that support children with other activities in their setting in a typical week
Would not do at all
%
Once or twice a week
%
A few times a week
%
Daily
%
Total who do activity
%
Don’t know
%
Teach about letters 6.9% 12.9% 19.0% 57.8% 89.7% 3.4%
Sing songs and rhymes 0.3% 4.3% 11.2% 83.3% 98.8% 0.9%
Play educational games 4.0% 12.9% 19.3% 61.8% 94.0% 4.0%
Paint or draw 2.3% 3.7% 15.2% 77.9% 96.8% 0.9%

26
Table 17: Percentage of children who look at or read stories in a typical week with an adult
Would not do at
all %
Once or twice a week
%
A few times a week
%
Daily
%
Total who do activity
%
Don’t know
%
All 1.1% 6.6% 16.4% 74.4% 97.4% 1.4%
PVI 1.6% 3.3% 17.6% 75.8% 96.7% 1.6%
Maintained .7% 10.9% 16.1% 70.8% 97.8% 1.5%
Unknown 0.0% 6.9% 10.3% 82.8% 100.0% 0.0%
Children’s centre 5.3% 7.9% 26.3% 57.9% 92.1% 2.6%
Day nursery 0.0% 2.2% 4.4% 91.1% 97.8% 2.2%
Nursery class/school 2.3% 4.5% 20.5% 72.7% 97.7% 0.0%
Reception class 0.0% 14.5% 12.7% 72.7% 100.0% 0.0%
Preschool playgroup 0.0% 4.0% 14.9% 79.2% 98.0% 2.0%
Missing 1.5% 7.7% 21.5% 67.7% 96.9% 1.5%
1-5 Staff .8% 6.3% 20.3% 70.3% 96.9% 2.3%
6-10 Staff 1.9% 6.5% 16.7% 74.1% 97.2% .9%
11-20 Staff 1.6% 4.9% 13.1% 80.3% 98.4% 0.0%
Over 20 Staff 0.0% 9.8% 9.8% 78.4% 98.0% 2.0%
Outstanding 1.6% 3.2% 17.7% 77.4% 98.4% 0.0%
Good .6% 3.5% 15.7% 79.7% 98.8% .6%
Improvement/inadequate 0.0% 9.7% 35.5% 54.8% 100.0% 0.0%
Don’t know 3.0% 18.2% 9.1% 66.7% 93.9% 3.0%
Refused to answer 2.0% 12.0% 10.0% 70.0% 92.0% 6.0%
Aged 18-30 2.2% 2.2% 19.6% 73.9% 95.7% 2.2%
Aged 31-40 0.0% 6.9% 19.5% 72.4% 98.9% 1.1%
Aged 41-50 2.2% 3.2% 19.4% 74.2% 96.8% 1.1%
Aged Over 51 0.0% 9.1% 13.0% 77.9% 100.0% 0.0%
Refused to answer 2.2% 13.3% 6.7% 73.3% 93.3% 4.4%
0 to 5 years 1.8% 8.8% 28.1% 57.9% 94.7% 3.5%
6 to 10 years 1.4% 2.7% 18.9% 77.0% 98.6% 0.0%
11 to 20 years .9% 5.6% 15.7% 76.9% 98.1% .9%
Over 21 years 0.0% 6.1% 10.6% 83.3% 100.0% 0.0%
Refused to answer 2.3% 14.0% 7.0% 72.1% 93.0% 4.7%
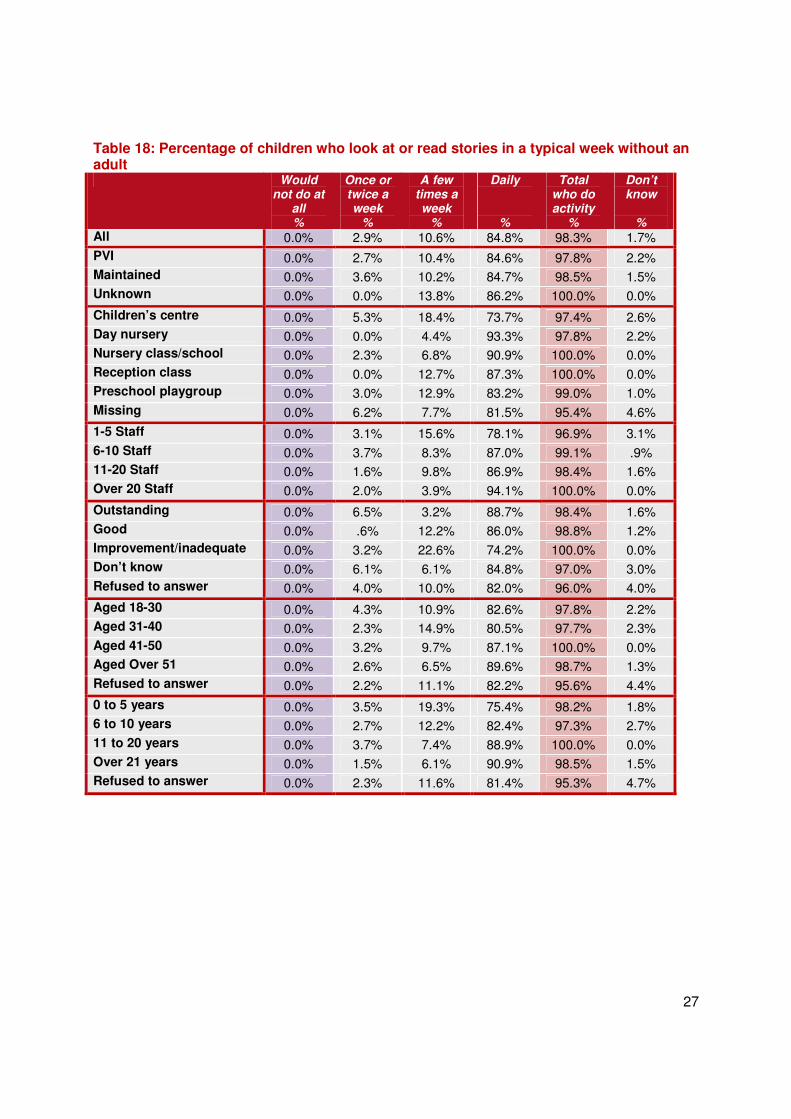
27
Table 18: Percentage of children who look at or read stories in a typical week without an adult
Would not do at
all %
Once or twice a week
%
A few times a week
%
Daily
%
Total who do activity
%
Don’t know
%
All 0.0% 2.9% 10.6% 84.8% 98.3% 1.7%
PVI 0.0% 2.7% 10.4% 84.6% 97.8% 2.2%
Maintained 0.0% 3.6% 10.2% 84.7% 98.5% 1.5%
Unknown 0.0% 0.0% 13.8% 86.2% 100.0% 0.0%
Children’s centre 0.0% 5.3% 18.4% 73.7% 97.4% 2.6%
Day nursery 0.0% 0.0% 4.4% 93.3% 97.8% 2.2%
Nursery class/school 0.0% 2.3% 6.8% 90.9% 100.0% 0.0%
Reception class 0.0% 0.0% 12.7% 87.3% 100.0% 0.0%
Preschool playgroup 0.0% 3.0% 12.9% 83.2% 99.0% 1.0%
Missing 0.0% 6.2% 7.7% 81.5% 95.4% 4.6%
1-5 Staff 0.0% 3.1% 15.6% 78.1% 96.9% 3.1%
6-10 Staff 0.0% 3.7% 8.3% 87.0% 99.1% .9%
11-20 Staff 0.0% 1.6% 9.8% 86.9% 98.4% 1.6%
Over 20 Staff 0.0% 2.0% 3.9% 94.1% 100.0% 0.0%
Outstanding 0.0% 6.5% 3.2% 88.7% 98.4% 1.6%
Good 0.0% .6% 12.2% 86.0% 98.8% 1.2%
Improvement/inadequate 0.0% 3.2% 22.6% 74.2% 100.0% 0.0%
Don’t know 0.0% 6.1% 6.1% 84.8% 97.0% 3.0%
Refused to answer 0.0% 4.0% 10.0% 82.0% 96.0% 4.0%
Aged 18-30 0.0% 4.3% 10.9% 82.6% 97.8% 2.2%
Aged 31-40 0.0% 2.3% 14.9% 80.5% 97.7% 2.3%
Aged 41-50 0.0% 3.2% 9.7% 87.1% 100.0% 0.0%
Aged Over 51 0.0% 2.6% 6.5% 89.6% 98.7% 1.3%
Refused to answer 0.0% 2.2% 11.1% 82.2% 95.6% 4.4%
0 to 5 years 0.0% 3.5% 19.3% 75.4% 98.2% 1.8%
6 to 10 years 0.0% 2.7% 12.2% 82.4% 97.3% 2.7%
11 to 20 years 0.0% 3.7% 7.4% 88.9% 100.0% 0.0%
Over 21 years 0.0% 1.5% 6.1% 90.9% 98.5% 1.5%
Refused to answer 0.0% 2.3% 11.6% 81.4% 95.3% 4.7%

28
Table 19: Percentage of children who use a tablet computer with an adult in a typical week
No touch screen
%
Would not do at all
%
Total do not
do activity
%
Once or
twice a week
%
A few times a week
%
Daily
%
Total who do activity
%
Don’t know
% All 78.0% 1.2% 79.1% 8.7% 4.9% 7.2% 20.9% 0.0%
PVI 76.2% 1.1% 77.3% 7.7% 5.5% 9.4% 22.7% 0.0% Maintained 81.3% 1.5% 82.8% 9.0% 3.7% 4.5% 17.2% 0.0% Unknown 73.3% 0.0% 73.3% 13.3% 6.7% 6.7% 26.7% 0.0%
Children’s centre 83.8% 2.7% 86.5% 2.7% 5.4% 5.4% 13.5% 0.0% Day nursery 80.0% 0.0% 80.0% 4.4% 2.2% 13.3% 20.0% 0.0% Nursery class/school 84.4% 0.0% 84.4% 6.7% 4.4% 4.4% 15.6% 0.0% Reception class 68.6% 3.9% 72.5% 11.8% 5.9% 9.8% 27.5% 0.0% Preschool playgroup 87.5% 1.0% 88.5% 3.8% 3.8% 3.8% 11.5% 0.0% Missing 60.3% 0.0% 60.3% 22.2% 7.9% 9.5% 39.7% 0.0%
1-5 Staff 75.6% 0.8% 76.4% 11.8% 5.5% 6.3% 23.6% 0.0% 6-10 Staff 80.4% 0.9% 81.3% 8.4% 2.8% 7.5% 18.7% 0.0% 11-20 Staff 84.7% 1.7% 86.4% 3.4% 3.4% 6.8% 13.6% 0.0% Over 20 Staff 71.2% 1.9% 73.1% 7.7% 9.6% 9.6% 26.9% 0.0%
Outstanding 67.2% 0.0% 67.2% 13.1% 9.8% 9.8% 32.8% 0.0% Good 78.0% 1.8% 79.9% 9.8% 4.3% 6.1% 20.1% 0.0% Improvement/inadequate 83.3% 0.0% 83.3% 3.3% 3.3% 10.0% 16.7% 0.0% Don’t know 71.9% 0.0% 71.9% 6.3% 6.3% 15.6% 28.1% 0.0% Refused to answer 89.7% 1.7% 91.4% 5.2% 1.7% 1.7% 8.6% 0.0%
Aged 18-30 78.0% 2.4% 80.5% 7.3% 4.9% 7.3% 19.5% 0.0% Aged 31-40 73.5% 1.2% 74.7% 10.8% 6.0% 8.4% 25.3% 0.0% Aged 41-50 75.0% 1.1% 76.1% 13.0% 3.3% 7.6% 23.9% 0.0% Aged Over 51 74.7% 1.3% 76.0% 6.7% 8.0% 9.3% 24.0% 0.0% Refused to answer 94.4% 0.0% 94.4% 1.9% 1.9% 1.9% 5.6% 0.0%
0 to 5 years 74.5% 2.0% 76.5% 13.7% 7.8% 2.0% 23.5% 0.0% 6 to 10 years 77.8% 2.8% 80.6% 11.1% 2.8% 5.6% 19.4% 0.0% 11 to 20 years 75.0% 1.0% 76.0% 6.7% 6.7% 10.6% 24.0% 0.0% Over 21 years 72.7% 0.0% 72.7% 10.6% 4.5% 12.1% 27.3% 0.0% Refused to answer 94.2% 0.0% 94.2% 1.9% 1.9% 1.9% 5.8% 0.0%
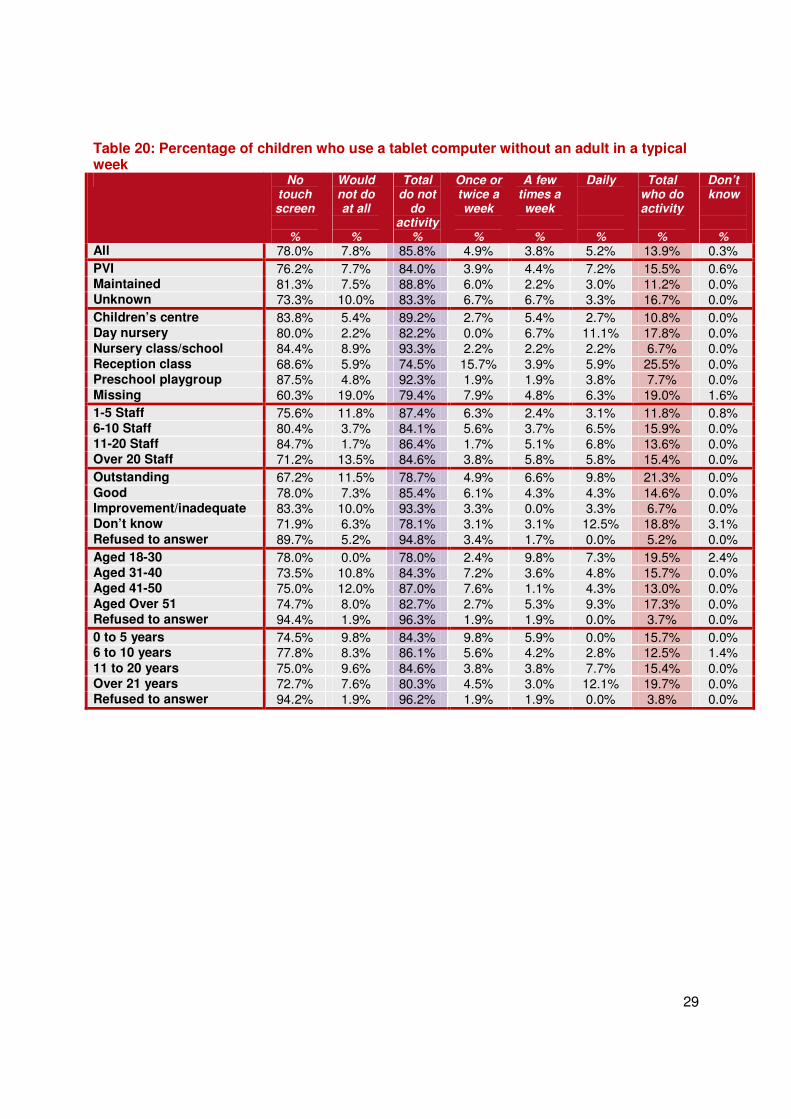
29
Table 20: Percentage of children who use a tablet computer without an adult in a typical week
No touch screen
%
Would not do at all
%
Total do not
do activity
%
Once or twice a week
%
A few times a week
%
Daily
%
Total who do activity
%
Don’t know
% All 78.0% 7.8% 85.8% 4.9% 3.8% 5.2% 13.9% 0.3%
PVI 76.2% 7.7% 84.0% 3.9% 4.4% 7.2% 15.5% 0.6% Maintained 81.3% 7.5% 88.8% 6.0% 2.2% 3.0% 11.2% 0.0% Unknown 73.3% 10.0% 83.3% 6.7% 6.7% 3.3% 16.7% 0.0%
Children’s centre 83.8% 5.4% 89.2% 2.7% 5.4% 2.7% 10.8% 0.0% Day nursery 80.0% 2.2% 82.2% 0.0% 6.7% 11.1% 17.8% 0.0% Nursery class/school 84.4% 8.9% 93.3% 2.2% 2.2% 2.2% 6.7% 0.0% Reception class 68.6% 5.9% 74.5% 15.7% 3.9% 5.9% 25.5% 0.0% Preschool playgroup 87.5% 4.8% 92.3% 1.9% 1.9% 3.8% 7.7% 0.0% Missing 60.3% 19.0% 79.4% 7.9% 4.8% 6.3% 19.0% 1.6%
1-5 Staff 75.6% 11.8% 87.4% 6.3% 2.4% 3.1% 11.8% 0.8% 6-10 Staff 80.4% 3.7% 84.1% 5.6% 3.7% 6.5% 15.9% 0.0% 11-20 Staff 84.7% 1.7% 86.4% 1.7% 5.1% 6.8% 13.6% 0.0% Over 20 Staff 71.2% 13.5% 84.6% 3.8% 5.8% 5.8% 15.4% 0.0%
Outstanding 67.2% 11.5% 78.7% 4.9% 6.6% 9.8% 21.3% 0.0% Good 78.0% 7.3% 85.4% 6.1% 4.3% 4.3% 14.6% 0.0% Improvement/inadequate 83.3% 10.0% 93.3% 3.3% 0.0% 3.3% 6.7% 0.0% Don’t know 71.9% 6.3% 78.1% 3.1% 3.1% 12.5% 18.8% 3.1% Refused to answer 89.7% 5.2% 94.8% 3.4% 1.7% 0.0% 5.2% 0.0%
Aged 18-30 78.0% 0.0% 78.0% 2.4% 9.8% 7.3% 19.5% 2.4% Aged 31-40 73.5% 10.8% 84.3% 7.2% 3.6% 4.8% 15.7% 0.0% Aged 41-50 75.0% 12.0% 87.0% 7.6% 1.1% 4.3% 13.0% 0.0% Aged Over 51 74.7% 8.0% 82.7% 2.7% 5.3% 9.3% 17.3% 0.0% Refused to answer 94.4% 1.9% 96.3% 1.9% 1.9% 0.0% 3.7% 0.0%
0 to 5 years 74.5% 9.8% 84.3% 9.8% 5.9% 0.0% 15.7% 0.0% 6 to 10 years 77.8% 8.3% 86.1% 5.6% 4.2% 2.8% 12.5% 1.4% 11 to 20 years 75.0% 9.6% 84.6% 3.8% 3.8% 7.7% 15.4% 0.0% Over 21 years 72.7% 7.6% 80.3% 4.5% 3.0% 12.1% 19.7% 0.0% Refused to answer 94.2% 1.9% 96.2% 1.9% 1.9% 0.0% 3.8% 0.0%

30
Table 21: Percentage of children who have access to and use a tablet computer with an adult in a typical week
Would not do at
all %
Once or twice a week
%
A few times a week
%
Daily
%
Total who do activity
%
Don’t know
%
All 5.3% 39.5% 22.4% 32.9% 94.7% 0.0%
PVI 4.7% 32.6% 23.3% 39.5% 95.3% 0.0% Maintained 8.0% 48.0% 20.0% 24.0% 92.0% 0.0% Unknown 0.0% 50.0% 25.0% 25.0% 100.0% 0.0%
Children’s centre 16.7% 16.7% 33.3% 33.3% 83.3% 0.0% Day nursery 0.0% 22.2% 11.1% 66.7% 100.0% 0.0% Nursery class/school 0.0% 42.9% 28.6% 28.6% 100.0% 0.0% Reception class 12.5% 37.5% 18.8% 31.3% 87.5% 0.0% Preschool playgroup 7.7% 30.8% 30.8% 30.8% 92.3% 0.0% Missing 0.0% 56.0% 20.0% 24.0% 100.0% 0.0%
1-5 Staff 3.2% 48.4% 22.6% 25.8% 96.8% 0.0% 6-10 Staff 4.8% 42.9% 14.3% 38.1% 95.2% 0.0% 11-20 Staff 11.1% 22.2% 22.2% 44.4% 88.9% 0.0% Over 20 Staff 6.7% 26.7% 33.3% 33.3% 93.3% 0.0%
Outstanding 0.0% 40.0% 30.0% 30.0% 100.0% 0.0% Good 8.3% 44.4% 19.4% 27.8% 91.7% 0.0% Improvement/inadequate 0.0% 20.0% 20.0% 60.0% 100.0% 0.0% Don’t know 0.0% 22.2% 22.2% 55.6% 100.0% 0.0% Refused to answer 16.7% 50.0% 16.7% 16.7% 83.3% 0.0%
Aged 18-30 11.1% 33.3% 22.2% 33.3% 88.9% 0.0% Aged 31-40 4.5% 40.9% 22.7% 31.8% 95.5% 0.0% Aged 41-50 4.3% 52.2% 13.0% 30.4% 95.7% 0.0% Aged Over 51 5.3% 26.3% 31.6% 36.8% 94.7% 0.0% Refused to answer 0.0% 33.3% 33.3% 33.3% 100.0% 0.0%
0 to 5 years 7.7% 53.8% 30.8% 7.7% 92.3% 0.0% 6 to 10 years 12.5% 50.0% 12.5% 25.0% 87.5% 0.0% 11 to 20 years 3.8% 26.9% 26.9% 42.3% 96.2% 0.0% Over 21 years 0.0% 38.9% 16.7% 44.4% 100.0% 0.0% Refused to answer 0.0% 33.3% 33.3% 33.3% 100.0% 0.0%
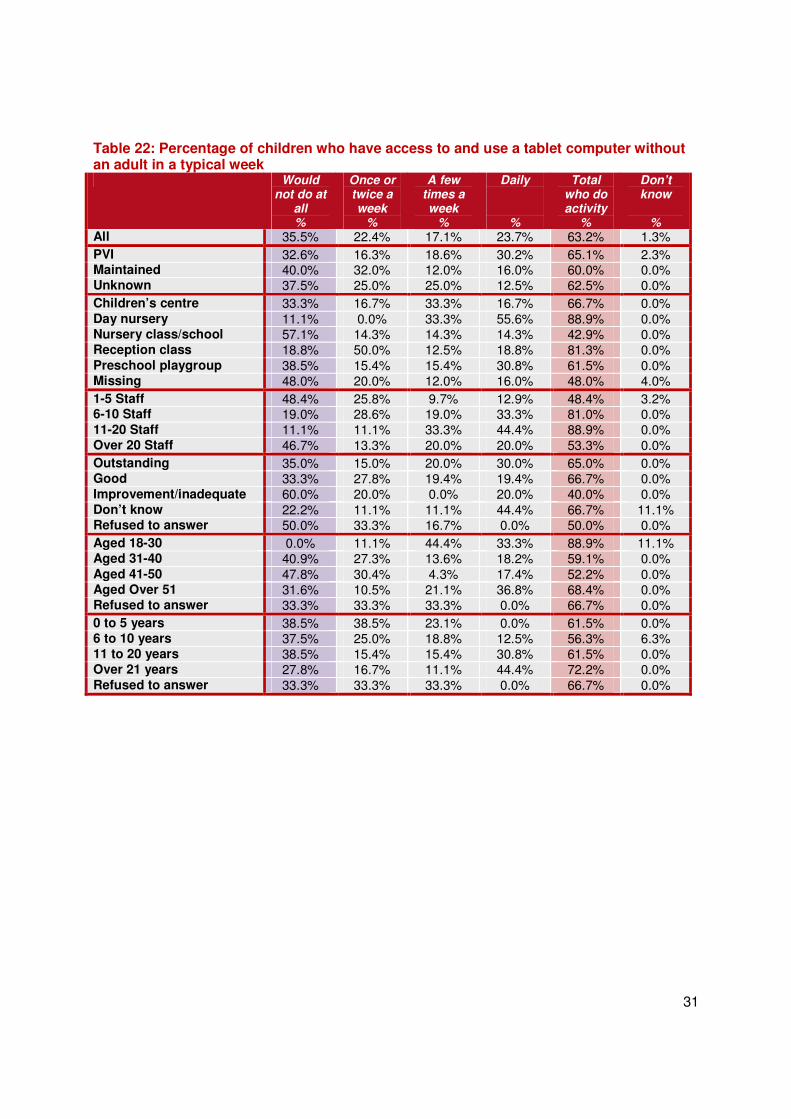
31
Table 22: Percentage of children who have access to and use a tablet computer without an adult in a typical week
Would not do at
all %
Once or twice a week
%
A few times a week
%
Daily
%
Total who do activity
%
Don’t know
%
All 35.5% 22.4% 17.1% 23.7% 63.2% 1.3%
PVI 32.6% 16.3% 18.6% 30.2% 65.1% 2.3% Maintained 40.0% 32.0% 12.0% 16.0% 60.0% 0.0% Unknown 37.5% 25.0% 25.0% 12.5% 62.5% 0.0%
Children’s centre 33.3% 16.7% 33.3% 16.7% 66.7% 0.0% Day nursery 11.1% 0.0% 33.3% 55.6% 88.9% 0.0% Nursery class/school 57.1% 14.3% 14.3% 14.3% 42.9% 0.0% Reception class 18.8% 50.0% 12.5% 18.8% 81.3% 0.0% Preschool playgroup 38.5% 15.4% 15.4% 30.8% 61.5% 0.0% Missing 48.0% 20.0% 12.0% 16.0% 48.0% 4.0%
1-5 Staff 48.4% 25.8% 9.7% 12.9% 48.4% 3.2% 6-10 Staff 19.0% 28.6% 19.0% 33.3% 81.0% 0.0% 11-20 Staff 11.1% 11.1% 33.3% 44.4% 88.9% 0.0% Over 20 Staff 46.7% 13.3% 20.0% 20.0% 53.3% 0.0%
Outstanding 35.0% 15.0% 20.0% 30.0% 65.0% 0.0% Good 33.3% 27.8% 19.4% 19.4% 66.7% 0.0% Improvement/inadequate 60.0% 20.0% 0.0% 20.0% 40.0% 0.0% Don’t know 22.2% 11.1% 11.1% 44.4% 66.7% 11.1% Refused to answer 50.0% 33.3% 16.7% 0.0% 50.0% 0.0%
Aged 18-30 0.0% 11.1% 44.4% 33.3% 88.9% 11.1% Aged 31-40 40.9% 27.3% 13.6% 18.2% 59.1% 0.0% Aged 41-50 47.8% 30.4% 4.3% 17.4% 52.2% 0.0% Aged Over 51 31.6% 10.5% 21.1% 36.8% 68.4% 0.0% Refused to answer 33.3% 33.3% 33.3% 0.0% 66.7% 0.0%
0 to 5 years 38.5% 38.5% 23.1% 0.0% 61.5% 0.0% 6 to 10 years 37.5% 25.0% 18.8% 12.5% 56.3% 6.3% 11 to 20 years 38.5% 15.4% 15.4% 30.8% 61.5% 0.0% Over 21 years 27.8% 16.7% 11.1% 44.4% 72.2% 0.0% Refused to answer 33.3% 33.3% 33.3% 0.0% 66.7% 0.0%

32
Table 23: Percentage of practitioners who are confident using books with children Very
confident %
Fairly confident
%
Total confident
%
Not very confident
%
Not at all confident
%
Neutral
%
Don’t know
% All 86.8% 12.4% 99.1% 0.3% 0.3% 0.3% 0.0%
PVI 84.1% 14.8% 98.9% 0.0% 0.5% 0.5% 0.0% Maintained 89.1% 10.2% 99.3% 0.7% 0.0% 0.0% 0.0% Unknown 93.1% 6.9% 100.0% 0.0% 0.0% 0.0% 0.0%
Children’s centre 81.6% 15.8% 97.4% 2.6% 0.0% 0.0% 0.0% Day nursery 88.9% 8.9% 97.8% 0.0% 0.0% 2.2% 0.0% Nursery class/school 95.5% 4.5% 100.0% 0.0% 0.0% 0.0% 0.0% Reception class 85.5% 14.5% 100.0% 0.0% 0.0% 0.0% 0.0% Preschool playgroup 82.2% 16.8% 99.0% 0.0% 1.0% 0.0% 0.0% Missing 90.8% 9.2% 100.0% 0.0% 0.0% 0.0% 0.0%
1-5 Staff 82.0% 15.6% 97.7% 0.8% 0.8% 0.8% 0.0% 6-10 Staff 86.1% 13.9% 100.0% 0.0% 0.0% 0.0% 0.0% 11-20 Staff 86.9% 13.1% 100.0% 0.0% 0.0% 0.0% 0.0% Over 20 Staff 100.0% 0.0% 100.0% 0.0% 0.0% 0.0% 0.0%
Outstanding 93.5% 6.5% 100.0% 0.0% 0.0% 0.0% 0.0% Good 90.1% 9.9% 100.0% 0.0% 0.0% 0.0% 0.0% Improvement/inadequate 64.5% 29.0% 93.5% 3.2% 0.0% 3.2% 0.0% Don’t know 87.9% 12.1% 100.0% 0.0% 0.0% 0.0% 0.0% Refused to answer 80.0% 18.0% 98.0% 0.0% 2.0% 0.0% 0.0%
Aged 18-30 89.1% 10.9% 100.0% 0.0% 0.0% 0.0% 0.0% Aged 31-40 83.9% 14.9% 98.9% 0.0% 0.0% 1.1% 0.0% Aged 41-50 88.2% 11.8% 100.0% 0.0% 0.0% 0.0% 0.0% Aged Over 51 90.9% 7.8% 98.7% 1.3% 0.0% 0.0% 0.0% Refused to answer 80.0% 17.8% 97.8% 0.0% 2.2% 0.0% 0.0%
0 to 5 years 77.2% 21.1% 98.2% 0.0% 0.0% 1.8% 0.0% 6 to 10 years 87.8% 10.8% 98.6% 1.4% 0.0% 0.0% 0.0% 11 to 20 years 88.0% 12.0% 100.0% 0.0% 0.0% 0.0% 0.0% Over 21 years 97.0% 3.0% 100.0% 0.0% 0.0% 0.0% 0.0% Refused to answer 79.1% 18.6% 97.7% 0.0% 2.3% 0.0% 0.0%

33
Table 24: Percentage of practitioners who are confident using a tablet computer with children
Very confident
%
Fairly confident
%
Total confident
%
Not very confident
%
Not at all confident
%
Neutral
%
Don’t know
% All 51.2% 36.9% 88.1% 2.7% 0.4% 8.1% 0.8%
PVI 51.7% 36.7% 88.4% 2.0% 0.0% 8.8% 0.7% Maintained 48.9% 39.1% 88.0% 3.3% 1.1% 6.5% 1.1% Unknown 57.1% 28.6% 85.7% 4.8% 0.0% 9.5% 0.0%
Children’s centre 83.3% 8.3% 91.7% 0.0% 0.0% 0.0% 8.3% Day nursery 57.5% 32.5% 90.0% 0.0% 0.0% 7.5% 2.5% Nursery class/school 55.9% 35.3% 91.2% 0.0% 2.9% 5.9% 0.0% Reception class 46.9% 40.8% 87.8% 4.1% 0.0% 8.2% 0.0% Preschool playgroup 41.9% 40.7% 82.6% 5.8% 0.0% 11.6% 0.0% Missing 56.4% 38.5% 94.9% 0.0% 0.0% 5.1% 0.0%
1-5 Staff 51.5% 34.7% 86.1% 1.0% 0.0% 11.9% 1.0% 6-10 Staff 39.5% 47.4% 86.8% 6.6% 1.3% 5.3% 0.0% 11-20 Staff 69.0% 23.8% 92.9% 0.0% 0.0% 7.1% 0.0% Over 20 Staff 53.7% 36.6% 90.2% 2.4% 0.0% 4.9% 2.4%
Outstanding 55.4% 37.5% 92.9% 1.8% 0.0% 5.4% 0.0% Good 52.9% 35.7% 88.6% 2.1% 0.7% 7.9% 0.7% Improvement/inadequate 45.0% 30.0% 75.0% 5.0% 0.0% 20.0% 0.0% Don’t know 58.8% 35.3% 94.1% 0.0% 0.0% 5.9% 0.0% Refused to answer 33.3% 48.1% 81.5% 7.4% 0.0% 7.4% 3.7%
Aged 18-30 70.0% 23.3% 93.3% 0.0% 0.0% 6.7% 0.0% Aged 31-40 50.0% 33.3% 83.3% 3.0% 0.0% 12.1% 1.5% Aged 41-50 48.1% 40.5% 88.6% 2.5% 1.3% 7.6% 0.0% Aged Over 51 53.2% 37.1% 90.3% 3.2% 0.0% 6.5% 0.0% Refused to answer 34.8% 52.2% 87.0% 4.3% 0.0% 4.3% 4.3%
0 to 5 years 58.5% 26.8% 85.4% 0.0% 0.0% 14.6% 0.0% 6 to 10 years 51.0% 37.3% 88.2% 3.9% 0.0% 5.9% 2.0% 11 to 20 years 52.3% 37.5% 89.8% 2.3% 0.0% 8.0% 0.0% Over 21 years 50.0% 37.9% 87.9% 3.4% 1.7% 6.9% 0.0% Refused to answer 36.4% 50.0% 86.4% 4.5% 0.0% 4.5% 4.5%
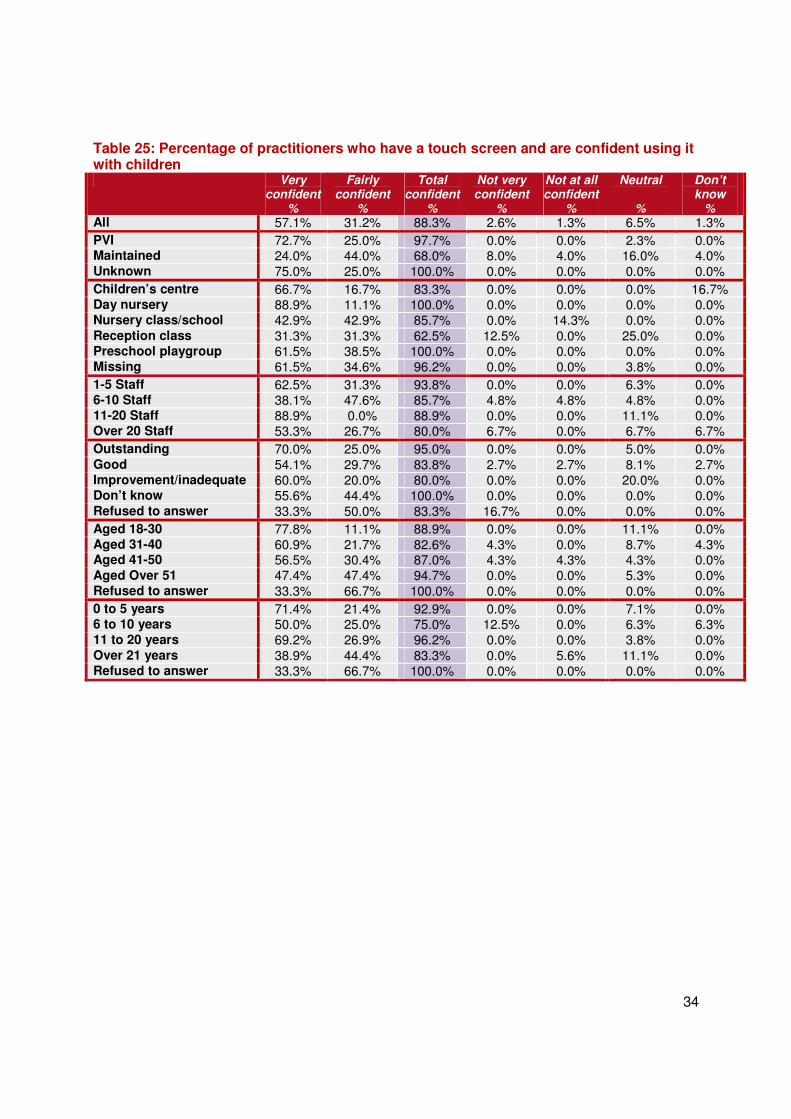
34
Table 25: Percentage of practitioners who have a touch screen and are confident using it with children
Very confident
%
Fairly confident
%
Total confident
%
Not very confident
%
Not at all confident
%
Neutral
%
Don’t know
% All 57.1% 31.2% 88.3% 2.6% 1.3% 6.5% 1.3%
PVI 72.7% 25.0% 97.7% 0.0% 0.0% 2.3% 0.0% Maintained 24.0% 44.0% 68.0% 8.0% 4.0% 16.0% 4.0% Unknown 75.0% 25.0% 100.0% 0.0% 0.0% 0.0% 0.0%
Children’s centre 66.7% 16.7% 83.3% 0.0% 0.0% 0.0% 16.7% Day nursery 88.9% 11.1% 100.0% 0.0% 0.0% 0.0% 0.0% Nursery class/school 42.9% 42.9% 85.7% 0.0% 14.3% 0.0% 0.0% Reception class 31.3% 31.3% 62.5% 12.5% 0.0% 25.0% 0.0% Preschool playgroup 61.5% 38.5% 100.0% 0.0% 0.0% 0.0% 0.0% Missing 61.5% 34.6% 96.2% 0.0% 0.0% 3.8% 0.0%
1-5 Staff 62.5% 31.3% 93.8% 0.0% 0.0% 6.3% 0.0% 6-10 Staff 38.1% 47.6% 85.7% 4.8% 4.8% 4.8% 0.0% 11-20 Staff 88.9% 0.0% 88.9% 0.0% 0.0% 11.1% 0.0% Over 20 Staff 53.3% 26.7% 80.0% 6.7% 0.0% 6.7% 6.7%
Outstanding 70.0% 25.0% 95.0% 0.0% 0.0% 5.0% 0.0% Good 54.1% 29.7% 83.8% 2.7% 2.7% 8.1% 2.7% Improvement/inadequate 60.0% 20.0% 80.0% 0.0% 0.0% 20.0% 0.0% Don’t know 55.6% 44.4% 100.0% 0.0% 0.0% 0.0% 0.0% Refused to answer 33.3% 50.0% 83.3% 16.7% 0.0% 0.0% 0.0%
Aged 18-30 77.8% 11.1% 88.9% 0.0% 0.0% 11.1% 0.0% Aged 31-40 60.9% 21.7% 82.6% 4.3% 0.0% 8.7% 4.3% Aged 41-50 56.5% 30.4% 87.0% 4.3% 4.3% 4.3% 0.0% Aged Over 51 47.4% 47.4% 94.7% 0.0% 0.0% 5.3% 0.0% Refused to answer 33.3% 66.7% 100.0% 0.0% 0.0% 0.0% 0.0%
0 to 5 years 71.4% 21.4% 92.9% 0.0% 0.0% 7.1% 0.0% 6 to 10 years 50.0% 25.0% 75.0% 12.5% 0.0% 6.3% 6.3% 11 to 20 years 69.2% 26.9% 96.2% 0.0% 0.0% 3.8% 0.0% Over 21 years 38.9% 44.4% 83.3% 0.0% 5.6% 11.1% 0.0% Refused to answer 33.3% 66.7% 100.0% 0.0% 0.0% 0.0% 0.0%

35
Table 26: Percentage of practitioners who are confident using technology in general with children
Very confident
%
Fairly confident
%
Total confident
%
Not very confident
%
Not at all confident
%
Neutral
%
Don’t know
% All 42.9% 50.5% 93.3% 1.9% 0.3% 4.1% 0.3%
PVI 43.5% 49.7% 93.2% 1.9% 0.6% 3.7% 0.6% Maintained 40.0% 54.4% 94.4% 1.6% 0.0% 4.0% 0.0% Unknown 51.7% 37.9% 89.7% 3.4% 0.0% 6.9% 0.0%
Children’s centre 41.7% 52.8% 94.4% 0.0% 0.0% 5.6% 0.0% Day nursery 43.9% 51.2% 95.1% 0.0% 0.0% 2.4% 2.4% Nursery class/school 52.6% 36.8% 89.5% 5.3% 0.0% 5.3% 0.0% Reception class 46.0% 52.0% 98.0% 0.0% 0.0% 2.0% 0.0% Preschool playgroup 34.4% 54.4% 88.9% 3.3% 1.1% 6.7% 0.0% Missing 46.7% 50.0% 96.7% 1.7% 0.0% 1.7% 0.0%
1-5 Staff 40.5% 51.7% 92.2% 1.7% 0.9% 4.3% 0.9% 6-10 Staff 36.1% 53.6% 89.7% 4.1% 0.0% 6.2% 0.0% 11-20 Staff 49.1% 49.1% 98.2% 0.0% 0.0% 1.8% 0.0% Over 20 Staff 55.6% 42.2% 97.8% 0.0% 0.0% 2.2% 0.0%
Outstanding 51.6% 43.5% 95.2% 1.6% 0.0% 3.2% 0.0% Good 44.8% 49.4% 94.2% 2.3% 0.0% 3.5% 0.0% Improvement/inadequate 25.8% 67.7% 93.5% 0.0% 0.0% 6.5% 0.0% Don’t know 42.4% 48.5% 90.9% 3.0% 0.0% 6.1% 0.0% Refused to answer 23.5% 58.8% 82.4% 0.0% 5.9% 5.9% 5.9%
Aged 18-30 67.4% 30.4% 97.8% 0.0% 0.0% 2.2% 0.0% Aged 31-40 50.6% 48.3% 98.9% 1.1% 0.0% 0.0% 0.0% Aged 41-50 33.3% 57.0% 90.3% 4.3% 0.0% 5.4% 0.0% Aged Over 51 35.1% 57.1% 92.2% 1.3% 0.0% 6.5% 0.0% Refused to answer 16.7% 50.0% 66.7% 0.0% 8.3% 16.7% 8.3%
0 to 5 years 54.4% 45.6% 100.0% 0.0% 0.0% 0.0% 0.0% 6 to 10 years 47.3% 50.0% 97.3% 0.0% 0.0% 2.7% 0.0% 11 to 20 years 42.6% 50.0% 92.6% 3.7% 0.0% 3.7% 0.0% Over 21 years 31.8% 56.1% 87.9% 3.0% 0.0% 9.1% 0.0% Refused to answer 20.0% 50.0% 70.0% 0.0% 10.0% 10.0% 10.0%
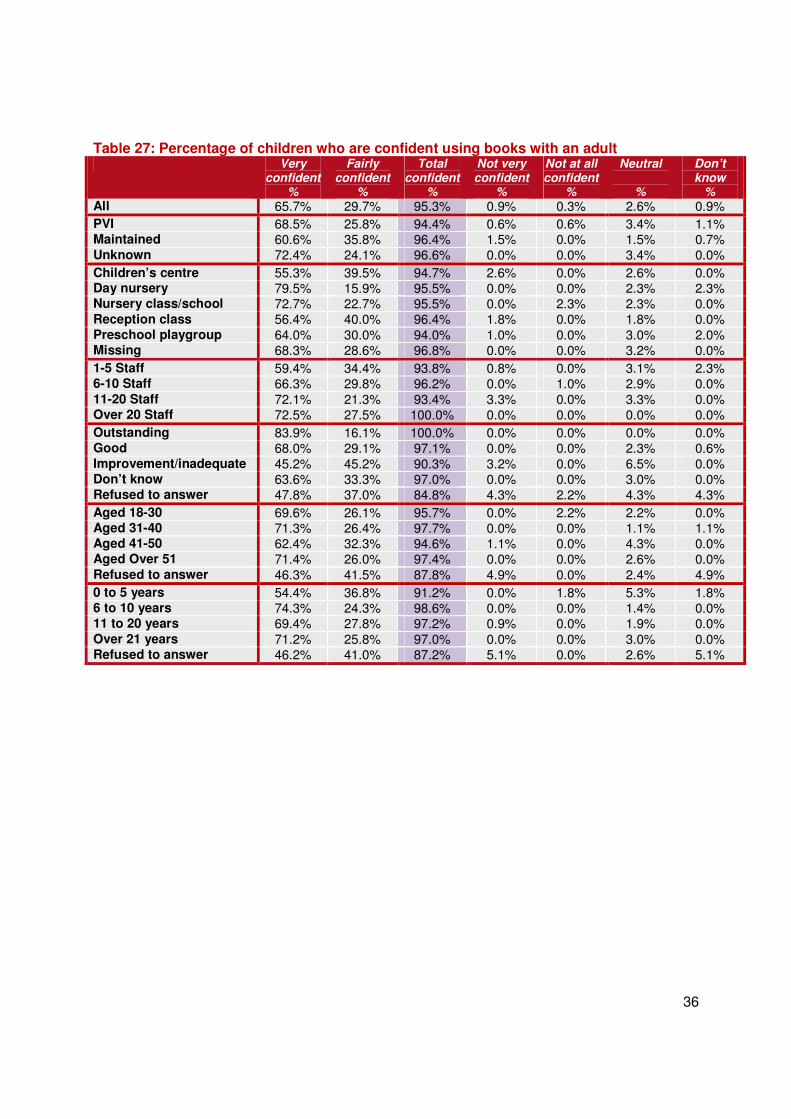
36
Table 27: Percentage of children who are confident using books with an adult Very
confident %
Fairly confident
%
Total confident
%
Not very confident
%
Not at all confident
%
Neutral
%
Don’t know
% All 65.7% 29.7% 95.3% 0.9% 0.3% 2.6% 0.9%
PVI 68.5% 25.8% 94.4% 0.6% 0.6% 3.4% 1.1% Maintained 60.6% 35.8% 96.4% 1.5% 0.0% 1.5% 0.7% Unknown 72.4% 24.1% 96.6% 0.0% 0.0% 3.4% 0.0%
Children’s centre 55.3% 39.5% 94.7% 2.6% 0.0% 2.6% 0.0% Day nursery 79.5% 15.9% 95.5% 0.0% 0.0% 2.3% 2.3% Nursery class/school 72.7% 22.7% 95.5% 0.0% 2.3% 2.3% 0.0% Reception class 56.4% 40.0% 96.4% 1.8% 0.0% 1.8% 0.0% Preschool playgroup 64.0% 30.0% 94.0% 1.0% 0.0% 3.0% 2.0% Missing 68.3% 28.6% 96.8% 0.0% 0.0% 3.2% 0.0%
1-5 Staff 59.4% 34.4% 93.8% 0.8% 0.0% 3.1% 2.3% 6-10 Staff 66.3% 29.8% 96.2% 0.0% 1.0% 2.9% 0.0% 11-20 Staff 72.1% 21.3% 93.4% 3.3% 0.0% 3.3% 0.0% Over 20 Staff 72.5% 27.5% 100.0% 0.0% 0.0% 0.0% 0.0%
Outstanding 83.9% 16.1% 100.0% 0.0% 0.0% 0.0% 0.0% Good 68.0% 29.1% 97.1% 0.0% 0.0% 2.3% 0.6% Improvement/inadequate 45.2% 45.2% 90.3% 3.2% 0.0% 6.5% 0.0% Don’t know 63.6% 33.3% 97.0% 0.0% 0.0% 3.0% 0.0% Refused to answer 47.8% 37.0% 84.8% 4.3% 2.2% 4.3% 4.3%
Aged 18-30 69.6% 26.1% 95.7% 0.0% 2.2% 2.2% 0.0% Aged 31-40 71.3% 26.4% 97.7% 0.0% 0.0% 1.1% 1.1% Aged 41-50 62.4% 32.3% 94.6% 1.1% 0.0% 4.3% 0.0% Aged Over 51 71.4% 26.0% 97.4% 0.0% 0.0% 2.6% 0.0% Refused to answer 46.3% 41.5% 87.8% 4.9% 0.0% 2.4% 4.9%
0 to 5 years 54.4% 36.8% 91.2% 0.0% 1.8% 5.3% 1.8% 6 to 10 years 74.3% 24.3% 98.6% 0.0% 0.0% 1.4% 0.0% 11 to 20 years 69.4% 27.8% 97.2% 0.9% 0.0% 1.9% 0.0% Over 21 years 71.2% 25.8% 97.0% 0.0% 0.0% 3.0% 0.0% Refused to answer 46.2% 41.0% 87.2% 5.1% 0.0% 2.6% 5.1%
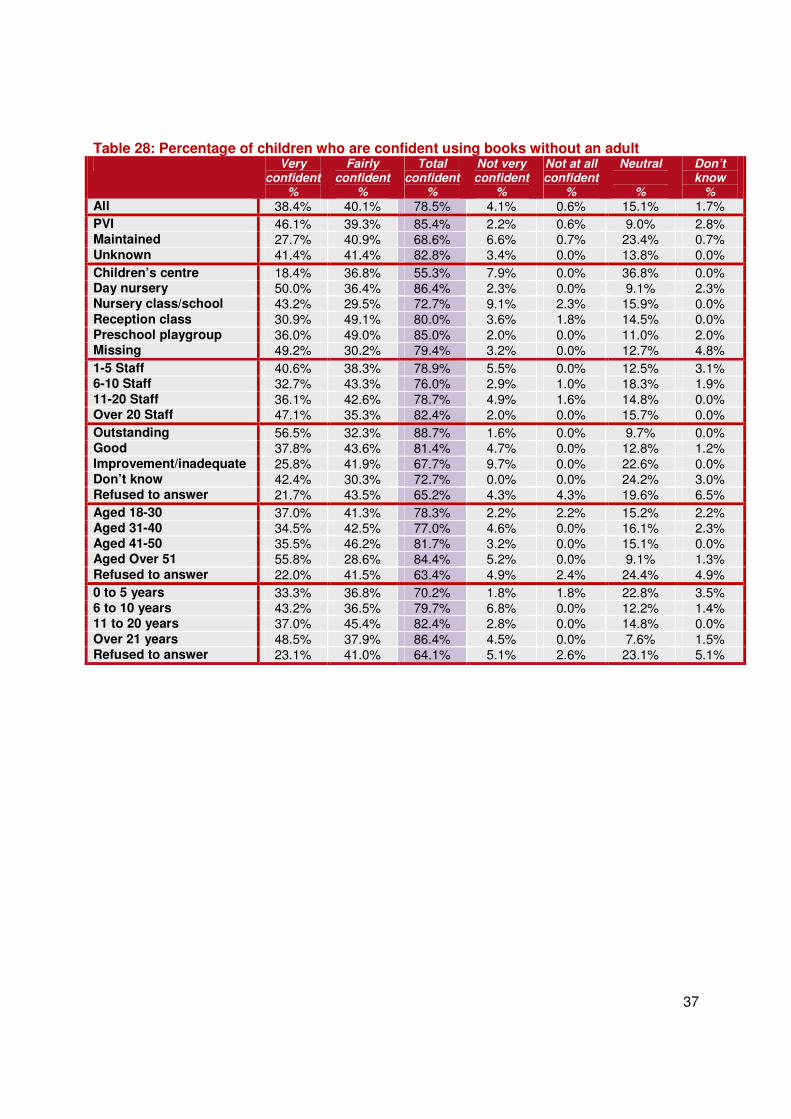
37
Table 28: Percentage of children who are confident using books without an adult Very
confident %
Fairly confident
%
Total confident
%
Not very confident
%
Not at all confident
%
Neutral
%
Don’t know
% All 38.4% 40.1% 78.5% 4.1% 0.6% 15.1% 1.7%
PVI 46.1% 39.3% 85.4% 2.2% 0.6% 9.0% 2.8% Maintained 27.7% 40.9% 68.6% 6.6% 0.7% 23.4% 0.7% Unknown 41.4% 41.4% 82.8% 3.4% 0.0% 13.8% 0.0%
Children’s centre 18.4% 36.8% 55.3% 7.9% 0.0% 36.8% 0.0% Day nursery 50.0% 36.4% 86.4% 2.3% 0.0% 9.1% 2.3% Nursery class/school 43.2% 29.5% 72.7% 9.1% 2.3% 15.9% 0.0% Reception class 30.9% 49.1% 80.0% 3.6% 1.8% 14.5% 0.0% Preschool playgroup 36.0% 49.0% 85.0% 2.0% 0.0% 11.0% 2.0% Missing 49.2% 30.2% 79.4% 3.2% 0.0% 12.7% 4.8%
1-5 Staff 40.6% 38.3% 78.9% 5.5% 0.0% 12.5% 3.1% 6-10 Staff 32.7% 43.3% 76.0% 2.9% 1.0% 18.3% 1.9% 11-20 Staff 36.1% 42.6% 78.7% 4.9% 1.6% 14.8% 0.0% Over 20 Staff 47.1% 35.3% 82.4% 2.0% 0.0% 15.7% 0.0%
Outstanding 56.5% 32.3% 88.7% 1.6% 0.0% 9.7% 0.0% Good 37.8% 43.6% 81.4% 4.7% 0.0% 12.8% 1.2% Improvement/inadequate 25.8% 41.9% 67.7% 9.7% 0.0% 22.6% 0.0% Don’t know 42.4% 30.3% 72.7% 0.0% 0.0% 24.2% 3.0% Refused to answer 21.7% 43.5% 65.2% 4.3% 4.3% 19.6% 6.5%
Aged 18-30 37.0% 41.3% 78.3% 2.2% 2.2% 15.2% 2.2% Aged 31-40 34.5% 42.5% 77.0% 4.6% 0.0% 16.1% 2.3% Aged 41-50 35.5% 46.2% 81.7% 3.2% 0.0% 15.1% 0.0% Aged Over 51 55.8% 28.6% 84.4% 5.2% 0.0% 9.1% 1.3% Refused to answer 22.0% 41.5% 63.4% 4.9% 2.4% 24.4% 4.9%
0 to 5 years 33.3% 36.8% 70.2% 1.8% 1.8% 22.8% 3.5% 6 to 10 years 43.2% 36.5% 79.7% 6.8% 0.0% 12.2% 1.4% 11 to 20 years 37.0% 45.4% 82.4% 2.8% 0.0% 14.8% 0.0% Over 21 years 48.5% 37.9% 86.4% 4.5% 0.0% 7.6% 1.5% Refused to answer 23.1% 41.0% 64.1% 5.1% 2.6% 23.1% 5.1%

38
Table 29: Percentage of children who are confident using a tablet computer with an adult Very
confident %
Fairly confident
%
Total confident
%
Not very confident
%
Not at all confident
%
Neutral
%
Don’t know
% All 45.8% 46.2% 92.1% 1.2% 0.0% 6.3% 0.4%
PVI 43.4% 45.6% 89.0% 2.2% 0.0% 8.1% 0.7% Maintained 48.5% 47.4% 95.9% 0.0% 0.0% 4.1% 0.0% Unknown 50.0% 45.0% 95.0% 0.0% 0.0% 5.0% 0.0%
Children’s centre 54.5% 27.3% 81.8% 0.0% 0.0% 18.2% 0.0% Day nursery 40.0% 50.0% 90.0% 0.0% 0.0% 7.5% 2.5% Nursery class/school 61.8% 35.3% 97.1% 0.0% 0.0% 2.9% 0.0% Reception class 49.1% 49.1% 98.1% 0.0% 0.0% 1.9% 0.0% Preschool playgroup 37.8% 56.1% 93.9% 1.2% 0.0% 4.9% 0.0% Missing 48.5% 30.3% 78.8% 6.1% 0.0% 15.2% 0.0%
1-5 Staff 42.4% 45.7% 88.0% 2.2% 0.0% 8.7% 1.1% 6-10 Staff 40.0% 52.0% 92.0% 1.3% 0.0% 6.7% 0.0% 11-20 Staff 55.6% 37.8% 93.3% 0.0% 0.0% 6.7% 0.0% Over 20 Staff 53.7% 46.3% 100.0% 0.0% 0.0% 0.0% 0.0%
Outstanding 47.3% 41.8% 89.1% 1.8% 0.0% 9.1% 0.0% Good 44.7% 47.5% 92.2% 1.4% 0.0% 6.4% 0.0% Improvement/inadequate 16.7% 72.2% 88.9% 0.0% 0.0% 11.1% 0.0% Don’t know 80.0% 20.0% 100.0% 0.0% 0.0% 0.0% 0.0% Refused to answer 50.0% 45.8% 95.8% 0.0% 0.0% 0.0% 4.2%
Aged 18-30 50.0% 43.8% 93.8% 0.0% 0.0% 6.3% 0.0% Aged 31-40 54.5% 34.8% 89.4% 1.5% 0.0% 9.1% 0.0% Aged 41-50 33.8% 56.8% 90.5% 1.4% 0.0% 8.1% 0.0% Aged Over 51 50.8% 44.3% 95.1% 1.6% 0.0% 3.3% 0.0% Refused to answer 40.0% 55.0% 95.0% 0.0% 0.0% 0.0% 5.0%
0 to 5 years 35.9% 48.7% 84.6% 2.6% 0.0% 12.8% 0.0% 6 to 10 years 51.0% 42.9% 93.9% 0.0% 0.0% 6.1% 0.0% 11 to 20 years 48.9% 43.2% 92.0% 2.3% 0.0% 5.7% 0.0% Over 21 years 44.8% 50.0% 94.8% 0.0% 0.0% 5.2% 0.0% Refused to answer 42.1% 52.6% 94.7% 0.0% 0.0% 0.0% 5.3%
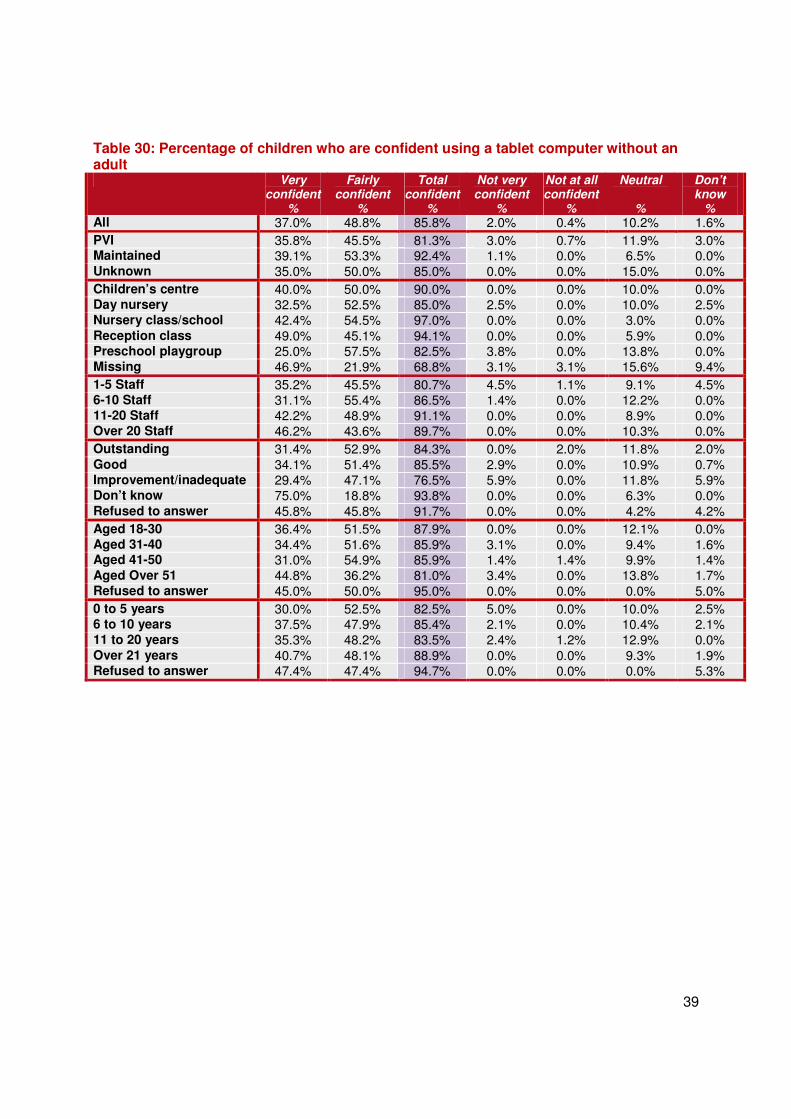
39
Table 30: Percentage of children who are confident using a tablet computer without an adult
Very confident
%
Fairly confident
%
Total confident
%
Not very confident
%
Not at all confident
%
Neutral
%
Don’t know
% All 37.0% 48.8% 85.8% 2.0% 0.4% 10.2% 1.6%
PVI 35.8% 45.5% 81.3% 3.0% 0.7% 11.9% 3.0% Maintained 39.1% 53.3% 92.4% 1.1% 0.0% 6.5% 0.0% Unknown 35.0% 50.0% 85.0% 0.0% 0.0% 15.0% 0.0%
Children’s centre 40.0% 50.0% 90.0% 0.0% 0.0% 10.0% 0.0% Day nursery 32.5% 52.5% 85.0% 2.5% 0.0% 10.0% 2.5% Nursery class/school 42.4% 54.5% 97.0% 0.0% 0.0% 3.0% 0.0% Reception class 49.0% 45.1% 94.1% 0.0% 0.0% 5.9% 0.0% Preschool playgroup 25.0% 57.5% 82.5% 3.8% 0.0% 13.8% 0.0% Missing 46.9% 21.9% 68.8% 3.1% 3.1% 15.6% 9.4%
1-5 Staff 35.2% 45.5% 80.7% 4.5% 1.1% 9.1% 4.5% 6-10 Staff 31.1% 55.4% 86.5% 1.4% 0.0% 12.2% 0.0% 11-20 Staff 42.2% 48.9% 91.1% 0.0% 0.0% 8.9% 0.0% Over 20 Staff 46.2% 43.6% 89.7% 0.0% 0.0% 10.3% 0.0%
Outstanding 31.4% 52.9% 84.3% 0.0% 2.0% 11.8% 2.0% Good 34.1% 51.4% 85.5% 2.9% 0.0% 10.9% 0.7% Improvement/inadequate 29.4% 47.1% 76.5% 5.9% 0.0% 11.8% 5.9% Don’t know 75.0% 18.8% 93.8% 0.0% 0.0% 6.3% 0.0% Refused to answer 45.8% 45.8% 91.7% 0.0% 0.0% 4.2% 4.2%
Aged 18-30 36.4% 51.5% 87.9% 0.0% 0.0% 12.1% 0.0% Aged 31-40 34.4% 51.6% 85.9% 3.1% 0.0% 9.4% 1.6% Aged 41-50 31.0% 54.9% 85.9% 1.4% 1.4% 9.9% 1.4% Aged Over 51 44.8% 36.2% 81.0% 3.4% 0.0% 13.8% 1.7% Refused to answer 45.0% 50.0% 95.0% 0.0% 0.0% 0.0% 5.0%
0 to 5 years 30.0% 52.5% 82.5% 5.0% 0.0% 10.0% 2.5% 6 to 10 years 37.5% 47.9% 85.4% 2.1% 0.0% 10.4% 2.1% 11 to 20 years 35.3% 48.2% 83.5% 2.4% 1.2% 12.9% 0.0% Over 21 years 40.7% 48.1% 88.9% 0.0% 0.0% 9.3% 1.9% Refused to answer 47.4% 47.4% 94.7% 0.0% 0.0% 0.0% 5.3%

40
Table 31: Percentage of children who enjoy looking at or reading books with an adult
Enjoy a lot
%
Enjoy a little
%
Total enjoy
%
Don’t enjoy much
%
Don’t enjoy at
all %
Neutral
%
Don’t know
%
All 95.9% 2.3% 98.3% 0.3% 0.0% 1.2% 0.3%
PVI 94.9% 2.8% 97.8% 0.6% 0.0% 1.1% 0.6% Maintained 96.4% 2.2% 98.5% 0.0% 0.0% 1.5% 0.0% Unknown 100.0% 0.0% 100.0% 0.0% 0.0% 0.0% 0.0%
Children’s centre 97.4% 0.0% 97.4% 0.0% 0.0% 2.6% 0.0% Day nursery 95.5% 0.0% 95.5% 2.3% 0.0% 0.0% 2.3% Nursery class/school 97.7% 2.3% 100.0% 0.0% 0.0% 0.0% 0.0% Reception class 94.5% 5.5% 100.0% 0.0% 0.0% 0.0% 0.0% Preschool playgroup 97.0% 1.0% 98.0% 0.0% 0.0% 2.0% 0.0% Missing 93.7% 4.8% 98.4% 0.0% 0.0% 1.6% 0.0%
1-5 Staff 96.1% 1.6% 97.7% 0.8% 0.0% 0.8% 0.8% 6-10 Staff 95.2% 3.8% 99.0% 0.0% 0.0% 1.0% 0.0% 11-20 Staff 95.1% 3.3% 98.4% 0.0% 0.0% 1.6% 0.0% Over 20 Staff 98.0% 0.0% 98.0% 0.0% 0.0% 2.0% 0.0%
Outstanding 98.4% 1.6% 100.0% 0.0% 0.0% 0.0% 0.0% Good 97.7% 2.3% 100.0% 0.0% 0.0% 0.0% 0.0% Improvement/inadequate 90.3% 3.2% 93.5% 3.2% 0.0% 3.2% 0.0% Don’t know 97.0% 0.0% 97.0% 0.0% 0.0% 3.0% 0.0% Refused to answer 89.1% 4.3% 93.5% 0.0% 0.0% 4.3% 2.2%
Aged 18-30 89.1% 8.7% 97.8% 0.0% 0.0% 2.2% 0.0% Aged 31-40 96.6% 2.3% 98.9% 1.1% 0.0% 0.0% 0.0% Aged 41-50 97.8% 2.2% 100.0% 0.0% 0.0% 0.0% 0.0% Aged Over 51 98.7% 0.0% 98.7% 0.0% 0.0% 1.3% 0.0% Refused to answer 92.7% 0.0% 92.7% 0.0% 0.0% 4.9% 2.4%
0 to 5 years 87.7% 8.8% 96.5% 1.8% 0.0% 1.8% 0.0% 6 to 10 years 98.6% 1.4% 100.0% 0.0% 0.0% 0.0% 0.0% 11 to 20 years 97.2% 1.9% 99.1% 0.0% 0.0% 0.9% 0.0% Over 21 years 100.0% 0.0% 100.0% 0.0% 0.0% 0.0% 0.0% Refused to answer 92.3% 0.0% 92.3% 0.0% 0.0% 5.1% 2.6%

41
Table 32: Percentage of children who enjoy looking at or reading books without an adult
Enjoy a lot
%
Enjoy a little
%
Total enjoy
%
Don’t enjoy much
%
Don’t enjoy at
all %
Neutral
%
Don’t know
%
All 66.9% 25.3% 92.2% 0.0% 0.0% 6.7% 1.2%
PVI 67.4% 22.5% 89.9% 0.0% 0.0% 8.4% 1.7% Maintained 61.3% 32.8% 94.2% 0.0% 0.0% 5.1% 0.7% Unknown 89.7% 6.9% 96.6% 0.0% 0.0% 3.4% 0.0%
Children’s centre 52.6% 34.2% 86.8% 0.0% 0.0% 13.2% 0.0% Day nursery 61.4% 25.0% 86.4% 0.0% 0.0% 11.4% 2.3% Nursery class/school 70.5% 25.0% 95.5% 0.0% 0.0% 4.5% 0.0% Reception class 63.6% 34.5% 98.2% 0.0% 0.0% 1.8% 0.0% Preschool playgroup 69.0% 24.0% 93.0% 0.0% 0.0% 6.0% 1.0% Missing 76.2% 14.3% 90.5% 0.0% 0.0% 6.3% 3.2%
1-5 Staff 63.3% 25.8% 89.1% 0.0% 0.0% 8.6% 2.3% 6-10 Staff 67.3% 25.0% 92.3% 0.0% 0.0% 6.7% 1.0% 11-20 Staff 65.6% 27.9% 93.4% 0.0% 0.0% 6.6% 0.0% Over 20 Staff 76.5% 21.6% 98.0% 0.0% 0.0% 2.0% 0.0%
Outstanding 66.1% 29.0% 95.2% 0.0% 0.0% 4.8% 0.0% Good 69.2% 25.0% 94.2% 0.0% 0.0% 4.7% 1.2% Improvement/inadequate 61.3% 32.3% 93.5% 0.0% 0.0% 6.5% 0.0% Don’t know 69.7% 12.1% 81.8% 0.0% 0.0% 15.2% 3.0% Refused to answer 60.9% 26.1% 87.0% 0.0% 0.0% 10.9% 2.2%
Aged 18-30 63.0% 32.6% 95.7% 0.0% 0.0% 4.3% 0.0% Aged 31-40 54.0% 31.0% 85.1% 0.0% 0.0% 12.6% 2.3% Aged 41-50 74.2% 23.7% 97.8% 0.0% 0.0% 2.2% 0.0% Aged Over 51 77.9% 15.6% 93.5% 0.0% 0.0% 5.2% 1.3% Refused to answer 61.0% 26.8% 87.8% 0.0% 0.0% 9.8% 2.4%
0 to 5 years 63.2% 22.8% 86.0% 0.0% 0.0% 12.3% 1.8% 6 to 10 years 59.5% 37.8% 97.3% 0.0% 0.0% 1.4% 1.4% 11 to 20 years 69.4% 22.2% 91.7% 0.0% 0.0% 8.3% 0.0% Over 21 years 77.3% 18.2% 95.5% 0.0% 0.0% 3.0% 1.5% Refused to answer 61.5% 25.6% 87.2% 0.0% 0.0% 10.3% 2.6%

42
Table 33: Percentage of children who enjoy using a tablet computer with an adult
Enjoy a lot
%
Enjoy a little
%
Total enjoy
%
Don’t enjoy much
%
Don’t enjoy at
all %
Neutral
%
Don’t know
%
All 76.1% 18.9% 95.0% 0.4% 0.0% 3.9% 0.8%
PVI 74.1% 20.3% 94.4% 0.7% 0.0% 3.5% 1.4% Maintained 76.8% 17.9% 94.7% 0.0% 0.0% 5.3% 0.0% Unknown 85.7% 14.3% 100.0% 0.0% 0.0% 0.0% 0.0%
Children’s centre 100.0% 0.0% 100.0% 0.0% 0.0% 0.0% 0.0% Day nursery 73.2% 17.1% 90.2% 2.4% 0.0% 4.9% 2.4% Nursery class/school 82.4% 14.7% 97.1% 0.0% 0.0% 2.9% 0.0% Reception class 78.8% 17.3% 96.2% 0.0% 0.0% 3.8% 0.0% Preschool playgroup 73.5% 21.7% 95.2% 0.0% 0.0% 3.6% 1.2% Missing 70.0% 25.0% 95.0% 0.0% 0.0% 5.0% 0.0%
1-5 Staff 74.7% 20.2% 94.9% 1.0% 0.0% 3.0% 1.0% 6-10 Staff 73.0% 21.6% 94.6% 0.0% 0.0% 4.1% 1.4% 11-20 Staff 80.0% 13.3% 93.3% 0.0% 0.0% 6.7% 0.0% Over 20 Staff 80.5% 17.1% 97.6% 0.0% 0.0% 2.4% 0.0%
Outstanding 87.5% 12.5% 100.0% 0.0% 0.0% 0.0% 0.0% Good 72.7% 21.7% 94.4% 0.0% 0.0% 4.9% 0.7% Improvement/inadequate 65.0% 25.0% 90.0% 5.0% 0.0% 5.0% 0.0% Don’t know 87.5% 12.5% 100.0% 0.0% 0.0% 0.0% 0.0% Refused to answer 70.8% 16.7% 87.5% 0.0% 0.0% 8.3% 4.2%
Aged 18-30 84.4% 15.6% 100.0% 0.0% 0.0% 0.0% 0.0% Aged 31-40 73.5% 22.1% 95.6% 1.5% 0.0% 2.9% 0.0% Aged 41-50 72.7% 22.1% 94.8% 0.0% 0.0% 3.9% 1.3% Aged Over 51 80.6% 14.5% 95.2% 0.0% 0.0% 4.8% 0.0% Refused to answer 70.0% 15.0% 85.0% 0.0% 0.0% 10.0% 5.0%
0 to 5 years 71.4% 23.8% 95.2% 2.4% 0.0% 2.4% 0.0% 6 to 10 years 76.0% 22.0% 98.0% 0.0% 0.0% 2.0% 0.0% 11 to 20 years 75.6% 20.0% 95.6% 0.0% 0.0% 3.3% 1.1% Over 21 years 82.8% 12.1% 94.8% 0.0% 0.0% 5.2% 0.0% Refused to answer 68.4% 15.8% 84.2% 0.0% 0.0% 10.5% 5.3%
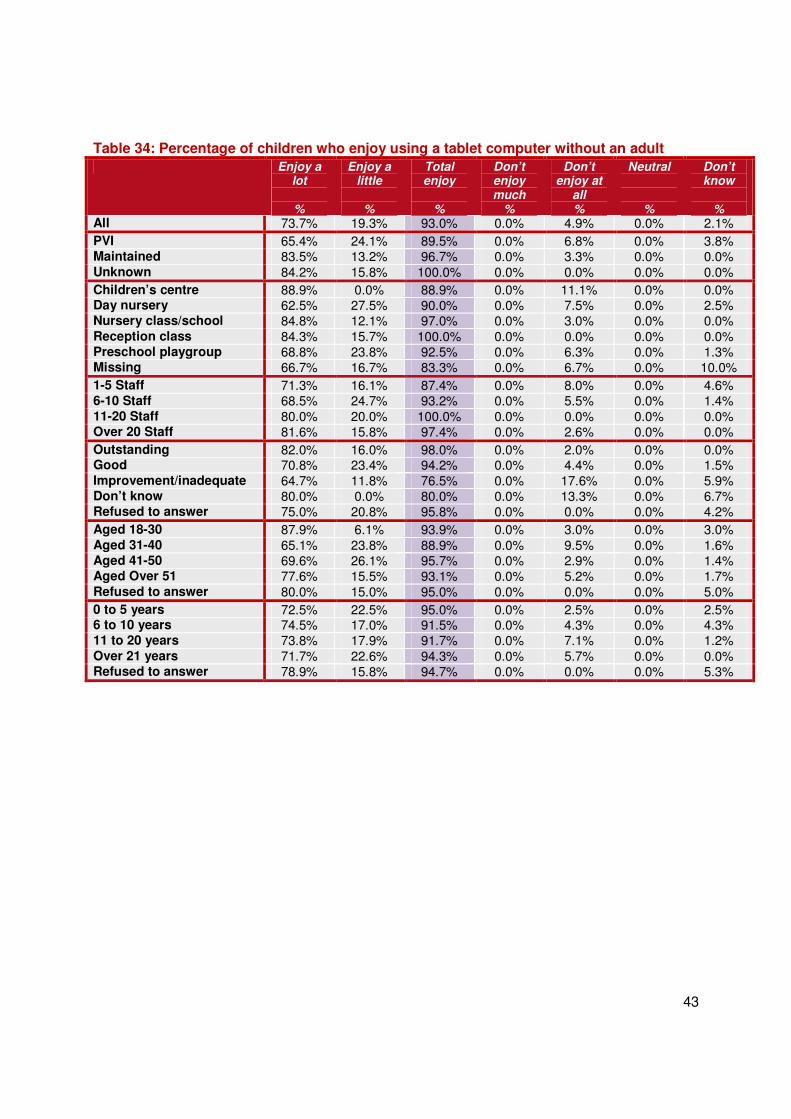
43
Table 34: Percentage of children who enjoy using a tablet computer without an adult
Enjoy a lot
%
Enjoy a little
%
Total enjoy
%
Don’t enjoy much
%
Don’t enjoy at
all %
Neutral
%
Don’t know
%
All 73.7% 19.3% 93.0% 0.0% 4.9% 0.0% 2.1%
PVI 65.4% 24.1% 89.5% 0.0% 6.8% 0.0% 3.8% Maintained 83.5% 13.2% 96.7% 0.0% 3.3% 0.0% 0.0% Unknown 84.2% 15.8% 100.0% 0.0% 0.0% 0.0% 0.0%
Children’s centre 88.9% 0.0% 88.9% 0.0% 11.1% 0.0% 0.0% Day nursery 62.5% 27.5% 90.0% 0.0% 7.5% 0.0% 2.5% Nursery class/school 84.8% 12.1% 97.0% 0.0% 3.0% 0.0% 0.0% Reception class 84.3% 15.7% 100.0% 0.0% 0.0% 0.0% 0.0% Preschool playgroup 68.8% 23.8% 92.5% 0.0% 6.3% 0.0% 1.3% Missing 66.7% 16.7% 83.3% 0.0% 6.7% 0.0% 10.0%
1-5 Staff 71.3% 16.1% 87.4% 0.0% 8.0% 0.0% 4.6% 6-10 Staff 68.5% 24.7% 93.2% 0.0% 5.5% 0.0% 1.4% 11-20 Staff 80.0% 20.0% 100.0% 0.0% 0.0% 0.0% 0.0% Over 20 Staff 81.6% 15.8% 97.4% 0.0% 2.6% 0.0% 0.0%
Outstanding 82.0% 16.0% 98.0% 0.0% 2.0% 0.0% 0.0% Good 70.8% 23.4% 94.2% 0.0% 4.4% 0.0% 1.5% Improvement/inadequate 64.7% 11.8% 76.5% 0.0% 17.6% 0.0% 5.9% Don’t know 80.0% 0.0% 80.0% 0.0% 13.3% 0.0% 6.7% Refused to answer 75.0% 20.8% 95.8% 0.0% 0.0% 0.0% 4.2%
Aged 18-30 87.9% 6.1% 93.9% 0.0% 3.0% 0.0% 3.0% Aged 31-40 65.1% 23.8% 88.9% 0.0% 9.5% 0.0% 1.6% Aged 41-50 69.6% 26.1% 95.7% 0.0% 2.9% 0.0% 1.4% Aged Over 51 77.6% 15.5% 93.1% 0.0% 5.2% 0.0% 1.7% Refused to answer 80.0% 15.0% 95.0% 0.0% 0.0% 0.0% 5.0%
0 to 5 years 72.5% 22.5% 95.0% 0.0% 2.5% 0.0% 2.5% 6 to 10 years 74.5% 17.0% 91.5% 0.0% 4.3% 0.0% 4.3% 11 to 20 years 73.8% 17.9% 91.7% 0.0% 7.1% 0.0% 1.2% Over 21 years 71.7% 22.6% 94.3% 0.0% 5.7% 0.0% 0.0% Refused to answer 78.9% 15.8% 94.7% 0.0% 0.0% 0.0% 5.3%

44
Table 35: Percentage of children who have access to a tablet computer and are confident using it with an adult
Very confident
%
Fairly confident
%
Total confident
%
Not very confident
%
Not at all confident
%
Neutral
%
Don’t know
% All 60.0% 34.3% 94.3% 0.0% 0.0% 5.7% 0.0%
PVI 67.5% 30.0% 97.5% 0.0% 0.0% 2.5% 0.0% Maintained 45.5% 40.9% 86.4% 0.0% 0.0% 13.6% 0.0% Unknown 62.5% 37.5% 100.0% 0.0% 0.0% 0.0% 0.0%
Children’s centre 50.0% 50.0% 100.0% 0.0% 0.0% 0.0% 0.0% Day nursery 88.9% 11.1% 100.0% 0.0% 0.0% 0.0% 0.0% Nursery class/school 57.1% 42.9% 100.0% 0.0% 0.0% 0.0% 0.0% Reception class 60.0% 26.7% 86.7% 0.0% 0.0% 13.3% 0.0% Preschool playgroup 54.5% 45.5% 100.0% 0.0% 0.0% 0.0% 0.0% Missing 54.2% 37.5% 91.7% 0.0% 0.0% 8.3% 0.0%
1-5 Staff 56.7% 36.7% 93.3% 0.0% 0.0% 6.7% 0.0% 6-10 Staff 64.7% 35.3% 100.0% 0.0% 0.0% 0.0% 0.0% 11-20 Staff 66.7% 33.3% 100.0% 0.0% 0.0% 0.0% 0.0% Over 20 Staff 57.1% 28.6% 85.7% 0.0% 0.0% 14.3% 0.0%
Outstanding 66.7% 33.3% 100.0% 0.0% 0.0% 0.0% 0.0% Good 52.9% 41.2% 94.1% 0.0% 0.0% 5.9% 0.0% Improvement/inadequate 60.0% 20.0% 80.0% 0.0% 0.0% 20.0% 0.0% Don’t know 77.8% 11.1% 88.9% 0.0% 0.0% 11.1% 0.0% Refused to answer 50.0% 50.0% 100.0% 0.0% 0.0% 0.0% 0.0%
Aged 18-30 75.0% 12.5% 87.5% 0.0% 0.0% 12.5% 0.0% Aged 31-40 55.0% 40.0% 95.0% 0.0% 0.0% 5.0% 0.0% Aged 41-50 54.5% 40.9% 95.5% 0.0% 0.0% 4.5% 0.0% Aged Over 51 63.2% 31.6% 94.7% 0.0% 0.0% 5.3% 0.0% Refused to answer 100.0% 0.0% 100.0% 0.0% 0.0% 0.0% 0.0%
0 to 5 years 54.5% 45.5% 100.0% 0.0% 0.0% 0.0% 0.0% 6 to 10 years 50.0% 35.7% 85.7% 0.0% 0.0% 14.3% 0.0% 11 to 20 years 69.2% 30.8% 100.0% 0.0% 0.0% 0.0% 0.0% Over 21 years 55.6% 33.3% 88.9% 0.0% 0.0% 11.1% 0.0% Refused to answer 100.0% 0.0% 100.0% 0.0% 0.0% 0.0% 0.0%

45
Table 36: Percentage of children who have access to a tablet computer and are confident using it without an adult
Very confident
%
Fairly confident
%
Total confident
%
Not very confident
%
Not at all confident
%
Neutral
%
Don’t know
% All 53.2% 33.9% 87.1% 0.0% 0.0% 9.7% 3.2%
PVI 60.0% 28.6% 88.6% 0.0% 0.0% 5.7% 5.7% Maintained 40.0% 45.0% 85.0% 0.0% 0.0% 15.0% 0.0% Unknown 57.1% 28.6% 85.7% 0.0% 0.0% 14.3% 0.0%
Children’s centre 50.0% 50.0% 100.0% 0.0% 0.0% 0.0% 0.0% Day nursery 87.5% 12.5% 100.0% 0.0% 0.0% 0.0% 0.0% Nursery class/school 33.3% 66.7% 100.0% 0.0% 0.0% 0.0% 0.0% Reception class 57.1% 35.7% 92.9% 0.0% 0.0% 7.1% 0.0% Preschool playgroup 30.0% 60.0% 90.0% 0.0% 0.0% 10.0% 0.0% Missing 55.0% 15.0% 70.0% 0.0% 0.0% 20.0% 10.0%
1-5 Staff 54.2% 25.0% 79.2% 0.0% 0.0% 12.5% 8.3% 6-10 Staff 52.9% 47.1% 100.0% 0.0% 0.0% 0.0% 0.0% 11-20 Staff 55.6% 44.4% 100.0% 0.0% 0.0% 0.0% 0.0% Over 20 Staff 50.0% 25.0% 75.0% 0.0% 0.0% 25.0% 0.0%
Outstanding 46.7% 46.7% 93.3% 0.0% 0.0% 6.7% 0.0% Good 50.0% 37.5% 87.5% 0.0% 0.0% 9.4% 3.1% Improvement/inadequate 66.7% 0.0% 66.7% 0.0% 0.0% 0.0% 33.3% Don’t know 77.8% 11.1% 88.9% 0.0% 0.0% 11.1% 0.0% Refused to answer 33.3% 33.3% 66.7% 0.0% 0.0% 33.3% 0.0%
Aged 18-30 55.6% 33.3% 88.9% 0.0% 0.0% 11.1% 0.0% Aged 31-40 47.1% 35.3% 82.4% 0.0% 0.0% 11.8% 5.9% Aged 41-50 44.4% 44.4% 88.9% 0.0% 0.0% 11.1% 0.0% Aged Over 51 66.7% 22.2% 88.9% 0.0% 0.0% 5.6% 5.6% Refused to answer 0.0% 0.0% 0.0% 0.0% 0.0% 0.0% 0.0%
0 to 5 years 50.0% 30.0% 80.0% 0.0% 0.0% 10.0% 10.0% 6 to 10 years 41.7% 33.3% 75.0% 0.0% 0.0% 16.7% 8.3% 11 to 20 years 60.9% 30.4% 91.3% 0.0% 0.0% 8.7% 0.0% Over 21 years 52.9% 41.2% 94.1% 0.0% 0.0% 5.9% 0.0% Refused to answer 0.0% 0.0% 0.0% 0.0% 0.0% 0.0% 0.0%

46
Table 37: Percentage of children who have access to a tablet computer and enjoy using it with an adult
Enjoy a lot
%
Enjoy a little
%
Total enjoy
%
Don’t enjoy much
%
Don’t enjoy at
all %
Neutral
%
Don’t know
%
All 85.9% 11.3% 97.2% 0.0% 0.0% 2.8% 0.0%
PVI 87.5% 12.5% 100.0% 0.0% 0.0% 0.0% 0.0% Maintained 82.6% 8.7% 91.3% 0.0% 0.0% 8.7% 0.0% Unknown 87.5% 12.5% 100.0% 0.0% 0.0% 0.0% 0.0%
Children’s centre 100.0% 0.0% 100.0% 0.0% 0.0% 0.0% 0.0% Day nursery 88.9% 11.1% 100.0% 0.0% 0.0% 0.0% 0.0% Nursery class/school 100.0% 0.0% 100.0% 0.0% 0.0% 0.0% 0.0% Reception class 93.3% 0.0% 93.3% 0.0% 0.0% 6.7% 0.0% Preschool playgroup 81.8% 18.2% 100.0% 0.0% 0.0% 0.0% 0.0% Missing 76.0% 20.0% 96.0% 0.0% 0.0% 4.0% 0.0%
1-5 Staff 83.9% 12.9% 96.8% 0.0% 0.0% 3.2% 0.0% 6-10 Staff 88.2% 11.8% 100.0% 0.0% 0.0% 0.0% 0.0% 11-20 Staff 88.9% 11.1% 100.0% 0.0% 0.0% 0.0% 0.0% Over 20 Staff 85.7% 7.1% 92.9% 0.0% 0.0% 7.1% 0.0%
Outstanding 89.5% 10.5% 100.0% 0.0% 0.0% 0.0% 0.0% Good 82.4% 11.8% 94.1% 0.0% 0.0% 5.9% 0.0% Improvement/inadequate 100.0% 0.0% 100.0% 0.0% 0.0% 0.0% 0.0% Don’t know 88.9% 11.1% 100.0% 0.0% 0.0% 0.0% 0.0% Refused to answer 75.0% 25.0% 100.0% 0.0% 0.0% 0.0% 0.0%
Aged 18-30 100.0% 0.0% 100.0% 0.0% 0.0% 0.0% 0.0% Aged 31-40 81.0% 19.0% 100.0% 0.0% 0.0% 0.0% 0.0% Aged 41-50 77.3% 18.2% 95.5% 0.0% 0.0% 4.5% 0.0% Aged Over 51 94.7% 0.0% 94.7% 0.0% 0.0% 5.3% 0.0% Refused to answer 100.0% 0.0% 100.0% 0.0% 0.0% 0.0% 0.0%
0 to 5 years 66.7% 25.0% 91.7% 0.0% 0.0% 8.3% 0.0% 6 to 10 years 92.9% 7.1% 100.0% 0.0% 0.0% 0.0% 0.0% 11 to 20 years 88.5% 11.5% 100.0% 0.0% 0.0% 0.0% 0.0% Over 21 years 88.9% 5.6% 94.4% 0.0% 0.0% 5.6% 0.0% Refused to answer 100.0% 0.0% 100.0% 0.0% 0.0% 0.0% 0.0%

47
Table 38: Percentage of children who have access to a tablet computer and enjoy using a it without an adult
Enjoy a lot
%
Enjoy a little
%
Total enjoy
%
Don’t enjoy much
%
Don’t enjoy at
all %
Neutral
%
Don’t know
%
All 83.3% 8.3% 91.7% 0.0% 0.0% 3.3% 5.0%
PVI 80.0% 8.6% 88.6% 0.0% 0.0% 2.9% 8.6% Maintained 84.2% 10.5% 94.7% 0.0% 0.0% 5.3% 0.0% Unknown 100.0% 0.0% 100.0% 0.0% 0.0% 0.0% 0.0%
Children’s centre 100.0% 0.0% 100.0% 0.0% 0.0% 0.0% 0.0% Day nursery 100.0% 0.0% 100.0% 0.0% 0.0% 0.0% 0.0% Nursery class/school 83.3% 16.7% 100.0% 0.0% 0.0% 0.0% 0.0% Reception class 100.0% 0.0% 100.0% 0.0% 0.0% 0.0% 0.0% Preschool playgroup 70.0% 20.0% 90.0% 0.0% 0.0% 10.0% 0.0% Missing 68.4% 10.5% 78.9% 0.0% 0.0% 5.3% 15.8%
1-5 Staff 79.2% 4.2% 83.3% 0.0% 0.0% 4.2% 12.5% 6-10 Staff 81.3% 18.8% 100.0% 0.0% 0.0% 0.0% 0.0% 11-20 Staff 100.0% 0.0% 100.0% 0.0% 0.0% 0.0% 0.0% Over 20 Staff 81.8% 9.1% 90.9% 0.0% 0.0% 9.1% 0.0%
Outstanding 93.3% 6.7% 100.0% 0.0% 0.0% 0.0% 0.0% Good 80.6% 9.7% 90.3% 0.0% 0.0% 6.5% 3.2% Improvement/inadequate 66.7% 0.0% 66.7% 0.0% 0.0% 0.0% 33.3% Don’t know 87.5% 0.0% 87.5% 0.0% 0.0% 0.0% 12.5% Refused to answer 66.7% 33.3% 100.0% 0.0% 0.0% 0.0% 0.0%
Aged 18-30 88.9% 0.0% 88.9% 0.0% 0.0% 0.0% 11.1% Aged 31-40 75.0% 12.5% 87.5% 0.0% 0.0% 6.3% 6.3% Aged 41-50 82.4% 17.6% 100.0% 0.0% 0.0% 0.0% 0.0% Aged Over 51 88.9% 0.0% 88.9% 0.0% 0.0% 5.6% 5.6% Refused to answer 0.0% 0.0% 0.0% 0.0% 0.0% 0.0% 0.0%
0 to 5 years 80.0% 10.0% 90.0% 0.0% 0.0% 0.0% 10.0% 6 to 10 years 81.8% 0.0% 81.8% 0.0% 0.0% 0.0% 18.2% 11 to 20 years 86.4% 9.1% 95.5% 0.0% 0.0% 4.5% 0.0% Over 21 years 82.4% 11.8% 94.1% 0.0% 0.0% 5.9% 0.0% Refused to answer 0.0% 0.0% 0.0% 0.0% 0.0% 0.0% 0.0%

48
Table 39: Percentage of practitioners who think tablet computers are central or supplemental to structured activities or to free play
Structured activities Free play Central
%
Supplemental
%
Should not be used
%
Don’t know
%
Central
%
Supplemental
%
Should not be used
%
Don’t know
%
All 3.1% 84.9% 6.0% 6.0% 5.7% 80.8% 9.7% 3.8%
PVI 3.7% 88.9% 1.9% 5.6% 6.8% 81.5% 8.0% 3.7% Maintained 2.4% 81.1% 11.8% 4.7% 4.7% 78.7% 12.6% 3.9% Unknown 3.4% 79.3% 3.4% 13.8% 3.4% 86.2% 6.9% 3.4%
Children’s centre 8.1% 75.7% 8.1% 8.1% 10.8% 75.7% 8.1% 5.4% Day nursery 2.4% 82.9% 2.4% 12.2% 2.4% 85.4% 9.8% 2.4% Nursery class/school 2.6% 82.1% 12.8% 2.6% 5.1% 79.5% 12.8% 2.6% Reception class 0.0% 84.0% 16.0% 0.0% 0.0% 82.0% 18.0% 0.0% Preschool playgroup 2.2% 92.3% 1.1% 4.4% 4.4% 82.4% 9.9% 3.3% Missing 5.0% 83.3% 1.7% 10.0% 11.7% 78.3% 1.7% 8.3%
1-5 Staff 1.7% 93.3% 1.7% 3.4% 6.7% 85.7% 5.0% 2.5% 6-10 Staff 4.1% 81.4% 7.2% 7.2% 5.2% 75.3% 14.4% 5.2% 11-20 Staff 5.3% 80.7% 8.8% 5.3% 3.5% 80.7% 14.0% 1.8% Over 20 Staff 2.2% 75.6% 11.1% 11.1% 6.7% 80.0% 6.7% 6.7%
Outstanding 3.2% 87.1% 6.5% 3.2% 8.1% 75.8% 11.3% 4.8% Good 3.5% 86.6% 5.8% 4.1% 3.5% 86.0% 9.3% 1.2% Improvement/inadequate 0.0% 87.1% 6.5% 6.5% 12.9% 74.2% 9.7% 3.2% Don’t know 6.1% 69.7% 3.0% 21.2% 6.1% 66.7% 12.1% 15.2% Refused to answer 0.0% 85.0% 10.0% 5.0% 5.0% 85.0% 5.0% 5.0%
Aged 18-30 6.5% 82.6% 4.3% 6.5% 4.3% 78.3% 10.9% 6.5% Aged 31-40 3.4% 86.2% 2.3% 8.0% 3.4% 86.2% 6.9% 3.4% Aged 41-50 2.2% 87.1% 6.5% 4.3% 7.5% 83.9% 7.5% 1.1% Aged Over 51 2.6% 80.5% 11.7% 5.2% 6.5% 72.7% 15.6% 5.2% Refused to answer 0.0% 93.3% 0.0% 6.7% 6.7% 80.0% 6.7% 6.7%
0 to 5 years 7.0% 84.2% 5.3% 3.5% 7.0% 86.0% 5.3% 1.8% 6 to 10 years 2.7% 83.8% 4.1% 9.5% 6.8% 75.7% 9.5% 8.1% 11 to 20 years 0.9% 87.0% 5.6% 6.5% 3.7% 87.0% 8.3% 0.9% Over 21 years 4.5% 81.8% 10.6% 3.0% 6.1% 72.7% 16.7% 4.5% Refused to answer 0.0% 92.3% 0.0% 7.7% 7.7% 76.9% 7.7% 7.7%

49
Table 40: Percentage of practitioners who would like to increase use of tablet computers in their setting
Yes, I would like to increase use
%
No, already use enough
%
No, I don’t think we should use
%
No, other reason
% All 65.8% 17.1% 8.9% 8.2%
PVI 61.3% 20.6% 8.1% 10.0% Maintained 74.2% 10.2% 10.2% 5.5% Unknown 53.6% 28.6% 7.1% 10.7%
Children’s centre 65.7% 11.4% 14.3% 8.6% Day nursery 66.7% 19.0% 7.1% 7.1% Nursery class/school 69.0% 16.7% 9.5% 4.8% Reception class 86.3% 9.8% 2.0% 2.0% Preschool playgroup 67.8% 11.5% 10.3% 10.3% Missing 42.4% 33.9% 10.2% 13.6%
1-5 Staff 58.6% 20.7% 9.5% 11.2% 6-10 Staff 70.4% 14.3% 7.1% 8.2% 11-20 Staff 69.6% 12.5% 8.9% 8.9% Over 20 Staff 69.6% 19.6% 10.9% 0.0%
Outstanding 60.0% 26.7% 8.3% 5.0% Good 69.0% 16.1% 8.3% 6.5% Improvement/inadequate 73.1% 7.7% 7.7% 11.5% Don’t know 57.6% 15.2% 12.1% 15.2% Refused to answer 62.1% 13.8% 10.3% 13.8%
Aged 18-30 63.0% 19.6% 10.9% 6.5% Aged 31-40 70.6% 18.8% 4.7% 5.9% Aged 41-50 65.5% 17.2% 10.3% 6.9% Aged Over 51 62.2% 17.6% 9.5% 10.8% Refused to answer 66.7% 4.2% 12.5% 16.7%
0 to 5 years 63.6% 14.5% 14.5% 7.3% 6 to 10 years 71.8% 12.7% 9.9% 5.6% 11 to 20 years 62.5% 23.1% 4.8% 9.6% Over 21 years 67.2% 18.8% 7.8% 6.3% Refused to answer 63.6% 4.5% 13.6% 18.2%

50
Table 41: Percentage of practitioners who agree with the statement that ‘to help them get on at school, it is important children learn to use computers and other technology from an early age’
Strongly Agree
%
Agree
%
Total Agree
%
Disagree
%
Strongly Disagree
%
Neutral
%
Don’t know
% All 28.8% 46.0% 74.8% 7.7% 2.5% 14.7% 0.3%
PVI 24.1% 48.8% 72.9% 9.0% 2.4% 15.1% 0.6% Maintained 37.4% 38.9% 76.3% 6.1% 3.1% 14.5% 0.0% Unknown 17.2% 62.1% 79.3% 6.9% 0.0% 13.8% 0.0%
Children’s centre 35.1% 43.2% 78.4% 13.5% 0.0% 8.1% 0.0% Day nursery 23.8% 52.4% 76.2% 7.1% 0.0% 14.3% 2.4% Nursery class/school 33.3% 28.6% 61.9% 11.9% 7.1% 19.0% 0.0% Reception class 43.1% 41.2% 84.3% 2.0% 0.0% 13.7% 0.0% Preschool playgroup 18.3% 54.8% 73.1% 7.5% 4.3% 15.1% 0.0% Missing 29.5% 45.9% 75.4% 6.6% 1.6% 16.4% 0.0%
1-5 Staff 23.8% 49.2% 73.0% 7.4% 3.3% 15.6% 0.8% 6-10 Staff 29.3% 47.5% 76.8% 9.1% 2.0% 12.1% 0.0% 11-20 Staff 28.8% 50.8% 79.7% 6.8% 1.7% 11.9% 0.0% Over 20 Staff 41.3% 28.3% 69.6% 6.5% 2.2% 21.7% 0.0%
Outstanding 33.9% 43.5% 77.4% 4.8% 4.8% 12.9% 0.0% Good 30.8% 45.3% 76.2% 6.4% 2.9% 14.5% 0.0% Improvement/inadequate 22.6% 58.1% 80.6% 9.7% 0.0% 9.7% 0.0% Don’t know 24.2% 45.5% 69.7% 12.1% 0.0% 18.2% 0.0% Refused to answer 17.9% 42.9% 60.7% 14.3% 0.0% 21.4% 3.6%
Aged 18-30 34.8% 34.8% 69.6% 10.9% 0.0% 19.6% 0.0% Aged 31-40 36.8% 44.8% 81.6% 10.3% 2.3% 5.7% 0.0% Aged 41-50 23.7% 50.5% 74.2% 5.4% 3.2% 17.2% 0.0% Aged Over 51 26.0% 49.4% 75.3% 2.6% 3.9% 18.2% 0.0% Refused to answer 17.4% 43.5% 60.9% 17.4% 0.0% 17.4% 4.3%
0 to 5 years 45.6% 33.3% 78.9% 3.5% 1.8% 15.8% 0.0% 6 to 10 years 28.4% 44.6% 73.0% 12.2% 2.7% 12.2% 0.0% 11 to 20 years 21.3% 53.7% 75.0% 7.4% 3.7% 13.9% 0.0% Over 21 years 31.8% 47.0% 78.8% 3.0% 1.5% 16.7% 0.0% Refused to answer 14.3% 42.9% 57.1% 19.0% 0.0% 19.0% 4.8%

51
Table 42: Percentage of practitioners who agree with the statement that ‘traditional objects such as books, toys and alphabet blocks are more educational than computer-based games with sounds and letters’
Strongly Agree
%
Agree
%
Total Agree
%
Disagree
%
Strongly Disagree
%
Neutral
%
Don’t know
% All 21.2% 18.4% 39.6% 14.4% 2.8% 42.9% 0.3%
PVI 21.7% 16.3% 38.0% 14.5% 2.4% 44.6% 0.6% Maintained 19.1% 18.3% 37.4% 16.0% 2.3% 44.3% 0.0% Unknown 27.6% 31.0% 58.6% 6.9% 6.9% 27.6% 0.0%
Children’s centre 21.6% 18.9% 40.5% 18.9% 5.4% 35.1% 0.0% Day nursery 11.9% 16.7% 28.6% 14.3% 0.0% 54.8% 2.4% Nursery class/school 33.3% 14.3% 47.6% 19.0% 0.0% 33.3% 0.0% Reception class 9.8% 13.7% 23.5% 17.6% 3.9% 54.9% 0.0% Preschool playgroup 24.7% 24.7% 49.5% 10.8% 2.2% 37.6% 0.0% Missing 23.0% 16.4% 39.3% 11.5% 4.9% 44.3% 0.0%
1-5 Staff 23.8% 22.1% 45.9% 11.5% 4.1% 37.7% 0.8% 6-10 Staff 20.2% 17.2% 37.4% 13.1% 2.0% 47.5% 0.0% 11-20 Staff 20.3% 15.3% 35.6% 18.6% 0.0% 45.8% 0.0% Over 20 Staff 17.4% 15.2% 32.6% 19.6% 4.3% 43.5% 0.0%
Outstanding 19.4% 17.7% 37.1% 17.7% 1.6% 43.5% 0.0% Good 22.1% 16.9% 39.0% 11.6% 2.3% 47.1% 0.0% Improvement/inadequate 22.6% 25.8% 48.4% 9.7% 0.0% 41.9% 0.0% Don’t know 18.2% 9.1% 27.3% 27.3% 12.1% 33.3% 0.0% Refused to answer 21.4% 32.1% 53.6% 14.3% 0.0% 28.6% 3.6%
Aged 18-30 21.7% 10.9% 32.6% 19.6% 4.3% 43.5% 0.0% Aged 31-40 21.8% 19.5% 41.4% 16.1% 1.1% 41.4% 0.0% Aged 41-50 22.6% 17.2% 39.8% 14.0% 2.2% 44.1% 0.0% Aged Over 51 18.2% 19.5% 37.7% 9.1% 5.2% 48.1% 0.0% Refused to answer 21.7% 30.4% 52.2% 17.4% 0.0% 26.1% 4.3%
0 to 5 years 15.8% 15.8% 31.6% 17.5% 5.3% 45.6% 0.0% 6 to 10 years 21.6% 17.6% 39.2% 14.9% 2.7% 43.2% 0.0% 11 to 20 years 21.3% 18.5% 39.8% 13.9% 1.9% 44.4% 0.0% Over 21 years 24.2% 18.2% 42.4% 10.6% 3.0% 43.9% 0.0% Refused to answer 23.8% 28.6% 52.4% 19.0% 0.0% 23.8% 4.8%

52
References Elliot, C., Smith, P., McCulloch, K. (1996). British Ability Scales Second Edition (BAS III). Windsor: NFER – Nelson Publishing Company Limited. Flewitt, R. (2012). Multimodal literacies in the early years. The Centre for Research in Educational Technology. The Open University, Milton Keynes. Green, S.D., Peterson, R., & Lewis, J.R. (2006). Language and Literacy Promotion in Early Childhood Settings: A Survey of Centre-Based Practices. Early Childhood Research & Practice, 8 (1). Kirkorian, H.L. & Pempek, T.A. (2013). Toddlers and touch screens: Potential for Early Learning? Zero to Three Journal, 33, 4. Sammons, P., Sylva, K., Melhuish, E., Siraj-Blatchford, I., Taggart, B., Grabbe, Y., Barreau, S., (2007). Influences on children’s attainment and progress in Key Stage 2: Cognitive outcomes in Year 5. Sammons, P., Sylva, K., Melhuish, E., Siraj-Blatchford, I., Taggart, B., Hunt, S. (2008). Influences on children’s attainment and progress in Key Stage 2: Cognitive outcomes in Year 6. Singer, D.G., Golinkoff, R.M., & Hirsh-Pasek, K. (2006). Play = Learning: How play motivates and enhances children’s cognitive and social-emotional growth. Oxford University Press: Oxford. Sylva, K., Melhuish, E., Sammons, P., Siraj-Blatchford, I., Taggart, B., Elliot., K. (2004). Effective provision of preschool education (EPPE) Project: Findings from the preschool period. Department for Education and Skills. Research Brief RBX15-03. Sylva, K., Melhuish, E., Sammons, P., Siraj-Blatchford, I., Taggart, B., Hunt, S., Jelicic, H., Barreau, S., Grabbe, Y., Smees, R., Welcomme, W. (2008). Final report from the primary phase: Preschool, School and Family Influences on Children’s Development during Key Stage 2 (Age 7-11). Research Report DCSF-RR061. Sylva (2010). Quality in early childhood settings. In Sylva, K., Melhuish, E., Sammons, P., Siraj-Blatchford, I. & Taggart, B. (2010) Early Childhood Matters: Evidence from the Effective Preschool and Primary Education Project. Abingdon, Oxford, Routledge. Chapter 5: 70-89. Wolfe, S. and Flewitt, R. (2010). New technologies, new multimodal literacy practices and young children’s metacognitive development. Cambridge Journal of education 40 (4), 387-399.