practice general test #3 section 5—quantitative reasoning section 6—quantitative...
TRANSCRIPT
GRADUATE RECORD EXAMINATIONS®
Practice General Test #3
Section 5—Quantitative Reasoning
Section 6—Quantitative Reasoning
Copyright © 2012 by Educational Testing Service. All rights reserved. E T S, the E T S
logo, GRADUATE RECORD EXAMINATIONS, and G R E are registered trademarks
of Educational Testing Service (E T S) in the United States and other countries.
GRE_Practice_Test_3_Quant.docPage 1 of 55

Instructions for the Verbal Reasoning and
Quantitative Reasoning SectionsInformation for screen reader users:
This document has been created to be accessible to individuals who use screen readers.
You may wish to consult the manual or help system for your screen reader to learn how
best to take advantage of the features implemented in this document. Please consult the
separate document, GRE Screen Reader Instructions.doc, for important details.
This practice test includes content that some users may wish to skip. For example, some
questions require you to complete sentences or longer texts from among several choices.
For those questions where it might be helpful to hear the available choices in context, text
of the choices in context is included. However, some users may wish to skip this material.
Similarly, some questions include detailed figure descriptions that some users may wish
to skip because they can get the required information from the accompanying tactile or
large print figures. In each case, material that may be skipped is delineated by statements
like “Begin skippable content” and “End skippable content” each in the Heading 6 style.
As a reminder, standard timing for each section of the test is provided in the table below:
GRE_Practice_Test_3_Quant.docPage 2 of 55

Section Order Section Name Standard Time1 Analytical Writing 1:
Analyze an Issue
30 minutes
2 Analytical Writing 2:
Analyze an Argument
30 minutes
3 Verbal Reasoning 35 minutes4 Verbal Reasoning 35 minutes5 Quantitative Reasoning 40 minutes6 Quantitative Reasoning 40 minutes
The Quantitative sections include figures and their descriptions. In addition, separate
figure supplements, in large print (18 points) and raised-line formats, are available. The
large print figure supplement may be downloaded from www.gre.org. To obtain the
raised-line figure supplement or if you have difficulty locating the large print figure
supplement on the G R E® web site, contact E T S Disability Services Monday-Friday
8:30 a.m. to 4:30 p.m. New York time, 1-609-771-7780, 1-866-387-8602 (toll free for
test takers in the United States, U.S. Territories, and Canada). E-mail: [email protected].
Important NotesIn the actual test, your scores for the multiple-choice sections will be determined by the
number of questions you answer correctly. Nothing is subtracted from a score if you
answer a question incorrectly. Therefore, to maximize your scores it is better for you to
guess at an answer than not to respond at all. Work as rapidly as you can without losing
accuracy. Do not spend too much time on questions that are too difficult for you. Go on
to the other questions and come back to the difficult ones later.
Some or all of the passages in this test have been adapted from published material to
provide the examinee with significant problems for analysis and evaluation. To make the
passages suitable for testing purposes, the style, content, or point of view of the original
may have been altered. The ideas contained in the passages do not necessarily represent
the opinions of the Graduate Record Examinations Board or Educational Testing Service.
GRE_Practice_Test_3_Quant.docPage 3 of 55

You may use a calculator in the Quantitative Reasoning sections only. You will be
provided with a basic calculator and cannot use any other calculator, except as an
approved accommodation.
Marking Your Answers
In the actual test, all answers must be entered in the test book (or in the supervisor’s copy
of the test book if you are not using a print format test). If answers are being recorded in a
large print test book, the directions for marking answers are slightly different because
answers entered in large print test books are not machine-scored.
If your answers are being entered in a large print test book, make sure your marks
are clear and unambiguous. Additional instructions for marking answers in large print
test books are provided with the large print practice tests.
The following instructions describe how answers must be filled in if using a regular print
test book, whether you are entering your own answers or a scribe is entering them at your
direction.
Be sure that each mark is dark and completely fills the circle.
Any stray marks that lie in or near a circle must be erased carefully. If you change an
answer, be sure that all previous marks are erased completely. Stray marks and
incomplete erasures may be read as intended answers. You may work out your answers in
the blank areas of the test book, but do not work out answers near the circles. Scratch
paper will not be provided, except as an approved accommodation.
Question Formats
This practice test may include questions that would not be used in an actual test
administered in an alternate format because they have been determined to be less suitable
for presentation in such formats.
The questions in these sections have several different formats. A brief description of
these formats and instructions for entering your answer choices are given below.
GRE_Practice_Test_3_Quant.docPage 4 of 55

Multiple-Choice Questions—Select One Answer Choice
These standard multiple-choice questions require you to select just one answer choice
from a list of options. You will receive credit only if you mark the single correct answer
choice and no other.
Example:
What city is the capital of France?
A. Rome
B. Paris
C. London
D. Cairo
In this example, B, Paris, should be marked.
Multiple-Choice Questions—Select One or More Answer Choices
Some of these questions specify how many answer choices you must select; others
require you to select all that apply. In either case, to receive credit all of the correct
answer choices must be marked. In printed versions of the test, these questions are
distinguished by the use of a square box to select an answer choice.
Example:
Select all that apply.
Which of the following countries are in Africa?
A. China
B. Congo
C. France
D. Kenya
In this example, B and D (Congo and Kenya) should be marked.
GRE_Practice_Test_3_Quant.docPage 5 of 55

Column Format Questions
This question type presents the answer choices in groups (presented as columns in the
printed version of the test). You must pick one answer choice from each group. You will
receive credit only if you mark the correct answer choice in each group. In the following
example, there is a sentence with two blanks, each indicating that something has been
omitted. For each question of this type, first you will hear the text with the word
“BLANK” in place of the omitted material. Next, you will hear the text again, but in
place of each blank, you will hear three lettered options for filling that blank. The set of
lettered options is formatted as bold and enclosed in parentheses. Each option consists of
a word or phrase.
For questions containing one or two blanks, following the list of answer choices are up to
nine readings of the text, one for each answer choice combination. The group of readings
begins with a “Begin Skippable Content” level-6 heading and ends with an “End
Skippable Content” level-6 heading. Each reading consists of the option letter or letters,
the words or phrases being combined, and the text with the combination of the words or
phrases inserted into the blanks.
For questions containing three blanks, the choices will not be read in context because it
has been determined that replaying the question for all possible combinations of answer
choices is not a useful way to present these questions.
Example:
This question has two blanks.
Complete the following sentence.
BLANK is the capital of BLANK.
Now listen to the text with the three options inserted in place of each blank.
(A. Paris, B. Rome, C. Cairo) is the capital of (D. Canada, E. France, F. China).
GRE_Practice_Test_3_Quant.docPage 6 of 55

Indicate your two answer choices and skip hearing the answer choices in context or go on
to hear them in context before indicating your answer choices. Fill all blanks in the way
that best completes the text.
Begin skippable content.
Answer Choices in Context:
A, D. Paris, Canada. Paris is the capital of Canada.
A, E. Paris, France. Paris is the capital of France.
A, F. Paris, China. Paris is the capital of China.
B, D. Rome, Canada. Rome is the capital of Canada.
B, E. Rome, France. Rome is the capital of France.
B, F. Rome, China. Rome is the capital of China.
C, D. Cairo, Canada. Cairo is the capital of Canada.
C, E. Cairo, France. Cairo is the capital of France.
C, F. Cairo, China. Cairo is the capital of China.
End skippable content.
Indicate your two answer choices. Fill all blanks in the way that best completes the text.
In this example, choice A, Paris (from the group A, B, C), and E, France (from the group
D, E, F), should be indicated as the answer.
GRE_Practice_Test_3_Quant.docPage 7 of 55

Numeric Entry Questions
These questions require a number to be entered by marking entries in a grid according to
the following instructions.
1. Your answer may be an integer, a decimal, or a fraction, and it may be
negative.
2. Equivalent forms of the correct answer, such as 2.5 and 2.50, are all correct.
Although fractions do not need to be reduced to lowest terms, they may need to
be reduced to fit in the grid.
3. Enter the exact answer unless the question asks you to round your answer.
4. If a question asks for a fraction, the grid will have a built-in division slash.
Otherwise, the grid will have a decimal point.
The instructions for marking the entries will depend on whether a regular print or a large
print test is being used to record your answers. If your answers are being entered into a
regular print edition of the test, the following instructions apply:
5. Start your answer in any column, space permitting. Fill in no more than one
entry in any column of the grid. Columns not needed should be left blank.
6. Write your answer in the boxes at the top of the grid and fill in the
corresponding circles. You will receive credit only if your grid entries are
clearly marked, regardless of the number written in the boxes at the top.
If your answers are being entered into a large print edition of the test, instead of filling in
circles on the grid in steps 5 and 6, you will be asked to circle those entries.
Section 5 follows. In an actual test, testing time will resume when you begin Section 5.
GRE_Practice_Test_3_Quant.docPage 8 of 55

The Graduate Record Examinations®
Practice General Test #3
Section 5 - Quantitative Reasoning.
25 questions.
Directions:
For each question, indicate the best answer, using the directions given.
Notes: All numbers used are real numbers.
All figures are assumed to lie in a plane unless otherwise indicated.
Geometric figures, such as lines, circles, triangles, and quadrilaterals, are not necessarily
drawn to scale. That is, you should not assume that quantities such as lengths and angle
measures are as they appear in a figure. You should assume, however, that lines shown as
straight are actually straight, points on a line are in the order shown, and more generally,
all geometric objects are in the relative positions shown. For questions with geometric
figures, you should base your answers on geometric reasoning, not on estimating or
comparing quantities from how they are drawn in the geometric figure.
Coordinate systems, such as x y planes and number lines, are drawn to scale; therefore,
you can read, estimate, or compare quantities in such figures from how they are drawn in
the coordinate system.
Graphical data presentations, such as bar graphs, circle graphs, and line graphs, are
drawn to scale; therefore, you can read, estimate, or compare data values from how they
are drawn in the graphical data presentation.
For each of Questions 1 through 9, compare Quantity A and Quantity B, using the
additional information given, if any. Select one of the following four answer choices.
GRE_Practice_Test_3_Quant.docPage 9 of 55
A. Quantity A is greater.
B. Quantity B is greater.
C. The two quantities are equal.
D. The relationship cannot be determined from the information given.
A symbol that appears more than once in a question has the same meaning throughout the
question.
Example 1:
Quantity A: 2 times 6
Quantity B: 2 + 6
Solution: Quantity A is equal to 12 and Quantity B is equal to 8, so the correct answer
for Example 1 is answer choice A, Quantity A is greater.
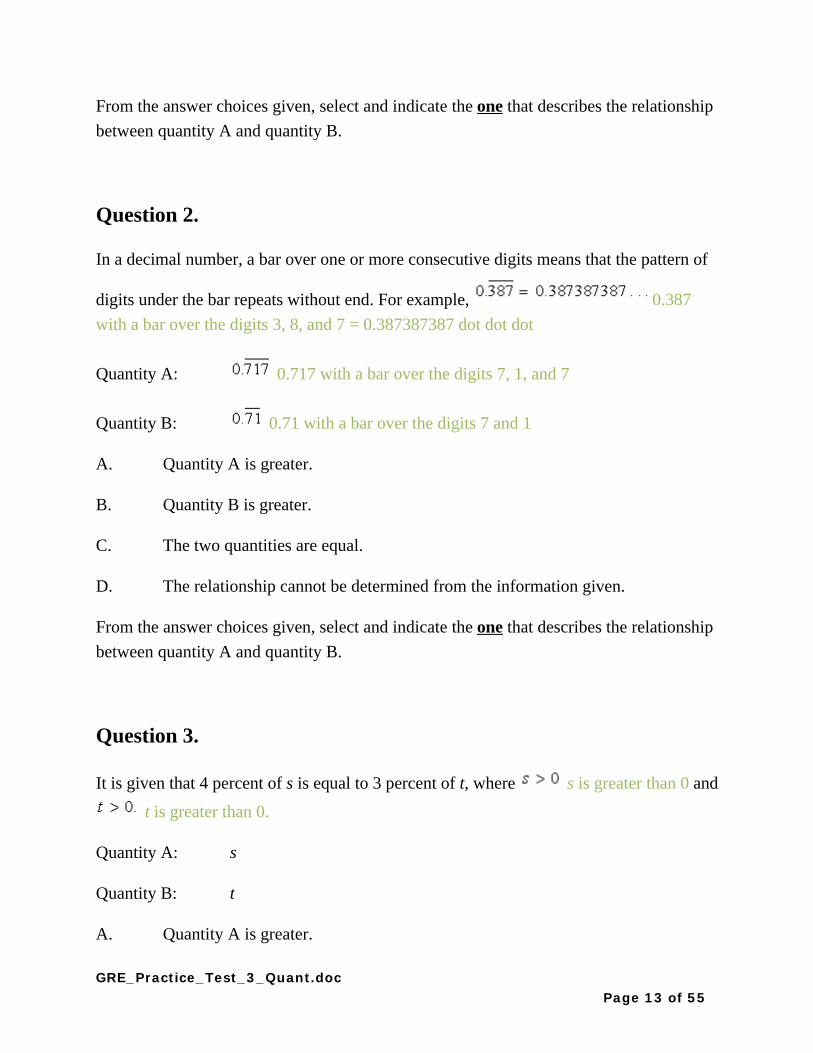
Example 2:
Refer to the figure.
Figure for Example 2
GRE_Practice_Test_3_Quant.docPage 10 of 55

Begin skippable part of figure description.
The figure for example 2 shows triangle PQR where P is the leftmost vertex of the
horizontal base PR and vertex Q is above PR. Point S lies on horizontal base PR and
appears to be the midpoint of PR. Line segment QS is drawn from vertex Q to point S.
The lengths of PS and SR appear to be equal.
End skippable part of figure description.
Quantity A: The length of PS
Quantity B: The length of SR
Solution: The correct answer for Example 2 is answer choice D. The relationship
between the lengths of PS and SR cannot be determined from the information given since
equal measures cannot be assumed, even though the lengths of PS and SR appear to be
equal in the figure.
GRE_Practice_Test_3_Quant.docPage 11 of 55

Question 1.
Refer to the figure.
Figure for Question 1
The figure shows two parallel horizontal lines, k and m, where line k is above line m. The
figure also shows a triangle whose upper vertex is on line k and whose bottom side is on
line m.
Begin skippable part of figure description.
In the triangle, the lower left angle is labeled z degrees, the lower right angle is labeled w
degrees, and the upper angle is not labeled. The angle below line k, adjacent and to the
left of the upper angle of the triangle is labeled x degrees. The angle below line k,
adjacent and to the right of the upper angle of the triangle is labeled y degrees.
End skippable part of figure description.
It is given that in the figure for question 1, line k is parallel to line m.
Quantity A: x + y
Quantity B: w + z
A. Quantity A is greater.
B. Quantity B is greater.
C. The two quantities are equal.
D. The relationship cannot be determined from the information given.
GRE_Practice_Test_3_Quant.docPage 12 of 55
From the answer choices given, select and indicate the one that describes the relationship
between quantity A and quantity B.
Question 2.
In a decimal number, a bar over one or more consecutive digits means that the pattern of
digits under the bar repeats without end. For example, 0.387
with a bar over the digits 3, 8, and 7 = 0.387387387 dot dot dot
Quantity A: 0.717 with a bar over the digits 7, 1, and 7
Quantity B: 0.71 with a bar over the digits 7 and 1
A. Quantity A is greater.
B. Quantity B is greater.
C. The two quantities are equal.
D. The relationship cannot be determined from the information given.
From the answer choices given, select and indicate the one that describes the relationship
between quantity A and quantity B.
Question 3.
It is given that 4 percent of s is equal to 3 percent of t, where s is greater than 0 and
t is greater than 0.
Quantity A: s
Quantity B: t
A. Quantity A is greater.
GRE_Practice_Test_3_Quant.docPage 13 of 55

B. Quantity B is greater.
C. The two quantities are equal.
D. The relationship cannot be determined from the information given.
From the answer choices given, select and indicate the one that describes the relationship
between quantity A and quantity B.
Question 4.
Refer to the figure.
Figure for Question 4
Begin skippable part of figure description.
The figure shows a large circle. In the large circle, there are two smaller circles, and a
horizontal line segment PQ, which appears to be the diameter of the large circle. The two
smaller circles are tangent to the large circle at points P and Q, respectively; and are
tangent to each other at point R, which lies on line segment PQ. Line segment PR appears
to be the diameter of one of the smaller circles, and line segment RQ appears to be the
diameter of the other smaller circle.
End skippable part of figure description.
GRE_Practice_Test_3_Quant.docPage 14 of 55

In the figure for question 4, three circles with their centers on line segment PQ are
tangent at points P, R, and Q, where point R lies on line segment PQ.
Quantity A: The circumference of the largest circle
Quantity B: The sum of the circumferences of the two smaller circles
A. Quantity A is greater.
B. Quantity B is greater.
C. The two quantities are equal.
D. The relationship cannot be determined from the information given.
From the answer choices given, select and indicate the one that describes the relationship
between quantity A and quantity B.
Question 5.
It is given that r t is less than 0, which is less than negative r.
Quantity A: t
Quantity B: 0
A. Quantity A is greater.
B. Quantity B is greater.
C. The two quantities are equal.
D. The relationship cannot be determined from the information given
From the answer choices given, select and indicate the one that describes the relationship
between quantity A and quantity B.
GRE_Practice_Test_3_Quant.docPage 15 of 55

Question 6.
It is given that x is greater than y.
Quantity A: the absolute value of, x + y
Quantity B: the absolute value of, x minus y
A. Quantity A is greater.
B. Quantity B is greater.
C. The two quantities are equal.
D. The relationship cannot be determined from the information given.
From the answer choices given, select and indicate the one that describes the relationship
between quantity A and quantity B.
Question 7.
In the x y plane, the points a comma 0 and 0 comma b are on the line
whose equation is y = one half of x, + 10.
Quantity A: a
Quantity B: b
A. Quantity A is greater.
B. Quantity B is greater.
C. The two quantities are equal.
D. The relationship cannot be determined from the information given.
GRE_Practice_Test_3_Quant.docPage 16 of 55

From the answer choices given, select and indicate the one that describes the relationship
between quantity A and quantity B.
Question 8.
Refer to the figure.
Figure for Question 8
The figure consists of two bar graphs, each of which shows a frequency distribution.
Distribution A is a frequency distribution of the data values 10, 20, 30, 40, and 50.
Distribution B is a different frequency distribution of the data values 10, 20, 30, 40,
and 50.
GRE_Practice_Test_3_Quant.docPage 17 of 55
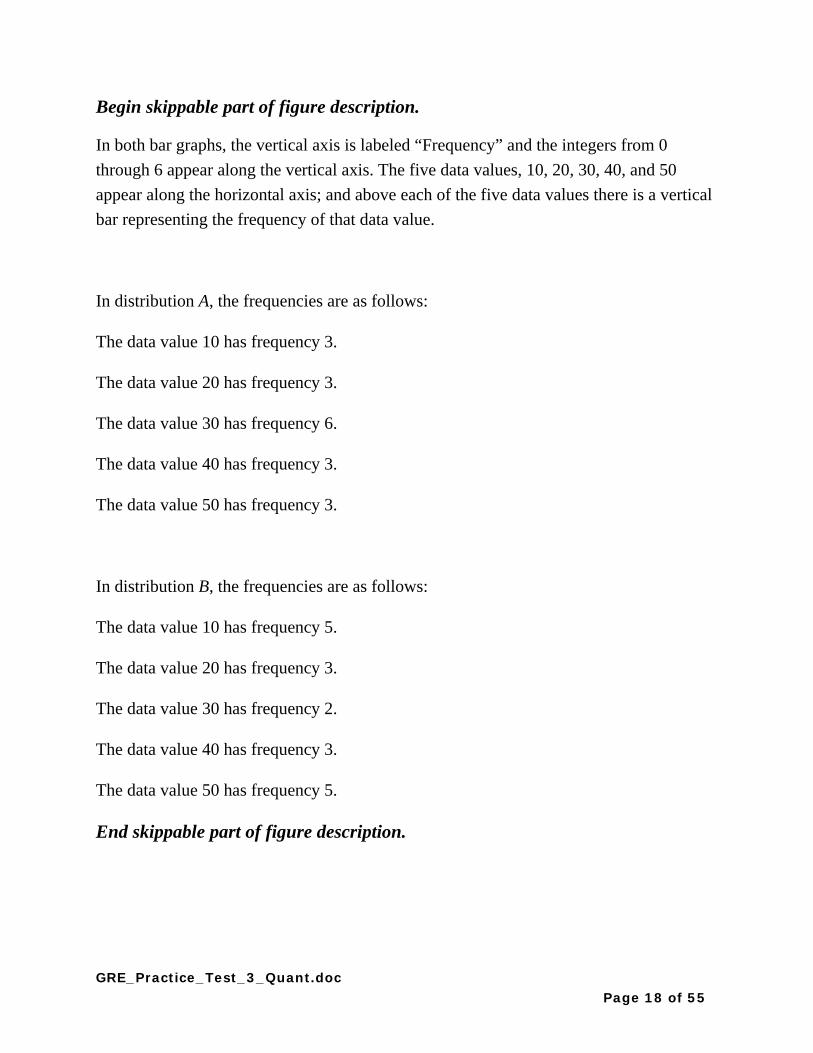
Begin skippable part of figure description.
In both bar graphs, the vertical axis is labeled “Frequency” and the integers from 0
through 6 appear along the vertical axis. The five data values, 10, 20, 30, 40, and 50
appear along the horizontal axis; and above each of the five data values there is a vertical
bar representing the frequency of that data value.
In distribution A, the frequencies are as follows:
The data value 10 has frequency 3.
The data value 20 has frequency 3.
The data value 30 has frequency 6.
The data value 40 has frequency 3.
The data value 50 has frequency 3.
In distribution B, the frequencies are as follows:
The data value 10 has frequency 5.
The data value 20 has frequency 3.
The data value 30 has frequency 2.
The data value 40 has frequency 3.
The data value 50 has frequency 5.
End skippable part of figure description.
GRE_Practice_Test_3_Quant.docPage 18 of 55

The frequency distributions shown in the figure for question 8 represent two groups of
data. Each of the data values is a multiple of 10.
Quantity A: The standard deviation of distribution A
Quantity B: The standard deviation of distribution B
A. Quantity A is greater.
B. Quantity B is greater.
C. The two quantities are equal.
D. The relationship cannot be determined from the information given.
From the answer choices given, select and indicate the one that describes the relationship
between quantity A and quantity B.
Question 9.
One person is to be selected at random from a group of 25 people. The probability that
the selected person will be a male is 0.44, and the probability that the selected person will
be a male who was born before 1960 is 0.28.
Quantity A: The number of males in the group who were born in 1960 or later
Quantity B: 4
A. Quantity A is greater.
B. Quantity B is greater.
C. The two quantities are equal.
D. The relationship cannot be determined from the information given.
From the answer choices given, select and indicate the one that describes the relationship
between quantity A and quantity B.
GRE_Practice_Test_3_Quant.docPage 19 of 55

Questions 10 through 25 have several different answer formats,
including both selecting answers from a list of answer choices
and numeric entry. With each question, answer format
instructions will be given.
Numeric Entry Questions
These questions require a number to be entered by marking entries in a grid according to
the following instructions.
1. Your answer may be an integer, a decimal, or a fraction, and it may be
negative.
2. Equivalent forms of the correct answer, such as 2.5 and 2.50, are all correct.
Although fractions do not need to be reduced to lowest terms, they may need to
be reduced to fit in the grid.
3. Enter the exact answer unless the question asks you to round your answer.
4. If a question asks for a fraction, the grid will have a built-in division slash.
Otherwise, the grid will have a decimal point.
The instructions for marking the entries will depend on whether a regular print or a large
print test is being used to record your answers. If your answers are being entered into a
regular print edition of the test, the following instructions apply:
5. Start your answer in any column, space permitting. Fill in no more than one
entry in any column of the grid. Columns not needed should be left blank.
6. Write your answer in the boxes at the top of the grid and fill in the
corresponding circles. You will receive credit only if your grid entries are
clearly marked, regardless of the number written in the boxes at the top.
If your answers are being entered into a large print edition of the test, instead of filling in
circles on the grid in steps 5 and 6, you will be asked to circle those entries.
GRE_Practice_Test_3_Quant.docPage 20 of 55

Question 10.
This question does not have any answer choices; it is a numeric entry question.
To answer this question, enter a number in the answer space provided.
At Company Y, the ratio of the number of female employees to the number of male
employees is 3 to 2. If there are 150 female employees at the company, how many male
employees are there at the company?
The answer space is followed by the words “male employees”.
To answer this question, enter a number in the answer space provided. The number can
include a decimal point, and can be positive, negative, or zero. The number entered
cannot be a fraction.
Question 11.
This question has five answer choices, labeled A through E. Select the best one of the
answer choices given.
If the fraction with numerator a minus b, and denominator a + b, = 2, and
b = 1, what is the value of a ?
A. 1
B. 0
C. negative 1
D. negative 2
E. negative 3
Select and indicate the best one of the answer choices given.
GRE_Practice_Test_3_Quant.docPage 21 of 55
Question 12.
This question has five answer choices, labeled A through E. Select the best one of the
answer choices given.
The floor space in a certain market is rented for $15 per 30 square feet for one day. In the
market, Alice rented a rectangular floor space that measured 8 feet by 15 feet, and Betty
rented a rectangular floor space that measured 15 feet by 20 feet. If each woman rented
her floor space for one day, how much more did Betty pay than Alice?
A. $27
B. $36
C. $54
D. $90
E. $180
Select and indicate the best one of the answer choices given.
Question 13.
This question has five answer choices, labeled A through E. Select the best one of the
answer choices given.
A business owner obtained a $6,000 loan at a simple annual interest rate of r percent in
order to purchase a computer. After one year, the owner made a single payment of $6,840
to repay the loan, including the interest. What is the value of r ?
A. 7.0
B. 8.4
C. 12.3
GRE_Practice_Test_3_Quant.docPage 22 of 55

D. 14.0
E. 16.8
Select and indicate the best one of the answer choices given.
Question 14.
This question does not have any answer choices; it is a numeric entry question. To
answer this question, enter a fraction in the answer space provided.
List L consists of three numbers: 2, x, and y
List M consists of five numbers: 1, 2, 3, x, and y
If the average (arithmetic mean), of the 3 numbers in list L is the fraction 10 over 3,
what is the average of the 5 numbers in list M ?
To answer this question, enter a fraction in the answer space provided. The fraction can
be positive or negative. Neither the numerator nor the denominator of the fraction can
include a decimal point. The fraction does not have to be in lowest terms.
Question 15.
This question has three answer choices, labeled A through C. Select all the answer
choices that apply.
Which of the following inequalities have at least one positive solution and at least one
negative solution?
Indicate all such inequalities.
A. five thirds of x, is less than, x
GRE_Practice_Test_3_Quant.docPage 23 of 55

B. x cubed, is less than, x
C. x minus 6, is less than, x minus 7
Select and indicate all the answer choices that apply. The correct answer to a question of
this type could consist of as few as one, or as many as all three of the answer choices.
Question 16.
This question has five answer choices, labeled A through E. Select the best one of the
answer choices given.
If 5 raised to the 5x power, times 25, = 5 raised to the n power, where n
and x are integers, what is the value of n in terms of x ?
A. 5x + 1
B. 5x + 2
C. 5x + 5
D. 10x
E. 10x + 2
Select and indicate the best one of the answer choices given.
GRE_Practice_Test_3_Quant.docPage 24 of 55

Questions 17 through 20 are based on the following data.
Data for Questions 17 through 20
GRE_Practice_Test_3_Quant.docPage 25 of 55
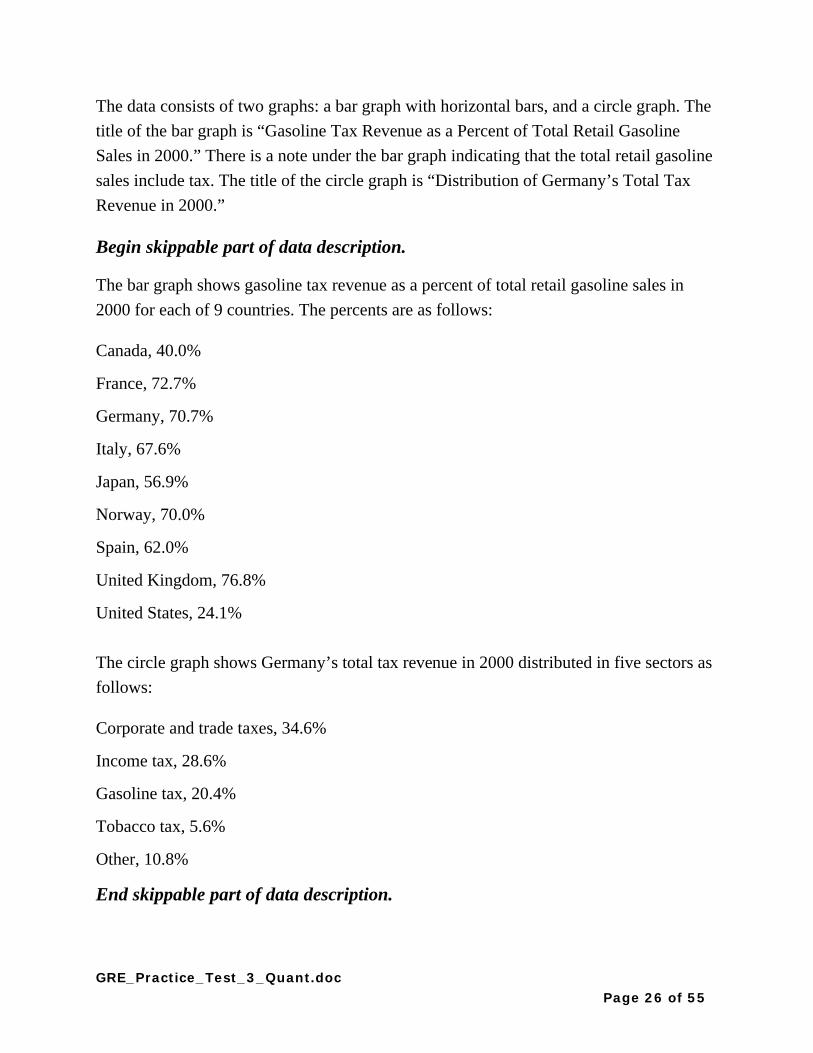
The data consists of two graphs: a bar graph with horizontal bars, and a circle graph. The
title of the bar graph is “Gasoline Tax Revenue as a Percent of Total Retail Gasoline
Sales in 2000.” There is a note under the bar graph indicating that the total retail gasoline
sales include tax. The title of the circle graph is “Distribution of Germany’s Total Tax
Revenue in 2000.”
Begin skippable part of data description.
The bar graph shows gasoline tax revenue as a percent of total retail gasoline sales in
2000 for each of 9 countries. The percents are as follows:
Canada, 40.0%
France, 72.7%
Germany, 70.7%
Italy, 67.6%
Japan, 56.9%
Norway, 70.0%
Spain, 62.0%
United Kingdom, 76.8%
United States, 24.1%
The circle graph shows Germany’s total tax revenue in 2000 distributed in five sectors as
follows:
Corporate and trade taxes, 34.6%
Income tax, 28.6%
Gasoline tax, 20.4%
Tobacco tax, 5.6%
Other, 10.8%
End skippable part of data description.
GRE_Practice_Test_3_Quant.docPage 26 of 55
Question 17.
This question has five answer choices, labeled A through E. Select the best one of the
answer choices given.
What is the median of the percent values representing gasoline tax revenue as a percent
of total retail gasoline sales for the nine countries listed in the bar graph?
A. 67.6%
B. 68.0%
C. 70.0%
D. 70.7%
E. 72.7%
Select and indicate the best one of the answer choices given.
Question 18.
This question has three answer choices, labeled A through C. Select all the answer
choices that apply.
Based on the information given, which of the following statements must be true?
Indicate all such statements.
A. In 2000 France’s gasoline tax revenue as a percent of its total tax revenue was
greater than 20.4 percent.
B. In 2000 the price per gallon of gasoline was greater in Norway than it was in
Spain.
C. In 2000 Germany’s gasoline tax revenue was more than 3 times its tobacco tax
revenue.
Select and indicate all the answer choices that apply. The correct answer to a question of
this type could consist of as few as one, or as many as all three of the answer choices.
GRE_Practice_Test_3_Quant.docPage 27 of 55
Question 19.
This question has five answer choices, labeled A through E. Select the best one of the
answer choices given.
In 2000 the amount of Germany’s gasoline tax revenue was approximately what percent
less than the amount of its income tax revenue?
A. 10%
B. 20%
C. 30%
D. 40%
E. 50%
Select and indicate the best one of the answer choices given.
Question 20.
This question has five answer choices, labeled A through E. Select the best one of the
answer choices given.
If Germany’s total tax revenue in 2000 was approximately $170 billion, approximately
what was the amount of the total retail gasoline sales in Germany that year?
A. $10 billion
B. $20 billion
C. $30 billion
D. $40 billion
E. $50 billion
Select and indicate the best one of the answer choices given.
GRE_Practice_Test_3_Quant.docPage 28 of 55

Question 21.
This question has five answer choices, labeled A through E. Select the best one of the
answer choices given.
Of the 180 judges appointed by a certain President, 30 percent were women and 25
percent were from minority groups. If one ninth of the women appointed were from
minority groups, how many of the judges appointed were neither women nor from
minority groups?
A. 75
B. 81
C. 87
D. 93
E. 99
Select and indicate the best one of the answer choices given.
Question 22.
This question has five answer choices, labeled A through E. Select the best one of the
answer choices given.
If an integer is divisible by both 8 and 15, then the integer also must be divisible by
which of the following?
GRE_Practice_Test_3_Quant.docPage 29 of 55

A. 16
B. 24
C. 32
D. 36
E. 45
Select and indicate the best one of the answer choices given.
Question 23.
This question has five answer choices, labeled A through E. Select the best one of the
answer choices given.
A certain experiment has three possible outcomes. The outcomes are mutually exclusive
and have probabilities p, one half of p, and one quarter of p, respectively. What is
the value of p ?
A. one seventh
B. 2 sevenths
C. 3 sevenths
D. 4 sevenths
E. 5 sevenths
GRE_Practice_Test_3_Quant.docPage 30 of 55

Select and indicate the best one of the answer choices given.
Question 24.
This question has six answer choices, labeled A through F. Select all the answer choices
that apply.
In triangle ABC, the measure of angle B is 90°, the length of side AB is 4, and the length
of side BC is x. If the length of hypotenuse AC is between 4 and 8, which of the following
could be the value of x ?
Indicate all such values.
A. 1
B. 2
C. 3
D. 4
E. 5
F. 6
Select and indicate all the answer choices that apply. The correct answer to a question of
this type could consist of as few as one, or as many as all six of the answer choices.
Question 25.
This question has five answer choices, labeled A through E. Select the best one of the
answer choices given.
GRE_Practice_Test_3_Quant.docPage 31 of 55
Each month, a certain manufacturing company’s total expenses are equal to a fixed
monthly expense plus a variable expense that is directly proportional to the number of
units produced by the company during that month. If the company’s total expenses for a
month in which it produces 20,000 units are $570,000, and the total expenses for a month
in which it produces 25,000 units are $705,000, what is the company’s fixed monthly
expense?
A. $27,000
B. $30,000
C. $67,500
D. $109,800
E. $135,000
Select and indicate the best one of the answer choices given.
This is the end of Section 5 of The Graduate Record Examinations® Practice General
Test #3. In an actual test, once you complete a section you may not return to it. The
answer key for this section is in a separate document, titled "G R E Practice Test #3
Answers.doc".
GRE_Practice_Test_3_Quant.docPage 32 of 55

Section 6 - Quantitative Reasoning.
25 questions.
Directions:
For each question, indicate the best answer, using the directions given.
Notes: All numbers used are real numbers.
All figures are assumed to lie in a plane unless otherwise indicated.
Geometric figures, such as lines, circles, triangles, and quadrilaterals, are not necessarily
drawn to scale. That is, you should not assume that quantities such as lengths and angle
measures are as they appear in a figure. You should assume, however, that lines shown as
straight are actually straight, points on a line are in the order shown, and more generally,
all geometric objects are in the relative positions shown. For questions with geometric
figures, you should base your answers on geometric reasoning, not on estimating or
comparing quantities from how they are drawn in the geometric figure.
Coordinate systems, such as x y planes and number lines, are drawn to scale; therefore,
you can read, estimate, or compare quantities in such figures from how they are drawn in
the coordinate system.
Graphical data presentations, such as bar graphs, circle graphs, and line graphs, are
drawn to scale; therefore, you can read, estimate, or compare data values from how they
are drawn in the graphical data presentation.
For each of Questions 1 through 9, compare Quantity A and Quantity B, using the
additional information given, if any. Select one of the following four answer choices.
A. Quantity A is greater.
B. Quantity B is greater.
C. The two quantities are equal.
D. The relationship cannot be determined from the information given.
GRE_Practice_Test_3_Quant.docPage 33 of 55

A symbol that appears more than once in a question has the same meaning throughout the
question.
Example 1:
Quantity A: 2 times 6
Quantity B: 2 + 6
Solution: Quantity A is equal to 12 and Quantity B is equal to 8, so the correct answer
for Example 1 is answer choice A, Quantity A is greater.
Example 2:
Refer to the figure.
Figure for Example 2
Begin skippable part of figure description.
The figure for example 2 shows triangle PQR, where P is the leftmost vertex of the
horizontal base PR and vertex Q is above PR. Point S lies on horizontal base PR and
appears to be the midpoint of PR. Line segment QS is drawn from vertex Q to point S.
The lengths of PS and SR appear to be equal.
End skippable part of figure description.
GRE_Practice_Test_3_Quant.docPage 34 of 55

Quantity A: The length of PS
Quantity B: The length of SR
Solution: The correct answer for Example 2 is answer choice D. The relationship
between the lengths of PS and SR cannot be determined from the information given since
equal measures cannot be assumed, even though the lengths of PS and SR appear to be
equal in the figure.
GRE_Practice_Test_3_Quant.docPage 35 of 55
Question 1.
The length of each side of equilateral triangle T is 6 times the length of each side of
equilateral triangle X.
Quantity A: The ratio of the length of one side of T to the length of another side
of T
Quantity B: The ratio of the length of one side of X to the length of another side
of X
A. Quantity A is greater.
B. Quantity B is greater.
C. The two quantities are equal.
D. The relationship cannot be determined from the information given.
From the answer choices given, select and indicate the one that describes the relationship
between quantity A and quantity B.
Question 2.
Of 30 theater tickets sold, 20 tickets were sold at prices between $10 and $30 each and
10 tickets were sold at prices between $40 and $60 each.
Quantity A: The average, that is, arithmetic mean of the prices of the 30 tickets
Quantity B: $50
A. Quantity A is greater.
B. Quantity B is greater.
C. The two quantities are equal.
GRE_Practice_Test_3_Quant.docPage 36 of 55
D. The relationship cannot be determined from the information given.
From the answer choices given, select and indicate the one that describes the relationship
between quantity A and quantity B.
Question 3.
It is given that x is greater than 1.
Quantity A: the fraction with numerator x, and denominator, x + 1
Quantity B: the fraction with numerator negative x, and denominator,
1 minus x
A. Quantity A is greater.
B. Quantity B is greater.
C. The two quantities are equal.
D. The relationship cannot be determined from the information given.
From the answer choices given, select and indicate the one that describes the relationship
between quantity A and quantity B.
Question 4.
In the x y plane, the point 1 comma 2 is on line j, and the point 2 comma 1 is
on line k. Each of the lines has a positive slope.
Quantity A: The slope of line j
Quantity B: The slope of line k
GRE_Practice_Test_3_Quant.docPage 37 of 55

A. Quantity A is greater.
B. Quantity B is greater.
C. The two quantities are equal.
D. The relationship cannot be determined from the information given.
From the answer choices given, select and indicate the one that describes the relationship
between quantity A and quantity B.
Question 5.
T is a list of 100 different numbers that are greater than 0 and less than 50. The number x
is greater than 60 percent of the numbers in T, and the number y is greater than 40 percent
of the numbers in T.
Quantity A: x minus y
Quantity B: 20
A. Quantity A is greater.
B. Quantity B is greater.
C. The two quantities are equal.
D. The relationship cannot be determined from the information given.
From the answer choices given, select and indicate the one that describes the relationship
between quantity A and quantity B.
GRE_Practice_Test_3_Quant.docPage 38 of 55

Question 6.
It is given that n is a positive integer.
Quantity A: The remainder when n is divided by 5
Quantity B: The remainder when n + 10 is divided by 5
A. Quantity A is greater.
B. Quantity B is greater.
C. The two quantities are equal.
D. The relationship cannot be determined from the information given.
From the answer choices given, select and indicate the one that describes the relationship
between quantity A and quantity B.
Question 7.
A right circular cylinder with radius 2 inches has volume 15 cubic inches.
Quantity A: The height of the cylinder
Quantity B: 2 inches
A. Quantity A is greater.
B. Quantity B is greater.
C. The two quantities are equal.
D. The relationship cannot be determined from the information given
From the answer choices given, select and indicate the one that describes the relationship
between quantity A and quantity B.
GRE_Practice_Test_3_Quant.docPage 39 of 55

Question 8.
It is given that k is an integer for which the fraction with numerator 1, and
denominator 2 raised to the 1 minus k power, is less than 1 eighth
Quantity A: k
Quantity B: negative 2
A. Quantity A is greater.
B. Quantity B is greater.
C. The two quantities are equal.
D. The relationship cannot be determined from the information given.
From the answer choices given, select and indicate the one that describes the relationship
between quantity A and quantity B.
Question 9.
It is given that n is an integer greater than 0.
Quantity A: The number of different prime factors of 9n
Quantity B: The number of different prime factors of 8n
A. Quantity A is greater.
B. Quantity B is greater.
C. The two quantities are equal.
D. The relationship cannot be determined from the information given.
GRE_Practice_Test_3_Quant.docPage 40 of 55

From the answer choices given, select and indicate the one that describes the relationship
between quantity A and quantity B.
GRE_Practice_Test_3_Quant.docPage 41 of 55

Questions 10 through 25 have several different answer formats,
including both selecting answers from a list of answer choices
and numeric entry. With each question, answer format
instructions will be given.
Numeric Entry Questions
These questions require a number to be entered by marking entries in a grid according to
the following instructions.
1. Your answer may be an integer, a decimal, or a fraction, and it may be
negative.
2. Equivalent forms of the correct answer, such as 2.5 and 2.50, are all correct.
Although fractions do not need to be reduced to lowest terms, they may need to
be reduced to fit in the grid.
3. Enter the exact answer unless the question asks you to round your answer.
4. If a question asks for a fraction, the grid will have a built-in division slash.
Otherwise, the grid will have a decimal point.
The instructions for marking the entries will depend on whether a regular print or a large
print test is being used to record your answers. If your answers are being entered into a
regular print edition of the test, the following instructions apply:
5. Start your answer in any column, space permitting. Fill in no more than one
entry in any column of the grid. Columns not needed should be left blank.
6. Write your answer in the boxes at the top of the grid and fill in the
corresponding circles. You will receive credit only if your grid entries are
clearly marked, regardless of the number written in the boxes at the top.
If your answers are being entered into a large print edition of the test, instead of filling in
circles on the grid in steps 5 and 6, you will be asked to circle those entries.
GRE_Practice_Test_3_Quant.docPage 42 of 55
Question 10.
This question has five answer choices, labeled A through E. Select the best one of the
answer choices given.
Working at their respective constant rates, machine 1 makes 240 copies in 8 minutes and
machine 2 makes 240 copies in 5 minutes. At these rates, how many more copies does
machine 2 make in 4 minutes than machine 1 makes in 6 minutes?
A. 10
B. 12
C. 15
D. 20
E. 24
Select and indicate the best one of the answer choices given.
Question 11.
This question does not have any answer choices; it is a numeric entry question. To
answer this question, enter a number in the answer space provided.
Among the people attending a convention in Europe, 32 percent traveled from Asia and
45 percent of those who traveled from Asia are women. What percent of the people at the
convention are women who traveled from Asia?
The answer space is followed by a percent sign.
To answer this question, enter a number in the answer space provided. The number can
include a decimal point, and can be positive, negative, or zero. The number entered
cannot be a fraction.
GRE_Practice_Test_3_Quant.docPage 43 of 55
Question 12.
This question has five answer choices, labeled A through E. Select the best one of the
answer choices given.
In the x y plane, points R and S have coordinates negative 2 comma 1 and
4 comma negative 7, respectively. If point P is the midpoint of line segment RS,
what are the coordinates of point P ?
A. negative 1 comma negative 3
B. 1 comma negative 4
C. 1 comma negative 3
D. 2 comma negative 4
E. 3 comma negative 4
Select and indicate the best one of the answer choices given.
Question 13.
This question has five answer choices, labeled A through E. Select the best one of the
answer choices given.
Steve’s property tax is $140 less than Patricia’s property tax. If Steve’s property tax is
$1,960, then Steve’s property tax is what percent less than Patricia’s property tax, to the
nearest 0.1 percent?
A. 6.7%
B. 7.1%
C. 7.5%
GRE_Practice_Test_3_Quant.docPage 44 of 55

D. 7.9%
E. 8.3%
Select and indicate the best one of the answer choices given.
Question 14.
This question has five answer choices, labeled A through E. Select the best one of the
answer choices given.
A base of a triangle has length b, the altitude corresponding to the base has length h, and
b = 2h. Which of the following expresses the area of the triangle, in terms of h ?
A. one half of h squared
B. three fourths of h squared
C. h squared
D. 3 halves, h squared
E. 2, h squared
Select and indicate the best one of the answer choices given.
Question 15.
This question has five answer choices, labeled A through E. Select the best one of the
answer choices given.
GRE_Practice_Test_3_Quant.docPage 45 of 55

How many different two digit positive integers are there in which the tens digit is greater
than 6 and the units digit is less than 4 ?
A. 7
B. 9
C. 10
D. 12
E. 24
Select and indicate the best one of the answer choices given.
Question 16.
This question has four answer choices, labeled A through D. Select all the answer choices
that apply.
Chris entered a number in his calculator and erroneously multiplied the number by 2,073
instead of 2.073, getting an incorrect product. Which of the following is a single
operation that Chris could perform on his calculator to correct the error?
Indicate all such operations.
A. Multiply the incorrect product by 0.001
B. Divide the incorrect product by 0.001
C. Multiply the incorrect product by 1,000
D. Divide the incorrect product by 1,000
Select and indicate all the answer choices that apply. The correct answer to a question of
this type could consist of as few as one, or as many as all four of the answer choices.
GRE_Practice_Test_3_Quant.docPage 46 of 55

Questions 17 through 20 are based on the following data.
Data for Questions 17 through 20
The data is shown in a hybrid table/horizontal bar graph. The title of the data is
“Distribution of the 50 States of the United States by Population, 2000.”
Begin skippable part of data description.
The title of the first column is “Population Category.” Eight population categories, from
Category A to Category H, are listed in this column. The title of the second column is
“Population (millions).” In this column, a range of population for each of the eight
population categories is given. The title of the third column is “Number of States.” This
column is the horizontal bar graph part of the data. In this column, there are vertical
GRE_Practice_Test_3_Quant.docPage 47 of 55
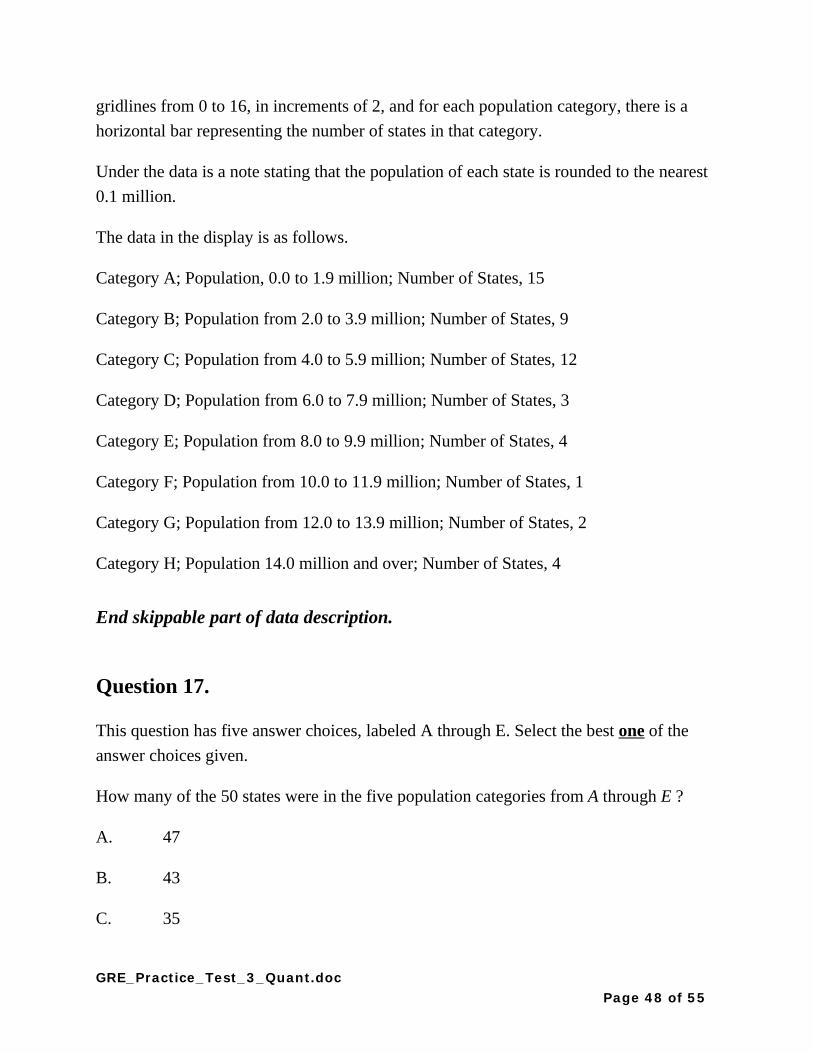
gridlines from 0 to 16, in increments of 2, and for each population category, there is a
horizontal bar representing the number of states in that category.
Under the data is a note stating that the population of each state is rounded to the nearest
0.1 million.
The data in the display is as follows.
Category A; Population, 0.0 to 1.9 million; Number of States, 15
Category B; Population from 2.0 to 3.9 million; Number of States, 9
Category C; Population from 4.0 to 5.9 million; Number of States, 12
Category D; Population from 6.0 to 7.9 million; Number of States, 3
Category E; Population from 8.0 to 9.9 million; Number of States, 4
Category F; Population from 10.0 to 11.9 million; Number of States, 1
Category G; Population from 12.0 to 13.9 million; Number of States, 2
Category H; Population 14.0 million and over; Number of States, 4
End skippable part of data description.
Question 17.
This question has five answer choices, labeled A through E. Select the best one of the
answer choices given.
How many of the 50 states were in the five population categories from A through E ?
A. 47
B. 43
C. 35
GRE_Practice_Test_3_Quant.docPage 48 of 55

D. 20
E. 19
Select and indicate the best one of the answer choices given.
Question 18.
This question has five answer choices, labeled A through E. Select the best one of the
answer choices given.
In 2000 the population of West Virginia was 1.8 million. If the ratio of the population of
Georgia to that of West Virginia was 9 to 2, in which population category was Georgia?
A. Category B
B. Category C
C. Category D
D. Category E
E. Category F
Select and indicate the best one of the answer choices given.
Question 19.
This question has five answer choices, labeled A through E. Select the best one of the
answer choices given.
The number of states in the two population categories C and D was approximately what
percent greater than the number in the four population categories from E through H ?
GRE_Practice_Test_3_Quant.docPage 49 of 55

A. 36%
B. 33%
C. 30%
D. 27%
E. 20%
Select and indicate the best one of the answer choices given.
Question 20.
This question has five answer choices, labeled A through E. Select the best one of the
answer choices given.
The median of the 50 state populations was in which population category?
A. Category A
B. Category B
C. Category C
D. Category D
E. Category E
Select and indicate the best one of the answer choices given.
GRE_Practice_Test_3_Quant.docPage 50 of 55

Question 21.
This question does not have any answer choices; it is a numeric entry question. To
answer this question, enter a number in the answer space provided.
If the cube root of x, = 3 and x =the positive square root of y, what is
the value of y ?
The answer space is preceded by the label “y =”.
To answer this question, enter a number in the answer space provided. The number can
include a decimal point, and can be positive, negative, or zero. The number entered
cannot be a fraction.
Question 22.
Figure for Question 22
The figure consists of a graph of the standard normal distribution with mean 0 and
standard deviation 1.
Begin skippable part of figure description.
The graph shows a bell shaped curve drawn above a horizontal axis. On the horizontal
axis, from left to right, are the 5 equally spaced numbers; negative 2, negative 1,
0, 1, and 2. Vertical line segments above each of these numbers divide the normal
distribution into 6 regions.
GRE_Practice_Test_3_Quant.docPage 51 of 55

The approximate percents of the distribution in each of the six regions are given as
follows.
To the left of negative 2: 2%
between negative 2 and negative one: 14%
between negative one and 0: 34%
between 0 and 1: 34%
between 1 and 2: 14%
and to the right of 2: 2%.
End skippable part of figure description
The figure shows the standard normal distribution, with mean 0 and standard deviation 1,
including approximate percents of the distribution corresponding to six regions shown.
Ian rode the bus to work last year. His travel times to work were approximately normally
distributed, with a mean of 35 minutes and a standard deviation of 5 minutes. According
to the figure shown, approximately what percent of Ian’s travel times to work last year
were less than 40 minutes?
A. 14%
B. 34%
C. 60%
D. 68%
E. 84%
GRE_Practice_Test_3_Quant.docPage 52 of 55
Question 23.
This question has five answer choices, labeled A through E. Select the best one of the
answer choices given.
It is given that for all integers x, the function f is defined as follows.
f of x = x minus 1, if x is even. And f of x = x + 1, if x is odd.
If a and b are integers and f of a, +, f of b = a + b, which of the
following statements must be true?
A. a = b
B. a = negative b
C. a + b is odd.
D. Both a and b are even.
E. Both a and b are odd.
Select and indicate the best one of the answer choices given.
Question 24.
This question has five answer choices, labeled A through E. Select the best one of the
answer choices given.
If y raised to the power negative 2, +, 2, y raised to the power
negative 1, minus 15, =, 0, which of the following could be the value of y ?
GRE_Practice_Test_3_Quant.docPage 53 of 55

A. 3
B. one fifth
C. negative one fifth
D. negative one third
E. negative 5
Select and indicate the best one of the answer choices given.
Question 25.
This question has six answer choices, labeled A through F. Select all the answer choices
that apply.
The six numbers 3.7, 4.1, a, 8.5, 9.2, and 2a, are listed in increasing order. Which of the
following values could be the range of the six numbers?
Indicate all such values.
A. 4.0
B. 5.2
C. 7.3
D. 11.6
E. 12.9
F. 14.1
Select and indicate all the answer choices that apply. The correct answer to a question of
this type could consist of as few as one, or as many as all six of the answer choices.
GRE_Practice_Test_3_Quant.docPage 54 of 55

This is the end of Section 6 of The Graduate Record Examinations® Practice General
Test #3. In an actual test, once you complete a section you may not return to it. The
answer key for this section is in a separate document, titled "GRE Practice Test #3
Answers.doc".
This is the end of The Graduate Record Examinations® Practice General Test #3.
GRE_Practice_Test_3_Quant.docPage 55 of 55