powerpoint presentationsphreit.listedcompany.com/misc/fs/ir_slides_fy16_1.pdf · the past...
TRANSCRIPT
FY2016
Financial Results 6 October 2016
Disclaimer
This presentation is for information only and does not constitute an invitation or offer to a c q u i re , p u rc ha s e o r s ubs c r i b e f o r u n i t s i n SP H R EI T ( “ U n i t s ” ) . Th e va l u e of Units and the income derived from them may fall as well as rise. Units are not obligations of, deposits in, or guaranteed by, the Manager or any of its affiliates. An investment in Units is subject to investment risks, including the possible loss of the principal amount invested. The past performance of SPH REIT is not necessarily indicative of its future performance. This presentation may also contain forward-looking statements that involve risks and uncertainties. Actual future performance, outcomes and results may differ materially from those expressed in forward-looking statements as a result of a number of r isks, uncertainties and assumptions. Representative examples of these factors include (without limitation) general industry and economic conditions, interest rate trends, cost of capital and capital availability, competition from similar developments, shifts in expected levels of property rental income, changes in operating expenses, including employee wages, benefits and training, property expenses and governmental and public policy changes and the continued availability of financing in the amounts and the terms necessary to support future business. You are cautioned not to place undue reliance on these forward-looking statements, which are based on current v iew of management on future events .
This presentation shall be read in conjunction with SPH REIT‟s financial results for the fourth quarter and financial year ended 31 August 2016 in the SGXNET announcement.
1
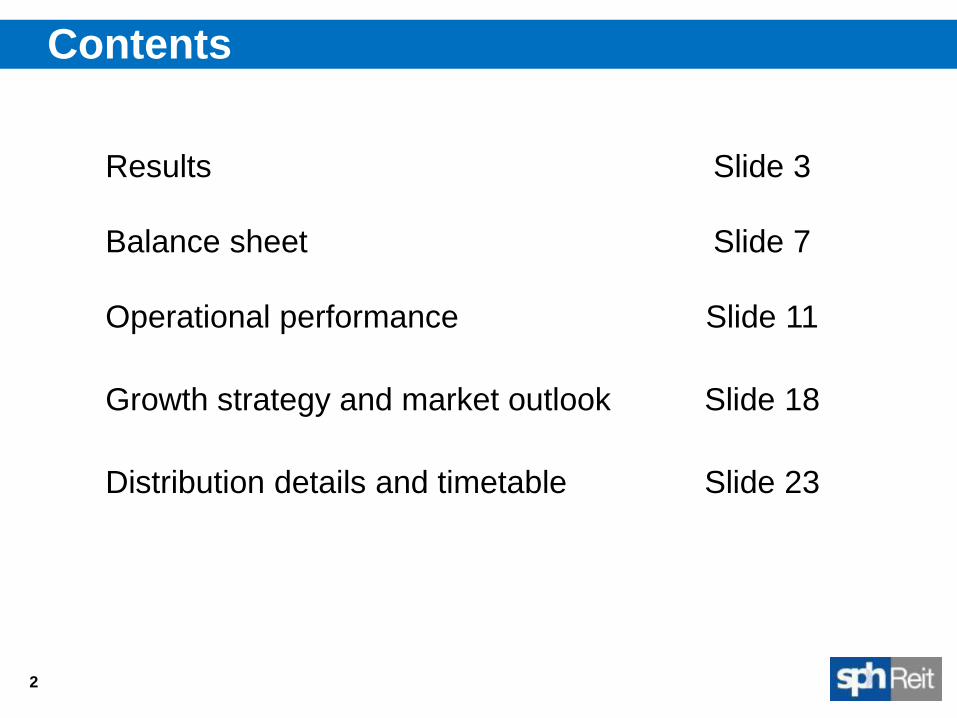
Contents
Results Slide 3
Balance sheet Slide 7
Operational performance Slide 11
Growth strategy and market outlook Slide 18
Distribution details and timetable Slide 23
2

Key highlights
3
Key Highlights
Net property income for FY16 up 3.4% y-o-y
FY16 DPU was 5.50 cents, an increase of 0.5% against last
year
4Q FY16 DPU was 1.41 cents
Distribution yield was 5.73% (based on closing price of
$0.960 per unit on 31 August 2016)
Continual tenancy revitalisation and asset enhancement to
create value
Strong balance sheet, with gearing level at 25.7% and 85.9%
of debt on fixed rate basis
FY16
S$’000
FY15
S$’000
Change
%
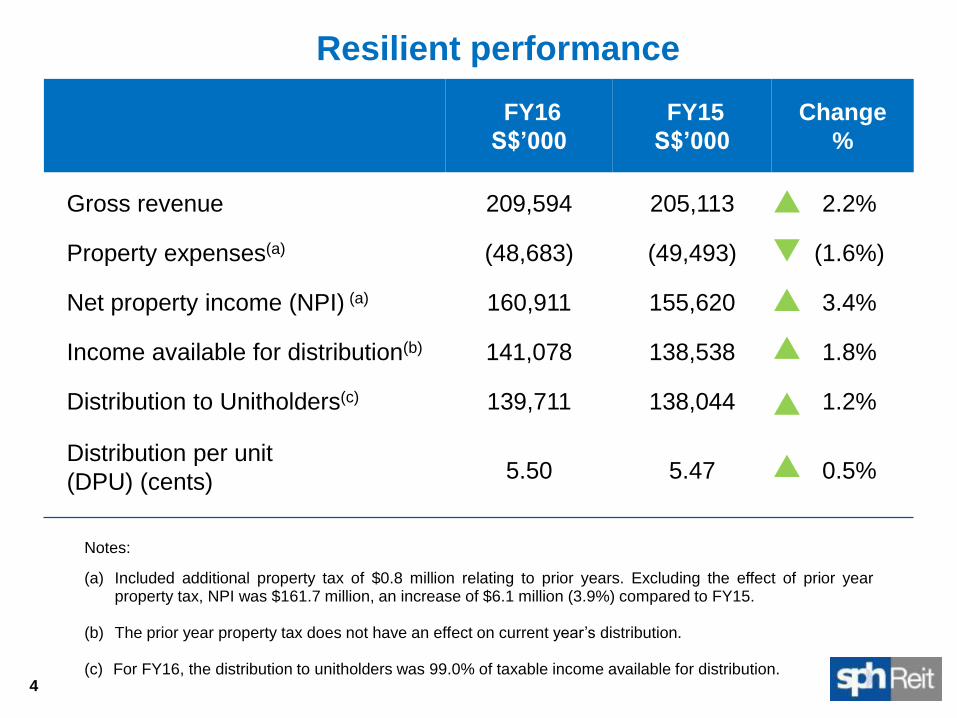
Gross revenue
209,594
205,113
2.2%
Property expenses(a)
(48,683) (49,493) (1.6%)
Net property income (NPI) (a)
160,911 155,620 3.4%
Income available for distribution(b)
141,078 138,538 1.8%
Distribution to Unitholders(c) 139,711 138,044 1.2%
Distribution per unit
(DPU) (cents)
5.50
5.47
0.5%
Notes:
(a) Included additional property tax of $0.8 million relating to prior years. Excluding the effect of prior year property tax, NPI was $161.7 million, an increase of $6.1 million (3.9%) compared to FY15.
(b) The prior year property tax does not have an effect on current year‟s distribution. (c) For FY16, the distribution to unitholders was 99.0% of taxable income available for distribution.
Resilient performance
4
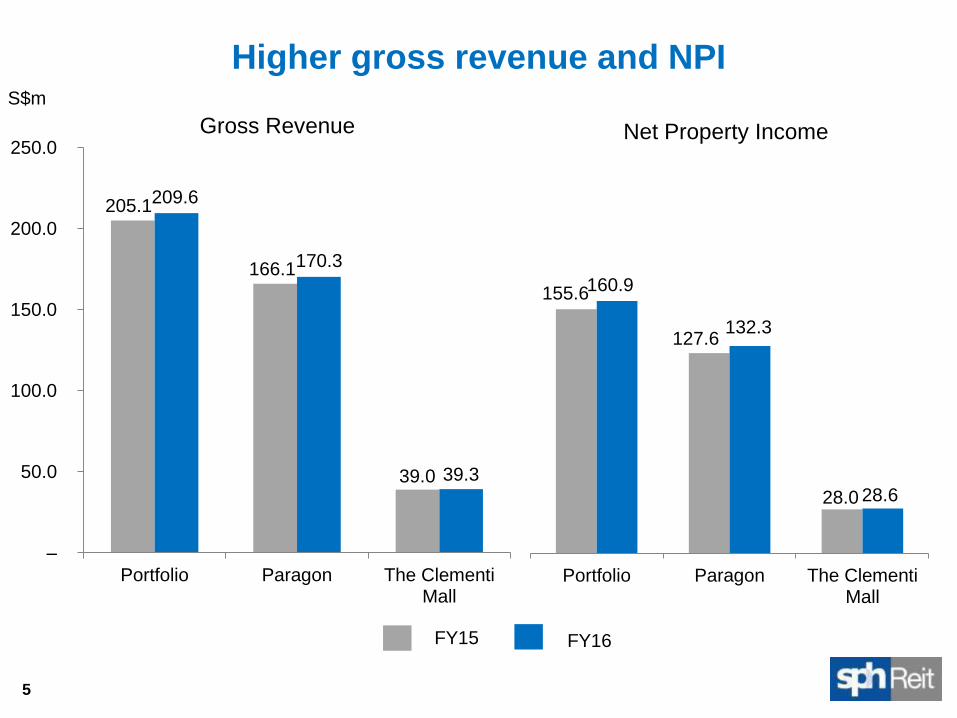
Higher gross revenue and NPI
5
FY16 FY15
205.1
166.1
39.0
209.6
170.3
39.3
–
50.0
100.0
150.0
200.0
250.0
Portfolio Paragon The ClementiMall
S$m
Gross Revenue
155.6
127.6
28.0
160.9
132.3
28.6
Portfolio Paragon The ClementiMall
Net Property Income
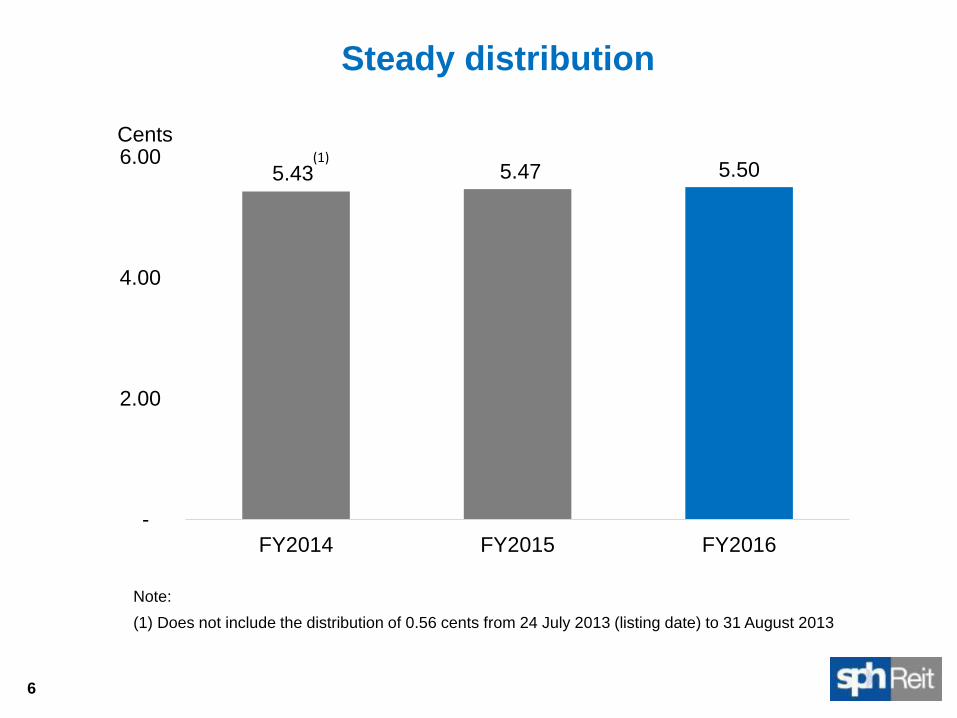
Steady distribution
6
Note:
(1) Does not include the distribution of 0.56 cents from 24 July 2013 (listing date) to 31 August 2013
5.43 5.47 5.50
-
2.00
4.00
6.00
FY2014 FY2015 FY2016
Cents (1)

Unsa
ve
d D
ocu
me
nt
/ 2
3/0
4/2
01
3 /
09
:00
Balance sheet
7
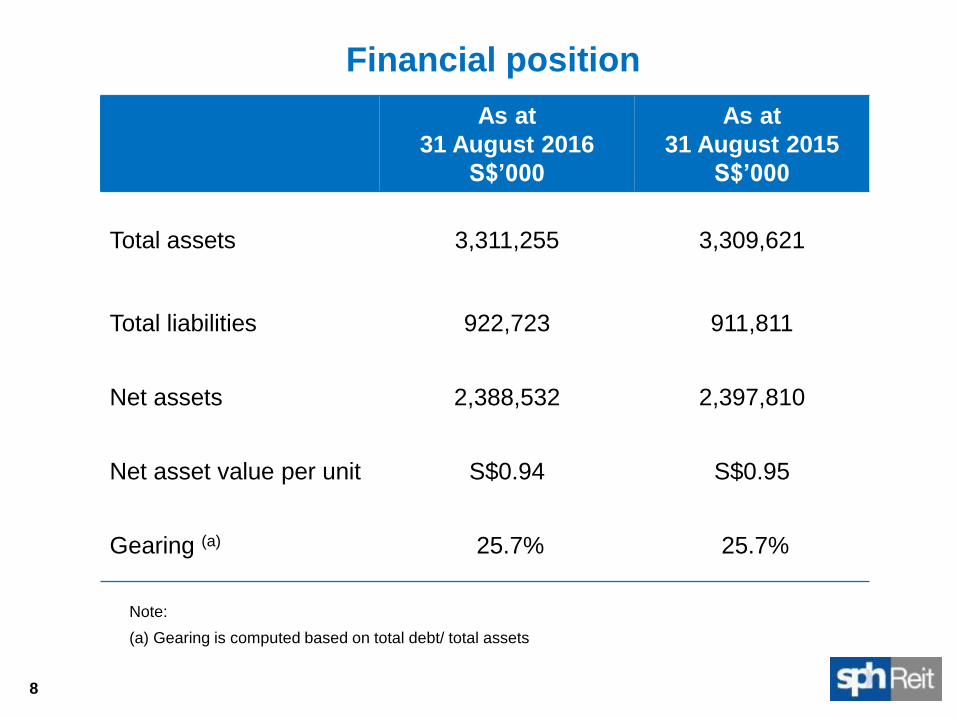
Financial position
As at
31 August 2016
S$’000
As at
31 August 2015
S$’000
Total assets
3,311,255
3,309,621
Total liabilities
922,723 911,811
Net assets 2,388,532 2,397,810
Net asset value per unit S$0.94 S$0.95
Gearing (a) 25.7% 25.7%
Note:
(a) Gearing is computed based on total debt/ total assets
8 8

A $250m loan tranche which matured in July 2016, was revised into two tranches of $125m each, with extended tenures of three years and five years.
Weighted average term to maturity increased to 3.1 years
Proactive capital management with 85.9% of the $850m debt facility on a fixed rate basis
Average cost of debt maintained at 2.82% p.a.
No refinancing required till 2018
9 9
320
65
280
65
60 60
2018 2019 2020 2021
Fixed Floating
Debt Maturity Profile (S$m)
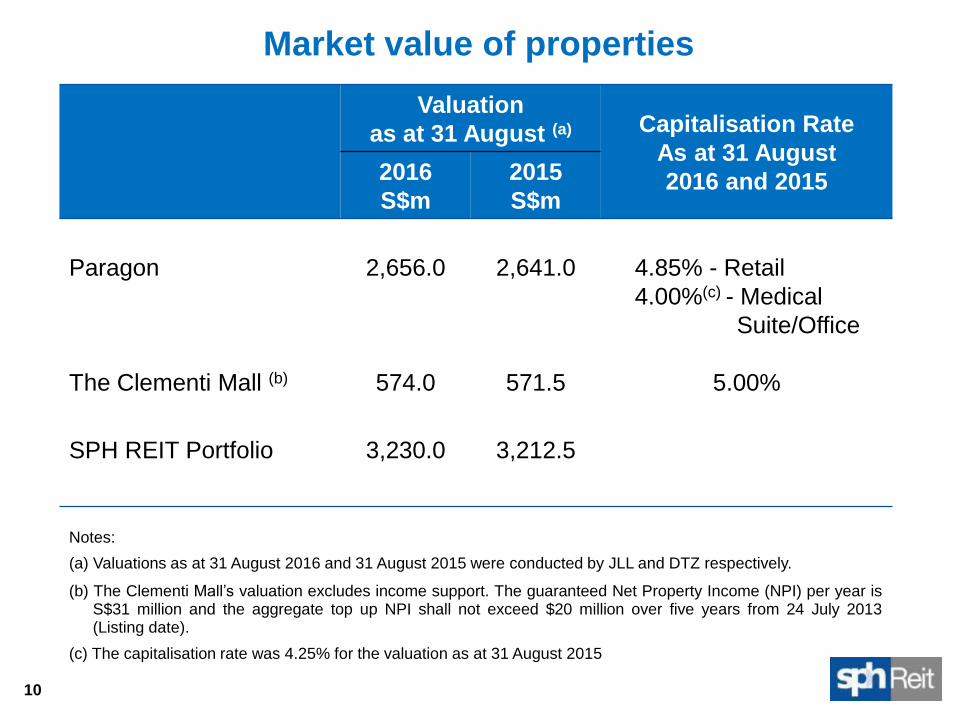
Market value of properties
Valuation
as at 31 August (a) Capitalisation Rate
As at 31 August
2016 and 2015 2016
S$m
2015
S$m
Paragon
2,656.0
2,641.0
4.85% - Retail
4.00%(c) - Medical
Suite/Office
The Clementi Mall (b) 574.0 571.5 5.00%
SPH REIT Portfolio
3,230.0
3,212.5
Notes:
(a) Valuations as at 31 August 2016 and 31 August 2015 were conducted by JLL and DTZ respectively. (b) The Clementi Mall‟s valuation excludes income support. The guaranteed Net Property Income (NPI) per year is
S$31 million and the aggregate top up NPI shall not exceed $20 million over five years from 24 July 2013 (Listing date).
(c) The capitalisation rate was 4.25% for the valuation as at 31 August 2015
10
Unsa
ve
d D
ocu
me
nt
/ 2
3/0
4/2
01
3 /
09
:00
Operational performance
11
12
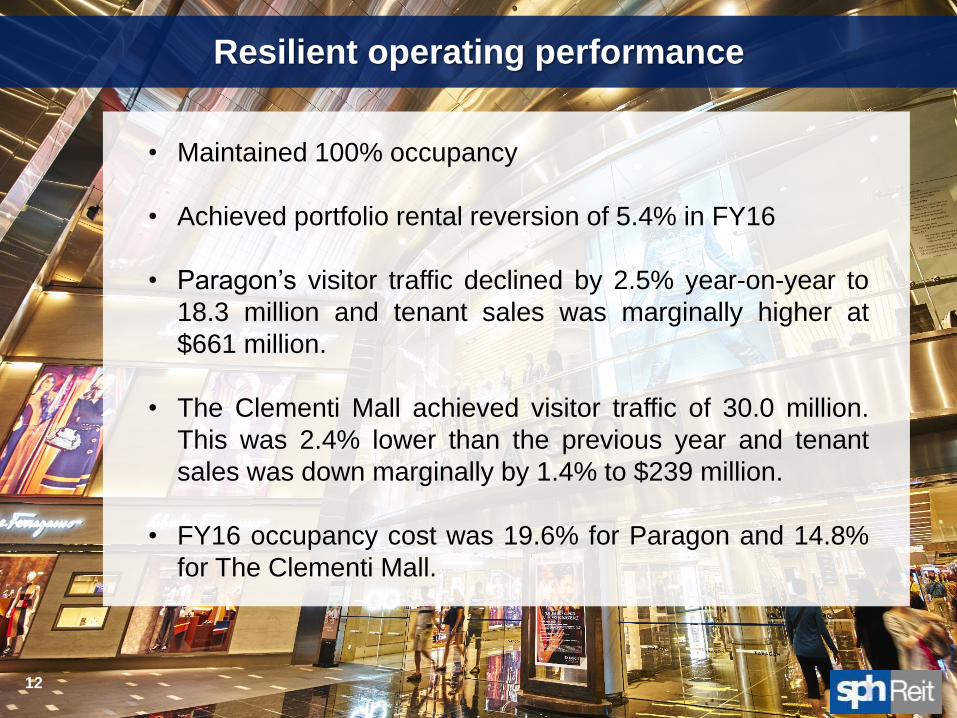
Resilient operating performance
• Maintained 100% occupancy
• Achieved portfolio rental reversion of 5.4% in FY16
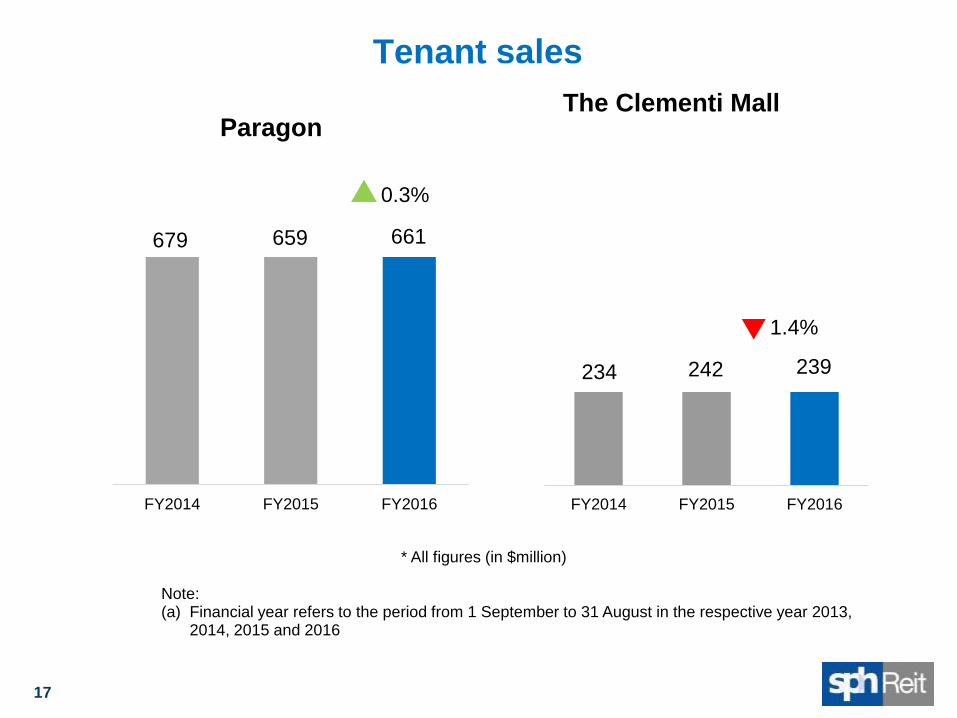
• Paragon‟s visitor traffic declined by 2.5% year-on-year to
18.3 million and tenant sales was marginally higher at
$661 million.
• The Clementi Mall achieved visitor traffic of 30.0 million.
This was 2.4% lower than the previous year and tenant
sales was down marginally by 1.4% to $239 million.
• FY16 occupancy cost was 19.6% for Paragon and 14.8%
for The Clementi Mall.
0
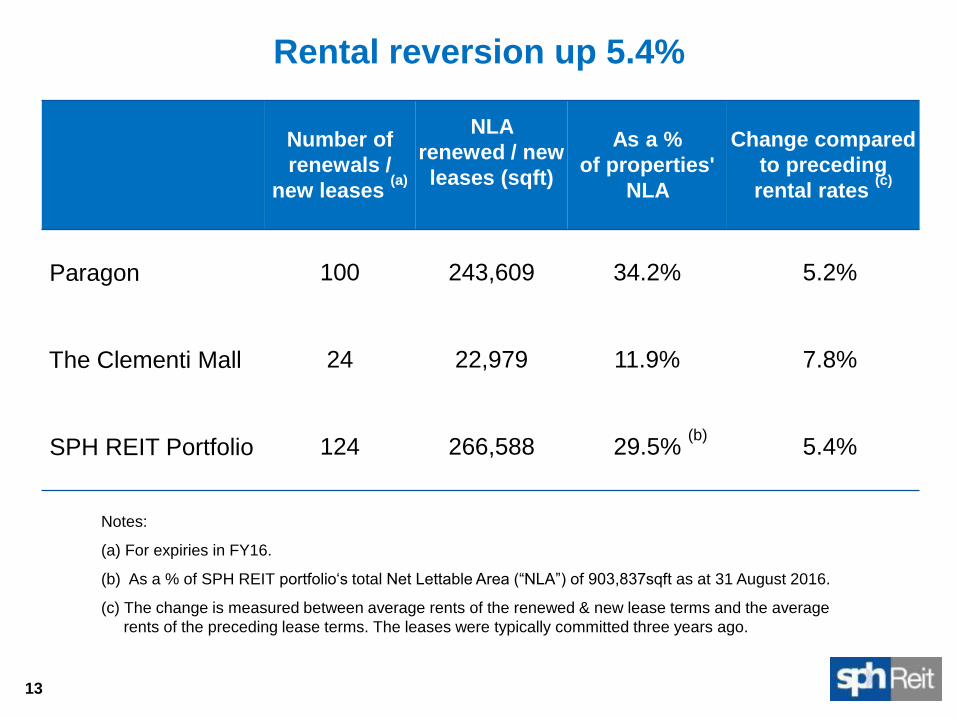
Rental reversion up 5.4%
Number of
renewals /
new leases (a)
NLA
renewed / new
leases (sqft)
As a %
of properties'
NLA
Change compared
to preceding
rental rates (c)
Paragon
100 243,609 34.2% 5.2%
The Clementi Mall
24 22,979 11.9% 7.8%
SPH REIT Portfolio
124 266,588 29.5% (b)
5.4%
Notes:
(a) For expiries in FY16.
(b) As a % of SPH REIT portfolio„s total Net Lettable Area (“NLA”) of 903,837sqft as at 31 August 2016.
(c) The change is measured between average rents of the renewed & new lease terms and the average
rents of the preceding lease terms. The leases were typically committed three years ago.
13
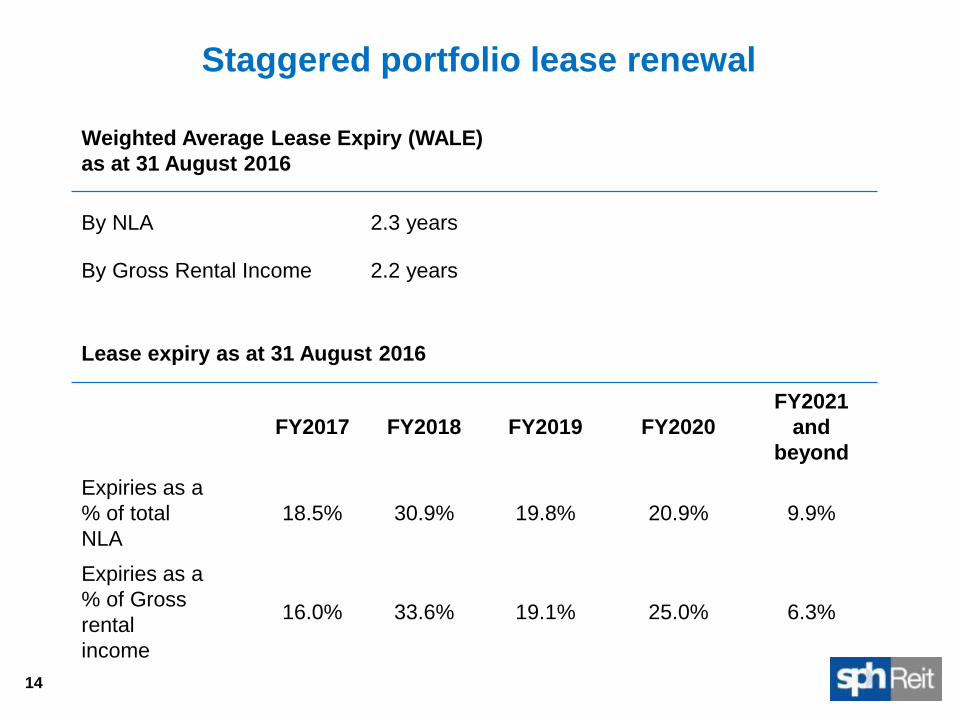
Staggered portfolio lease renewal
Weighted Average Lease Expiry (WALE)
as at 31 August 2016
By NLA
2.3 years
By Gross Rental Income
2.2 years
14
Lease expiry as at 31 August 2016
FY2017 FY2018 FY2019 FY2020
FY2021
and
beyond
Expiries as a
% of total
NLA
18.5% 30.9% 19.8% 20.9% 9.9%
Expiries as a
% of Gross
rental
income
16.0% 33.6% 19.1% 25.0% 6.3%
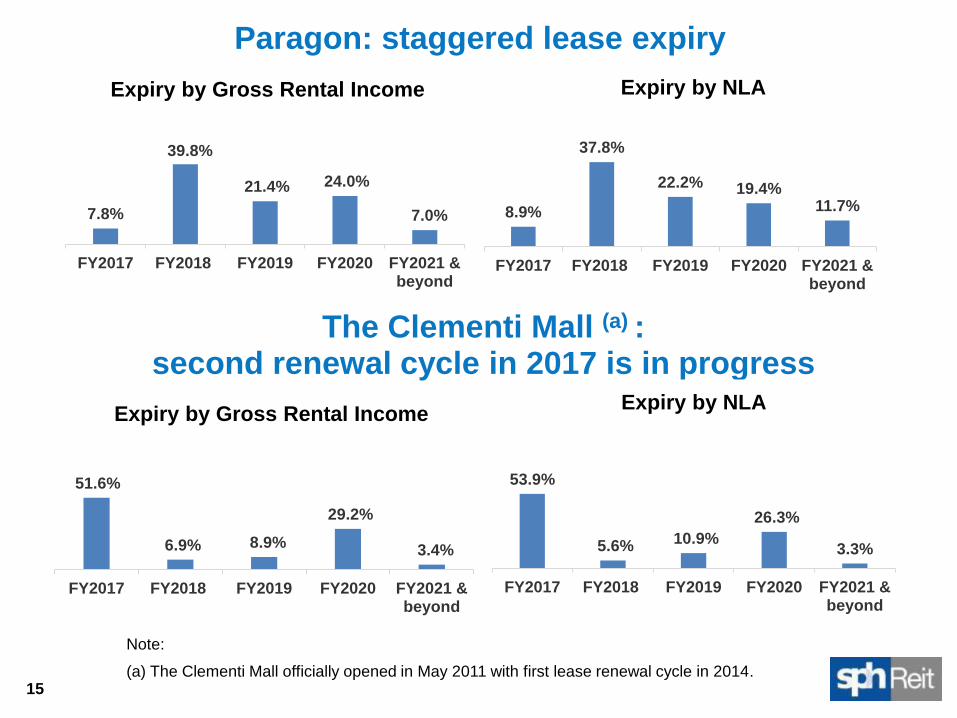
The Clementi Mall (a) : second renewal cycle in 2017 is in progress
Paragon: staggered lease expiry
15
Note:
(a) The Clementi Mall officially opened in May 2011 with first lease renewal cycle in 2014.
7.8%
39.8%
21.4% 24.0%
7.0%
FY2017 FY2018 FY2019 FY2020 FY2021 &beyond
Expiry by Gross Rental Income
8.9%
37.8%
22.2% 19.4% 11.7%
FY2017 FY2018 FY2019 FY2020 FY2021 &beyond
Expiry by NLA
51.6%
6.9% 8.9%
29.2%
3.4%
FY2017 FY2018 FY2019 FY2020 FY2021 &beyond
Expiry by Gross Rental Income
53.9%
5.6% 10.9%
26.3%
3.3%
FY2017 FY2018 FY2019 FY2020 FY2021 &beyond
Expiry by NLA
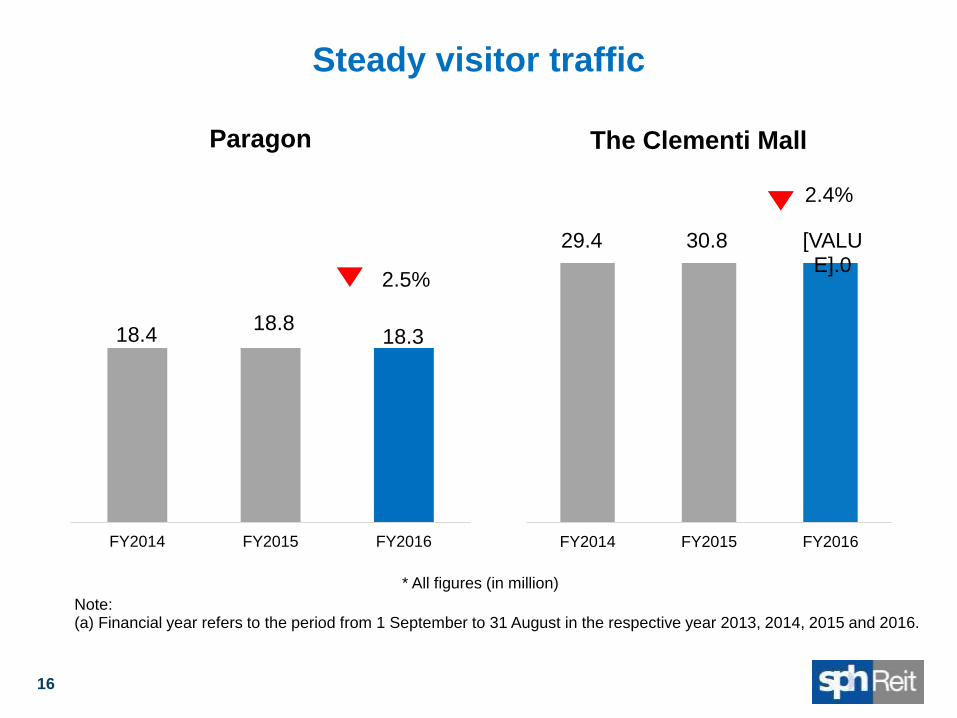
18.4 18.8
18.3
FY2014 FY2015 FY2016
Paragon
29.4 30.8 [VALUE].0
FY2014 FY2015 FY2016
The Clementi Mall
16
Steady visitor traffic
* All figures (in million)
2.4%
2.5%
Note: (a) Financial year refers to the period from 1 September to 31 August in the respective year 2013, 2014, 2015 and 2016.
17
* All figures (in $million)
Note: (a) Financial year refers to the period from 1 September to 31 August in the respective year 2013, (a) 2014, 2015 and 2016
Tenant sales
1.2%
679 659 661
FY2014 FY2015 FY2016
Paragon
0.3%
234 242 239
FY2014 FY2015 FY2016
The Clementi Mall
1.4%

Unsa
ve
d D
ocu
me
nt
/ 2
3/0
4/2
01
3 /
09
:00
Growth strategy and market outlook
18
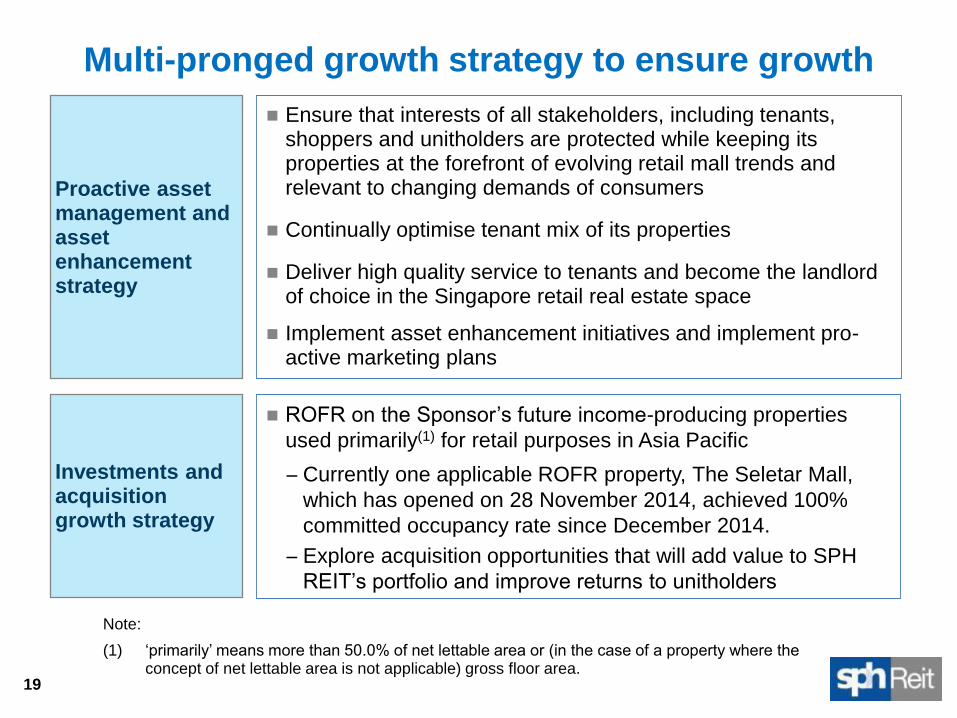
Proactive asset management and asset enhancement strategy
Ensure that interests of all stakeholders, including tenants, shoppers and unitholders are protected while keeping its properties at the forefront of evolving retail mall trends and relevant to changing demands of consumers
Continually optimise tenant mix of its properties
Deliver high quality service to tenants and become the landlord of choice in the Singapore retail real estate space
Implement asset enhancement initiatives and implement pro-active marketing plans
Investments and acquisition growth strategy
ROFR on the Sponsor‟s future income-producing properties
used primarily(1) for retail purposes in Asia Pacific
− Currently one applicable ROFR property, The Seletar Mall,
which has opened on 28 November 2014, achieved 100%
committed occupancy rate since December 2014.
− Explore acquisition opportunities that will add value to SPH
REIT‟s portfolio and improve returns to unitholders
Note:
(1) „primarily‟ means more than 50.0% of net lettable area or (in the case of a property where the concept of net lettable area is not applicable) gross floor area.
Multi-pronged growth strategy to ensure growth
19
20
Strategy to revitalise tenant mix
• Strategy to continually revitalise tenant mix to keep the
properties relevant and elevate the properties‟ positioning
• Completed tenancy revitalisation program for Level 1 in 2016
• Ongoing initiatives to strengthen various clusters and levels
• Asset enhancement works to create value and strengthen
the long-term sustainability of the property

21
The Clementi Mall’s (“TCM”) reconfiguration project
• Create a more efficient layout at basement and increase to a total of 21 food kiosks.
• Shoppers will enjoy a wider variety of food offering with 4 new-to-market concepts and 10 new tenants
Air Handling Unit (“AHU”) decanting project in Paragon
• Replace aging AHUs with fan coil unit (“FCU”) and convert about 7,000 sqft back-of-house space into revenue generating net lettable area (“NLA”) at retail levels.
• Multi-phased approach from September 2015 to mid 2018 to minimise disruption to tenants.
• New concepts and flagship stores for the newly created net lettable area at Level 1, namely “Emporio Armani” and “Greyhound Café” (first café in Singapore)
• Reconfigure space at Level 3, with new shopfronts and stores, and capitalise on the new elevated pedestrian linkway between Paragon and the Cairnhill redevelopment project
Continual asset enhancement
22
• Outlook for Singapore economy remain modest
- The Singapore economy grew by 2.1% year-on-year in the second quarter of 2016, unchanged from the previous quarter.
- The Ministry of Trade and Industry (MTI) has narrowed the growth forecast for 2016 at 1.0% to 2.0%.
• STB expects modest growth in 2016 amidst global uncertainties and increasing regional competition
- International visitor arrivals (IVA) grew y-o-y by 11.5% in the first half year of 2016.
- Tourism receipts grew by 2.0% to S$5.4 billion in Q1 2016.
• Retail environment remains challenging
- The retail sales index (excluding motor vehicles) declined by 1.0% y-o-y in
2015 and continued to contract by 4.0% in Q1 2016 and 3.9% in Q2 2016.
- Most of the trade segments registered decline in sales in Q2 2016, in particular,
supermarkets (3.6%), wearing apparel and footwear (3.8%), department stores
(3.2%), food and beverage (7.5%) and watches and jewellery (8.5%),
Market outlook
23
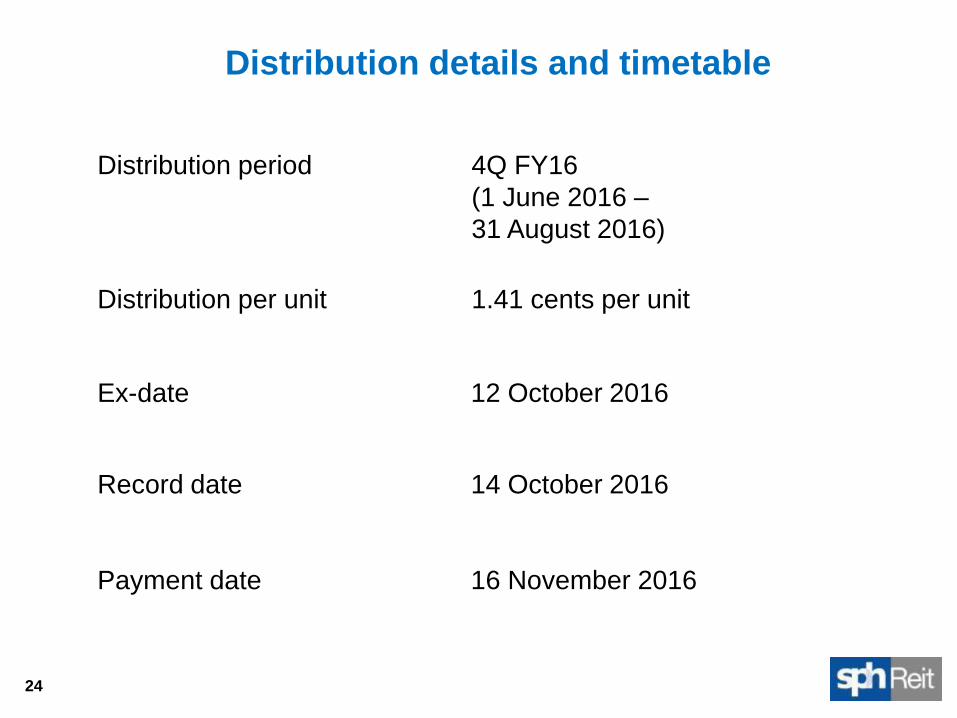
Distribution period
4Q FY16
(1 June 2016 –
31 August 2016)
Distribution per unit
1.41 cents per unit
Distribution details and timetable
24
Ex-date
12 October 2016
Record date
14 October 2016
Payment date
16 November 2016
Thank You Please visit www.sphreit.com.sg for more information.
25