powerpoint presentation · 06/21/16 solarcity corp. tesla motors, inc. electrical equipment...
TRANSCRIPT
Industrials M&A Report
Q2 2016
HYDE PARK CAPITAL
Member FINRA/SIPC
Investment Banking | Mergers & Acquisitions | Capital Raising
Hyde Park Capital Advisors, LLC 701 N. Franklin Street
Tampa, FL 33602 Tel: 813-383-0202
www.hydeparkcapital.com
John Hill Senior Managing Director [email protected] (813) 383-0205 John McDonald Senior Managing Director [email protected] (813) 383-0206 Keith Hodgdon Managing Director [email protected] (813) 383-0208 Greg Bosl Vice President [email protected] (813) 597-2649 Jami Gold Vice President [email protected] (813) 383-0203 Jeffrey Hendricks Vice President [email protected] (678) 523-3073 Kenneth Burnside Business Development Officer [email protected] (864) 905-9633

HYDE PARK CAPITAL Investment Banking | Mergers & Acquisitions | Capital Raising
Industry Sector 3 Months 12 months Revenue EBITDA
Construction 2.7% 11.5% 1.3x 10.1x
Electrical Equipment (1.4%) (2.8%) 2.2x 12.1x
Machinery (0.1%) (7.1%) 1.5x 10.6x
Industrial Services 5.5% 14.6% 2.5x 11.2x
Transportation (3.7%) (4.4%) 1.3x 7.6x
Industrial Conglomerates 1.3% 10.6% 2.8x 13.7x
Materials 3.0% (3.4%) 2.3x 9.8x
Median
Change in Stock Price Enterprise Value / LTM
Offer Date Issuer Industry Sector
Transaction
Type
Transaction
Value
04/04/16 FedEx Corp. Transportation Fixed-Income $3,402
04/20/16Prime Security Services
Borrower, LLCIndustrial Services Fixed-Income $3,140
05/03/16 United States Steel Corp. Materials Fixed-Income $980
05/25/16 TransDigm, Inc. Industrial Services Fixed-Income $950
04/29/16 Reliance Worldwide Corp. Materials IPO $700
05/11/16 SiteOne Landscape Supply, Inc. Materials IPO $210
06/09/16 Atkore International Group, Inc. Electrical Equipment IPO $192
05/25/16 GMS, Inc. Industrial Services IPO $147
80%
90%
100%
110%
Jun-15 Sep-15 Dec-15 Mar-16 Jun-16
S&P 500 S&P Global Industrials Sector Index Nasdaq
Capital Markets Overview
2
Public Market Performance (LTM)
Select Public Offerings – Industrials (Q2 2016)
Public Company Market Performance by Sector
Source: S&P Capital IQ
The S&P Global Industrials Sector Index rose 2.2% over the last 12 month period ended June 30, 2016, while the Nasdaq declined 3.4% and the S&P 500 increased 1.0%.
IPO activity in the Industrials industry improved in Q2 2016 after
none were completed during Q1 2016. Reliance Worldwide Corp. (ASX: RWC), which provides water control and plumbing solutions, raised $700 million in the largest IPO during the quarter.
The Industrial Conglomerates and Electrical Equipment sectors were the industry’s leaders with respect to valuation during Q2 2016, trading at EBITDA multiples of 13.7x and 12.1x, respectively.
Commentary
2.2%
($ in millions)
3.4%
1.0%
HYDE PARK CAPITAL Investment Banking | Mergers & Acquisitions | Capital Raising
Deal Size Volume Value Volume Value Volume Value
Less than $100M 116 $4.1 60 $2.2 (48%) (47%)
$100 - $499M 36 $8.7 40 $10.6 11% 22%
$500 - $999M 15 $10.4 6 $4.4 (60%) (57%)
Total Middle Market 167 $23.2 106 $17.3 (37%) (26%)
% of Middle Market
Less than $100M 69% 18% 56% 13%
$100 - $499M 22% 37% 38% 61%
$500 - $999M 9% 45% 6% 26%
Total Middle Market 100% 100% 100% 100%
1H 2015 1H 2016 % Change
402
473
550
501
250
412
525
457
398
435
336
167
106
0
50
100
150
200
250
300
350
400
450
500
550
600
2005 2006 2007 2008 2009 2010 2011 2012 2013 2014 2015 1H 2015 1H 2016
Middle Market M&A Transactions by Deal Size
U.S. Middle Market M&A Activity – Annual Trends: VOLUME U.S. Middle Market M&A Activity – Annual Trends: VALUE
To
tal T
ran
sact
ion
Vo
lum
e
To
tal T
ran
sact
ion
Val
ue
($ i
n b
illi
ons)
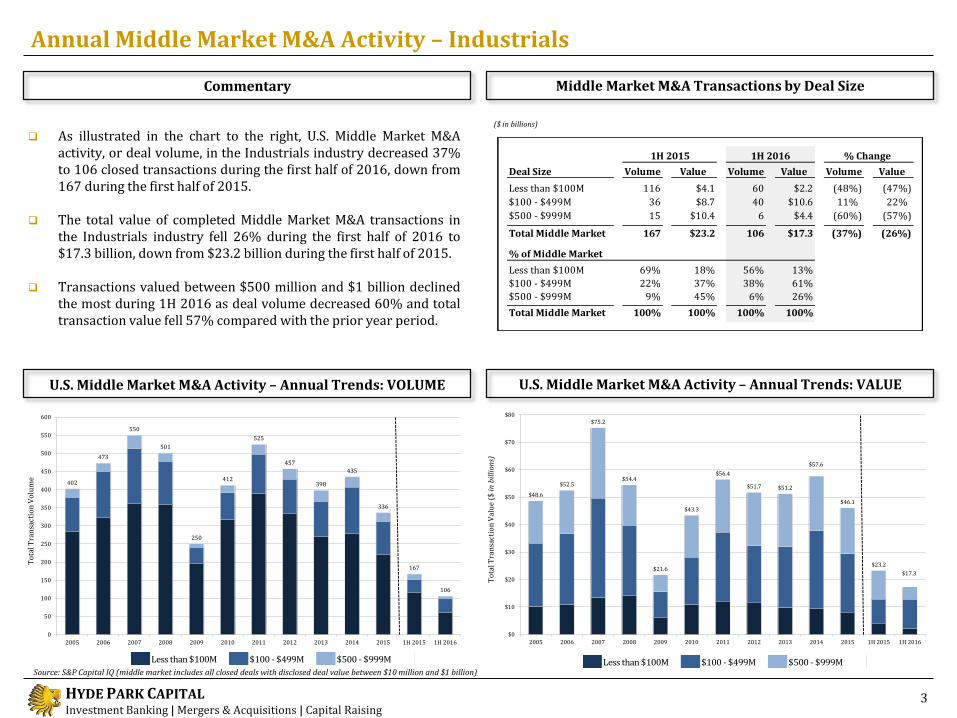
Annual Middle Market M&A Activity – Industrials
3
As illustrated in the chart to the right, U.S. Middle Market M&A activity, or deal volume, in the Industrials industry decreased 37% to 106 closed transactions during the first half of 2016, down from 167 during the first half of 2015.
The total value of completed Middle Market M&A transactions in the Industrials industry fell 26% during the first half of 2016 to $17.3 billion, down from $23.2 billion during the first half of 2015.
Transactions valued between $500 million and $1 billion declined the most during 1H 2016 as deal volume decreased 60% and total transaction value fell 57% compared with the prior year period.
Commentary
Source: S&P Capital IQ (middle market includes all closed deals with disclosed deal value between $10 million and $1 billion)
($ in billions)
Less than $100M $100 - $499M $500 - $999M Less than $100M $100 - $499M $500 - $999M
$48.6
$52.5
$75.2
$54.4
$21.6
$43.3
$56.4
$51.7 $51.2
$57.6
$46.1
$23.2
$17.3
$0
$10
$20
$30
$40
$50
$60
$70
$80
2005 2006 2007 2008 2009 2010 2011 2012 2013 2014 2015 1H 2015 1H 2016

HYDE PARK CAPITAL Investment Banking | Mergers & Acquisitions | Capital Raising
Deal Size Volume Value Volume Value Volume Value
Less than $100M 55 $1.8 31 $1.0 (44%) (45%)
$100 - $499M 14 $3.4 21 $5.4 50% 60%
$500 - $999M 10 $6.7 3 $2.6 (70%) (62%)
Total Middle Market 79 $11.9 55 $8.9 (30%) (25%)
% of Middle Market
Less than $100M 70% 15% 57% 11%
$100 - $499M 18% 28% 38% 60%
$500 - $999M 12% 57% 5% 29%
Total Middle Market 100% 100% 100% 100%
Q2 2015 Q2 2016 % Change
Quarterly Middle Market M&A Activity – Industrials
U.S. Middle Market M&A Activity – Quarterly Trends: VALUE U.S. Middle Market M&A Activity – Quarterly Trends: VOLUME
Middle Market M&A Transactions by Deal Size
($ in billions)
To
tal T
ran
sact
ion
Vo
lum
e
To
tal T
ran
sact
ion
Val
ue
($ i
n b
illi
ons)
4
As detailed in the table on the right, Middle Market M&A activity in the Industrials industry decreased 30% to 55 completed transactions during Q2 2016 compared to Q2 2015; while the total value of completed transactions fell 25% to $8.9 billion.
During Q2 2016, transactions valued at $500 to $999 million saw
the largest decline compared with the prior year period as deal volume and value within this size range fell 70% and 62%, respectively.
As evidenced in the charts on this page, increased volatility in the
capital markets coupled with slow global growth had a negative impact on M&A activity within the Industrial industry during Q2 2016.
Commentary
Source: S&P Capital IQ (middle market includes all closed deals with disclosed deal value between $10 million and $1 billion)
Less than $100M $100 - $499M $500 - $1,000MLess than $100M $100 - $499M $500 - $1,000M
69
100
108
121
96
131
98
110
88
7983
86
5155
0
25
50
75
100
125
150
Q1 '13 Q2'13 Q3 '13 Q4 '13 Q1 '14 Q2 '14 Q3 '14 Q4 '14 Q1 '15 Q2 '15 Q3 '15 Q4 '15 Q1 '16 Q2 '16
$10.0 $9.7
$14.8
$16.7
$13.1
$16.9
$14.5
$13.2
$11.4 $11.9
$11.1
$11.8
$8.4 $8.9
$0.0
$3.0
$6.0
$9.0
$12.0
$15.0
$18.0
$21.0
Q1 '13 Q2 '13 Q3 '13 Q4 '13 Q1 '14 Q2 '14 Q3 '14 Q4 '14 Q1 '15 Q2 '15 Q3 '15 Q4 '15 Q1 '16 Q2 '16

HYDE PARK CAPITAL Investment Banking | Mergers & Acquisitions | Capital Raising
Recent M&A Activity – Industrials
Select Announced M&A Transactions (Q2 2016)
5
Source: S&P Capital IQ.
Announced
Date Target Buyer Industry
Enterprise
Value ($mm)
EV /
Revenue
EV /
EBITDA
06/21/16 SolarCity Corp. Tesla Motors, Inc. Electrical Equipment $6,921.4 12.9x NA
06/21/16 American Science & Engineering, Inc. OSI Systems, Inc. Transportation $182.5 1.8x NA
06/16/16 Dejana Truck & Utility Equipment Co. Douglas Dynamics, Inc. Machinery $206.0 1.4x NA
06/14/16 DST Systems, Inc. Broadridge Investor Corp. Industrial Services $410.0 0.4x NA
06/13/16 BWAY Parent Co., Inc. Stone Canyon Industries, LLC Materials $2,400.0 NA NA
06/10/16 Axiall Corp. Westlake Chemical Corp. Materials $3,622.9 1.1x NA
05/31/16 Vertellus Specialties, Inc. Black Diamond Capital Materials $453.8 NA NA
05/27/16 Blue Bird Corp. American Securities Machinery $416.1 0.5x NA
05/24/16 ILC Industries, LLC TransDigm, Inc. Transportation $1,000.0 NA NA
05/24/16 American Covers, Inc. Energizer Reliance, Inc. Materials $340.0 NA NA
05/23/16 Wyle, Inc. KBR Holdings, LLC Transportation $600.0 NA NA
05/19/16 Lifestorage, LP Sovran Acquisition Ltd. Industrial Services $1,300.0 NA NA
05/18/16 Monsanto Co. Bayer AG Materials $63,980.6 4.8x NA
05/18/16 Cambridge International, Inc. Rexnord Corp. Machinery $210.0 NA NA

HYDE PARK CAPITAL Investment Banking | Mergers & Acquisitions | Capital Raising
Recent M&A Activity – Industrials
Select Announced M&A Transactions (Q2 2016)
6
Source: S&P Capital IQ.
Announced Date Target Buyer Industry
Enterprise Value ($mm)
EV / Revenue
EV / EBITDA
05/17/16 Herndon Aerospace & Defense Co. KLX, Inc. Transportation $210.0 1.6x NA
05/16/16Terex Corp. (material handlingand port solutions business)
Konecranes Plc Machinery $1,332.3 0.9x 11.9x
05/16/16 Armed Forces Services Corp. Magellan Healthcare, Inc. Industrial Services $127.5 0.9x NA
05/13/16 Great Plains Manufacturing, Inc. Kubota U.S.A., Inc. Machinery $430.0 NA NA
05/12/16 The Climate Control Group, Inc. NIBE Energy Systems, Inc. Machinery $364.0 1.3x 14.6x
05/05/16 NRG EV Services, LLC Capricorn Investment Group Electrical Equipment NA NA NA
04/30/16 Emerald Performance Materials, LLC DyStar LP Materials $245.0 NA NA
04/29/16 Power Service, Inc. NOW, Inc. Machinery $90.0 NA NA
04/26/16 Kaydon Corp. Stabilus S.A. Machinery $339.0 2.8x NA
04/25/16 Ball Corp. Ardagh Group S.A. Materials NA NA NA
04/04/16 Heritage Bag Co. Novolex Materials NA NA NA
04/04/16 Virgin America, Inc. Alaska Air Group, Inc. Transportation $2,432.4 1.6x 11.5x
04/01/16 Downhole Technology, LLC Schoeller-Bleckmann Oilfield Equipment AG Machinery $151.5 3.5x NA
HYDE PARK CAPITAL Investment Banking | Mergers & Acquisitions | Capital Raising
20
5
30
22
5
12
62
19
46
17
0
17
0 10 20 30 40 50 60 70
Materials
Transportation
Industrial Services
Machinery
Electrical Equipment
Construction
1H 2015 1H 2016
$3.1
$0.8
$4.3
$3.5
$1.1
$2.5
$6.9
$2.7
$5.3
$2.0
$0.0
$1.6
$0.0 $1.0 $2.0 $3.0 $4.0 $5.0 $6.0 $7.0 $8.0
Materials
Transportation
Industrial Services
Machinery
Electrical Equipment
Construction
1H 2015 1H 2016
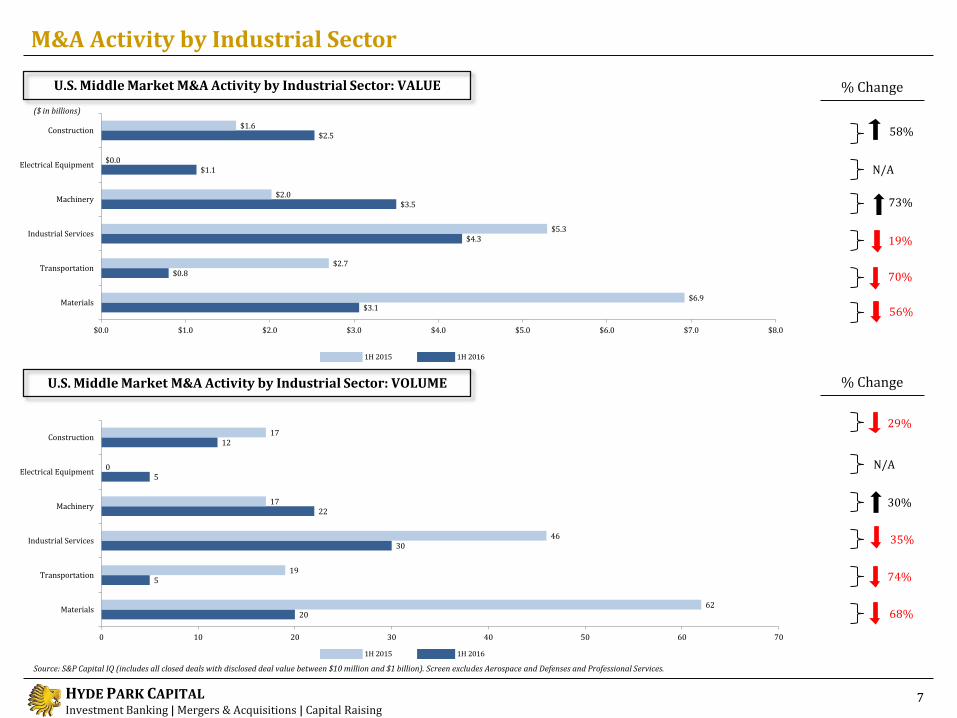
M&A Activity by Industrial Sector
% Change
% Change
U.S. Middle Market M&A Activity by Industrial Sector: VALUE
7
Source: S&P Capital IQ (includes all closed deals with disclosed deal value between $10 million and $1 billion). Screen excludes Aerospace and Defenses and Professional Services.
U.S. Middle Market M&A Activity by Industrial Sector: VOLUME
19%
70%
30%
35%
74%
68%
($ in billions)
N/A
29%
56%
58%
73%
N/A
HYDE PARK CAPITAL Investment Banking | Mergers & Acquisitions | Capital Raising
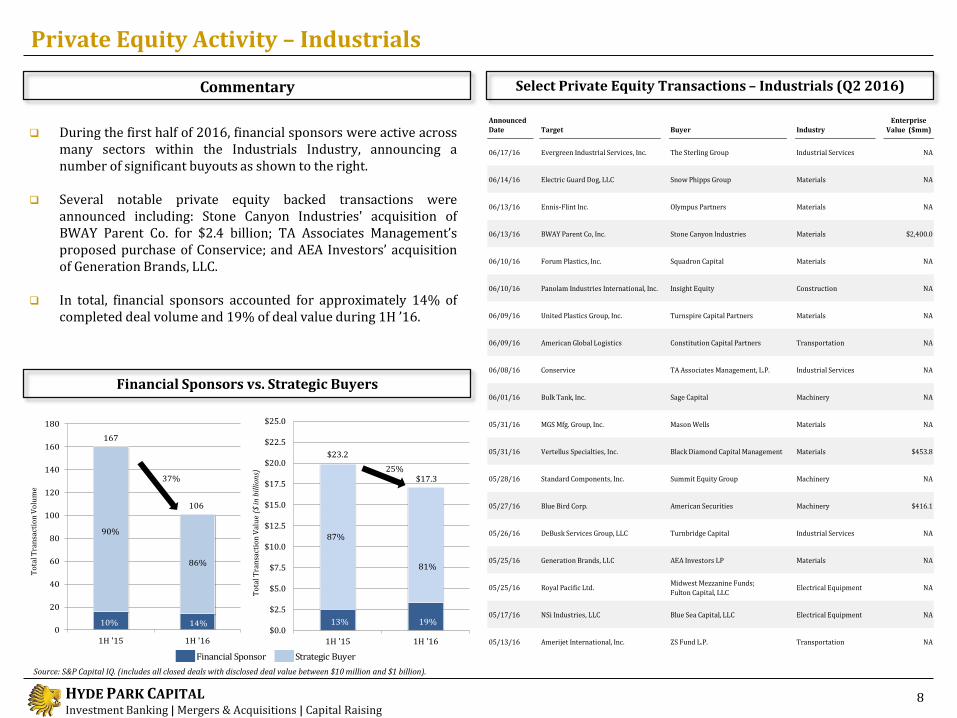
During the first half of 2016, financial sponsors were active across many sectors within the Industrials Industry, announcing a number of significant buyouts as shown to the right.
Several notable private equity backed transactions were
announced including: Stone Canyon Industries' acquisition of BWAY Parent Co. for $2.4 billion; TA Associates Management’s proposed purchase of Conservice; and AEA Investors’ acquisition of Generation Brands, LLC.
In total, financial sponsors accounted for approximately 14% of completed deal volume and 19% of deal value during 1H ’16.
Select Private Equity Transactions – Industrials (Q2 2016)
Financial Sponsors vs. Strategic Buyers
Private Equity Activity – Industrials
8
Commentary
Source: S&P Capital IQ. (includes all closed deals with disclosed deal value between $10 million and $1 billion).
To
tal T
ran
sact
ion
Val
ue
($ in
bil
lion
s)
To
tal T
ran
sact
ion
Vo
lum
e
Financial Sponsor Strategic Buyer
$0.0
$2.5
$5.0
$7.5
$10.0
$12.5
$15.0
$17.5
$20.0
$22.5
$25.0
1H '15 1H '16
$23.2
25%$17.3
81%
13% 19%
87%
167
106
0
20
40
60
80
100
120
140
160
180
1H '15 1H '16
10%
90%
14%
86%
37%
Announced
Date Target Buyer Industry
Enterprise
Value ($mm)
06/17/16 Evergreen Industrial Services, Inc. The Sterling Group Industrial Services NA
06/14/16 Electric Guard Dog, LLC Snow Phipps Group Materials NA
06/13/16 Ennis-Flint Inc. Olympus Partners Materials NA
06/13/16 BWAY Parent Co, Inc. Stone Canyon Industries Materials $2,400.0
06/10/16 Forum Plastics, Inc. Squadron Capital Materials NA
06/10/16 Panolam Industries International, Inc. Insight Equity Construction NA
06/09/16 United Plastics Group, Inc. Turnspire Capital Partners Materials NA
06/09/16 American Global Logistics Constitution Capital Partners Transportation NA
06/08/16 Conservice TA Associates Management, L.P. Industrial Services NA
06/01/16 Bulk Tank, Inc. Sage Capital Machinery NA
05/31/16 MGS Mfg. Group, Inc. Mason Wells Materials NA
05/31/16 Vertellus Specialties, Inc. Black Diamond Capital Management Materials $453.8
05/28/16 Standard Components, Inc. Summit Equity Group Machinery NA
05/27/16 Blue Bird Corp. American Securities Machinery $416.1
05/26/16 DeBusk Services Group, LLC Turnbridge Capital Industrial Services NA
05/25/16 Generation Brands, LLC AEA Investors LP Materials NA
05/25/16 Royal Pacific Ltd.Midwest Mezzanine Funds;
Fulton Capital, LLCElectrical Equipment NA
05/17/16 NSi Industries, LLC Blue Sea Capital, LLC Electrical Equipment NA
05/13/16 Amerijet International, Inc. ZS Fund L.P. Transportation NA

HYDE PARK CAPITAL Investment Banking | Mergers & Acquisitions | Capital Raising
70%
80%
90%
100%
110%
Jun-15 Sep-15 Dec-15 Mar-16 Jun-16
S&P 500 Machinery
70%
80%
90%
100%
110%
Jun-15 Sep-15 Dec-15 Mar-16 Jun-16
S&P 500 Electrical Equipment
80%
90%
100%
110%
120%
Jun-15 Sep-15 Dec-15 Mar-16 Jun-16
S&P 500 Construction
Industry Sector Overview – Recent Stock Price Performance
Electrical Equipment
Commentary
9
Construction
Machinery
Source: S&P Capital IQ
The charts included on the following pages detail the recent stock price performance by sector for the leading public companies within the Industrials industry for the trailing 12-month period ending June 30, 2016. The shaded section is the most recent 3-month period (Q2) for each sector and relative to the S&P 500.
For the 12-month period ending June 30, 2016, the Industrial Services and Construction sectors saw the largest ascent, rising 14.6% and 11.5%, respectively. Machinery saw the largest decline, falling 7.1%.
During Q2 2016, the Industrials industry produced mixed results with the Industrial Services and Materials sectors increasing the most at 5.0% and 3.0% respectively.
11.5%
1.0%
1.0% 1.0%
7.1%
2.8%

HYDE PARK CAPITAL Investment Banking | Mergers & Acquisitions | Capital Raising
80%
90%
100%
110%
120%
Jun-15 Sep-15 Dec-15 Mar-16 Jun-16
S&P 500 Transportation
80%
90%
100%
110%
120%
Jun-15 Sep-15 Dec-15 Mar-16 Jun-16
S&P 500 Industrial Conglomerates
70%
80%
90%
100%
110%
Jun-15 Sep-15 Dec-15 Mar-16 Jun-16
S&P 500 Materials
80%
90%
100%
110%
120%
Jun-15 Sep-15 Dec-15 Mar-16 Jun-16
S&P 500 Industrial Services
Industry Sector Overview – Recent Stock Price Performance
Industrial Conglomerates
Industrial Services
10
Transportation
Source: S&P Capital IQ
Materials
4.4%
10.6%
1.0%
1.0%
3.4%
14.6%
1.0%
1.0%

HYDE PARK CAPITAL Investment Banking | Mergers & Acquisitions | Capital Raising
Closing Price % of 52 Equity Enterprise
Company Ticker 6/30/16 Week High Value Value Revenue Gross Profit EBITDA Gross Profit EBITDA Revenue EBITDA
AECOM Technology Corp. ACM $31.77 93% $4,890 $8,948 $17,952 $621 $1,015 3.5% 5.7% 0.5x 8.8x
Fluor Corp. FLR $49.28 88% $7,119 $6,363 $17,989 $1,053 $1,076 5.9% 6.0% 0.4x 5.9x
Jacobs Engineering Group, Inc. JEC $49.81 93% $6,108 $6,238 $11,654 $1,843 $685 15.8% 5.9% 0.5x 9.1x
EMCOR Group, Inc. EME $49.26 94% $3,091 $3,021 $6,875 $951 $364 13.8% 5.3% 0.4x 8.3x
Tutor Perini Corp. TPC $23.55 97% $1,168 $1,901 $4,939 $371 $171 7.5% 3.5% 0.4x 11.1x
KBR, Inc. KBR $13.24 66% $1,897 $1,121 $4,656 $323 $210 6.9% 4.5% 0.2x 5.3x
Average 88% $3,876 $3,729 $9,223 $908 $501 10.0% 5.0% 0.4x 8.0x
Median 93% $3,091 $3,021 $6,875 $951 $364 7.5% 5.3% 0.4x 8.3x
Enterprise Value /
LTM LTM Margins LTM
Closing Price % of 52 Equity Enterprise
Company Ticker 6/30/16 Week High Value Value Revenue Gross Profit EBITDA Gross Profit EBITDA Revenue EBITDA
Masco Corp. MAS $30.94 94% $10,442 $12,566 $7,203 $2,327 $1,123 32.3% 15.6% 1.7x 11.2x
Fortune Brands Home & Security, Inc. FBHS $57.97 97% $9,390 $10,760 $4,735 $1,648 $685 34.8% 14.5% 2.3x 15.7x
Owens Corning OC $51.52 98% $6,064 $8,002 $5,378 $1,224 $906 22.8% 16.8% 1.5x 8.8x
AO Smith Corp. AOS $88.11 100% $7,858 $7,505 $2,555 $1,043 $484 40.8% 18.9% 2.9x 15.5x
Lennox International, Inc. LII $142.60 100% $6,417 $7,438 $3,524 $1,005 $470 28.5% 13.3% 2.1x 15.8x
USG Corp. USG $26.96 82% $3,968 $5,529 $3,837 $733 $573 19.1% 14.9% 1.4x 9.7x
Armstrong World Industries, Inc. AWI $39.15 64% $2,188 $3,019 $2,440 $614 $289 25.2% 11.8% 1.2x 10.5x
Simpson Manufacturing Co., Inc. SSD $39.97 100% $1,956 $1,724 $817 $374 $151 45.8% 18.5% 2.1x 11.4x
Average 92% $5,406 $6,282 $3,327 $949 $508 31.0% 15.6% 1.9x 12.5x
Median 98% $6,064 $7,438 $3,524 $1,005 $484 28.5% 14.9% 2.1x 11.4x
LTM Margins
Enterprise Value /
LTM LTM
Construction and Engineering
Industry Sector Overview – Public Company Analysis
Building Products
($ in millions, except per share)
11
Construction
Source: S&P Capital IQ.

HYDE PARK CAPITAL Investment Banking | Mergers & Acquisitions | Capital Raising
Closing Price % of 52 Equity Enterprise
Company Ticker 6/30/16 Week High Value Value Revenue Gross Profit EBITDA Gross Profit EBITDA Revenue EBITDA
Rockwell Automation, Inc. ROK $114.82 91% $15,323 $14,804 $6,050 $2,549 $1,214 42.1% 20.1% 2.4x 12.2x
Ametek, Inc. AME $46.23 80% $11,092 $12,924 $3,935 $1,436 $1,070 36.5% 27.2% 3.3x 12.1x
Acuity Brands, Inc. AYI $247.96 94% $10,817 $10,835 $3,125 $1,358 $537 43.5% 17.2% 3.5x 20.2x
Hubbell, Inc. HUBB $105.47 95% $6,070 $6,735 $3,416 $1,122 $594 32.8% 17.4% 2.0x 11.3x
Woodward, Inc. WWD $57.64 97% $3,725 $4,357 $1,982 $561 $317 28.3% 16.0% 2.2x 13.8x
Belden, Inc. BDC $60.37 75% $2,592 $4,139 $2,304 $946 $366 41.1% 15.9% 1.8x 11.3x
Generac Holdings, Inc. GNRC $34.96 88% $2,389 $3,451 $1,292 $458 $249 35.5% 19.3% 2.7x 13.9x
Brady Corp. BRC $30.56 93% $1,556 $1,657 $1,127 $547 $137 48.5% 12.2% 1.5x 12.1x
Average 89% $5,463 $6,300 $2,454 $918 $467 38.0% 17.9% 2.4x 13.5x
Median 93% $3,725 $4,357 $2,304 $946 $366 36.5% 17.2% 2.2x 12.1x
Enterprise Value /
LTM LTM Margins LTM
Industry Sector Overview – Public Company Analysis
12
Source: S&P Capital IQ.
Electrical Equipment
($ in millions, except per share)

HYDE PARK CAPITAL Investment Banking | Mergers & Acquisitions | Capital Raising
Industry Sector Overview – Public Company Analysis
Construction and Farm Machinery
($ in millions, except per share)
13
Industrial Machinery
Machinery
Source: S&P Capital IQ.
Closing Price % of 52 Equity Enterprise
Company Ticker 6/30/16 Week High Value Value Revenue Gross Profit EBITDA Gross Profit EBITDA Revenue EBITDA
Illinois Tool Works, Inc. ITW $104.16 95% $37,893 $42,545 $13,334 $5,577 $3,427 41.8% 25.7% 3.2x 12.4x
Eaton Corp. ETN $59.73 88% $27,583 $35,811 $20,153 $6,441 $3,201 32.0% 15.9% 1.8x 11.2xStanley Black & Decker, Inc. SWK $111.22 97% $16,576 $20,438 $11,279 $4,148 $1,911 36.8% 16.9% 1.8x 10.7x
Parker Hannifin Corp. PH $108.05 92% $14,793 $15,944 $11,361 $2,537 $1,485 22.3% 13.1% 1.4x 10.7xDover Corp. DOV $69.32 96% $10,844 $13,606 $6,791 $2,528 $1,213 37.2% 17.9% 2.0x 11.2x
Flowserve Corp. FLS $45.17 86% $5,942 $7,330 $4,358 $1,472 $684 33.8% 15.7% 1.7x 10.7xDonaldson Co., Inc. DCI $34.36 93% $4,653 $5,016 $2,237 $758 $352 33.9% 15.8% 2.2x 14.2x
The Timken Co. TKR $30.66 83% $2,493 $3,052 $2,779 $756 $418 27.2% 15.0% 1.1x 7.3x
Average 91% $15,097 $17,968 $9,037 $3,027 $1,586 33.1% 17.0% 1.9x 11.1x
Median 92% $12,819 $14,775 $9,035 $2,533 $1,349 33.8% 15.8% 1.8x 11.0x
Enterprise Value /
LTM LTM Margins LTM
Closing Price % of 52 Equity Enterprise
Company Ticker 6/30/16 Week High Value Value Revenue Gross Profit EBITDA Gross Profit EBITDA Revenue EBITDA
Caterpillar, Inc. CAT $75.81 89% $44,690 $77,554 $41,795 $8,932 $5,629 21.4% 13.5% 1.9x 13.8xDeere & Co. DE $81.04 83% $26,188 $60,826 $27,670 $6,264 $3,783 22.6% 13.7% 2.2x 16.1x
PACCAR, Inc. PCAR $51.87 78% $18,313 $23,548 $17,916 $2,852 $2,626 15.9% 14.7% 1.3x 9.0xCummins, Inc. CMI $112.44 85% $19,509 $20,399 $18,205 $4,673 $2,351 25.7% 12.9% 1.1x 8.7xAGCO Corp. AGCO $47.13 81% $3,971 $5,291 $7,250 $1,505 $579 20.8% 8.0% 0.7x 9.1x
The Toro Company TTC $88.20 98% $4,958 $5,145 $2,413 $871 $388 36.1% 16.1% 2.1x 13.3xOshkosh Corp. OSK $47.71 96% $3,589 $4,545 $6,102 $1,010 $478 16.5% 7.8% 0.7x 9.5x
Joy Global, Inc. JOY $21.14 60% $2,065 $2,911 $2,786 $651 $253 23.4% 9.1% 1.0x 11.5xManitowoc Co., Inc. MTW $5.45 28% $744 $1,006 $3,437 $833 $329 24.2% 9.6% 0.3x 3.1x
Average 78% $13,781 $22,358 $14,175 $3,066 $1,824 23.0% 11.7% 1.3x 10.4x
Median 83% $4,958 $5,291 $7,250 $1,505 $579 22.6% 12.9% 1.1x 9.5x
Enterprise Value /
LTM LTM Margins LTM
HYDE PARK CAPITAL Investment Banking | Mergers & Acquisitions | Capital Raising
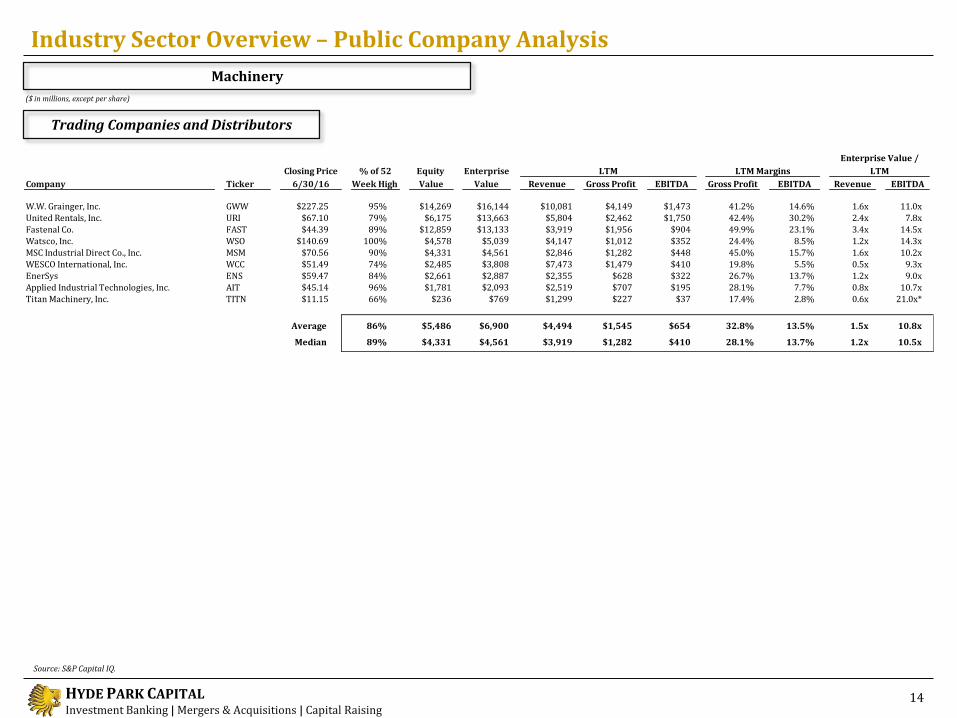
Industry Sector Overview – Public Company Analysis
Trading Companies and Distributors
($ in millions, except per share)
14
Machinery
Source: S&P Capital IQ.
Closing Price % of 52 Equity Enterprise
Company Ticker 6/30/16 Week High Value Value Revenue Gross Profit EBITDA Gross Profit EBITDA Revenue EBITDA
W.W. Grainger, Inc. GWW $227.25 95% $14,269 $16,144 $10,081 $4,149 $1,473 41.2% 14.6% 1.6x 11.0xUnited Rentals, Inc. URI $67.10 79% $6,175 $13,663 $5,804 $2,462 $1,750 42.4% 30.2% 2.4x 7.8x
Fastenal Co. FAST $44.39 89% $12,859 $13,133 $3,919 $1,956 $904 49.9% 23.1% 3.4x 14.5xWatsco, Inc. WSO $140.69 100% $4,578 $5,039 $4,147 $1,012 $352 24.4% 8.5% 1.2x 14.3x
MSC Industrial Direct Co., Inc. MSM $70.56 90% $4,331 $4,561 $2,846 $1,282 $448 45.0% 15.7% 1.6x 10.2xWESCO International, Inc. WCC $51.49 74% $2,485 $3,808 $7,473 $1,479 $410 19.8% 5.5% 0.5x 9.3xEnerSys ENS $59.47 84% $2,661 $2,887 $2,355 $628 $322 26.7% 13.7% 1.2x 9.0x
Applied Industrial Technologies, Inc. AIT $45.14 96% $1,781 $2,093 $2,519 $707 $195 28.1% 7.7% 0.8x 10.7xTitan Machinery, Inc. TITN $11.15 66% $236 $769 $1,299 $227 $37 17.4% 2.8% 0.6x 21.0x*
Average 86% $5,486 $6,900 $4,494 $1,545 $654 32.8% 13.5% 1.5x 10.8x
Median 89% $4,331 $4,561 $3,919 $1,282 $410 28.1% 13.7% 1.2x 10.5x
Enterprise Value /
LTM LTM Margins LTM

HYDE PARK CAPITAL Investment Banking | Mergers & Acquisitions | Capital Raising
Closing Price % of 52 Equity Enterprise
Company Ticker 6/30/16 Week High Value Value Revenue Gross Profit EBITDA Gross Profit EBITDA Revenue EBITDA
Iron Mountain, Inc. IRM $39.83 100% $8,451 $13,379 $3,009 $1,715 $904 57.0% 30.1% 4.4x 14.8x
Cintas Corp. CTAS $98.13 100% $10,975 $11,911 $4,777 $2,063 $918 43.2% 19.2% 2.5x 13.0x
KAR Auction Services, Inc. KAR $41.74 100% $5,888 $8,825 $2,752 $1,188 $672 43.2% 24.4% 3.2x 13.1x
Avery Dennison Corp. AVY $74.75 97% $6,920 $7,957 $5,924 $1,638 $712 27.7% 12.0% 1.3x 11.2x
R.R. Donnelley & Sons Co. RRD $16.92 89% $3,536 $6,863 $11,162 $2,454 $1,139 22.0% 10.2% 0.6x 6.0x
Copart, Inc. CPRT $49.01 98% $6,105 $6,668 $1,218 $547 $430 44.9% 35.3% 5.5x 15.5x
Pitney Bowes, Inc. PBI $17.80 82% $3,535 $6,141 $3,532 $1,999 $786 56.6% 22.2% 1.7x 7.8x
Corrections Corp. of America CXW $35.02 99% $4,125 $5,476 $1,814 $545 $446 30.0% 24.6% 3.0x 12.3x
The Brink's Co. BCO $28.49 81% $1,407 $1,731 $3,007 $568 $225 18.9% 7.5% 0.6x 7.7x
Average 93% $5,311 $6,947 $4,273 $1,375 $666 35.8% 19.4% 2.3x 10.8x
Median 97% $5,007 $6,766 $3,270 $1,413 $692 36.6% 20.7% 2.1x 11.7x
Enterprise Value /
LTM LTM Margins LTM
Closing Price % of 52 Equity Enterprise
Company Ticker 6/30/16 Week High Value Value Revenue Gross Profit EBITDA Gross Profit EBITDA Revenue EBITDA
Waste Management, Inc. WM $66.27 100% $30,048 $38,947 $13,097 $4,819 $3,462 36.8% 26.4% 3.0x 11.2x
Republic Services, Inc. RSG $51.31 100% $17,926 $25,469 $9,194 $3,549 $2,563 38.6% 27.9% 2.8x 9.9x
Stericycle, Inc. SRCL $104.12 69% $8,958 $12,144 $3,197 $1,424 $816 44.5% 25.5% 3.8x 14.9x
Waste Connections, Inc. WCN $72.05 97% $8,875 $11,044 $2,126 $942 $711 44.3% 33.4% 5.2x 15.5x
Rollins, Inc. ROL $29.27 96% $6,399 $6,268 $1,507 $761 $291 50.5% 19.3% 4.2x 21.5x
Covanta Holding Corp. CVA $16.45 75% $2,176 $4,491 $1,665 $526 $343 31.6% 20.6% 2.7x 13.1x
Clean Harbors, Inc. CLH $52.11 96% $3,029 $4,056 $3,179 $904 $484 28.4% 15.2% 1.3x 8.4x
Tetra Tech, Inc. TTEK $30.75 97% $1,847 $1,925 $1,749 $315 $191 18.0% 10.9% 1.1x 10.1x
Sims Metal Management, Ltd. ASX:SGM $5.83 65% $1,194 $913 $3,914 $440 $72 11.2% 1.8% 0.2x 12.7x
Casella Waste Systems, Inc. CWST $7.85 99% $320 $842 $555 $170 $95 30.6% 17.2% 1.5x 8.8x
Schnitzer Steel Industries, Inc. SCHN $17.60 82% $478 $678 $1,419 $176 $73 12.4% 5.1% 0.5x 9.3x
Average 89% $7,386 $9,707 $3,782 $1,275 $827 31.6% 18.5% 2.4x 12.3x
Median 96% $3,029 $4,491 $2,126 $761 $343 31.6% 19.3% 2.7x 11.2x
Enterprise Value /
LTM LTM Margins LTM
Industry Sector Overview – Public Company Analysis
Environmental and Facilities Services
($ in millions, except per share)
15
Industrial Services
Diversified Support Services
Source: S&P Capital IQ.

HYDE PARK CAPITAL Investment Banking | Mergers & Acquisitions | Capital Raising
Closing Price % of 52 Equity Enterprise
Company Ticker 6/30/16 Week High Value Value Revenue Gross Profit EBITDA Gross Profit EBITDA Revenue EBITDA
United Parcel Service, Inc. UPS $107.72 100% $97,083 $106,324 $58,804 $14,574 $9,964 24.8% 16.9% 1.8x 10.7x
FedEx Corp. FDX $151.78 88% $42,347 $47,994 $50,365 $14,457 $7,531 28.7% 15.0% 1.0x 6.4x
CH Robinson Worldwide, Inc. CHRW $74.25 98% $10,742 $11,532 $13,249 $1,233 $933 9.3% 7.0% 0.9x 12.4x
Expeditors International of Washington, Inc. EXPD $49.04 95% $9,210 $8,199 $6,358 $923 $750 14.5% 11.8% 1.3x 10.9x
Atlas Air Worldwide Holdings, Inc. AAWW $41.42 72% $1,027 $2,575 $1,796 $591 $363 32.9% 20.2% 1.4x 7.1x
Forward Air Corp. FWRD $44.53 84% $1,378 $1,411 $983 $250 $143 25.4% 14.6% 1.4x 9.8x
Hub Group, Inc. HUBG $38.37 87% $1,371 $1,311 $3,496 $432 $166 12.4% 4.7% 0.4x 7.9x
Average 89% $23,308 $25,621 $19,293 $4,637 $2,836 21.1% 12.9% 1.2x 9.3x
Median 88% $9,210 $8,199 $6,358 $923 $750 24.8% 14.6% 1.3x 9.8x
LTM
Enterprise Value /
LTM Margins LTM
Industry Sector Overview – Public Company Analysis
Air Freight and Logistics
($ in millions, except per share)
16
Transportation
Road and Rail
Source: S&P Capital IQ.
Closing Price % of 52 Equity Enterprise
Company Ticker 6/30/16 Week High Value Value Revenue Gross Profit EBITDA Gross Profit EBITDA Revenue EBITDA
Union Pacific Corp. UNP $87.25 88% $74,302 $87,328 $20,369 $10,436 $9,503 51.2% 46.7% 4.3x 9.2xCSX Corp. CSX $26.08 79% $25,245 $34,967 $11,042 $4,514 $4,514 40.9% 40.9% 3.2x 7.7x
Norfolk Southern Corp. NSC $85.13 86% $25,496 $34,408 $10,105 $4,028 $4,033 39.9% 39.9% 3.4x 8.5xKansas City Southern KSU $90.09 89% $9,793 $12,374 $2,361 $1,101 $1,135 46.6% 48.1% 5.2x 10.9xJB Hunt Transport Services, Inc. JBHT $80.93 90% $9,288 $10,234 $6,351 $1,275 $1,084 20.1% 17.1% 1.6x 9.4x
AMERCO UHAL $374.55 86% $7,339 $9,244 $3,314 $1,176 $1,247 35.5% 37.6% 2.8x 7.4xRyder System, Inc. R $61.14 65% $3,261 $8,795 $6,675 $1,503 $1,808 22.5% 27.1% 1.3x 4.9xGenesee & Wyoming, Inc. GWR $58.95 77% $3,437 $5,690 $2,045 $731 $573 35.7% 28.0% 2.8x 9.9xOld Dominion Freight Line, Inc. ODFL $60.31 81% $5,084 $5,199 $2,977 $898 $661 30.2% 22.2% 1.7x 7.9x
Landstar System, Inc. LSTR $68.66 93% $2,940 $2,875 $3,179 $700 $258 22.0% 8.1% 0.9x 11.1xWerner Enterprises, Inc. WERN $22.97 78% $1,665 $1,802 $2,045 $550 $355 26.9% 17.4% 0.9x 5.1x
Average 82% $9,355 $12,559 $5,009 $1,648 $1,567 32.0% 28.6% 2.4x 8.3x
Median 83% $6,211 $9,020 $3,246 $1,138 $1,109 32.8% 27.6% 2.3x 8.2x
LTM
Enterprise Value /
LTM Margins LTM

HYDE PARK CAPITAL Investment Banking | Mergers & Acquisitions | Capital Raising
Closing Price % of 52 Equity Enterprise
Company Ticker 6/30/16 Week High Value Value Revenue Gross Profit EBITDA Gross Profit EBITDA Revenue EBITDA
Kirby Corp. KEX $62.39 79% $3,386 $4,107 $2,019 $752 $544 37.3% 26.9% 2.0x 7.6x
Matson, Inc. MATX $32.29 61% $1,420 $1,881 $1,941 $375 $295 19.3% 15.2% 1.0x 6.4x
Rand Logistics, Inc. RLOG $1.03 31% $19 $224 $148 $42 $29 28.5% 19.5% 1.5x 7.8x
International Shipholding Corp. ISHC $0.30 4% $2 $111 $245 $46 $12 18.9% 4.8% 0.5x 9.3x
Average 44% $1,207 $1,581 $1,088 $304 $220 26.0% 16.6% 1.2x 7.8x
Median 46% $719 $1,053 $1,093 $211 $162 23.9% 17.3% 1.2x 7.7x
Enterprise Value /
LTM LTM Margins LTM
Industry Sector Overview – Public Company Analysis
Airlines
($ in millions, except per share)
17
Transportation
Marine
Source: S&P Capital IQ.
Closing Price % of 52 Equity Enterprise
Company Ticker 6/30/16 Week High Value Value Revenue Gross Profit EBITDA Gross Profit EBITDA Revenue EBITDA
American Airlines Group, Inc. AAL $28.31 60% $17,711 $32,337 $40,134 $14,137 $8,600 35.2% 21.4% 0.8x 3.8xDelta Air Lines, Inc. DAL $36.43 69% $28,434 $33,283 $40,307 $12,091 $8,352 30.0% 20.7% 0.8x 4.0x
Southwest Airlines Co. LUV $39.21 76% $25,565 $25,504 $20,333 $8,133 $5,670 40.0% 27.9% 1.3x 4.5xUnited Continental Holdings, Inc. UAL $41.04 66% $14,672 $21,593 $36,933 $13,918 $7,342 37.7% 19.9% 0.6x 2.9xAlaska Air Group, Inc. ALK $58.29 67% $7,350 $6,390 $5,733 $2,416 $1,781 42.1% 31.1% 1.1x 3.6x
JetBlue Airways Corp. JBLU $16.56 61% $5,669 $5,939 $6,541 $2,783 $1,658 42.5% 25.3% 0.9x 3.6xSpirit Airlines, Inc. SAVE $44.87 69% $3,211 $2,905 $2,217 $906 $578 40.9% 26.1% 1.3x 5.0xAllegiant Travel Co. ALGT $151.50 64% $2,513 $2,803 $1,303 $574 $481 44.0% 36.9% 2.2x 5.8x
Westjet Airlines, Ltd. WJA $16.24 78% $2,001 $1,852 $3,070 $1,524 $585 49.6% 19.1% 0.6x 3.2x
Average 69% $11,177 $12,534 $14,555 $5,293 $3,306 40.9% 25.9% 1.1x 4.1x
Median 68% $6,510 $6,165 $6,137 $2,600 $1,720 41.5% 25.7% 1.0x 3.8x
Enterprise Value /
LTM LTM Margins LTM
HYDE PARK CAPITAL Investment Banking | Mergers & Acquisitions | Capital Raising
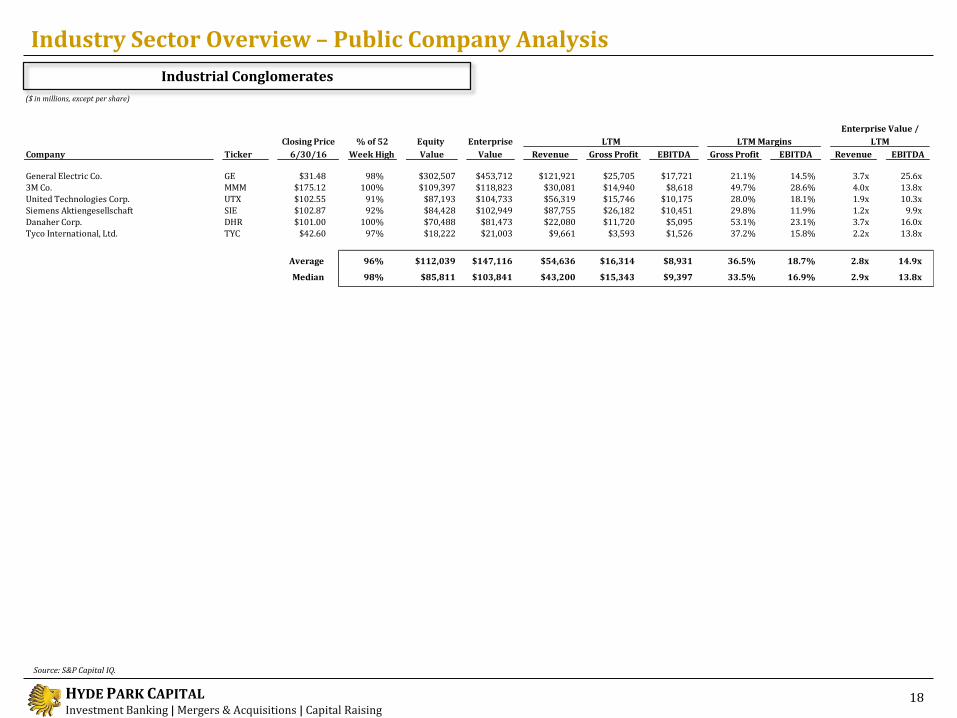
Industry Sector Overview – Public Company Analysis
($ in millions, except per share)
18
Industrial Conglomerates
Source: S&P Capital IQ.
Closing Price % of 52 Equity Enterprise
Company Ticker 6/30/16 Week High Value Value Revenue Gross Profit EBITDA Gross Profit EBITDA Revenue EBITDA
General Electric Co. GE $31.48 98% $302,507 $453,712 $121,921 $25,705 $17,721 21.1% 14.5% 3.7x 25.6x
3M Co. MMM $175.12 100% $109,397 $118,823 $30,081 $14,940 $8,618 49.7% 28.6% 4.0x 13.8x
United Technologies Corp. UTX $102.55 91% $87,193 $104,733 $56,319 $15,746 $10,175 28.0% 18.1% 1.9x 10.3xSiemens Aktiengesellschaft SIE $102.87 92% $84,428 $102,949 $87,755 $26,182 $10,451 29.8% 11.9% 1.2x 9.9x
Danaher Corp. DHR $101.00 100% $70,488 $81,473 $22,080 $11,720 $5,095 53.1% 23.1% 3.7x 16.0x
Tyco International, Ltd. TYC $42.60 97% $18,222 $21,003 $9,661 $3,593 $1,526 37.2% 15.8% 2.2x 13.8x
Average 96% $112,039 $147,116 $54,636 $16,314 $8,931 36.5% 18.7% 2.8x 14.9x
Median 98% $85,811 $103,841 $43,200 $15,343 $9,397 33.5% 16.9% 2.9x 13.8x
Enterprise Value /
LTM LTM Margins LTM
HYDE PARK CAPITAL Investment Banking | Mergers & Acquisitions | Capital Raising
Closing Price % of 52 Equity Enterprise
Company Ticker 6/30/16 Week High Value Value Revenue Gross Profit EBITDA Gross Profit EBITDA Revenue EBITDA
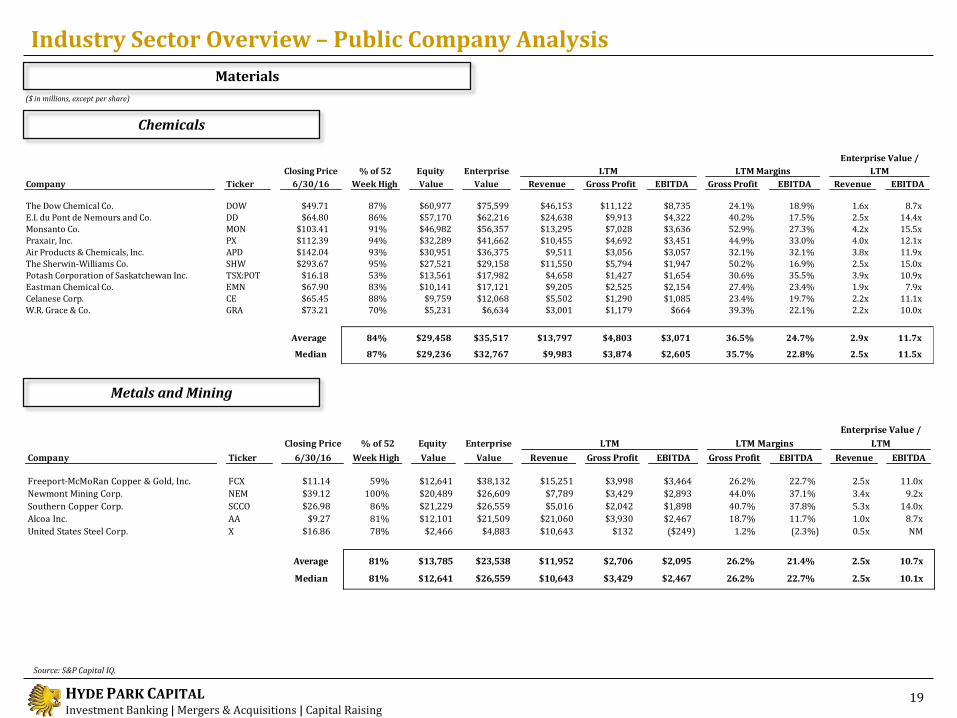
Freeport-McMoRan Copper & Gold, Inc. FCX $11.14 59% $12,641 $38,132 $15,251 $3,998 $3,464 26.2% 22.7% 2.5x 11.0x
Newmont Mining Corp. NEM $39.12 100% $20,489 $26,609 $7,789 $3,429 $2,893 44.0% 37.1% 3.4x 9.2x
Southern Copper Corp. SCCO $26.98 86% $21,229 $26,559 $5,016 $2,042 $1,898 40.7% 37.8% 5.3x 14.0x
Alcoa Inc. AA $9.27 81% $12,101 $21,509 $21,060 $3,930 $2,467 18.7% 11.7% 1.0x 8.7x
United States Steel Corp. X $16.86 78% $2,466 $4,883 $10,643 $132 ($249) 1.2% (2.3%) 0.5x NM
Average 81% $13,785 $23,538 $11,952 $2,706 $2,095 26.2% 21.4% 2.5x 10.7x
Median 81% $12,641 $26,559 $10,643 $3,429 $2,467 26.2% 22.7% 2.5x 10.1x
Enterprise Value /
LTM LTM Margins LTM
Industry Sector Overview – Public Company Analysis
19
Materials
($ in millions, except per share)
Chemicals
Metals and Mining
Source: S&P Capital IQ.
Closing Price % of 52 Equity Enterprise
Company Ticker 6/30/16 Week High Value Value Revenue Gross Profit EBITDA Gross Profit EBITDA Revenue EBITDA
The Dow Chemical Co. DOW $49.71 87% $60,977 $75,599 $46,153 $11,122 $8,735 24.1% 18.9% 1.6x 8.7x
E.I. du Pont de Nemours and Co. DD $64.80 86% $57,170 $62,216 $24,638 $9,913 $4,322 40.2% 17.5% 2.5x 14.4xMonsanto Co. MON $103.41 91% $46,982 $56,357 $13,295 $7,028 $3,636 52.9% 27.3% 4.2x 15.5xPraxair, Inc. PX $112.39 94% $32,289 $41,662 $10,455 $4,692 $3,451 44.9% 33.0% 4.0x 12.1x
Air Products & Chemicals, Inc. APD $142.04 93% $30,951 $36,375 $9,511 $3,056 $3,057 32.1% 32.1% 3.8x 11.9xThe Sherwin-Williams Co. SHW $293.67 95% $27,521 $29,158 $11,550 $5,794 $1,947 50.2% 16.9% 2.5x 15.0xPotash Corporation of Saskatchewan Inc. TSX:POT $16.18 53% $13,561 $17,982 $4,658 $1,427 $1,654 30.6% 35.5% 3.9x 10.9xEastman Chemical Co. EMN $67.90 83% $10,141 $17,121 $9,205 $2,525 $2,154 27.4% 23.4% 1.9x 7.9x
Celanese Corp. CE $65.45 88% $9,759 $12,068 $5,502 $1,290 $1,085 23.4% 19.7% 2.2x 11.1xW.R. Grace & Co. GRA $73.21 70% $5,231 $6,634 $3,001 $1,179 $664 39.3% 22.1% 2.2x 10.0x
Average 84% $29,458 $35,517 $13,797 $4,803 $3,071 36.5% 24.7% 2.9x 11.7x
Median 87% $29,236 $32,767 $9,983 $3,874 $2,605 35.7% 22.8% 2.5x 11.5x
Enterprise Value /
LTM LTM Margins LTM

HYDE PARK CAPITAL Investment Banking | Mergers & Acquisitions | Capital Raising
Industry Sector Overview – Public Company Analysis
20
Source: Capital IQ.
Materials
($ in millions, except per share)
Paper and Forest Products
Closing Price % of 52 Equity Enterprise
Company Ticker 6/30/16 Week High Value Value Revenue Gross Profit EBITDA Gross Profit EBITDA Revenue EBITDA
International Paper Co. IP $42.38 86% $17,649 $32,432 $21,566 $6,187 $3,069 28.7% 14.2% 1.5x 10.6x
Domtar Corp. UFS $35.01 82% $2,202 $3,379 $5,160 $1,064 $654 20.6% 12.7% 0.7x 5.2xResolute Forest Products, Inc. RFP $5.29 45% $476 $1,045 $3,567 $862 $265 24.2% 7.4% 0.3x 3.9x
Average 71% $6,776 $12,286 $10,098 $2,704 $1,329 24.5% 11.4% 0.8x 6.6x
Median 82% $2,202 $3,379 $5,160 $1,064 $654 24.2% 12.7% 0.7x 5.2x
Enterprise Value /
LTM LTM Margins LTM

HYDE PARK CAPITAL Investment Banking | Mergers & Acquisitions | Capital Raising
Member FINRA/SIPC
Recent Transactions
HYDE PARK CAPITAL Investment Banking | Mergers & Acquisitions | Capital Raising Integrity | Expertise | Results
Hyde Park Capital Advisors, LLC 701 N. Franklin Street
Tampa, FL 33602 Tel: 813-383-0202
www.hydeparkcapital.com
John Hill Senior Managing Director [email protected] (813) 383-0205 John McDonald Senior Managing Director [email protected] (813) 383-0206 Keith Hodgdon Managing Director [email protected] (813) 383-0208 Greg Bosl Vice President [email protected] (813) 597-2649 Jami Gold Vice President [email protected] (813) 383-0203 Jeffrey Hendricks Vice President [email protected] (678) 523-3073 Kenneth Burnside Business Development Officer [email protected] (864) 905-9633
has been acquired by
a portfolio company of
has been acquired byhas been acquired byhas been acquired by
has been acquired by
a part of
MTS Markets International Inc.
has been acquired by
has been acquired byhas been acquired by Sell-side Advisory
*Confidential Transaction
Third-Party
Logistics Provider
Hyde Park Capital Advisors, LLC
has been acquired by
has been acquired byhas been recapitalized by
Minera del Norte S.A. de C.V.
has been recapitalized by
&
has been acquired by
has been recapitalized by
& Strategic Buyer