powder metallurgy science ch 1-ch 2
TRANSCRIPT
gyallurgy to111ologil:al
POWDER METAlLURGY SCIENcr
:('Chapter One·Introduction to Powder Metallurgy
Frame of Reference
Among the various metalworking techno logics. powder metallurgy is the most diversemanufacturing approach. One attraction of powder metallurgy (P/M) is Ihc ability to fab-ricatc high quality, complex parts to close tolerances in an economical manner. Inessence. P/M takes a metal powderwith specific attributes of size. ~hape_ and packing,then converts it into a strong. precise. high performance shape. Key steps Include tllc
. shapingor compaction of the powdcr and the subse uent thermal bondi I of the articlesby sintering. e pr cess effectively uses automated operations with low relative energyconsumption, high material utilization. and low capital costs. These characteristics makeP/M well aligned with current concerns about productivity. energy. and raw materials.Consequently, the field is experiencing growth and replacing traditional rnetalformingoperations. Further. powder metallurgy is a flexible manufacturing process capable ofdelivering a wide range of new materials. microstructures. and properties. That createsseveral unique niche applications for P/M such as wear resistant composites.
This book provides an introduction to the scientific principles behind powder metal-lurgy. One primary audience is the student becoming acquainted with P/M as a process-ing science. Additionally, the engineer involved in powder metallurgy cap also benefitfrom this text. Frequently. empirical observations go unexplained and processes remaininefficient because of an inadequate understanding. This book provides a logical presen-tation of underlying basics without dwelling on the technological specifics covered indetail elsewhere.'. The P/M process relies on a different philosophical approach to component fubrica-
, . tion than is encountered in traditional metalworking. Specifically. the versatility of P/Mgives an expanded latitude to the processing-of-materials: Material chemistry, heat treat-ment, and microstructure are variable, and the distribution of phases and microcon-stituents (including porosity and. reinforcing phases) is controllable. .
Theapplications of P/M are quite extensive. 'Several examples will be developed.throughout this text; however, as an introductory illustration of the diversity, consider theu~~ of metal powders in the fabrication of tungsten lamp filaments. dental restorations.od-Iess' beilrings, automotive transmission gears, armor piercing projectiles, electricalContacts, nuclear power fuel elements. orthopedic implants. business machine parts.high-temperature fihers, aircraft brake pads. rechargeable batteries. 'Intl jet engine COIll-
16
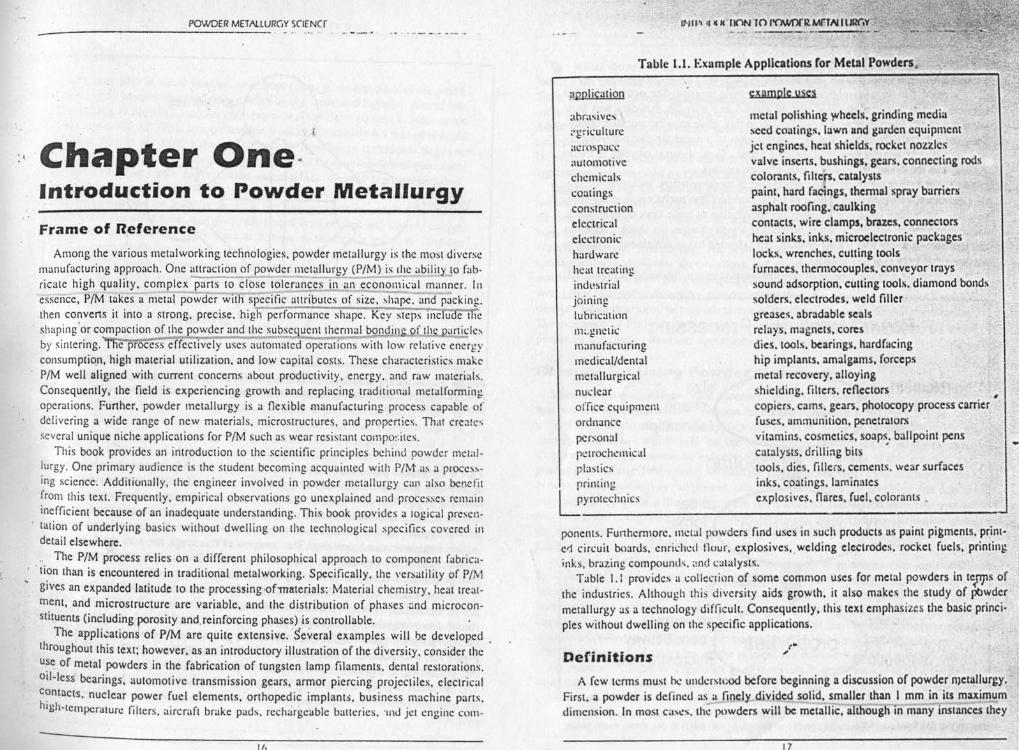
Tallie 1.1. Example Applications for Metal Powders.
;lPDlication example uses
metal polishing wheels, grinding-mediaseed coatings. lawn und garden equipmentjet engines. heat shields, rocket nozzlesvalve inserts. bushings. gears, connecting rodscolorants, filters, catalystspaint. hard facings, thermal spray barriersasphalt roofing. r.aulkingcontacts, wire clamps, brazes, connectorsheat sinks. inks, microelectronic packageslocks. wrenches, cutting toolsfurnaces. thermocouples. conveyor trayssound adsorption, cutting tools, diamond bondssolders. electrodes, weld fillergreases. abrudable sealsrelays, magnets, coresdies, tools, bearing'. hurdfucinghip implants. amalgams, forcepsmetal recovery, alloyingshielding. filters. reflectorscopiers. cams, gears. photocopy process carrierfuses. ammunition, penetrarorsvitamins, cosmetics. soaps. ballpoint penscatalysts, drilling bits 'tools, dies. fillers. cements. wear surfacesinks. coatings, laminatesexplosives. flares, fuel. colorants.
abrasives;'gril:ulture;1\:roSp;IC~automotivechemicalscoatingsconstructionelectricalelectronichardwareheat treatingindustrialjoininglubricationm..gncticmanufacturingmedical/dentalrnctullurgicalnuclearoffice equipmentordnancepersonalpetrochemicalplasticsprinting
~yrotcchnics
ponents. Funhcrruorc. metal powders find uses in such products us puint pigments, prim-cd circuit boards, enriched [lour, explosives., welding electrodes. rocket fuels, printinginks. brazing compounds. ;!nd catalysts.
Table 1.1 provides a collection of some common uses for metal powders in tep]'s ofthe industries. Although thi; diversity aids growth. it also makes the study of powdermetallurgy as a technology difficult. Consequently, this text emphasizes the basic princi-pies without dwelling on the specific applications.
PefinitionsA few terms must he understood before beginning a discussion of powder metallurgy.
First. a powder is defined as a finely divided solid, smaller than 1 mm in its maximumdimension. In most cases, the powders will be metallic, lilt ough in many instances they
17

I
I
,I
-POWDER METALLURGY SCIENCE
arc combined with other phases such as ceramics or lymcrs. An important charactcris-lie of a powde.r i~ its relatively high surface area to volume ratio. The particles exhibitbehavior t~at IS intermediate between that of a 011 and a liq I • Powders will flowunder gravity to fil~ con~ainers or die cavities. so in t IS sense they behave like liquids.They ar~ com~resslble like. a gas. But the compression of a metal powder is csxcntiillyIrreversible. like the plastic deformation of a metal. Thus. a metal powder is casilvshaped. with the desirable behavior of a solid after processing. .. P?wder metall~rgy. is the study of the processing of metal powders. including the lab-
neutron. charactenzat.,on. and conversion of metal powders rnto useful engineering com-ponents. The .processmg sequence involves the application of basic laws of heat. work.and defonnallon to the powder. It is the processing which changes the shape. propertiesand structure of a powder into a final product. An extended list of definitions relating topowder metallurgy is given in Appendix A.
The three main steps in the scheme of powder metallurgy are illustrated in Figure 1.1.
Powder Metallurgy Processing
microstructurechemistry
packing
sizeshape
fabrication
sinterforge
hot press
densityductility
magnetic
strengthconductivity
microstructure
Agu~e 1.1. Th~ conceptual flow for powder metallurgy from the powder through the pro-cessing to the final product. Example concerns are given for each of the three main steps.
18
INllo.'OtlU<11\ IN 1111'1\\11 II I.: MUALttJlo.'t.Y----------------------- -----------------------~.
powders chemistry
Figure 1.2. A tetrahedron illustrating the interdependence between several aspects 01P/M. including the alloy chemistry. powder characteristics. processing variables. and linalproduct performance.
,First is the general area labeled "powder tccluiology" which is concerned with the natureof powders. Emphasis is given to ihc Iabric.uion. classification. characterization. andhandling of powders. Secondary concerns arc with the sampling. safety. packu!;ing. andtransportation. Examination of a powder for <ize and shape arc common and imponantactiviti~s in the field of powder technology. Traditional powder consolidation activitiesinclude compaction and sintering. The concerns :It this stage are with the forming anddensification of the powders. Finally, the conceptual now turns to an emphasis on thefinal properties. with concomitant uucruion to product microstructure.
Students cannot separate the three activities. Decisions concerning the powder typeand its fabrication influence the case ul' compaction and sinicring. Likewise. the type ofconsolidation sequence applied to a powder will affect the final compact properties and . i:specific property goals require attention to the powder, processing. and chemistry. InFigure 1.2. a tetrahedron is used to represent the interdepe¢ence of the chemistry. pow- "der, processing. and properties. Conceptually. this book follows the flow chart in Figure1.1. Emphasis is given to describing the effects of the many process variables. includingthe relations between powder characteristics. ease of consolidation. and final compactpropert ies.
1'1
'.
01(i final
nature
~
and&.and
nantlivitiesng andon the
r typeypc ofes and, . \:
stry. In• pow-Figureluding
ompact
":'.
POWDER METAlLlJRC,y \('n.NC I I.
Brief History The initial interest in powder metallurgy grew from an expanding materials base,forming the common elements like copper and,iron by a new. lower cost t~hnology.Sir.ce the 1940·s. several less common materials have been processed fro!" powders.incluJing the refractory metals and their alloys (Nb, W. Mo. Zr. TI. and Re).Additionally. the structural metals have come through a _major growth during the. ~etime period. The majority of the structural powder-produced parts ~re .ba5ed on I~~':\.:.....Hcwevcr, several compositions tailored for nuclear, aerospace, eicctn.clli. and magnetl~ .. ' .applications arc processed by P/M techniques, ., .. . . '. . '
Equally exciting has been the evolution in applications. The spint 10 DpplylO~ PIM.has undergone a recent change. Initially. powder-based components were selected Simplyfor .heir low costs. More recently, the basis for selecting D powder metallurgy route hasbeen associated with improved quality, homogeneity. or properties. coupled with, an -: .attractive cost and productivity. The high temperature nickel-balled lIu~ralloys: highspecific stiffness aluminum aircraft alloys. and. cOOlroll~d thermal expansron alumlO~m-,.matrix composites offer gnod examples of this evolution. Not only, can they be mad.e, i .with h:ller material economy hy powder approaches. but new and Improved cornpon-rions arc being developed to take advaruagc of the chemistry an~ microst~cture con~rol.The expansion or P/M prll\:e~sillg into areas requiring high quality materiuls and uruqueproperties will creat~ even more opportunities in the future.
The very early uses of metal powders have been traced to several parts of the world.: \ .: For example. gold powder was fired 0010 jewelry by the Incas. and Egyptian uses of iron
powder date back to 3000 Be. Another early example is the Delhi column in India whichdates from about 300 AD. This column is made from approximately 6.5 tons of reducediron powder. During the 1800's the use of powder metallurgy techniques began inearnest: The need for platinum laboratory apparatus led to the development of chemicallyprecipitated powder and new consolidation routes which avoided high tempe:atures.Such activities occurred in both Russia and England where precipitated powders werehot-worked to overcome the inability to obtain the high temperatures needed for castingplatinum. About this same time. coins were fabricated from pressed and sintcrcd copper.silver. and lead powders. The modern era of powder metallurgy is traced to Coolidgewho used' tungsten powder to develop a durable lamp filament for Edison. Subsequently.cemented carbides, porous bronze bearings, and copper-grnpbue electrical Contacts weredeveloped in the 1930·s. By the 1940·s. P/M was involved in the fabrication of newtungsten alloys, ferrous structural alloys, and refractory metals.
Reasons for Using Powder Metallurgy
Many auributcs contribute III the succe~s of P/M. Three overlapping categ?ries dom!~,narc '1I1U nrovide an introductory concept lor the use of powder metallurgy. Figure 1.3 1\
a venn d'iag '1111 showing how the upplications for .P/M can be c~tegoriztd. First are the .many applications which rely on the economical production of ~omplex part~ ..Components Ior the automotive industry represent good exa~ple!i of this area .and theirproduction is a large rIM activity. Within the area o.f economical parts. ~roductlon comecr nccrns with productivity. tolerances. and aurornauon. Both th~ precls~on and cOlit.nrevery anracrive , while with cuxung there are problems associated with .se~regallon,machining. and maimaining final tolerances. Prealloyed powders allow fabflcat.'on bcl~wthe melting temperature. Thiv eliminates segregation and other defects associated With
casting. '. if .As Figure 1.3 shows. there arc also unique property or micr~structu~ Just~ Icall~ns
Ior using P/M approaches. Some examples include porous metals. OXide d.'spemonstrengthened alloys. ccrrncts (ceramic-metal composites). and c~mented carbl~es.9'heinability [0 fabricate these unique microstructures by other techOlque.s has contributed ~large pan to thegrowth of riM. The final cir~le sho~n on the ~enn.dlagram correspondsto captive applications. These arc the materials which are quue difficult to .process.byother techniques. Ideal examples arc the react~ and refractory metals for which meLl1ngis not practical. Another emerging group of materials is amorphous or glassy met~ls. 10many cases. it is desirable to form a powder and develop low temperature processmg toavoid the microstructural damage accompanying elevated temperatures. Powder metal-
, .~
Edison demonstrated his basic incandescent filament bulb system for lighting in1879. For the technology to grow he required an inexpensive and durable filamentmaterial resistant to repeated heating cycles. His early choice was carbonized nat-ural fiber. These efforts built on earlier work in England that used platinum fila-ments in evacuated glass containers. But by the late 1800's the efforts to find adurable lamp filament 'had largely focused on carbon filaments with various treat-ments to increase the optical output. By 1905. Whitney had optimized metallizedcarbon filaments with outputs of 4 lumens per watt. At this time the investigationturned to the refractory metals. first tantalum and then tungsten. The first tungsten
' lilal~ent was produced from powder mixed with an organic binder that alloweds~apmg by binder-assisted extrusion. The binder.-wns.burned off and the particlessmtered to make a fragiie filament. The output was 8 lumens per wall. twice thatof. the carbon filaments. In 1910. Coolidge developed ductile tungsten filamentsu~mg tungs(en powder and controlled deformation processing. Tungsten allowed a~Igher operatin~ temperature and gave more light in contrast to the other options.n 1937. the coiled filament was developed and in 1959 halogen W;JSadded to
regenerate the coil during operation. Today. I kg of tungsten powder produces150.000 filaments for 40 W bulbs, each giving approximately 1000 h of life withan outPUt approaching 13 lumens per watt. However. the life of the tungsten fila-ment may be ending: New clcctrodeless lamps that operate at 13.56 MHz usingquartz arcs have de . .
monstrated efficiencies of 135 lumens per watt.~
,,
70 11

I'OWOLU METAlLU/~(jY ~LlINU
Economiccostprecisionproductivity(example: automobile gears)
Uniquealloysmicrostructurescomposites(example: stainless steel
filters)
CapUverefractoryreactive(example:
Ideal Applications(example: porous tantalum capacitors)
Agure 1.3. The three main reasons for using powder metallurgy are shown in the form ofa VeM diagram. The Intersection of the circles represents an ideal area for applying pow-der metallurgy In the future.
lurgy techniques are attractive since all of the processing can be performed in the solidstate. .
Usually elements from all three categories exist in most P/M applications. Indeed. themajor growth and expansion will most likely come from further combinations of eco-nomic, captive, and unique aspects in. forming unique.low-cost. high quality products.
. '
The Future of POWder Metallurgy
The past successes of P/M have come from the economic benefits. evident in ••nclysisof the volume of powder used for several material systems. A relative comparison ofpowder production qua~tities is given in Figure 1.4. This normalized plot shows thatcommon e~gineering systems constitute the largest use segment. relying on the lowestcost matenals. More recently, the unique and difficult-to-process materials have con-triOO.tedto the .expansion in the tech~ol~gical base. The same attributes are expected tocontinue merging to form new appltcattons for powder metallurgy. Six areas hold .henece.ssary ingredients for continued growth: I) High volume production of precise. highquality structural.parts from felTOUSalloys. 2) Consolidation of high performance rnateri-
"als. where full density and reliability are primary concerns. 3) Fabrication of difficult-to-process materials. wbere fully dense high perfonnance alloys can be fabricated with uni-
22
IN II/UUL}( II! ,,~ II I I', IWUlIl MlIl\J I UIIGY
iron and steel
aluminum
copper
nickel
tungsten
stainless steel
tin
relative production
Figure 1.4. A comparison of the relative production for some common metal powders.Note the logarithmic scaling and dominant role of iron and steel.
fonn microstructures, 4) Economical consolid.uion of specialty alloys. typically compos-ites containing mixed phases; these will often be fabricated by enhanced dCllsificat.iollprocesses. 5) Synthesis of nonequilibrium materials such as a~lOrphous. microcrystalline.or metastable alloys. 6) Processing of complex paris with unique ingredients or UIlCOIll,man shapes.
There are many industrial and consumer materials that arc available <ISpow-ders. They include minerals. cereals. coffee, and metal powders. On a tonnagebasis. metal powders are a relatively small activity when compared to commonpowders such as sand andccrcnl=Tbc worldwide consumption of met~1 po.wdersamounts to approximately 109 kg/ye<lr. Industrial minerals .con~umptlon IS l?8_.times larger. and even coffee. tea. and tobacco consumption tS at least 10kg/year. Of the metal powders. thc majority are iron r~nd stee.1. As illustrated inFigure 1.4 on logarithmic scaling. those amount to nearly 10 times thc consump-tion of aluminum powder. which is. approximately twice that of copper powder,which in turn is approximately twice that of nickel powder. and so on .
..,
K.volpp.
....
S..
1.1the
1
I powders,
I)' C~111POS'
msli rcat lOll
crystalline.or 1IIlCOIl1·
us pow.tonn'IIge[ommonoWdersis 300
st 10 10,rated inDilsump.powder.
POWDER METAllURGY SCIENCE
" ''.Powder metallurgy is in a prolonged, if not steady. growth phase. The use of metal
powders continues to expand and the field is growing faster than other metalworkingtechnologies. Moreover, the need for trained personnel is growing even more rapidlybecause of the diverse and difficult applications being developed for PIM processing. .
The feedback from design engineers indicates that as knowledge about PIM expandsthere will be 'many more applications. The majority of the current uses relies on econom-ical net-shape processing. The future promises more challenges with the combination ofcost savings and factors such as reliability, quality. strength, dimensional control. andunique shaping capabilities. Widespread appreciation of these advantages will provideboth economic and technological growth opportunities. Research using metal powdersoffers hope for even more diverse applications, including rapidly solidified magnetic
, alloys. new aircraft alloys. improved metal matrix composites, and ultra-high strengthstructures involving very small scale microstructures.
Suggested References
K. J. Anderson, "Materials for Incandescent Lighting: 110 Years for the Light Bulb."MRS Bulletin, 1990, vol. IS, no. I, pp. 52-53.
,F. Clark, Advanced Experimental Techniques in Powder Metallurgy, Rowrnan andLittlefield. New York, NY. 1963, pp.I60-163.
C. G. Goetzel, Tre~iise On Powder M~fall~i'~~~"f~ur '~~'I~;"es. Interscience Publishers.New York, NY. 1949.
H.H. Hausner and M. K. Mal, Handbook of Powder Mmllurgy, second edition.Chemical Publishing Co., New York, NY, 1982.
L Jenkins and J. Y. Wood (eds.), Powder Metallurgy: An Overview. The Institute ofMetals. London, UK. 1991.
W. D. Jones, fundamental Principles of Powder Metallurgy, Edward Amold Publishers.London, UK. 1960.
E. ~Iar (ed.), fowder Metallyrgy: Applications. Advantages, and Limitations, AmericanSociety for Metals. Metals Park. OH, 1983. ,
F. Y. Lenel, fowder Metallyrgy Principles and Applications, Metal Powder IndustriesFederation, Princeton, NJ, 1980. '
K. H. Roll, "History of Powder Metallurgy," Powder Metallurgy. E. Klar (ed.),vol. 7, ninth edition of Metals Handbook ASM International Materials Park OH 1984pp. 14-20. '" , .
StUdy' QUestions",,, 1.1. The Uses for met I d
th diff a POWers range from the very sophisticated to mundane. Considere I erent properties sought for aluminum powder for use in rocket fuels and aircraft
24
wing structures. Contrast the expected powder requirements (or these two nelda.
1.2. ?owder metallurgy contributes to a range of automcdveeompceeau, Identify onesuch component and give the chief performance requlrements (check Table 1.1 andChapter Eleven for ideas).
1.3. Consider the alternatives to powder metallurgy for the tabricalion of lamp filaments :"from tungsten. Why are fusion techniques not applied to Ihis product? : ' "
IA. Powder metallurgy was once known as "metal ceramics." What similarities with ' 'ceramic processing does this name suggest?
1.5. What are some of the key differences between ceramic and metal powders and howmight these differences influence processing?
1.6. One of the challenges of PIM processing is to minimize tooling costs, especially din- ,ing product development efforts. The need is to reduce errors in the construction of pro-duction tooling to ensure final dimensions and properties meet specifications. What stepsmight help to minimize pre-production tool costs?
1.7. In spite of a low melting temperature (232·C). tin is widely used as a powder.Identify some possible applications for tin powders. '
1.8. Give <I short definition of powder metallurgy in lay terms and embellish this defini-tion in engineering terms.
1.9. Metal powders exhibit fluid-like behavior. Identify a common object or product that •relies on this attribute.
1.10. Metal matrix composites. such as aluminum reinforced with silicon carbidewhiskers. are a new application area for PIM. Identify and explain some of the concerns •.associated with' the fabrication of such materials. ,.:.
~. • ,1'
r ~\ .
.,.,
25
II,i,
. ,.. ,
",
POWf)F.R MFTt'J ItJR(,y mrN(J
Chapter !".!~__,.Powder Characterization
-I "
ConceptsAll powder processing starts with a powder; therefor~; one must understand the nature
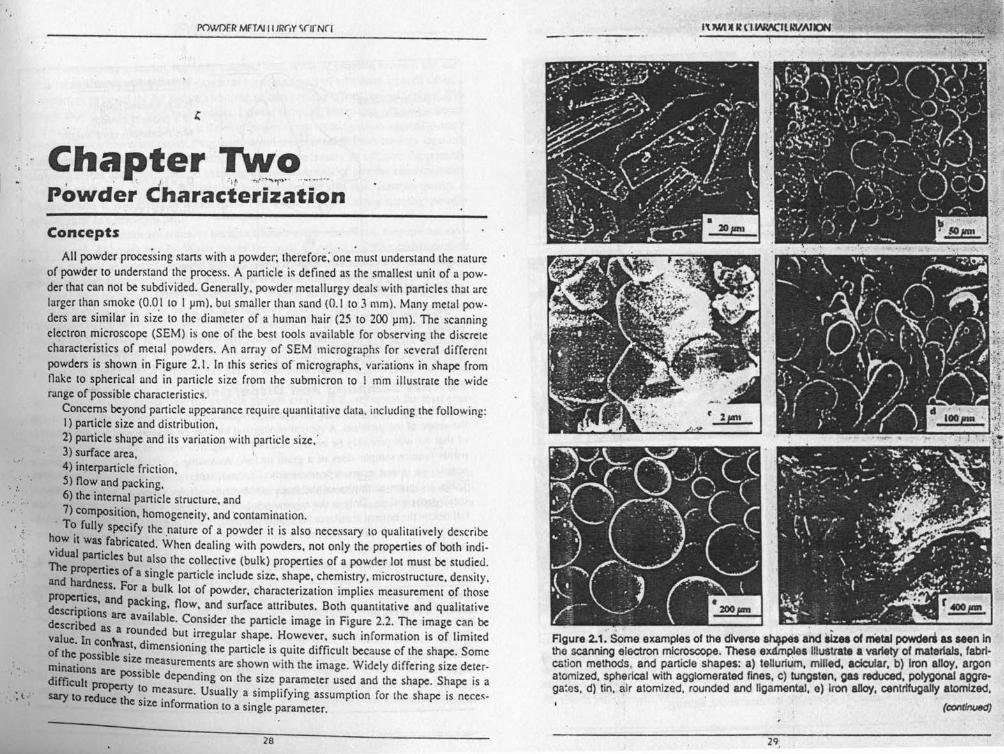
of powder to understand the process. A particle is defined as the smallest unit of a pow-der that can not be subdivided. Generally. powder metallurgy deals with particles that arclarger than smoke (0.0 I to 1 urn), but smaller than sand (0.1 to 3 mm). Many metal pow-ders are similar in size 10 the diameter of a human hair (25 to 200 urn). The scanningelectron microscope (SEM) is one of the best tools available for observing the discretecharacteristics of metal powders. An array of SEM micrographs for several differentpowders is shown in Figure 2.1. In this series of micrographs. variations in shape fromflake to spherical and in particle size from the submicron to I mm illustrate the widerange of possible characteristics.
Concerns beyond particle appearance require quantitative data. including the following:I) particle size and distribution.2) particle shape and its variation with particle size.'3) surface area.4) interparticle friction.s) now and packing.6) the internal particle structure. and7) composition. homogeneity. and 'Contamination .
. T~ fully specify the ,nature of a powder it is also necessary .to qualitatively describeh?w It was. fabricated. When dealing with powders. not only the properties of both indi-Thee, partl~les but also the collective (bulk) properties of a powder lot must be studied.
; ~ropertles of a single particle include size. shape. chemistry. microstructure. density.an ~ness. For a bulk lot of powder, characterization implies measurement of those
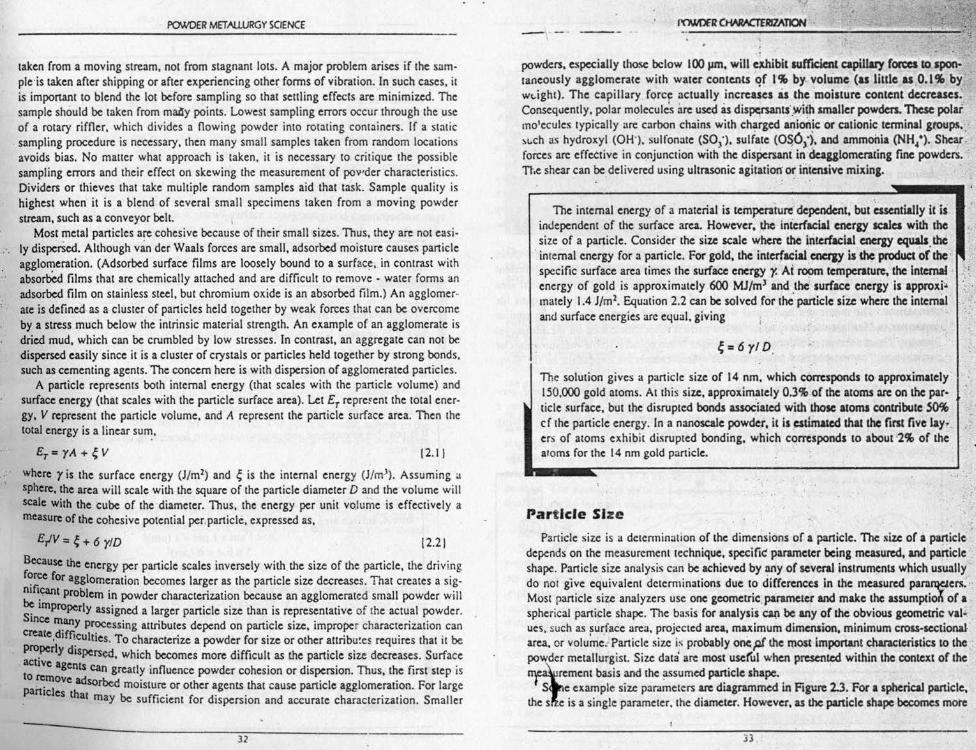
dPro~nl~s, and packing, now, and surface attributes. Both quantitative and qualitativeescnpllons are av '1 bl C' .... .d'bed al a e. onsider the particle Image 111Figure 2.2. The Image can beescn as a rou d db' Ivalue I ~ e ut irregu ar shape. However, such information is of limited
of th~ n c~~~.t, dimensioning the particle is quite difficult because of the shape. Somemin t·poSSI e size. measurements are shown with the image. Widely differing size deter-
a Ions are POSSIble d dl ,difficult epen mg on the Size parameter used and the shape. Shape is asary to r~~:;:;t~ m~asure. Usually a simplifying assumption for the shape is neces-
e Size II1formation to a single parameter.: t,,·
28
1\ l'NIll Il nWW:llNIIAJION', ,
FIgure 2.1: S<;~e examples of the diverse 6~ a~ Iizes of metal powde'* u seen Inthe scanning eiectron microscope. These exMIpiea Illustrate. variety of materials, fabrl·cation methods, and particle shapes: a) tellurium, milled, acicular, b) Iron alloy, argonatomized. spherical with aggtomerated fines, c) tungsten, gas reduced, polygonal aggre-ga!es, d) tin. air atomized. rounded and IIgamental, e) Iron alloy, centrifugally atomized.
'. ,
(COfIt1nuftd)
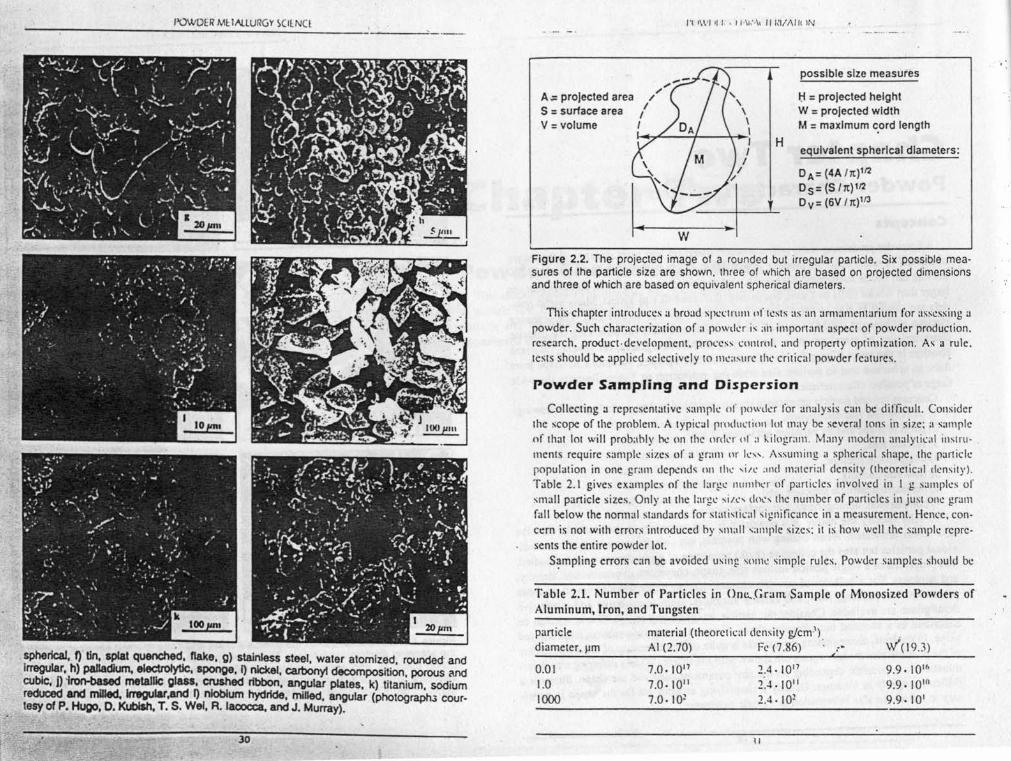
POWDER MI: IN..LURGY SCllNCl
spherical, f) tin, splat quenched, flake, g) stainless steel, water atomized. rounded andIrregular, h) palladium, eIecttoIytIc, sponge, I) nickel. carbonyl decomposition, porous andcubic, D 'Iron-bued metallic glass, CN5hed ribbon, angular plates. k) titanium. sodiumreduced and milled, lrreguIar,and I) niobium hydride, milled, angular (photograptu cour-tesy of P. Hugo, D. KubIah. T. S. WeI, R. iaeecea, and J. Murray).
30
1'( 'WI '1 I . 11·\1,··\, 111.'11/\111 IN
I:i = projected heightW = projected widthM = maximum cord length
equivalent spherical diameters:
0A= (4A/7t)1120s= (S /7t)1120v= (6V /7t)1f3
possible size measures
A ~ projected areaS = surface areaV = volume
H
Figure 2.2. The projected image of a rounded but irregular particle. Six possible mea-sures of the particle size are shown. three of which are based on projected dimensionsand three of which are based on equivalenl spherical diameters. .
This chapter introduces a hroad spectrum IIr tests as an armamentarium for asscssing apowder. Such characterization of a powder is an important aspect of powder production.research. product. development. process control. and property optimization. As a rule.tests should be applied selectively to measure the critical powder features.
Powder Sampling and Dispersion
Collecting a representative sample of powder tor analysis can be difficult. Considerthe scope of the problem. A typical production lot may be several tons in size: a sampleof that lot will probably he on the order IIf ;1 kilogr.un. Many modem analytical insuu- .mcnts require sample sizes or a gram or k". Assuming a spherical shape. the particlepopulation in one gram depends on the ,i/e .md material density (rhcorcucal density).Table 2.1 gives examples or the large number of panicles involved in I g samples orsmall particle sizes. Only at the laq;e silL" doc the number of particles in just om: grarnfall below the nonnal standards for stati\ticrl siguificance in a measurement. Hence, con-cern is not with errors introduced by small \al11ple sizes: it is how well the sample repre-sents the entire powder lot.
Sampling errors can be avoided using xomc simple rules. Powder samples should be
Table 2.1. Number of Particles in Olll\.,'c; ram .Sarnple of MunosizedAluminum, Iron, and Tungsten
Powders of
particle material (theoretical density glcm ')diameter. um AI (2.70) Fe (7.86) _.
<vt(19.3)
0.011.0
1000
7.0.1017
7.0.1011
7.0· 10~
9.9·10Ih
9.9·10'fl
9.9· 101
2.4. 1017
2~~. 10"2.4· 10~
Pissosas
(',
eters:
Ie mea-ensicns
ssing <J
uction,a rule.
msider;amplemxtru.articlensily).rl..:s oft gr<J1ll
POWDER METALlURGY SCIENCE
, ,'.
taken from a moving stream, not from stagnant lots. A major problem arises if the sam-pleis taken after shipping or after experiencing other forms of vibration. In such cases, itis important to blend the lot before sampling so that settling effects are ·minimized. Thesample should be taken from maay points. Lowest sampling errors occur through the useof a rotary riffler, which divides a flowing powder into rotating containers. If a static
. sampling procedure is necessary, then many small samples taken from random locationsavoids bias. No matter what approach is taken, it is necessary to critique the possiblesampling errors and their effect on skewing the measurement of powder characteristics.Dividers or thieves that take multiple random samples aid that task. Sample quality ishighest when it is a blend of several small specimens taken from a moving powderstream, such asa conveyor belt.
Most metal particles are cohesive because of their small sizes. Thus, they are not easi-ly dispersed. Although van der Waals forces are small, adsorbed moisture causes particleagglomeration. (Adsorbed surface films are loosely bound to a surface, in contrast withabsorbed films that are chemically attached and are difficult to remove - water forms anadsorbed film on stainless steel, but chromium oxide is an absorbed film.) An agglorner-ate is defined as a cluster of particles held together by weak forces that can be overcomeby a stress much below the intrinsic material strength. An example of an agglomerate isdried mud, which can be crumbled by low stresses. In contrast, an aggregate can not bedispersed easily since it is a cluster of crystals or particles held together by strong bonds.such as cementing agents. The concern here is with dispersion of agglomerated particles.
A particle represents both internal energy (that scales with the particle volume) andsurface energy (that scales with the particle surface area). Let Er represent the total ener-gy, V represent the particle volume, and A represent the particle surface area. Then thetotal energy is a linear sum,
e; = YA + ~ V (2.1 1
where r is the surface energy (J/m2) and ~ is the internal energy (JIm"). Assuming asphere, the area will scale with the square of the particle diameter D and the volume willscale with the cube of the diameter. Thus, the energy per unit volume is effectively ameasure of the cohesive potential per. particle, expressed as,
EIV = ~ + 6 rID [2.21
~ecause the energy per particle scales inversely with. the size of the particle, the driving~~ for agglomeration becomes larger as the particle size decreases. That creates a sig-
: ~cant problem in powder characterization because an agglomerated small powder wills' Improperly assigned a larger particle size than is representative of the actual powder.
ince ~any processing attributes depend on particle size, improper characterization cancreate,dlffiCulties. To characterize a powder for size or other attributes requires that it beprot.perlydispe~, which becomes more difficult as the particle size decreases. Surface
. ac rve agents can I' f1 d hesi di . Th th - .to great y in uence power co esion or ispersion. us, e nrst step IS
pa~~ove adsorbed moisture or other agents that cause particle agglomeration. For large. ICes that may be sufficient for dispersion and accurate characterization. Smaller
. : l.:·
32
~.-.
powders, especially those below lOO..,n, will ~ibit suffICient capillary rorc:cs to.lpan-.raneously agglomerate with water contenu of t~ by. volume (as liule as O.l~ by':weight). The capillary forcf actually increases as the meinure content decreases.Consequently, polar molecules are used udis~rsant(with smaller powders.. These polar.mo'ecules typically <Irecarbon chains with charged anwn'icor cationic terminal gtoups.·scch as hydroxyl (OH·). sulfonate (SO)'). sulfate (O~O):). andl1:Jllmonia (NH/). Shear: 'forces are effective in conjunction with the disPersant indeagglomenuing fine powders. ..The shear can be delivered using ultrasonic agitation ~ intensive mixina.
The internal energy of a material is temperature' dependent, but ~tially ilisindependent of the surface area. However, ,!,he interfacial coeri)' ~CI with thesize of a particle. Consider the size scale where ihc i~terflClal enctJ)' eqUJ:ls.thC
'.internal energy for a particle. For gold, the interfacial enc:raY is ~ product or the·specific surface area times the surface energy .r. At room temperature, the internal r
energy of gold is approximately 600 MJ/m'
and the surface energy is approxi~mately 1.4 11m2. Equation 2.2 can be solved for the' particle size where the internal'and surface energies are equal. giving
.. ~:
~ = 6 r! D.
The solution gives a particle size of 14 nrn, which corresponds to approximately'150,000 gold atoms. At this size. approximately O.3%.of the atoms I1tC on the par-ticle surface, but the disrupted bonds as~atcd withlhose atoms contribute SO%cf the particle energy. In a nanoscale powder, it is ~t1mated that the first five Jay,ers of atoms exhibit disrupted bonding. which corresponds to about '2~ of theatoms for the 14 nm gold particle.
Particle Size. ,
Particle size is a determination of the dimensions of a particle. The size of a particle.depends on the measurement technique. specific parameter being measured, and particle: "•.shape. Particle size analysis can be achieved by ~y or several instruments which USUAlly. .do nOI gl~e eq~ivalenl determinations due t~di(ferences in the measured ~fllSlef5;; .Most particle Size analyzers use one geometncpararneter and make the assumpllo~ of a,spherical particle shape. The basis for analysis ca{l be any of the obvious geometric: val~: .ues, such as surface area, projected area, maximum dimension, minimum cross-sectional-area, or volume; Particle size is probably Orlc.p! the n:lost important characteristics to the :
~
er metallurgist. Size data are most use(ul when presented within the context of theirernent basis and the assumed particle shape.
e example size parameters are diagrammed in Figure 2.3. For a spherical particle,the s is a single parameter. the diameter. However. as the particle shape becomes more
33.
•
1'()wt)~ll MEIN.LUI~u'( ~LI~Nll
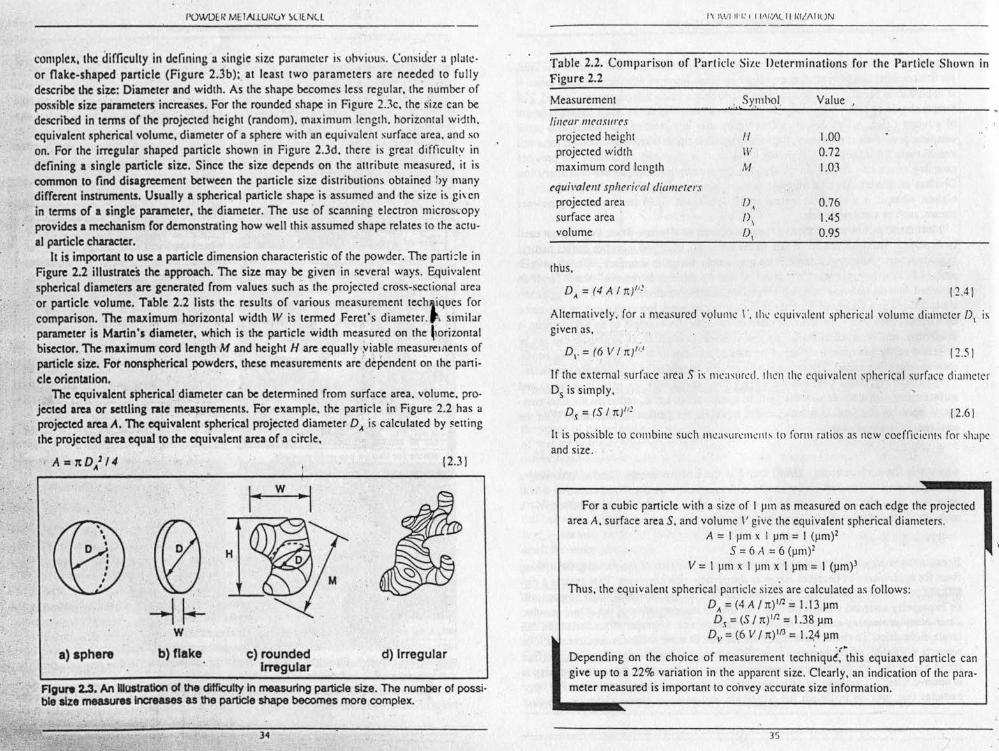
complex, the difficulty in defininga single size parameter is obvious, Consider a plate-or flake-shaped panicle (Figure 2.3b):. at least two parameters are needed to fullydescribe the size: Diameter and width. As the shape becomes less regular. the number ofpossible size parameters increases. For the rounded shape in Figure 2.3c. the size can bedescribed in terms or the projected height (random). maximum Icngth. horizontal width.equivalent spherical volume, diameter of a sphere with an equivalent surface area. and soon. For the irregular shaped particle shown in Figure 2.3d. there is great difficulty indefining a single panicle size. Since the size depends on the attribute measured. it iscommon to find disagreement between the particle size distributions obtained by manydifferent instruments. Usually a spherical particle shape is assumed and the size is givenin terms or a single parameter, the diameter. The use 'of scanning electron microscopyprovides a mechanism for demonstrating how well this assumed shape relates to the actu-al particle character.
It is important to use a particle dimension characteristic of the powder. The particle inFigure 2.2 illustrates the approach. The size may be given in several ways. Equivalentspherical diameters are generated from values such cis the projected cross-sectional areaor particle volume. Table 2.2 lists the results of various measurement tech1iques forcomparison. The maximum horizontal width W is termed Ferer's diameter.'~ similarparameter is Mvtin's diameter. which is the particle width me~sured on the ~orizontalbisector. The muimum cord length M and height H are. equally -viable measurements ofparticle size. For nonspherical powders, these measurements aredependent on the pani-cle orientation. ' "
The equivalent spherical 'diameter can be determined from surface area. volume. pro-jected area or settling rate _measurements. For example. the panicle in Figure 2.2 has a
, projected area A. The equivalent spherical projected diameter DAis calculated by settingthe projected area equal to the equivalent area of a circle,
, A = rtD/14 (2.31
1 \-- w ~II (0 H
<
~~W
a) sphere b) flake. c) rounded,Irregular
d) Irregular
Rgure 2.3. Atllllostratlon of the diffICUltyIn measuring particle size. The number of possi-ble size meuurea Increases sa the particle shape becomes more complex. .
34
I't 1\v11I1,',11!\1.:J\llllilLl\lIUN
Table 2.2. Comparison of Particle Size Determinations for the Particle Shown infigure 2.2
Measurement Value
linear measuresprojected heightprojected widthmaximum cord length
equivalent spherical diametersprojected areasurface arca 'volume
"IVI'vI
1.000.721.03
0.761.450.95
thus.
DA = (4 A t tu'" 11.41
Alternatively .. for ;1 measured volume \ ', the equivalent spherical volume diameter D, isgiven as, '
D" = (6 V I iu'" 11.51
If the external surface area S is measured. Ihcl1, the equivalent spherical surface diameterD, is simply.
D~ = (5/n)ll.' 12.61
It is possible to combine such mcasurcmcurs 10 form ratios as new coefficients for shapeand size.,
For a cubic panicle with a size of I um as measured on each edge the projectedarea A. surface area S. and volume V give the equivalent spherical diameters,
A = I 11m x I 11m = I (urn)?5 = 6 r\ = 6 (um)?
V = 1 urn x I prn x I urn = I (urn)!
Thus, the equivalent spherical panicle sizes are calculated as follows:D/o, = (4 A / n)ln == 1.13 urnD~= (5/ n)lf2 = I .38 urn
Dv = (6 V / n)lf3 = 1.44 pm. .r"
Depending on the choice of measurement technique, this equiaxed panicle cangive up to a 22% variation in the apparent size. Clearly. an indication of the para-meter measured is important to convey accurate size information.
" '
, .,
~ Shown in
12.41
iamctcr D, is
12.51
'ace diameter
12.61
mx for shape
projecteders,
rtiele canthe para.
~----
POWDER METALlURGY SCIENCE
Measurement Techniques
MicroscopyA widely applied technique for particle sizing uses the ability of the eye to rapidly
size dispersed particles in a microscope. Many procedures relevant to testing metal p()\~.dcrs are identified in Appendix B. Although microscopy is rcasonubly accurate, thc tcdi-urn of sizing statistically significant quantities of particles has led to use of automaticimagc analyzcrs. The image for analysis is ~el~eratcd by optic.al (either rdlectc.d or trans-milled light). scanning electron or trans~lssion electron microscopes. The instrumentchoice depends on the panicle size: however. the larger depth of field in the SEM is adistinct advantage. especially since it shows surface topography and can provide x.ra~sfor compositional analysis. By microscopic counting of diameter. length. height or area.a frequency distribution can be generated. The distribution will record the relative Ire-qucncy of the selected particle dimension.
A wetting liquid causes agglomeration of small panicles because of the strongcapillary force at the panicle contact. For example. the capillary force between apanicle and a flat substrate depends on the wetting angle and quantity of liquid.but approximately equals. .
F" = 5 Dy
where F" is the capillary force.' D is the panicle diameter (assumed spherical). andy is the surface energy of the liquid. Consider the panicle size where that forcewill equal the gravitational force on the particle. The panicle would adhere to thetop of a container. The gravitational force on a panicle is given as the mass timesacceleration:
F = re DJ ~ P 16.1:. • III
where g is the gravitational acceleration. D is the particle diameter. and P", is theparticle density. Combining the above two equations and solving for the particlesize gives the critical condition where the capillary force equals the gravitationalforce.
D = [30 yl (re g Pm)JII1
If the fluid is water and the solid has a density of 10 g/cm\' then the surfaceenergy is 0.07 11m2 and the critical panicle diameter is 1850 prn, indicating a largepanicle. The calculation demonstrates the difficulty in dispersing metal powderswhen they have adsorbed moisture films.
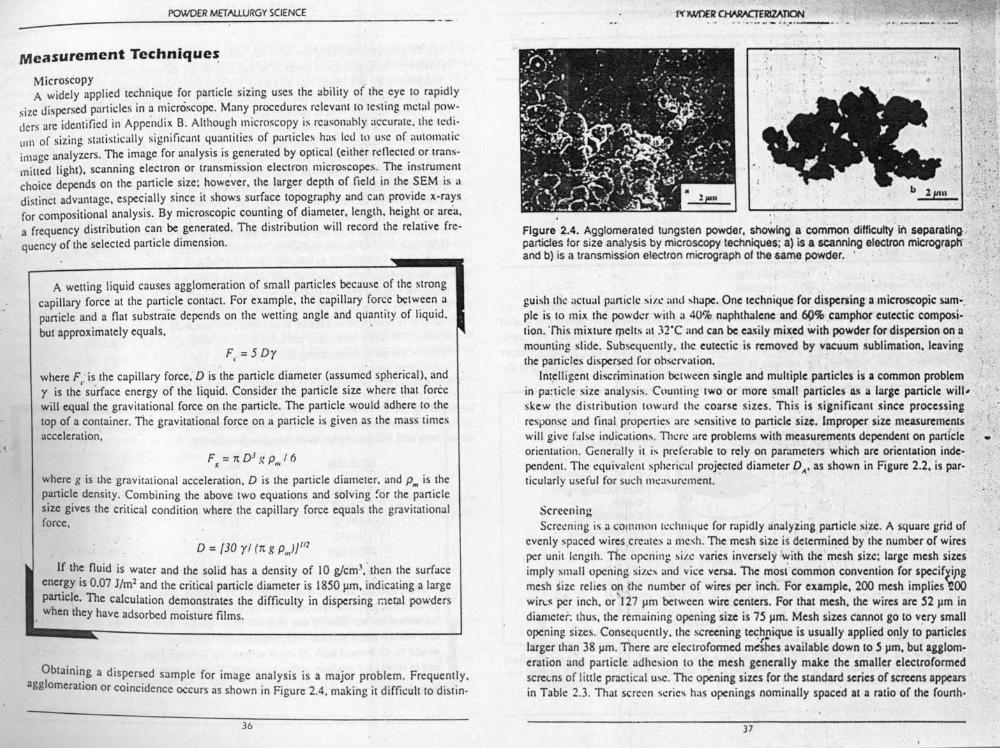
Obtaini~g a dispersed sample for image analysis is a major problem. Frequently.agglomeration or coincidence OCcurs as shown in Figure 2.4. making it difficult to distin-
36
... ~ - ----:-- .
:,.,
Figure 2.4. Agglomerated tungsten powder. showing a common' difficulty"In separatlno. ..particles for size analysis by microscopy techniques: a) is a scanning electron micrograph" .and b) is a transmission electron micrograph 01 the same powder.' .
guish the actual particle size and shape. One technique (or dhpersing II microscopic sam-,pie is to mix the powderwith a 40% naphthalene and 69% camphor eutectic composi-tion. This mixture melts at 32"C and can be easily mixed with powder (or dispersion on II
mounting slide. Subsequently. the eutectic is removed by vacuum sublimation. leavingthe panicles dispersed for observation. .
Intelligent discrimination between single and multiple panicles is a common problemin particle size analysis. Counting two or more small panicles as II large panicle will,skew the distribution toward the coarse sizes. This. is significan: since processingresponse and final properties arc sensitive to panicle size. Improper size measurementswill give false indicuticns. There are problems with measurements dependent on pOlnfdeorientation. Generally it is preferable to rely on parameters which lire orientation inde-pendent. The equivalent spherical projected diameter D~.OlSshown in Figure 2.2. is par-ticularly useful for such measurement.
ScreeningScreening is a common technique for rapidly anulyiing panicle si,le. A square grid of
evenly spaced wirescreates a mesh. The mesh size is deterrnined by' the number of wiresper unit length, The opening ~ii'.e varies inversely :~ith the mesh size: large mesh sizes"imply ~Illall ~pening sil.e~ and vice v~rsa. Th~ most common convention (o~ spe.ci(~ipgmesh size relies .a." .{he number of Wires per inch. For example, 200 mesh implies ~OOwires per inch. or '1'27 urn between wire centers. For thllt mesh. the wires are 52 11mindiameter. thus. the remaining opening size is 75 prn, Mesh sizes cannot go to v~ry smallopening sizes. Consequently. the screening t~~£lique is usually applied on.ly to panicleslarger than 38 urn. There arc electroformed meshes available down to 5 urn, but agglom-eration and particle adhesion to the mesh generally make the smaller electroformedscreens of lillie practical use. The opening sizes for the standard series of screens appearsin Table 2.3. That screen series has openings nominally spaced at a ratio of the fourth-
]7
" -.
I'O\IJ!JERMEIAlLUI~Liy ~(Il Nli.
Tllble 2.3. Standard Sieve Sizes
i mesh size opening. 11m mesh size opening. 11m• c
'1 18 1000 100 15020 850 120 12525 710 140 106
II30 600 170 9035 500 200 7540 425 .230 .0345 .. 355 270 5350 .300 325 4560 Z50 400 3870 ... .,211 450 3?80 180 500 25
600 20
".,,:;-
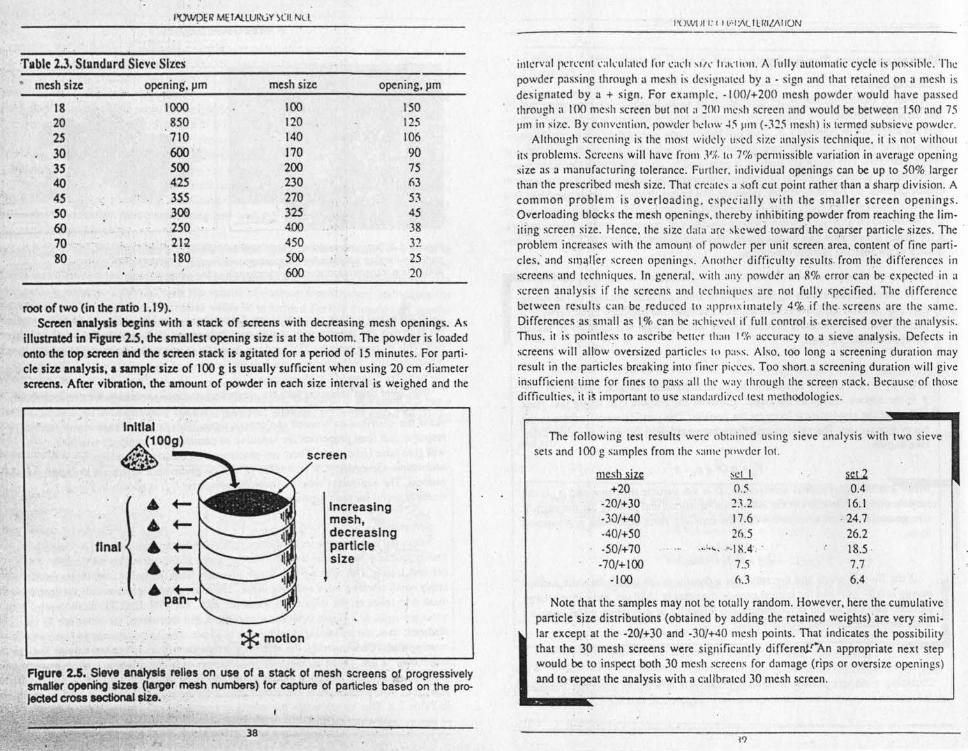
root of two (in the ratio 1.19).Screen analysis begins with 11 !>IaCIcof screens with decreasing mesh openings. As
illustrated in Figure 2.5. the smallest opening size is at the bottom. The powder is loadedonto the top screen arid -thescreen staclc is agitated for a period of 15 minutes. For pani-cle size analysis •• sample size of 100 g is usually sufficient when using 20 em diameterscreens. After vibration. the amount of powder in each size interval is weighed and the
InItial
•
. (1009)f'.:~ ---.-. ......lI~-_..-..-..-. .-..-pan-«
Increasingmesh,decreasingparticlesize
final
*motion
Figure 2.5. Sieve an8.tysis relies on use of a stack of mesh screens of progressivelysmaller opening sizes (~r mesh numbers) for capture of particles based on the pro-jected cross sectional siz.e •. "
38
I'OWl )11:I I \i'I:AlIlIIILI\II0N
interval pcrccnt calcul.ucd I'm each \1/,' 11;1,·lillll.1\ fully automatic cycle is possible. Thepowder passing through a mesh is designated by a - sign and that retained on a mesh isdesignated by a + sign. For example. -100/+200 mesh powder would have passedthrough a toO mesh screen but nOI a 2nn mesh screen and would be between I SO and 75pill in size. By convention. powder h<.:lllw.JS um (-325 mesh) is termed subxicve powder.
Although screening is the most widely used size analysis technique. il is not withoutits problems. Screens will have from .Vir, 10 7'/()'pcnni$sible variation in average openingsize as a manufacturing tolerance. Further. individual openings can be up to 50% largerthan the prescribed mesh size. That creates a softcut point rather than a sharp division. Acommon problem is overloading. especially with the smaller screen openings.Overloading blocks the mesh openings. thereby inhibiting powder from reaching the lim-iting screen size. Hence, the size dal;1 arc skewed toward the cOflrser panicle- sizes. The'problem increases with the arnouru of powder per unit screen. area, content of fine parti-cles." and SID'Il\cr screen openings. Another difficulty results. from the differences inscreens and techniques. In general. with any powder an R% error can be expected in ascreen analysis if the screens and techniques are not fully specified. The differencebetween results can be. reduced 10 approximately 4%. if the.screens are the same.Differencesas.small as 1.%can be achieved if full control is e.xercised over the analysis.Thus. it is pointless to ascribe better than I % accuracy to a sieve analysis. Defects inscreens will allow oversized panicles In pass. Also. too long a screening dural ion mayresult in the panicles breaking into finer pieces. Too short.a screening duration will giveinsufficient time for fines to pass all the way through the screen stack. Because of thosedifficulties. it is important to use standardized lest methodologies.
The following test results were obtained using sieve analysis with two sievesets and 100 g samples from the x.unc powder 101.
mesh size+20
-20/+30-30/+40-40/+50-50/+70-70/+100
-100
set I0.5.2.\.217,626.5
.•. t, ••., ·•.·1X.4' ..
7.56.3
ill10.4
16.1·24.7
26.218.5·7.76.4
Note that the samples may not be totally random. However. here the cumulativeparticle size distributions (obtained by adding the retained weightsjare very simi-lar except at the -20/+30 and -30/+40 mesh points. That indicates the possibilitythat the 30 mesh screens were significantly differerU!~An appropriate next stepwould be to inspect both 30 mesh screens for damage (rips or oversize openings)and to repeat the analysis with a calibrated 30 mesh screen,
l?
i'
.'.
f,,,,,,,,, The
on a mesh isave passed
I 150 and 75CV\! powder.not without
age opening50% largerdivision. Aopenings.
ing the lirn-sizes. The'
f fine parti-ferences in
cered in adifferencethe same.e analysis.Defects in
ration mayn will givesc of those
o sieve
POWDER METAllURGY SCIENCE
Screening is also useful in obtaining sized powders. This procedure is termed classili-cation and is used to tailor size distributions. In several applications the ability to processa powder is dependent on controlling the particle size. Consequently. screening providesa means for removing specific size, fractions.
SedimentationParticle size analysis by sedimentation is most applicable to the smaller sizes.
Particles settling in a fluid (liquid or gas) reach a terminal velocity dependent on both theparticle size and the fluid viscosity. On that basis. particle size can be estimated from thesettling velocity. Depending on the particle density and shape. sedimentation techniquesare nominally applicable to particles in the 0.02 to I00 urn range. The extension of sedi-mentation to the lower particle sizes depends on the use of centrifugal forces. High fluidviscosities are needed for analysis of larger particle sizes. I
Particle size analysis by sedimentation uses a predetermined settling height and placesa dispersed powder at the top of a tube. Usually the test is performed in a fluid such aswater. but air can be used for smaller particles. Measurements of the amount of powdersettling at the bottom. of the tube (weight or volume) versus settling time then allow cal-culation of the particle size distribution. Obviously. the fastest settling particles are thelargest while the smallest can take considerable time to settle. Automatic instrumentationfor performing sedimentation analyses use light blocking. x-ray attenuation, weight orsettled cake height to determine the size distribution. Centrifugal forces can be added to.accelerate the test for smaller particles.
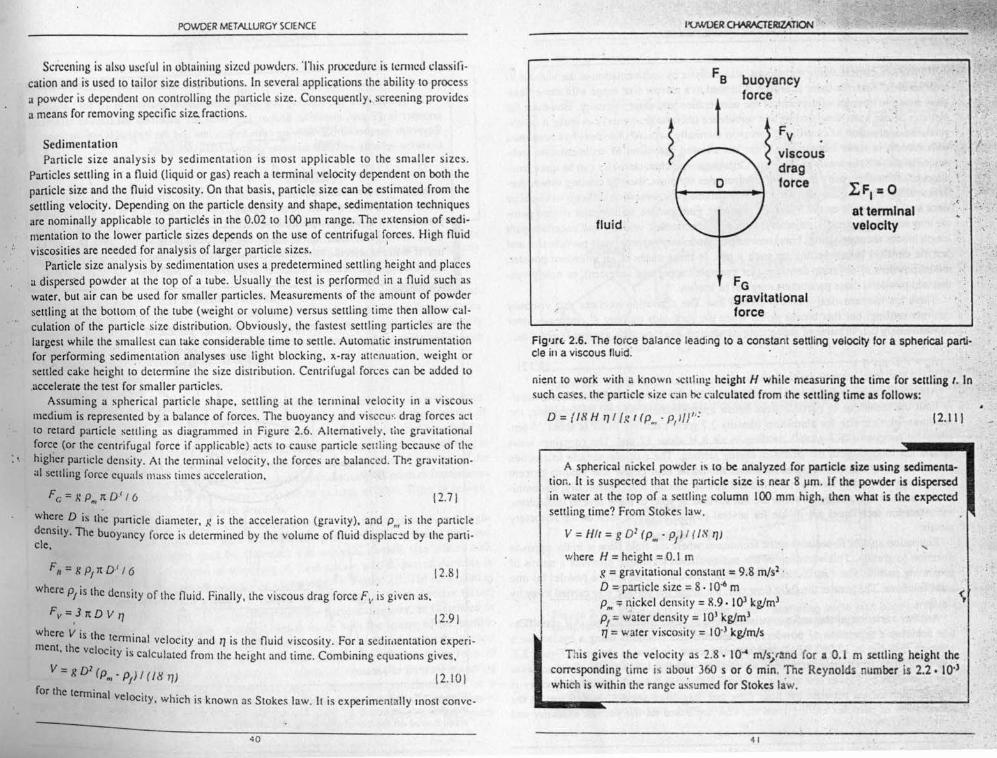
Assuming a spherical particle shape. settling at the terminal velocity in a viscousmedium is represented by a balance of forces. The buoyancy and viscous drag forces actto retard particle settling as diagrammed in Figure 2.6. Alternatively. the gravitationalforce (or the centrifugal force if applicable) acts to cause particle sculing because of thehigher panicle density. At the terminal velocity. the forces are balanced. The gravitation-al settling force equals mass times acceleration.
Fc=KP.,1t0·<f6 (2.71
where 0 is the particle diameter. K is the acceleration (gravity). and Pm is the particledensity, The buoyancy force is determined by the volume of fluid displac::d by the pani-cle.
Fn=gPI1tD'<f6 (2.81
where PI is the density of the fluid. Finally. the viscous drag force FI' is given as.
Fv=.31tOVTJ 12:91
where V is the teml'lnal I' d n i h fl id vi . F di . .h . vc ocuy an TJIS t e UI VISCOSity. or a se rmentauon expcn-rneru, t e velocity is calculated from the height and time. Combining equations gives.
V = g 01 t»; - PI) f (I (J 7]) 12.101for the terminal v I' '.e ocuy, which IS known as Stokes law. It is experimentally most convc-
40
buoyancyforce
t " '.'
~ FV~ vls.cous
dragforce
kF1=Oat terminalvelocity
,'.
fluid
FGgravitationalforce
'.
FIg·m. 2.6. The force balance leading to a constant settling velocity for a spherical partiec1e ill a viscous fluid.
nient to work with a known -culing height H while measuring the time {or settling I. Insuch cases. the particle size can be calculated from the settling time as fellows:
0= {/8 H TJt i: t (PH' - P,J/J": (2.111
A spherical nickel powder is to be analyzed {or particle size using sedimenta-tion. It is suspected that the particle size is near 8 urn. If the powder is dispersedin water at the top of a settling column 100 mm high. then what is the expectedsettling lime? From Stokes law.
V = HIt = g D1 (P •••- PI) f (/8 TJ)
where H = height = 0.1 mg = gravitational constant = 9.8 m/s1 .
D = particle size = 8. 10-6mP",;: nickel density = R.9.1()l kg/ml
PI= water den. ity = 10l kg/rn!7] = water viscosity = 10·l kg/m/s
.'
This gives the velocity as 2.8. 10" m/s/nnd for a O.i m settling height thecorresponding time is about 360 s or 6 min. Tne Reynold number is 2.2. 10')which is within the range assumed {or Stokes law.
~I
PO\.VDER METAlliJRGY SCIENCE
A~ with all panicle sizing techniques, size analysis by sedimentation is nut without it~error sources, First, the basic approach is limited to a narrow size range with some flexi-bility possible through adjustment of the acceleration and fluid viscosity. However. forparticles below I pm slow settling and turbulence (thermal gradients) can make it unrcli-able. The upplicuiion of centrifugal forces in thcrmalty ivol.ucd cluunbcr-, ha" been uvcdwith success in some laboratories. That has allowed extension or sedimentation tech-niques to panicles a.~ small as 0.01 ~111. Certain particle characteristics can be qui.c trou-blesome. Intemal porosity in the powder decreases the mass. thereby causing slowc.: par-ticle settling. For irregular panicles. the size parameter is somewhat difficult to visualize
-slnce settling depends on the hydraulic diameter. Furthermore, an irregular shaped pani-cle may not take a ,tmight trajectory: hence its nonconstant velocity and uncertain pathlength hinder accurate sizing. Foreknowledge is necessary (appr?x,irrate particle size andpanicle density) before setting up such a test. In those cases of an unknown powder.mixed powders of 4iffering densities (for example copper and tungsten), or newly syn-thesized powders, those parameters may not be known.
There are mathematical limits to Stokes law. The derivation assumes that viscositycontrols settling. but this breaks down when thc Reynolds number RN increases overapproximately 0.2. In term~ of the settling parameters. the Reynolds number is given as.
{2.12\
Also. the panicles are assumed to reach terminal velocity rapidly. These factors usual-Iy limit the technique to particle sizes below approximately 60 prn. For exarnpic, themaximum"'panicle size for aluminum (density 2.7 g/cm.l) settling in air is about _'\5urn,while for tungsten (19.3 g!cm·'). settling in air it is about 17 prn, The container wallsshould not interact with the particles during settling. The particle-panicle in.eructionmust be zero: consequently; concentrations should be kept below one volume percentwith no agglomeration. Finally. the fluid and powder can not react chemically. so combi-nations such as iron powder in water are not advised. In spite of these several ditficulties,sedimentation techniques are in use for several powder systems. such as th~ refractorymetals. '
Elutriation applies to sedimentation techniques where the fluid flow is in the oppositedirection to gravity. This variation of the sedimentation technique provides a means ofgenerating panicle size distribution information. as well as separating a powder lot intosized fractions. The greater the fluid flow rate. the larger the particle size carried away bythe flow.
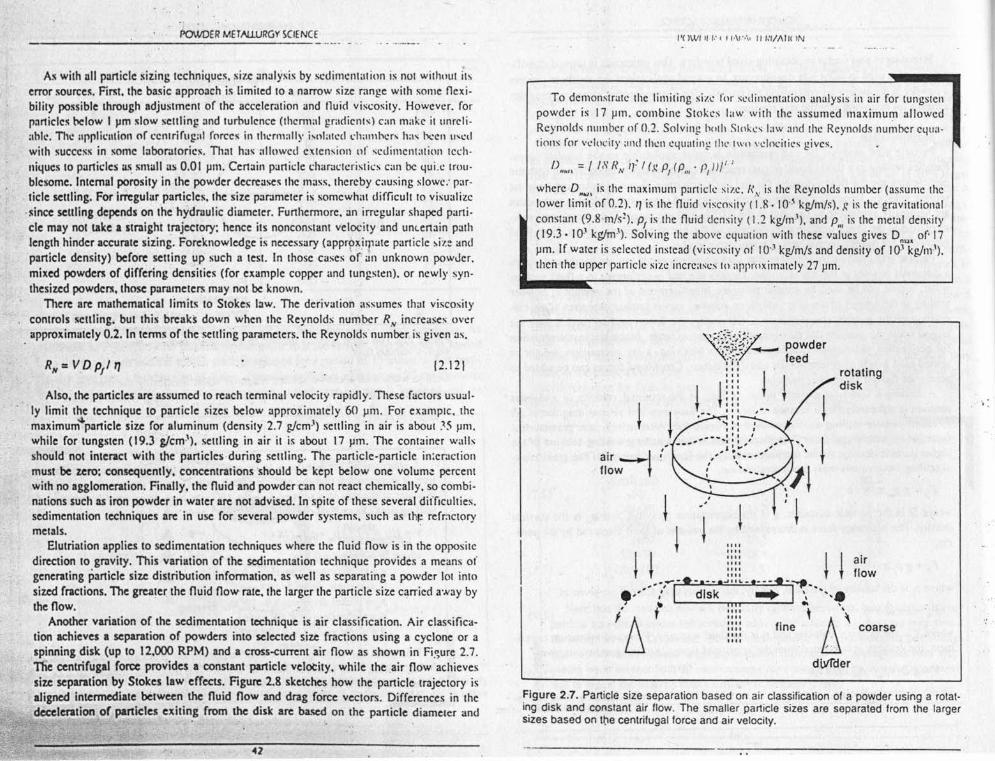
Another variation of the sedimentation technique is air classification. Air classifica-tion achieves a separation of powders into selected size fractions using a cyclone or aspiMing disle. (up to 12.000 RPM) and a cross-current air now as shown in Figure 2.7.Tfle centrifugal forte provides a constant panicle velocity, while the .air flow achievessize separation by Stokes law effects. Figure 2.8 sketches how the particle trajectory isaligned intermediate between the fluid flow and drag force vectors. Differences in thedeceleration of panicles exiting from the disk are based on the particle diameter and
42
1'( )WI '11.' f "'\",''' III,VAIIC IN
To demonstrate the limiting sizcIor sedimentation analysis in air for tungstenpowder is 17 urn. combine Stokes law with the assumed maximum allowedReynolds number or 0.2. Solving I1clIl1Stokc-, law and the Reynolds number equa-tions for velocity and then cqu.uinj; the IWI!velocities gives.
f) =118RNll-'I(~p to -r))/"11141\ • J III I
where D •• " is the maximum particle size, N,\, is the Reynolds number (assume thelower limit of 0.1). 1) is the fluid viscosity (I,R· \O'~kg/m/s).!: is the gravitationalconstant (9.8-m/s1). p, is the fluid density (1.2 kg/m'), and POll is the metal density(19.3· IO~ kg/m'). Solving the above equation with these values gives D of' 17prn. If water is selected instead (viscosity or 10'" kg/m/s and density of I03'kg/m").then the upper particle size increases to approximately 27 prn.
,air __ 1 f
. flow t
rotatingdisk
powderfeed
II I ::::~ ~ [[[[ ~ ~
.,,.. .•~~ •.• - •.•.•. e..J 1' ••....• _ .•..•.• -;--1t ..• .> ~ I disk "" ••• I ~"'"ifj t :::: 't A\:::: fineII.. .
"Itr>.
airflow
coarse
dll/fder
Figure 2.7. Particle size separation based on air classification of a powder using a rotat-ing disk and constant air flow. The smaller particle sizes are separated from the largersizes based on the centrifugal terce and air velocity.
,.\\\
,I
ungstenJ/owed
er cqua-
rrne thetationa!
enxity• of' 17Will').
a rotat_e larger
--
powrXR ME1Al LlJJ.:tiY \ClLNC I
~ ~I~W ~
particle --Q-- ce~~;~~gal
~ trajectorydragforce
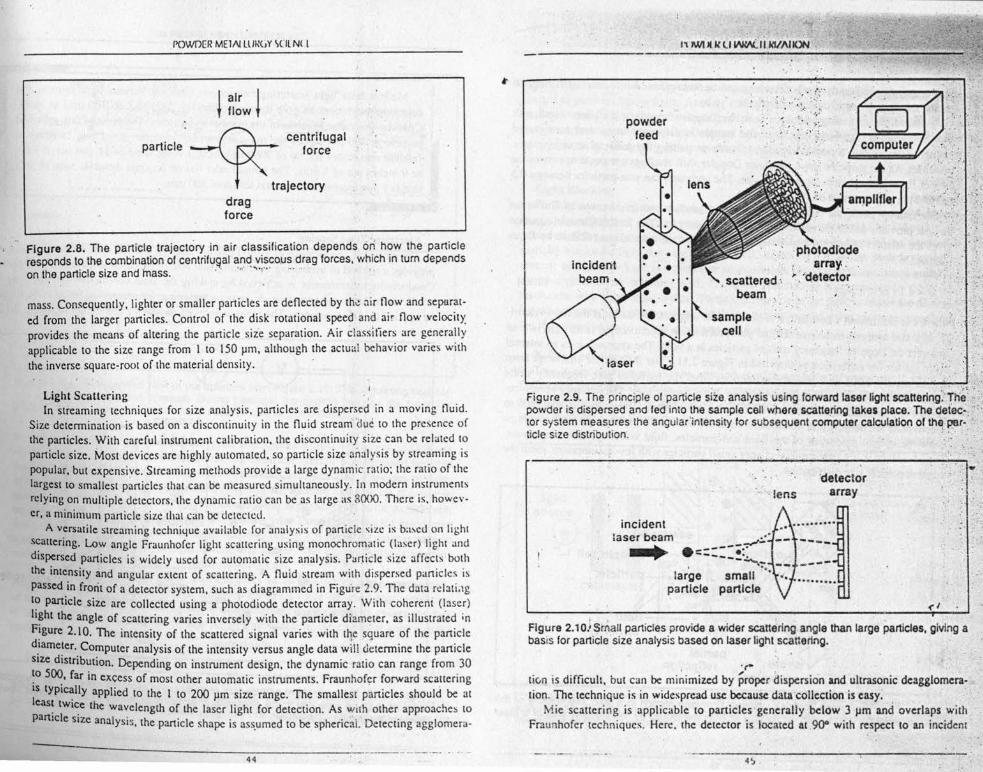
. I Figure 2.8. The particle trajectory in air classification depends o~ h~w the particleresponds to the combination of centrif~Qal an~ visco-us drag forces. which In turn dependson t~e particle size and mass. . . ." ~·1··· '." . '.
mass. Consequently. lighter or smaller particles are deflected by th\! air flow and separat-ed from the larger particles. Control of the disk rotational speed ana air flow velocity.provides the means of altering the particle size separation. Air classifiers are generallyapplicable to the size range from I to 150 prn, although the actual behavior varies withthe inverse square-root of the material density.
",'Light ScatteringIn streaming techniques for size analysis. particles are dispersed in a moving fluid.
Size determination ..is based on a discontinuity in the fluid strearridue to the presence ofthe particles. With careful instrument calibration, the discontinuity size can be related toparticle size. Most devices are highly automated. so particle size analysis by streaming ispopular, but expensive. Streaming methods provide a large dynamic ratio; the ratio of thelargest to smallest particles that can be measured simultaneously. In modem instrumentsrelying on multiple detectors. the dynamic ratio can be as large as8000. There is. howev-er, a minimum particle size that can be detected.
A versatile streaming technique available for analysis of particle size is based on lightscattering. Low angle Fraunhofer light scattering using monochromatic (laser) light anddispersed particles is widely used for automatic size analysis. Particle size affects boththe intensity and ungular extent of scattering. A fluid stream with dispersed particles ispassed in front of a detector system, such as diagrammed in Figure 2.9. The data rclati.tgt~ panicle size are collected using a photodiode detector array. With coherent (laser)h~ht the angle of scattering varies inversely with the particle diameter. as illustrated inFigure 2.10. The intensity of the scattered signal varies with t~e square of the particlediamete-, Computer analysis of the intensity versus angle data will determine the particleSI2.edistribution. Depending on instrument design, the dynamic ratio can range from 30~o 5~. far in excess of most other automatic instruments. Fraunhofer forward scatteringIS typically applied to the I to 200 urn size range. The smallest particles should be atleas~ twi~e the wavelength of the laser light for detection. As with other approaches toparticle Size analysis, the particle shape is assumed to be spherical. Detecting agglornera-
------------,--.:..-_---_._.44
t~put!rp~. .
" .. '
". "0'J: .~','
powderfeed
. .. . \ ~' ... :"
. ,',
~ .. : .....,':. '
. ,',.
samplecell
',:i
Figure 2.9. The principte of particle siie analysis using. forward laser light scattering~'Th~:~: /.,powder is dispersed and fed into the sample cell wherescatte,ring takes place, The defec.:; <,.'tor system measures the angular'intensity tor subsequent computer calculation 01 !hElper-.· .ticle size distribution. . . . . '.:. . .'
.~.'')'
"Iens'detector
array
----incident
laser beam•••_ .
.'..".,:. .,.-.-----;..----- -.-~-:- --small" .
particle
----large
particle.........
Figure 2.1 oj Small particles provide a wider scattering angle than large particles, giving abasis for particle size analysis based on laser light scattering.
*(. '. .
tion is difficult, but can be: mi~imi2.ed by proper dispersion and ultrasonic deagglomera-tion. The technique is in widespread use because data 'collection is easy:
Mie scattering is applicable to particles generally below 3 11m and overlaps withFraunhofer techniques. Here. the detector is located at 90" with respect to an incident
4~ .

POWDER ME1N.LURGY SClENCl
light beam. Consequently, both detectors can be incorporated into one instrument toexpand the dynamic ratio during. an analysis.
Another light scattering technique uses the Doppler frequency shift. associated withmoving particles. For huge particles. the sample is dispersed in air' and acceleratedthrough u nozzle into a partial vacuum, initially propelling the panicles at nearly sonicvelocities. As the particles slow. two-laser Doppler shift readings are made to extract thetime of flight and estimate the particle size. The approach can size panicles between 0,5
. and 200 JIm at count rates of I()~per second.For smaller particles, the thermally induced random motion. known as Brownian
motion, provides sufficient velocity for sizing the particles. The Stokes-Einstein equationgives the relation between the particle diameter D and, the translational diffusivity DT asfollows: '
12,13\
where k is Boltzmann's constant, T is the absolute temperature. and 1] is the fluid viscosi-,ty. In a size lUUIly~istechnique termed photocorrclationspcctroscopy. laser light is usedto detect the Doppler frequency shift of particles in a fluid. The approach uses an internalbeam splitter for calibration as sketched in Figure 2,1'1. Over the panicle size range from
I approximatety 0.00510 ~ .prn, the reflections from the particles 'give frequency ,hif:s(rom 1000 to I Hz, depending on the inverse of the panicle 'size. TIle,' intensity versus ire-.quency information is collected over a period of minutes. The output is analyzed todeconvolute the particle slze distribution from the signals. To use that approach one must
: know the optical properties of the fluid and panicles, fluid viscosity, and temperature.... The advantage is it's applicability to very small panicles with few assumptions about the
inherent particle size distribution.
scatterIng
r--+---sampl~ cell
partIcle
fluid~
~photo
detector
partialreflection
FIgure 2.11. Very ~ particles undergo Brownian motion in a fluId, the velocity c'! themotion provides Infonnatlon on particle size as measured by the Doppler shift of .:I laserOO~. .
46
,'( )WI)II·:, It"I:", II I;I/A/I(IN
Modern laser light scancring inxtnuncrus combine 'various light sources anddetection techniques to give dynamic ratios of 7000 (0.1 to 700 urn) or more.Consider this range in terms of the number or particles, The mass of one sphericalpanicle at 700 um equals the m;I~' or 3.4 . 10s particles at 0,1 !lm.'ln terms orfamiliar size scales. a ratio or 7()()() Icngth, to I is the same as i4 ntm out of I km
or <} inches out or r mile. The nonual ruler has an accurate dynamic ratio of 300 .that is I nun increments in a total length or JOO nun.
Electrical Zone SensingThe electrical conductivity or ;1 fluid p;I""1g through ;1 small aperture in all iusul.uor
provides a method of measuring the number alld size or part ides suspended in the fluid.Conductivity mcasurcmcut is achieved I", 111;lkillgthe fluid conductive and applying ;1
small voltage across the opening. A COIlIIIlOIltechnique for measuring blood cells. it callhe applied to sizing powders, The main katllrl'~ or the d~vicc arc shown in Figure ~,12,
to pump
tttt '
electrode
•. '; '-"-"e.. ::::0f" ~
• aperture
•. ~• !.----.~./
••electrode., .:
• particle •.............., •'-"-" electrolyte
'-"--' ,
Figure 2.12. The principle of partictesize analysis using electrical conductivily changes ina small aperture zone due to the streaming 01 particles dispersed in an electrolyte flowingthrough the insulating aperture.
47
)un:es and, or more.
sphcri<.:al1 terms orIIIof I kill
io or 300.
an insulatorin the fluid.
cI "pplying a~ cells. it canFigure ~.I~.
electrode
-if changes inolyte flowing
POWL>ER MEiAlLURGY SCIENCE
lIuldflow
current
time (expanded scale)
current
time
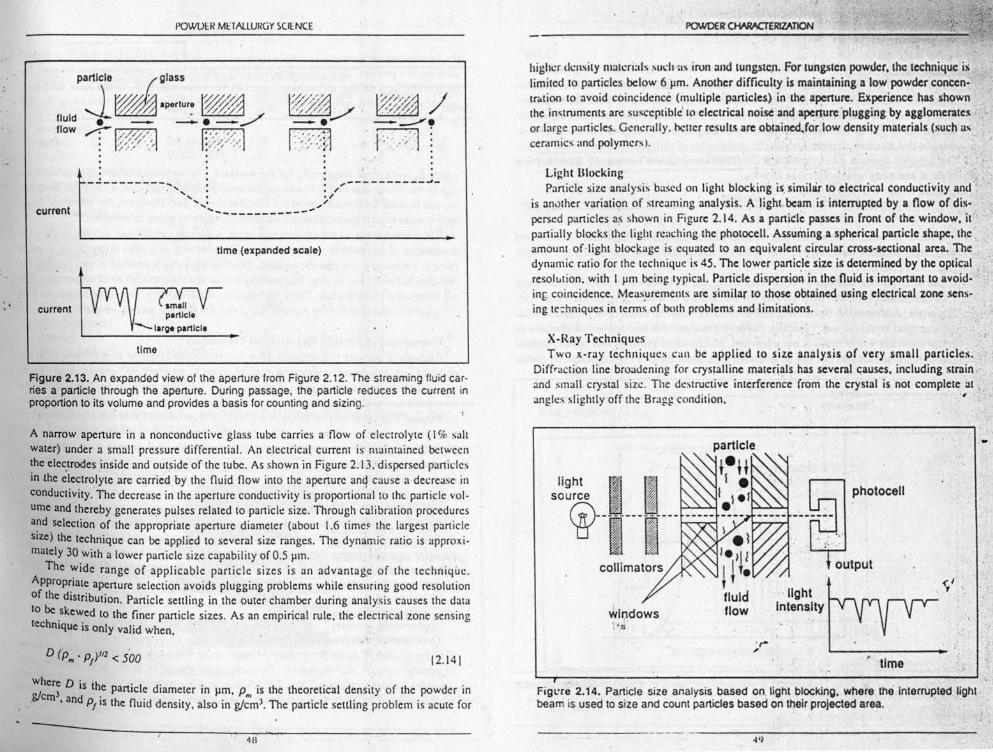
Figure 2.13. An expanded view of the aperture from Figure 2.12. The streaming fluid car-ries a particle through the aperture. During passage, the particle reduces Ihe current inproportion to its volume and provides a basis for counting and sizing.
A narrow aperture in a nonconductive glass tube carries a flow of electrolyte (I % sailwater) under a small pressure differential. An electrical current is' maintained betweenthe electrodes inside and outside of the tube. As shown in Figure 2.13. dispersed particlesin the electrolyte are carried by the fluid flow into the aperture anq cause a decrease inconductivity. The decrease in the aperture conductivity is proportional to the. particle vol-ume and thereby generates pulses related to particle size. Through calibration proceduresa~d selection of the appropriate aperture diameter (about 1.6 times the largest particleSize) the technique can be applied to several size ranges. The dynamic ratio is approxi-mately 30 with a lower particle size capability of 0.5 urn. . .
The wide range of applicable particle sizes is an advantage of the technique.Approp~iate aperture selection avoids plugging problems while ensuring goad resolutionof the distribution. Particle settling in the outer chamber during analysis causes the datato be .skewed to the finer particle sizes. As an empirical rule, the electrical zone sensingtechOlque is only valid when, . . ..
D (p~ . P,Y'} < 500 .
~~:~ D is ih.e particl~ diam~ter in }l~, P., is the theo~etical d~nsity of the. powder in.: .and P,IS the fluid density, also In g/cnr'. The particle settling problem IS acute for
12.141
higher dcusity materials xuch ~IS iron and tungsten. For tungsten powder. the technique islimited to particles below 6 urn. Another difficulty is maintaining 11 low powder coneen-tr••tion to avoid coincidence (multiple particles) in the aperture. Experience has shownthe instruments are susceptible' to electrical noise and aperiure 'plugging by agglomerates ~.or large particles. Generally. better results are obtained.fer low density materials (such u.~ceramics and polymers).·
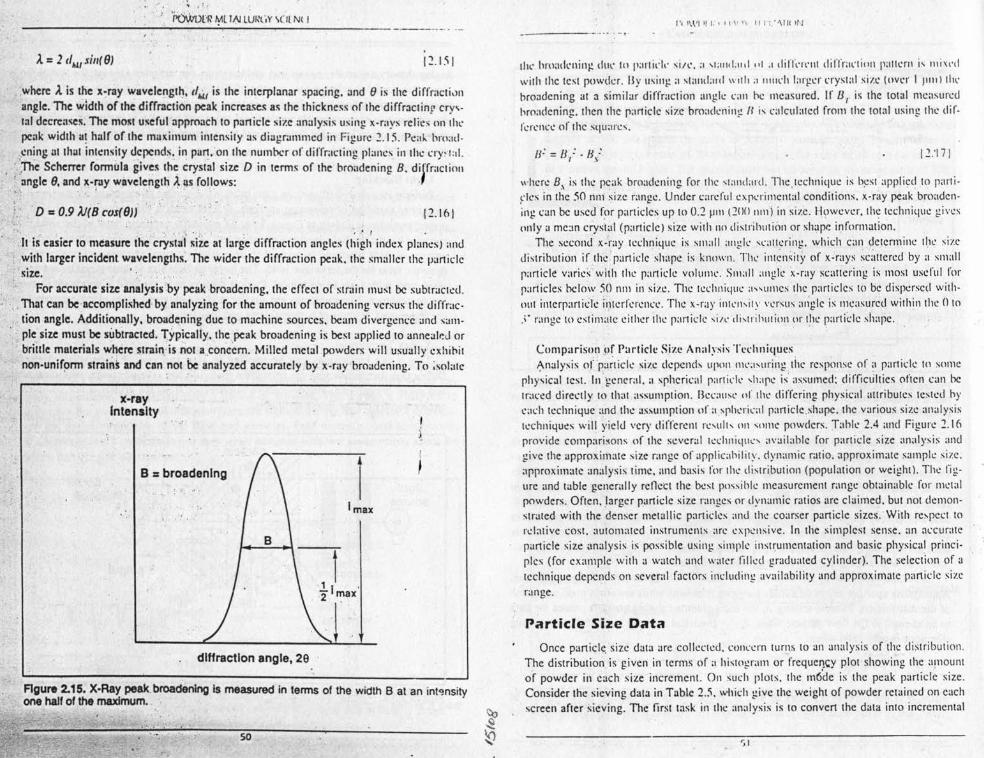
Light Blocking . ; ..Particle size analysis based on light blocking iOimilJir to electrical conductivity and'.
is another variation of streaming analysis, A light beam is' interrupted by a now or dis-persed particles a~ shown in Figure 2.14. As a particle passes in front or the window. it ..partially blocks the light reaching the photocell. Assuming a spherical particle shape. theamount of-light blockage is equated to an equivalent circular cross-sectional area. Thedynamic ratio for the technique is 45. The lower particle size is determined by the opticalresolution. with I urn being typical. Particle dlspersion in the fluid is important to avoid- .inf coincidence. Measurements are similar to those obtained using electrical zone sens-ing techniques in terms of both problems and ·Iimitations.
X·Ray Techniques .. .Two x-ray techniques call be applied 10 size analysis of very small particles. .'
Diffraction line broadening for crystalline materials. has several causes, including. strain .and small crystal size. The destructive interference from the crystal is not complete at ,angles slightly off the Bragg condition. .·1
..light I Isource
~-------------I I(",
wlndows .~.~••(j
·r·, .'.
time . J.,
FigL're 2.14. Particle size analysis based on. light blocking, where the Interrupted lightbeam is used to size and count particles based on their proJected area,
'i>OVmr·r. ¥ll ~ lUI~t', Y \( ILNt I--------~....•..--~.,..-.------------.-- .. -
12.1.'i 1
'where ,t is the x-ray wavelength, cI.il is the interplanar spacing. and () is the diffractionangle. The width of the diffraction peak increases as the thickness of the diffracting crys-1:11decreases. The most useflil approach to particle size analysis using x-rays relic: 011 thepeak width a! half of the maximum intensity us diugrummed ill Figure 2.15. Peak hro.ul-
yning ut thai intensity depends. in pUf!;on the number of diffraclillg planes ill the ny~tul.:.;J11e Scherrer formula gives (he crystal size D in terms of the broadening B. diffractionr angle 9. and x-ray wQveleng(h ). ~s foJ.lows:'~'. . . ' ~. ..'
,. .D = 0.9 ).J(8 cos(O}) 12,101
""
.. ,,' , , ' , "',, , ' " ; I .
Jt is easier to measure the crystal size at large diffraction unglcs (high index planes) andwith larger incident wavelengths, The wider the diffraction peak. (he smaller the panicle
'size.For accurate size analysis by peak broadening. the effect of strain mus: be subtracted.
<, That can be accomplished' by analyzing for the amount of broadening versus the diffrac-, tion angle. Additionally. broadening due to machine sources. beam diverucncc and sum-, pie size must be subtracted. Typically. the peak broadening is best applied 10 annealed or
briitle materials where strain,'is not aconcern. Milled metal powders will usually exhibitrion-unifpnn strains and CDn ,not be analyzed accurately by x-ray broadening. To .solatc
x-rayIntensity
B = broadening
1Imax
dlHraction angle, 29
Figure 2.15. X-Ray peak,broadening Is measured in terms of the width 8 at an intsnsltvone half of the maximum. ' .
" .. so
1"'\\,1111., 'I I"l 1111."\111" J
IIll' hroa!it-lIill!! due 10 I'arlil'k ~i/l', a ,1;11111:11.1 III :1 dilll'l'l'l1t dillrarti(ll1 p.nrcrn is 111i~l'dwith the lest powder. Ily lIsil1!! a slal1d:lld \\'1111;1 uruch lar!!er rryxta] size Inver I )1111) thl'hroadcning :JI a similar diffraction angle call be measured. If B.,. is the 101a1 measuredhroadening. then the particle size broadcninp /I i~ calculated from the total using the dif-fl'rem:e 01" the squarc«,
lJ: = B,.-' - H/ 12.'171
where B.\ is the IX:ak broadening for the ~lal1dard. Thetechnique is best applied 10 parti-Fk~ in the 50 lillj size range. Under careful cxpcrimcntul conditions, x-ray peak broaden-ing can be used for panicles up 10 0.2 pill eOO nm) in size. However, the technique givesonly a mean crystal (panicle) size with 110 disuiluuion or shape information.
Thc second x-ray technique is sm;dl :ll1gk ~catlerill!!, which can determine the sizedistribution if tilt:' particle share is known. The inl~n;'il)' of x-ruys scattered by a smallpanicle varies with the particle volume. Small ;l11gh: x-ray scuncring is most useful forparticles below $0 run in size. The technique a"lImes the particles to be dispersed with-out iutcrparticlc interference. The x-ruy illlL'n,ity versus angle is measured within the () to.'. range III estimate either the panicle ~ilL'di~lrihlllioll l1I' the particle sh:'1ie.
Comparison ,!Jf Particle Size Analysis TechniquesAnalysis otpanictc size depends upon ml';I~uring,lilc response of a particle 10 some
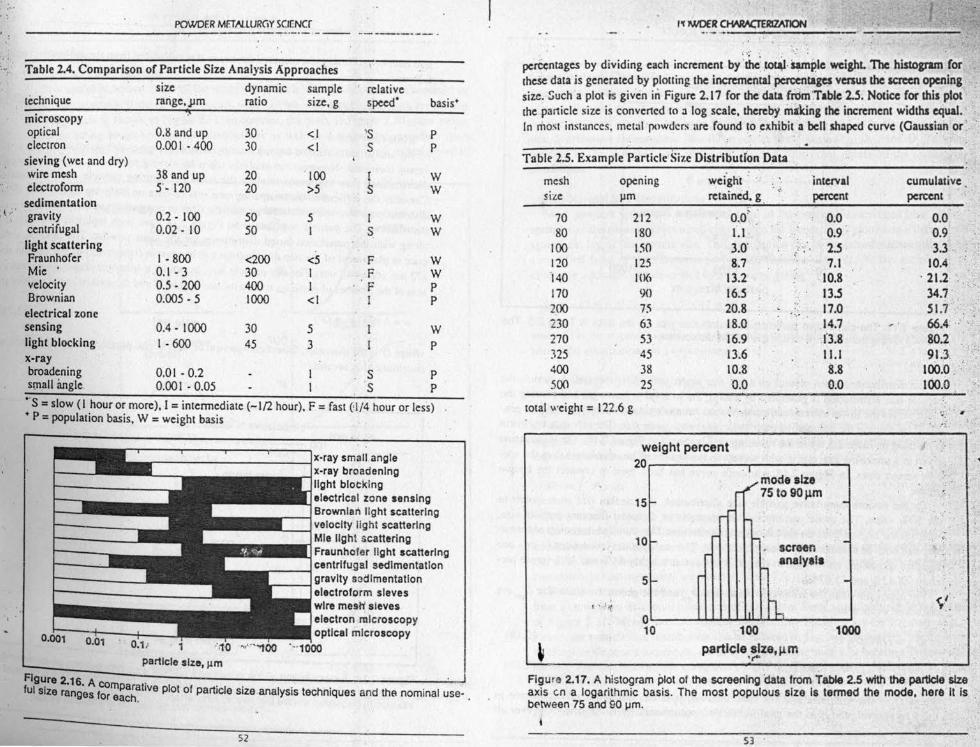
physical icst.vlngcncral. a spherical partirit' ,Ilape is' assumed: difficulties often can betraced directly 10 Ihal assumption. Because (If the differing physical attributes tested hyeach technique and the assumption of a~phl'ril'al particle.shape. the various size analysistechniques will yield very different rc-ulr-, Oil '<line powders. Table 2.4 and Figure 2.10provide comparisons of the several technique available for panicle size analysis andgive the approximate size range of upplicabilitv. dynamic ratio. approximate sample size,approximate analysis lime. and basis for the distribution (population or weight). The fig-ure and table generally reflect the best posxihle measurement range obtainable for metalpowders. Often . larger panicle size ranges or dynamic ratios are claimed. bUI nOI demon-strutcd with the denser metallic panicles and the courser panicle sizes. With respect 10
relative cost, automated instruments arc expensive. In the simplest sense, an accuratepanicle size analysis is possible uxing simple instrumentation and basic physical princi-ples (for example with a watch and water filled graduated cylinder). The selection of atechnique depends on several factors including availability and approximate particle sizerange.
Particle Size DataOnce particle size data are collected, concern turns 10 an analysis of the distribution,
The distribution is given in terms of a histogram or frequency plot showing the amountof powder in each size increment. On such plots, the m6'de is the peak particle size.Consider the sieving data in Table 2.5, which ~ivc the weight of powder retained on eachscreen after sieving. The firs: task ill Ihe analysis is 10 convert the data into incremental
'>1
: t ,:'
.....
rn i~ rnixvdr I )1111) lilL'I measured
,ing the dif-
12.'171
icd 10 pari i·uk broaden-niquc givcs
IlC the sizeby a smallI useful tor.rscd with-
hin thc () 10
llc 10 someItcn Gill hes icsrcd hyze analyxi»igure 2.16alysis and
umrle size.I). The rig.c for metal101 demon.
re~pcCI 10
11OICClirale
ical princi-eCliol1 of a,mick size
iSlribUlion.rhe amounlnlclc size.led on eachneremellIul--
" . .' ;..I .,: POINDER MF.TAlLURGY SOENCr
.; ..Table 2.4. Comparison or Particle Size Analysis Approaches
techniquesize dynamic samplerange. jim ratio size. g
e., basis"relativespeed·
microscopyopticalelectron
sieving (wet and dry)wire meshelectroform
sedimentationgravitycentrifugallight scatteringFraunhoferMie .velocityBrownian
electrical zonesensinglight blockingx-raybroadening 0.0 I - 0.2 S Psmall angle 0.00 I - 0.05 I' S P
0.1l and up0.001-400
3030
<I<I
'SS
PP
38 and up5'- 120
2020
100>5
IS
ww
0.2· 1000.02-10
5050
5I
Is
ww
1-8000.1 - 30.5 - 2000.005 - 5
<200304001000
<5II<I
FFF
wwPP
0.4 - 10001-600
3045
53
wp
··S = slow (I hour or more). I = intermediate (-1/2 hour). F = fast (:t/4 hour or less)• P = population basis. W = weight basis
___ ----------~x·ray small. anglex·ray broadeninglight blockingelectrical zone lensing
••••• Il:=jBrownian light scattering• velocity ilgh! scattering
••••• II1Mle light scattering
Fraunhofer light scattering__ -I centrifugal sedimentationr--_-Igravlty sedlmantatlon
electrofcrm sieveswire mesH sieveselectron. microscopy
0.001 ' optical microscopy0.01 0.11 1 :i'fO ""'''100 ····1000
particle size, umFigure 2.16 A co .f . mpara!' I '.ul size ranges for each. Ive pot of particle size.anatysls techniques and the nominal use- .
52
~ntages by dividing each increment by "ilie: .toti.I.~ple weight. The histogram (orthese data is generated b.y plotting the incremental percenta~ venus the screen openingsize. Sucha plot ;s given in Figure 2.17 for the-data frdm 'Table 2.5. Notice (or chis plot'the particle size is converted to a log scale. thereby. miXing the increment widths equal.In most instances. metal powders are found to ~xhibit a bell shaped curve (Gausshln or ' ..
Table 2.5. Example Particle ~ile Dlstrlbutlon Data
meshsize
opening~m
weight' '.retained. g
interval cumulativepercent percent
0.0 0.00.9 '. 0.9
':'~' . 2.5, 3.3\~ ..
7.1 10.410.8 . 21.2·13.5 34.7 .17.0 51.714.7 ~, 66.4:
'.1'3.8 80.211.1 91.3.8:8
,100.0. -.
0.0 100.0
7080
100120140170200230270325400500
212180I~O125J069{)756353453825.
0-,0' .1.13.0'8.7
13.216.520.818.016.913.610.80.0
' .., '.
total weight = 122.6 g e: ,.
1000
, ,
weight percent20 ...
. I
~modeslze
'- 75to90~m -,..
'- -. screenI- analysl1
'- -rh
15
10
5
o10 100
particle 8Ize,~m.,..Figure 2.17. A histogram plot of the screening data from.TabIe 2.5 with the particleSIzeaxis en a logarithmic basis. The most populous size Is termed the mode, her& It Isbetween 75 and 90 urn,
t
53
PowoER METmURGY SCIENCE _____ ...:.- .__ '_'1 _JW_'_" r,.• II,W,\, _'_"_"_/A_'_'I_IN _
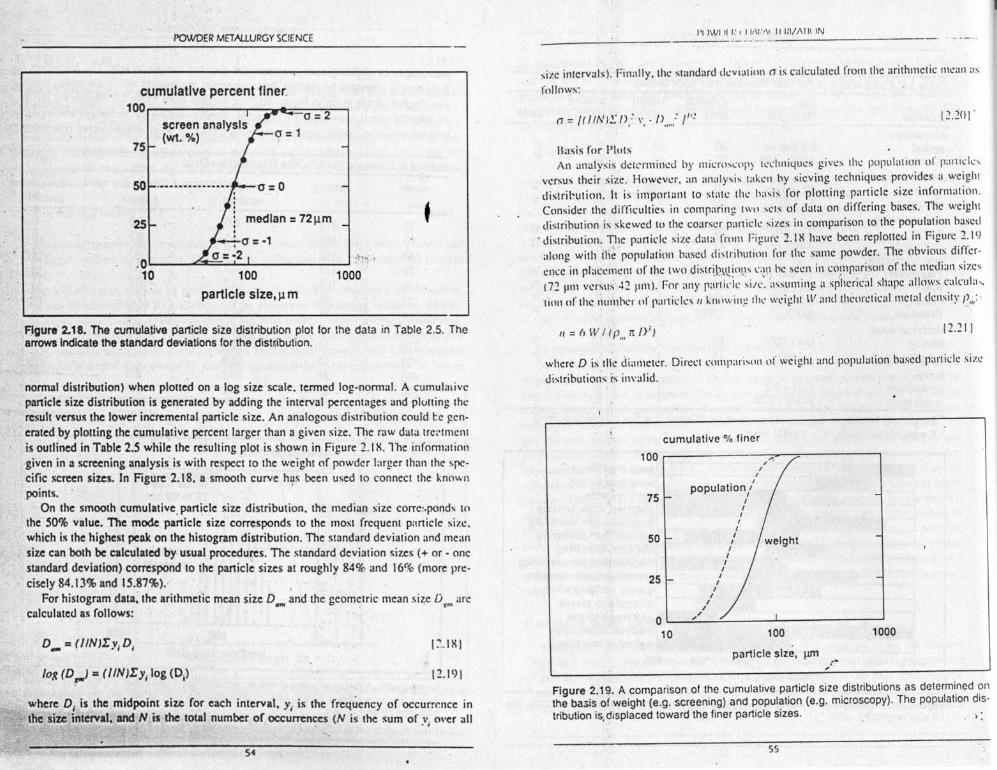
size intervals), Finally, the standard deviation a is calculated from thc arithmetic mean asfollows:
Basis lur PlotsAn analysis determined by micr\l~(lIp) techniques giws the pupulution of p.miclc-,
versus their size. However. an analysis taken by sieving techniques provides a weightdistribution. It is important to state the hasis for plotting particle size information.Consider the difficulties ill comparing tW(I ~ets of data on differing bases. The weightdistrihution is skewed to the coarser particle sizes in comparison to the population based
. distribution. The particle size data from Figure 2.1 X have been replotted in Figure 2.19along with i1i~'population bused distribution for the same powder. The obvious differ-cncc in placement of the two distr!I)\I~~o'.l~c;.~,.lhe seen in comparison of the median sizes(72 IIIll VcTSUS' -12 um). For any partil'ic Sill'. ';I~suming a spherical shape allows calcula-,tion of the number (If particles 1/ kunwin;; till' weight \I' and thcuretic,tlllletallit:llsity I~",:'
cumulative percent finer.100r----------.~wt~~~
a = II /IN)!: n,: \.,. l) .....: I"! 12.201'
75
50
2S
.0.L--_......c::J1:::.-..L-...l- ....J -t- ••. ,
10 1000
Figure 2.18. The cumulative particle size distribution plot lor the data in Table 2.5. Thearrows Indicate the standard deviations lor the distr;ibution.
12.2111/ = (I \II I (P .., IT IJ')
-normal distribution) when plotted on a log size scale. termed log-normal. A cumulaiivc. particle size distribution is generated by adding the interval percentages and plotting the
result versus the lower incremental panicle size. An analogous distribution could te gen-. crated by plotting the cumulative percent larger than a given size. The raw data trcrtrncnt. is outlined in Table 2.5 while the resulting plot is shown in Figure 2.1 X. The information. given in a screening analysis is with respect to the weight of powder larger than the spe-
cific screen sizes. In Figure 2.18. a smooth curve h~s been used to connect the knownpoints.
On the smooth cumulative. particle size distribution. the median size corresponds tothe 50% value, The mode. particle size corresponds to the most frequent particle size.which ill the highest peak on the histogram distribution. The standard deviation and meansize can both be calculated by usual procedures. The standard deviation sizes (+ or· onestandard deviation) correspond to the particle sizes at roughly 84% and 16% (more pre-cisely 84.13% and 15.87%). ,
For histogram data; the ari.lhmet'ic mean size D and the geometric mean size D arc",., . x'"calculated as follows: . . , .
where D is tll'e diameter. Direct comparison llf weight ,II1dpopulation based particle sizedistributions is invalid.
1000
cumulative % finer
I~.IX}
100 -1/
II
population,'I
75 IIIII
50 IIIIII
25 II
II
II
'"I0
10 100particle size, IlITI
'"log (D,..I = (lINlEy/log (01) 12.191
where D/ is the midpoint size for each interval. y/ is the frequency of occurrence inthe size interval. and N is the total number of occurrences (N is the sum of v. over all.,
Figure 2.19.A comparison 01 the cumulative particle size distributions as determined 011
the basis of weight (e.g. screening) and population (e.g. microscopy). The population drs-tribution is,displaced toward the liner particle sizes.
S4 55
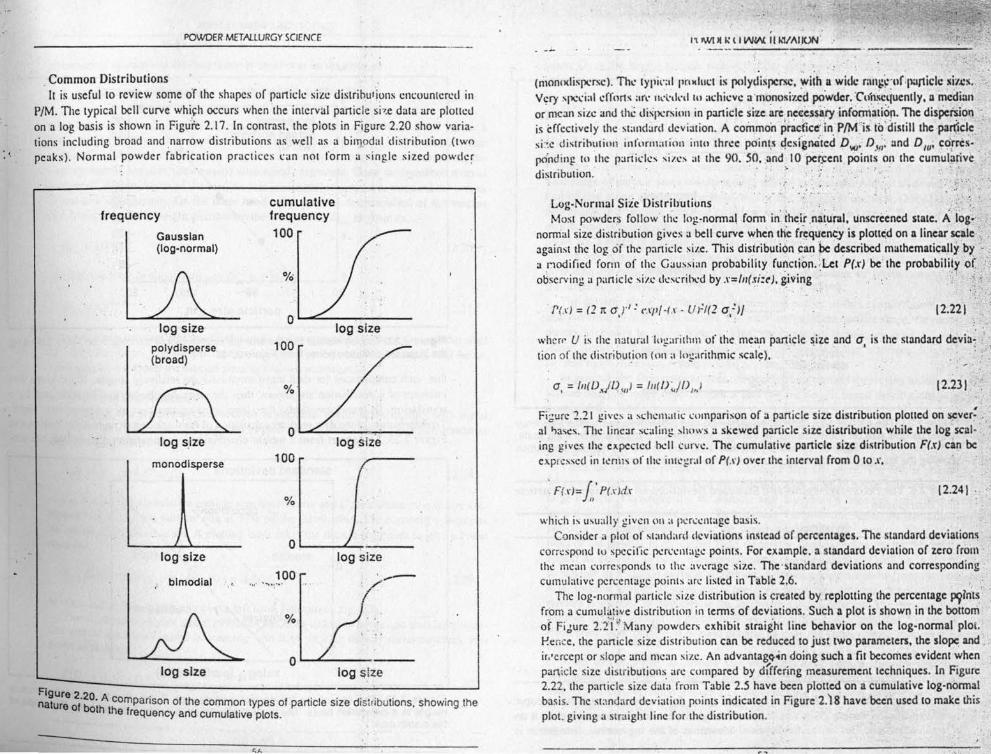
ithmctic mean as
iion or p:trltck,'ovides a weightzc information.scs. The weightDopulation basedd in Figure 2.19
obvious differ-he median sizes
: allows culculn-,ctal dcnsirv /) :'
•. ,'/1
12.~II
s determined all
e Population dis-
--
POWDER METALLURGY SCIENCE
. Common DistributionsIt is useful 10 review some of the shapes of panicle size distributions encountered in
P/M. TIle typical bell curve' which occurs when 'the interval panicle si·,.e data are ploucdon a log basis is shown in Figu'ie 2.17. In contrast, the plots in Figure 2.20 show varia-tions including broad and narrow distributions as well as a bimodal distribution (twopeaks). Normal powder fabrication practices can not form a single sized powder
frequency
GaussIan(log-normal)
cumulativefrequency100
%
o~~-....,....:---log sizelog size
poiydisperse(broad)
100
%
o •....•~--.....,..;...--log sizelog size
monodlsperse
o '-----'-~----log size
;---log size
100blmodlai '. '11' ~ "" .~ •••
%
OL-~------log size log slze
~~~~:: ;"~-hA comparison of Ihe common types of particle size distr~butions. showing theI the frequency and cumulative plots.
. -;." IW! JI,.;IIINW II J.V J\IIOl'f
(rilonn<iispcrse). The t"ypi\'al pnxluc: is polydispcrsc, ~iih II wide rall~~:uf:Jlartich: lIii'.cs. -.Vr;ry special efforts a(\' lll'l'Ik'd tll achieve amonesizcd powder. rllh~.lluently. II medianor mean size and the dispersion in particle srze.arene<i:e$S~:tyinform;lIio!l. The disPeisioq-,is effectively the standard deviation. A common pr3c~ice'in P/Mh io·distillthepart;icle ..si:·.e distribution information into three points c!esi~~'icci /)vii D.I!;: and DIU' corres- .pOmling III the pari ides sizes at the 90. SO.~and' 10 petceru, paints on the cumulativedistribution. . ' ".' , , : / , .',' . , . . . . ', ::..
. :
Log-Normal SizeDistributions ',' ., ;. z . ..' '~'. ':.
Most powders follow the log-normal form in th~ir .nril.ur.&I.unscreened state. A log! ' 'normal size distribution gives a bell curve when die fr~quen~y is plotted on a linear scale-, .against the log of the panicle size. This distribution !=ant>edeseribedmathematically .by,·· .',•a modified form of the Gaussian probability function,;Let P(x) be the probabilit~ ofobserving a part iclc size described by .r=!I/(si:r ),~iving " , ' . . ':.' "'.
12.211
when' U is the natural 'Io\!:,rithlll of the mean particle size and CT is the standard devia- '- ':. . .' .. ..tion of the distribution (on a logarithmic scale).
12.231 -.
Figure 2.21 gives a xchcm.u ic comparison of a panicle size distribution ploued on S/:ver: -,al lJa:c:s. The linear scaling shows a skewed particle size distribution while the log seal.:, 'ing gives the expected bell curve. The cumulative particle size distribution Fix) c!n beexpressed in tenus of the iutcgr.rl or P(.I'} over the. interval (rom 0 to r,
: Ft.r)= t:Ptxtdxill \2.241
which i~ uw:III}' given on :, pcrccnrage basis.Consider a plot of standard deviations instead of percentage . The standard devlmions
correspond to specific percentage points. For example a standard deviation of zero from' .the mean corresponds III the average size. The 'standard deviations and corresponding'cumulative percentage points arc listed in Table 2.6. , '.
The log-normal particle size distribution is created by replouing the percentage P91nls 'from a cumulative distribution in terms of deviations. Such a plot is shown in the bottomof FiJure 2.21':' Many powders exhibit straight line behavior on the log-normal plot.Hence, the particle size distribution can be reduced to juS! two parameters. the slope and ,.ir.rcrccpt or slope and mean size. An advantage-in doing such a fit becomes evident whenparticle size distributions are compared by d(ffering measurement techniques. In Figure2.22. the particle size dat;, from Table 2.5 have been plotted on a cumulative log-normalbasi. The standard deviation points indicated in Figure 2_) 8 have been used to make thisplot. giving a straight line for the distribution.

I'OWDl~ M.lllII.tUh'l,n( IINIt /., '1'.'/./ f'. ""f"\' "/.'1/'1/1, f1l
cumulative percentstandard deviations2r----.--r-"".-rr.-----~
frequencyplot
IIn~ar
frequency aplot
log -1
cumulative -2plot 20log
percentI.
b)
percent
c)
cumulativepercent··· 50 100
particle size, ~m
Figure 2.22.'-The Ioq-norrnal particle size orstnbution plot of the data from Table 2.5 usingthe standard deviation points from Figure 2.18. . .
that such comparisons (or data transfurm.uionx) are relatively simple. If tl~e slope andintercept ofa distribution are known. then the other distribution can be estimated by atranslation. In 'transfonnarions. the slope remains constant on a log-normal basis.Transformation ~f the data requires culcul.u iun of the displacement parameter 8 shown inFigure 2.23. To convert from a weight distribution to a population distribution. the dis- .
. , -d)/standard. "" log-normal ;i,. ,
devlatl~~.. ' plot
~~----------~Iog
FJgure 2.21. The particle size distribution shown on four different bases; a) the frequencyversus particle size .on a linear scale. 'b) the frequency versus particle size on a log scale,c) the cul'!'lulative frequency versus log particle size. and d) the log-normal distributionshowing the standard deviations as a function· of the log particle size..
959080706050403020105
200
standard deviationsJ',' :
s =6.908/m
Table 2.6. The Percentage Points and Stan~ard Deviations on a Cumulative ParticleSiu Distribution POPUlatiOn//!,,,,,,
median /'a ······················>l················
,,,/\
,/slope=m,,,,,
deviations percentage
-2.0-1.5-1.9.-0.50.00.5 ..1.01.5
.2.0
2.286.68
15.8731.8550.0069.1584.1393.3297.72 x=log,o (particle size) "
Reali the problem of comparing analyses taken from screening and microscopic'measurements. Screening gives size data on a weight basis while microscopy gi les it on• population buis. One of the fundamental attractions of the log-normal distribution is
Figure 2.23. The use of the log-normal particle size distribution to transform from aweight to a population basis. The vertical translation distance 0 depends on the slope ofthe distributi~n. .
.•. c'-- _H~" -.. i_(a
.I
\'
Ie 2,5using
e slope andatcd by a
rmal basis,1) shown inon. the dis~ '
m from ae Slope of
POWDER MET,AJ.LUI~GY SCIENCE
;I1.
placement is upward and the magnitude is dependent on the slope m
1) = 6,908'1 m 12,251
whcn the panicle size is expressed on a base-l 0 logarithmic scale. I ore, 6.90R equals :Itimes the loge IO. where e is the basis for the natural logarithm and :I represents the sizeexponent in Equation 2.21. To convert from a population to a weight distribution. thedisplacement is negative (downward) with equal magnitude. Once the transformation iscompleted. determination of the median size is straightforward (zero standard deviationson the new distribution). On the other hand. mathematical detcrmination of the mediansize is possible. For a weight distribution the median size D., •. is given as.
12.261
and then the median population size 0 is g~'~:~'as/1111 •
D = /O'lh+oYm"'I' .
12.271
where" is the intercept (the standard de'viation corresponding to the I prn panicle size)and 11/ is the slope, The steeper the particle size distribution. the smal!er 1) will be or.alternatively. the closer the median sizes by the two techniques.
Other Size DistributionsGenerally. the log-normal distribution is the most useful when dealing with metal
powders. Others arc sometimes applied to panicle size data. One is the Rosiu-Rammlerdistribution. given as follows:
F(D) = I - exp!-D"ID/)
where F(D) is the cumulative particle size distrib~tion and 0 is a characteristic size cor-respo~ding to D,l~' the 'panicle size a(::n%' ~;;"ihe di'stributio~.' The exponent 1/ indicatesthe W.ldth of thc distribution. A plotting basis takes the double logarithm to give a lincirequation. .
log,ofll/!I - F(D))) ;" 1/ log (D) - 1/ 10" (0 )'U "'II II 12.291
where 1/ is the '1 f h If' ,s ope 0 t e p ot 0 the left hand Side versus 10gio(D).The Andreasen . I . di 'b' . .. . panic e size istn unon has been linked to optimized packing proper-
ties and IS sorn t' . fl' . .. , .. e imes use u m working with high packing density metul powders. It isgiven as follows: '
F(D)=AD"ID"L 12.301
-----.---------'------- ._-_ .._-(,1)
where D,. is the largest particle size. A similar distribution is the Dinger-Funk distribb-.tion which uses both th~ smallest size Ds and largest size DL•
j F(D) = (0" - D") 1(;) ··0 ")~ , \
...'Problems in Particle Size A'"a'Y~is
12.lll
There arc several problems with particle siz~ ao~ly~is.lt is quit~. difficult to resolve a:'~id.e ran~c of particle sizes simultaneously during an analysis. Almost all devices·hav~·;i. lir.iitcd size range they can accurately resolve and .l.anatyze at one time. Often thnt Hmiia.,tion results in a realistic dynamic ratio less thap th:e advertised runge. If the particle. size:distribution is broader than that, the methods are noi.accuraie. Additionally. each tech •. 'nique has a range of optimal -uirability, For sieves .. it i~ generally above 38 jJm.,Optical.'microscopy is restricted l\l purticlcs aboveupproxlmutely lum. Techniques such a:~scdi-.'mentation arc only applicable l\l a narrow size r.ll}ge :~cause of limltations imPosed'by -the fundamental physic». - . .
The particle shape problem was emphasized earlier in this chapter; more on shaPe >
analysis follows in the next section. The more irregular the particle shape.rhe more parol"meters necessary to size a particle. Most rncasurement techniques assume a srhcri~ollsl.apc, Accurate description of shape and its variation with size is tedious. It is notewor- '.'tll:' rh,u shape. like size. is a distributed property or" pOwder.· . ..: ,," ,
; In general. the finer particle sizes arc poorly-characterized .by sieving techniques. Tli~·.limited ;m;t1ysi~ range coupled with a bias toward weight based dimibutions results'ii\:,disregard for the filler particle sizes. In many instances; the disregard is not \\Iarr~ied.sin~e t~e fil~er particle, Il(l'~':'~ the greater su'rface .~rea and kinetic activity. Ai. a ~i~e::rauo '11 25. It takes 15625 Ill' the smallest particles 10 equal the malls of just one' ontlc':'largest pan icles. . .
There arc common problems with automatic size analyzers. The finn is COincidence;": When more than one particle i~ in the detection zone of IU1 analyzer. they are si~(fas onelarge particle. Conscqucurly. the particle size distribution becomes artificially skewet1' .toward the coarse particle sizes. To minimize the problem. lower the ccncerurationofpowders inthe detector wile. For the streaming devices. that requires dilute conceritrl!~:tions of the powder in the carrier tluid. Secondly. agglomeration causes firie particles to'appear as coarser particles. Dcagglornenuion requires agitation. milling. and chemica)treatments to maintain particle dispersion. Another problem results from the relativCiy .h 'fi . . <'IJn SpeCI IC gravity 01 most metal powders. Streaming techniques assume a uniform ~random dispersion of particles in the feedstock for the detector. The measurements-can'become qi~~d because of preferential settling of the coarse particles. To aS5u~e mini-mum error from sell ling. it is good practice to pass the entire sample through the detec-tor. ;t~ .
Many examinations of particle size analyzers have been performed. Under criticalassessment. it appears that the particle size distribution can be reproduced with.a 2 per-cent to 3 percent variation. Figure 2.24 illustrates the cumulative particle size distribution ..of a coarse spherical iron powder. Between instruments it is common to see at least a
/01

1\)\V()1 II MllAllUI;C,y \(11 Nll .
cumulative mass percent
100 r----~----_;:==_=~:;:iiI""'_,
80 Iron spheres60 urn
" ;.''''
20. - .
" .O~'------~~~~~~~~~----~10 100
particle slze,llm
FIgure 2.24. A demonstration of scatter for particle sizes analysis results using Ihe samepowder and seven measurements of the size distribution with four laser scatteringdevices. The powder was nominally a 60 101mspherical iron. Note the variation at thp. 0'0and 010 particle sizes. '
s,10% difference in the median particle size. and many instruments will disagree by 30percent to SO percent. It is inappropriate to assign high accuracy to panicle size distribu-
. tions.
: :Partlcle ShapeParticle shape inf1uence~ packing. flow. and compressibility, provides information on
the powder fabrication route, and help~ explain many processing characteristics. Because,iUs difficult to quantify panicle shape, qualitative descriptors are frequently used to con-. vey a sense of the shape. Figure,t.2S gives a collection of particle shapes and shows the.appropriate qualitative descriptors.
Particle shape varies with size and manufacturing technique, A panicle size analysiswhich assumes I constant shape Could potentially have a large error. For many analyses,
~ . .a 'simple quantitative shape desc~iptor proves adequate. The most straightforward
62
1'( 1\v1 II ,.', '1'\1"\' II 1I11A III IN'
-----------------------------------------~----------------.Q.spherical
~ ~angUlar
c!) tear drop'
. ~CUblc
/'CiCUI,ar
:Jjf~egular ...'e' ··'·~am,ental
fI.ake~rous
~/':.\t· sponge orporous
~yllndrical
'();iPOlygOnal'. rffI:? ~ggregateV dendritic .: .
Figure 2.25. A cotlccuon of possible particle shapes and the suggested qualitativedescriptors. .
descriptor is th~ aspect ratio. defined as the maximum particle dimensio~ divided by theminimum particle dimension. For a sphere. the aspect ratio is unity, while for a ligamenta value near 3 to 5 is more likely. A flake particle can have an aspect ratio in excess of10. and in some instances can be as high as 2()(). Generally, microscopy techniques aremost appropriate for quantifying shape.
Consider the irregular shaped particle diagrammed in Figure 2.26. Various shapeparameters result from the projected image. Particle shape can also be expressed by theratio DjD A' where Do is the diameter or the .outer embracing circle and DAis the equiva-lent spherical diameter based on the projected area. By far. the microscopy based shapedescriptors are the. easiest to understand and arc relatively easy to obtain from projectedimages. , ,
A more complex shape parameter can be generated from a profile analysis of a parti-cle. If a radial coordinate system were centered inside a panicle. such as in Figure 2.27,then a plot of the surface profile could be constructed. The plot might look as shown onthe right in Figure 2.27. The tracing of the surface position becomes a contour in terms
.\1.1..'-;': •.
"
t .,
\;,
. :",;
. .:':
. :":
.~':.r..;. " ;",
I, :,
I.
, ."'" "
I •• '''~'.: ; l..~·
..'0
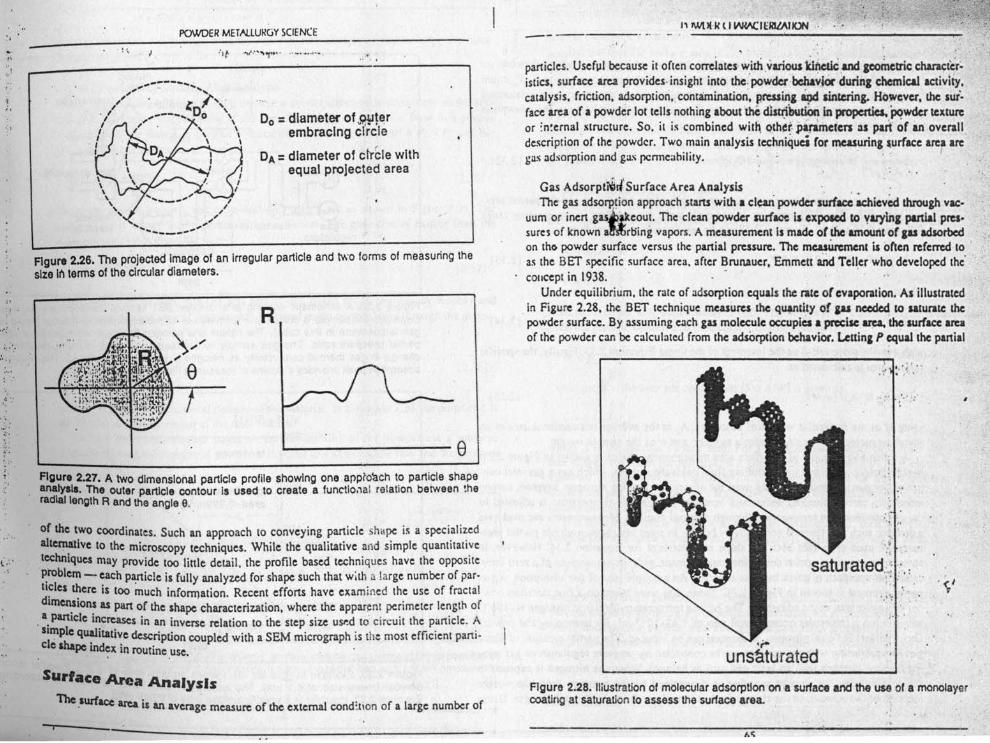
nlilalive
tJ by theigaillcilt~ce~s ofues are
S shapehy the
cquiva_shape
ojected
a pani-c 2.27.own onI tenns
.r:.....
.:...,'.: ....
POWDER MET.A.l.LURGY SCtENCE•." ,-....
, '
'"
,I;,
,,;,'
'•...... _--_ ..•','
e
""-~---""", .J', '
" t; l' ,, , ~--- Do \, ".... ,I' \I' ,
'/ \I
Do = diameter of "c;wl~rembracing circle
DA = diameter of ctrcle withequal projected area
Figure 2.26. The projected Image of an Irregular particle and two forms of measuring thesize 11'1 terms of the clrcular diameters.
,.R
::':
'1.,
~'..' ',.
,.;.' ~'.:
I, ;
Figure 2.27. A two dimensional particle profile showing one appioach to particle shapeana/yala. The outer particle contour Is used to create a tunctlonal ralation between theradial length R and the angle e.
or the lWOcoordinates. Such an approach to conveying particle shape is a specializedal~lve 10 the microscopy techniques. While the qualitative and simple quantitati:veleclulIques mlly provide too little detail. the profile based techniques have the opposite~roblem - each particle is fully analyzed for shape such that with a large number of par-1I7les there is too much information. Recent efforts have examined the use of fractaldlmen.sions as part of the shape characterization. where the apparent perimeter length of
,a. panicle increases in an inverse relation to the stepsize used to' circuit the particle. ASimple qualitative description coupled with a SEM micrograph is the most efficient parti-cle shape ind' .~x in routine use.
Surface Area Analysis1bc .surface area is in average measure of the external condition of a large number of
" , , . ,
particles. Useful because, it often correiates' with ,various ~;and ~etric chara~te'r~istics. surface area provides. insight into the. powderbc:ha •••ior·durinl chemical activity.catalysis. friction. adsorption. contamination', P.l'eSS~1 i9d Iintuina. However, the sui-face i.ru of a powder lot tells nothing about the dlsttlbut10n In propcrtiea. pqwdcr textureor :n~ernal structure. So, it is combined with. C)thti'·paramerers as part or an overalldescription' of the powder. Two main analysis techniquei ror measuring lurface area an:gas adsorption and s= permeability. ',' '. ' j,
Gas Adsorpt~ltSurface Area Analysis . . .The gas adsorption approach starts with a clean powder surface achieved through vac-
uum or inert gas~Jkeout. The clean powder surface Is cxpolCd CO VlI)'inl partial pres-sures of known a!sl)roing vapors. A measurement Is made or the amounl or IU adsorbedon tho powder surface versus the panial pressure. The mcuUrcmcnl Is often referred to .as the BET specific surface area, after Brunauer, Emmett ancs Teller who developed the'concept in 1938. -
Under equilibrium. the rate of adsorption equals the rate or evaporation. As illustratedin Figure 2.28. the BET technique measures the qUJl\llty of iU needed CO saturate thepowder surface. By assuming each gas molecule occupies a pRelsc area. the surface areaof the powder can be calculated from the adsorptlon behavior. Leuinl P equal tbe panial
. <;'
.... ', ,
.'
. /.
",'!
.;-unsafurated
Figure 2.28. lIiustration of molecular adsorption ona surface and the usa of a monolayer'coating at saturation to assess the surface area.
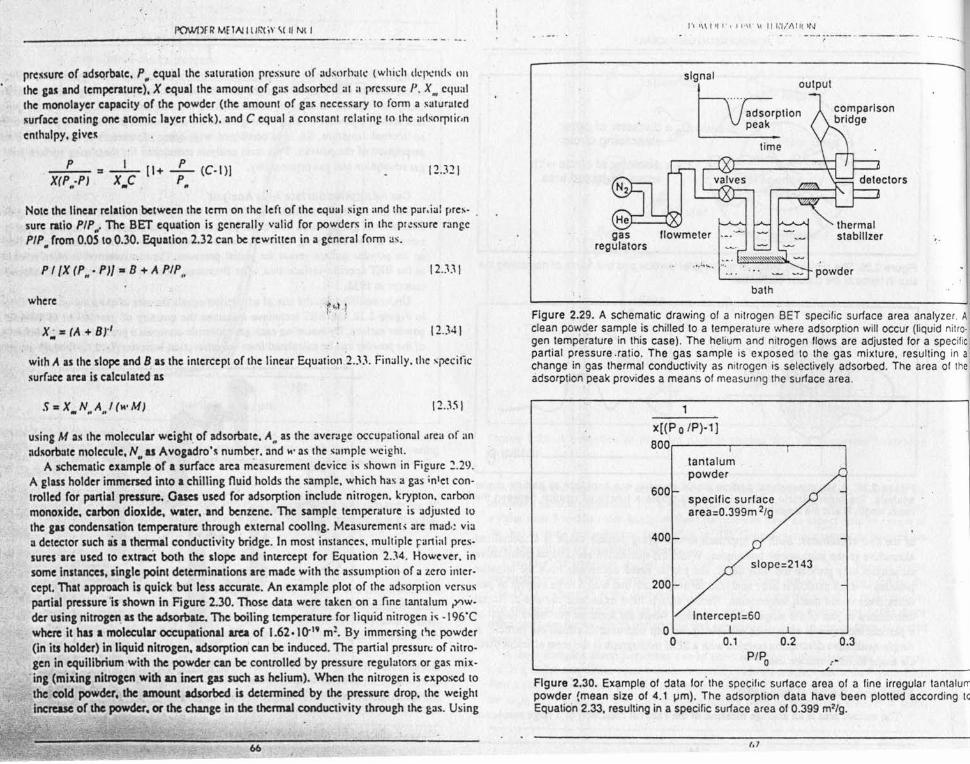
I'OWDFR Mf1A1IIJl~(iY \( " Nt I
pressure of adsqrbale, f" equal the saturation pressure of adsorbate (which depends Oil
the gu and temperature), X equal the amount ofgas adsorbed at a pressure P. X •• equalthe monolayer capacity of the powder (the amount of gas necessary to form a saturatedsurface coating one atomic layer thick), and C equal a constant relating 10 the adsorptionenthalpy. give~
P ,. _1- [1+L- (C.I)]X(P,;P] X.C P"
12.:\21
Note the linear relation between the term on the left of the equal sign and the par.ial pres·sure ratio PIP". The BET equatlon is generally valid for powders in the: pressure rangePIP" from O.OS to 0.30. Equation 2.32 can be rewritten in a general form as.
P IIX (PH' P)/. 8 + A PIP" ID:\I
where .
X:''' (A + 8}'1 ID41
with A as the slope and 8 as the intercept of the linear Equation 2.:\:\. Finally. the specificsurface area is calculated as
S •• X.N ••A•.'( .••·M] 12.:\51
using M IlS the molecular weight. of adsorbate, An as the average occupational area of anud~orbule molecule, N••uAvogadro's number, and I<' as the sample weight.
A schematlc example or a surface area measurement device is shown in Figure 2.2lJ.A glass holder immersed into a chilling fluid holds the sample. which has a gas inlet con-trolled for panial pressure. .Oases used for adsorption include nitrogen. krypton. carbonmonoxide, carbon dioxide, water, and benzene. The sample temperature is adjusted tothe gu condensation temperature through external cooling. Measurement, are made viaa detector such lis a thennal conductivity bridge. In most instances. multiple partial pres-sures are used to extrac't both the slope and intercept for Equation 2.:\4. However. insome instances, single point detenninations are made with the assumption of a zero inter-cept, That approach is quick but less accurate. An example plot of the adsorption versuspanlal pressure 'is shown in Figure 2.30. Those data were taken on a fine tantalum ;Ylw.der using nitrogen. u the ad$orbate. The boiling temperature for liquid nitrogen i~ -196'Cwhere it hu a molecular occupational area of 1.62. \0.19 m!. By immersing l'le powder(in its holder) in liquid nitrogen, adsorption can be induced. The partial pressure of nitro-gen in equilibrium·with the powder can be controlled by pressure regulators or gas mix-
'ing (midn, nitrogen wilh an inert gas such as helium). When the nitrogen is exposed tothe cold powder. the amount adsorbed is detennined by the pressure drop, the weightincrease of the powder. or the change in the thennal conductivity through the gas. Using
66
I', 1111111'.11'\1' I' II 1,'1/" II! IN--.------ ---_.I
f.I
\.\
\I
I
signalOUIpUI
time
valves
flowmeterthermalstabilizer
powder'-- ...Jbath
Figure 2.29. A schematic drawing 01 a nitrogen BET specific surface area analyzer. Aclean powder sample is chilled to a tempera lure where adsorption will occur (liquid nitro-gen temperature in this case). The helium and nitrogen flows are adjusted for a specificpartial pressure .ratio. The gas sample is exposed to the gas mixture. resulting in achange in gas thermal conductivity as nitrogen is selectively adsorbed. The area 01 theadsorption peak provides a means of measuring the surface area.
,x[{P 0 IP)-']800~-----.------~----~
tantalumpowder
600specific surfaceareaec.assrn 2/g
400
slope=2143
200
lntercepteso
O~----~------~----~o O~
Figure 2.30. Example of data for 'the spccitic surface area of a fine irregular tantalumpowder (mean size of 4.1 urn). The adsorption data have been plotted according to'Equation 2.33. resulting in a specific surface area of 0.399 m2/g.
(.7
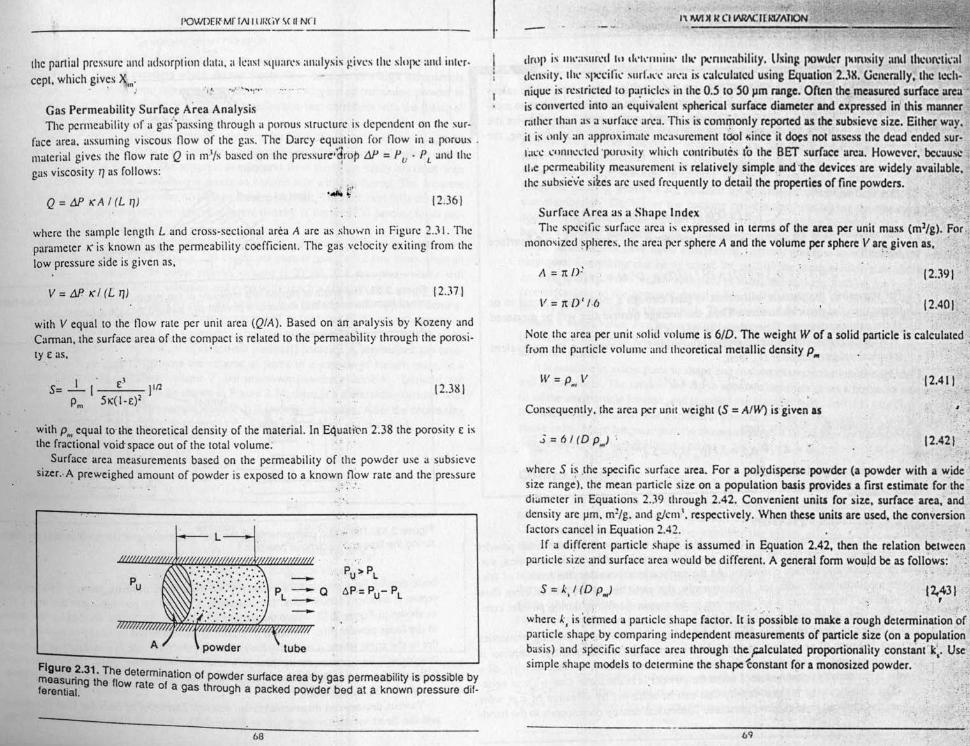
Ison
:]ectorsl
! area analyzer, Aoccur (liquid nitro-Isted lor a specificura, resulting in ad. The area of the
regular tantalurTlted according 10'
POWDER" Mr TAl It JI~(iY \( II NCI
the partial pressure and adsorption data, a least squarl's analysis gives the slope ;IIHIinter-cept. which gives X .
. • .11'.I~
Gas Permeability Surface Area AnalysisThe pcnncability of a gas:'passing through a porous structure is dependent on (he sur-
face area. assuming viscous flow of the gas, The Darcy equation for flow in a porous.material gives the tlow rate Q in m,l/s based on the pressur~l~rop M = Pu . PL and thegas viscosity T) as follows:
Q=MK"A/(LT)) 12,361
where the sample length Land cross-sectional area A are as shown in Figure 2.3 I, Theparameter K" is known as the perrneability.cocfflcienr. The gas velocity exiting from thelow pressure side is given as.
12.371
with V equal to the flow rate per unit area (Q/A). Based on an analysis b), Kozeny andCannan. the surface area of-the compact is related to the permeability through the porosi-ty e as.
I ' E,Is= _[ ]1/2
P"' 5K( "E)212J!l1
with PHI equal tothe theoretical density of the material. In Equat-ion 2.38 the porosity E isthe fractional void' space out of the total volume:
Surface area measurements based on the permeability of the powder use a subsievesizer.·A preweighed amount of powder is exposed to a known ,f1?Wrate and the pressure
..' . . .
PI,.!)o PLtoP = Pu- PL
------
A powder tube
Figure 2.31. The deterrnt rmeasuring the flow rat I~a Ion 01 powder surface area by gas permeability is possible byferential. e a a gas through a packed powder bed at a known pressure dit-
68
drop is IIII'aslln.'1I III d,'t\'rlllill,' Ilk' pcnlll.'ahility. llsin~ powder pIIRlllily an,llhcuMi~'aldensily. Ihl' specific xurt.u'c area is calculated using Equation 2•.l1(. vCllcrnlly. the tech-niquc is restricted 10 p,'.rtic.:1l:sill the 0,5 to 50 um range. Often the measured surface otreais converted into an equivalent spherical surface diameler and expressed in' Ihis mlUlllCrrather than as a surface area. This is commonly reported as lhe subsieve size. Either wuy.it i~ \1111)'an approximate measurement 1601 since it docs nol IL~SCSSthe dead ended sur,f;ll'~ connected 'poruxity which contributes to the 'BET surface area, However. becauseu.e permeability measurement is relatively simple ~n(hhe devices are widely available. ~the subsievc si~es arc used frequently to detail the properties of fine powders, " ;,';
.....Surface Area as a Shape Index , 'The specific surface area is expressed in terms of the area per unit mau (ml/g), Fo;.,.
monoxizcd spheres, the area per sphere A and the volume per sphere \I arc:,given as. :
\I = n 1)'/,6 12.401
Note the area per unit solid volume is 6/D, The weight W of a solid particle is calculatedfrom the particle volume and theoretical metallic density P",
IV = P., V 12.411
Consequently. the area per unit weight (S = A/W) is given as
.J=o/(DP.,J " 12.421, ..
where S i~ the specific surface area, For a polydisperse powder (a powder with a wide'size range). the mean particle size on a population basis provides a first estimate for the'di ••meter in Equations 2.39 through 2.42, Convenient units for size. surface area. anddensity are 11m.m2/g, and g/cnr'. respectively, When these units arc used. the conversionfactors cancel in Equation 2.42.
If a different particle shape is assumed'in Equation 2.42. then the relation betweenparticle size and surface area would be different, A general fonn would be as follows:",:
,,
S = k.' (D p ••J \2,431. ,, .' .. .':." ", . ,'.. j\":
where kJ is termed a particle shape factor, lr is possible to make a rough determination of,panicle shape by comparing independent measurements of particle size (on a populatlon ;basis) and specific surface area through theplculated proportionality constantk'. Use"simple shape models to determine the shape 1:onstant for a monosized powder, ' ' ,
: -.:
69
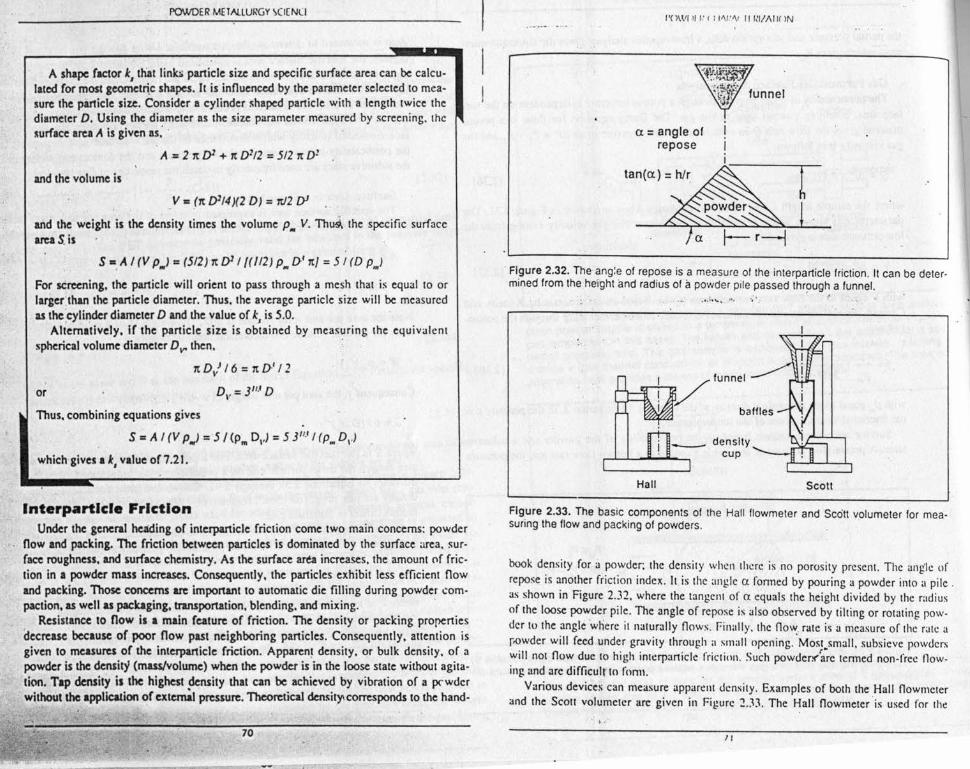
POVJDER METN.LU~GY ~CI(NLI
A shape factor Ie, tllat Iinkri panicle size and specific surface area can be calcu-lated for most geometric shapes. It is influenced by the parameter selected to mea-sure the particle size. Consider a cylinder shaped particle with a length twice thediameter D. Using the diameter as the size parameter measured by screening. thc~urface area A is given as: '
A = 2 1t [)1 + Tt D112 = 512 1t D!
and the volume is
V. (1t [)114)(2 D) = 1[/2 [)1
and the weight is the density times the volume P. V. Thui the specific surfacearea S. is
S -, A I (V P.) = (512) 1t D11/(//2) P,. D' Tt/ = 51 (D P••i
For screening, the particle will orient to pass through a mesh that is equal to orlarger:than the particle diameter. Thus, the average particle size will be measuredas the cylinder diameter D and the value of 1:,is 5,0.
Aliernatively, If the particle size is obtained by measuring the equivalentspherical volume diameter DV' then,
Tt D/ 16 = Tt D' I 2
D" = 311,1 Dor
Thus. combining equations gives
S = A I (V P••) = 5 / (Pm D,.) = 5 311•1 I (P•••D,.)
which gives a Ie, value of 7.21.
II
\ #
Interparticle FrictionUnder the general heading or interparticle friction come two main concerns: powder
flow and packing. The friction between particles is dominated by the surface area, sur-face roughness, and surface chemistry. As the surface area increases. the amount of fric-tion in a powder mass increases. Consequently, the particles exhibit less efficient flowand packing. Those concerns are important to automatic die filling during powde! com-paction, as well as packaging, transportation, blending. and mixing, '
Resistance to now il a main feature of friction. The density or packing propertiesdecrease because of poor now past neighboring particles, Consequently, attention isgiven to measures of the interparticle friction. Apparent density. or bulk density. of apowder is the density (mus/volume) when the powder is in the loose state without agita-tion. Tap density il the highest density that can be achieved by vibration or a pcwdcrwithout the application of extemiJ pressure. 'Theoretical density corresponds to the hand-
70
\,,I,
"OW""." : 1"1'". " III/Allr)N
a = angle ofrepose
tan(a) = hlr
"Figure 2.32, Theang:e of repose is a measure of the interparticle friction, It can be deter.mined from the height and radius of a powder pile passed thr?ugh a funnel.
••• ~ ••••" II,
Half Scott
densitycup
Vfunnel "
baffles
Figure 2.33. The basic components of the Hall flowmeter and seen volumeter for mea.suring the flow and packing of powders.
book density for a powder: the density when there is no porosity present. The angle ofrepose is another friction index, It is the angle a formed by pouring a powder into a pile"as shown in Figure 2.32, where the tangent of a equals the height divided by the radiusof the loose powder pile. The angle of repose is also observed by tilting or rotating pow-der to the angle 'where it naturally flows. Finally, the [low. rate is a measure of the rate apowder will feed under gravity through a small opening. Mos!.small, subsieve powderswill not flow due to high interparticle friction. Such powderxarc termed non-free flow-ing and arc difficult to fonn,
Various devices can measure apparent density, Examples of both the Hall flowmeterand the Scott volurnercr are given in Figure 2,:n, The Hall flowmeter is used for the
, ,.", .
/I

r can be deter-
ter for mea-
h~ allg'le ofIllto a pile,the radius
tating pow-f the rurc ae POwders-free now-
flownJctered for the
POWDER METAllURGY SCIENCE
coarser particles measuring both the flow rate and the apparent density. The Scott deviceis applied to smaller powders which do not freely flow because of a high interparticlefriction, The Arnold meter minimizes powder flow by using a ring containing powder todirectly fill a 20 ern? cylindrical volume. That technique best correlates with the filling. ofdie cavities in powder compaction operations., ' ,
The flow rate is usually expressed as the time for 50 g of powder to flow through the, Hall flowmeter. Short flow times indicate free flowing powders while long times indicatehigh interparticle friction. The apparent density and flow times are easily obtained withthe Hall flowmeter by combining a precision volume cup with the funnel. The apparentdensity is the weight of powder divided by the cup volume. The precision falls between Ipercent and 5 per~ent and .the, typical apparent density is between 30 percent to 60 per-cent of the theoretical density. '
Another simple test for interparticle friction is the tap density. Powder is vibrated in acylinder for IOOOto 3000 cycles at 284 cycles per minute using '1 3.2 m~ throw from ~neccentric cam. Usually the initial powder volume is 25 rnl. The occupied volume Willdecrease rapidly with initial vibration and eventually reach a plateau value. giving the tapdensity as the weight divided by the final volume, It is higher than the apparent density,Both the tap and apparent densities can be expressed as fractions of theoretical density.
The pycnometer density is sometimes given to assess the theoretical density of anunknown powder or the amount of closed-off (internal) porosity. A pressurized gas (usu-ally helium) is used to measure the volume of pores in a powder of known mass. in asample chamber of known volume V, but unknown powder volume VI" Initially. thechamber is at a pressure PI" As shown in Figure 2.34. there is a calibration chamber withvolume V" connected to the sample volume. It is initially evacuated. After the connectingvalve is opened. the pressure decreases to Pr Applying the ideal gas law gives.
P, (V - V ) = P, (V - V + V)J t • J " "
\2.441
"," -,,' ' .••·1···
, pre!jsuresensor
~calibrationchamber
/'" (volume = V e)
~~~vacuumvalve
samplepowder chamber(volume = V p) (volume = V 5)
Figure 2.34. A schemSitic d' 'using a p cno t lag ram of the true volume measurement for a loose powderpressure ~ea:~eer. The powder of known weight is placed into the sample chamber. anded calibration VOluments are made before and after equilibration with an initially evacuat-me.
72
Thus. as the only unknown. the powder volume can'be calculated.
V = V + V (I - PIP )./I' J'" :
(2.45)
The powder mass divided hy the volume gives the pycnometer density. Since sealedpores in the particles can not be accessed by the test gas, the pycnometer density can belower than the theoretical density. The typical accuracy is 1%., In most all applications involving powders, high packing densities are desired.
Improved packing densities arc possible by adjustment of the particle size.. shape, andsize distribution. The higher the packing coordination, the higher the observed powderoensity. The f.o;ordination number is the number of touching neighbors that any p~iclehas in a po~tr ensemble. and is synonymous, with the number of nearest neighbors.Small particles will have more interparticle friction, giving a lower number of nearestneighbors. Everything else being equal, the smaller the mean panicle size, the lower theapparent density. For a coarse spherical powder, the packing fraction for loose p~cking'(corresponding to the apparent density) is usually near 60% of theoretical and the tapdensity is near 64* of theoretical. The cocrdinatlonnumber exhibits a distributionaround a mean value. For louse packed, monosized spheres, the mean coordination is..'between six and seven. Generally. in random packing, spheres pack more efficiently thanany other shape. .
It is possible to assess particle shape and friction characterization through the apparentand tap densities. The ratio of the tap to apparent densities gives a signature characteris-tic of the interparticle friction. and is called the Hausner ratio. useful in categorizing rela-rive interparticle friction. For a spherical powder. the tap to apparent ratio will be slightlyabove unity. More irregular particle shapes undergo a larger density increase with vibra-'ion. resulting in a higher Hausner ratio. .
C;ompressibilityOne of the main uses for metal powders is for fabricating complex shapes by com-
paction. Accordingly. the compaction behavior is an important characteristic.Compressibility. or compactability, measures the ability to densify a powder under anapplied load. The typical test geometry is a sjmple cylinder or rectangle. The die isloaded with powder and the density is measured after compaction at a predeterminedpressure. often near 414 MPa (corresponding to 30 ton/in1 or 60,000 psi). That is termedthe green density and is the basis for expressing the compressibility. For a com~tiongrade of iron or steel powders the green density might be 85 to 90% of theoretical. Aparameter used in tool design is the compression ratio C/I'
·r·, 12.46}
where \lL is the volume of the! loose powder, Vc' is the' volume of the compacted powder,p. is the green density. and P" is the apparent density. A high interparticle friction willgive a low initial density. but other factors such 3S panicle size, chemistry, lubrication.
73
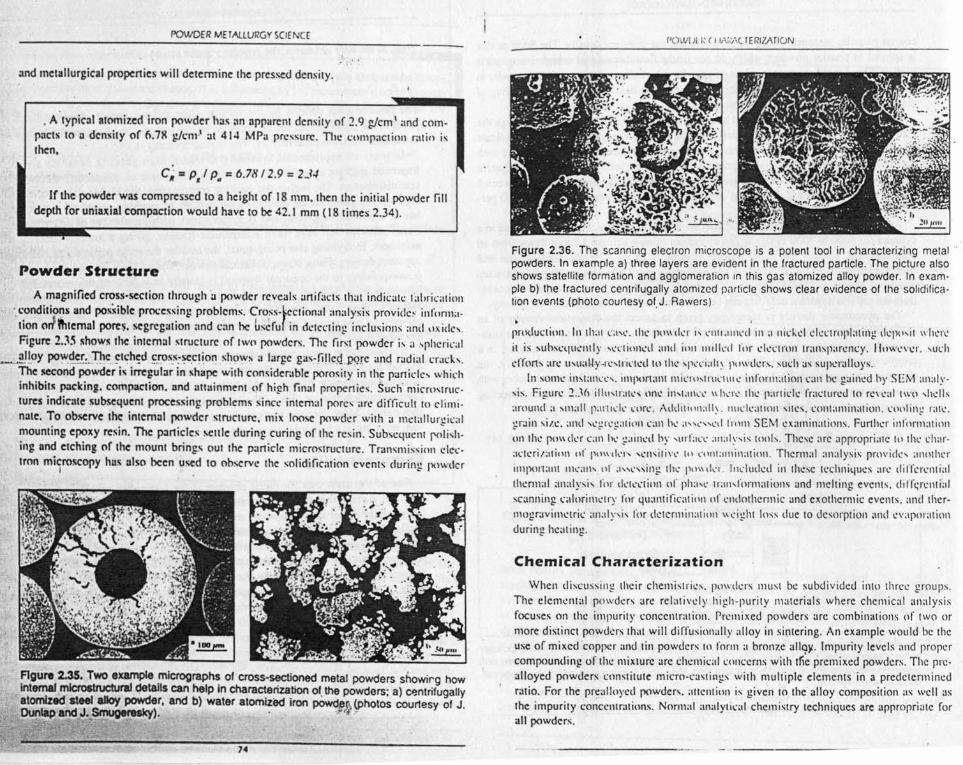
POWDER METAlLURGY SCIENCE----------------------------------------------------------and metallurgical properties will determine the pressed density.
. A'typic;!1 atomized iron powder has ,10 apparent density of 2.9 glcm \ and com-pacts to a density of 6.71( gjcm" at 414 MPa pressure. The compaction ratio isthen.
c, = P, / p. = 6.7H /2.9 = 23-1
If the powder was compressed to a height of 18 rnrn, then the initial powder filldepth for uniaxial compaction would have to be 42.1 mm (18 times 2.34).
Powder Structure
A magnified cross-section through 'a powder reveals artifucts that indicate 1';lbriCltion
1 .conditions and possible processing problem's. Cro,ss-~ectional analysis provides inlonna-tion orliftlternol pores, segregation and can he Lsefu{ in detecting inclusions and oxidcv,
. Figure 2,:l~ shows Ihe internal structure of two powders. TIle first powder i~ a ~pheric;d_ .-.!!!l.oy pow.der,_1]le, ~Ich~d ~_r:os.s~~,C!!ol1show~ a large gas-fjlle.(LW.fe and radial crack-,
. ' ~ The second powder i••irregular in shape with con ••ider ••ble porosity in the panicles whichinhibit!! packing. compaction. nnd attainment of high final properties. Such' microxtruc-lures indicate subsequent processing problems since internal pores arc difficult to climi-nate. To observe the internal powder structure, mix loose powder wit~l a metallurgicalmounting epoxy resin. The particles seule during curing of the resin. Subsequent polish-ing and etching of the mount brings out the panicle microstructure. Tranxmiscion clcc-Iron mi~mscopy ha.•• also been u~d to observe the solidification events during powder
Agure 2.35. Two example micrographs of cross-sectioned metal powders showirg howInternal mlc:roauctutal details can help In characterization of,the powders; a) cp.ntrifugallyatomized steel alloy powder. and b) water atomized Iron poWd8[1(photos courtesy of J.O\napandJ ..~), . ,f',,,-
,.
1'0 vt)1 I; ( 11;,i,,\lrERIZI\TI()N
Figure 2.36. The scanning electron microscope is a polent tool in characterizing metalpowders. In example a) three layers are evident in the fractured particle. The picture alsoshows satellite formation and agglomeration In this gas atomized alloy powder, In exam-ple b) the fractured centrifugally atomized particle shows clear evidence of the solidifica-tion events (photo courtesy of.J. Hawers).
•production. III Ih;11c.r-c. rhc pll\\li.:r i-, cuu.uucd ill ;1 nickel ekt:troplatill!! d.:pn,il whereil is ~uhst:qu.:nlly 'l'Clil1l1.:d .IIHI illil nul lvd rill' electron truuxparcncy. However. -uchefforts arc uvuallyrc-u'ictcd to the 'l'c'CI;dl\ powder», such as supcralloys ..
In xumc ill~talln·'. uuportanr micro-uucuu c iuform.uion can he gained hy SEM analy·~is. Fieurc 2..~6 illll'lr;IIl', one ilhlal1c·,· 1\ here the particle fractured to reveal I\VO vhcllsaround a ~mall p;Ir\lck core. '\ddllilll1;dl~, uuclc.uion ~il':~. cout.uuination. t:lllllill~ rail'.!!r••ill size. ;1I1d,..:!!rl·!!;lIi'"1call he' a",'",11 Irom SEM examinations. Further informationon the powder C;l;l I~' ~;Iin,d hy ,urran' ;l1l;dy,i~ tonlx. These arc appropriate 111the char-al'leri/alilln 111'1'"I\(kr, -cnxitivv 111,'lIlll;lIl1il1;l!io1\,Thermal analysi •• providc-, anotherimponan: mcan-, 111'a"c'"ing Iii..: I'",,,kr, Included in these techniques arc ditfcrcnriulthermal analvsi-, for detection or pha-c u'au-Ioruuuiou» and melting events. dirrt;r':lltialscanning c;Ii;lriml'lry ror quantific.uion of endothermic and exothermic events. and thcr-mogravimctric analy,i, for determination I\l'ight loss due to desorption and evaporationduring hearing.
Chemica. CharacterizationWhen di~cussillg their chemistries. powders must be subdivided into three groups,
The elemental powders arc rel.uivc ly high·purity materials where chemical analysisfocuses on the impurity concentration. Premixed powders arc combinations or two ormore distinct powders that will diffusionally alloy in sintering. An example would be theuse of mixed 'copper and tin powders 10 Iorrn a bronze a1l9)1.Impurity levels and propercompounding of the mixture arc chcmicul conccrns with tile premixed powders, The pre-alloyed powders constitute micro-castingx with multiple elements in a predeterminedratio. For the preulloycd powders. uucntion is given to the alloy composition as well asthe impurity concentrations. Normal analYlical chemistry techniques are appropriate forall powders.
Bofthcncconpcrutredu
beodiffr'. :.andapprAdvMicisitiosine,usinnearpre.
A
teri:1 promirresanepolpol
tobu:we
'. Typal

·terizing metale picture alsoder. In exam-the soiiditlca-
ep("il where1Wl·\,er. such
• SEM analy·al 1\\'1I ,Ilells(llolin~ rate.informalion
! 10 Illl' char-ide, annllll'!', dil'kreillial. dil'i't;rl:llIi'alIS. and thcr-eVaporalion
irce groups.t:11 an;lIysisSol' Iwo orould be theand proper
rs, The pre.{Ictcrmincd
as well asropriate for
~'I'"'"'''i'~'
POWDER METAlLURGY SCI[N(E
Beyond the bulk chemical information, the surface condition is an important propertyof the powder. Hence, there is concern with oxides, adsorbed organic films, and the prcs-,encc of surface coatings like silica to determine appropriate cleaning treatments. A losson reduction is reported to show the weight loss when heated in hydrogen at a low tern-perature. This measures the surface oxidation as well as volatile organic content andreducible compounds and is less sophisticated as compared to thermogravimetric analy-sis. Likewise, the inclusion concentration is measured by acid dissolution. For somematerials, the powder hardness provides a gross gauge of the impurity level and assuresthat the powder has been annealed. Often the elemental iron powders are derived eitherfrom ores or metal scrap. The ore based elemental powders will usually have less lot-to-lot chemistry variations than the scrap based powders. On the other hand, the ore basedpowders tend to have higher inert or oxide inclusion contents. Powders fabricated bymelting techniques provide greater opportunity for chemical refining. and can be expect-ed to have higher purity. .
Depending on the desired sensitivity. bulk chemical characterization 01 a powder (anbe obtained from wet analysis. emission or name spectroscopy. atomic absorption. x-ray
.' diffraction, x-ray fluorescence, or neutron activation analysis. Emission spectroscopy.. and x-ray fluorescence are typically used for routine analysis. with lower sensitivities of
approximately 10 ppm (pprn is the standard abbreviation for parts per million or l O'"),Advanced techniques arc capable of extending analytical accuracy to the 0.0 I ppm level.Microanalysis by electron or ion beams is useful for characterizing the chemical compo-sition in small volumes. The microanalysis techniques are not useful for routine analysissince they are typically semi-quantitative and slow. Finally. surface analysis is possibleusing Auger or other research techniques. Here low energy electrons arc stimulated fromnear-surface regions. These electrons convey infonnation related to the chemical speciespresent on the powder surface.
A Minimum Characterization Battery.It is rare that a full battery of measurements is either needed or warranted to charuc-
tenze a metal powd Th' .: ('d er, e typical goal 111powder metallurgy is to control the process toprovi e a standardiz d ad. . e pr uct. Powder characterization is geared toward performing them1l11mum amount of t . .research d d estll1g necessary to ensure consistent feedstock to the process. In
an evelopment a I" h ... ..and und di pp icanons, c aractenzauon IS necessary for future repetitionersran 1I1gof the I Fpowder to resu ts. or that purpose. a few tests should be performed on a
ensure control Oft h .powder cha .. . en t ey are relegated to the manufacturer who certifies theractensllcs.In the characterizati f
to perform and I' on 0 a powder, the test should be meaningful. accurate, and easyrep icare E h .bulk chemistry th d . mp am should be given to the powder chemistry. Beyondweight loss me~sur: egree o.f ~ontamination should be determined using hydrogenTypically, a scannin mC~ts. 11 IS I.mponant to obtain a reliable particre size distribution.parison to some S\angdedectroh micrograph will provide sufficient shape detail for com-
ar S Add' .. uionahy, one or more of the simple tests for interparticle
" 1\VI ti •• I I WII'.l II .." AI ION
Tablr 2.7, Puwdt'r Cha"'oIrh'ri1~lliclIIfur Ihr TunJ:.<ilen Powder Shown In "i~ur~2.-'7Material = TungstenDesignation = -325 meshMetallic Chemistry = 99.99% W •Impurities (ppm) = C (10), Cu (I I. Fe '(2), K (15), Mg (4), Mo (10). N (100), Nu (6), .•0(740), Si (2)Apparent Density = 4.37 g/cnr' (23%)Tap Density = 8.05 g/cm' (42%)Flow Time for 50 g = not free flowingBET Specific Surface Area = 0.12 m!/gGas Permeability Surface Area = O.02X m!/g
Particle Size by SedimentationDII.= 3.0 prnD". = 6.4 ~1l1
DVI.= 12~m
Particle Size by Electrical Zone ScnvingD." = 3.5 pm0.".= 6.2 ~1l1'
D",. = X.9 ~1l1
I
•
(I,
Figure 2.37. A scanning electron micrograph of the tungsien powder as characterized InTable 2.7.
---.-- ------II
POWDER METAllURGY S(IENC.l
friction should be given to provide a relative assessment of now, mixing, and fnctionbehavior. Finally. in some materials. it may be necessary to examine the internal ~truc-ture via metallography techniques for pores. inclusions or second phases.
In most instances, not all of these characteristics need be measured: however. inresearch situation!! a broad test battery is reasonable. Table 2.7 gives an example charae.terizatlon of the tungsten powder shown in Figure 2.:n. It is a high purity elemental pow-der with a specific surface area indicating an irregular panicle shape. as seen in t!"lescan-ning electron micrograph. The particle size distribution by two techniques gives a medi-an size near 6 11m.while the SEM shows individual crystals from 0.5 to 311m. The lowpacking densities. lack of flow, fine size. and irregular particle shape are consistent withone another and indicale an agglomerated. snail powder. Generally. the goal of such ananalysis Is 10 obtain specific information of the panicle size. shape. friction and structureas well as lhe chemistry. The appropriate combination of tests will. of course. be modi-fied for the Iype o~ powder under consideration.
Suggested ReferencesA. Adler. "Flow Properties of Metal Powders." IDler: J. Powder Met" 1969. vol. 5. no. I.pp.7.20.
T. Allen. Particle Size Measurement. fourth edition. Chapman and Hall. London. UK.1990.
J. K. Beddow. Particulate Science and TechnQlo~y. Chemical Publishing. New York.NY. 1980.
J. K. Beddow and T. P. Meloy. Advanced Particulale Momholo~y, CRC Press. BocaRaton. FL. 1980.
R. O. Grey and J. K. Bit, "On the Hausner Ratio and its Relationship to Some Propertiesof Metal Powders." Powder Tech •• 1969. vol. 2. pp. 323-326...M. Ghadiri, F. A. Farhadpour. R. Clift and J. P. K. Seville. "Particle Characterization:Size and Morphology." Powder Metallurgy - An Overvjew. I. Jenkins and J. V. 'Wood(eds.), The Institute of Materials. London. UK. 19<)): pp. 56-75.
A. Guinier, G. Founet. B. Walker and K. L. Yudowitch, Small Angle Scanerjng. JohnWiley and Sons. New York. NY. 1955.
H. H. Hausner and M. K. Mal. Handbook of Powder Metallurgy. second edition.OlCmical Publishing. New York. NY. 1982.
W. I. Huppmann and K. -Dalal, Meta!J0CC30hic Atlas of Powder Metallurgy. VerlagSchmid. Frieburg. Gennany. 1986.
B. H. Kaye, "Review' of New Methods for Characterizing the Shape and Texture of FineParticles." I. Powder Bylk Solids Tech., 1982. vol, 6. no. 2. pp. 1-4.
Eo K1ar (editor). Powder MetaJltu:EY, vol. 7, ninth edition of Metals Handbook. ASMI
18
1'( I\VI II I; I I II\I;AI 1/ /ill AliI IN-------------------------_. ---~~---------------------------International. Materials Park. OH. Il}X4.
H. D. Lewis. "Sm;J1I Panicle Statistics: The Analysis of Particle 'Size' Data." TesliD.!:iilld Characterization of Powders and Fin~ Particles, 1. K. Bit and T. Meloy (cds.).Heyden. London. England. 1980. pro 1.t5-175.
S. Lowell and J. E. Shields. Introduction III Powder Surf;tce Arca·and P(lrosily. johnWiley and Sons. New York. NY. IlJX4.
G. Matei. N. Claussen and H. H. Hausner, "Influencc of Relative Humidity on Flow ofMetal and Ceramic Powders." Modem Dcvelopments in Powder Metallur~y. vol. K. H.H. Hausner and W. E. Smith (eds.), Metal Powder Industries Federation. Princeton. NJ,1974. pp. 5-11.
T. P. Meloy. "Particulate Shape Characterization." J. Powder Bulk Solids Tech .. 1978.vol. 2. no. 2. pp. 13-23.
R. Meyer. '''Standardizing Test Method» fill' Characterizing Powders." ), Powder RulkSolids Tech,. 1979. vol. 3. no. 2. pro 21-27.
M. J. Rhodes (editor). Principles of f>mnkr T.:chnology. John Wiley and Sons. NewYork. NY. 1990.
L. M. Sheppard. "Automation of Particle Analysis." Ceramic Rull .. 1988. vol. 67. pp.87R-883.
J. D. Stockham and E. G. Fochtman (elk l. Parlit:1e Size Analysis. Ann Arbor SciencePublishers. Ann Arbor. Michigan. 1977.
L. Svarovsky. Powder Testing Guide. Elsevier Applied Science. London. UK. 19K7.
J. F. Waus and T. J. Carney, "Surface ChclI~ical Characterization of Powders," P()\:dcrMetallurgy - An Overview. I. Jenkins and 1. V. Wood (eds.), The Institute of Materials.London. UK. 1991. pp. 76·91.
2.1pialan;
2.1insiz
2.mimem(
Study Ouestions2.1. A 200 s sample is used to measure Ihe panicle size .of spherical nick~1 pO\~.dcr.TIt~average size is 120 11m.roughly how many particles arc III the sample? (NI density IS X.1g/crrr')
2.2. A powder with an ellipsoid shape (lcnglh = 120 11mand diameter. = 60 11m)is sizedby screening. What panicle dimension will best correl~te to the mesh size?
2.3. For a cubic panicle of sides 3 urn. a) what is the equivalent spherical surface diame-ter. and b) the equivalent spherical volume diameter? ;.. ,
2.4. Iron powder is screened into -'I&)/~2(i() m'~sh and -325 m~sh fractions. The apparentdensity of the coarse fraction is 2.6 g!cm \ and the line fraction has an apparent dc~slty of2.3 g/cm'. When a blend is prepared using. 20% fine panicles in the coarse Iruction, the
, .
2.wi
>2.laa
2.mgJ
2P
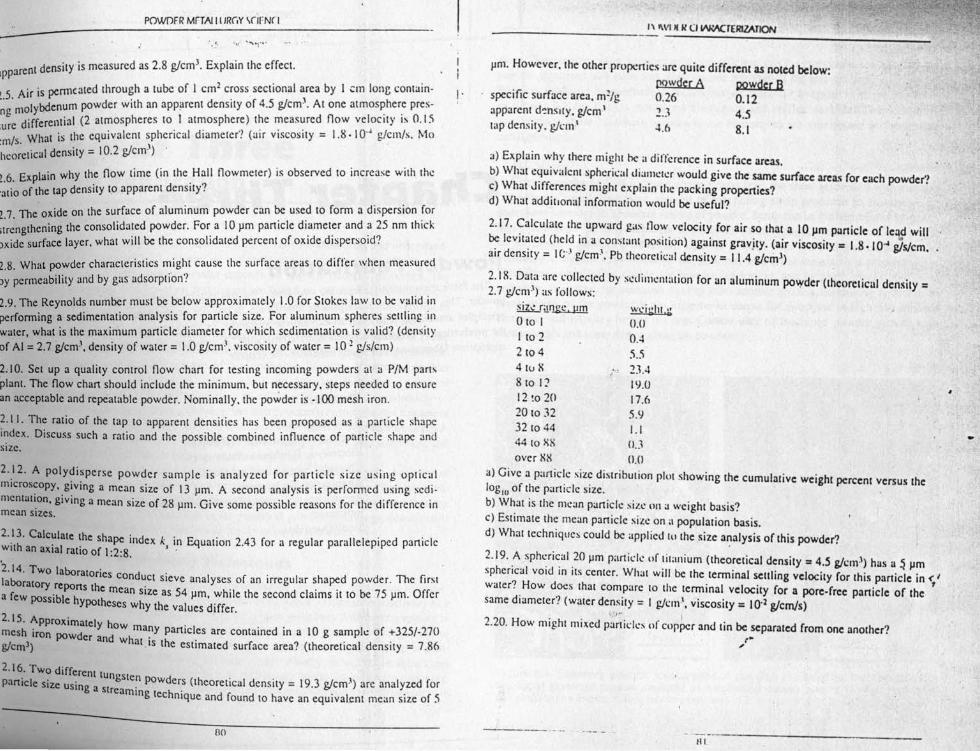
Dara." Testin~. Meloy (cds.),
1 Porosity. John
I. Powde'r Rulk
lnd Sons. New
8. vol. 67. pp.
Arbor Science
UK.19X7.
!luers." Powderte of Materials.
('I powder. TheIi density is X.lJ
)0 urn) is sized»
surface diarne-
>. The apparentircm density ofse fraction. the
POWOFR MrTAlttJR(,Y \(JFN( I
nt density is measured as 2.8 g/crn'. Explain the effect.appare5 Air is penneated through a tube of I cm2 cross sectional area by I em lone contain- I.
~.. Iybdenum powder with an apparent density of 4.5 g/crn'. At one atmosphere pres-mg rno d fl I" 0 I 'i. differential (2 atmospheres to I atmosphere) the measure ow ve ocuy IS "sur/c. What is the equivalent spherical diameter'! (air viscosity = 1.8· 10'· gicm/s. Moem s. . , .theoretical density = 10.2 g/cm )
2 6 E lain why the flow time (in the Hall flowmeter) is observed to increase with the., xpratio of the tap density to apparent density?
2.7. The' oxide on the surface of aluminum powder can be used to form a dispersion :orstrengthening the consolida~ed powder. For. a 10 11mparticle di.amet~r and ~ ;5 nm thickoxide surface layer. what will be the consolidated percent of OXIdedispersoid?
2.8. What powder characteristics might cause the surface areas to differ when measuredby permeability and by gas adsorption?
2.9. The Reynolds number must be below approximately 1.0 for Stokes law to be valid inperforming a sedimentation analysis for particle size. For aluminum spheres settling inwater, what is the maximum particle diameter for which sedimentation is valid? (densityof AI = 2.7 g/cm', density of water = 1.0 g/crrr'. viscosity of water = I0 ~gis/cm)
..
2.10. Set up a quality control flow chart for testing incoming powders at a P/M partsplant. The flow chart should include the minimum. but necessary. steps needed to ensure
, an acceptable and repeatable powder. Nominally. the powder is -I ()() mesh iron.
2.11. The ratio of the tap to apparent densities has been proposed as a particle shapeindex. Discuss such a ratio and the possible combined influence of particle shape andsize.
2 '.12. A polydisperse powder sample is analyzed for particle size using opticalmicroscopy, giving a mean size of 13 urn. A second analysis is performed using scdi-mentat~on. giving a mean size of 28 11m.Give some possible reasons for the difference inmean sizes.
2..13h·Calc~late the shape index k in Equation 2.43 for a regular parallelepiped paniclewit an axial ratio of 1:2:8. J •
. '2.14. Two laborator' d .laborat res con uct sieve analyses of an irregular shaped powder. The firsta few ;~i~I~;s the mean size as 54 11m,while the second claims it to be 75 urn. Offer
ypotheses Why the values differ.2.15. Approximatel h .mesh iron powd y ow ma~y panIcles are contained in a 10 g sample of +325/-270
er and what IS th . ..g/cml) . e estimated surface area? (theoretical density = 7.86
2.16. Two different tun rstepanicle size using g ~ powders (theoretical density = 19.3 g/crrr') arc analyzed for
a stream IIlg t h .cc ruque and found to have an equivalent mean size of 5
no
1\ "VIII /( U~nRllATION
prn. However. the other properties are quite different as noted below:[l9wder A powder B0.26 0.12:U 4.5~,6 8.1
specific surface area. m~/gapparent densuy, g/cm'tap density. g/cm
a) Explain why there might he a difference in surface areas.b) What equivalent sp~erical dial.Heler woul~ give the same surface area.~ for each powder'!c) What differences might explain the packing propenies?d) What addiuonat information would be useful?
2.17. ~alculate th: upward gas Ilo~"'.velocit~ for air so that a 10 urn panicle of le'l2 willbe levlt~ted (held III a constant posinon) against gravjty, (air viscosity = 1.8.10-1 giS/em.arr density = 1(;··1g/cm', Pb theoretical density = 11.4 g/cm')
2.1 It Data arc collected by sedimentation for an aluminum powder (theoretical density =2.7 g/crn:') as follows:
siz-: r;J.nge. pm weit:hl,:,:o to I (1.OI to 2 0.42 to 4 5.54 tu X ., 2.l48 to 12 IlJ.O12 to 20 17.620 to 32 5.lJ32 to 44 1.144 to XX 0 ..1over XX 0.0
a) Give a particle size distribution plot showing the cumulative weight percent versus the10glOof the particle size. .b) What is the mean panicle size 1111 a weight basis?c) Estimate the mean panicle size on a population basis.d) What techniques could be applied tll the size analysls of this powder?
2.19 ':A spheri~al .20 11mpart ide lIf ~itallium (theoretical density = 4.5 glcm·1) has a ~ urnspherical VOId 111 ItS center. What will be the terminal settling velocity for this particle in < I
water? .How d.oes that com.pare to the terminal velocity for a pore-free particle of the 'same diameter? (water density = I g/cm:', viscosity = 10.2 glcm/s)
2.20. How might mixed P'~~;ides of copper and tin be separated from one another?(.,
III