poverty and food needs: clarke county, iowa · 2020-02-05 · poverty and food needs poverty...
TRANSCRIPT
Poverty and Food Needs Iowa Community Indicators Program
9-1-2014
Poverty and Food Needs: Clarke County, IowaLiesl EathingtonIowa State University, [email protected]
Follow this and additional works at: http://lib.dr.iastate.edu/icip_poverty
Part of the Food Security Commons, and the Regional Economics Commons
This Report is brought to you for free and open access by the Iowa Community Indicators Program at Iowa State University Digital Repository. It hasbeen accepted for inclusion in Poverty and Food Needs by an authorized administrator of Iowa State University Digital Repository. For moreinformation, please contact [email protected].
Recommended CitationEathington, Liesl, "Poverty and Food Needs: Clarke County, Iowa" (2014). Poverty and Food Needs. 118.http://lib.dr.iastate.edu/icip_poverty/118

Poverty And Food Needs
Poverty
Revised September, 2014
Poverty and food insecurity impact the welfare of individuals, families, and communities. This profile describes indicators of poverty, food insecurity, and other measures of general economic well-being in Clarke County, Iowa.
Clarke County, Iowa
Poverty Rates 2
Food Insecurity 3
Food Accessibility 4
Nutrition 5
Local Income 8
Household Economic Stress 9
Data Notes 11
Demographic Profile 10
Program Participation Trends 7
Program Participation Levels 6
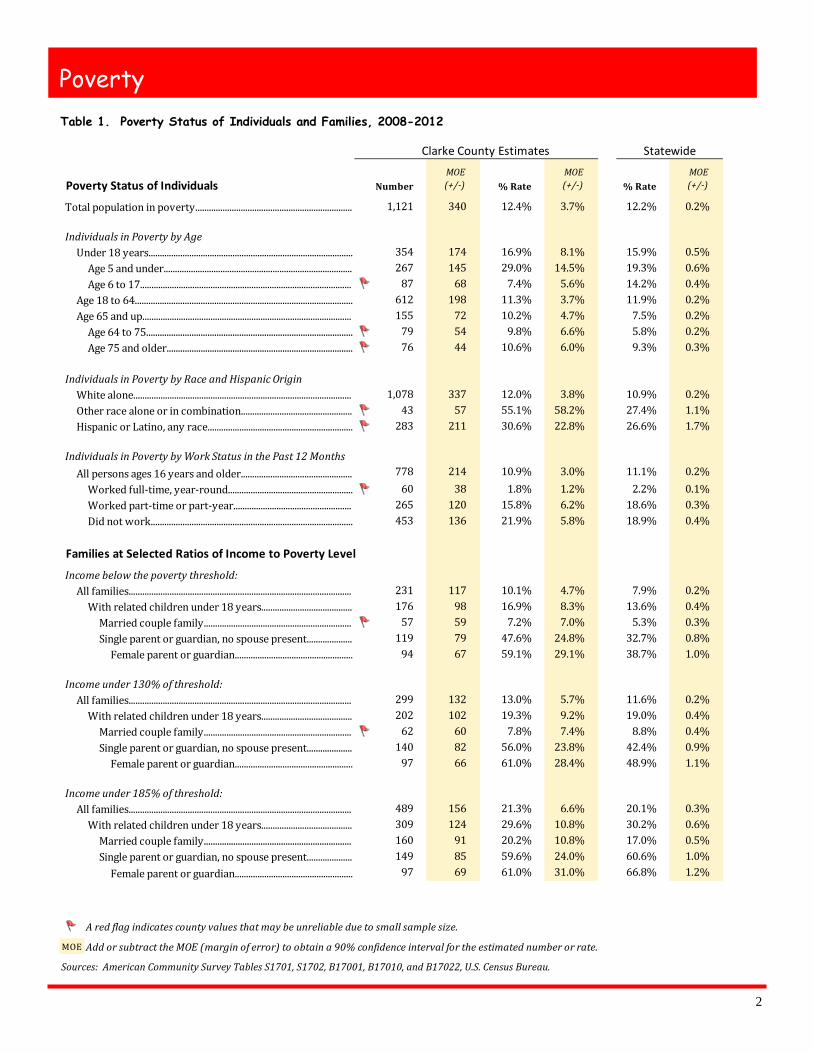
Contents People living in poverty have annual incomes insufficient to meet their basic needs. The Federal government determines the poverty status of individuals and families using money income thresholds that vary by family size. The thresholds are based on three times the cost of a minimum food diet. See Page 11 for current Federal poverty guidelines. The incidence of poverty varies among individuals and families with different socio-economic characteristics. Table 1 (following page) displays poverty rates by age, race and ethnicity, work experience, and family type in Clarke County and the state. The data describe average poverty characteristics during a five-year survey measurement period. For each poverty measure, Table 1 includes a point estimate and a margin of error (MOE) value associated with that estimate. Adding and subtracting the margin of error to the point estimate yields a confidence interval that is 90% likely to contain the actual number or percentage of individuals or families in poverty.
2
Poverty
Sources:AmericanCommunitySurveyTablesS1701,S1702,B17001,B17010,andB17022,U.S.CensusBureau.
Table 1. Poverty Status of Individuals and Families, 2008-2012
Poverty Status of Individuals NumberMOE(+/-) % Rate
MOE(+/-) % Rate
MOE(+/-)Total population in poverty..................................................................... 1,121 340 12.4% 3.7% 12.2% 0.2%
IndividualsinPovertybyAgeUnder 18 years.......................................................................................... 354 174 16.9% 8.1% 15.9% 0.5%Age 5 and under................................................................................... 267 145 29.0% 14.5% 19.3% 0.6%Age 6 to 17............................................................................................. 87 68 7.4% 5.6% 14.2% 0.4%Age 18 to 64................................................................................................ 612 198 11.3% 3.7% 11.9% 0.2%Age 65 and up............................................................................................ 155 72 10.2% 4.7% 7.5% 0.2%Age 64 to 75........................................................................................... 79 54 9.8% 6.6% 5.8% 0.2%Age 75 and older.................................................................................. 76 44 10.6% 6.0% 9.3% 0.3%IndividualsinPovertybyRaceandHispanicOriginWhite alone................................................................................................ 1,078 337 12.0% 3.8% 10.9% 0.2%Other race alone or in combination................................................. 43 57 55.1% 58.2% 27.4% 1.1%Hispanic or Latino, any race................................................................ 283 211 30.6% 22.8% 26.6% 1.7%IndividualsinPovertybyWorkStatusinthePast12MonthsAll persons ages 16 years and older................................................. 778 214 10.9% 3.0% 11.1% 0.2%Worked full-time, year-round....................................................... 60 38 1.8% 1.2% 2.2% 0.1%Worked part-time or part-year.................................................... 265 120 15.8% 6.2% 18.6% 0.3%Did not work......................................................................................... 453 136 21.9% 5.8% 18.9% 0.4%Families at Selected Ratios of Income to Poverty Level
Incomebelowthepovertythreshold:All families.................................................................................................. 231 117 10.1% 4.7% 7.9% 0.2%With related children under 18 years........................................ 176 98 16.9% 8.3% 13.6% 0.4%Married couple family................................................................. 57 59 7.2% 7.0% 5.3% 0.3%Single parent or guardian, no spouse present.................... 119 79 47.6% 24.8% 32.7% 0.8%Female parent or guardian.................................................... 94 67 59.1% 29.1% 38.7% 1.0%Incomeunder130%ofthreshold:All families.................................................................................................. 299 132 13.0% 5.7% 11.6% 0.2%With related children under 18 years........................................ 202 102 19.3% 9.2% 19.0% 0.4%Married couple family................................................................. 62 60 7.8% 7.4% 8.8% 0.4%Single parent or guardian, no spouse present.................... 140 82 56.0% 23.8% 42.4% 0.9%Female parent or guardian.................................................... 97 66 61.0% 28.4% 48.9% 1.1%Incomeunder185%ofthreshold:All families.................................................................................................. 489 156 21.3% 6.6% 20.1% 0.3%With related children under 18 years........................................ 309 124 29.6% 10.8% 30.2% 0.6%Married couple family................................................................. 160 91 20.2% 10.8% 17.0% 0.5%Single parent or guardian, no spouse present.................... 149 85 59.6% 24.0% 60.6% 1.0%Female parent or guardian.................................................... 97 69 61.0% 31.0% 66.8% 1.2%
StatewideClarke County Estimates
Aredflagindicatescountyvaluesthatmaybeunreliableduetosmallsamplesize.MOE AddorsubtracttheMOE(marginoferror)toobtaina90%confidenceintervalfortheestimatednumberorrate.
3
Food Insecurity In food insecure households, access to food is limited by a lack of money or other resources. The U.S. Department of Agriculture (USDA) defines two levels of food insecurity: low food security and very low food security. Low food secure households have difficulty at some time during the year providing enough food for all their members. In very low food secure households, the food intake of some household members is reduced and normal eating patterns are disrupted at times during the year due to limited resources. The chart at right illustrates USDA estimates for the incidence of food insecurity by level among households in Iowa compared to the United States.
Afoodsecurehouseholdhasaccesstoenoughfoodforanactive,healthylife
forallhouseholdmembers.
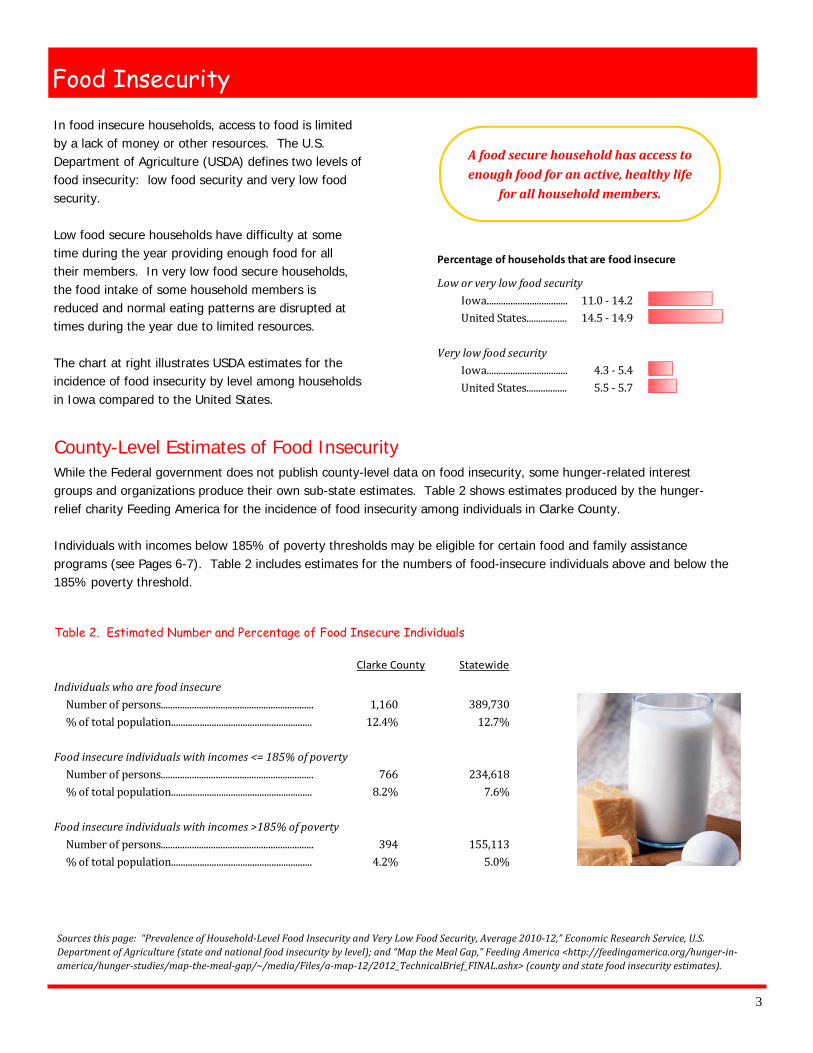
County-Level Estimates of Food Insecurity While the Federal government does not publish county-level data on food insecurity, some hunger-related interest groups and organizations produce their own sub-state estimates. Table 2 shows estimates produced by the hunger-relief charity Feeding America for the incidence of food insecurity among individuals in Clarke County. Individuals with incomes below 185% of poverty thresholds may be eligible for certain food and family assistance programs (see Pages 6-7). Table 2 includes estimates for the numbers of food-insecure individuals above and below the 185% poverty threshold.
Statewide
IndividualswhoarefoodinsecureNumber of persons................................................................ 1,160 389,730% of total population........................................................... 12.4% 12.7%Foodinsecureindividualswithincomes<=185%ofpovertyNumber of persons................................................................ 766 234,618% of total population........................................................... 8.2% 7.6%Foodinsecureindividualswithincomes>185%ofpovertyNumber of persons................................................................ 394 155,113% of total population........................................................... 4.2% 5.0%
Clarke County
Table 2. Estimated Number and Percentage of Food Insecure Individuals
Sourcesthispage:“PrevalenceofHousehold-LevelFoodInsecurityandVeryLowFoodSecurity,Average2010-12,”EconomicResearchService,U.S.DepartmentofAgriculture(stateandnationalfoodinsecuritybylevel);and“MaptheMealGap,”FeedingAmerica<http://feedingamerica.org/hunger-in-america/hunger-studies/map-the-meal-gap/~/media/Files/a-map-12/2012_TechnicalBrief_FINAL.ashx>(countyandstatefoodinsecurityestimates).
LoworverylowfoodsecurityIowa.................................. 11.0 - 14.2United States................. 14.5 - 14.9VerylowfoodsecurityIowa.................................. 4.3 - 5.4United States................. 5.5 - 5.7
Percentage of households that are food insecure
4
Access to Food Stores
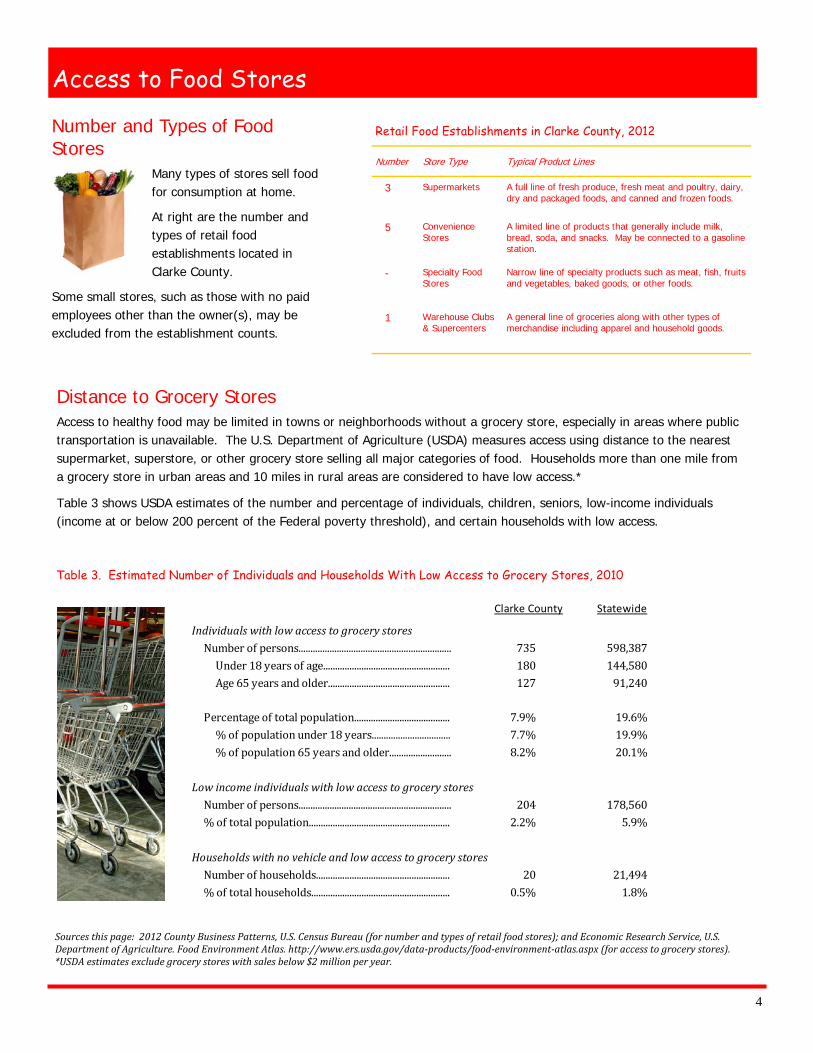
Distance to Grocery Stores Access to healthy food may be limited in towns or neighborhoods without a grocery store, especially in areas where public transportation is unavailable. The U.S. Department of Agriculture (USDA) measures access using distance to the nearest supermarket, superstore, or other grocery store selling all major categories of food. Households more than one mile from a grocery store in urban areas and 10 miles in rural areas are considered to have low access.*
Table 3 shows USDA estimates of the number and percentage of individuals, children, seniors, low-income individuals (income at or below 200 percent of the Federal poverty threshold), and certain households with low access.
Number and Types of Food Stores
Many types of stores sell food for consumption at home.
At right are the number and types of retail food establishments located in Clarke County.
Some small stores, such as those with no paid employees other than the owner(s), may be excluded from the establishment counts.
Statewide
IndividualswithlowaccesstogrocerystoresNumber of persons................................................................ 735 598,387Under 18 years of age..................................................... 180 144,580Age 65 years and older................................................... 127 91,240Percentage of total population........................................ 7.9% 19.6%% of population under 18 years................................. 7.7% 19.9%% of population 65 years and older.......................... 8.2% 20.1%
LowincomeindividualswithlowaccesstogrocerystoresNumber of persons................................................................ 204 178,560% of total population........................................................... 2.2% 5.9%HouseholdswithnovehicleandlowaccesstogrocerystoresNumber of households........................................................ 20 21,494% of total households.......................................................... 0.5% 1.8%
Clarke County
Table 3. Estimated Number of Individuals and Households With Low Access to Grocery Stores, 2010
Sourcesthispage:2012CountyBusinessPatterns,U.S.CensusBureau(fornumberandtypesofretailfoodstores);andEconomicResearchService,U.S.DepartmentofAgriculture.FoodEnvironmentAtlas.http://www.ers.usda.gov/data-products/food-environment-atlas.aspx(foraccesstogrocerystores).*USDAestimatesexcludegrocerystoreswithsalesbelow$2millionperyear.
Number Store Type Typical Product Lines
3 Supermarkets A full line of fresh produce, fresh meat and poultry, dairy, dry and packaged foods, and canned and frozen foods.
5 Convenience Stores
A limited line of products that generally include milk, bread, soda, and snacks. May be connected to a gasoline station.
- Specialty Food Stores
Narrow line of specialty products such as meat, fish, fruits and vegetables, baked goods, or other foods.
1 Warehouse Clubs & Supercenters
A general line of groceries along with other types of merchandise including apparel and household goods.
Retail Food Establishments in Clarke County, 2012
5
Nutrition
Nutrition-Related Health Indicators Many health conditions such as obesity and diabetes are related to diet. Obesity is defined as Body Mass Index (BMI)>=30.0. The BMI equals a person's body weight in kilograms divided by his or her height in meters squared. Diabetic is defined as the percent of the population ever told by their doctor they are diabetic, excluding women told only during pregnancy. Following are estimates for the incidence of obesity and diabetes among the adult population (ages 18 years and older) for Clarke County and the state. The rates shown are averages for 2006-2012.
Sourcesthispage:IowaDepartmentofAgricultureandLandStewardship(forlocationsofFMNP-authorizedmarkets);ISUEstimatesbasedon2012CensusofAgriculture,U.S.DepartmentofAgriculture(forfruitandvegetableproductionacres);andBehavioralRiskFactorSurveillanceSystem(BRFSS)datafromtheHealthIndicatorsWarehouse,U.S.CentersforDiseaseControlandPreventionNationalCenterforHealthStatistics(forincidenceofobesityanddiabetes).
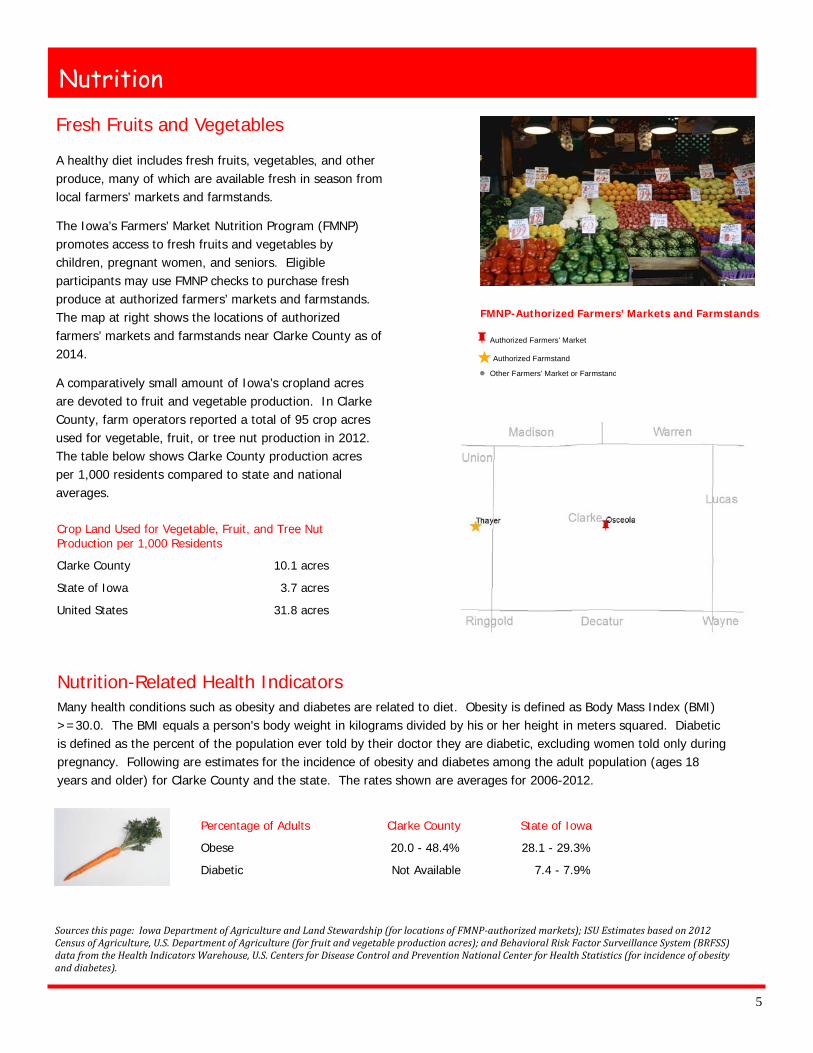
Fresh Fruits and Vegetables
A healthy diet includes fresh fruits, vegetables, and other produce, many of which are available fresh in season from local farmers’ markets and farmstands.
The Iowa’s Farmers’ Market Nutrition Program (FMNP) promotes access to fresh fruits and vegetables by children, pregnant women, and seniors. Eligible participants may use FMNP checks to purchase fresh produce at authorized farmers’ markets and farmstands. The map at right shows the locations of authorized farmers’ markets and farmstands near Clarke County as of 2014.
A comparatively small amount of Iowa’s cropland acres are devoted to fruit and vegetable production. In Clarke County, farm operators reported a total of 95 crop acres used for vegetable, fruit, or tree nut production in 2012. The table below shows Clarke County production acres per 1,000 residents compared to state and national averages.
Clarke County 10.1 acres
State of Iowa 3.7 acres
United States 31.8 acres
Crop Land Used for Vegetable, Fruit, and Tree Nut Production per 1,000 Residents
cAuthorized Farmers' Market
^Authorized Farmstand
! Other Farmers' Market or Farmstand
FMNP-Authorized Farmers’ Markets and Farmstands
Percentage of Adults Clarke County State of Iowa
Obese 20.0 - 48.4% 28.1 - 29.3%
Diabetic Not Available 7.4 - 7.9%
6
Food and Family Assistance Programs
FOOD ASSISTANCE PROGRAM
The Food Assistance Program helps low-income individuals and families buy the food they need for good health. To be eligible, a household's monthly income must be within applicable gross and net limits for its size. Net monthly income is calculated by subtracting certain allowable deductions from gross monthly income. Some exceptions to the income guidelines apply. Households in which everyone receives Supplemental Security Income or Family Investment Program assistance do not have to meet gross or net monthly income guidelines. Households with an elderly (age 60 or over) or disabled person do not have to meet gross income guidelines. Households that do not meet the published income guidelines might be eligible if their monthly income is not more than 160% of the federal poverty level. Most households do not have to meet an asset test. If they do, their home and the value of at least one vehicle are excluded. For m o r e i n f o r m a t i o n , g o t o h t t p : / /w w w . d h s . s t a t e . i a . u s / C o n s u m e r s /Assistance_Programs/FoodAssistance/index.html.
FAMILY INVESTMENT PROGRAM (FIP)
Iowa's Family Investment Program provides cash assistance, along with employment and training services, to needy families in return for an agreement that recipients will work toward self-sufficiency. Eligibility requirements are relatively complex and depend on a number of factors including income, assets (e.g., cash, bank accounts, etc.), having a minor child, having a Social Security number, cooperating with the Child Support Recovery office, being a resident of Iowa and cooperating with PROMISE JOBS, the Department's work and training program. FIP assistance has a federal lifetime limit of 60 months of assistance received in all states. For more d e t a i l e d i n f o r m a t i o n , s e e h t t p : / /www.dhs.state.ia.us/docs/FIPBrochure.pdf.
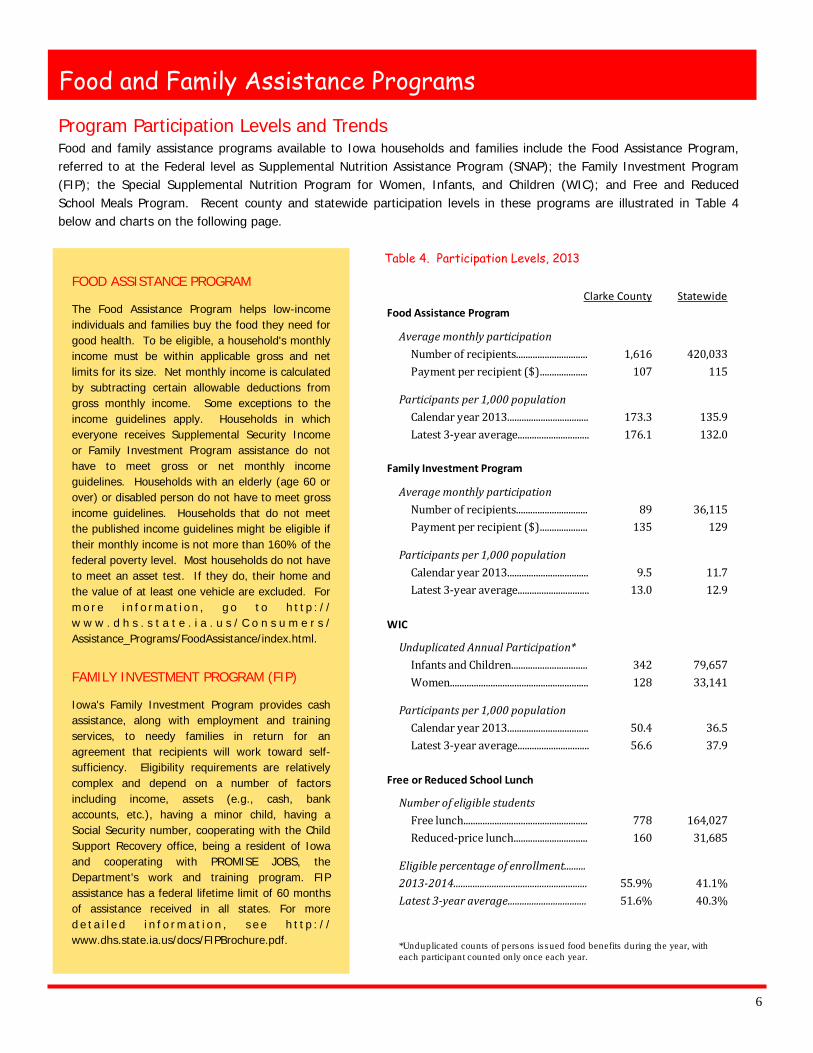
Program Participation Levels and Trends Food and family assistance programs available to Iowa households and families include the Food Assistance Program, referred to at the Federal level as Supplemental Nutrition Assistance Program (SNAP); the Family Investment Program (FIP); the Special Supplemental Nutrition Program for Women, Infants, and Children (WIC); and Free and Reduced School Meals Program. Recent county and statewide participation levels in these programs are illustrated in Table 4 below and charts on the following page.
StatewideFood Assistance Program
AveragemonthlyparticipationNumber of recipients.............................. 1,616 420,033Payment per recipient ($).................... 107 115Participantsper1,000populationCalendar year 2013.................................. 173.3 135.9Latest 3-year average.............................. 176.1 132.0
Family Investment Program
AveragemonthlyparticipationNumber of recipients.............................. 89 36,115Payment per recipient ($).................... 135 129Participantsper1,000populationCalendar year 2013.................................. 9.5 11.7Latest 3-year average.............................. 13.0 12.9
WIC
UnduplicatedAnnualParticipation*Infants and Children................................ 342 79,657Women.......................................................... 128 33,141Participantsper1,000populationCalendar year 2013.................................. 50.4 36.5Latest 3-year average.............................. 56.6 37.9
Free or Reduced School Lunch
NumberofeligiblestudentsFree lunch.................................................... 778 164,027Reduced-price lunch............................... 160 31,685Eligiblepercentageofenrollment.........2013-2014........................................................ 55.9% 41.1%Latest3-yearaverage................................. 51.6% 40.3%*Unduplicated counts of persons is sued food benefits during the year, with each participant counted only once each year.
Clarke County
Table 4. Participation Levels, 2013
7
Food and Family Assistance Programs, continued
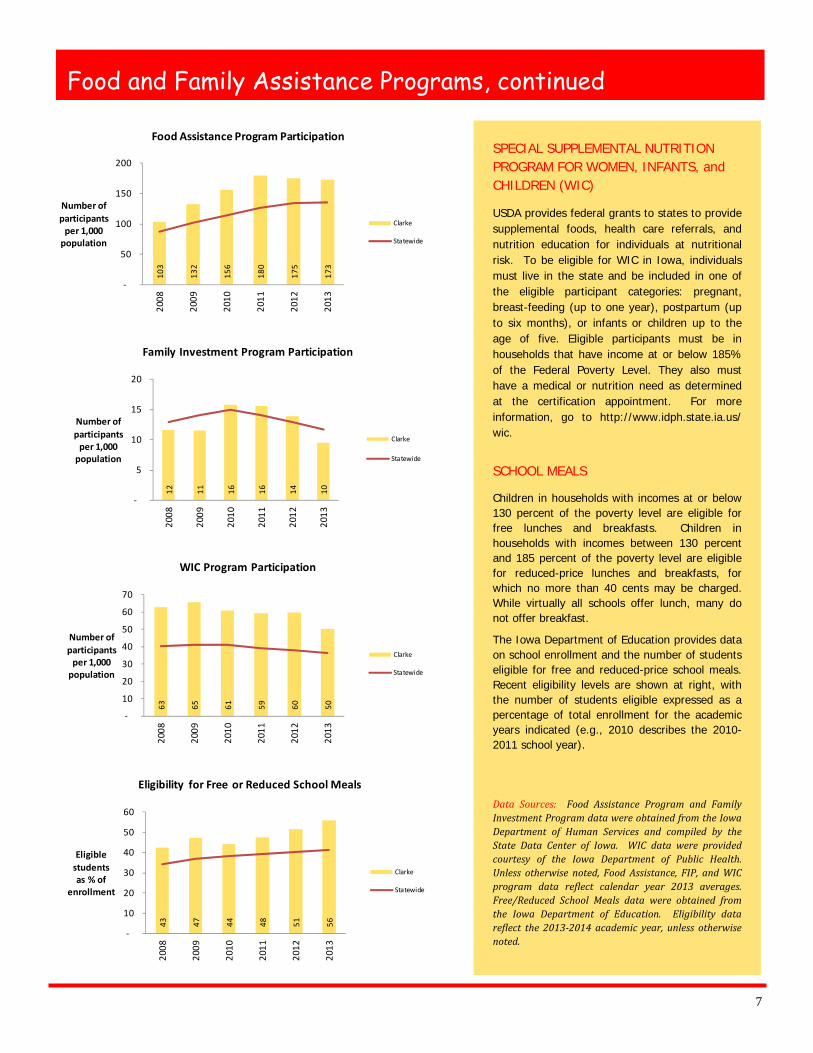
103
132
156
180
175
173
-
50
100
150
20020
08
2009
2010
2011
2012
2013
Number ofparticipants
per 1,000population
Food Assistance Program Participation
Clarke
Statewide
12 11 16 16 14 10
-
5
10
15
20
2008
2009
2010
2011
2012
2013
Number of participants
per 1,000population
Family Investment Program Participation
Clarke
Statewide
43 47 44 48 51 56
-
10
20
30
40
50
60
2008
2009
2010
2011
2012
2013
Eligiblestudentsas % of
enrollment
Eligibility for Free or Reduced School Meals
Clarke
Statewide
SPECIAL SUPPLEMENTAL NUTRITION PROGRAM FOR WOMEN, INFANTS, and CHILDREN (WIC)
USDA provides federal grants to states to provide supplemental foods, health care referrals, and nutrition education for individuals at nutritional risk. To be eligible for WIC in Iowa, individuals must live in the state and be included in one of the eligible participant categories: pregnant, breast-feeding (up to one year), postpartum (up to six months), or infants or children up to the age of five. Eligible participants must be in households that have income at or below 185% of the Federal Poverty Level. They also must have a medical or nutrition need as determined at the certification appointment. For more information, go to http://www.idph.state.ia.us/wic.
SCHOOL MEALS
Children in households with incomes at or below 130 percent of the poverty level are eligible for free lunches and breakfasts. Children in households with incomes between 130 percent and 185 percent of the poverty level are eligible for reduced-price lunches and breakfasts, for which no more than 40 cents may be charged. While virtually all schools offer lunch, many do not offer breakfast.
The Iowa Department of Education provides data on school enrollment and the number of students eligible for free and reduced-price school meals. Recent eligibility levels are shown at right, with the number of students eligible expressed as a percentage of total enrollment for the academic years indicated (e.g., 2010 describes the 2010-2011 school year).
Data Sources: Food Assistance Program and FamilyInvestmentProgramdatawereobtainedfromtheIowaDepartment of Human Services and compiled by theState Data Center of Iowa. WIC data were providedcourtesy of the Iowa Department of Public Health.Unless otherwisenoted,FoodAssistance,FIP,andWICprogram data re lect calendar year 2013 averages.Free/Reduced School Meals data were obtained fromthe Iowa Department of Education. Eligibility datare lect the2013-2014academic year,unlessotherwisenoted.
63 65 61 59 60 50
-
10
20
30
40
50
60
70
2008
2009
2010
2011
2012
2013
Number of participants
per 1,000 population
WIC Program Participation
Clarke
Statewide
8
Household Income Median household and family income values and median worker earnings are shown in Table 5. Household income describes the annual, pre-tax income from all sources (earnings, Social Security, public assistance, etc.) for all members in a household. Earnings include wages, salaries, and net self-employment income. Values are shown using 90 percent confidence intervals.
Local Income Characteristics
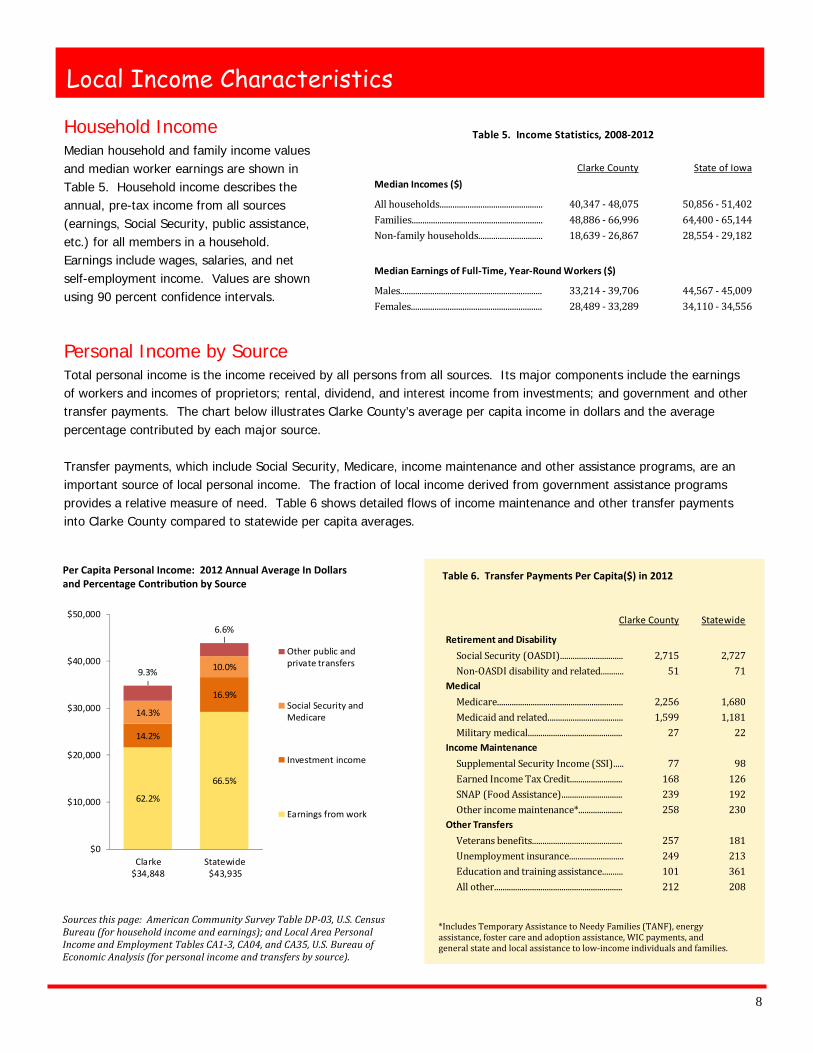
Personal Income by Source Total personal income is the income received by all persons from all sources. Its major components include the earnings of workers and incomes of proprietors; rental, dividend, and interest income from investments; and government and other transfer payments. The chart below illustrates Clarke County’s average per capita income in dollars and the average percentage contributed by each major source. Transfer payments, which include Social Security, Medicare, income maintenance and other assistance programs, are an important source of local personal income. The fraction of local income derived from government assistance programs provides a relative measure of need. Table 6 shows detailed flows of income maintenance and other transfer payments into Clarke County compared to statewide per capita averages.
Sourcesthispage:AmericanCommunitySurveyTableDP-03,U.S.CensusBureau(forhouseholdincomeandearnings);andLocalAreaPersonalIncomeandEmploymentTablesCA1-3,CA04,andCA35,U.S.BureauofEconomicAnalysis(forpersonalincomeandtransfersbysource).
Per Capita Personal Income: 2012 Annual Average In Dollars and Percentage Contribu on by Source
State of Iowa
All households................................................ 40,347 - 48,075 50,856 - 51,402Families............................................................. 48,886 - 66,996 64,400 - 65,144Non-family households.............................. 18,639 - 26,867 28,554 - 29,182Males.................................................................. 33,214 - 39,706 44,567 - 45,009Females............................................................. 28,489 - 33,289 34,110 - 34,556Median Earnings of Full-Time, Year-Round Workers ($)
Table 5. Income Statistics, 2008-2012
Clarke CountyMedian Incomes ($)
Table 6. Transfer Payments Per Capita($) in 2012
Statewide
Retirement and DisabilitySocial Security (OASDI).............................. 2,715 2,727Non-OASDI disability and related........... 51 71MedicalMedicare............................................................ 2,256 1,680Medicaid and related.................................... 1,599 1,181Military medical............................................. 27 22Income MaintenanceSupplemental Security Income (SSI)..... 77 98Earned Income Tax Credit......................... 168 126SNAP (Food Assistance)............................. 239 192Other income maintenance*..................... 258 230Other TransfersVeterans benefits........................................... 257 181Unemployment insurance.......................... 249 213Education and training assistance.......... 101 361All other............................................................. 212 208
Clarke County
62.2%
66.5%
14.2%
16.9%
14.3%
10.0%9.3%
6.6%
$0
$10,000
$20,000
$30,000
$40,000
$50,000
Clarke$34,848
Statewide $43,935
Other public andprivate transfers
Social Security andMedicare
Investment income
Earnings from work
*Includes Temporary Assistance to Needy Families (TANF), energy assistance, foster care and adoption assistance, WIC payments, and general state and local assistance to low-income individuals and families.
9
Measures of Household Economic Stress
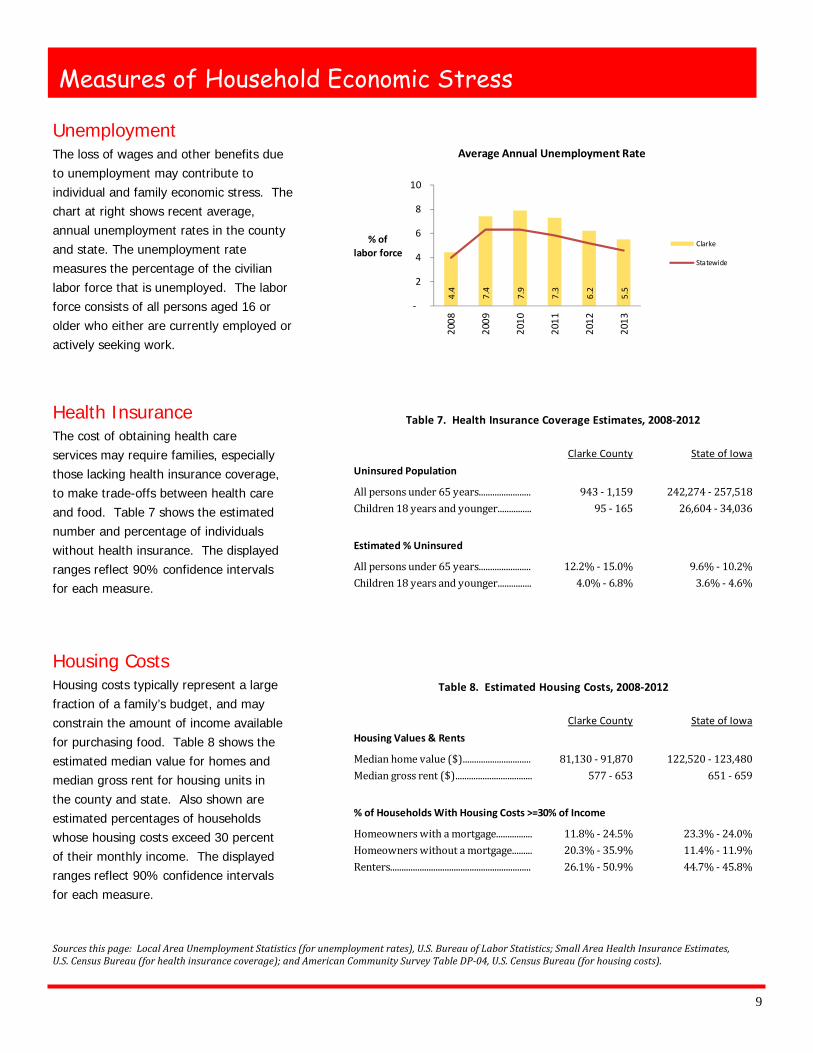
Unemployment The loss of wages and other benefits due to unemployment may contribute to individual and family economic stress. The chart at right shows recent average, annual unemployment rates in the county and state. The unemployment rate measures the percentage of the civilian labor force that is unemployed. The labor force consists of all persons aged 16 or older who either are currently employed or actively seeking work.
Health Insurance The cost of obtaining health care services may require families, especially those lacking health insurance coverage, to make trade-offs between health care and food. Table 7 shows the estimated number and percentage of individuals without health insurance. The displayed ranges reflect 90% confidence intervals for each measure.
Housing Costs Housing costs typically represent a large fraction of a family’s budget, and may constrain the amount of income available for purchasing food. Table 8 shows the estimated median value for homes and median gross rent for housing units in the county and state. Also shown are estimated percentages of households whose housing costs exceed 30 percent of their monthly income. The displayed ranges reflect 90% confidence intervals for each measure.
4.4
7.4
7.9
7.3
6.2
5.5
-
2
4
6
8
10
2008
2009
2010
2011
2012
2013
% of labor force
Average Annual Unemployment Rate
Clarke
Statewide
Sourcesthispage:LocalAreaUnemploymentStatistics(forunemploymentrates),U.S.BureauofLaborStatistics;SmallAreaHealthInsuranceEstimates,U.S.CensusBureau(forhealthinsurancecoverage);andAmericanCommunitySurveyTableDP-04,U.S.CensusBureau(forhousingcosts).
State of IowaHousing Values & RentsMedian home value ($).............................. 81,130 - 91,870 122,520 - 123,480Median gross rent ($).................................. 577 - 653 651 - 659Homeowners with a mortgage................ 11.8% - 24.5% 23.3% - 24.0%Homeowners without a mortgage......... 20.3% - 35.9% 11.4% - 11.9%Renters.............................................................. 26.1% - 50.9% 44.7% - 45.8%% of Households With Housing Costs >=30% of Income
Table 8. Estimated Housing Costs, 2008-2012
Clarke County
State of IowaUninsured PopulationAll persons under 65 years....................... 943 - 1,159 242,274 - 257,518Children 18 years and younger............... 95 - 165 26,604 - 34,036Estimated % UninsuredAll persons under 65 years....................... 12.2% - 15.0% 9.6% - 10.2%Children 18 years and younger............... 4.0% - 6.8% 3.6% - 4.6%
Table 7. Health Insurance Coverage Estimates, 2008-2012
Clarke County
10
Educational Attainment and English Language Ability Individuals with lower educational attainment may have limited employment and earnings opportunities that contribute to household economic stress. Table 10 displays the percentage of the adult population by their highest degree attained. Educational attainment is reported for the adult aged population after their education is largely complete (25 years of age or older). Values are displayed using 90% confidence intervals. Language barriers may hinder programming and other local efforts to assist area families and individuals in need. Table 10 below shows the number and percentage of individuals ages 5 years and older who report speaking English less than “very well.”
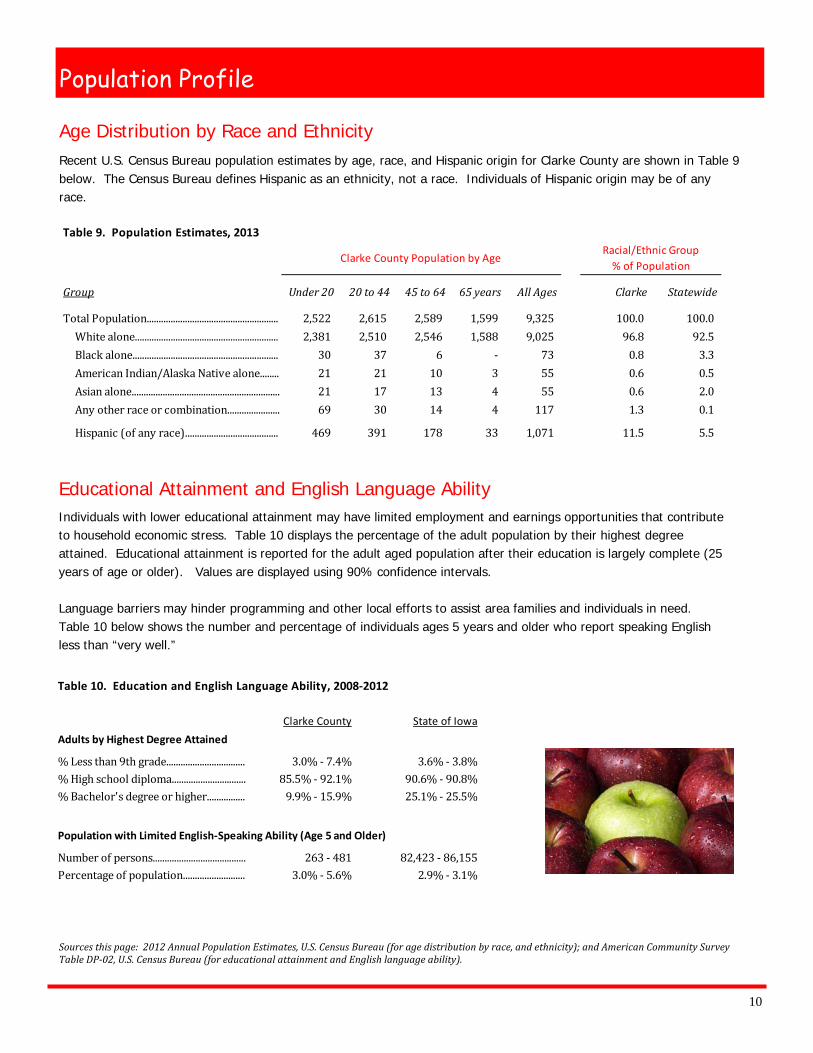
Age Distribution by Race and Ethnicity Recent U.S. Census Bureau population estimates by age, race, and Hispanic origin for Clarke County are shown in Table 9 below. The Census Bureau defines Hispanic as an ethnicity, not a race. Individuals of Hispanic origin may be of any race.
Population Profile
State of Iowa
% Less than 9th grade................................. 3.0% - 7.4% 3.6% - 3.8%% High school diploma............................... 85.5% - 92.1% 90.6% - 90.8%% Bachelor's degree or higher................ 9.9% - 15.9% 25.1% - 25.5%Number of persons....................................... 263 - 481 82,423 - 86,155Percentage of population.......................... 3.0% - 5.6% 2.9% - 3.1%
Adults by Highest Degree Attained
Population with Limited English-Speaking Ability (Age 5 and Older)
Table 10. Education and English Language Ability, 2008-2012
Clarke County
Sourcesthispage:2012AnnualPopulationEstimates,U.S.CensusBureau(foragedistributionbyrace,andethnicity);andAmericanCommunitySurveyTableDP-02,U.S.CensusBureau(foreducationalattainmentandEnglishlanguageability).
Table 9. Population Estimates, 2013
Group Under20 20to44 45to64 65years AllAges Clarke StatewideTotal Population....................................................... 2,522 2,615 2,589 1,599 9,325 100.0 100.0 White alone............................................................ 2,381 2,510 2,546 1,588 9,025 96.8 92.5 Black alone............................................................. 30 37 6 - 73 0.8 3.3 American Indian/Alaska Native alone........ 21 21 10 3 55 0.6 0.5 Asian alone.............................................................. 21 17 13 4 55 0.6 2.0 Any other race or combination...................... 69 30 14 4 117 1.3 0.1 Hispanic (of any race)....................................... 469 391 178 33 1,071 11.5 5.5
Clarke County Population by AgeRacial/Ethnic Group
% of Population
11
Iowa State University Extension programs are available to all without regard to race, color, age, religion, national origin, sexual orientation, gender identity, genetic information, sex, marital status, disability, or status as a U.S. veteran. Inquiries can be directed to the Director of Equal Opportunity and Compliance, 3280 Beardshear Hall, (515) 294-7612. Issued in furtherance of Cooperative Extension work, Acts of May 8 and June 30, 1914, in cooperation with the U.S. Department of Agriculture. Cathann A. Kress, director, Cooperative Extension Service, Iowa State University of Science and Technology, Ames, Iowa.
Data Notes
Publication prepared by:
Liesl Eathington Assistant Scientist
Department of Economics 515-294-2954
For more information, please contact:
Kimberly Greder Associate Professor and
Human Sciences Extension and Outreach Specialist Human Development & Family Studies
515-294-5906 [email protected]
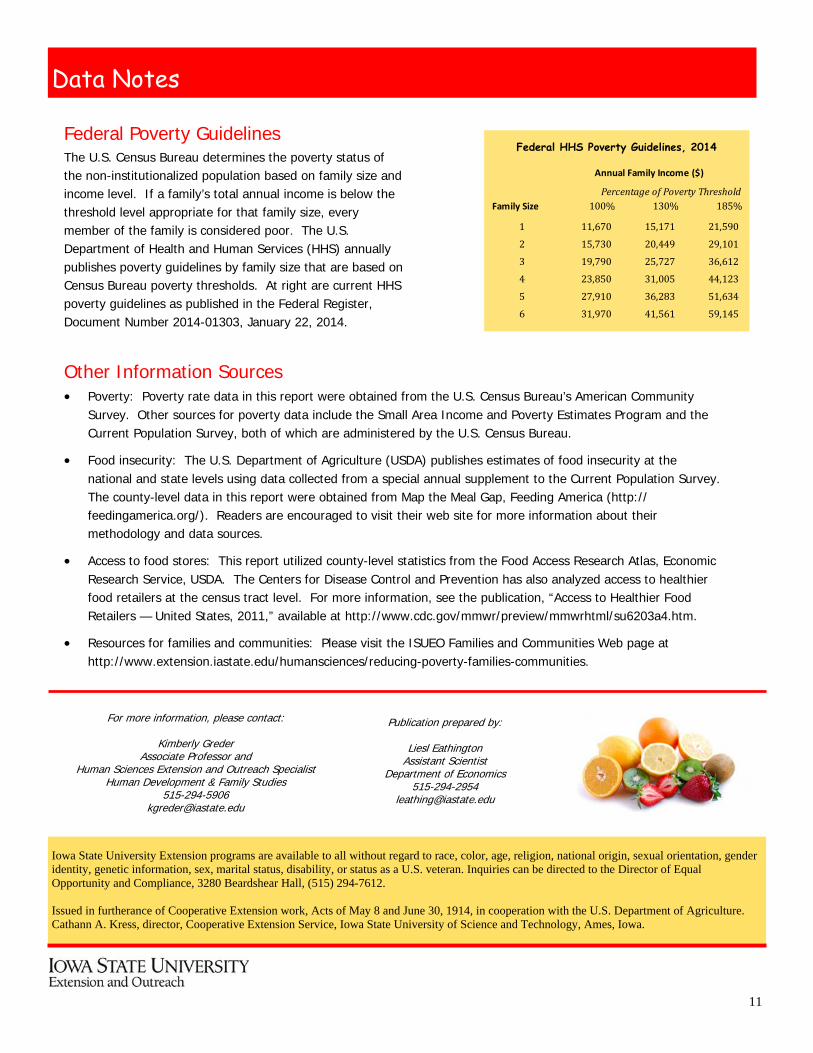
Federal HHS Poverty Guidelines, 2014 Federal Poverty Guidelines The U.S. Census Bureau determines the poverty status of the non-institutionalized population based on family size and income level. If a family’s total annual income is below the threshold level appropriate for that family size, every member of the family is considered poor. The U.S. Department of Health and Human Services (HHS) annually publishes poverty guidelines by family size that are based on Census Bureau poverty thresholds. At right are current HHS poverty guidelines as published in the Federal Register, Document Number 2014-01303, January 22, 2014.
Family Size 100% 130% 185%1 11,670 15,171 21,590 2 15,730 20,449 29,101 3 19,790 25,727 36,612 4 23,850 31,005 44,123 5 27,910 36,283 51,634 6 31,970 41,561 59,145
Annual Family Income ($)
PercentageofPovertyThreshold
Other Information Sources • Poverty: Poverty rate data in this report were obtained from the U.S. Census Bureau’s American Community
Survey. Other sources for poverty data include the Small Area Income and Poverty Estimates Program and the Current Population Survey, both of which are administered by the U.S. Census Bureau.
• Food insecurity: The U.S. Department of Agriculture (USDA) publishes estimates of food insecurity at the national and state levels using data collected from a special annual supplement to the Current Population Survey. The county-level data in this report were obtained from Map the Meal Gap, Feeding America (http://feedingamerica.org/). Readers are encouraged to visit their web site for more information about their methodology and data sources.
• Access to food stores: This report utilized county-level statistics from the Food Access Research Atlas, Economic Research Service, USDA. The Centers for Disease Control and Prevention has also analyzed access to healthier food retailers at the census tract level. For more information, see the publication, “Access to Healthier Food Retailers — United States, 2011,” available at http://www.cdc.gov/mmwr/preview/mmwrhtml/su6203a4.htm.
• Resources for families and communities: Please visit the ISUEO Families and Communities Web page at http://www.extension.iastate.edu/humansciences/reducing-poverty-families-communities.