poverty alleviation strategypoverty alleviation strategy - west coast
TRANSCRIPT

Prepared by:Prepared by:UrbanUrban--EconEconTel: 021 447 3449Tel: 021 447 3449Fax: 021 447 3459Fax: 021 447 3459cape@[email protected]
PO
VE
RT
Y A
LLE
VIA
TIO
N S
TR
AT
EG
YP
OV
ER
TY
ALL
EV
IAT
ION
ST
RA
TE
GY
DECEMBER 2006FINAL REPORT
Prepared for:Prepared for:West Coast West Coast District MunicipalityDistrict Municipality
WWWeeesssttt CCCoooaaasssttt PPPooovvveeerrrtttyyy AAAlll llleeevvviiiaaattt iiiooonnn SSStttrrraaattteeegggyyy
© 2006 Urban-Econ: Development Economists +27 21 447 3449 [email protected]
i
Executive Summary 1. Introduction The West Coast District Municipality (WCDM) has appointed Urban-Econ to compile a strategic plan for poverty alleviation in the West Coast Region. The West Coast Poverty Alleviation Strategy (WCPAS) is an attempt to address the daunting challenge of comprehensively addressing poverty as a multi-dimensional threat to sustained prosperity and well being in the West Coast region as well as the province and country as a whole. The Poverty Alleviation strategy consists of the following chapters: Chapter Two: Policy Framework Chapter Three: Poverty Model Chapter Four: Sosio-economic Analysis Chapter Five: Poverty Profile Chapter Six: Poverty Measurement in the West Coast region Chapter Seven: Strategic Plan Chapter Eight: Implementation and Action Plan 2. Objective of the Study The West Coast region is facing many challenges regarding community upliftment and poverty alleviation. It has therefore become imperative that a strategy is developed from which programmes, projects and various action plans would result in order to achieve the poverty eradication and provincial priorities regarding the level of poverty in the West Coast region and the Western Cape. The strategy aims at providing a definition of poverty which forms part of helping identify the key poverty indicators in the West Coast. These criteria enabled poverty thresholds to be conceptualised. This was used to conduct a situational analysis of the area to gain understanding of the level of poverty in the area and which projects are currently underway regarding poverty alleviation. The strategy is aimed at the development and identification of opportunities, programmes and projects which will:
Effectively utilise and apply the local resource base for the benefit of local communities in the various local municipalities in the West Coast Region.
Increase the living standards of communities living in poverty. Enable the municipality to provide more and better services and facilities Develop the human resource potential and opportunities for development; and Develop linkages between developed and underdeveloped areas.
The purpose of the strategy is therefore to identify the multiple dimension of poverty and try and find ways in which to alleviate poverty with practical actions in a holistic manner through the participation of all
WWWeeesssttt CCCoooaaasssttt PPPooovvveeerrrtttyyy AAAlll llleeevvviiiaaattt iiiooonnn SSStttrrraaattteeegggyyy
© 2006 Urban-Econ: Development Economists +27 21 447 3449 [email protected]
ii
stakeholders and role-players involved in the process. The final product will be an integrated poverty alleviation strategy. The Western Cape’s Poverty Alleviation Strategy is value based and therefore it is suggested that:
The strategy places people and their needs at the forefront – Batho Pele; The strategy advocates for social, economical and environmental sustainability; The strategy promotes integration and acknowledges that all elements of society are interrelated
and linked; The strategy does not unfairly discriminate against any person or groups of vulnerable and
disadvantaged groups; Equitable access to the benefits of the strategy is pursued vigorously; The strategy takes into account the consequences of each program throughout its life cycle; The participation of all interested and affected parties be ensured; Decisions be taken in an open and transparent manner; Vulnerable groups who suffer discrimination beyond poverty, such as women, the disabled, older
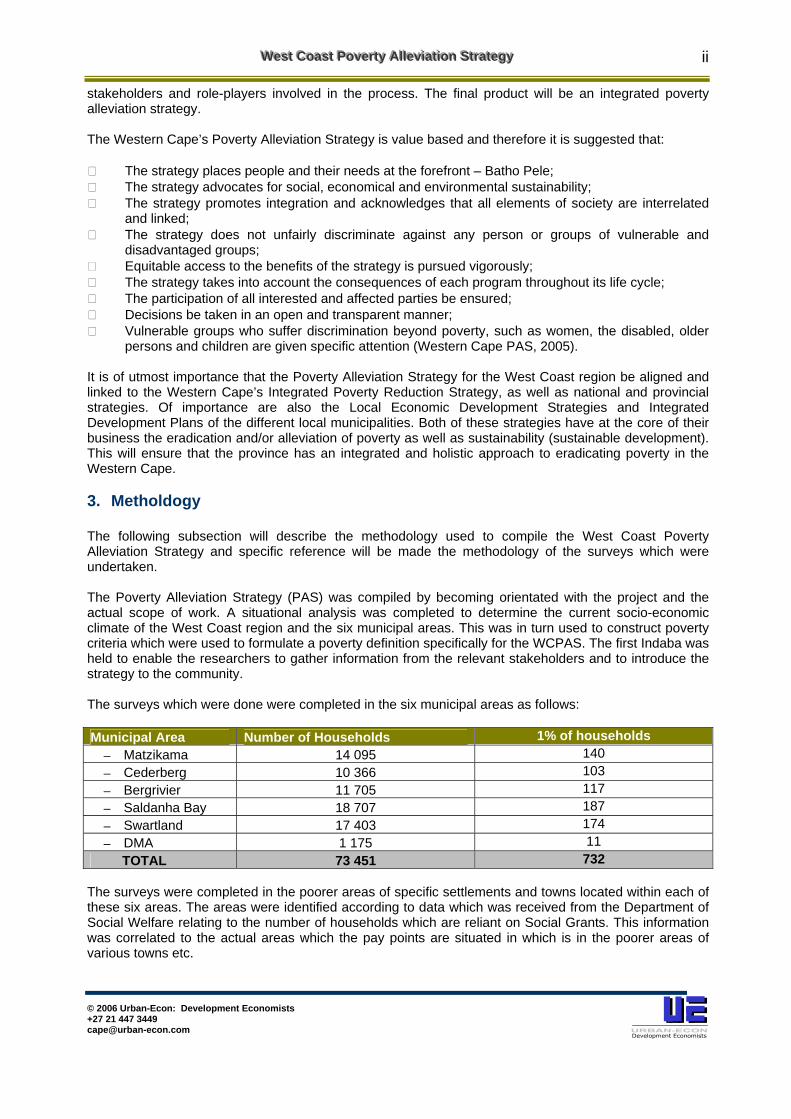
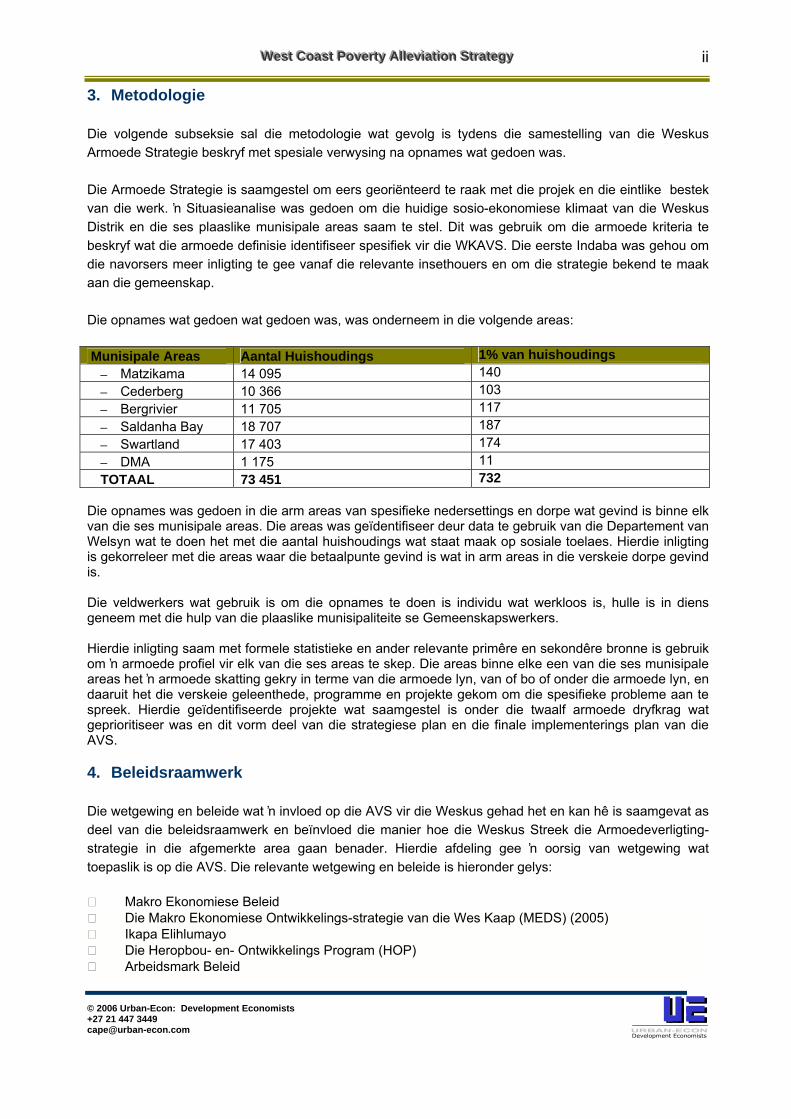
persons and children are given specific attention (Western Cape PAS, 2005). It is of utmost importance that the Poverty Alleviation Strategy for the West Coast region be aligned and linked to the Western Cape’s Integrated Poverty Reduction Strategy, as well as national and provincial strategies. Of importance are also the Local Economic Development Strategies and Integrated Development Plans of the different local municipalities. Both of these strategies have at the core of their business the eradication and/or alleviation of poverty as well as sustainability (sustainable development). This will ensure that the province has an integrated and holistic approach to eradicating poverty in the Western Cape. 3. Metholdogy The following subsection will describe the methodology used to compile the West Coast Poverty Alleviation Strategy and specific reference will be made the methodology of the surveys which were undertaken. The Poverty Alleviation Strategy (PAS) was compiled by becoming orientated with the project and the actual scope of work. A situational analysis was completed to determine the current socio-economic climate of the West Coast region and the six municipal areas. This was in turn used to construct poverty criteria which were used to formulate a poverty definition specifically for the WCPAS. The first Indaba was held to enable the researchers to gather information from the relevant stakeholders and to introduce the strategy to the community. The surveys which were done were completed in the six municipal areas as follows: Municipal Area Number of Households 1% of households
─ Matzikama 14 095 140 ─ Cederberg 10 366 103 ─ Bergrivier 11 705 117 ─ Saldanha Bay 18 707 187 ─ Swartland 17 403 174 ─ DMA 1 175 11 TOTAL 73 451 732
The surveys were completed in the poorer areas of specific settlements and towns located within each of these six areas. The areas were identified according to data which was received from the Department of Social Welfare relating to the number of households which are reliant on Social Grants. This information was correlated to the actual areas which the pay points are situated in which is in the poorer areas of various towns etc.
WWWeeesssttt CCCoooaaasssttt PPPooovvveeerrrtttyyy AAAlll llleeevvviiiaaattt iiiooonnn SSStttrrraaattteeegggyyy
© 2006 Urban-Econ: Development Economists +27 21 447 3449 [email protected]
iii
The fieldworkers who were used were unemployed individuals which were employed with the assistance of each municipal areas local municipality and Community Development Workers. This information along with the formal statistics and other relevant primary and secondary sources were used to compile a poverty profile for each area. The areas within each municipality was rated according to the poverty criteria to illustrate which areas are above or below the poverty line and to initiate the identification of opportunities, programmes and projects. These identified projects which are each included in one of the twelve poverty thrusts were prioritised and formed part of the strategic plan and the final implementation plan of the PAS. 4. Policy Framework Legislation and policy that have an influence on the Poverty Alleviation Strategy for the West Coast Region provide a legal framework and influences the manner in which the West Coast Region will be conducting Poverty Alleviation in their demarcated area. This section provides an overview of legislation applicable to Poverty Alleviation Strategies and is discussed in the subsequent paragraphs of this section.
Macro Economic Policy The Macro Economic Development Strategy of the Western Cape (MEDS) (2005) Ikapa Elihlumayo The Reconstruction and Development Programme (RDP), 1994 Labour Market Policy Industrial Policy The West Coast District Spatial Plan (Vol 1 & 2) Spatial Development initiative Growth potential of towns in the Western Cape, 2004 West Coast Investment Initiative Appraisal, 1997 Integrated Poverty Reduction Strategy for the Western Cape Province, 2002 West Coast Integrated Development Plan, 2006-2007 National Education Policy, 1996 Strategic Priorities for the National Health System, 2004-2007 Migration Framework for the West Coast District Tourism Strategy for the West Coast region Municipal Infrastructure Policy, 1997 White Paper on Land Policy, 1997 White Paper on National Transport Policy, 1996 White Paper on Telecommunications, 2006 Western Cape Housing Policy, 1996 Water Supply and Sanitation Policy, 1994
It is of cardinal importance that the West Coast region and the Department of Social Services and Poverty Alleviaio works together in the fight against poverty. The Pioverty Alleviaiotn Strategy must be aligned to the above mentioned polcy documents in order for the strategy to gain full support from the Provincial Govenrmnent. 5. Poverty Model Poverty can be defined as “not having enough money to get by from day to day” or “not having enough money for the things you need and want” i.e. poverty is not having enough money for the things you need and want. When persons find themselves in these kinds of situations, it is a struggle to survive.
WWWeeesssttt CCCoooaaasssttt PPPooovvveeerrrtttyyy AAAlll llleeevvviiiaaattt iiiooonnn SSStttrrraaattteeegggyyy
© 2006 Urban-Econ: Development Economists +27 21 447 3449 [email protected]
iv
The condition of poverty is complex and should not be thought of as a simple problem with a simple solution. Race, gender, familial status, age, and place of residence are some, but not all of the characteristics that enhance the risk of living in poverty. The purpose of this fact sheet is to increase knowledge about poverty. As such measuring poverty is difficult because poverty is a complex issue. Three ingredients are required in computing a poverty measure. First, one has to choose the relevant dimension and indicator of well-being. Second, one has to select a poverty line, that is, a threshold below which a given household or individual will be classified as poor. Finally, one has to select a poverty measure to be used for reporting for the population as a whole or for a population subgroup. To embrace the concept of sustainability a community requires guiding principles. In considering these principles, a community needs to keep the following points in mind. A sustainable community:
Utilises nature’s ability to provide for human needs, without undermining its ability to function over time
Ensures the well-being of its members, offering and encouraging tolerance, creativity, participation and safety
Empowers people with shared responsibility , equal opportunity and access to expertise and knowledge, with the capacity to affect decisions which affect them
Consists of businesses, industries and institutions which collaborate as well as compete, are environmentally sound, financially viable and socially responsible, investing in the local community in a variety of ways
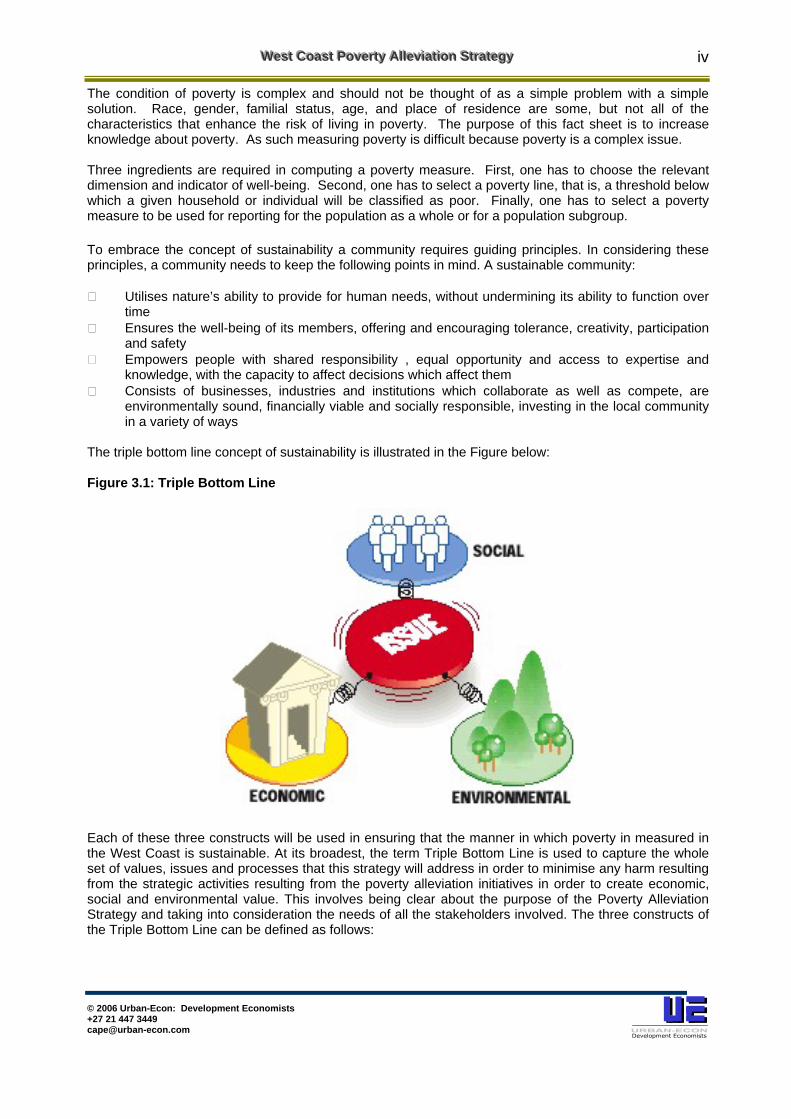
The triple bottom line concept of sustainability is illustrated in the Figure below: Figure 3.1: Triple Bottom Line
Each of these three constructs will be used in ensuring that the manner in which poverty in measured in the West Coast is sustainable. At its broadest, the term Triple Bottom Line is used to capture the whole set of values, issues and processes that this strategy will address in order to minimise any harm resulting from the strategic activities resulting from the poverty alleviation initiatives in order to create economic, social and environmental value. This involves being clear about the purpose of the Poverty Alleviation Strategy and taking into consideration the needs of all the stakeholders involved. The three constructs of the Triple Bottom Line can be defined as follows:
WWWeeesssttt CCCoooaaasssttt PPPooovvveeerrrtttyyy AAAlll llleeevvviiiaaattt iiiooonnn SSStttrrraaattteeegggyyy
© 2006 Urban-Econ: Development Economists +27 21 447 3449 [email protected]
v
Social Well-being Indicators Max-Neef (1991), who is dedicated to development through local self-reliance, offers a framework to re-evaluate human needs, and hence well-being. He says that there are nine basic, universal, human needs that require satisfaction if a healthy community is to be achieved. They include the need for:
Sustenance Protection Affection Idleness Creativity Freedom Understanding Participation Identity
The important aspect is evaluating how well a community performs in each of these areas, identifying ways to improve and to measure progress. Environmental Impact Indicators The Earth’s ecosystems cannot indefinitely sustain current levels or forms of economic activity and material consumption. It is crucial to develop new ways of living that are fulfilling and sustainable within nature’s capacity to continue to provide. To achieve environmental sustainability, communities need to gain an appreciation of the demands the consumptive and waste producing activities of communities place on nature. The footprint analysis enables communities to evaluate their consumption of energy, food, housing, transport and consumer goods and services in terms of the amount of land needed to sustain consumption at current levels (Wackernagel & Rees, 1998). For example, Wackernagel & Rees (1998) have estimated that a sustainable level of consumption by each individual on this planet is approximately 1.5 ha. Simpson et al. (2000) calculated the per capita footprint for Australians as 8.11 ha. If every individual in the world consumed at this rate, we would need six more planets. The footprint analysis provides locally specific information which can be used to encourage a change in the way we utilise resources, and may lead to the adoption and development of innovative solutions. Economic Opportunity Indicators Kinsley’s (1997) concept of economic development is a process of making the local economy performs better as opposed to making it bigger. The economic component of a community audit is therefore about assisting communities to make more of what they have, rather than solely relying on external sources. The community needs to determine the type of economic activity it wants, and how well existing enterprises are performing, relative to the sustainability criteria discussed above. To survive, small rural communities need to form regional alliances, or establish networks and business clusters which add value to each other. Communities also need to answer questions about the economic (i.e. income and employment) performance of individual sector developments. For example, is tourism as good as it appears in terms of generating local income and employment? What will be the economic impact of possible new development initiatives? Are there sectors that already exist which have significant potential to contribute to the local economy, but which are overlooked rather than expanded or developed? The various poverty criteria which will be used to measure poverty in the study area are indicated in Table 3.1 according to each level of the Triple Bottom Line. Criteria 1: Access to Training
WWWeeesssttt CCCoooaaasssttt PPPooovvveeerrrtttyyy AAAlll llleeevvviiiaaattt iiiooonnn SSStttrrraaattteeegggyyy
© 2006 Urban-Econ: Development Economists +27 21 447 3449 [email protected]
vi
Criteria 2: Level of Education Criteria 3: Access to Educational Facilities Criteria 4: Frequency of availability of Health care facilities Criteria 5: Access to trauma care facilities Criteria 6: Response time of medical emergency facilities Criteria 7: HIV/Aids Awareness Programmes Criteria 8: Access to sport facilities Criteria 9: Access to recreational and leisure activities Criteria 10: Employment Status Criteria 11: Household Income & Expenditure Criteria 12: Tourism Development Criteria 13: SMME Development Criteria 14: Access to Security Criteria 15: Access to Social Grants Criteria 16: Access to Youth Care Facilities Criteria 17: Youth Development Criteria 18: Elderly Development Criteria 19: Access to Identity Documents Criteria 20: Access to Rehabilitation Centers Criteria 21: Nutritional Services Criteria 22: Affordability Criteria 23: Affordability of Financial Services Criteria 24: Affordability of Government Services Criteria 25: Access to financial and business support services Criteria 26: Access to Banks & ATM’s Criteria 27: Access to Telephones Criteria 28: Access to Computers & Internet Criteria 29: Land Reform Criteria 30: Access to Transport Criteria 31: Access to Water Criteria 32: Access to Electricity Criteria 33: Access to Sanitation Criteria 34: Dwelling Type Criteria 35: Tenure Criteria 36: Access to Housing 6. Sosio-economic Profile of the West Coast The purpose of this section is to provide some insight into the relative size and structure of the local economy of the West Coast, as well as the economic profile of the local Municipalities. Secondly, this section will provide a broad perspective on the economy as well as various aspects of the economy which can be used to illustrate the poverty measures within an economic context. This perspective will provide some understanding on the ability of the local economy to absorb capital investment and operational expenditure, as well as other benefits that will arise from the various projects which will result because of the WCPAS.
WWWeeesssttt CCCoooaaasssttt PPPooovvveeerrrtttyyy AAAlll llleeevvviiiaaattt iiiooonnn SSStttrrraaattteeegggyyy
© 2006 Urban-Econ: Development Economists +27 21 447 3449 [email protected]
vii
Economic Profile The Local Economy of the West Coast is a viable economy. As indicated in chapter 3 there are numerous sectors which are experiencing growth and development. It is essential that poverty is addressed through employment opportunities which are provided by business in the West Coast. Gross Value Added The sector which contributes the most to the GVA of the West Coast District Municipality is the Manufacturing sector which contributes 20.5% of the GVA. This is followed by the Agriculture, Fishing and forestry industry which contributes a total of 18.9%. The Manufacturing is the largest contributor of the GVA and this is related to the manufacturing of the sub-sector of food and beverages which consisted of 41.7% and the sub-sectors of metal products which contributed 31.7% of the total manufacturing sector. The Agricultural and especially the fishing sector of Agriculture form a very large part of the economic activities within the West Coast Region Sectoral Employment The employment rate refers to those economically active people who are unemployed and looking for work as well as persons who are unemployed and not looking for work but would accept work if it was offered to them. This category also includes the not economically active population, which are people who are not working, but are housewives, scholars/full time students, pensioners; disabled people not wishing to work. It is important to note that 35% of the employed population has jobs within the agricultural and fishing sector, which is seasonal in nature. This situation, combined with the fact that 79% of the population receives monthly wages of less than R1600, contributes to the high levels of poverty in the region (StatsSA, 2001). Besides the agricultural sector, employment opportunities are concentrated in the Manufacturing, Trade and Service Sectors. The sectors that had an increase in employment were the mining sector, the retail sector, the business sector as well as the services sector. Social Profile The purpose of this section is to provide an overview of the socio-economic situation of the West Coast District municipal population based on the data acquired from the 2001 Census Data and standardised data from Statistics South Africa. Population The total population for the WCDM (which encompasses both rural and urban areas) was estimated to be 282 661 in 2001 as extrapolated from StatsSA, 2001 Census data. According to StatsSA standardised data, the population of West Coast District Municipality increased from 245 497 in 1996 to 290 973 in 2004. This represents a 2.1% growth rate per annum between 1996 and 2004. Most of the West Coast District Municipal population is located within the Swartland local Municipality (25.5%), followed by the Saldanha Bay local Municipality (24.9%) and Matzikama local Municipality (17.8%). Unemployment According to Stats SA Census 2001 results, the following is evident in terms of the employment situation in the West Coast District Municipal area: The number of unemployed persons is the lowest for the Bergrivier, Swartland and the Cederberg Municipalities. The Bergrivier, Cederberg and Swartland Municipalities have the highest employment rates. Over the eight year period from 1996 till 2004 the employment rate has decreased by 5.5% in the West Coast District.
WWWeeesssttt CCCoooaaasssttt PPPooovvveeerrrtttyyy AAAlll llleeevvviiiaaattt iiiooonnn SSStttrrraaattteeegggyyy
© 2006 Urban-Econ: Development Economists +27 21 447 3449 [email protected]
viii
Skills Level The skilled category increased from 29.9% to 33.4% in the WCDM. The skilled category was the largest category in 2001, which comprised of the community service, trade, construction and manufacturing sectors the service sector also includes the tourism industry. The number of unskilled labours has increased from 51.0% in 1996 to 51.2% in 2001. The skilled professionals within the WCDM often commute to the larger metropolitan areas within the Western Cape and this result in an outflow of skilled workers to other areas. This could have a negative impact on the local and regional economy. Gender and Age In the WCDM the highest population group is between the ages of 15 and 64 which include the economically active population. The gender distribution is fairly even and the Swartland Municipality has the most males and females.
Household Income Household income levels are generally used as a basis for determining poverty levels in a community. Additionally, the income levels of a particular area provide some insight into the economic behaviour of a particular community, i.e. the buying power of that community and the potential poverty levels that a community might be experiencing. Estimates extrapolated from StatsSA and Census Data 2001 and population figures suggest that 6.8% of households in WCDM had no income in 2001. The majority (22.7%) of households earn an income of between R19 201-R38 400 per annum and (21.4%) earn an income between R9 601-R19 200 per annum. Over 23.9% of the population earned less than R1 600 per month. The above paragraphs illustrate that a large percentage of the WCDM population lives in conditions of poverty and that this situation has been worsening since 1996. Conclusion The Socio-Economic profile of the study area has indicated that there is a definite need for numerous poverty alleviation initiatives to be implemented within the various local municipalities. This is essential as the proposed projects which will be discussed in following sections will relate to the various needs which have been identified by the surveys and the socio-economic indicators. The above profile will be linked to the next sections poverty profile to complete the poverty criteria which has been discussed in section two. Therefore it is essential that these sections be read parallel to one another. This will enable all monetary and non monetary aspects of the identified poverty measurements to be captured to enable the compilation of a poverty profile which will be mapped. 7. West Coast Poverty Profile An overview of the poverty criteria for each municipal area within the WCDM will be discussed shortly. 7.1 Poverty in Matzikama Education According to Census Data, 22% completed Some Primary Education. The percentage of persons who completed Primary Level education is 10.5% and those who completed Some Secondary education amounts to 33.6%. Grade 12 graduates in the area amounts to 17.1%. Only 6.2% of people in the Matzikama Municipal area completed some form of higher education. Ten percent of the population in the Matzikama Municipal area has no schooling.
WWWeeesssttt CCCoooaaasssttt PPPooovvveeerrrtttyyy AAAlll llleeevvviiiaaattt iiiooonnn SSStttrrraaattteeegggyyy
© 2006 Urban-Econ: Development Economists +27 21 447 3449 [email protected]
ix
Health Various healthcare facilities can be found within the Matzikama Municipal area. In Lutzville, Doringbaai, Strandfontein, Ebenhaeser, Koekenaap and Stofkraal people have access to one Municipal Satellite Clinic. Klawer has access to one Satellite Clinic and one Mobile Clinic. Vanrhynsdorp has a Mobile Clinic. In Vredendal, there is one Mobile Clinic and one District Hospital or Provincially aided Hospital. HIV/AIDS awareness programmes can be found at various clinics in the area. The public is allowed to visit clinics and ask the nurses about issues they need clarification about. Sport and Recreation There are sport, recreational and leisure facilities in the Matzikama Municipal area. The public has access to the following facilities:
Rugby fields Soccer Fields Cricket Fields
The population residing in the Matzikama Municipal area has access to leisure activities, namely:
Rock Climbing Hiking Trails Mountain Biking 4X4 Routes
Local Economic Development Matzikama and Strandfontein have the most employed individuals. Unemployment is the highest in Doringbaai where 54.3% of the individuals are unemployed as well as Koekenaap which has a 39.9% unemployment rate. On average a poorer household cannot meet their monthly needs as their expenses exceed their income. The average household spends most of their monthly income on food and clothing as well as education followed by housing. Many families do not even receive an income and are forced to survive on grants and other means of income. The Matzikama Municipal area has a good market for tourism. Various tourism activities occur in the area from season to season. The West Coast District has access to the West Coast business centre that assists people with SMME development. The only problem for the population residing in the Matzikama municipal area is that the centre is in Vredenburg which is too far to travel. Safety The accessibility to security in the Matzikama Municipal area is of importance. There are 5 police stations in the whole Matzikama Municipal area and 3 Neighbourhood watches in the whole area (Source: SAPS, 2006) Social Development There are various types of social grant which individuals can access if they meet the necessary criteria as set out by the Department of Social Development. There are Youth Development organisations and programmes in the Matzikama Municipal area. The organisation running in the Doringbaai area is known as the “St. Magdalene Youth Organisation”. In Koekenaap, the St. Thaddues Youth Organisation is active in the area. In Lutzville and Vanrhynsdorp the AGS Youth Organisation is active in the areas. The Vredendal area has 4 Youth organisations that are active in the area.
WWWeeesssttt CCCoooaaasssttt PPPooovvveeerrrtttyyy AAAlll llleeevvviiiaaattt iiiooonnn SSStttrrraaattteeegggyyy
© 2006 Urban-Econ: Development Economists +27 21 447 3449 [email protected]
x
It is of utmost importance that senior citizens get support from the community and government. According to the West coast Community Foundation, there is a venue for the elderly, in Doringbaai, named: the: “Bejaarde diens”. According to the sample survey done, 99% of the population residing in the Matzikama Municipal area has access to Identity Documents (ID). Only 1% of the population does not have ID’s. There is no access to rehabilitation centers in the Matzikama municipal area. The closest rehabilitation centre is in Worcester and Mitchell’s plain in the Cape Town area. Financial and Government Services According to the sample survey done, 15% of the poor feels that transport is not affordable. Sixty percent of the poor feels that food is not affordable. Ten percent of the poor residing in the Matzikama area says that water and electricity is affordable for them. Only 5% feels that the telephone is not affordable. The percentage of people living in the Matzikama Municipal area who feels that housing is not affordable amounts to 10%. There are banks and but no business support centres in the Matzikama Municipal area. This is a problem for local entrepreneurs but they can be assisted by the West Coast Business Development organisation and the Red Door Initiative if they want financial assistance etc. for SMME development. Communication According to Census data, the percentage of people residing in Vredendal who has access to both a telephone in dwelling and cell phone is 58.6%, which is the highest in the Matzikama Municipal area. The area which has the lowest percentage in terms of accessibility to both a telephone in dwelling and cell phone is Koekenaap with 2.4%. In Ebenhaezer, only 3.9% of the population residing in the area has access to cell phones. The percentage of population in Vredendal, who has access to public telephones nearby, amounts to 77.7% and the percentage of people who have no access to any type of telephone amounts to 3.4% in Vredendal which is the highest in the Matzikama Municipal area. A percentage of the population residing in the Matzikama municipal area has access to computers and the internet. According to the survey, 100% of the poor population surveyed in the Matzikama Municipal area has access to computers and internet. Land Reform The land reform process is dependant on the availability of land. The land which is available in the Matzikama Municipal area for land reform includes the following according to the Land Reform Strategy for the West Coast (2006) includes the following:
State Land - 56 801,6822 hectares Commonage - 700,0 hectares Coloured Rural Areas - 65 724 hectares
The opportunities and constraints which exist have to be taken into account regarding the current land distribution within the Matzikama which is distributed as follows:
Dry-land - 68 889 hectares Irrigation - 16 496 hectares Usable veld - 438 806 hectares
It can therefore be summarised that there is land available in the Matzikama Municipal area for land reform and that is it necessary that the relevant land reform strategy be incorporated in ensuring that the parties who are HDI candidates receive access to land etc.
WWWeeesssttt CCCoooaaasssttt PPPooovvveeerrrtttyyy AAAlll llleeevvviiiaaattt iiiooonnn SSStttrrraaattteeegggyyy
© 2006 Urban-Econ: Development Economists +27 21 447 3449 [email protected]
xi
Transport Public transport is a huge problem in the Matzikama municipal area. People have to walk long distances or use a taxi, which is very costly. There are no buses running in the Matzikama Municipal area. The poor community within the municipal area does not have enough money to pay for transport. Therefore, government has to investigate the problem of transport to help mobilize the poor. Basic Services According to StatsSA and Census Data, the individuals living in the Matzikama Municipal area mostly (i.e. 66.3%) have access to water in the form of piped water inside their dwellings. This is followed by 21.2% of individuals who have piped water but inside their yards. And 5.7% of individuals make use of piped water on a community yard less than 200 meters away from their dwelling. Therefore according to the poverty criteria 93.2% of individuals living in the Matzikama Municipal area have access to water and are above the poverty line. About 84.9% of individuals living in the Matzikama Municipal area have access to electricity. The type of energy which is mostly used besides electricity is candles which are used by 12.8% of individuals followed by other sources such as fire wood etc. which contributes 1.1%. According to the survey data 80% of individuals make use of gas as well as paraffin. This indicates that many individuals still do not have access to electricity in the Matzikama Municipal area. According to Statistics, 70.3% of households in Matzikama Municipal area have access to a flush toilet connected to a sewerage system and 9.1% have access to a toilet connected to a septic tank. 0.6% has access to a chemical toilet. Therefore 80% have access to a sanitary facility. 11.4% of individuals have no access to any type of sanitary facility. Housing According to Census Data, 86.5% of individuals living in the Matzikama Municipal area have access to a house. About, 4.1% of individuals live in traditional dwellings and 0.8% in semi-detached houses. Individuals living in traditional dwelling do not have access to basic services and these can only be installed in formal dwellings. 7.2 Poverty in Cederberg Education According to Census Data, 24.8% completed Some Primary Education. The percentage of persons who completed Primary Level education is 12.2% and those who completed Some Secondary education amounts to 30.9%. Grade 12 graduates in the area amounts to 14.6%. Only 5.6% of people in the Cederberg Municipal area completed some form of higher education. Health According to Census data various healthcare facilities can be found within the Cederberg Municipal area. In Citrusdal, Lamberts Bay, Graafwater and Clanwilliam people have access to a Clinic. Wuppertal, Clanwilliam and Citrusdal each have a mobile clinic. In the Cederberg Municipal area there is a District Hospital or Provincially Aided hospital. HIV/AIDS awareness programmes can be found at various clinics in the area. The public is allowed to visit clinics and ask the nurses about issues they need clarification about. Sport and Recreation There are sport, recreational and leisure facilities in the Cederberg Municipal area. The public has access to the following facilities:
WWWeeesssttt CCCoooaaasssttt PPPooovvveeerrrtttyyy AAAlll llleeevvviiiaaattt iiiooonnn SSStttrrraaattteeegggyyy
© 2006 Urban-Econ: Development Economists +27 21 447 3449 [email protected]
xii
Rugby Fields Soccer Fields
There are leisure activities in the Cederberg Municipal area, namely:
Citrusdal Golf Club Freshwater Angling Skydive Citrusdal Rock Climbing Hiking Trails Mountain Biking 4X4 Routes
Local Economic Development The average household spends most of their monthly income on food and clothing as well as housing followed by education. Education as well as housing can be subsidised by the government and this could allow households to have less expenses and increase their amount of disposable income. The Cederberg Municipal area has a good market for tourism. Tourist activities are very seasonal. SMME development has been taking place within the Cederberg Municipal area. An example of one project which has generated job opportunities is the Bird Island Project. The project has helped in the establishment and growth of 7 SMME’S involved in the running of the restaurant and curio shop on the island. Safety The accessibility to security in the Cederberg Municipal area is of importance. There are 5 police stations in the whole Cederberg Municipal area and 4 Neighbourhood watches in the whole area (Source: SAPS, 2006). Social Development There are various types of social grants which individuals can gain access to if they meet the various criteria. This is determined by the Department of Social Development. There are Youth Development organisations and programmes in the Cederberg Municipal area. The organisation running in the Citrusdal area is known as the “Kultuur en Jeug Organisasie”. In Lamberts Bay, the Maranatha Youth Organisation is active in the area. It is of utmost importance that senior citizens get support from the community and government. According to the West coast Community Foundation, there is a venue for the elderly, in Citrusdal, named: the: “Sentrum Vir Senior”. According to the sample survey done, 100% of the population residing in the Cederberg Municipal area has access to Identity Documents (ID). Individuals living in the Cederberg Municipal area have no access to a rehabilitation centre. The closest centre is in Worcester and Mitchells Plain in Cape Town. Financial and Government Services According to the Sample survey done, 10% of the poor feels that transport is not affordable. 65% of the poor indicated that food is not affordable. 10% of the poor residing in the Cederberg area indicated that water and electricity is not affordable for them. The percentage of people living in the Cederberg Municipal area who indicated that housing is not affordable amounts to 10%.
WWWeeesssttt CCCoooaaasssttt PPPooovvveeerrrtttyyy AAAlll llleeevvviiiaaattt iiiooonnn SSStttrrraaattteeegggyyy
© 2006 Urban-Econ: Development Economists +27 21 447 3449 [email protected]
xiii
Communities have indicated that there are banks and ATM’s in the Cederberg Municipal area, but the distance to the services is far. There is no business support centre for the poor. Communication According to Census data, the percentage of people residing in Lamberts Bay who has access to both a telephone in dwelling and cell phone is 20.2%, which is the highest in the Cederberg Municipal area. The area which has the lowest percentage in terms of accessibility to both a telephone in dwelling and cell phone is Cederberg with 7.9%. In Cederberg, only 5.2% of the population residing in the area has access to cell phones. The percentage of population in Elandsbaai who have access to public telephones, amounts to 49.2% and the percentage of people who has no access to any type of telephone amounts to 7.5% in Citrusdal, which is the highest in the Cederberg Municipal area. According to the sample survey, 100% of the poor population in the Cederberg Municipal area has access to computers and internet. The only problem is the distance to the computer centers. Land Reform The land reform process is dependant on the availability of land. The land which is available in the Cederberg Municipal area for land reform according to the Land Reform Strategy for the West Coast (2006) includes the following:
State Land - 32 410, 9115 hectares Commonage - 2400,00 hectares
The opportunities and constraints which exist have to be taken into account regarding the current land distribution within the Cederberg Municipal area which is distributed as follows:
Dry-land - 126 277 hectares Irrigation - 56 535 hectares Usable veld - 528 873 hectares
Therefore, it can be summarised that land is available in the Cederberg Municipal area and it is important that the land reform process be aligned to the needs of the poor in the Cederberg Municipal area. Transport Public transport is a huge problem in the Cederberg municipal area. People have to walk long distances or use a taxi, which is very costly. There are no buses running in the Cederberg Municipal area. The poor community within the municipal area does not have enough money to pay for transport. Therefore, government has to investigate the problem of transport to help mobilize the poor. Basic Services According to StatsSA and Census Data, the individuals living in the Cederberg Municipal Area mostly (i.e. 71.3%) have access to water in the form of piped water inside their dwellings. This is followed by 22.1% of individuals who have piped water but inside their yards. The access to energy in the Cederberg area is satisfactory. Approximately 99.4% of the inhabitants in Lamberts Bay, has access to electricity, which is the most in the whole Cederberg Municipal area. 96.3% of the population residing in the Citrusdal area has access to a flush toilet, connected to a sewerage system.
WWWeeesssttt CCCoooaaasssttt PPPooovvveeerrrtttyyy AAAlll llleeevvviiiaaattt iiiooonnn SSStttrrraaattteeegggyyy
© 2006 Urban-Econ: Development Economists +27 21 447 3449 [email protected]
xiv
Housing According to StatsSA, 87.9% of individuals living in the Cederberg Municipal area have access to a house. 39.7% of individuals living in the Cederberg Municipal area own their own house and have paid it in full. 7.3 Poverty in Bergrivier Education According to Census Data, 23.3% completed Some Primary Education. The percentage of persons who completed Primary Level education is 10.7% and those who completed Some Secondary education amounts to 32%. Grade 12 graduates in the area amounts to 18.1%. Only 6.3% of people in the Cederberg Municipal area completed some form of higher education. Health According to Statistics, there are various healthcare facilities within the Bergrivier Municipal area. In Aurora, Goedverwacht, Koringberg, Piketberg and Porterville people have access to a Municipal Satellite Clinic and a Mobile Clinic. Aurora, Eendekuil, Grootfontein and Porterville each have ‘n mobile clinic and Piketberg has 5 mobile clinics. In Porterville there is a District Hospital or Provincially Aided hospital. HIV/AIDS awareness programmes can be found at various clinics in the area. The public is allowed to visit clinics and ask the nurses about issues they don’t know about. Sport and Recreation There are sport and recreational facilities in the Bergrivier Municipal area. The public has access to the following facilities:
Rugby Fields Soccer Fields Swimming Pools
Some of the leisure activities in the area include the following:
Museums Caravan Parks Municipal Beach Resorts
Local Economic Development On average a poorer household cannot meet their monthly needs as their expenses exceed their income. Tourist attractions include: Bird watching, the mountain ranges displaying fascinating ancient rock formations and paintings. Hang-gliding, 4x4 driving, hiking, canoeing are among the popular pastimes. Cultural experiences include museums, monuments, missionary stations, unique architecture and country shows where you can meet the people. SMME development has been taking place within the Bergrivier Municipal area. An example of one project which has generated job opportunities is the Rooibaai Fishing Jetty Project. The project has helped in the establishment and growth of SMME’S involved in the private and public fishing industry. Safety There are 5 police stations in the whole Bergrivier Municipal area and 3 Neighbourhood watches in the whole area (Source: SAPS, 2006).
WWWeeesssttt CCCoooaaasssttt PPPooovvveeerrrtttyyy AAAlll llleeevvviiiaaattt iiiooonnn SSStttrrraaattteeegggyyy
© 2006 Urban-Econ: Development Economists +27 21 447 3449 [email protected]
xv
Social Development There are various types of social grant which individuals can access if they meet the necessary criteria as set out by the Department of Social Development. There are Youth Development organisations and programmes in the Bergrivier Municipal area. The organisations running in the Porterville area are known as the “Undivided Christian Youth organization” and the “ANC Youth League”. In Velddrift, the Youth Upliftment Organisation is active in the area. In Piketberg, there is a Youth Development Forum which looks after the interests of the young people in the area. In Eendekuil there is an organisation which is known as “youth Against Crime”. It is of utmost importance that senior citizens get support from the community and government. According to the West coast Community Foundation, there is a venue for the old aged in Piketberg, named the “Dienssentrum vir Bejaardes”. In Porterville,, there is an organisation named “Goue Jare” which focuses on the development of senior citizens. According to the sample survey done, 100% of the population surveyed in the Bergrivier Municipal area has access to Identity Documents (ID). Financial and Government Services According to the sample survey completed in the area, 20% of the poor feel that transport is not affordable. Sixty percent of the poor feels that food is not affordable. Ten percent of the poor residing in the Bergrivier area states that water and electricity is not affordable. The poor feels that the telephone services are not affordable. The percentage of people living in the Bergrivier Municipal area who indicated that housing is not affordable amounts to 10%. According to the Sample communicates, people have indicated that there are banks and ATM’s in the Bergrivier Municipal area, but the distance to the services is far. Communication According to Census data, the percentage of people residing in Dwarskersbos who has access to both a telephone in dwelling and cell phone is 47.5%, which is the highest in the Bergrivier Municipal area. The area which has the lowest percentage in terms of accessibility to both a telephone in dwelling and cell phone is Bergrivier with 11.2%. In Goedverwacht, only 1.7% of the population residing in the area has access to cell phones. The percentage of population in Porterville who has access to public telephones nearby, amounts to 42.6% and the percentage of people who has no access to any type of telephone amounts to 4.6% in Bergrivier, which is the highest in the Bergrivier Municipal area. According to the survey, people have access to computers and the internet. The poor feels that if the internet is not free, it is too costly for them to afford. Land Reform Access to land has been a problem throughout the West Coast District Municipality area. The land which is available in the Bergrivier Municipal area for land reform includes the Land Reform Strategy for the West Coast (2006) indicates the following:
State Land - 17 338,2764 hectares Commonage - 947,0 hectares
The opportunities and constraints which exist have to be taken into account regarding the current land distribution within the Bergrivier Municipal area which is distributed as follows:
Dry-land - 200 444 hectares Irrigation - 34 036 hectares Usable veld - 157 021 hectares
WWWeeesssttt CCCoooaaasssttt PPPooovvveeerrrtttyyy AAAlll llleeevvviiiaaattt iiiooonnn SSStttrrraaattteeegggyyy
© 2006 Urban-Econ: Development Economists +27 21 447 3449 [email protected]
xvi
It can therefore be summarised that there is land available in the Bergrivier Municipal area for land reform and that is it necessary that the relevant land reform strategy be incorporated in ensuring that the parties who are HDI candidates receive access to land etc. Transport Public transport is a huge problem in the Bergrivier municipal area. People have to walk long distances or use a taxi, which is very costly. There are no buses running in the Bergrivier Municipal area. The poor community within the municipal area does not have enough money to pay for transport. Therefore, government has to investigate the problem of transport to help mobilize the poor. Basic Services In the Bergrivier municipal area most of the individuals have access to basic services. In Dwarskersbos area t 100% of individuals have access to piped water in their homes. In Eendekuil, 34.5% of the people living in the area have access to piped water inside their dwelling. The access to energy in the area is satisfactory. Approximately 73.2% of inhabitants in Goedverwacht have access to electricity, which is the lowest percentage on the whole of Bergrivier area. About 98% of the population residing in the Piketberg area has access to a flush toilet, connected to a sewerage system. Only 5.3% of the people living in the Aurora area have access to a flush toilet connected to sewerage system. Housing According to StatsSA and Census Data, 86.4% of individuals living in the Bergrivier municipal area have access to a house. In the Bergrivier Municipal area, 42.6% of the population has ownership of a residential dwelling. 7.4 Poverty in Saldanha Bay Education According to StatsSA and Census Data, the towns with the highest level of education include Vredenburg with 36.4%, Saldanha with 24.5% and Langebaan with 12.4%. These three towns had the highest percentage of individuals who had a higher education. The towns with the largest number of individuals who have no schooling and therefore the highest illiteracy rate are Vredenburg with 39.8%, Saldanha with 23.5% and Saldanha Bay with 13.3%. Health Various health care facilities can be found in Saldanha Bay Municipal area. In Hopefield there is a well established clinic. Mobile clinics can also be located in Hopefield. In Saldanha there is a hospital. Currently there are HIV/Aids Awareness programmes which are active in the Saldanha Bay Local Municipality. These are mostly being run by NGO’s such as Siyabonga. The clinics in the area provide a platform for HIV/Aids Awareness programmes. Most of the residents in the area have access to these programmes. Sport and Recreation There are various types of sport and recreational facilities in Saldanha Bay Local Municipality. According to the survey there are the following different sport facilities:
Soccer fields
WWWeeesssttt CCCoooaaasssttt PPPooovvveeerrrtttyyy AAAlll llleeevvviiiaaattt iiiooonnn SSStttrrraaattteeegggyyy
© 2006 Urban-Econ: Development Economists +27 21 447 3449 [email protected]
xvii
Rugby fields Cricket fields Swimming Pool Tennis Courts
The various leisure activities in the Saldanha Bay area include:
Golfing Sailing Bowls
These activities are subject to membership and it is not always possible for all members of the public to access these facilities free of charge. This needs to be addressed in terms of community upliftment with the various sport clubs and forums. Local Economic Development The two towns with the largest portion of the working population are Vredenburg and Saldanha. The percentage of unemployed individuals exceeds that of the employed individuals in both these towns. Therefore there is either a lack in employment opportunities or a lack in training or both which prohibits individuals from being employed. The average household spends most of their monthly income on housing and food as well as clothing and footwear followed by alcohol. Education as well as housing can be subsidised by the government and this could allow households decreases their expenses and increase their disposable income. There are many tourist attractions in Saldanha Bay Local Municipality. The tourism industry has large economic and social potential in the Saldanha Bay area. It is important to mention that tourism plays a very important role in this area as many towns are located near the sea and therefore many holiday tourist come to the area. There are two SMME development organisations that are very active in the Saldanha Bay Local Municipality area. The West Coast Business Development Centre has indicated that there is a growing demand by the local inhabitants for the services which they provide. They provide services to the whole of the West Coast but their facilities are located in Saldanha the local individuals attend courses and receive training in Saldanha which can cause minor logistical problems. Safety There are a total of six police stations in the Saldanha Bay Local Municipality. There is nine neighborhood watch programmes in the whole area. Social Development There are various types of social grant which individuals can access if they meet the necessary criteria as set out by the Department of Social Development. There are Youth Development organizations which are active in the Saldanha Bay Municipal area. The Mati Community Service Organization has various active programmes in the area. It is also very important that the senior citizens gain support from the community and government. The “Golden Oldies” is an important programme in the Saldanha Bay Municipal area. According to the sample survey which was done, 95% of the population in the Saldanha Bay Municipal area has access to an identity document. No individual living in the Saldanha Bay Municipal area has access to a rehabilitation centre.
WWWeeesssttt CCCoooaaasssttt PPPooovvveeerrrtttyyy AAAlll llleeevvviiiaaattt iiiooonnn SSStttrrraaattteeegggyyy
© 2006 Urban-Econ: Development Economists +27 21 447 3449 [email protected]
xviii
Financial and Government Services According to survey results, affordability is experiences by the general population as 25% of inhabitants experience the transport costs to be very high. Affordability of food is experienced as unaffordable by 50% of the population, whilst only 10% experience that services such as water and electricity is affordable. In Saldanha Bay Municipal area, 3.5% of individuals experience housing to be unaffordable. There are numerous banking facilities in Saldanha Bay Municipal area. Many poorer individuals feel that the location of these financial facilities is to far from there house to be accessed on foot. Communication According to StatsSA, of the households living in Jacobsbaai 61.6% has access to telephone and a cell phone within their dwellings. Approximately 31.9% of individuals living in st Helena Bay have access to a public telephone, and 3.5% of individuals in Saldanha Bay (NU) have no access to a telephone. Of the population in the Saldanha Bay Municipal area, 12% has access to a computer and the internet. Land Reform The land reform process is dependant on the availability of land. The land which is available in Saldanha Bay Local Municipality for land reform according to the Land Reform Strategy for the West Coast (2006) includes the following:
State Land - 44146,361 hectares Commonage - 3100 hectares Admiralty Reserve - Not Quantified
The opportunities and constraints which exist have to be taken into account regarding the current land distribution within Saldanha Bay Local Municipality which is distributed as follows:
Dry-land - 99 923 hectares Irrigation - 80 hectares Usable veld - 63 696 hectares Improved grassland - 119 hectares
According to the Land Reform Strategy currently there are 12 emerging resource poor farming projects in the Saldanha Bay Municipal area. These include:
Vredenburg Kleinboere Vereniging (29 participants) Westfork Kleinboere Vereniging (29 participants)
Transport Public Transport is a significant problem in the Saldanha Bay municipal area. Individuals must travel large distances on foot or they must make use of taxi’s which is very expensive. The poorer community does not have the financial means to afford this mode of transport. It is therefore the responsibility of government to investigate the problem relating to lack of access to efficient public transport networks to ensure mobilization of the poor. Basic Services In the Saldanha Bay Municipal area, most individuals have access to basic services. Approxiamately 69.7% of the individuals who reside in the area has access to piped water in their dwellings and 24.4% of the inhabitants has access to water in their yards.
WWWeeesssttt CCCoooaaasssttt PPPooovvveeerrrtttyyy AAAlll llleeevvviiiaaattt iiiooonnn SSStttrrraaattteeegggyyy
© 2006 Urban-Econ: Development Economists +27 21 447 3449 [email protected]
xix
The access to electricity in the Saldanha Bay Municipal area is satisfactory. Approximately 56% of individuals have access to electricity. Approximately 91.3% of inhabitants have access to a sanitary system within their dwellings. Individuals living in Aurora mostly have access to pit latrines. Housing According to StatsSA, 78.5% of individuals living in Saldanha Bay Local Municipality have access to a house. About 48.7% of individuals living in Saldanha Bay Local Municipality own their own house and have paid it in full. 7.5 Poverty in Swartland Education The population distribution of the Swartland has various levels of education as only 10.0% of the population has had no schooling and 23.2% of the population has received very limited primary education. Of the population 10.0% has received an education up to and including Grade 7 and 30.7% of the population has attended high school. Of the population 18.8% has received their matric certificate and 7.4% of the population has received a tertiary education in the form of a College, Technikon or a University Health Various health facilities can be found in the Swartland Municipal area. HIV/Aids programmes and clinics can also be accessed by the community. Sport and Recreation There are not many different types of sport and recreational facilities in the Swartland Municipal area. According to the survey there are the following different sport facilities:
Soccer fields Rugby fields Cricket fields Tennis Clubs Swimming Pools
There are leisure facilities in the Swartland Municipal area, namely:
4x4 trails Hiking trails Horse ride Bowling Clubs Golf Clubs
Local Economic Development According to Census Data (2001) 89.8% of the population in the Swartland is employed, 10.2% is unemployed. The average household spends most of their monthly income on food and clothing as well as housing followed by education. Education as well as housing can be subsidised by the government and this could allow households to have less expenses and increase their amount of disposable income. The Swartland Municipal area has a growing tourism industry. Various tourism activities are being established throughout the area.
WWWeeesssttt CCCoooaaasssttt PPPooovvveeerrrtttyyy AAAlll llleeevvviiiaaattt iiiooonnn SSStttrrraaattteeegggyyy
© 2006 Urban-Econ: Development Economists +27 21 447 3449 [email protected]
xx
There are SMME development organisations in the West Coast that are active in the area. SMME development is important, especially since there is a lack of economic development which will ensure an increase in job opportunities. Safety There are 4 police stations and 6 Neighbourhood watches in the Swartland Municipal area. (Source: SAPS, 2006) Social Development There are various types of social grants which individuals can access if they meet the necessary criteria. The criteria are determined by the Department of Social Welfare and Poverty Alleviation. There are various youth development programmes which are currently underway in the Swartland Municipal area. In each settlement there is a service centre where these programmes are currently being implemented. There is a youth development organisation called the Catholic Welfare and Development (CWD) Youth Development organisation. There are elderly development programmes within the Swartland Municipal area. One of the projects for the elderly is in the Moorreesburg area which helps the elderly to stay active and socialise whilst taking part in sporting activities. The access to Identification Documents in the Swartland Municipal area, according to the survey which was done in the area indicates that 98% of the residents have an ID. No formal statistics is available for this by the Department of Home Affairs therefore the survey is the only primary information source available. Financial and Government Services According to the surveys results in the Swartland Municipal area 15% of households cannot afford transport 70% food, and 10%housing and 5% indicated that basic services are unaffordable. There are banks in the Swartland Municipal area but no business support centres. This is a problem for local entrepreneurs but they can be assisted by the West Coast Business Development organisation and the Red Door Initiative if they want financial assistance etc. for SMME development. For further financial assistance the only other option is to make use of traditional financial institutions for home loans etc Communication According to StatsSA, 100% of residents in Dassen Island has access to a telephone as well as a cell phone in their dwellings. In Riebeek-Wes only 4.4% of individuals have access to a cell phone in their dwellings. Approximately 58.7 % of people residing in the greater Chatsworth area make use of a public telephone and 8.6% have no access to a any public telephone facility. The access to computers and internet in the Swartland Municipal area is illustrated according to the available census data as well as the survey data. The survey data illustrated that 100% of the individuals living in the Swartland Municipal area specifically have access to internet and computer facilities. Land Reform The land reform process is dependant on the availability of land. The land which is available in the Swartland Municipal area for land reform includes the following according to the Land Reform Strategy for the West Coast (2006) which includes the following:
State Land - 16829,7573 hectares Commonage - 1496,0 hectares
WWWeeesssttt CCCoooaaasssttt PPPooovvveeerrrtttyyy AAAlll llleeevvviiiaaattt iiiooonnn SSStttrrraaattteeegggyyy
© 2006 Urban-Econ: Development Economists +27 21 447 3449 [email protected]
xxi
The opportunities and constraints which exist have to be taken into account regarding the current land distribution within the Swartland Municipal area which is distributed as follows:
Dry-land - 272 902 hectares Irrigation - 5286 hectares Usable veld - 60 067 hectares
It can be summarised that there is land available in the Swartland Municipal area for land reform and that is it necessary that the relevant land reform strategy be incorporated in ensuring that the parties who are HDI candidates receive access to land etc. It is important to educate the individuals regarding the land potential in terms of tourism, mining and other opportunities which they can access as well as the specific crops and stock which they must farm with which is specific for the area. It is important that the land reform strategy be aligned with a skills development strategy which is important for local economic development in all sectors. Transport According to Census Data, the mode of transport which individuals living in the Swartland Municipal area travel to work and school is on foot. This is followed by travelling as a passenger in a private vehicle, by car as a driver and by bus. The transport network in the Swartland Municipal area is developed compared to the rest of the areas within the West Coast, although the infrastructure is in need of upgrading etc. There are settlements which can only be reached via a dirt road and this makes it very difficult to promote other forms of public transport to travel to these destinations. This has an impact on the tourism and trade in the area as well. Basic Services According to StatsSA, the individuals living in the Swartland Municipal area mostly (i.e. 72%) have access to water in the form of piped water inside their dwellings. This is followed by 16.2% of individuals who have piped water but inside their yards. Of individuals 5.0% make use of piped water on a community yard less than 200 meters away from their dwelling. According to the poverty criteria 93.2% of individuals living in the Swartland Municipal area have access to water and are above the poverty line. Access to energy is determined in terms of individuals who have access to electricity. Approximately 91.8% of individuals living in the Swartland Municipal area have access to electricity therefore they are above the poverty line. Type of energy which is used mostly besides electricity is candles which are used by 5.3% of individuals followed by other sources such as paraffin etc. which contributes 2.1%. The individuals living in the Swartland Municipal area do not all have access to a proper sanitation facility. Of households in the Swartland Municipal area 74.9% have access to a flush toilet connected to a sewerage system. Housing According to StatsSA and Census Data indicates that 82.8% of individuals living in the Swartland Municipal area have access to a house. According to Census Data, 42.7% of individuals living in the Swartland Municipal area own their own house and have paid it in full. 7.6 Poverty in DMA Education The population distribution of the DMA has various levels of education namely 14% of the population has had no schooling and 24% of the population has received very limited primary education. Approximately 13% of the population has received an education up to and including Grade 7 and 33% of the population has attended high school. Of the population 11% has received their matric certificate and 4% of the population has received a tertiary education in the form of a College, Technikon or a University.
WWWeeesssttt CCCoooaaasssttt PPPooovvveeerrrtttyyy AAAlll llleeevvviiiaaattt iiiooonnn SSStttrrraaattteeegggyyy
© 2006 Urban-Econ: Development Economists +27 21 447 3449 [email protected]
xxii
Health Health facilities can be located in the DMA but this is subjective to the location and services available. Sport and Recreation There are not many different types of sport and recreational facilities in the DMA. According to the survey there are the following different sport facilities:
Soccer fields Rugby fields Cricket fields
There are no leisure facilities in the DMA. Local Economic Development According to StatsSA, 63% of the population in the DMA is employed. Of the individuals 37% is unemployed. The average household spends most of their monthly income on food and clothing as well as housing followed by education. Education as well as housing can be subsidised by the government and this could allow households to have less expenses and increase their amount of disposable income. There aren’t many tourist attractions in the DMA. There aren’t many tourist attractions in the DMA The two SMME development organisations in the West Coast are not very active in the DMA except for the 1000/1000 project. There is a very drastic need for SMME development opportunities to be accessed by citizens living in the DMA especially since there is a lack of economic development which will ensure an increase in job opportunities. Safety The only police station in the West Coast is situated in Nuwerus. (Source: SAPS, 2006) Social Development There are various types of social grants which can be access by individuals if they meet the necessary criteria as determined by the Department of Social Welfare and Poverty Alleviation. There are various youth development programmes which are currently underway in the DMA. In each settlement there is a service centre, where these programmes are currently being implemented. There is a main youth development organisation, the Knersvlakte Youth Development organisation. They provide training and projects for youth regarding life skills, teenage pregnancy, HIV/Aids and specifically substance abuse. This is in all settlements excluding Stofkraal. The infrastructure is lacking in terms of community halls etc. but currently there is an increase in the number of youth development programmes and projects. The main project for the elderly in the DMA is the Golden Games which helps the elderly to stay active and socialise whilst taking part in sporting activities. This is a very successful project which is implemented throughout the DMA. Financial and Government Services According to the sample survey the households in the DMA, 25% of households indicated that transport in unaffordable and 31.3& indicated that food is not affordable. A further 31.3% indicated than they cannot afford basic services.
WWWeeesssttt CCCoooaaasssttt PPPooovvveeerrrtttyyy AAAlll llleeevvviiiaaattt iiiooonnn SSStttrrraaattteeegggyyy
© 2006 Urban-Econ: Development Economists +27 21 447 3449 [email protected]
xxiii
There are no banks and business support centres in the DMA. The only type of support which these individuals can access is if they travel to the nearest town such as Vredendal and Bitterfontein where they can make use of those facilities etc. Communication According to StatsSA, 12% of individuals who reside in Bitterfontein have access to a cell phone and a telephone within their dwellings. 57% of individuals in Nuwerus have access to public telephones. Land Reform The land reform process is dependant on the availability of land. The land which is available in the DMA for land reform includes the following according to the Land Reform Strategy for the West Coast (2006) includes the following:
State Land - 14 936 hectares Commonage - 0 hectares Coloured Rural Areas - 7 162 hectares Admiralty Reserve - Not Quantified Conservation - 60 000 hectares
The opportunities and constraints which exist have to be taken into account regarding the current land distribution within the DMA which is distributed as follows:
Dry-land - 44 973 hectares Irrigation - 7 hectares Usable veld - 691 217 hectares
Transport Public Transport is a very large problem in the DMA. Individuals are forced to travel long distances to make use of taxis as there are no alternative public transport available for them. Taxis are a very expensive mode of transport especially for the poor. It is therefore the responsibility of government to assist the poor to gain better access to public transport facilities. Basic Services In the DMA area most individuals have access to basic services. Hundred percent of individuals have access to piped water within their dwellings. Access to energy in the DMA is satisfactory as 100% of individuals have access to electricity. 100% of individuals have access to sanitary systems in the dwellings. Housing According to StatsSA, 78% of individuals living in the DMA have access to a house. About 66.4% of individuals living in the DMA own their own house and have paid it in full.
WWWeeesssttt CCCoooaaasssttt PPPooovvveeerrrtttyyy AAAlll llleeevvviiiaaattt iiiooonnn SSStttrrraaattteeegggyyy
© 2006 Urban-Econ: Development Economists +27 21 447 3449 [email protected]
xxiv
8. Strategic Planning The 13 Thrusts for the WCDM area’s economy were identified and these include the following: TTTHHHRRRUUSSSTTT OOONNNEEE : Education U
U F
U
TTTHHHRRRUUUSSSTTT TTTWWWOOO : Health TTTHHHRRRUUUSSSTTT TTTHHHRRREEEEEE : Sport and Recreation TTTHHHRRRUUSSSTTT FFOOOUUURRR : Local Economic Development TTTHHHRRRUUUSSSTTT FFF IIIVVVEEE : Safety TTTHHHRRRUUUSSSTTT SSSIIIXXX : Social Development TTTHHHRRRUUUSSSTTT SSSEEEVVVEEENNN : Financial and Government Services TTTHHHRRRUUUSSSTTT EEEIIIGGGHHHTTT : Communication TTTHHHRRRUUUSSSTTT NNNIIINNNEEE : Land Reform TTTHHHRRRUUUSSSTTT TTTEEENNN : Transport TTTHHHRRRUUUSSSTTT EEELLLEEEVVVEEENNN : Basic Services TTTHHHRRRUUSSSTTT TTTWWWEEELLLVVVEEE : Housing TTThhhrrruuusssttt TTTHHHIIIRRRTTTEEEEEENNN : Environment 8.1 Potential Projects Various potential projects have been identified in each municipal area and according to the outcomes of the poverty criteria measurements of each area within the Municipal areas. The prioritisation of various projects is of utmost importance for the Poverty alleviation process. It is important that stakeholders at government prioritise projects in terms of the following criteria:
Strategic Importance Sustainable Impact and Job Creation Capacity building Community Upliftment Potential Anchor Projects
9. Implmentation and Action Plan The Implementation and Action plan is necessary to assist the West Coast District Municipality to identify which projects are of most importance for implementation and also to identify which projects could lead to further spin-off effects within the local municipalities’ poor areas. Projects and programmes which are realistic and practical were identified, which could facilitate and promote the triple bottom line. Actions Recommended actions were given as a guideline to various stakeholders involved in the process. Location Areas were identified where these potential projects could occur. Role Players Various role-players have been identified who will need to form part of the implementation process of the identified programmes and projects. In order to present a clear understanding of the key role-players, which have been identified as being responsible for the implementation, it is necessary to mention that the West Coast District Municipality and the six municipal areas will often play facilitating roles in some of these projects without being solely responsible for the implementation.

WWWeeesssttt CCCoooaaasssttt PPPooovvveeerrrtttyyy AAAlll llleeevvviiiaaattt iiiooonnn SSStttrrraaattteeegggyyy
© 2006 Urban-Econ: Development Economists +27 21 447 3449 [email protected]
xxv
Time period Different time frames were given according to the projects capacity. Costs Costs were determined according to the projects identified and these costs are just estimates of how much the projects could amount to. Risks Risks are given in terms of low, medium and high, depending on the projects intensity. 10. Conclusion In order to implement the various poverty programmes formulated in this Implementation and Action Plan, the various institutional recommendations have to be initiated and established as a matter of urgency. These drivers of the poverty alleviation process throughout the West Coast District will in all probability not succeed if the political ambition is not included in the implementation process as a whole. Therefore the inclusion of all the role-players and stakeholders throughout the planning process has been able to initiate political will, generate interest and stimulate dialogue. Therefore only through a fast-tracked approach to the commencement of implementation will these benefits, which occurred during the process, be sustained and momentum gained. It is important to note that a brief window of opportunity exists for the exploitation of these benefits before these opportunities are lost. This will influence future efforts to initiate a similar approach to poverty alleviation negatively. Against the timeframes determined in the action plan, it is vitally important to utilise the period between the present and the commencement dates as an opportunity to perform pre-initiation planning. It is critically important that the role-players in the West Coast District take ownership of this Implementation and Action Plan to facilitate the implementation of the development programmes as soon as possible. The monitoring and evaluation of the various activities should be incorporated into the performance management system of the West Coast District Municipality. This will ensure that accountability and responsibility, for implementation, is allocated and that potential conflicts are avoided.
WWWeeesssttt CCCoooaaasssttt PPPooovvveeerrrtttyyy AAAlll llleeevvviiiaaattt iiiooonnn SSStttrrraaattteeegggyyy
© 2006 Urban-Econ: Development Economists +27 21 447 3449 [email protected]
i
Bestuursopsomming 1. Inleiding Urban-Econ was aangestel deur die Weskus Distrik Munisipaliteit om ʼn strategiese plan vir armoede- verligting in die Weskusstreek op te stel. Die Armoedeverligting-strategie is ʼn probeerslag om armoede in die streek wat gesien is as ʼn multidimensionele bedreiging te bekamp en om groei en welstand in die Weskus te bevorder in die Weskus Distrik sowel as die provinsie en Suid Afrika as ʼn geheel. Die Armoedeverligting-strategie is in die volgende hoofstukke verdeel: Hoofstuk Twee: Beleidsraamwerk Hoofstuk Drie: Armoede Model Hoofstuk Vier: Sosio-ekonomiese Analise Hoofstuk Vyf: Armoede Profiel Hoofstuk Ses: Armoede Meting in die Weskus Distrik Hoofstuk Sewe Strategiese Plan Hoofstuk Agt: Implementering en Aksieplan 2. Doel van die Studie Alle rolspelers kom te staan teen baie uitdagings tenopsigte van gemeenskapontwikkeling en armoedeverligting. Daarom is dit noodsaaklik dat ʼn strategie ontwikkel word waaruit programme, projekte en verskeie ander aksieplanne sal onstaan om armoedeverligting te beplan. Dit is ʼn provinsiale prioriteit tenopsigte van die vlak van armoede in die Weskus Distrik en die Weskaap. Die mikpunt van die strategie is om ʼn definisie van armoede te gee wat deel vorm van die identifisering van die sleutel armoede in die WKDM. Hierdie kriteria maak dit moontlik om armoededrempels te konseptualiseer. Hierdie definisie is gebruik om ʼn situasieanalise van die area te skep en om die vlak van armoede in die verskillende areas te verstaan en watter armoedeverligting projekte tans geïmplementeer word. Die strategie is gefokus rondom die ontwikkeling en identifisering van geleenthede, programme en projekte wat:
Die plaaslike hulpbron basis effektief sal gebruik tot die voordeel van die plaaslike gemeenskappe in die verskeie plaaslike munisipaliteite in die WKDM.
Om die lewensstandaard van die gemeenskap wat in armoede bly te verhoog. Om die munisipaliteit in staat te stel om meer en beter dienste en fasiliteite te verskaf. Om die menslike hulpbronpotensiaal en geleenthede vir ontwikkeling te ontwikkel. Om skakels tussen die ontwikkelde en onderontwikkelde areas te ontwikkel.
WWWeeesssttt CCCoooaaasssttt PPPooovvveeerrrtttyyy AAAlll llleeevvviiiaaattt iiiooonnn SSStttrrraaattteeegggyyy
© 2006 Urban-Econ: Development Economists +27 21 447 3449 [email protected]
ii
3. Metodologie Die volgende subseksie sal die metodologie wat gevolg is tydens die samestelling van die Weskus Armoede Strategie beskryf met spesiale verwysing na opnames wat gedoen was. Die Armoede Strategie is saamgestel om eers georiënteerd te raak met die projek en die eintlike bestek van die werk. ʼn Situasieanalise was gedoen om die huidige sosio-ekonomiese klimaat van die Weskus Distrik en die ses plaaslike munisipale areas saam te stel. Dit was gebruik om die armoede kriteria te beskryf wat die armoede definisie identifiseer spesifiek vir die WKAVS. Die eerste Indaba was gehou om die navorsers meer inligting te gee vanaf die relevante insethouers en om die strategie bekend te maak aan die gemeenskap. Die opnames wat gedoen wat gedoen was, was onderneem in die volgende areas: Munisipale Areas Aantal Huishoudings 1% van huishoudings
─ Matzikama 14 095 140 ─ Cederberg 10 366 103 ─ Bergrivier 11 705 117 ─ Saldanha Bay 18 707 187 ─ Swartland 17 403 174 ─ DMA 1 175 11 TOTAAL 73 451 732
Die opnames was gedoen in die arm areas van spesifieke nedersettings en dorpe wat gevind is binne elk van die ses munisipale areas. Die areas was geïdentifiseer deur data te gebruik van die Departement van Welsyn wat te doen het met die aantal huishoudings wat staat maak op sosiale toelaes. Hierdie inligting is gekorreleer met die areas waar die betaalpunte gevind is wat in arm areas in die verskeie dorpe gevind is. Die veldwerkers wat gebruik is om die opnames te doen is individu wat werkloos is, hulle is in diens geneem met die hulp van die plaaslike munisipaliteite se Gemeenskapswerkers. Hierdie inligting saam met formele statistieke en ander relevante primêre en sekondêre bronne is gebruik om ʼn armoede profiel vir elk van die ses areas te skep. Die areas binne elke een van die ses munisipale areas het ʼn armoede skatting gekry in terme van die armoede lyn, van of bo of onder die armoede lyn, en daaruit het die verskeie geleenthede, programme en projekte gekom om die spesifieke probleme aan te spreek. Hierdie geïdentifiseerde projekte wat saamgestel is onder die twaalf armoede dryfkrag wat geprioritiseer was en dit vorm deel van die strategiese plan en die finale implementerings plan van die AVS. 4. Beleidsraamwerk Die wetgewing en beleide wat ʼn invloed op die AVS vir die Weskus gehad het en kan hê is saamgevat as deel van die beleidsraamwerk en beïnvloed die manier hoe die Weskus Streek die Armoedeverligting- strategie in die afgemerkte area gaan benader. Hierdie afdeling gee ʼn oorsig van wetgewing wat toepaslik is op die AVS. Die relevante wetgewing en beleide is hieronder gelys:
Makro Ekonomiese Beleid Die Makro Ekonomiese Ontwikkelings-strategie van die Wes Kaap (MEDS) (2005) Ikapa Elihlumayo Die Heropbou- en- Ontwikkelings Program (HOP) Arbeidsmark Beleid
WWWeeesssttt CCCoooaaasssttt PPPooovvveeerrrtttyyy AAAlll llleeevvviiiaaattt iiiooonnn SSStttrrraaattteeegggyyy
© 2006 Urban-Econ: Development Economists +27 21 447 3449 [email protected]
iii
Industriële Beleid Die Weskus Distrik Ruimtelike Plan (Vol 1 & 2) Ruimtelike Ontwikkelingsinisiatief Groei potensiaal van dorpe in die Weskus (2004) Weskus Investering Inisiatief Waardering (Nov 1997) Geïntegreerde Armoedeverligting-Strategie vir die Wes Kaap Provinsie Geïntegreerde Ontwikkelings-Raamwerk vir die Weskus Distrik Munisipaliteit Onderwysbeleid Gesondheidsbeleid Migreer Raamwerk vir die Weskus Distrik Toerisme Strategie vir die Weskus Distrik Munisipale Infrastruktuur- beleid Landsbeleid Vervoerbeleid Telekommunikasie Behuisingsbeleid Water en Sanitasiebeleid
Implikasies vir die Weskus Armoedeverligting-Strategie Dit is van kardinale belang dat die Weskus Distrik en die Departement van Maatskaplike Werk en Armoede Verligting saam werk in die geveg teen armoede. Die Armoedeverligting-Strategie moet met die bo genoemde beleide in lyn wees sodat die strategie volle ondersteuning van die Provinsiale Regering kan verkry. 5. Armoede Model Armoede kan gedefinieer word as volg, “om nie genoeg geld te hê om in ‘n persoon se daaglikse behoeftes te kan voorsien nie.” Daarom is armoede omskryf deur die feit dat mense nie die nodige hulpbronne het om alles te verkry wat hulle benodig of begeer is nie armoede nie. Wanneer mense hulle- self in so posisie bevind dan is dit ‘n geveg om oorlewing. Die toestand van armoede is ingewikkeld en kompleks. Armoedeverligting is nie ‘n eenvoudige oplossing nie. Ras, geslag, familiêre status, ouderdom en woonbuurt is gedeeltelik verantwoordelik maar nie al die eienskappe wat die risiko loop om in armoede te leef, en verhoog nie. Die doel van hierdie feitlike dokumente is om die kennis van armoede te vergroot. As sulks is dit moeilik om armoede te meet want armoede is ‘n komplekse kwessie. Drie bestanddele word verduidelik om in armoede meting te bepaal. Eerstens moet die relevante dimensie en aanwysers van welstand gekies word. Tweedens moet daar ‘n armoede lyn gekies word wat ‘n drempel onder ‘n gegewe huishouding of individue as arm geklassifiseer word. Laastens moet daar ‘n armoede meting gekies word om die bevolking as geheel te evalueer. Om hierdie konsep van bystand aan te neem, moet die gemeenskap riglyn beginselsneerlê. ‘n Gemeenskap benodig dit om die volgende punte in oënskou te neem as die beginsels in aanmerking geneem word, ‘n Bystand gemeenskap:
Bereik natuurlike vermoëns om na die menslike benodighede om te sien, sonder om die vermoëns te ondermyn.
Verseker die welstand van sy lede, offer en moedig verdraagsaamheid, kreatiwiteit, deelname en veiligheid aan.
Bemagtig mense met gelyke verantwoordelikhede, gelyke geleenthede, en toegang tot kundigheid en kennis, met die vermoë om beslissings te maak.
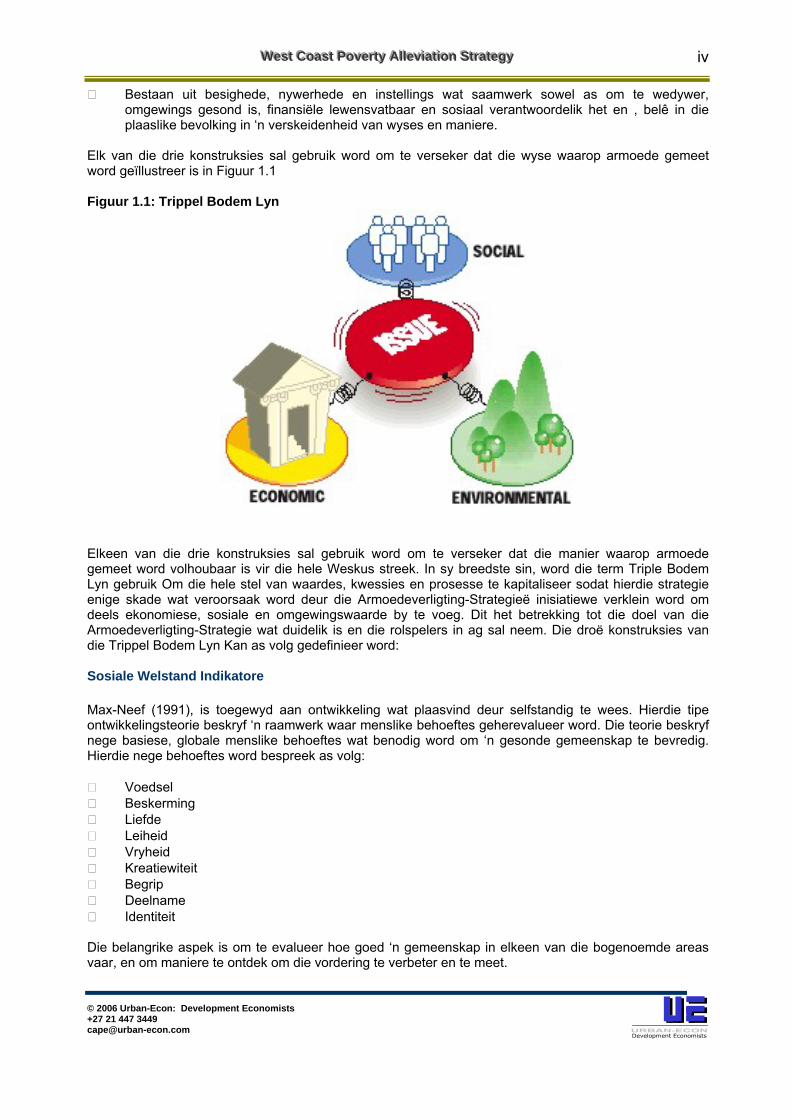
WWWeeesssttt CCCoooaaasssttt PPPooovvveeerrrtttyyy AAAlll llleeevvviiiaaattt iiiooonnn SSStttrrraaattteeegggyyy
© 2006 Urban-Econ: Development Economists +27 21 447 3449 [email protected]
iv
Bestaan uit besighede, nywerhede en instellings wat saamwerk sowel as om te wedywer, omgewings gesond is, finansiële lewensvatbaar en sosiaal verantwoordelik het en , belê in die plaaslike bevolking in ‘n verskeidenheid van wyses en maniere.
Elk van die drie konstruksies sal gebruik word om te verseker dat die wyse waarop armoede gemeet word geïllustreer is in Figuur 1.1 Figuur 1.1: Trippel Bodem Lyn
Elkeen van die drie konstruksies sal gebruik word om te verseker dat die manier waarop armoede gemeet word volhoubaar is vir die hele Weskus streek. In sy breedste sin, word die term Triple Bodem Lyn gebruik Om die hele stel van waardes, kwessies en prosesse te kapitaliseer sodat hierdie strategie enige skade wat veroorsaak word deur die Armoedeverligting-Strategieë inisiatiewe verklein word om deels ekonomiese, sosiale en omgewingswaarde by te voeg. Dit het betrekking tot die doel van die Armoedeverligting-Strategie wat duidelik is en die rolspelers in ag sal neem. Die droë konstruksies van die Trippel Bodem Lyn Kan as volg gedefinieer word: Sosiale Welstand Indikatore Max-Neef (1991), is toegewyd aan ontwikkeling wat plaasvind deur selfstandig te wees. Hierdie tipe ontwikkelingsteorie beskryf ‘n raamwerk waar menslike behoeftes geherevalueer word. Die teorie beskryf nege basiese, globale menslike behoeftes wat benodig word om ‘n gesonde gemeenskap te bevredig. Hierdie nege behoeftes word bespreek as volg:
Voedsel Beskerming Liefde Leiheid Vryheid Kreatiewiteit Begrip Deelname Identiteit
Die belangrike aspek is om te evalueer hoe goed ‘n gemeenskap in elkeen van die bogenoemde areas vaar, en om maniere te ontdek om die vordering te verbeter en te meet.
WWWeeesssttt CCCoooaaasssttt PPPooovvveeerrrtttyyy AAAlll llleeevvviiiaaattt iiiooonnn SSStttrrraaattteeegggyyy
© 2006 Urban-Econ: Development Economists +27 21 447 3449 [email protected]
v
Omgewingsimpak Indikatore Die aarde se ekosisteem kan nie vir ewig die huidige vlakke of vorm van ekonomiese aktiwiteit en materialegebruik volhou nie. Dit is noodsaaklik dat nuwe leefstylmaniere gevind word wat verwesenlik en volhoubaar is binne die kapasiteit van die natuur. Om omgewingsvolhoubaarheid te bereik, moet gemeenskappe ‘n waardering kry vir die aanvraag wat die gebruik en vervaardiging van produkte van gemeenskappe plaas op die natuur. Die voetspooranalise stel gemeenskappe in staat om hulle konsumpsie van energie, kos, behuising, vervoer en verbruikers- goedere en dienste te evalueer in terme van die behoefte na land wat benodig word om konsumpsie op huidige vlakke te volhou (Wackernagel & Rees, 1998). Byvoorbeeld, Wackernagel & Rees (1998) het bepaal dat die vlak van konsumpsie wat volhoubaarheid is vir elke individue op hierdie aarde is ongeveer 1.5 hektaar. Simson et al. (2000) het bereken dat die per kapita voetspoor vir Australiërs 8.11 hektaar is. As elke mens op aarde teen hierdie vlak hulpbronne gebruik, gaan die mensdom binnekort ‘n addisionele ses planete benodig. Die voetdruk analise gee plaaslike inligting wat spesifiek is. Dit kan gebruik word om verandering aan te help in die wyse hoe mense hulpbronne gebruik, en dit Kan lei tot ‘n aanneming en ontwikkeling van innoverende oplossings. Ekonomiese Geleentheidsindikatore Kinsley’s (1997) se konsep van ontwikkeling is ‘n prosess wat die plaaslike ekonomie se vordering verbeter eerder as om dit te laat groei. Die ekonomiese komponent van ‘n gemeenskap is deels om gemeenskappe by te staan om meer te maak met wat hulle tot hulle beskikking het, eerder as om alleenlik op eksterne hulpbronne te steun. Die gemeenskap moet die tipe ekonomiese aktiwiteit bepaal wat hulle benodig en hoe bestaande maatskappye vorder, alles wat relatief is tot die volhoubare kriteria wat bespreek is. Vir klein landelike gemeenskappe om te oorleef moet distrikalliansies gevorm word. Besigheidsgroepe moet gevorm word om waarde toe voeg by elkeen se bestaande onderneming. Kommunikasie is ook benodig om vrae te beantwoord omtrent die ekonomiese (maw. Inkomste en indiensneming) prestasie van elkeen van die sektore se ontwikkeling. Byvoorbeeld, het toerisme werklik so ‘n goeie impak op werkskepping ens.? Wat sal die ekonomiese impak wees op nuwe ontwikkelingsaktiwiteite? Is daar sektore wat alreeds bestaan wat ‘n groot potential het om by te voeg tot die plaaslike ekonomie? Die verskeie armoede kriteria wat gebruik sal word om armoede te meet in hierdie studie is beskryf in Tabel 3.1 wat ooreenstem met elkeen van die drie vlakke van die Trippel Bodem Lyn. Kriteria 1: Toegang tot Opleiding Kriteria 2: Vlak van Opvoeding Kriteria 3: Toegang tot Opvoedingsfasiliteite Kriteria 4: Frekwensie van beskikbaarheid van Gesondheidsorg fasiliteite Kriteria 5: Toegang tot traumasorg fasiliteite Kriteria 6: Reaksietyd van mediese noodgevalle fasiliteite Kriteria 7: HIV/Vigs Bewusmakingsprogramme Kriteria 8: Toegang tot sport fasiliteite Kriteria 9: Toegang tot rekreasie en ontspanningsaktiwiteite Kriteria 10: Werkstatus Kriteria 11 Huishoudelike Inkomste en Uitgawes Kriteria 12: Toerisme-ontwikkeling Kriteria 13: SMME Ontwikkeling Kriteria 14: Toegang tot Sekuriteit Kriteria 15: Toegang tot Sosiale Toelae Kriteria 16: Toegang tot Jeugsorg fasiliteite Kriteria 17: Jeugontwikkeling Kriteria 18: Senior burgersontwikkeling Kriteria 19: Toegang tot Identiteitdokumente
WWWeeesssttt CCCoooaaasssttt PPPooovvveeerrrtttyyy AAAlll llleeevvviiiaaattt iiiooonnn SSStttrrraaattteeegggyyy
© 2006 Urban-Econ: Development Economists +27 21 447 3449 [email protected]
vi
Kriteria 20: Toegang tot Rehabilitasiesentrums Kriteria 21: Voedings dienste Kriteria 22: Bekostigbaarheid Kriteria 23: Bekostigbaarheid van Finansiële dienste Kriteria 24: Bekostigbaarheid van Staats dienste Kriteria 25: Toegang tot finansiële en besigheids dienste Kriteria 26: Toegang tot OTM en Banke Kriteria 27: Toegang tot Telefone Kriteria 28: Toegang tot rekenaars en internet Kriteria 29: Grondhervorming Kriteria 30: Toegang tot vervoer Kriteria 31: Toegang tot water Kriteria 32: Toegang tot elektrisiteit Kriteria 33: Toegang tot sanitasie Kriteria 34: Behuising tipe Kriteria 35: Eiendomsreg Kriteria 36: Toegang tot Behuising 6. Sosio-ekonomiese Profiel van die Weskus Die doel van die afdeling is om insig oor die relatiewe grootte en struktuur van die plaaslike ekonomie van die Weskus, asook die ekonomiese profiel van die plaaslike munisipaliteite, te voorsien. Tweedens, die afdeling sal ook ‘n breë perspektief van die ekonomie en die verskeie aspekte van die ekonomie, wat gebruik kan word om die armoede metings binne die ekonomiese konteks te illustreer, voorsien. Die perspektief sal ‘n beter beskrywing gee van die vermoëns, van die plaaslike ekonomie, kapitaal-investering en operasionele uitgawes, asook ander voordele wat na vore kan kom vanweë verskeie projekte afkomstig van die WAVS, bepaal. Ekonomiese Profiel Die Plaaslike ekonomie van die Weskus is ‘n vatbare ekonomie. Soos genoem in Hoofstuk 3 is daar verskeie sektore wat tans groei en ontwikkeling ervaar. Dit is baie belangrik dat armoede aangespreek moet word deur werkskeppingsgeleenthede, wat voorsien word deur besigheid in die Weskus. Bruto Waardetoevoeging Die sektor wat die meeste bydrae tot die BWT van die Weskus Distrik Munisipaliteit (WDM), is die Vervaardigings sektor wat 20.5% bygedra het tot BWT. Dit word gevolg deur die Landbou sektor, wat 18.9% bygedra het tot BWT. Die Vervaardigings sektor is ook die grootste sektor as gevolg van die vervaardiging van sub-sektor produkte soos voedsel en drank en metaal produkte, wat 41.7% van die totale vervaardigingssektor bygedra het. Die Landbou sektor, veral die vis sektor, vorm ‘n groot deel van die ekonomiese aktiwiteite in die Weskus Streek. Sektor Indiensneming Die indiensnemingskoers verwys na die ekonomiese aktiewe persone wat werkloos is en wat wel op soek is na werk, asook die persone wat werkloos is en nie op soek is na werk nie, maar wat wel werk sal aanvaar as dit aangebied word. Die kategorie sluit ook die ekonomiese onaktiewe populasie in, wat bestaan uit persone wat nie werk nie soos huisvrouens, skoliere, studente, pensionarisse, gestremde persone wat nie werk nie. Dit is belangrik om te weet dat 35% van die werkende populasie werke het in die Landbou en Vis sektor, wat seisoenaal van aard is. Die situasie, gekombineer met die feit 79% van die populasie maandelikse salarisse van minder as R1 600 ontvang, dra by tot die hoë vlakke van armoede in die area (StatsSA, 2001). Behalwe in die Landbou sektor is werksgeleenthede gekonsentreerd in die vervaardigings, handel en diens sektore. Die myn, verkope, diens en besigheids sektor het n groei gehad in werksgeleenthede.
WWWeeesssttt CCCoooaaasssttt PPPooovvveeerrrtttyyy AAAlll llleeevvviiiaaattt iiiooonnn SSStttrrraaattteeegggyyy
© 2006 Urban-Econ: Development Economists +27 21 447 3449 [email protected]
vii
Sosiale Profiel Die doel van die afdeling is om n oorsig van die sosio-ekonomiese situasie van die Weskus Distrik Munisipaliteit se populasie te gee, wat gebaseer is op data verkry van Census Data en Statistieke Suid Afrika. Bevolking Die totale populasie vir die WDM (wat landelike en stedelike areas insluit) was bepaal op 282 661 in 2001,(StatsSA en Census Data 2001). Volgens StatsSA se gestandaardiseerde data, het die populasie van die WDM gegroei van 245 497 in 1996 tot 290 973 in 2004. Dit verteenwoordig ‘n groeikoers van 2.1% per jaar tussen 1996 tot 2004. Meeste van die WDM se populasie is gevestig in die Swartland Plaaslike Munisipaliteit (25.5%), gevolg deur die Saldanhabaai Plaaslike Munisipaliteit (24.9%) en die Matzikama Plaaslike Munisipaliteit (17.8%). Werkloosheid Volgens StatsSA en Census 2001 se resultate, het die volgende in terme van werksgeleenthede in die WDM na vore gekom: Die aantal werklose persone is die laagste in die Bergrivier, Swartland en Cederberg Munisipaliteite. Die Bergrivier, Cederberg en Swartland Munisipaliteite het die hoogste indiensnemingskoers. Vanaf 1996 tot 2004 het die koers gedaal met 5.5% in die Weskus Distrik. Vlak van Vaardighede Die vaardighede kategorie het gegroei van 29.9% tot 33.4% in die WDM. Die kategorie was die hoogste in 2001, en het deel gevorm van die gemeenskapsdienste, handel, konstruksie, vervaardigings en dienste sektor (wat ook die toerisme industrie insluit). Die aantal werkers wat oor geen vaardighede beskik nie, het gegroei van 51% in 1996 tot 51.2% in 2001. Die professionele persone met vaardighede in die WDM moet gereeld pendel na die groter metropolitaanse areas binne die Wes-Kaap. Dit dra by tot die uitvloei van werkers met vaardighede na ander areas. Dit kan n negatiewe impak op die plaaslike en distriksekonomie hê. Geslag en Ouderdom Die grootste populasie in die WDM is tussen die ouderdom van 15 en 64, wat die ekonomiese aktiewe bevolking insluit.
Huishoudelike Inkomste Die huishoudelike inkomste word gebruik om armoedevlakke in n gemeenskap te bepaal. Die inkomste vlakke van n sekere area verskaf insig in die ekonomiese gedrag van ‘n spesifieke gemeenskap in terme van die koopkrag van die gemeenskap en die potensiële armoedevlakke waaraan die gemeenskap blootgestel word. Die populasie syfers toon dat in 2001, 6.8% van huishoudings in WDM geen inkomste gehad het nie. Die meerderheid (22.7%) van huishoudings verdien ‘n inkomste van tussen R19 201-R38 400 per jaar en 21.4% verdien n inkomste tussen R9 601-R19 200 per jaar. Meer as 23.9% van die populasie verdien minder as R1 600 per maand. ‘n Groot persentasie van die WDM populasie lewe in armoede en die situasie het vererger sedert 1996.
WWWeeesssttt CCCoooaaasssttt PPPooovvveeerrrtttyyy AAAlll llleeevvviiiaaattt iiiooonnn SSStttrrraaattteeegggyyy
© 2006 Urban-Econ: Development Economists +27 21 447 3449 [email protected]
viii
Gevolgtrekkings Die Sosio-ekonomiese profiel van die studie area het getoon dat daar ‘n definitiewe behoefte vir armoedeverligting-inisiatiewe is om ge-implementeer te word in die verskeie munisipaliteite. Die voorgestelde projekte, wat bespreek sal word in die volgende afdeling, sal verband hou met die verskeie behoeftes wat geïdentifiseer is deur die opnames en die sosio-ekonomiese indikatore. 7. Weskus Armoede Profiel n Oorsig van die armoede kriteria vir elke munisipale area binne die WDM sal kortliks bespreek word. 7.1 Armoede in Matzikama Opvoeding Volgens Census Data beskik 22% van die populasie oor ‘n gedeeltelike primêre opvoeding. Slegs 10.5% van die populasie beskik oor primêre opvoeding en 33.6% beskik oor sekondêre opvoeding. Ongeveer 17.1% van die populasie beskik oor Graad 12. Slegs 6.2% van persone in die Matzikama Munisipale area beskik oor n hoër vlak van opvoeding en 10% van die populasie beskik oor geen opvoeding. Gesondheid Verskeie gesondheid fasiliteite kan in die Matzikama Munisipale area gevind word. In Lutzville, Doringbaai, Strandfontein, Ebenhaezer, Koekenaap en Stofkraal is daar een Munisipale satelliet kliniek en in Klawer is daar een satelliet kliniek en een mobiele kliniek. Vanrhynsdorp beskik oor ‘n mobiele kliniek. In Vredendal is daar is 1 mobiele kliniek and 1 distrik hospitaal. HIV/Vigs bewusmaking programme kan by verskeie klinieke gevind word. Sport and Rekreasie Daar is sport, rekreasie en ontspannings fasiliteite in die Matzikama Munisipale area. Die publiek het toegang tot die volgende fasiliteite en aktiwiteite:
Rugbyvelde Sokkervelde Krieketvelde Rotsklim Staproetes Bergfiets roetes 4X4 Roetes
Plaaslike Ekonomiese Ontwikkeling Matzikama (landelikke gebied) en Strandfontein het die meeste individue wat werksaam is. Werkloosheid is die hoogste in Doringbaai (54.3%) asook in Koekenaap 39.9%. Die gemiddelde arm huishouding kan nie hul maandelikse behoeftes nakom nie, omdat hul uitgawes meer is as hul inkomstes. Die gemiddelde huishouding spandeer die meeste van hul maandelikse inkomste aan voedsel en klerasie, sowel as opvoeding en behuising. Baie families het nie eers n inkomste nie en word geforseer om te oorleef op hul toelaes. Die Matzikama Munisipale area het ‘n goeie mark vir toerisme. Verskeie toerisme-aktiwiteite kom van seisoen tot seisoen in die area voor.
WWWeeesssttt CCCoooaaasssttt PPPooovvveeerrrtttyyy AAAlll llleeevvviiiaaattt iiiooonnn SSStttrrraaattteeegggyyy
© 2006 Urban-Econ: Development Economists +27 21 447 3449 [email protected]
ix
Die Weskus distrik het toegang tot die Weskus besigheidssentrum, waar persone gehelp word met SMME ontwikkeling. Die enigste probleem vir die persone in die Matzikama munisipale area is dat die sentrum in Vredenburg is en te vêr is vir hulle om na te reis. Veiligheid Daar is 5 polisiestasies in die hele Matzikama Munisipale area, en 3 buurtwagte. (Bron: SAPS, 2006). Sosiale Ontwikkeling Daar is verskeie tipes sosiale toelaes wat individue kan bekom as hul oor die nodige kriteria beskik. Dit word bepaal is deur die Departement van Sosiale Ontwikkeling. Daar is jeug-ontwikkelings-organisasies en programme in die Matzikama Munisipale area. Die organisasie in Doringbaai is bekend as die “St. Magdalene Youth Organisation”. In Koekenaap is die “St. Thaddues Youth Organisation”, in Lutzville en Vanrhynsdorp is die “AGS Youth Organisation”. Vredendal het 4 jeug-organisasies wat aktief is in die area. Dit is ook baie belangrik dat die senior burgers ondersteuning van die gemeenskap en owerheid ontvang. Daar is n plek vir die bejaardes in Doringbaai wat “Bejaarde diens” genoem word. Volgens die steekproef opname wat gedoen is, het 99% van die populasie in die Matzikama Munisipale area, toegang tot Identiteit dokumente (ID). Slegs een persent van die populasie het nie ID’s nie. Daar is geen toegang tot rehabilitasiesentrums in die Matzikama munisipale area nie. Die naaste sentrum is in Worcester en Mitchell’s Plain in Kaapstad. Finansiële en Owerheidsdienste Volgens die steekproef opname wat gedoen is, voel 15% van die arms dat vervoer nie bekostigbaar is nie, 60% voel dat voedsel nie bekostigbaar is nie en slegs 10% voel dat water en elektrisiteit bekostigbaar is. Slegs 5% voel dat telefone wel bekostigbaar is. Slegs 10% in die Matzikama Munisipale area voel dat behuising nie bekostigbaar is nie. Daar is wel banke, maar geen besigheids ondersteuningsdienste in die Matzikama Munisipale area nie. Dit skep dus n probleem vir die plaaslike entrepreneurs. Hulle kan wel bygestaan word deur die Weskus Besigheidsontwikkelings organisasie en die RED Door Inisiatief in terme van finansiële bystand ens. vir SMME ontwikkeling. Kommunikasie Volgens die Census Data, het 58.6% van persone wat woonagtig is in Vredendal toegang tot ‘n selfoon en ‘n telefoon in hul huise. In Koekenaap het slegs 2% van persone toegang tot ‘n telefoon en ‘n selfoon en in Ebenhaezer het slegs 3.9% toegang tot ‘n selfoon. Ongeveer 77.7% van die persone in Vredendal het toegang tot publieke telefone, en 3.4% van persone het geen toegang tot telefone nie. n Persentasie van die populasie in die Matzikama munisipale area het toegang tot rekenaars en die internet. Volgens die opnames het 100% van die arm populasie in die Matzikama Munisipale area toegang tot rekenaars en die internet. Grondhervorming Die grond hervormingsproses is afhanklik van die beskikbaarheid van grond. Die grond wat beskikbaar is in die Matzikama Munisipale area vir grondhervorming sluit die volgende in, volgens die Grondhervormings Strategie vir die Weskus (2006):
Staatsgrond - 56 801,6822 hektaar Algemene grond - 700,0 hektaar
WWWeeesssttt CCCoooaaasssttt PPPooovvveeerrrtttyyy AAAlll llleeevvviiiaaattt iiiooonnn SSStttrrraaattteeegggyyy
© 2006 Urban-Econ: Development Economists +27 21 447 3449 [email protected]
x
Bruin landelike areas - 65 724 hektaar Die geleenthede en beperkinge wat bestaan, moet in ag geneem word aangaande die huidige grond verspreiding binne Matzikama wat verdeel is as volg:
Droë-land - 68 889 hektaar Besproeiing - 16 496 hektaar Bruikbare veld - 438 806 hektaar
Die gevolgtrekking is dat daar wel grond beskikbaar is in die Matzikama Munisipale area vir grondhervorming. Vervoer Publieke vervoer is ‘n groot probleem in die Matzikama munisipale area. Persone moet lang afstande loop of gebruik maak van taxis wat baie duur is. Daar is ook geen busse in die area nie. Die arm gemeenskappe het nie eers geld om vir vervoer te betaal nie. Die owerheid moet dus die probleem van vervoer ondersoek om die armes te help mobiliseer. Basiese Dienste Die individue wat in Matzikama Municipal area woonagtig is het meestal (i.e. 66.3%) toegang tot water in die vorm van pyp water binne in hulle wonings. Meeste van die bevolking in Matzikama het meestal toegang tot water in hulle erwe. Daarom as hierdie inligting vir die armoede kriteria gebruik word dan het 93.2% van die bevolking in Matzikama toegang tot water en is hulle bo die armoede lyn. Omtrent 84.9% van dies bevolking het toegang tot elektrisiteit. Die tipe energie wat meestal gebruik is (uitsluitende elektrisiteit) is meestal wat deur 12.8% van die bevolking gebruik word. Die opname se resultate toon aan dat 80% van die bevolking gebruik maak van nie net elektrisiteit nie maar ook gas en paraffien. Van die bevolking het 70.3% van alle huishoudings in Matzikama Municipal area toegang tot ‘n spoel -toilet wat gekoppel is aan in rioolstelsel. ‘n Vêrdere 9.1% het toegang tot ‘n toilet wat gekoppel is aan ‘n septiese tenk. Daarom het meer as 80% van die bevolking toegang tot ‘n sanitêre fasiliteit. As die armoede kriteria gebruik word as ‘n maatstaf dan het 11.4% van die bevolking nog steeds nie toegang tot sanitêre fasiliteite nie. Behuising Van dies bevolking in Matzikama Municipal area het 84.5% toegang tot formele behuising. Omtrent 4.1% van dies individue woon in tradisionele wonings en 0.8% in semi-afgeskorte wonings. Die huishoudings wat in tradisionele wonings bly, het nie toegang tot basiese dienste nie want dit word net in formele behuising geïnstalleer, en daarom het hulle geen toegang tot hierdie basiese diens nie. 7.2 Armoede in Cederberg Opvoeding Volgens Census Data beskik 24.8% van die populasie oor gedeeltelike primêre opvoeding. Slegs 12.2% van die populasie beskik oor primêre opvoeding en 30.9% beskik oor sekondêre opvoeding. Ongeveer 14.6% van die populasie beskik oor Graad 12. Slegs 5.6% van persone in die Cederberg Munisipale area beskik oor ʼn hoër vlak van opvoeding. Gesondheid Verskeie gesondheidsfasiliteite kan in die Cederberg Munisipale area gevind word. In Citrusdal, Lamberts Bay, Graafwater en Clanwilliam het die mense toegang tot ʼn kliniek. Wuppertal, Clanwilliam en Citrusdal

WWWeeesssttt CCCoooaaasssttt PPPooovvveeerrrtttyyy AAAlll llleeevvviiiaaattt iiiooonnn SSStttrrraaattteeegggyyy
© 2006 Urban-Econ: Development Economists +27 21 447 3449 [email protected]
xi
beskik elk ʼn mobiele kliniek. In die Cederberg Munisipale omgewing is daar ook 1 distrik hospitaal. HIV/Vigs bewusmakingsprogramme kan by verskeie klinieke gevind word. Sport en Rekreasie Daar is sport, rekreasie en ontspannings fasiliteite in die Cederberg Munisipale area. Die publiek het toegang tot die volgende fasiliteite:
Rugbyvelde Sokkervelde Staproetes Vakansieoorde 4X4 Roetes
Plaaslike Ekonomiese Ontwikkeling Die gemiddelde arm huishouding kan nie hul maandelikse behoeftes nakom nie, omdat hul uitgawes meer is as hul inkomstes. Die gemiddelde huishouding spandeer die meeste van hul maandelikse inkomste aan voedsel en klerasie, sowel as opvoeding en behuising. Baie families het nie eers ʼn inkomste nie en word geforseer om te oorleef op hul toelaes. Die Cederberg Munisipale area het ʼn goeie mark vir toerisme. Verskeie toerisme-aktiwiteite kom van seisoen tot seisoen in die area voor. Die Weskus distrik het toegang tot die Weskus besigheids entrum, waar persone gehelp word met SMME ontwikkeling. Die enigste probleem vir die persone in die Cederberg munisipale area is dat die sentrum in Vredenburg is en te vêr is vir hulle om na te reis. Veiligheid Daar is 5 polisiestasies in die hele Cederberg Munisipale area, en 4 buurtwagte in die hele area (Bron: SAPS, 2006). Sosiale Ontwikkeling Daar is verskeie tipes sosiale toelaes wat individue kan bekom as hul oor die nodige kriteria beskik. Dit word bepaal deur die Departement van Sosiale Ontwikkeling. Daar is jeugontwikkelings organisasies en programme in die Cederberg Munisipale area. Die organisasie in Citrusdal is bekend as die “Kultuur en Jeug Organisasie”. In Lamberts Bay is die “Maranatha Youth Organisation” aktief. Dit is ook baie belangrik dat die senior burgers ondersteuning van die gemeenskap en owerheid ontvang. Daar is ʼn plek vir die bejaardes in Citursdal wat “Sentrum Vir Senior” genoem word. Volgens die steekproefopname wat gedoen is, het 100% van die populasie in die Cederberg Munisipale area, toegang tot Identiteitdokumente (ID). Daar is geen toegang tot rehabilitasiesentrums in die Cederberg munisipale area nie. Die naaste sentrum is in Worcester en Mitchell’s Plain in Kaapstad. Finansiële en Owerheidsdienste Volgens die steekproefopname wat gedoen is, voel 10% van die arms dat vervoer nie bekostigbaar is nie, 65% voel dat voedsel nie bekostigbaar is nie en slegs 10% voel dat water en elektrisiteit bekostigbaar is. Slegs 10% in die Cederberg Munisipale area voel dat behuising nie bekostigbaar is nie.
WWWeeesssttt CCCoooaaasssttt PPPooovvveeerrrtttyyy AAAlll llleeevvviiiaaattt iiiooonnn SSStttrrraaattteeegggyyy
© 2006 Urban-Econ: Development Economists +27 21 447 3449 [email protected]
xii
Daar is banke in die Cederberg Munisipale area. Die arm gemeenskap voel dat die afstand na die bank is te ver om te loop. Kommunikasie Volgens die Census Data, het 20.2% van persone wat woonagtig is in Lamberts Bay toegang tot ʼn selfoon en ‘n telefoon in hul huise. Ongeveer 49.2% van die persone in Elandsbaai het toegang tot publieke telefone, en 7.5% van persone in die Cederberg Munisipaal area het geen toegang tot telefone nie. ʼn Persentasie van die populasie in die Cederberg munisipale area het toegang tot rekenaars en die internet. Volgens die opnames het 100% van die arm populasie in die Cederberg Munisipale area toegang tot rekenaars en die internet. Grondhervorming Die grondhervormingsproses is afhanklik van die beskikbaarheid van grond. Die grond wat beskikbaar is in die Cederberg Munisipale area vir grondhervorming sluit die volgende in, volgens die Grondhervorming Strategie vir die Weskus (2006):
Staatsgrond - 32 410, 9115 hektaar Algemene grond - 2400, 00 hektaar
Die geleenthede en beperkinge wat bestaan, moet in ag geneem word aangaande die huidige grondverspreiding binne Cederberg wat verdeel is as volg:
Droë-land - 126 277 hektaar Besproeiing - 56 535 hektaar Bruikbare veld - 528 873 hektaar
Die gevolgtrekking is dat daar wel grond beskikbaar is in die Cederberg Munisipale area vir grondhervorming. Vervoer Publieke vervoer is ʼn groot probleem in die Cederberg munisipale area. Persone moet lang afstande loop of gebruik maak van taxi’s wat baie duur is. Daar is ook geen busse in die area nie. Die arm gemeenskappe het nie eers geld om vir vervoer te betaal nie. Die owerheid moet dus die probleem van vervoer ondersoek om die arms te help mobiliseer. Basiese dienste In die Cederberg munisipale omgewing het meestel van die arm mense toegang tot basiese dienste. In Cederberg munisipale area het 71.3% van die mense wat in die gebied woon, toegang tot gepypde water in hul huise en 22.1% van die inwoners in Cederberg Munisipale area het toegang tot water op hul erf. Die toegang tot energie in die Cederberg omgewing is bevredigend. Ongeveer 99.4% van inwoners in Lamberts Bay het toegang tot elektrisiteit, wat die hoogste persentasie is in die hele Cederberg munisipale gebied. Ongeveer 96.3% van die inwoners in Citrusdal het toegang tot riool sisteme in hul huise. Cederberg NU (landelike gebied) se arm mense het meestel toegang tot pit latrines en balies. Behuising Volgens StatsSA en Census Data, het 87.9% van die individu in die Cederberg Munisipale gebied toegang tot ʼn huis en 39.7% het eienaarskap van ʼn residensiële woning.
WWWeeesssttt CCCoooaaasssttt PPPooovvveeerrrtttyyy AAAlll llleeevvviiiaaattt iiiooonnn SSStttrrraaattteeegggyyy
© 2006 Urban-Econ: Development Economists +27 21 447 3449 [email protected]
xiii
7.3 Armoede in Bergrivier Opvoeding Volgens Census Data beskik 23.3% van die populasie oor gedeeltelike primêre opvoeding. Slegs 10.7% van die populasie beskik oor primêre opvoeding en 32% beskik oor sekondêre opvoeding. Ongeveer 18.1% van die populasie beskik oor Graad 12. Slegs 6.3% van persone in die Bergrivier Munisipale area beskik oor ʼn hoër vlak van opvoeding. Gesondheid Verskeie gesondheidsfasiliteite kan in die Bergrivier Munisipale area gevind word. In Aurora, Goedverwacht, Koringberg, Piketberg en Porterville is daar ʼn Munisipale satellietkliniek elk in hierdie gebiede. Aurora, Eendekuil, Grootfontein, Porterville beskik elk oor ʼn mobiele kliniek en Piketberg beskik oor 5 mobiele klinieke. In Porterville is daar ook 1 distrik hospitaal. HIV/Vigs bewusmaking programme kan by verskeie klinieke gevind word. Sport en Rekreasie Daar is sport, rekreasie en ontspannings fasiliteite in die Bergrivier Munisipale area. Die publiek het toegang tot die volgende fasiliteite:
Rugbyvelde Sokkervelde Swembaddens Museums Staproetes Strand Vakansie-oorde 4X4 Roetes
Plaaslike Ekonomiese Ontwikkeling Die gemiddelde arm huishouding kan nie hul maandelikse behoeftes nakom nie, omdat hul uitgawes meer is as hul inkomstes. Die gemiddelde huishouding spandeer die meeste van hul maandelikse inkomste aan voedsel en klerasie, sowel as opvoeding en behuising. Baie families het nie eers ʼn inkomste nie en word geforseer om te oorleef op hul toelaes. Die Bergrivier Munisipale area het ʼn goeie mark vir toerisme. Verskeie toerisme-aktiwiteite kom van seisoen tot seisoen in die area voor. Die Weskus distrik het toegang tot die Weskus besigheidssentrum, waar persone gehelp word met SMME ontwikkeling. Die enigste probleem vir die persone in die Bergrivier munisipale area is dat die sentrum in Vredenburg is en te vêr is vir hulle om na te reis. Veiligheid Daar is 5 polisiestasies in die hele Bergrivier Munisipale area, en 3 buurtwagte. (Bron: SAPS, 2006). Sosiale Ontwikkeling Daar is verskeie tipes sosiale toelaes wat individue kan bekom as hul oor die nodige kriteria beskik. Dit word bepaal deur die Departement van Sosiale Ontwikkeling. Daar is Jeug-ontwikkelings-organisasies en programme in die Bergrivier Munisipale area. Die organisasie in Porterville is bekend as die “Undivided Youth Organisation”. In Velddrift is die “Youth Upliftment Organisation” aktief. In Piketberg en Eendekuil het ook Jeug-organisasies wat aktief in die area is.

WWWeeesssttt CCCoooaaasssttt PPPooovvveeerrrtttyyy AAAlll llleeevvviiiaaattt iiiooonnn SSStttrrraaattteeegggyyy
© 2006 Urban-Econ: Development Economists +27 21 447 3449 [email protected]
xiv
Dit is ook baie belangrik dat die senior burgers ondersteuning van die gemeenskap en owerheid ontvang. Daar is ʼn plek vir die bejaardes in Piketberg wat “Dienssentrum vir Bejaardediens” genoem word. Volgens die steekproefopname wat gedoen is, het 100% van die populasie in die Bergrivier Munisipale area toegang tot Identiteitsdokumente (ID). Daar is geen toegang tot rehabilitasiesentrums in die Bergrivier munisipale area nie. Die naaste sentrum is in Worcester en Mitchell’s Plain in Kaapstad. Finansiële en Owerheidsdienste Volgens die steekproefopname wat gedoen is, voel 20% van die arms dat vervoer nie bekostigbaar is nie, 60% voel dat voedsel nie bekostigbaar is nie en slegs 10% voel dat water en elektrisiteit bekostigbaar is. Slegs 10% in die Bergrivier Munisipale area voel dat behuising nie bekostigbaar is nie. Daar is banke in die Bergrivier Munisipale area. Die arm gemeenskap voel dat die afstand na banke is te ver om te loop. Kommunikasie Volgens die Census Data, het 47.5% van persone wat woonagtig is in Dwarskersbos toegang tot ʼn selfoon en ʼn telefoon in hul huise. In Bergrivier NU het slegs 11.2% van persone toegang tot ʼn telefoon en ʼn selfoon en in Goedverwacht het slegs 1.7% toegang tot ʼn selfoon. Ongeveer 42.6% van die persone in Porterville het toegang tot publieke telefone, en 4.6% van persone het geen toegang tot telefone nie. ʼn Persentasie van die populasie in die Bergrivier munisipale area het toegang tot rekenaars en die internet. Volgens die opnames het 100% van die arm populasie in die Bergrivier Munisipale area toegang tot rekenaars en die internet. Grondhervorming Die grondhervormingsproses is afhanklik van die beskikbaarheid van grond. Die grond wat beskikbaar is in die Bergrivier Munisipale area vir grondhervorming sluit die volgende in, volgens die Grondhervorming Strategie vir die Weskus (2006):
Staatsgrond - 17 338, 2764 hektaar Algemene grond - 947,0 hektaar Bruin landelike areas - 65 724 hektaar
Die geleenthede en beperkinge wat bestaan, moet in ag geneem word aangaande die huidige grondverspreiding binne Bergrivier gebied wat verdeel is as volg:
Droë-land - 200 444 hektaar Besproeiing - 34 036 hektaar Bruikbare veld - 157 021 hektaar
Die gevolgtrekking is dat daar wel grond beskikbaar is in die Bergrivier Munisipale area vir grondhervorming. Vervoer Publieke vervoer is ʼn groot probleem in die Bergrivier munisipale area. Persone moet lang afstande loop of gebruik maak van taxi’s wat baie duur is. Daar is ook geen busse in die area nie. Die arm gemeenskappe het nie eers geld om vir vervoer te betaal nie. Die owerheid moet dus die probleem van vervoer ondersoek om die arms te help mobiliseer.
WWWeeesssttt CCCoooaaasssttt PPPooovvveeerrrtttyyy AAAlll llleeevvviiiaaattt iiiooonnn SSStttrrraaattteeegggyyy
© 2006 Urban-Econ: Development Economists +27 21 447 3449 [email protected]
xv
Basiese dienste In die Bergrivier munisipale omgewing het meestel van die arm mense toegang tot basiese dienste. In Dwarskersbos het 100% van die mense wat in die gebied woon, toegang tot gepypde water in hul huise en 34.5% van die inwoners in Eendekuil het toegang tot water op hul erf. Die toegang tot energie in die Bergrivier-omgewing is bevredigend. Ongeveer 73.2% van inwoners in Goedverwacht het toegang tot elektrisiteit, wat die laagste persentasie is in die hele Bergrivier munisipale gebied. Ongeveer 98% van die inwoners in Piketberg het toegang tot riool sisteme in hul huise. Aurora se arm mense het meestel toegang tot pit latrines en balies. Behuising Volgens StatsSA en Census Data, het 86.4% van die individu in die Bergrivier Munisipale gebied toegang tot ʼn huis en 42.6% het eienaarskap van ʼn residensiële woning. 7.4 Armoede in Saldanha Bay Opvoeding Volgens Census Data beskik 36.4% van die populasie in Vredenburg die hoogste vlak van opvoeding, as ook Saldanha 24.5% en Langebaan 12.4%. In hierdie drie dorpe beskik die mense ʼn tertiêre vlak van opvoeding . Een van die dorpe wat die hoogste persentasie van enkelinge sonder opvoeding het en wat die hoogste ongeletterdheids vlak het, is in Saldanha Bay. Gesondheid Verskeie gesondheidsfasiliteite kan in die Saldanha Bay Munisipale area gevind word. In Hopefield is daar verstandige klinieke. Daar kan ook mobiele klinieke in Hopefield gevind word. In Saldanha is daar ook hospitale. HIV/Vigs bewusmakingsprogramme kan by verskeie klinieke gevind word. Sport en Rekreasie Daar is sport, rekreasie en ontspannings fasiliteite in die Saldanha Bay Munisipale area. Die publiek het toegang tot die volgende fasiliteite:
Rugbyvelde Sokkervelde Swembaddens Krieketvelde Tennisbane Museums Staproetes Strand Vakansie-oorde 4X4 Roetes
Plaaslike Ekonomiese Ontwikkeling Vredenburg en Saldanha het die meeste individue wat werksaam is. Werkloosheid in die Saldanha Munisipale gebied is hoog en die tekort aan werksgeleenthede verbied indiwidu om werksaam te wees. Die gemiddelde arm huishouding kan nie hul maandelikse behoeftes nakom nie, omdat hul uitgawes meer is as hul inkomstes. Die gemiddelde huishouding spandeer die meeste van hul maandelikse inkomste aan voedsel en klerasie, sowel as opvoeding en behuising. Baie families het nie eers ʼn inkomste nie en word geforseer om te oorleef op hul toelaes.

WWWeeesssttt CCCoooaaasssttt PPPooovvveeerrrtttyyy AAAlll llleeevvviiiaaattt iiiooonnn SSStttrrraaattteeegggyyy
© 2006 Urban-Econ: Development Economists +27 21 447 3449 [email protected]
xvi
Die Saldanha Bay Munisipale area het ʼn goeie mark vir toerisme. Verskeie toerisme-aktiwiteite kom van seisoen tot seisoen in die area voor. Die Weskus distrik het toegang tot die Weskus besigheidsentrums, waar persone gehelp word met SMME ontwikkeling. Veiligheid Daar is 6 polisiestasies in die hele Saldanha Bay Munisipale area, en 9 buurtwagte in die hele area (Bron: SAPS, 2006). Sosiale Ontwikkeling Daar is verskeie tipes sosiale toelaes wat individue kan bekom as hul oor die nodige kriteria beskik. Dit word bepaal deur die Departement van Sosiale Ontwikkeling. Daar is Jeug-ontwikkelings organisasies en programme in die Saldanha Bay Munisipale area. Die Matie “Community Services” is een van die projekte wat aktief in die area is. Dit is ook baie belangrik dat die senior burgers ondersteuning van die gemeenskap en owerheid ontvang. Daar is die “Golden Oldies” vir die bejaardes in die Saldanha Bay omgewing. Volgens die steekproefopname wat gedoen is, het 95% van die populasie in die Saldanha Bay Munisipale area, toegang tot Identiteitsdokumente (ID). Daar is geen toegang tot rehabilitasiesentrums in die Saldanha Bay munisipale area nie. Die naaste sentrum is in Worcester en Mitchell’s Plain in Kaapstad. Finansiële en Owerheidsdienste Volgens die steekproefopname wat gedoen is, voel 25% van die arms dat vervoer nie bekostigbaar is nie, 50% voel dat voedsel nie bekostigbaar is nie en slegs 10% voel dat water en elektrisiteit bekostigbaar is. Slegs 8% in die Saldanha Bay Munisipale area voel dat behuising nie bekostigbaar is nie. Daar is banke in die Saldanha Bay Munisipale area. Die arm gemeenskap voel dat die afstand tot die banke is te ver om te loop. Kommunikasie Volgens die Sensus Data, het 70.3% van persone wat woonagtig is in Jacobsbaai toegang tot ʼn selfoon en ʼn telefoon in hul huise. Ongeveer 31.9% van die persone in St. Helena Bay het toegang tot publieke telefone, en 3.5% van persone in Saldanha Bay (NU) het geen toegang tot telefone nie. ʼn Persentasie van die populasie in die Saldanha Bay munisipale area het toegang tot rekenaars en die internet. In Saldanha Bay het 12% van die populasie toegang tot rekenaars en die internet. Grondhervorming Die grondhervormingsproses is afhanklik van die beskikbaarheid van grond. Die grond wat beskikbaar is in die Saldanha Bay Munisipale area vir grondhervorming sluit die volgende in, volgens die Grondhervorming Strategie vir die Weskus (2006):
Staatsgrond - 44146,361 hektaar Algemene grond - 3100 hektaar Bruin landelike areas - Nie gekwantifiseer nie
WWWeeesssttt CCCoooaaasssttt PPPooovvveeerrrtttyyy AAAlll llleeevvviiiaaattt iiiooonnn SSStttrrraaattteeegggyyy
© 2006 Urban-Econ: Development Economists +27 21 447 3449 [email protected]
xvii
Die geleenthede en beperkinge wat bestaan, moet in ag geneem word aangaande die huidige grondverspreiding binne Saldanha Bay wat verdeel is as volg:
Droë-land - 99 923 hektaar Besproeiing - 80 hektaar Bruikbare veld - 63 969 hektaar
Die gevolgtrekking is dat daar wel grond beskikbaar is in die Saldanha Bay Munisipale area vir grondhervorming. Vervoer Publieke vervoer is ʼn groot probleem in die Saldanha Bay munisipale area. Persone moet lang afstande loop of gebruik maak van taxi’s wat baie duur is. Die arm gemeenskappe het nie eers geld om vir vervoer te betaal nie. Die owerheid moet dus die probleem van vervoer ondersoek om die arms te help mobiliseer. Basiese dienste In die Saldanha Bay munisipale omgewing het meestel van die arm mense toegang tot basiese dienste. In die Saldanha Bay Munisipale gebied beskik 69.7% van die mense wat in die gebied woon, toegang tot gepypde water in hul huise en 24.4% van die inwoners in die munisipale omgewing het toegang tot water op hul erf. Die toegang tot energie in die Saldanha Bay munisipale omgewing is bevredigend. Ongeveer 56% van inwoners in die munisipale gebied het toegang tot elektrisiteit. Ongeveer 91.3% van die inwoners in die munisipale omgewing het toegang tot rioolsisteme in hul huise. Aurora se arm mense het meestel toegang tot pit latrines en balies. Behuising Volgens StatsSA en Sensus Data, het 78.5% van die individu in die Saldanha Bay Munisipale gebied toegang tot ʼn huis en 48.7% het eienaarskap van ʼn residensiële woning. 7.5 Armoede in Swartland Opvoeding Volgens Census Data beskik 10.0% van die populasie oor gedeeltelike primêre opvoeding. Slegs 10% van die populasie beskik oor primêre opvoeding en 30.7% beskik oor sekondêre opvoeding. Ongeveer 18.8% van die populasie beskik oor Graad 12. Slegs 7.4% van persone in die Swartland Munisipale area beskik oor ʼn hoër vlak van opvoeding. Gesondheid Verskeie gesondheidsfasiliteite kan in die Swartland Munisipale area gevind word. Daar is ook HIV/Vigs programme in klinieke wat deur die gemeenskap benut kan word. Sport en Rekreasie Daar is sport, rekreasie en ontspanningsfasiliteite in die Swartland Munisipale area. Die publiek het toegang tot die volgende fasiliteite:
Rugbyvelde Sokkervelde Swembaddens
WWWeeesssttt CCCoooaaasssttt PPPooovvveeerrrtttyyy AAAlll llleeevvviiiaaattt iiiooonnn SSStttrrraaattteeegggyyy
© 2006 Urban-Econ: Development Economists +27 21 447 3449 [email protected]
xviii
Tennisbane Gholfbane Museums Staproetes Strand Vakansie-oorde 4X4 Roetes
Plaaslike Ekonomiese Ontwikkeling Volgens Census data (2001) is 89.8% van die populasie in die Swartland Munisipale gebied werksaam en 10.2% van die mense in die omgewing werkloos. Die gemiddelde arm huishouding kan nie hul maandelikse behoeftes nakom nie, omdat hul uitgawes meer is as hul inkomstes. Die gemiddelde huishouding spandeer die meeste van hul maandelikse inkomste aan voedsel en klerasie, sowel as opvoeding en behuising. Baie families het nie eers ʼn inkomste nie en word geforseer om te oorleef op hul toelaes. Die Swartland Munisipale area het ʼn goeie mark vir toerisme. Verskeie toerisme-aktiwiteite kom van seisoen tot seisoen in die area voor. Die Weskus distrik het toegang tot die Weskus besigheidsentrum, waar persone gehelp word met SMME ontwikkeling. Veiligheid Daar is 4 polisiestasies in die hele Swartland Munisipale area, en 6 buurtwagte (Bron: SAPS, 2006). Sosiale Ontwikkeling Daar is verskeie tipes sosiale toelaes wat individue kan bekom as hul oor die nodige kriteria beskik. Dit word bepaal deur die Departement van Sosiale Ontwikkeling. Daar is Jeug-ontwikkelings-organisasies en programme in die Swartland Munisipale area. Die organisasie in die Swartland Munisipale gebied is bekend, as die “Catholic Welfare and Development Youth Organisation”. Dit is ook baie belangrik dat die senior burgers ondersteuning van die gemeenskap en owerheid ontvang. Daar is ʼn plek vir die bejaardes in Moorreesburg wat op die behoeftes van die bejaardes gefokus is. Volgens die steekproefopname wat gedoen is, het 98% van die populasie in die Swartland Munisipale area, toegang tot Identiteitsdokumente (ID). Daar is geen toegang tot rehabilitasiesentrums in die Swartland munisipale area nie. Die naaste sentrum is in Worcester en Mitchell’s Plain in Kaapstad. Finansiële en Owerheidsdienste Volgens die steekproefopname wat gedoen is, voel 15% van die arms dat vervoer nie bekostigbaar is nie, 70% voel dat voedsel nie bekostigbaar is nie en slegs 5% voel dat water en elektrisiteit bekostigbaar is. Slegs 10% in die Swartland Munisipale area voel dat behuising nie bekostigbaar is nie. Daar is banke in die Swartland Munisipale area. Die arm gemeenskap voel dat die afstand na die banke is te ver om te loop.
WWWeeesssttt CCCoooaaasssttt PPPooovvveeerrrtttyyy AAAlll llleeevvviiiaaattt iiiooonnn SSStttrrraaattteeegggyyy
© 2006 Urban-Econ: Development Economists +27 21 447 3449 [email protected]
xix
Kommunikasie Volgens die Census Data, het 100% van persone wat woonagtig is in Dassen Island toegang tot ‘n selfoon en ʼn telefoon in hul huise. In Riebeek -Wes het slegs 4.4% toegang selfoon. Ongeveer 58.7% van die persone in Greater Chatsworth het toegang tot publieke telefone, en 8.6% van persone het geen toegang tot telefone nie. ʼn Persentasie van die populasie in die Swartland munisipale area het toegang tot rekenaars en die internet. Volgens die opnames het 100% van die arm populasie in die Swartland Munisipale area toegang tot rekenaars en die internet. Grondhervorming Die grondhervormingsproses is afhanklik van die beskikbaarheid van grond. Die grond wat beskikbaar is in die Swartland Munisipale area vir grondhervorming sluit die volgende in, volgens die Grondhervorming Strategie vir die Weskus (2006):
Staatsgrond - 16 829, 7573 hektaar Algemene grond - 1496,0 hektaar
Die geleenthede en beperkinge wat bestaan, moet in ag geneem word aangaande die huidige grondverspreiding binne Swartland wat verdeel is as volg:
Droë-land - 272 902 hektaar Besproeiing - 5286 hektaar Bruikbare veld - 60 067 hektaar
Die gevolgtrekking is dat daar wel grond beskikbaar is in die Swartland Munisipale area vir grondhervorming. Vervoer Publieke vervoer is ʼn groot probleem in die Swartland munisipale area. Persone moet lang afstande loop of gebruik maak van taxi’s wat baie duur is. Daar is busse in die area. Die arm gemeenskappe het nie eers geld om vir vervoer te betaal nie. Die owerheid moet dus die probleem van vervoer ondersoek om die arms te help mobiliseer. Basiese dienste In die Swartland munisipale omgewing het meestel van die arm mense toegang tot basiese dienste. In die munisipale gebied het 72% van die mense wat in die omgewing woon, toegang tot gepypde water in hul huise en 5% van die inwoners in munisipale area het toegang tot water op hul erf. Die toegang tot energie in die Swartland omgewing is bevredigend. Ongeveer 91.8% van inwoners in die munisipale omgewing het toegang tot elektrisiteit. Ongeveer 74.9% van die inwoners in die Swartland munisipale gebied het toegang tot rioolsisteme in hul huise. Chatsworth se arm mense het meestel toegang tot pit latrines en balies. Behuising Volgens StatsSA en Census Data, het 82.8% van die individu in die Swartland Munisipale gebied toegang tot ʼn huis en 42.7% het eienaarskap van ʼn residensiële woning.

WWWeeesssttt CCCoooaaasssttt PPPooovvveeerrrtttyyy AAAlll llleeevvviiiaaattt iiiooonnn SSStttrrraaattteeegggyyy
© 2006 Urban-Econ: Development Economists +27 21 447 3449 [email protected]
xx
7.6 Armoede in DMA Opvoeding Volgens Census Data beskik 14% van die populasie oor gedeeltelike primêre opvoeding. Slegs 13% van die populasie beskik oor primêre opvoeding en 33% beskik oor sekondêre opvoeding. Ongeveer 11% van die populasie beskik oor Graad 12. Slegs 4% van persone in die DMA Munisipale area beskik oor ʼn hoër vlak van opvoeding. Gesondheid Gesondheidsfasiliteite kan in die DMA Munisipale area gevind word maar dit is beperk in terme van lokasie en dienste. Sport en Rekreasie Daar is sport, rekreasie en ontspannings-fasiliteite in die DMA Munisipale area. Die publiek het toegang tot die volgende fasiliteite:
Rugbyvelde Sokkervelde
Plaaslike Ekonomiese Ontwikkeling Volgens Census data (2001) is 63% van die populasie in die DMA Munisipale gebied werksaam en 37% van die mense in die omgewing is werkloos. Die gemiddelde arm huishouding kan nie hul maandelikse behoeftes nakom nie, omdat hul uitgawes meer is as hul inkomstes. Die gemiddelde huishouding spandeer die meeste van hul maandelikse inkomste aan voedsel en klerasie, sowel as opvoeding en behuising. Baie families het nie eers ʼn inkomste nie en word geforseer om te oorleef op hul toelaes. Die DMA Munisipale area het nie ʼn baie groot mark vir toerisme nie. Die Weskus distrik het toegang tot die Weskus besigheidsentrum, waar persone gehelp word met SMME ontwikkeling. Die enigste probleem vir die persone in die DMA munisipale area is dat die sentrum in Vredenburg is en te vêr is vir hulle om na te reis. Veiligheid Daar is een polisiestasie in die hele DMA Munisipale area wat in Nuwerus gevind kan word (Bron: SAPS, 2006). Sosiale Ontwikkeling Daar is verskeie tipes sosiale toelaes wat individue kan bekom as hul oor die nodige kriteria beskik. Dit word bepaal deur die Departement van Sosiale Ontwikkeling. Daar is Jeug-ontwikkelings-organisasies en programme in die DMA Munisipale area. Die organisasie in die DMA is bekend as die “Knersvlakte Youth Development Organisation”. Dit is ook baie belangrik dat die senior burgers ondersteuning van die gemeenskap en owerheid ontvang. Daar is ʼn plek wat vir die bejaardes in DMA sorg en dit is bekend as die “Golden Games”.
WWWeeesssttt CCCoooaaasssttt PPPooovvveeerrrtttyyy AAAlll llleeevvviiiaaattt iiiooonnn SSStttrrraaattteeegggyyy
© 2006 Urban-Econ: Development Economists +27 21 447 3449 [email protected]
xxi
Daar is geen toegang tot rehabilitasiesentrums in die DMA munisipale area nie. Die naaste sentrum is in Worcester en Mitchell’s Plain in Kaapstad. Finansiële en Owerheidsdienste Volgens die steekproefopname wat gedoen is, voel 25% van die arms dat vervoer nie bekostigbaar is nie, 31.3% voel dat voedsel nie bekostigbaar is nie en slegs 31.3% voel dat water en elektrisiteit bekostigbaar is. Daar is geen banke in die DMA Munisipale area. Die arm gemeenskap voel dat die afstand na die banke is te ver om te loop en die naaste bank aan Bitterfontein is in Vredendal. Kommunikasie Volgens die Census Data, het 12% van persone wat woonagtig is in Bitterfontein toegang tot ʼn selfoon en ʼn telefoon in hul huise. In Nuwerus het 57% van persone toegang tot publieke telefone. Grondhervorming Die grondhervormingsproses is afhanklik van die beskikbaarheid van grond. Die grond wat beskikbaar is in die DMA Munisipale area vir grondhervorming sluit die volgende in, volgens die Grondhervormings Strategie vir die Weskus (2006):
Staatsgrond - 14 936 hektaar Algemene grond - 0 hektaar Bruin landelike areas - 7 162 hektaar
Die geleenthede en beperkinge wat bestaan, moet in ag geneem word aangaande die huidige grondverspreiding binne DMA wat verdeel is as volg:
Droë-land - 44 973 hektaar Besproeiing - 7 hektaar Bruikbare veld - 691 217 hektaar
Die gevolgtrekking is dat daar wel grond beskikbaar is in die DMA Munisipale area vir grondhervorming. Vervoer Publieke vervoer is ʼn groot probleem in die DMA munisipale area. Persone moet lang afstande loop of gebruik maak van taxi’s wat baie duur is. Daar is ook geen busse in die area nie. Die arm gemeenskappe het nie eers geld om vir vervoer te betaal nie. Die owerheid moet dus die probleem van vervoer ondersoek om die arms te help mobiliseer. Basiese dienste In die DMA munisipale omgewing het meestel van die arm mense toegang tot basiese dienste. In die DMA munisipale omgewing het 100% van die mense wat in die gebied woon, toegang tot gepypde water in hul huise. Die toegang tot energie in die DMA omgewing is goed. 100% van inwoners in DMA het toegang tot elektrisiteit. 100% van die inwoners in die DMA het toegang tot riool sisteme in hul huise. Behuising Volgens StatsSA en Census Data, het 78% van die individu in die DMA Munisipale gebied toegang tot ʼn huis en 66.4% het eienaarskap van ʼn residensiële woning.
WWWeeesssttt CCCoooaaasssttt PPPooovvveeerrrtttyyy AAAlll llleeevvviiiaaattt iiiooonnn SSStttrrraaattteeegggyyy
© 2006 Urban-Econ: Development Economists +27 21 447 3449 [email protected]
xxii
8. Strategiese Beplanning Die dertien strategiese dryfkragte wat geïdentifiseer was vir die Weskus streek is die volgende: DDDRRRYYYFFFKKKRRRAAAGGG EEEEEENNN : Opvoeding DDDRRRYYYFFFKKKRRRAAAGGG TTTWWWEEEEEE : Gesondheid DDDRRRYYYFFFKKKRRRAAAGGG DDDRRRIIIEEE : Sport en Rekreasie DDDRRRYYYFFFKKKRRRAAAGGG VVVIIIEEERRR : Plaaslike Ekonomiese Ontwikkeling DDDRRRYYYFFFKKKRRRAAAGGG VVVYYYFFF : Veiligheid DDDRRRYYYFFFKKKRRRAAAGGG SSSEEESSS : Sosiale Ontwikkeling DDDRRRYYYFFFKKKRRRAAAGGG SSSEEEWWWEEE : Finansiële en Staatsdienste DDDRRRYYYFFFKKKRRRAAAGGG AAAGGGTTT : Kommunikasie DDDRRRYYYFFFKKKRRRAAAGGG NNNEEEGGGEEE : Grondhervorming DDDRRRYYYFFFKKKRRRAAAGGG TTT IIIEEENNN : Vervoer DDDRRRYYYFFFKKKRRRAAAGGG EEELLLFFF : Basiese Dienste DDDRRRYYYFFFKKKRRRAAAGGG TTTWWWAAAAAALLLFFF : Behuising DDDRRRYYYFFFKKKRRRAAAGGG DDDEEERRRTTTIIIEEENNN: Omgewing 8.1 Potensiale Projekte Verskillende potentiale projekte was geidentifiseer vir elkeen van die munisipale areas. Die armoede kriteria se resultate het bewys dat sekere projekte in die verskeie areas moet geimplemeteer moet word om seker te maak dat armoede verlig kan word en die verskeie areas ʼn laer vlak van armoede kan handaaf. Die prioritiseering van potentiëlle projekte is baie belangrik vir die Armoedeverligting-Strategie proses. Dit gee ‘n riglyn aan die verskeie partye wat die projekte gaan implementeer, i.t.v. wanneer watter projek geimplimenteer moet word en watter van die projekte sal nou die grootste verskil kan maak. Elkeen van die strategiese dryfkragte is ook geprioritiseer. Die strategiese prioritseeringskriterise wat gebruik is die volgende:
Strategiese Belangrikheid Volhoubare Impak en Werkskepping Kapasiteitsbou Gemeenskapsontwikkiling Potentiële Anker Projekte
9. Implementerings en Aksie Plan Die doel van die armoede-verligting strategie is om met ‘n voordelige aksieplan voorendag te kom wat met verskeie programme en projekte gepaard gaan. Hierdie programme en projekte is geidentifiseerde en geprioritiseerde teenopsigte van hulle meting in terme van sekere kriteria. Dit is belangrik dat hierdie projekte gesien word as maniere vir die verskeie rol spelers om armoede te kan verlig in die Weskus lyn met die armoede kriteria ens. Die projekte wat geidetifiseerd was is bepreek in verdere detail. 9.1 Geprioritiseerde Projekte Die implementering en aksie plan is nodig om verder projekte en aksies in staat te stel wat tot ‘n realistiese en praktiese benadering tot armoede verligting toe kan lei. Die aksie plan is inlyn met die tripel bodem lyn beginsels.
WWWeeesssttt CCCoooaaasssttt PPPooovvveeerrrtttyyy AAAlll llleeevvviiiaaattt iiiooonnn SSStttrrraaattteeegggyyy
© 2006 Urban-Econ: Development Economists +27 21 447 3449 [email protected]
xxiii
Aksies Voorgestelde aksies was gegee as riglyne vir die verskei rolspelers wat in die process betrokke kan wees. Plekaanwysing Areas was geidentifiseer waar potentiaale projekte geimplimenteer kan word. Rol Spelers Verskeie rolspelers is geïdentifiseerde wat deel sal vorm van die implementering process van die geïdentifiseerde programme en projekte. Dit is nodig om ‘n goeie idea van die voorgestel role van die verskeie sleutel rolspelers wat geïdentifiseerde is die verantwoordelike partye vir die implementering fase. Dit is nodig om wel by te voeg dat die Weskus Distrik munisipaliteit en die ander vyf plaaslike munisipaliteite ‘n groot fasiliteurende rol sal kan speel in die aksie plan sonder om geheel verantwoordelik te wees. Tydperk Verskei tyd perker is voorgestel teenopsigte van die projekt se kapasiteit. Koste Die koste van die verskei projekte was bereken as ‘n vooruitskating van die koste van die projek ekcetra. Risiko Die risiko van die projek is gegee in terme van laag, medium of hoog, afhangende van die projek se intensiteit. 10. Gevolgtrekkings Dit is noodsaaklik dat die Armoedeverligting-Strategie gesien word as ‘n raamwerk waar binne verskei partye hulle rol sal kan identifiseer en saam met verskeie rol spelers die armoede in hulle streek kan bekamp. Armoede is gekonseptualiseer binne die raamwerk van die Weskus streek en sy gemeenskappe. Die vlak van armoede is gemeer en dit is gebruik om die verskillende arm gedeeltes en areas binne die Weskus identifiseer. Die strategie verwys dat daar is ‘n probleem binne die Weskus iv armoede en al verskil dit van gemeenskap tot gemeenskap is dit nodig om ‘n gesamelike probeerslag te gee om die toestand van die gemiddelde huishouding in die Weskus bo die van die armoede lyn te kan bring. Dit is belangrik dat die goue geleentheid wat bestaan vir die verligting van armoede in die geïdentifiseerde areas in die Weskus gebruik word. Die sal die pogings wat in die toekoms aan gewend word in terme van armoede verligting beïnvloed. Dit is van uiterste belange dat die projekte uitgevoer word in terme van die aksie plan met strategise beplanning. Die gemeenskap in die Weskus sowel as al die rolspelers moet eienaarskap vat van hierdie implementering en beplannings fase so gou as moontlik. Die monitering en evaluering van die verskeie aksies sal moet geïnkorporeer word in die verskeie prestasie beoordeling sisteme van die Weskus owerhede. Dit sal verseker dat daar aanspreeklikheid en verantwoordelikheid geneem is vir die implementering van die strategie en dat toekomstige konflik vermy kan word.
WWWeeesssttt CCCoooaaasssttt PPPooovvveeerrrtttyyy AAAlll llleeevvviiiaaattt iiiooonnn SSStttrrraaattteeegggyyy
© 2006 Urban-Econ: Development Economists +27 21 447 3449 [email protected]
xxiv
Daarom is dit met die doel dat armoede vernietig moet word en mense se lewens toestand verbeter word dat hierdie strategie voorgestel is.
WWWeeesssttt CCCoooaaasssttt PPPooovvveeerrrtttyyy AAAlll llleeevvviiiaaattt iiiooonnn SSStttrrraaattteeegggyyy
© 2006 Urban-Econ: Development Economists +27 21 447 3449 [email protected]
i
Table of Contents EXECUTIVE SUMMARY BESTUUR OPSOMMING CHAPTER ONE: INTRODUCTION 1.1 BACKGROUND 1-1 1.2 PURPOSE OF THE PROJECT 1-1 1.3 METHODOLOGY 1-2 1.4 STRUCTURE OF THE DOCUMENT 1-2 CHAPTER TWO: POLICY FRAMEWORK 2.1 INTRODUCTION 2-1 2.2 LINKAGES BETWEEN POLICIES 2-2 2.3 SOCIAL WELFARE IN THE WESTERN CAPE 2-10 2.4 CONCLUSION 2-11 CHAPTER THREE: POVERTY MODEL 3.1 INTRODUCTION 3-1 3.2 DEFINITIONS OF POVERTY 3-1 3.3 A MODEL FOR POVERTY 3-1 3.3.1 Monetary Indicators of Poverty 3-1 3.3.2 Non-Monetary Indicators of Poverty 3-2 3.3.3 Estimating a Poverty 3-3 3.4 POVERTY CRITERIA 3-3 3.4.1 Sustainability and Poverty Alleviation 3-4 3.4.2 Criteria for a sustainable Community 3-4 3.5 CONCLUSION 3-14 CHAPTER FOUR: SOCIO-ECONOMIC ANALYSIS 4.1 INTRODUCTION 4-1 4.2 ECONOMIC PROFILE OF THE WESTERN CAPE 4-1 4.2.1 Western Cape in National Context 4-1 4.2.2 The Internal Structure of the Western Cape Economy 4-3 4.2.3 Employment and Salaries 4-4 4.3 WEST COAST DISTRICT ECONOMIC PROFILE 4-4 4.3.1 GVA Contribution 4-4 4.3.2 Economic Growth 4-6 4.3.3 Sectoral Employment 4-7 4.3.4 West Coast Socio-Economic Profile 4-9
WWWeeesssttt CCCoooaaasssttt PPPooovvveeerrrtttyyy AAAlll llleeevvviiiaaattt iiiooonnn SSStttrrraaattteeegggyyy
© 2006 Urban-Econ: Development Economists +27 21 447 3449 [email protected]
ii
4.3.5 Household Income 4-13 4.4 CONCLUSION 4-13 CHAPTER FIVE: POVERTY PROFILE 5.1 INTRODUCTION 5-1 5.2 WEST COAST REGION 5-1 5.2.1 Poverty Criteria 5-1 5.3 MATZIKAMA LOCAL MUNICIPALITY 5-16 5.3.1 Poverty Criteria 5-16 5.4 CEDERBERG LOCAL MUNICIPALITY 5-27 5.4.1 Poverty Criteria 5-27 5.5 BERGRIVIER LOCAL MUNICIPALITY 5-38 5.5.1 Poverty Criteria 5-38 5.6 SALDANHA BAY LOCAL MUNICIPALITY 5-49 5.6.1 Poverty Criteria 5-49 5.7 SWARTLAND LOCAL MUNICIPALITY 5-62 5.7.1 Poverty Criteria 5-62 5.8 DISTRICT MANAGEMENT AREA 5-74 5.8.1 Poverty Criteria 5-74 5.9 CONCLUSION 5-82 CHAPTER SIX: MEASURING THE EXTENT OF POVERTY IN THE WEST COAST DISTRICT MUNICIPALITY 6.1 INTRODUCTION 6-1 6.2 CRITERIA & RATING 6-1 6.3 POVERTY MATRIX 6-15 6.4 POVERTY MAP OF WEST COAST 6-20 6.5 SYNTHESIS 6-23 CHAPTER SEVEN: STRATEGIC PLAN 7.1 INTRODUCTION 7-1 7.2 STRATEGIC THRUSTS 7-1 7.3 POTENTIAL PROJECTS 7-2 7.4 PROJECT EVALUATION 7.38 7.5 PRIORITISATION CRITERIA 7-39 7.6 RECOMMENDATION 7-50 CHAPTER EIGHT: IMPLEMENTATION AND ACTION PLAN 8.1 INTRODUCTION 8-1 8.2 IMPLEMENTATION ACTION PLAN 8-1 8.3 PRIORITISED 8-3 8.2.1 Thrust One: Education 8-4 8.2.2 Thrust Two: Health 8-6 8.2.3 Thrust Three: Sport and Recreation 8-8 8.2.4 Thrust Four: Local Economic Development 8-11 8.2.5 Thrust Five: Safety 8-15 8.2.6 Thrust Six: Social Development 8-17 8.2.7 Thrust Seven: Financial and Government Services 8-20 8.2.8 Thrust Eight: Communication 8-23
WWWeeesssttt CCCoooaaasssttt PPPooovvveeerrrtttyyy AAAlll llleeevvviiiaaattt iiiooonnn SSStttrrraaattteeegggyyy
© 2006 Urban-Econ: Development Economists +27 21 447 3449 [email protected]
iii
8.2.9 Thrust Nine: Land Reform 8-27 8.3.10 Thrust Ten: Transport 8-30 8.3.11 Thrust Eleven: Basic Services 8-33 8.3.12 Thrust Twelve: Housing 8-36 8.3.13 Thrust Thirteen: ENVIRONMENT 8-39 8.4 MINI BUSINESS PLANS 8-42 8.5 WAY FORWARD 8-48 LIST OF REFERENCES ANNEXURE A : MAP ILLUSTRATING DMA SPATIALLY ANNEXURE B : POVERTY MATRIX ANNEXURE C : MAPPED POVERTY THRUSTS ANNEXURE D : EXISTING AND POTENTIAL POVERTY PROGRAMMES &
PROJECTS ANNEXURE E : POVERTY PROJECTS IDENTIFIED
WWWeeesssttt CCCoooaaasssttt PPPooovvveeerrrtttyyy AAAlll llleeevvviiiaaattt iiiooonnn SSStttrrraaattteeegggyyy
© 2006 Urban-Econ: Development Economists +27 21 447 3449 [email protected]
iv
MAPS, TABLES AND FIGURES MAPS 6.1 POVERTY POCKETS MAP IN WEST COAST REGION TABLES 3.1 POVERTY CRITERIA 4.1 INTER-PROVINCIAL COMPARISON WITH SELECTED INDICATORS 4.2 WEST COAST SECTORAL DISTRIBUTION (2004) 4.3 WEST COAST EMPLOYMENT DISTRIBUTION (2004) 4.4 WEST COAST OCCUPATION PER SKILL CATEGORY (2001 & 1999) 4.5 PERCENTAGE OF SKILLS PER AREA 4.6 WCDM ANNUAL HOUSEHOLD INCOME 5.1 POLICE STATIONS AND NEIGHBOURHOOD WATCHES IN THE WEST
COAST REGION 5.2 HOUSEHOLD BUDGET FOR MATZIKAMA LOCAL MUNICIPALITY, 2006 5.3 AVERAGE HOUSEHOLD EXPENDITURE FOR MATZIKAMA LOCAL
MUNICIPALITY, 2006 5.4 ACCESS TO GRANTS FOR MATZIKAMA LOCAL MUNICIPALITY, 2006 5.5 ACCESS TO TELEPHONES FOR MATZIKAMA LOCAL MUNICIPALITY,
2006 5.6 ACCESS TO WATER FOR MATZIKAMA LOCAL MUNICIPALITY, 2006 5.7 ACCESS TO SANITATION FOR MATZIKAMA LOCAL MUNICIPALITY,
2006 5.8 HOUSE BUDGET FOR CEDERBERG LOCAL MUNICIPALITY, 2006 5.9 AVERAGE HOUSEHOLD EXPENDITURE FOR CEDERBERG LOCAL
MUNICIPALITY, 2006 5.10 ACCESS TO GRANTS FOR CEDERBERG LOCAL MUNICIPALITY, 2006 5.11 ACCESS TO TELEPHONE FOR CEDERBERG LOCAL MUNICIPALITY,
2006 5.12 ACCESS TO WATER IN CEDERBERG LOCAL MUNICIPALITY, 2006 5.13 ACCESS TO SANITATION IN CEDERBERG LOCAL MUNICIPALITY,
2006 5.14 HOUSEHOLD BUDGET FOR BERGRIVIER LOCAL MUNICIPALITY, 20065.15 AVERAGE HOUSEHOLD EXPENDITURE FOR CEDERBERG LOCAL
MUNICIPALITY, 2006 5.16 ACCESS TO GRANTS IN BERGRIVIER LOCAL MUNICIPALITY 5.17 ACCESS TO TELEPHONES FOR BERGTIVIER LOCAL MUNICIPALITY 5.18 ACCESS TO WATER FOR BERGRIVIER LOCAL MUNICIPALITY 5.19 ACCESS TO SANITATION FOR BERGRIVIER LOCAL MUNICIPALITY 5.20 LEVEL OF EDUCATION OF SALDANHA BAY LOCAL MUNICIPALITY 5.21 ACCESS TO EDUCATIONAL FACILITIES FOR SALDANHA BAY LOCAL
MUNICIPALITY 5.22 MEDICAL FACILITIES FOR SALDANHA BAY LOCAL MUNICIPALITY 5.23 HOUSEHOLD BUDGET FOR SALDANHA BAY LOCAL MUNICIPALITY 5.24 AVERAGE HOUSEHOLD EXPENDITURE FOR SALDANHA BAY LOCAL
MUNICIPALITY 5.25 ACCESS TO TELEPHONES FOR SALDANHA BAY LOCAL
WWWeeesssttt CCCoooaaasssttt PPPooovvveeerrrtttyyy AAAlll llleeevvviiiaaattt iiiooonnn SSStttrrraaattteeegggyyy
© 2006 Urban-Econ: Development Economists +27 21 447 3449 [email protected]
v
MUNICIPALITY 5.26 MODE OF TRANSPORT FOR SALDANHA BAY LOCAL MUNICIPALITY 5.27 ACCESS TO WATER IN SALDANHA BAY LOCAL MUNICIPALITY 5.28 ACCESS TO SANITATION IN SALDANHA BAY LOCAL MUNICIPALITY 5.29 EDUCATIONAL FACILITIES FOR SALDANHA BAY LOCAL
MUNICIPALITY 5.30 MEDICAL FACILITIES FOR SALDANAH BAY MUNICIPALITY 5.31 HOUSEHOLD BUDGET FOR SWARTLAND LOCAL MUNICIPALITY 5.32 AVERAGE HOUSEHOLD EXPENDITURE FOR SWARTLAND LOCAL
MUNICIPALITY 5.33 ACCESS TO TELEPHONES FOR SWARTLAND LOCAL MUNICIPALITY 5.34 MODE OF TRANSPORT FOR SWARTLAND LOCAL MUNICIPALITY 5.35 ACCESS TO WATER IN THE SWARTLAND LOCAL MUNICIPALITY 5.36 ACCESS TO SANITATION IN THE SWARTLAND LOCAL MUNICIPALITY 5.37 EDUCATIONAL FACILITIES FOR SWARTLAND LOCAL MUNICIPALITY 5.38 MEDICAL FACILITIES FOR SWARTLAND LOCAL MUNICIPALITY 5.39 HOUSEHOLD BUDGET FOR DMA 5.40 AVERAGE HOUSHOLD EXPENDITURE IN THE DMA 5.41 ACCESS TO TELEPHONES 5.42 MODE OF TRANSPORT IN DMA 5.43 ACCESS TO WATER IN THE DMA 5.44 ACCESS TO SANITATION IN DMA 7.1 EDUCATION 7.2 HEALTH 7.3 SPORTS AND RECREATION 7.4 LOCAL ECONOMIC DEVELOPMENT 7.5 SAFETY 7.6 SOCIAL DEVELOPMENTS 7.7 FINANCIAL AND GOVERNMENT SERVICES 7.8 COMMUNICATION 7.9 LAND REFORM 7.10 TRANSPORT 7.11 BASIC SERVICES 7.12 HOUSING 7.13 ENVIRONMENT 7.14 PRIORITISATION TABLE FIGURES 3.1 TRIPLE BOTTOM LINE 4.1 WESTERN CAPE ECONOMY IN SA CONTEXT 4.2 SECTORAL CONTRIBUTION TO THE NATIONAL GGP 4.3 WESTERN CAPE EMPLOYMENT AND SALARIES COMPARISON 4.4 WEST COAST SECTORAL CONTRIBUTIONS (2004) 4.5 GVA CONTRIBUTION OF WCDM PER MUNICIPALITY (2004) 4.6 WEST COAST ECONOMIC GROWTH RATE 4.7 SECTORAL EMPLOYMENT DISTRIBUTIONS (2001 & 2004) 4.8 WEST COAST POPULATION DISTRIBUTION (2004) 4.9 EMPLOYMENT STATUS PER AREA (2001)
WWWeeesssttt CCCoooaaasssttt PPPooovvveeerrrtttyyy AAAlll llleeevvviiiaaattt iiiooonnn SSStttrrraaattteeegggyyy
© 2006 Urban-Econ: Development Economists +27 21 447 3449 [email protected]
vi
4.10 WEST COAST GENDER AND AGE DISTRIBUTION 5.1 LEVEL OF EDUCATION FOR WEST COAST REGION (2001) 5.2 EMPLOYMENT STATUS FOR WEST COAST REGION 5.3 ANNUAL HOUSEHOLD INCOME FOR WEST COAST REGION (2001) 5.4 DISTRIBUTION OF GRANTS IN THE WEST COAST REGION 5.5 ACCESS TO TELEPHONES FOR THE WEST COAST REGION 5.6 MODES OF TRANSPORT USED IN THE WEST COAST REGION 5.7 TYPE OF ENERGY FOR THE WEST COAST REGION 5.8 ACCESS TO SANITATION FOR THE WEST COAST REGION 5.9 DWELLING TYPE (2001) FOR THE WEST COAST REGION 5.10 TENURE STATUS FOR THE WEST COAST REGION (2001) 5.11 LEVEL OF EDUCATION FOR MATZIKAMA LOCAL MUNICIPALITY 5.12 EMPLOYMENT STATUS FOR MATZIKAMA LOCAL MUNICIPALITY 5.13 DISTRIBUTION OF GRANTS IN THE MATZIKAMA LOCAL
MUNICIPALITY 5.14 IDENTITY DOCUMENTS FOR THE MATZIKAMA LOCAL MUNICIPALITY 5.15 NUTRITIONAL SERVICES IN THE MATZIKAMA LOCAL MUNICIPALITY 5.16 AFFORDABILITY OF SERVICES IN THE MATZIKAMA LOCAL
MUNICIPALITY 5.17 ACCESS TO ELECTRICITY IN THE MATZIKAMA LOCAL MUNICIPALITY 5.18 TYPE OF DWELLING IN THE MATZIKAMA LOCAL MUNICIPALITY 5.19 TENURE FOR MATZIKAMA LOCAL MUNICIPALITY 5.20 LEVEL OF EDUCATION FOR CEDERBERG LOCAL MUNICIPALITY
(2001) 5.21 EMPLOYMENT STATUS FOR CEDERBERG LOCAL MUNICIPALITY
(2001) 5.22 DISTRIBUTION OF GRANTS IN THE CEDERBERG LOCAL
MUNICIPALITY 5.23 AVERAGE IDENTITY DOCUMENTS FOR CEDERBERG LOCAL
MUNICIPALITY 5.24 ACCESS TO NUTRITIONAL SERVICES FOR CEDERBERG LOCAL
MUNICIPALITY 5.25 AFFORDABILITY OF SERVICES IN THE CEDERBERG LOCAL
MUNICIPALITY 5.26 ACCESS TO ELECTRICITY IN THE CEDERBERG LOCAL
MUNICIPALITY 5.27 TYPE OF DWELLING IN CEDERBERG LOCAL MUNICIPALITY 5.28 TENURE FOR CEDERBERG LOCAL MUNICIPALITY 5.29 LEVEL OF EDUCATION FOR BERGRIVIER LOCAL MUNICIPALITY
(2001) 5.30 EMPLOYMENT STATUS FOR BERGRIVIER LOCAL MUNICIPALITY
(2001) 5.31 DISTRIBUTION OF GRANTS IN THE BERGRIVIER LOCAL
MUNICIPALITY 5.32 AVERAGE IDENTITY DOCUMENTS FOR BERGRIVIER LOCAL
MUNICIPALITY 5.34 NUTRITIONAL SERVICES IN BERGRIVIER 5.35 AFFORDABILITY OF SERVICES IN THE BERGRIVIER LOCAL
WWWeeesssttt CCCoooaaasssttt PPPooovvveeerrrtttyyy AAAlll llleeevvviiiaaattt iiiooonnn SSStttrrraaattteeegggyyy
© 2006 Urban-Econ: Development Economists +27 21 447 3449 [email protected]
vii
MUNICIPALITY 5.36 DWELLING TYPE FOR BERGRIVIER LOCAL MUNICIPALITY (2001) 5.37 HOUSEHOLD TENURE STATUS FOR BERGRIVIER LOCAL
MUNICIPALITY (2001) 5.38 AVERAGE HOUSEHOLD EDUCATION IN THE SALDANHA BAY LOCAL
MUNICIPALITY 5.39 SALDANHA BAY LOCAL MUNICIPALITY EMPLOYMENT STATUS 5.40 GRANT DISTRIBUTION IN SALDANHA BAY LOCAL MUNICIPALITY 5.41 AFFORDABILITY OF GOODS AND SERVICES 5.42 ACCESS TO COMPUTERS TO SALDANHA BAY LOCAL MUNICIPALITY 5.43 ACCESS TO ELECTRICITY IN SALDNHA BAY LOCAL MUNICIPALITY 5.44 TYPE OF DWELLING IN SALDANHA BAY LOCAL MUNICIPALITY 5.45 TENURE FOR SALDANHA BAY LOCAL MUNICIPALITY 5.46 LEVEL OF EDUCATION OF SWARTLAND LOCAL MUNICIPALITY 5.47 SWARTLAND LOCAL MUNICIPALITY EMPLOYMENT STATUS 5.48 GRANT DISTRIBUTION IN THE SWARTLAND LOCAL MUNICIPALITY 5.49 AFFORDABILITY OF GOODS AND SERVICES FOR SWARTLAND
LOCAL MUNICIPALITY 5.50 ACCESS TO COMPUTERS IN THE SWARTLAND LOCAL
MUNICIPALITY 5.51 ACCESS TO ELECTRICITY IN THE SWARTLAND LOCAL
MUNICIPALITY 5.52 TYPE OF DWELLING IN SWARTLAND LOCAL MUNICIPALITY 5.53 TENURE FOR THE SWARTLAND LOCAL MUNICIPALITY 5.54 LEVEL OF EDUCATION OF DMA 5.55 DMA EMPLOYMENT STATUS 5.56 GRANT DISTRIBUTION IN TH DMA 5.57 AFFORDABILITY OF GOODS AND SERVICES IN THE DMA 5.58 ACCESS TO COMPUTERS IN TH DMA 5.59 ACCESS TO ELECTRICITY IN THE DMA 7.1 INTEGRATED DEVELOPMENT APPROACH 7.2 PRIORITISATION CRITERIA 7.3 ANCHOR PROJECTS