portfolio of teaching materials - university of...
TRANSCRIPT
Portfolio of Teaching Materials Sam M. Young
All materials are from Principles of Macroeconomics, taught during Summer 2015
Contents:
1. Syllabus
2. Final exam
3. Problem set (for inflation chapter)
4. Lecture slides (for inflation chapter)
Economics 3 – Principles of Macroeconomics,
Summer Session II 2015 TuTh, 8:00-10:50 am, Warren Lecture Hall 2113
Discussion: Wed, 9:00-9:50 am, Warren Lecture Hall 2113
Instructor: Sam Young ([email protected])
Office Hours: Thursdays, 12-2 pm, Sequoyah Hall 244
Class Website: https://ted.ucsd.edu
TA: Boris Wong ([email protected])
Office Hours: Wednesdays, 10 am – 12 pm, Sequoyah Hall 232
COURSE DESCRIPTION:
Introduction to macroeconomics: output, unemployment, inflation, business cycles, monetary and
fiscal policy, and international trade.
COURSE GOALS:
By the end of this course, you should be able to:
• Define GDP and its components
• Explain how GDP, the Consumer Price Index, and the unemployment rate are computed + be
able to compute simple versions by hand
• Use the CPI to compare price levels at two points in time
• Define the different types of unemployment, and the “natural rate of unemployment”
• Describe the monetary policy tools available to central banks, like the Federal Reserve, to
affect the money supply and interest rates
• Analyze how changes to fiscal or monetary policy affect output, interest rates, and price
levels
• Explain the difference between real and nominal GDP, interest rates, and exchange rates
• Explain and compute the “multiplier effect”
PREREQUISITES:
ECON 1 – Principles of Microeconomics
TEXTBOOK:
Principles of Economics ECON 1/2/3, 5th edition, by Robert H. Frank and Ben S. Bernanke
A custom edition is available at the UCSD Bookstore. All chapter, page, and problem numbers will
refer to this version of the textbook.
GRADING AND EXAMS:
Clicker questions (5%)
Homework (10%)
Midterm Exam (35%) Thursday, August 20
Final Exam, cumulative (50%) Saturday, September 5, 8:00-10:59am, location TBA
If you have a known conflict with either exam date, please notify the instructor or TA as soon as
possible, making sure to do so before the exam.
CLASS PARTICIPATION:
This course will use clickers to help make classes more engaging. The i-clicker 2 model is available
at the UCSD Bookstore.1 You will need to register your remote on Ted before using in class. From
the class Ted page, go to Tools > i-clicker Student Registration.
Clicker questions will count toward your grade beginning in week 2 (Tuesday, August 11). For each
question you answer, you will receive ¾ of a point for participating, and ¼ of a point for
correctness.
HOMEWORK:
Homework will be posted and submitted through Ted. Homework will be due each Friday night,
with the next homework being released the same night.
ADMINISTRATIVE ISSUES:
1. I am told the ECON 1 pre-req is enforced. TritonLink may even let you register initially, but I am
told you will later be dropped if you have not previously completed ECON 1.
2. The add deadline for Summer Session II is Friday, August 7. After this deadline, you may still be
able to add this course through a petition with the Department of Economics; however, this
typically requires an extraordinary circumstance. Students with extraordinary circumstances
may submit a completed petition, with a written explanation (and any supporting
documentation) to the undergraduate advising office in Sequoyah Hall 245.
3. Students with a documented disability should register immediately with the Office for Students
with Disabilities (OSD) to obtain a letter of Authorization for Accommodation. After doing so,
please notify either the instructor or TA as early as possible so we can make suitable
accommodations.
4. The university takes academic integrity very seriously! Students found guilty of academic
dishonesty will earn a failing grade for the course, and may also face outside discipline.
READING:
Topic Chapter
Spending, Income, and GDP 15
Inflation and the Price Level 16
Wages and Unemployment 17
Economic Growth 18
Saving, Capital Formation, and Financial Markets 19
Money, Prices, and the Financial System 20
Short-Term Economic Fluctuations 21
Spending, Output, and Fiscal Policy 22 & Appendix
Monetary Policy and the Federal Reserve 23
Exchange Rates, International Trade, and Capital Flows 26
1 If you already have the i-clicker or i-clicker(+) model, these should work fine.
Econ 3 Name ________________________________________ Summer II 2015 Young Student ID ____________________________ Seat number _________
Final Exam – Version A
Your exam should have 7 short answer questions and 15 multiple choice questions. No notes or books during this exam. You may use a calculator if it is not a graphing calculator and not your phone. Problems with computations must show work to receive credit (unless multiple choice). If you need to use the restroom, please raise your hand to request permission before leaving the room. You must leave your phone while using the restroom. ------------------------------------------------------------------------------------------------------------ Do not mark, for graders only
Part I Question 1 _____________ / 23
Question 2 _____________ / 28 Question 3 _____________ / 12 Question 4 _____________ / 17 Question 5 _____________ / 14 Question 6 _____________ / 12 Question 7 _____________ / 15
Part II Multiple Choice ________ / 60 TOTAL _________________________ / 181

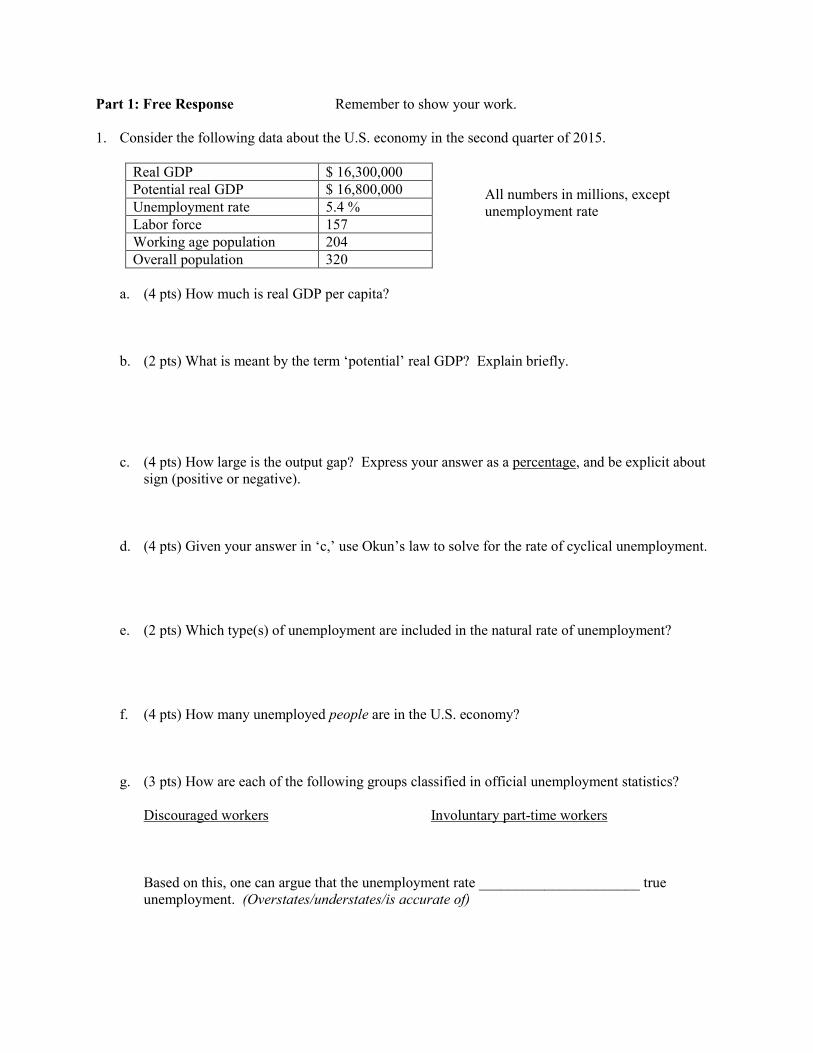
Part 1: Free Response Remember to show your work. 1. Consider the following data about the U.S. economy in the second quarter of 2015.
Real GDP $ 16,300,000
Potential real GDP $ 16,800,000
Unemployment rate 5.4 %
Labor force 157
Working age population 204
Overall population 320
a. (4 pts) How much is real GDP per capita?
b. (2 pts) What is meant by the term ‘potential’ real GDP? Explain briefly.
c. (4 pts) How large is the output gap? Express your answer as a percentage, and be explicit about sign (positive or negative).
d. (4 pts) Given your answer in ‘c,’ use Okun’s law to solve for the rate of cyclical unemployment.
e. (2 pts) Which type(s) of unemployment are included in the natural rate of unemployment?
f. (4 pts) How many unemployed people are in the U.S. economy?
g. (3 pts) How are each of the following groups classified in official unemployment statistics? Discouraged workers Involuntary part-time workers Based on this, one can argue that the unemployment rate ______________________ true unemployment. (Overstates/understates/is accurate of)
All numbers in millions, except unemployment rate
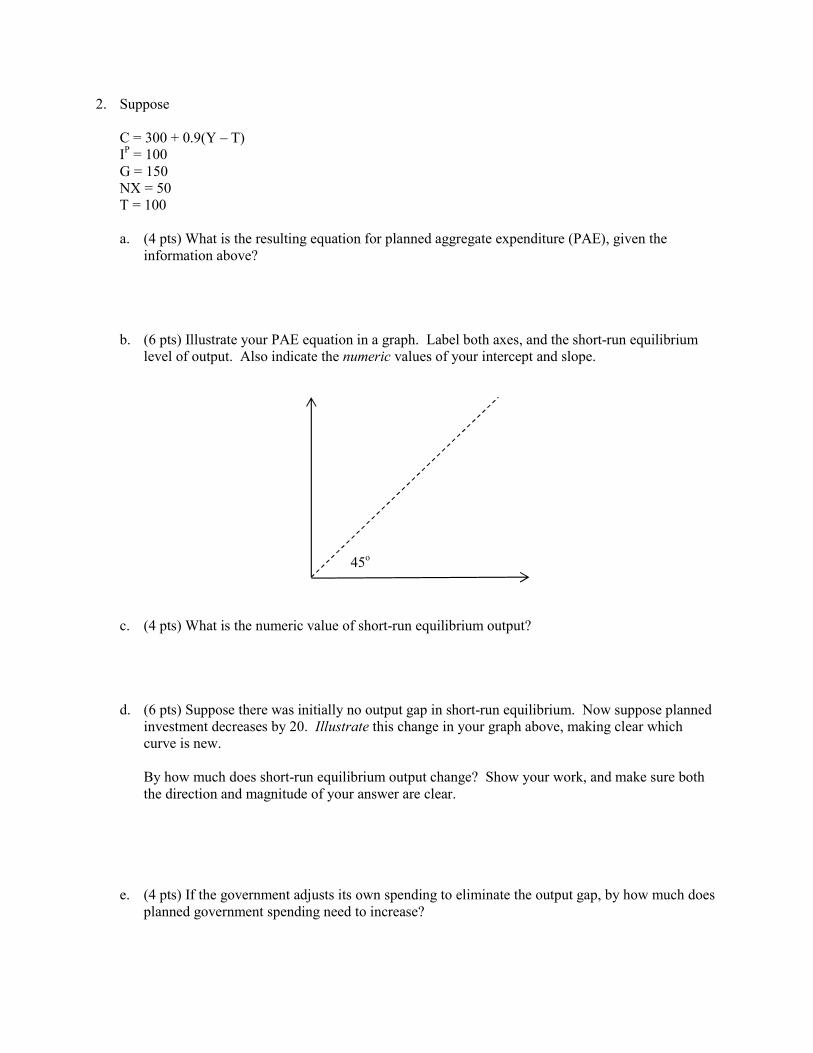
2. Suppose C = 300 + 0.9(Y – T) IP = 100 G = 150 NX = 50 T = 100
a. (4 pts) What is the resulting equation for planned aggregate expenditure (PAE), given the information above?
b. (6 pts) Illustrate your PAE equation in a graph. Label both axes, and the short-run equilibrium level of output. Also indicate the numeric values of your intercept and slope.
c. (4 pts) What is the numeric value of short-run equilibrium output?
d. (6 pts) Suppose there was initially no output gap in short-run equilibrium. Now suppose planned investment decreases by 20. Illustrate this change in your graph above, making clear which curve is new. By how much does short-run equilibrium output change? Show your work, and make sure both the direction and magnitude of your answer are clear.
e. (4 pts) If the government adjusts its own spending to eliminate the output gap, by how much does planned government spending need to increase?
45o
f. (4 pts) If the government uses tax cuts to eliminate the output gap, by how much do taxes need to decrease?
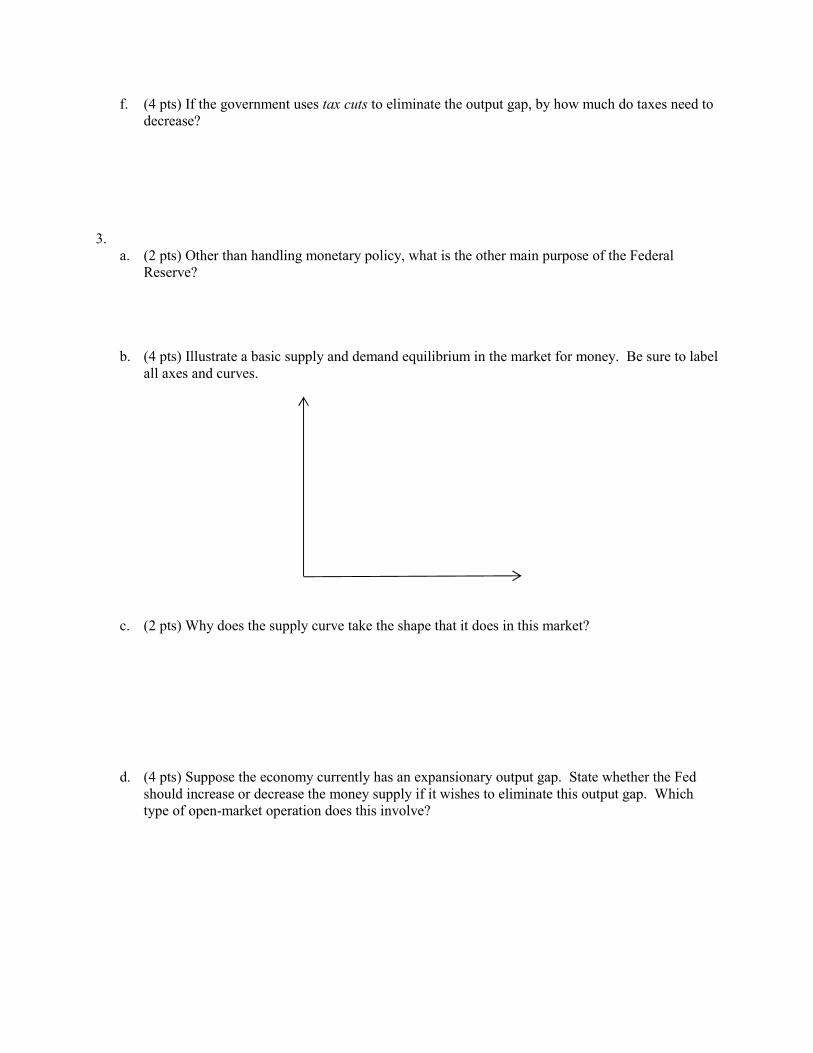
3. a. (2 pts) Other than handling monetary policy, what is the other main purpose of the Federal
Reserve?
b. (4 pts) Illustrate a basic supply and demand equilibrium in the market for money. Be sure to label all axes and curves.
c. (2 pts) Why does the supply curve take the shape that it does in this market?
d. (4 pts) Suppose the economy currently has an expansionary output gap. State whether the Fed should increase or decrease the money supply if it wishes to eliminate this output gap. Which type of open-market operation does this involve?
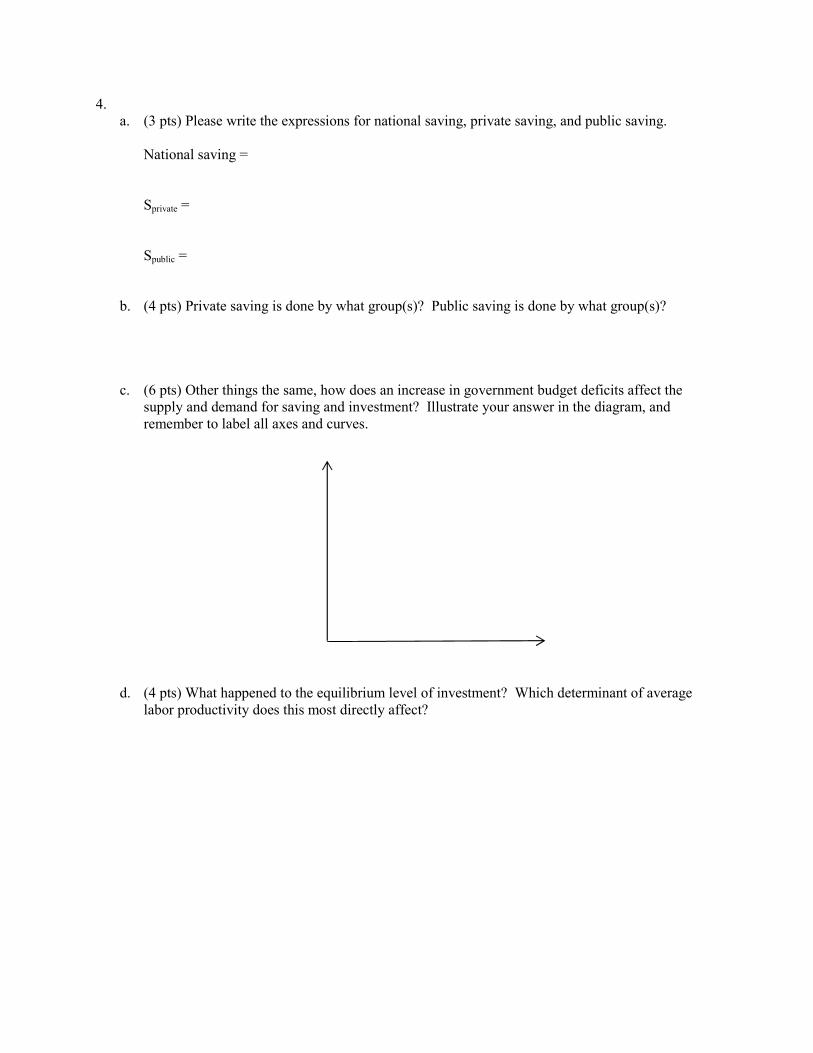
4. a. (3 pts) Please write the expressions for national saving, private saving, and public saving.
National saving = Sprivate = Spublic =
b. (4 pts) Private saving is done by what group(s)? Public saving is done by what group(s)?
c. (6 pts) Other things the same, how does an increase in government budget deficits affect the supply and demand for saving and investment? Illustrate your answer in the diagram, and remember to label all axes and curves.
d. (4 pts) What happened to the equilibrium level of investment? Which determinant of average labor productivity does this most directly affect?
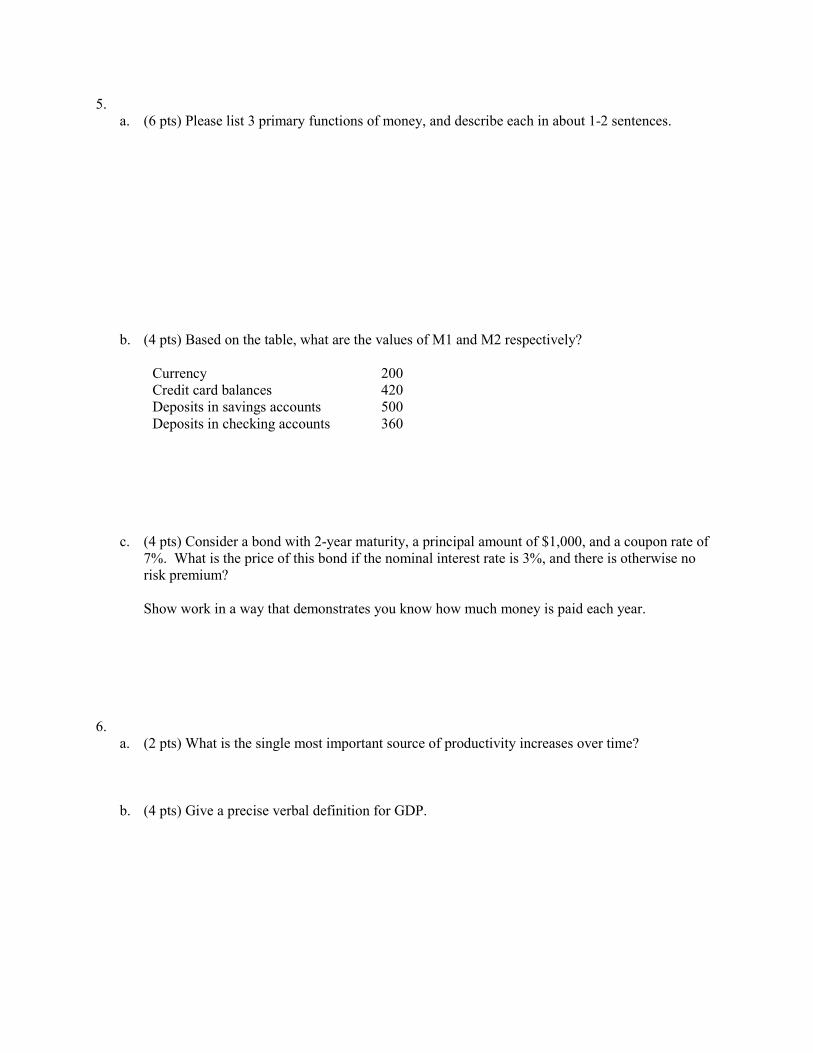
5. a. (6 pts) Please list 3 primary functions of money, and describe each in about 1-2 sentences.
b. (4 pts) Based on the table, what are the values of M1 and M2 respectively?
Currency 200 Credit card balances 420 Deposits in savings accounts 500 Deposits in checking accounts 360
c. (4 pts) Consider a bond with 2-year maturity, a principal amount of $1,000, and a coupon rate of 7%. What is the price of this bond if the nominal interest rate is 3%, and there is otherwise no risk premium? Show work in a way that demonstrates you know how much money is paid each year.
6.
a. (2 pts) What is the single most important source of productivity increases over time?
b. (4 pts) Give a precise verbal definition for GDP.
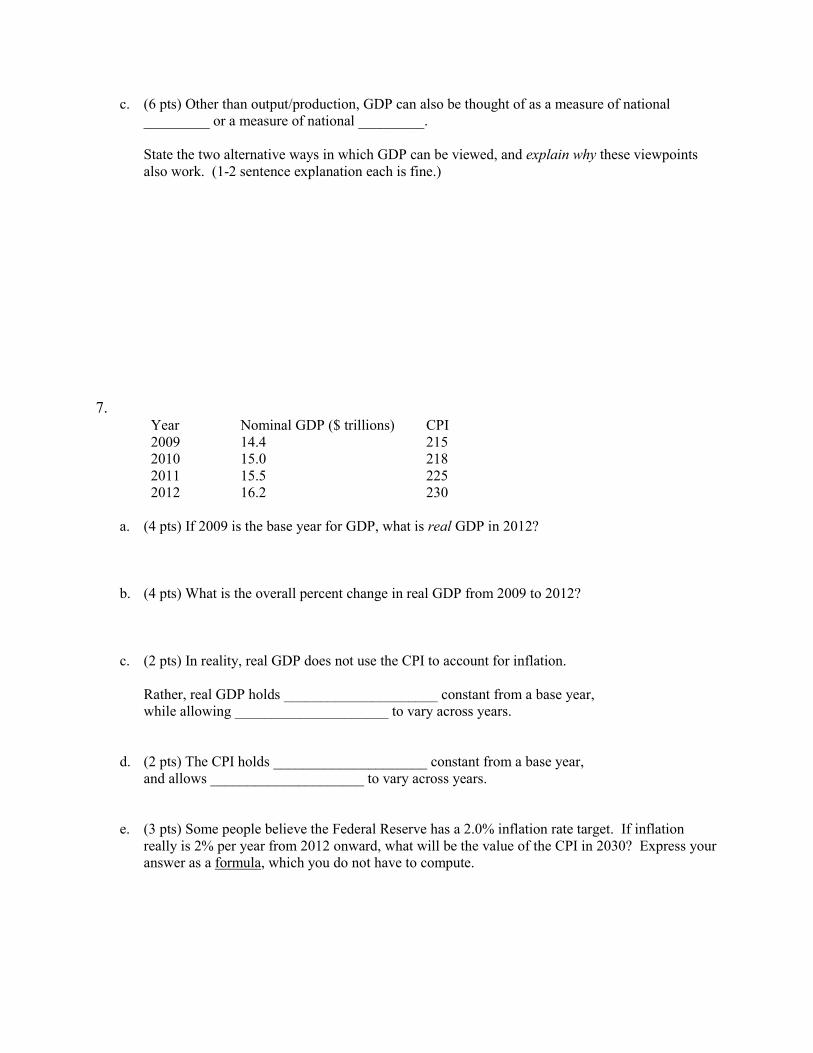
c. (6 pts) Other than output/production, GDP can also be thought of as a measure of national _________ or a measure of national _________. State the two alternative ways in which GDP can be viewed, and explain why these viewpoints also work. (1-2 sentence explanation each is fine.)
7.
Year Nominal GDP ($ trillions) CPI 2009 14.4 215 2010 15.0 218 2011 15.5 225 2012 16.2 230
a. (4 pts) If 2009 is the base year for GDP, what is real GDP in 2012?
b. (4 pts) What is the overall percent change in real GDP from 2009 to 2012?
c. (2 pts) In reality, real GDP does not use the CPI to account for inflation. Rather, real GDP holds _____________________ constant from a base year, while allowing _____________________ to vary across years.
d. (2 pts) The CPI holds _____________________ constant from a base year, and allows _____________________ to vary across years.
e. (3 pts) Some people believe the Federal Reserve has a 2.0% inflation rate target. If inflation really is 2% per year from 2012 onward, what will be the value of the CPI in 2030? Express your answer as a formula, which you do not have to compute.
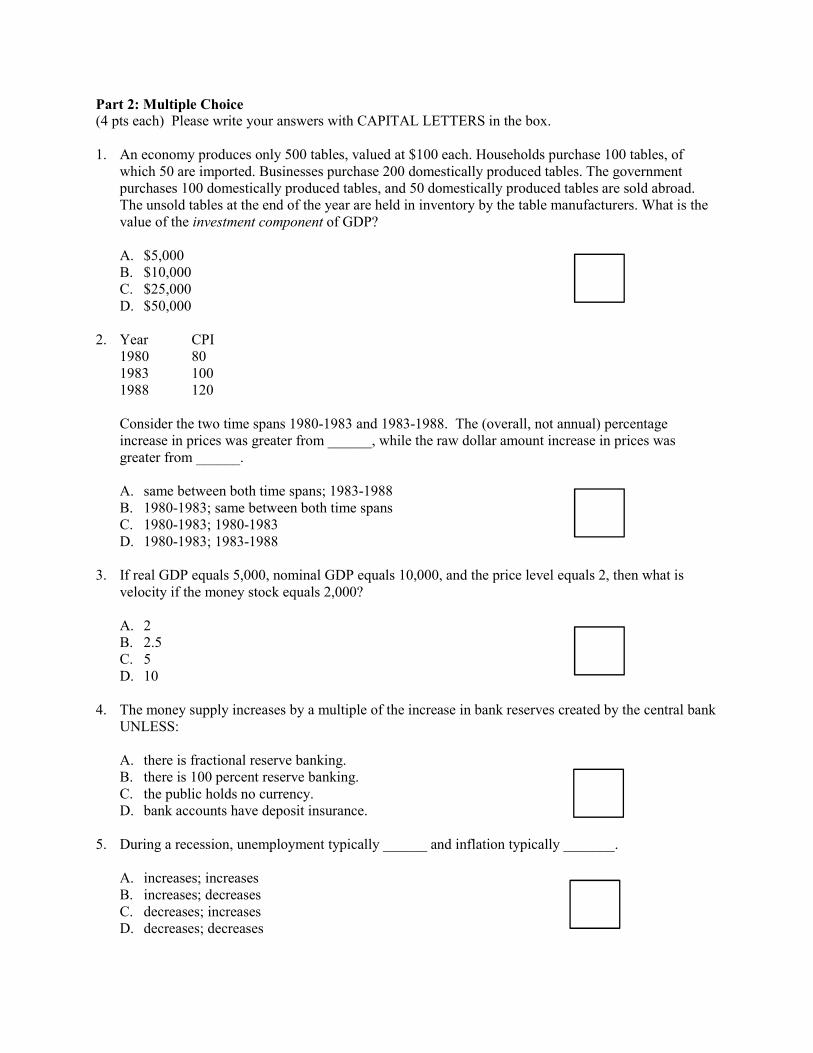
Part 2: Multiple Choice (4 pts each) Please write your answers with CAPITAL LETTERS in the box. 1. An economy produces only 500 tables, valued at $100 each. Households purchase 100 tables, of
which 50 are imported. Businesses purchase 200 domestically produced tables. The government purchases 100 domestically produced tables, and 50 domestically produced tables are sold abroad. The unsold tables at the end of the year are held in inventory by the table manufacturers. What is the value of the investment component of GDP?
A. $5,000 B. $10,000 C. $25,000 D. $50,000
2. Year CPI
1980 80 1983 100 1988 120
Consider the two time spans 1980-1983 and 1983-1988. The (overall, not annual) percentage increase in prices was greater from ______, while the raw dollar amount increase in prices was greater from ______.
A. same between both time spans; 1983-1988 B. 1980-1983; same between both time spans C. 1980-1983; 1980-1983 D. 1980-1983; 1983-1988
3. If real GDP equals 5,000, nominal GDP equals 10,000, and the price level equals 2, then what is
velocity if the money stock equals 2,000?
A. 2 B. 2.5 C. 5 D. 10
4. The money supply increases by a multiple of the increase in bank reserves created by the central bank
UNLESS:
A. there is fractional reserve banking. B. there is 100 percent reserve banking. C. the public holds no currency. D. bank accounts have deposit insurance.
5. During a recession, unemployment typically ______ and inflation typically _______.
A. increases; increases B. increases; decreases C. decreases; increases D. decreases; decreases
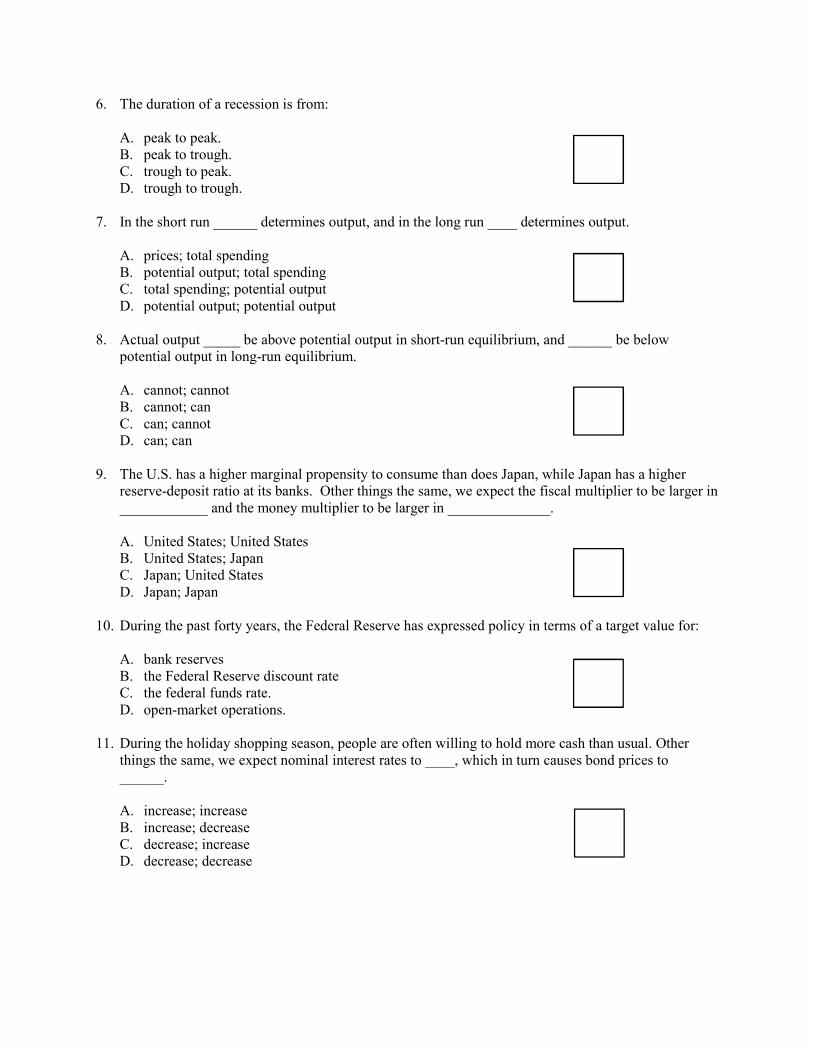
6. The duration of a recession is from:
A. peak to peak. B. peak to trough. C. trough to peak. D. trough to trough.
7. In the short run ______ determines output, and in the long run ____ determines output.
A. prices; total spending B. potential output; total spending C. total spending; potential output D. potential output; potential output
8. Actual output _____ be above potential output in short-run equilibrium, and ______ be below
potential output in long-run equilibrium.
A. cannot; cannot B. cannot; can C. can; cannot D. can; can
9. The U.S. has a higher marginal propensity to consume than does Japan, while Japan has a higher
reserve-deposit ratio at its banks. Other things the same, we expect the fiscal multiplier to be larger in ____________ and the money multiplier to be larger in ______________.
A. United States; United States B. United States; Japan C. Japan; United States D. Japan; Japan
10. During the past forty years, the Federal Reserve has expressed policy in terms of a target value for:
A. bank reserves B. the Federal Reserve discount rate C. the federal funds rate. D. open-market operations.
11. During the holiday shopping season, people are often willing to hold more cash than usual. Other
things the same, we expect nominal interest rates to ____, which in turn causes bond prices to ______.
A. increase; increase B. increase; decrease C. decrease; increase D. decrease; decrease
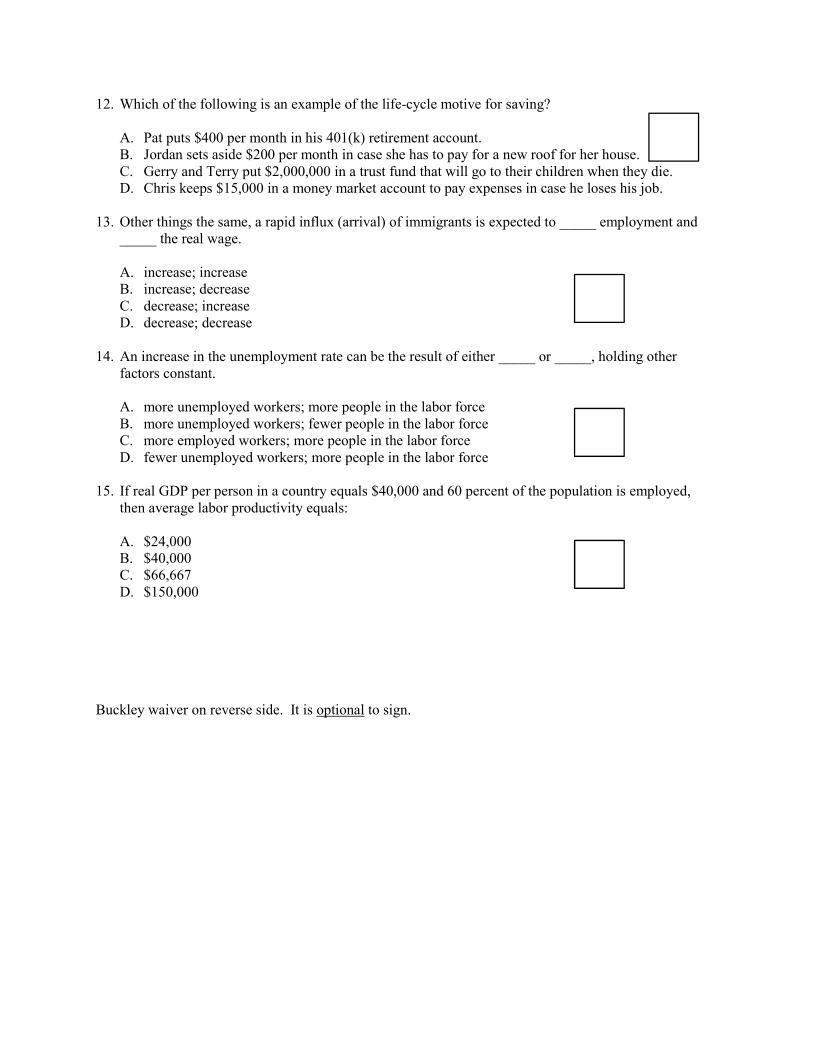
12. Which of the following is an example of the life-cycle motive for saving?
A. Pat puts $400 per month in his 401(k) retirement account. B. Jordan sets aside $200 per month in case she has to pay for a new roof for her house. C. Gerry and Terry put $2,000,000 in a trust fund that will go to their children when they die. D. Chris keeps $15,000 in a money market account to pay expenses in case he loses his job.
13. Other things the same, a rapid influx (arrival) of immigrants is expected to _____ employment and
_____ the real wage.
A. increase; increase B. increase; decrease C. decrease; increase D. decrease; decrease
14. An increase in the unemployment rate can be the result of either _____ or _____, holding other
factors constant.
A. more unemployed workers; more people in the labor force B. more unemployed workers; fewer people in the labor force C. more employed workers; more people in the labor force D. fewer unemployed workers; more people in the labor force
15. If real GDP per person in a country equals $40,000 and 60 percent of the population is employed,
then average labor productivity equals:
A. $24,000 B. $40,000 C. $66,667 D. $150,000
Buckley waiver on reverse side. It is optional to sign.
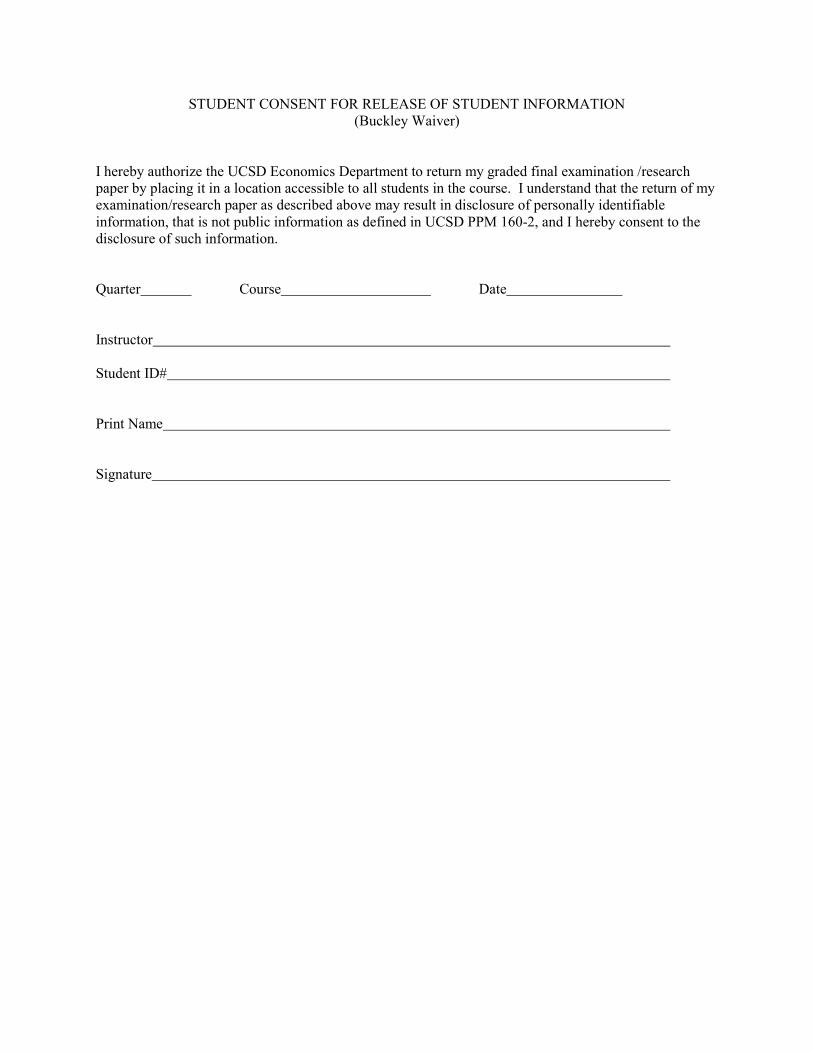
STUDENT CONSENT FOR RELEASE OF STUDENT INFORMATION (Buckley Waiver)
I hereby authorize the UCSD Economics Department to return my graded final examination /research paper by placing it in a location accessible to all students in the course. I understand that the return of my examination/research paper as described above may result in disclosure of personally identifiable information, that is not public information as defined in UCSD PPM 160-2, and I hereby consent to the disclosure of such information. Quarter Course Date Instructor Student ID# Print Name Signature
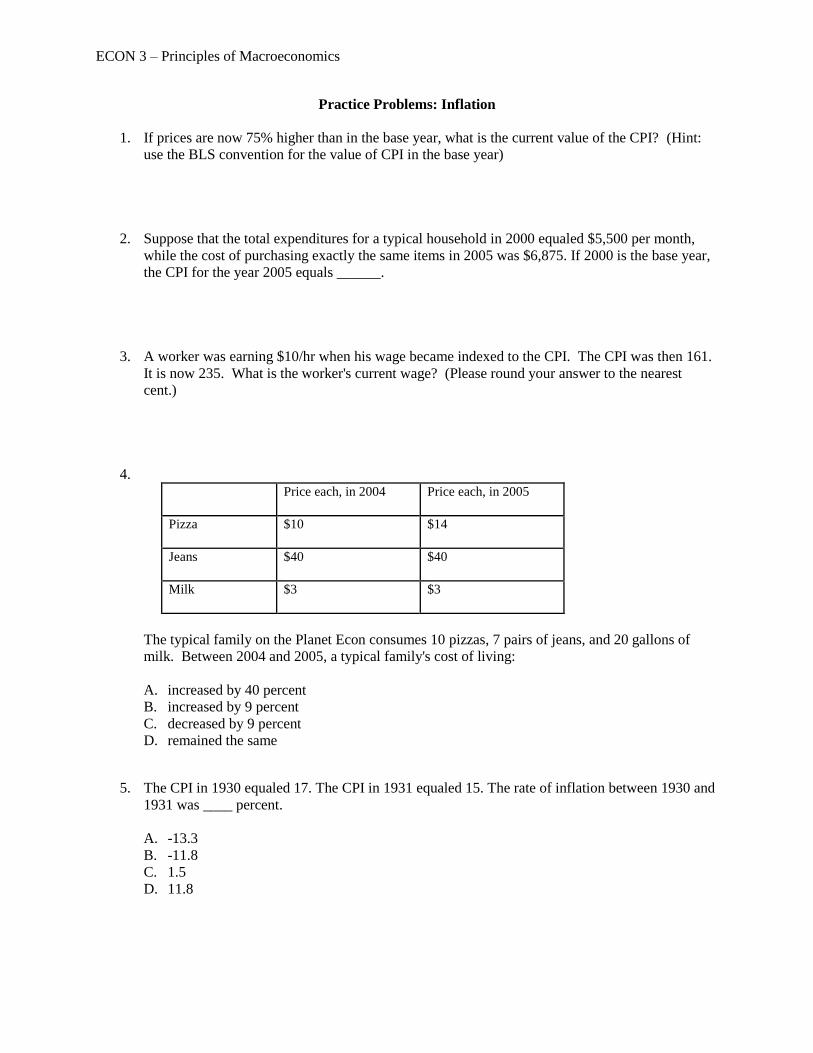
ECON 3 – Principles of Macroeconomics
Practice Problems: Inflation
1. If prices are now 75% higher than in the base year, what is the current value of the CPI? (Hint:
use the BLS convention for the value of CPI in the base year)
2. Suppose that the total expenditures for a typical household in 2000 equaled $5,500 per month,
while the cost of purchasing exactly the same items in 2005 was $6,875. If 2000 is the base year,
the CPI for the year 2005 equals ______.
3. A worker was earning $10/hr when his wage became indexed to the CPI. The CPI was then 161.
It is now 235. What is the worker's current wage? (Please round your answer to the nearest
cent.)
4.
Price each, in 2004 Price each, in 2005
Pizza $10 $14
Jeans $40 $40
Milk $3 $3
The typical family on the Planet Econ consumes 10 pizzas, 7 pairs of jeans, and 20 gallons of
milk. Between 2004 and 2005, a typical family's cost of living:
A. increased by 40 percent
B. increased by 9 percent
C. decreased by 9 percent
D. remained the same
5. The CPI in 1930 equaled 17. The CPI in 1931 equaled 15. The rate of inflation between 1930 and
1931 was ____ percent.
A. -13.3
B. -11.8
C. 1.5
D. 11.8
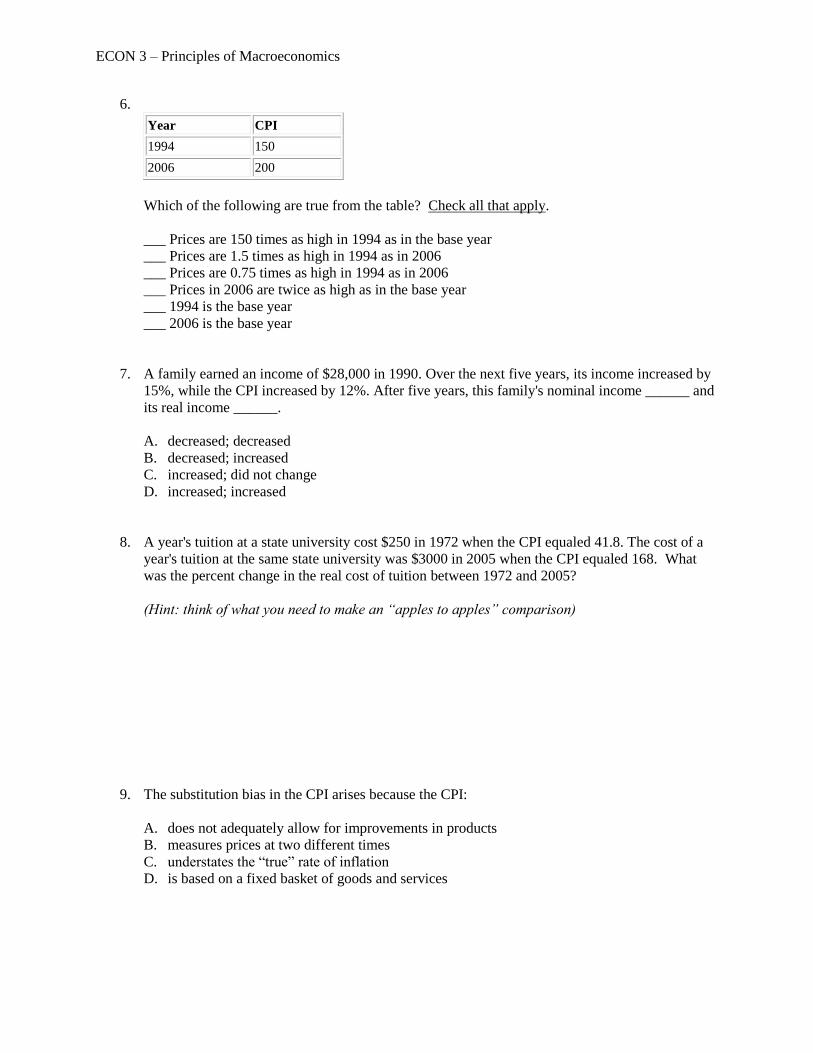
ECON 3 – Principles of Macroeconomics
6.
Year CPI
1994 150
2006 200
Which of the following are true from the table? Check all that apply.
___ Prices are 150 times as high in 1994 as in the base year
___ Prices are 1.5 times as high in 1994 as in 2006
___ Prices are 0.75 times as high in 1994 as in 2006
___ Prices in 2006 are twice as high as in the base year
___ 1994 is the base year
___ 2006 is the base year
7. A family earned an income of $28,000 in 1990. Over the next five years, its income increased by
15%, while the CPI increased by 12%. After five years, this family's nominal income ______ and
its real income ______.
A. decreased; decreased
B. decreased; increased
C. increased; did not change
D. increased; increased
8. A year's tuition at a state university cost $250 in 1972 when the CPI equaled 41.8. The cost of a
year's tuition at the same state university was $3000 in 2005 when the CPI equaled 168. What
was the percent change in the real cost of tuition between 1972 and 2005?
(Hint: think of what you need to make an “apples to apples” comparison)
9. The substitution bias in the CPI arises because the CPI:
A. does not adequately allow for improvements in products
B. measures prices at two different times
C. understates the “true” rate of inflation
D. is based on a fixed basket of goods and services
ECON 3 – Principles of Macroeconomics
10. Product improvements make it difficult for the statisticians who construct the CPI to distinguish
between ____ changes and ____ changes.
A. price; quality
B. quantity; price
C. quantity; quality
D. income; price
11. In addition to the main CPI, there is also a “core” CPI basket. What two major items are
excluded when computing core inflation? Why?
12. If a borrower and lender agree to an interest rate on a loan when inflation is expected to be 7%
and inflation turns out to be 10% over the life of the loan, then the borrower _____ and the lender
______.
A. gains; gains
B. gains; loses
C. is not affected; gains
D. loses; gains
13. If the real interest rate is 3% and the inflation rate is 7%, then the nominal interest rate equals:
A. 3%
B. 4%
C. 7%
D. 10%
14. In 1975, the inflation rate was 9% and the interest rate for a 10-year U.S. Treasury bond was 8%.
In 2009, the inflation rate was 0% and the interest rate for a 10-year Treasury bond was 3%.
Other things the same, in which year would you prefer to own a Treasury bond? Explain why.
ECON 3 – Principles of Macroeconomics
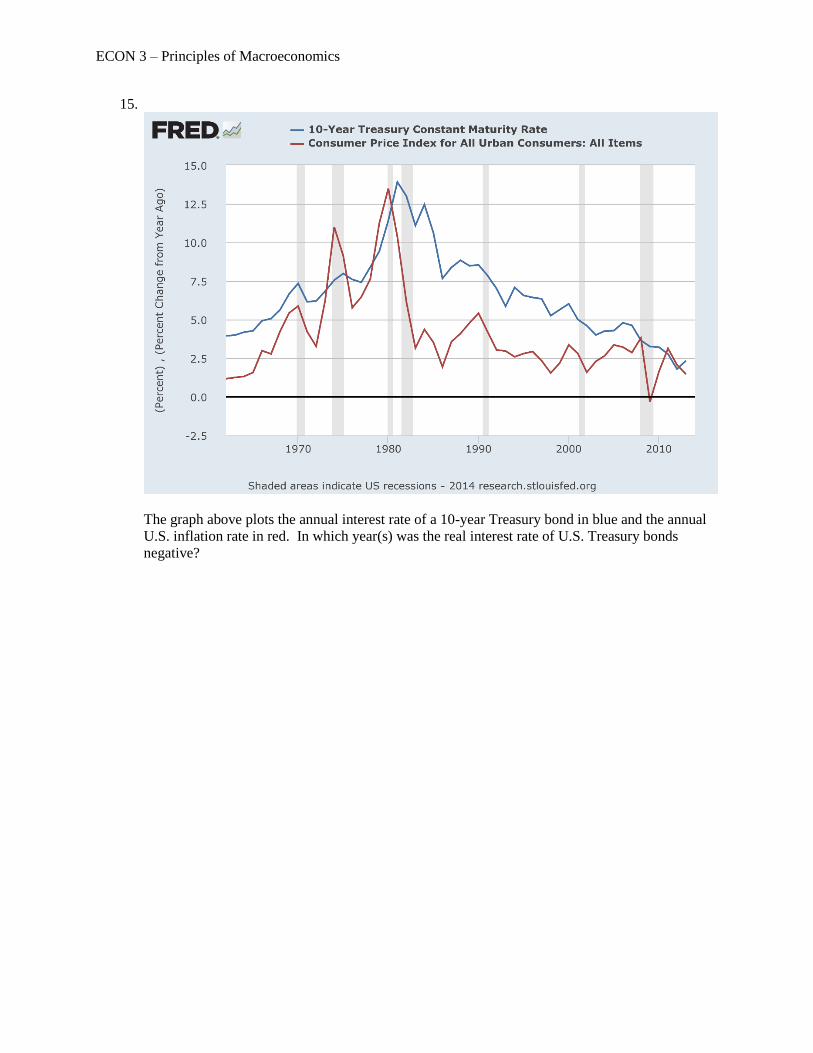
15.
The graph above plots the annual interest rate of a 10-year Treasury bond in blue and the annual
U.S. inflation rate in red. In which year(s) was the real interest rate of U.S. Treasury bonds
negative?
Chapter 16
Inflation and the Price Level

Announcements
1. Yes, textbook available on reserve at library
2. Will adapt teaching style as weeks progress
• Occasional observers will help provide feedback
• Trying today: 10 min break; “think, pair, share”
Chapter 15 Review
• Define GDP (precise verbal def’n)
• Different ways of thinking about it
– Expenditure Method equation
• “Nominal” and “Real” GDP
– Details of conversion
• Things GDP overlooks
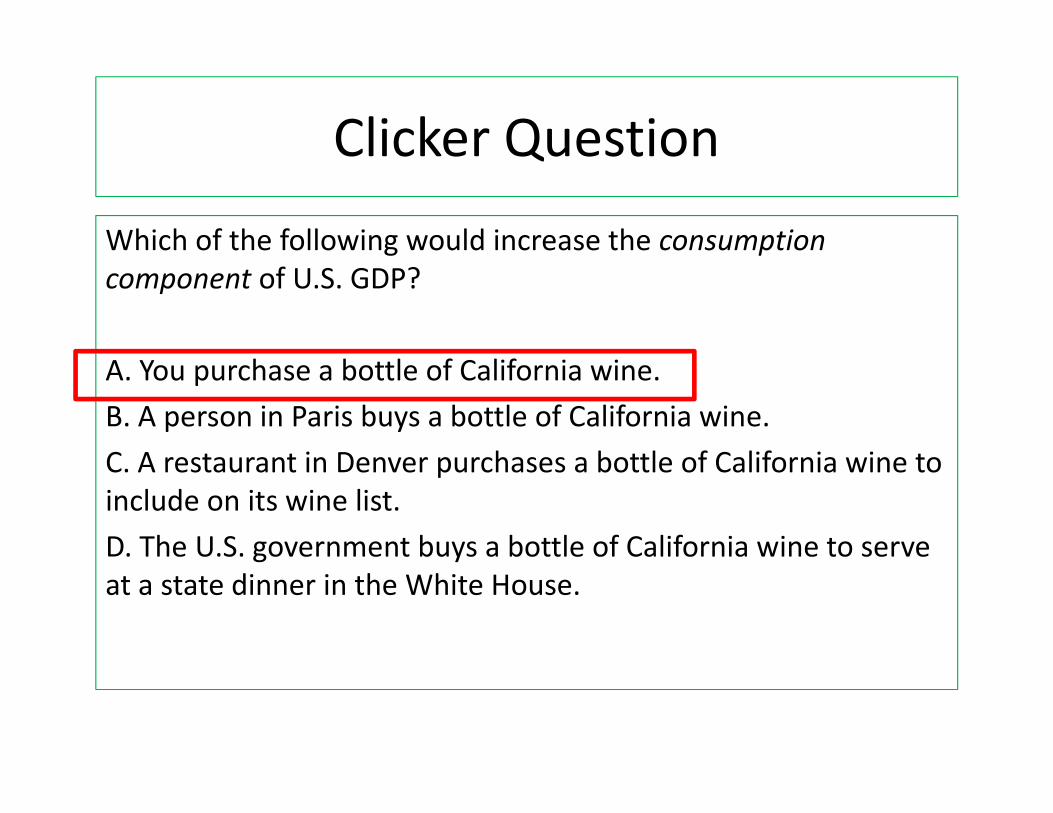
Clicker Question
Which of the following would increase the consumption
component of U.S. GDP?
A. You purchase a bottle of California wine.
B. A person in Paris buys a bottle of California wine.
C. A restaurant in Denver purchases a bottle of California wine to
include on its wine list.
D. The U.S. government buys a bottle of California wine to serve
at a state dinner in the White House.
Learning Objectives
By the end of this chapter, you should be able to:
1. Explain how the Consumer Price Index (CPI) is constructed
+ be able to construct a simple version by hand
2. Compute inflation rate
3. Adjust nominal $ amounts for inflation
4. Explain the costs of inflation
5. Distinguish real and nominal interest rates

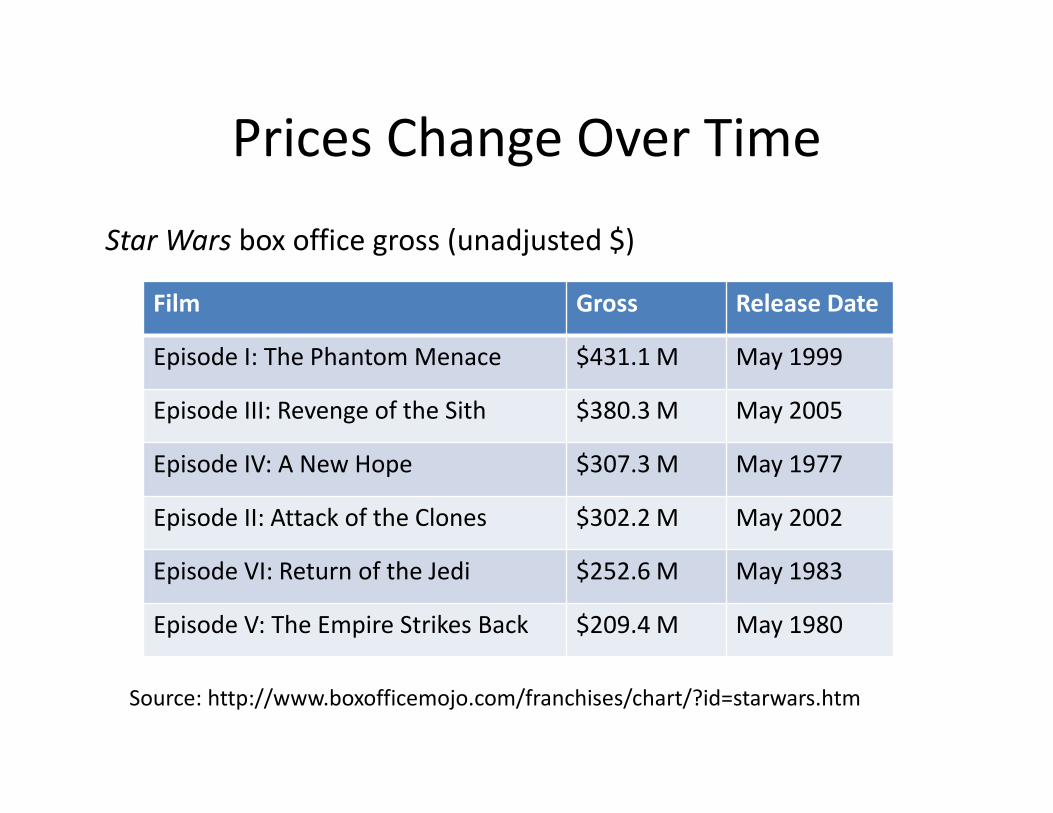
Prices Change Over Time
Star Wars box office gross (unadjusted $)
Film Gross Release Date
Episode I: The Phantom Menace $431.1 M May 1999
Episode III: Revenge of the Sith $380.3 M May 2005
Episode IV: A New Hope $307.3 M May 1977
Episode II: Attack of the Clones $302.2 M May 2002
Episode VI: Return of the Jedi $252.6 M May 1983
Episode V: The Empire Strikes Back $209.4 M May 1980
Source: http://www.boxofficemojo.com/franchises/chart/?id=starwars.htm
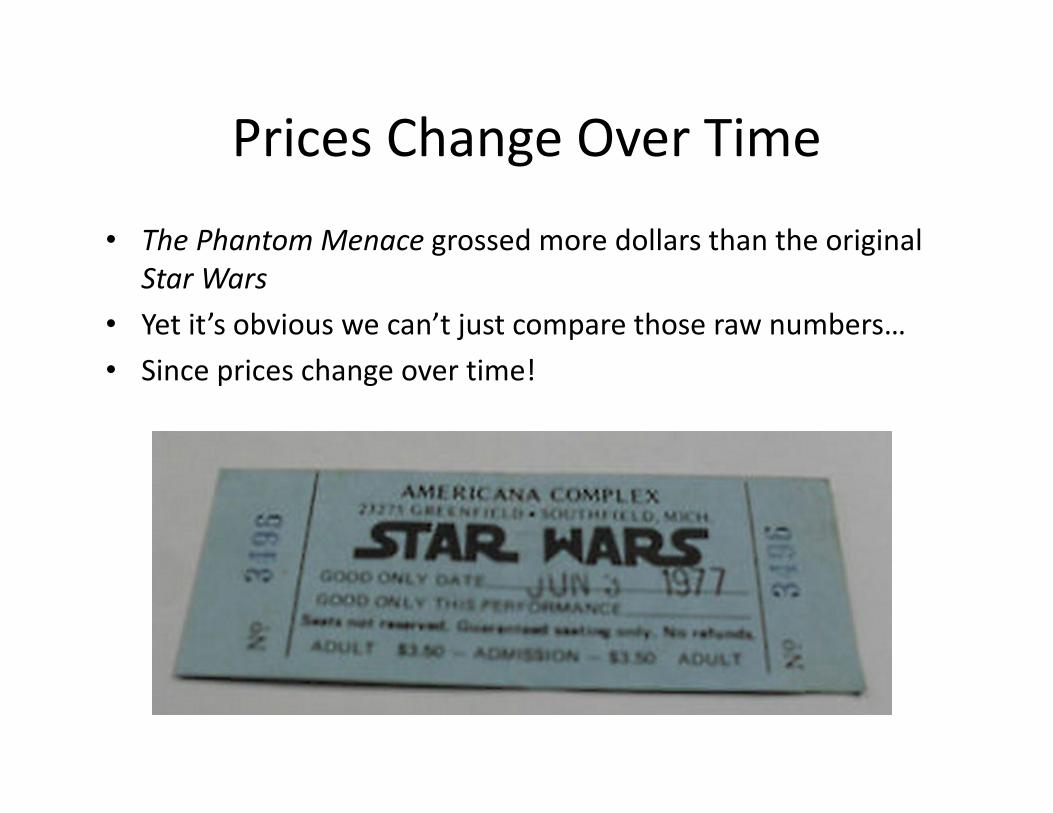
Prices Change Over Time
• The Phantom Menace grossed more dollars than the original
Star Wars
• Yet it’s obvious we can’t just compare those raw numbers…
• Since prices change over time!
Prices Change Over Time
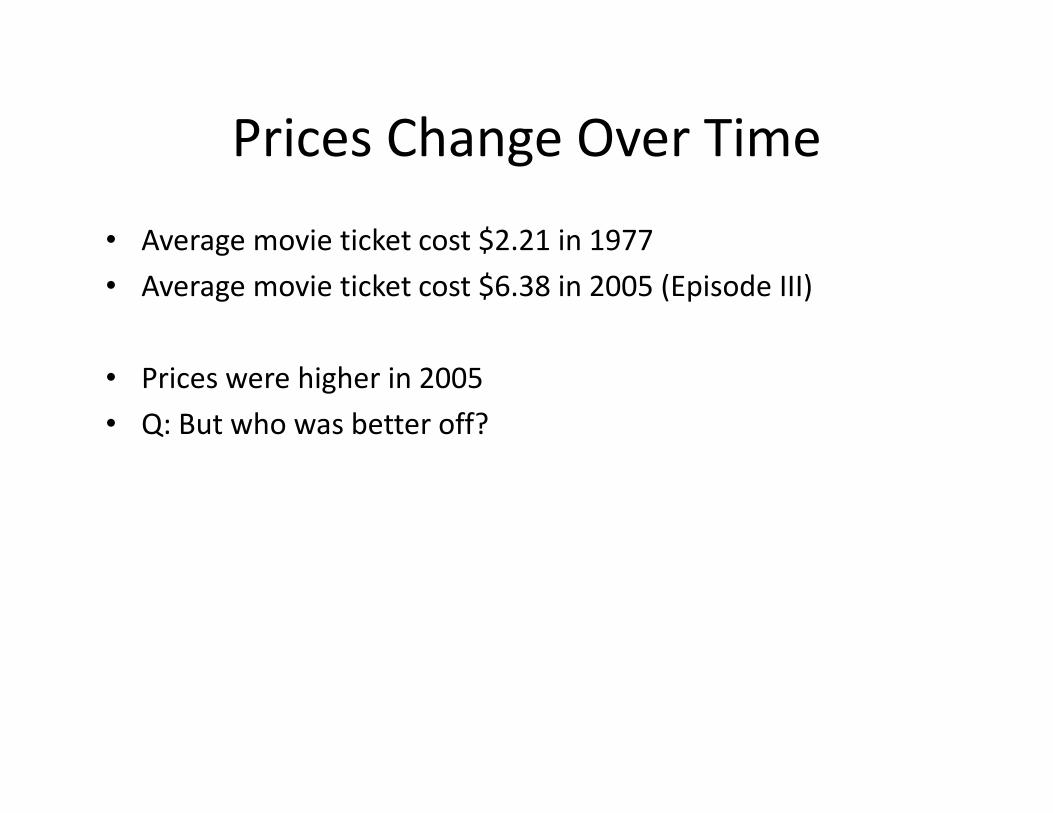
• Average movie ticket cost $2.21 in 1977
• Average movie ticket cost $6.38 in 2005 (Episode III)
• Prices were higher in 2005
• Q: But who was better off?
Prices Change Over Time
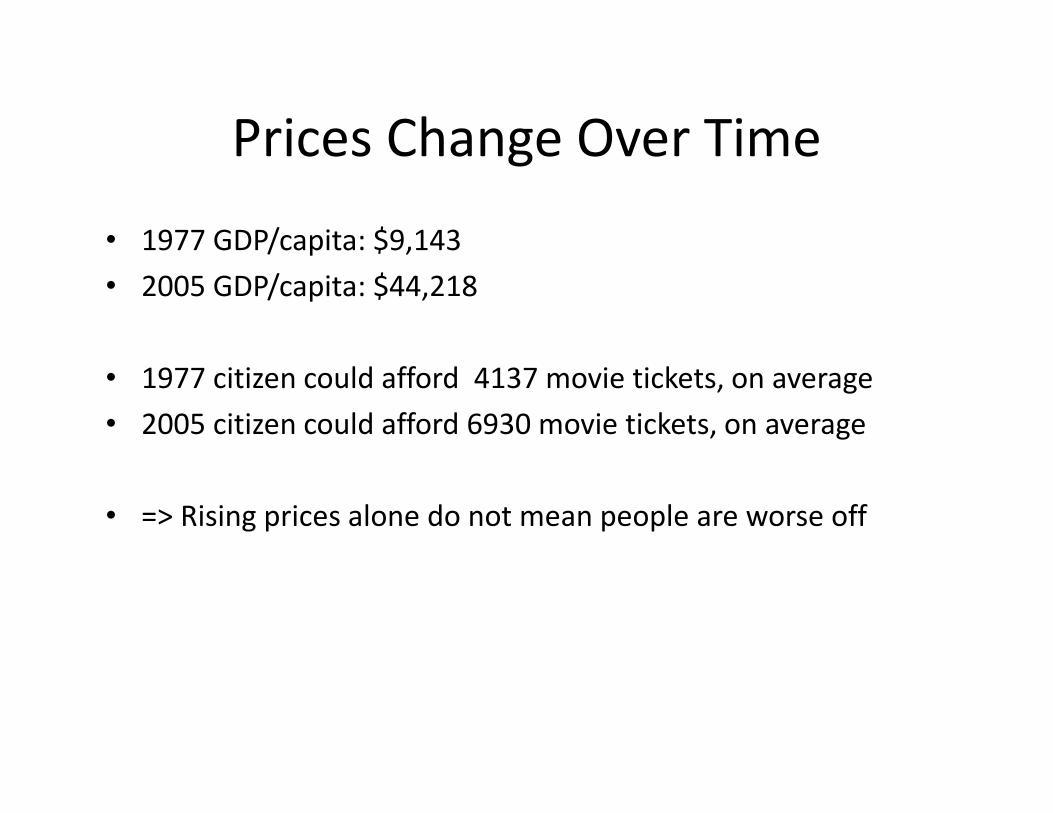
• 1977 GDP/capita: $9,143
• 2005 GDP/capita: $44,218
• 1977 citizen could afford 4137 movie tickets, on average
• 2005 citizen could afford 6930 movie tickets, on average
• => Rising prices alone do not mean people are worse off
Inflation Preview
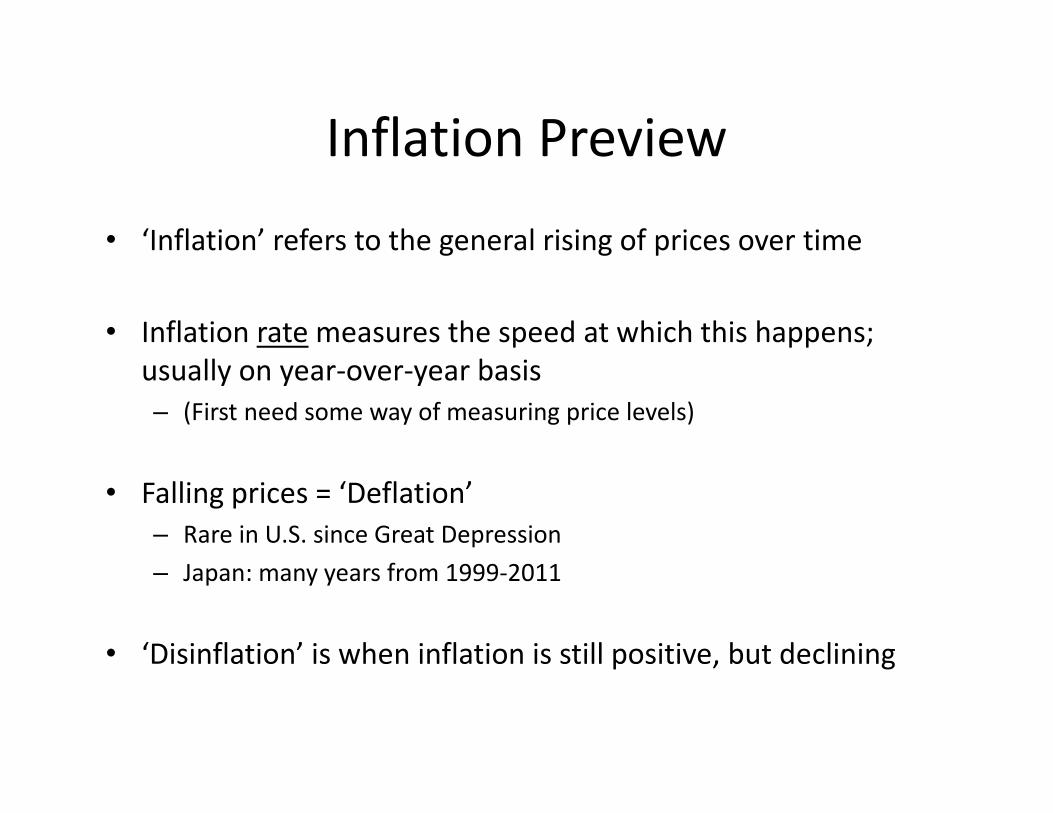
• ‘Inflation’ refers to the general rising of prices over time
• Inflation rate measures the speed at which this happens;
usually on year-over-year basis
– (First need some way of measuring price levels)
• Falling prices = ‘Deflation’
– Rare in U.S. since Great Depression
– Japan: many years from 1999-2011
• ‘Disinflation’ is when inflation is still positive, but declining
Measuring Price Levels
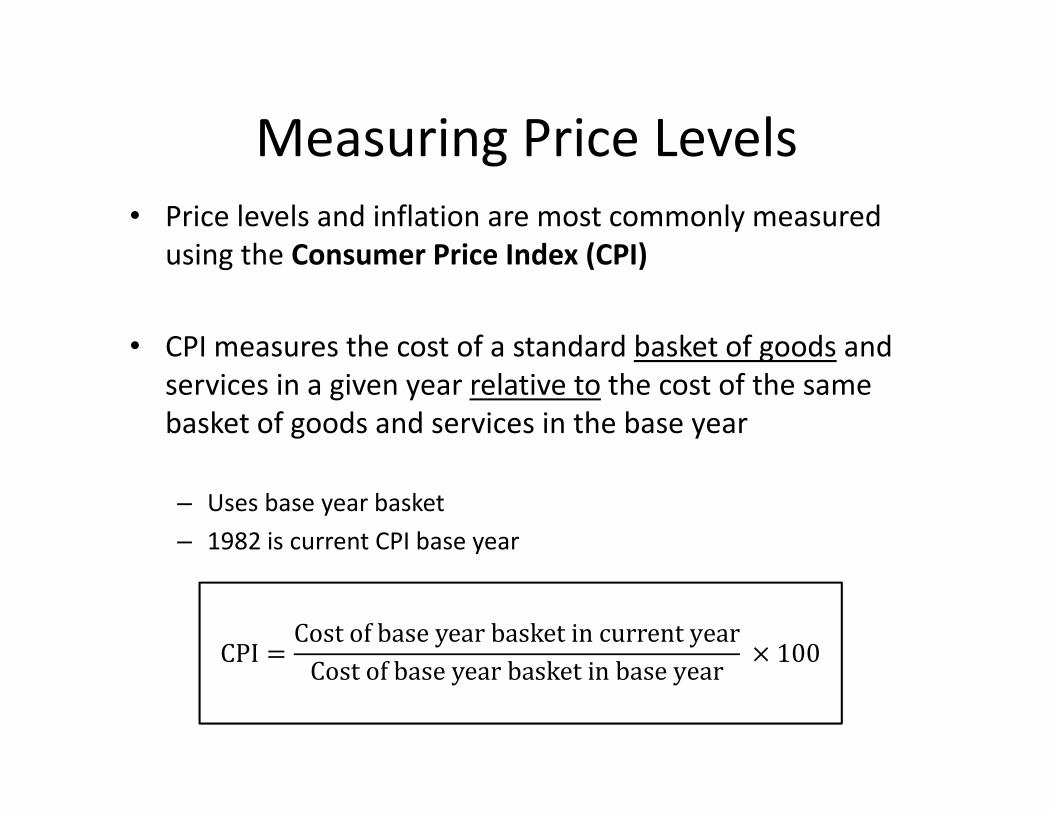
• Price levels and inflation are most commonly measured
using the Consumer Price Index (CPI)
• CPI measures the cost of a standard basket of goods and
services in a given year relative to the cost of the same
basket of goods and services in the base year
– Uses base year basket
– 1982 is current CPI base year
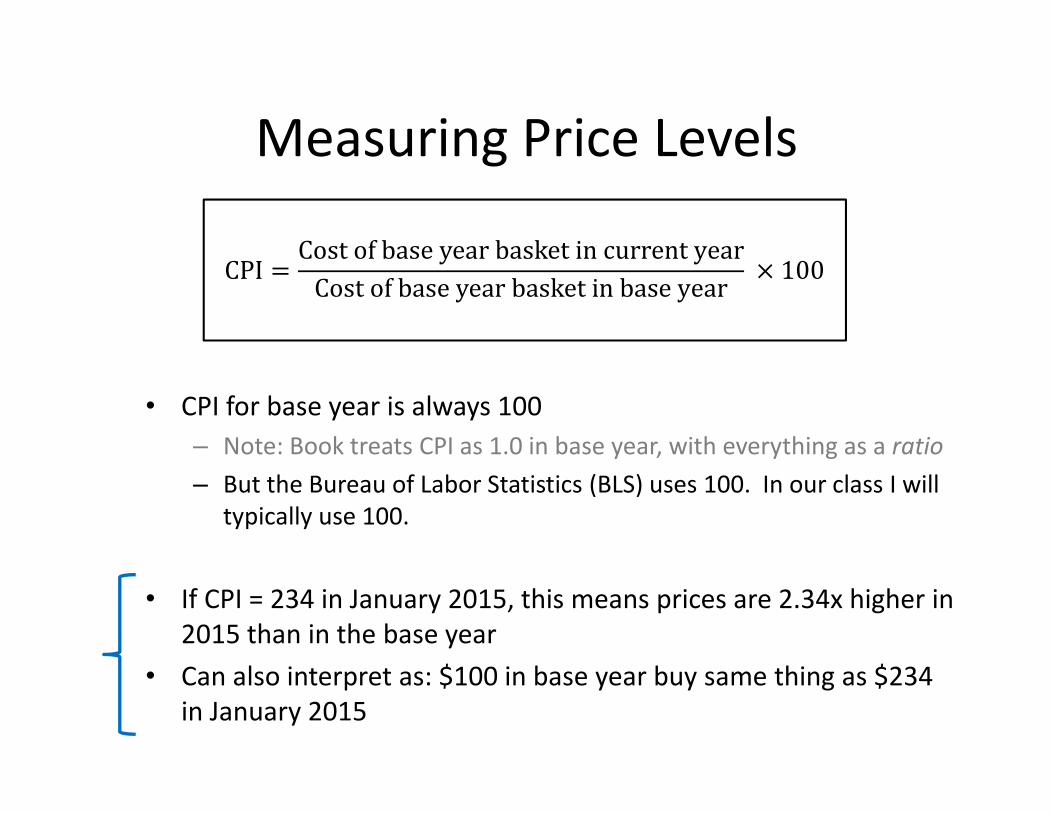
CPI =Cost of base year basket in current year
Cost of base year basket in base year × 100
Measuring Price Levels
• CPI for base year is always 100
– Note: Book treats CPI as 1.0 in base year, with everything as a ratio
– But the Bureau of Labor Statistics (BLS) uses 100. In our class I will
typically use 100.
• If CPI = 234 in January 2015, this means prices are 2.34x higher in
2015 than in the base year
• Can also interpret as: $100 in base year buy same thing as $234
in January 2015
CPI =Cost of base year basket in current year
Cost of base year basket in base year × 100
Measuring Price Levels
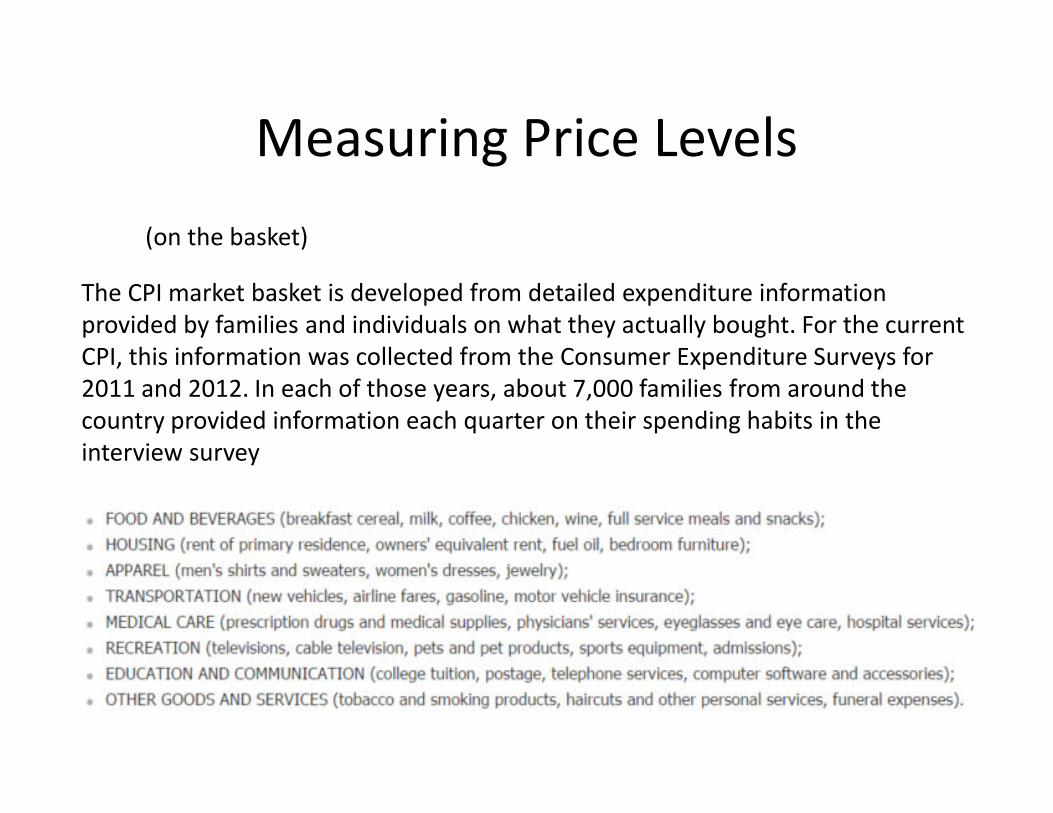
(on the basket)
The CPI market basket is developed from detailed expenditure information
provided by families and individuals on what they actually bought. For the current
CPI, this information was collected from the Consumer Expenditure Surveys for
2011 and 2012. In each of those years, about 7,000 families from around the
country provided information each quarter on their spending habits in the
interview survey
Measuring Price Levels
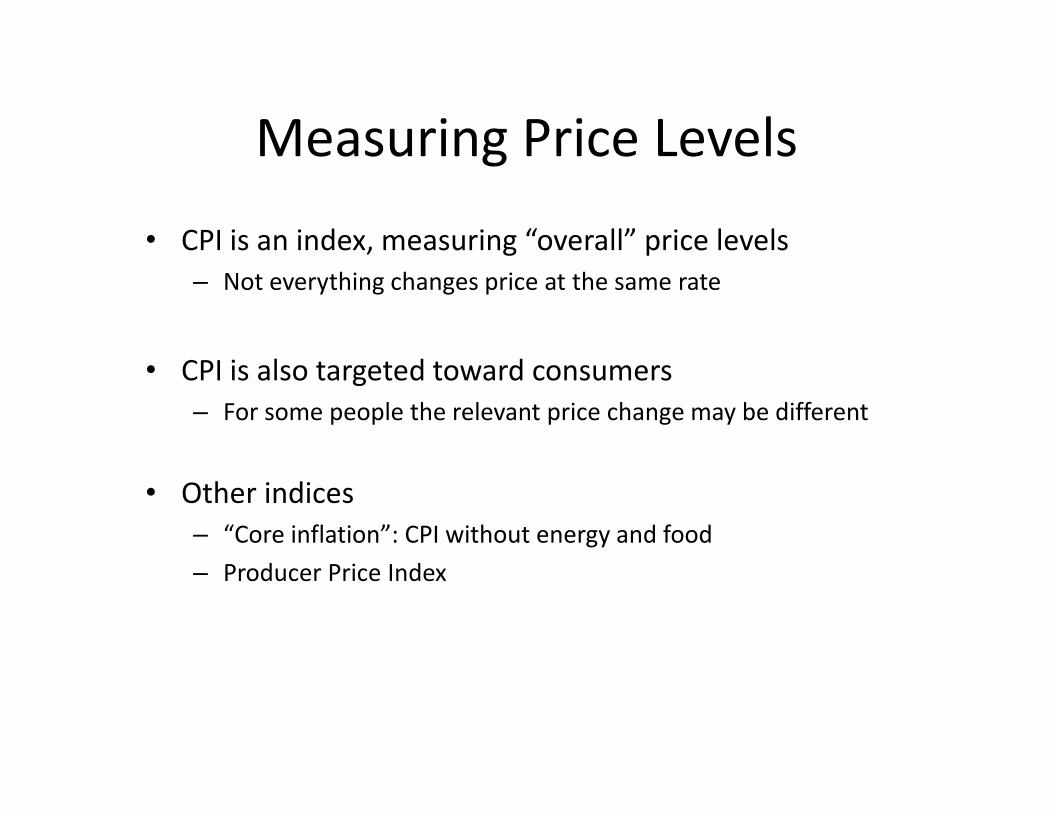
• CPI is an index, measuring “overall” price levels
– Not everything changes price at the same rate
• CPI is also targeted toward consumers
– For some people the relevant price change may be different
• Other indices
– “Core inflation”: CPI without energy and food
– Producer Price Index
Computing CPI: example
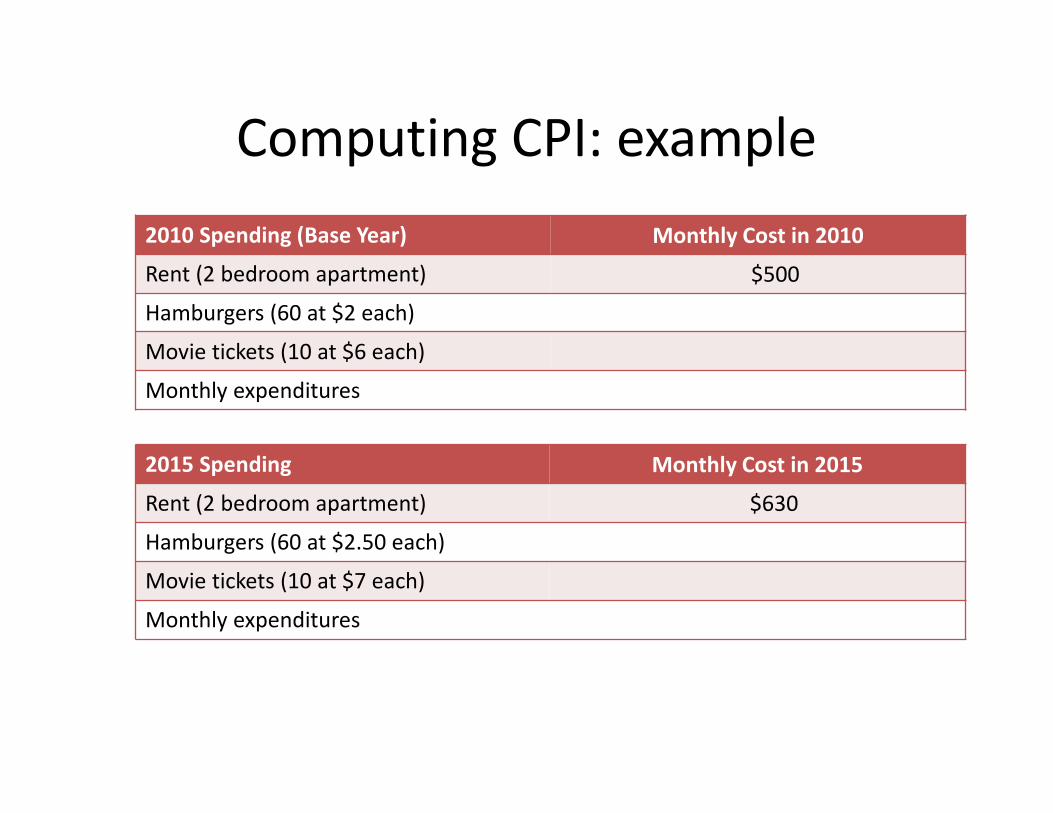
2010 Spending (Base Year) Monthly Cost in 2010
Rent (2 bedroom apartment) $500
Hamburgers (60 at $2 each)
Movie tickets (10 at $6 each)
Monthly expenditures
2015 Spending Monthly Cost in 2015
Rent (2 bedroom apartment) $630
Hamburgers (60 at $2.50 each)
Movie tickets (10 at $7 each)
Monthly expenditures
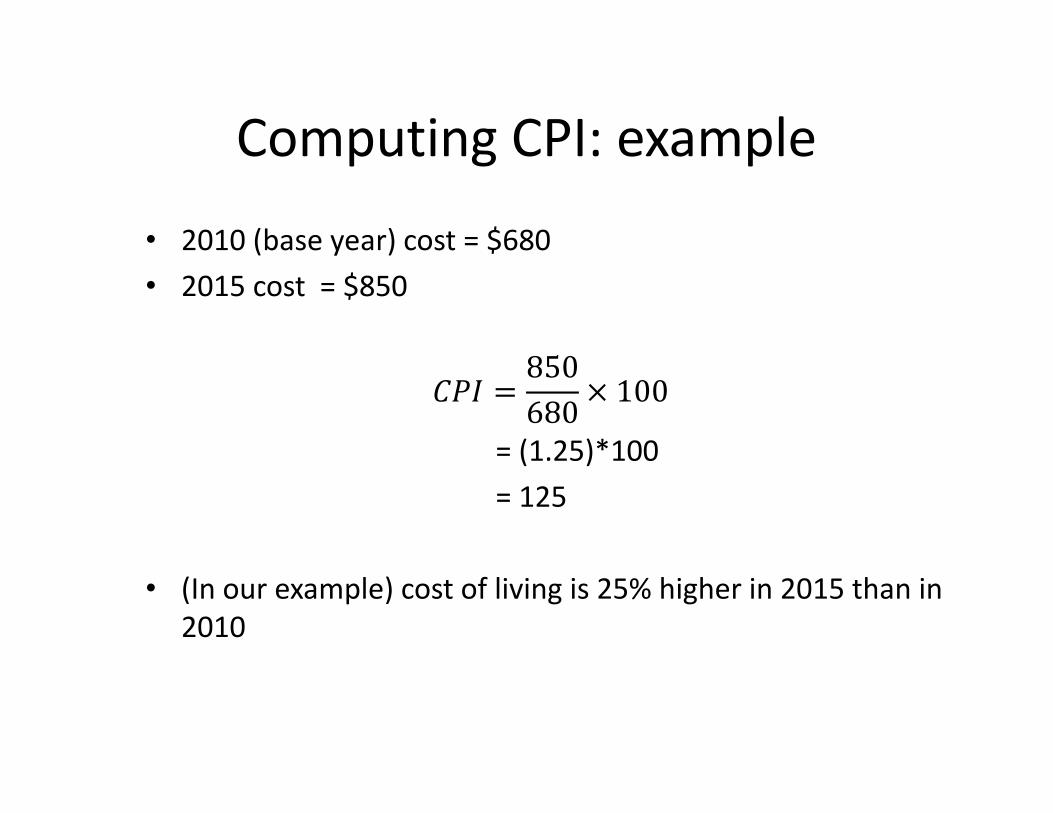
Computing CPI: example
• 2010 (base year) cost = $680
• 2015 cost = $850
��� =850
680× 100
= (1.25)*100
= 125
• (In our example) cost of living is 25% higher in 2015 than in
2010
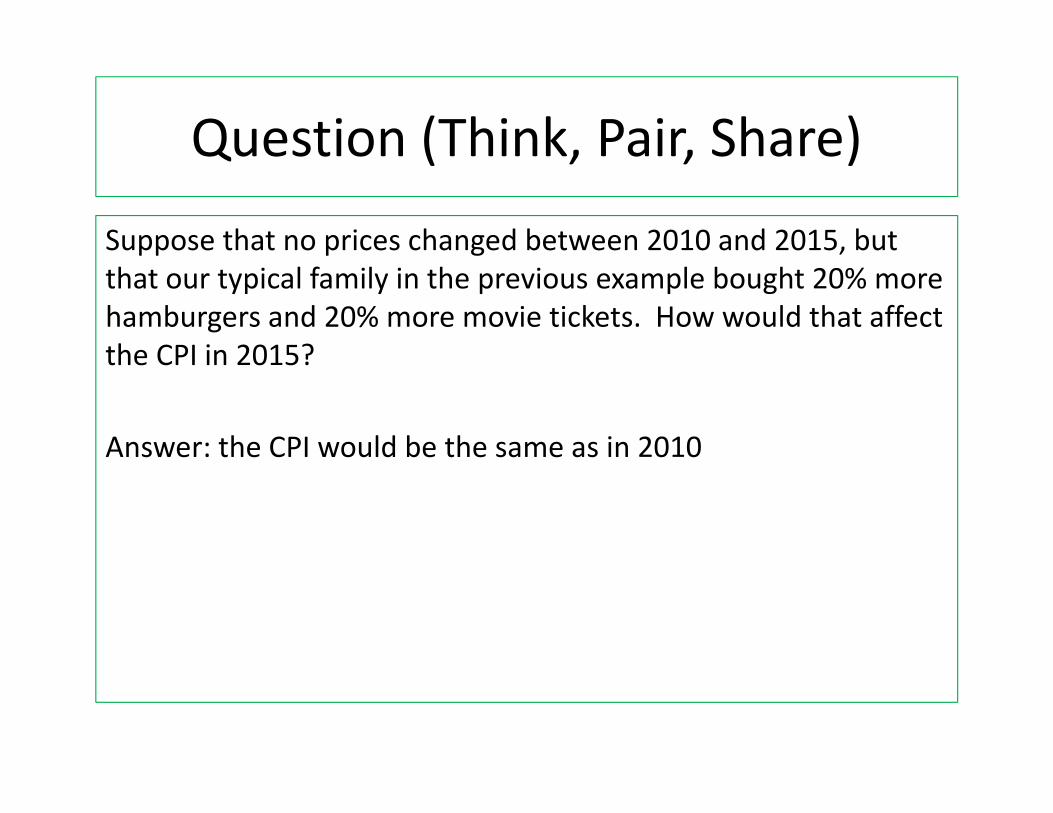
Question (Think, Pair, Share)
Suppose that no prices changed between 2010 and 2015, but
that our typical family in the previous example bought 20% more
hamburgers and 20% more movie tickets. How would that affect
the CPI in 2015?
Answer: the CPI would be the same as in 2010
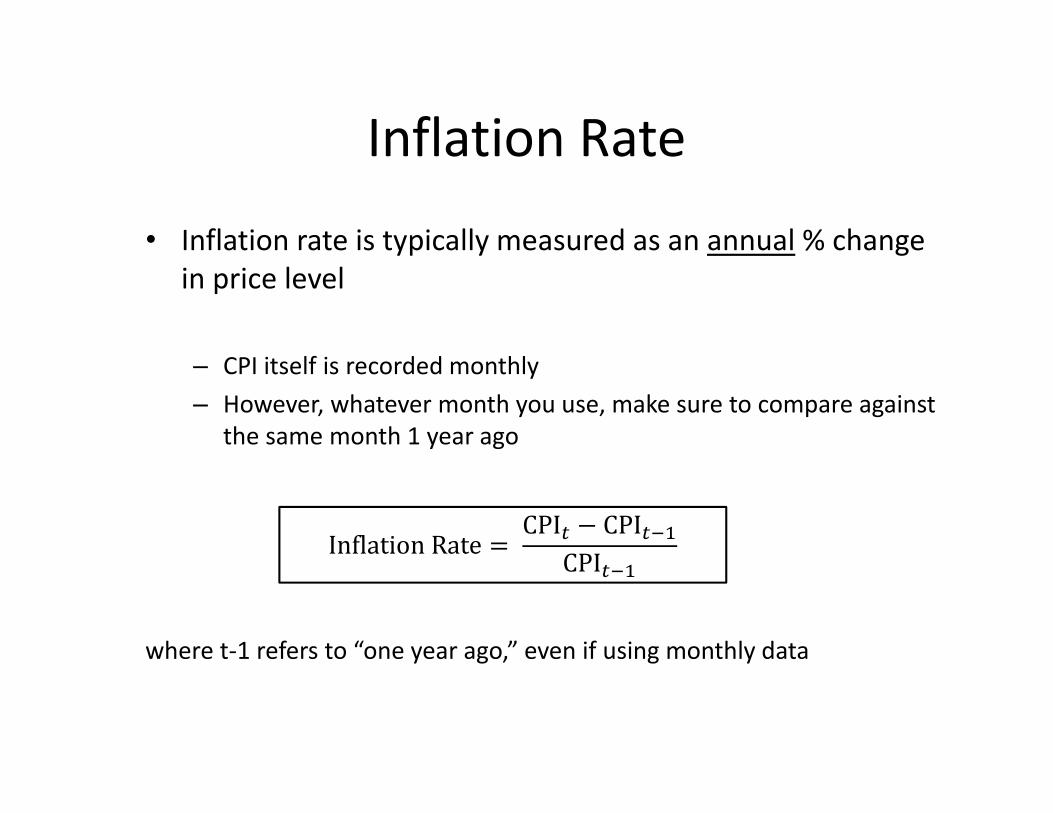
Inflation Rate
• Inflation rate is typically measured as an annual % change
in price level
– CPI itself is recorded monthly
– However, whatever month you use, make sure to compare against
the same month 1 year ago
where t-1 refers to “one year ago,” even if using monthly data
Inflation Rate = CPI� − CPI�!"
CPI�!"
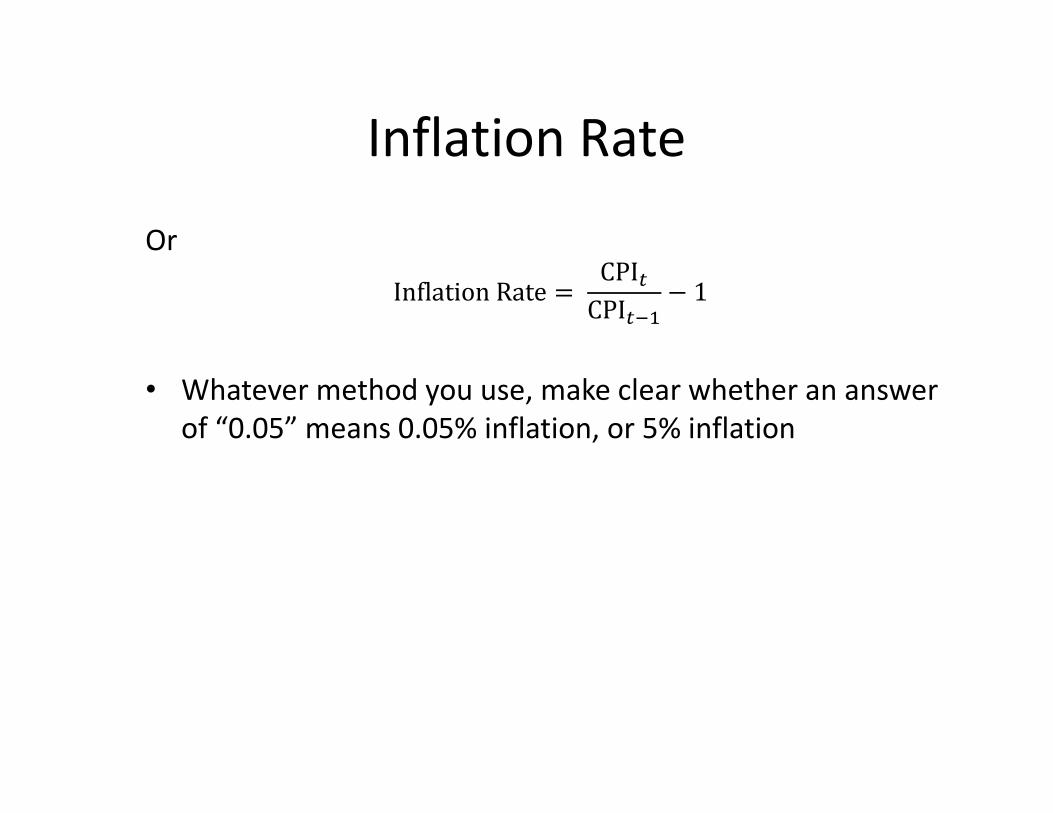
Inflation Rate
Or
Inflation Rate = CPI�
CPI�!"− 1
• Whatever method you use, make clear whether an answer
of “0.05” means 0.05% inflation, or 5% inflation

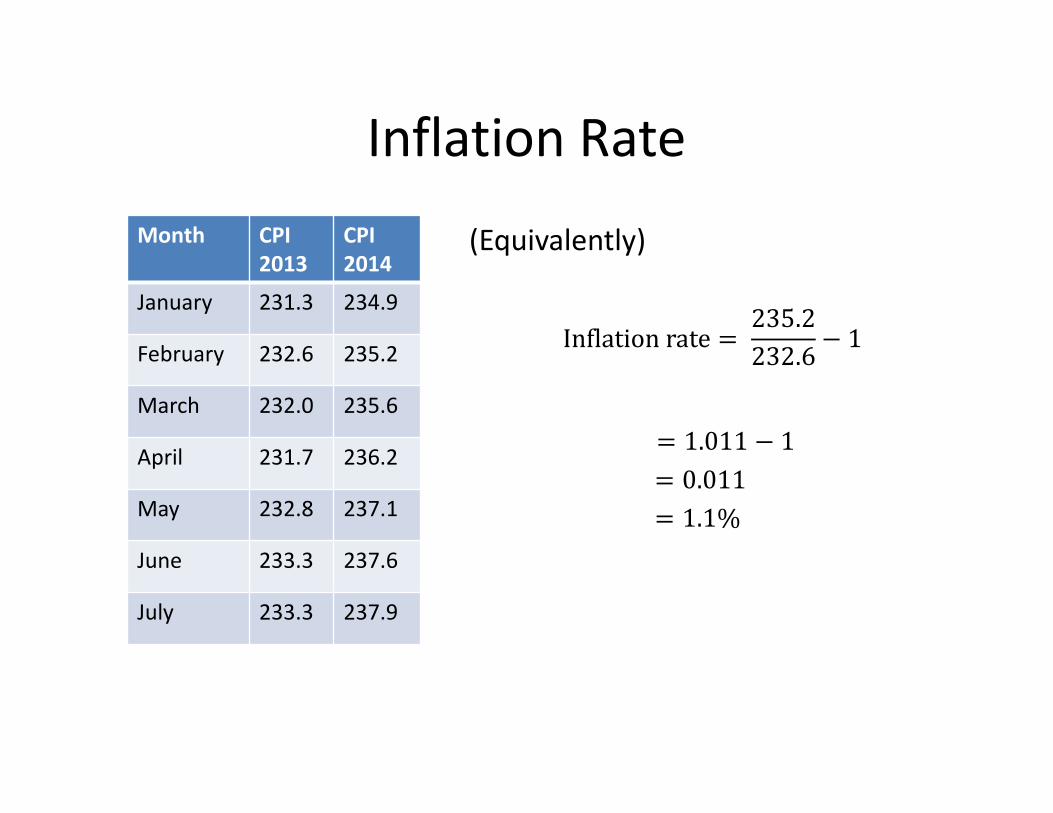
Inflation Rate
Month CPI
2013
CPI
2014
January 231.3 234.9
February 232.6 235.2
March 232.0 235.6
April 231.7 236.2
May 232.8 237.1
June 233.3 237.6
July 233.3 237.9
Inflation rate in February 2014:
Inflation rate = 235.2 − 232.6
232.6
=&.'
&(&.'
= 0.011
= 1.1%
Inflation Rate
Month CPI
2013
CPI
2014
January 231.3 234.9
February 232.6 235.2
March 232.0 235.6
April 231.7 236.2
May 232.8 237.1
June 233.3 237.6
July 233.3 237.9
(Equivalently)
Inflation rate = 235.2
232.6− 1
= 1.011 − 1
= 0.011
= 1.1%
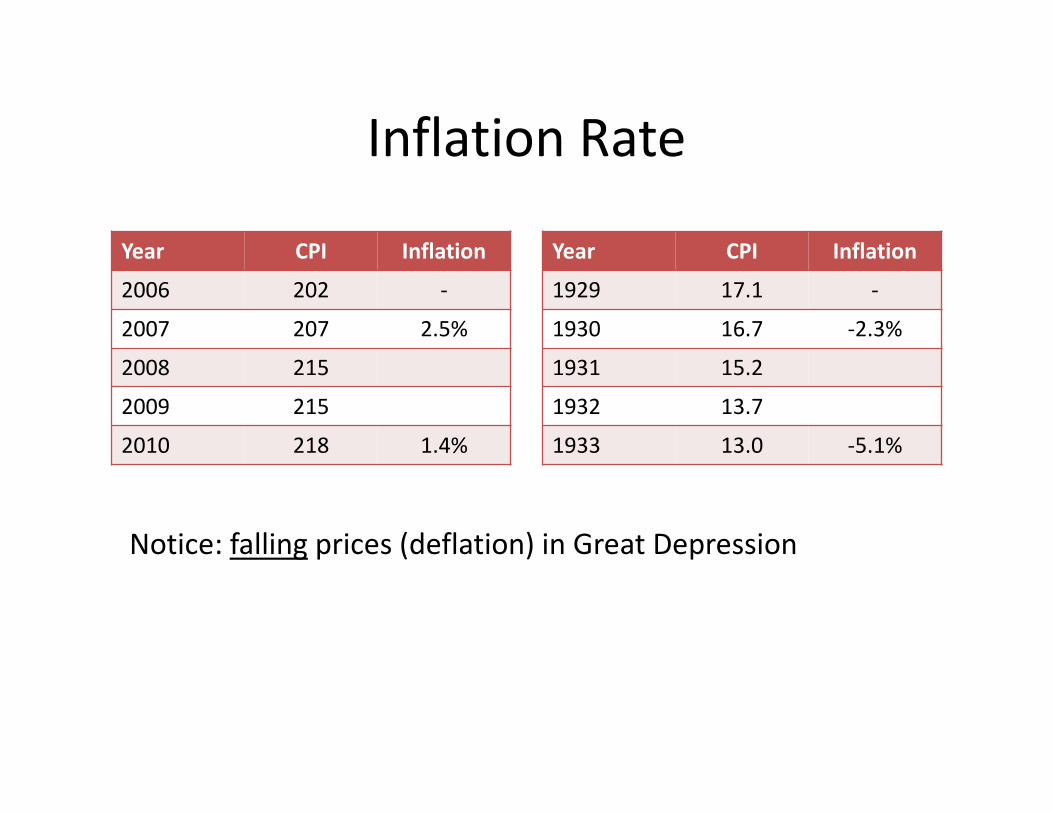
Inflation Rate
Notice: falling prices (deflation) in Great Depression
Year CPI Inflation
2006 202 -
2007 207 2.5%
2008 215
2009 215
2010 218 1.4%
Year CPI Inflation
1929 17.1 -
1930 16.7 -2.3%
1931 15.2
1932 13.7
1933 13.0 -5.1%
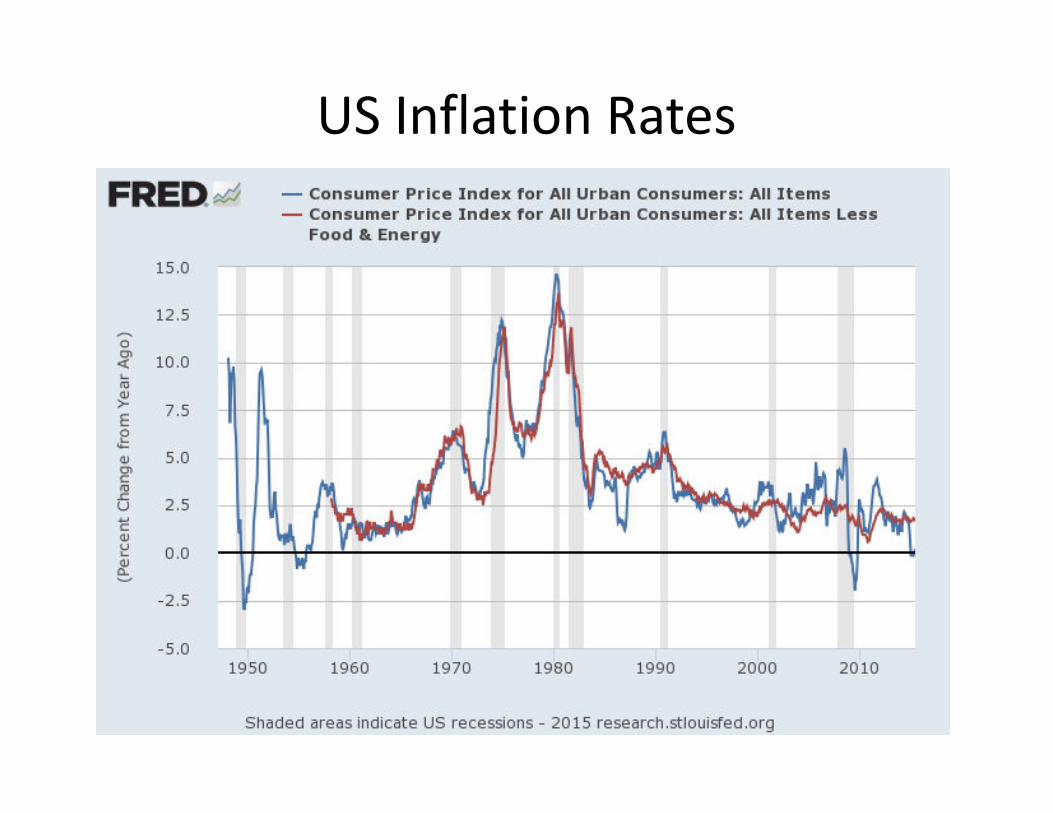
US Inflation Rates
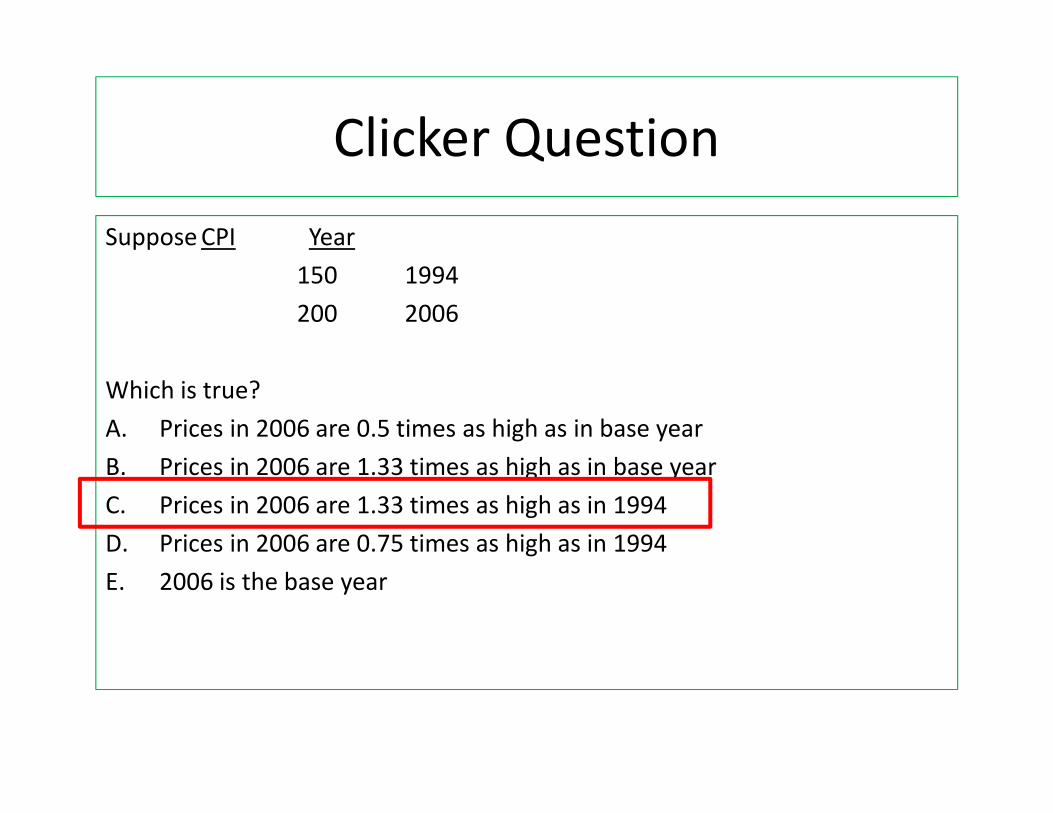
Clicker Question
Suppose CPI Year
150 1994
200 2006
Which is true?
A. Prices in 2006 are 0.5 times as high as in base year
B. Prices in 2006 are 1.33 times as high as in base year
C. Prices in 2006 are 1.33 times as high as in 1994
D. Prices in 2006 are 0.75 times as high as in 1994
E. 2006 is the base year
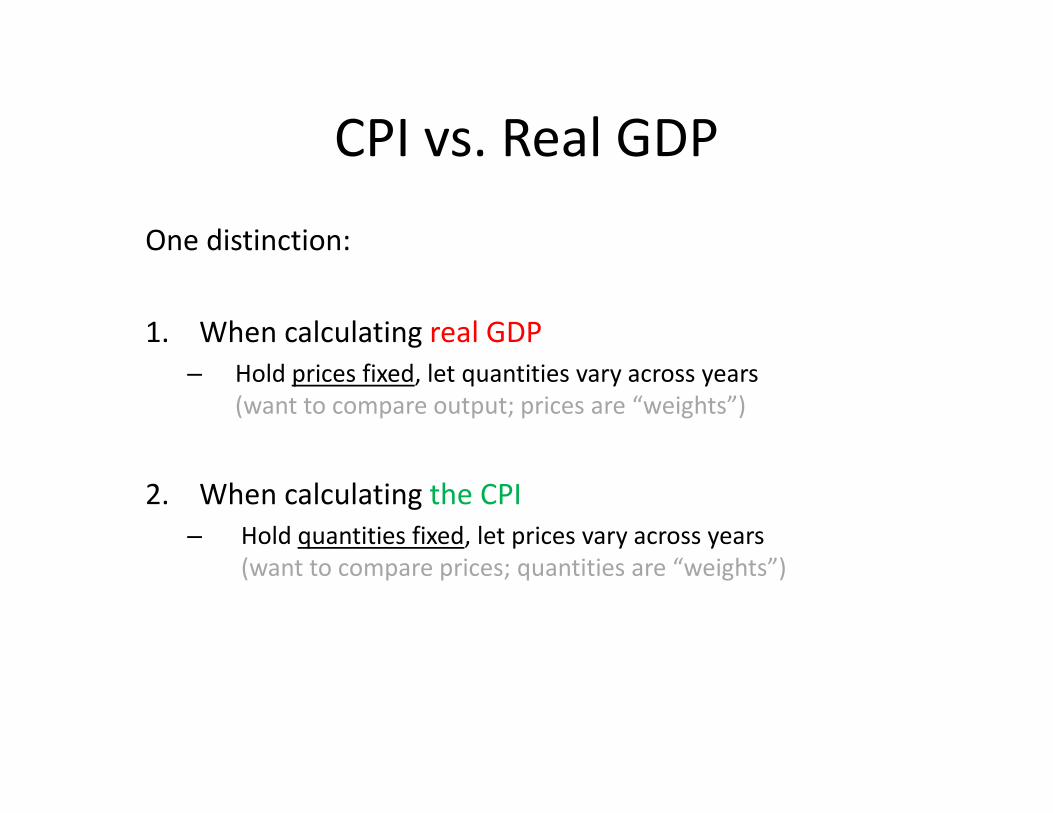
CPI vs. Real GDP
One distinction:
1. When calculating real GDP
– Hold prices fixed, let quantities vary across years
(want to compare output; prices are “weights”)
2. When calculating the CPI
– Hold quantities fixed, let prices vary across years
(want to compare prices; quantities are “weights”)
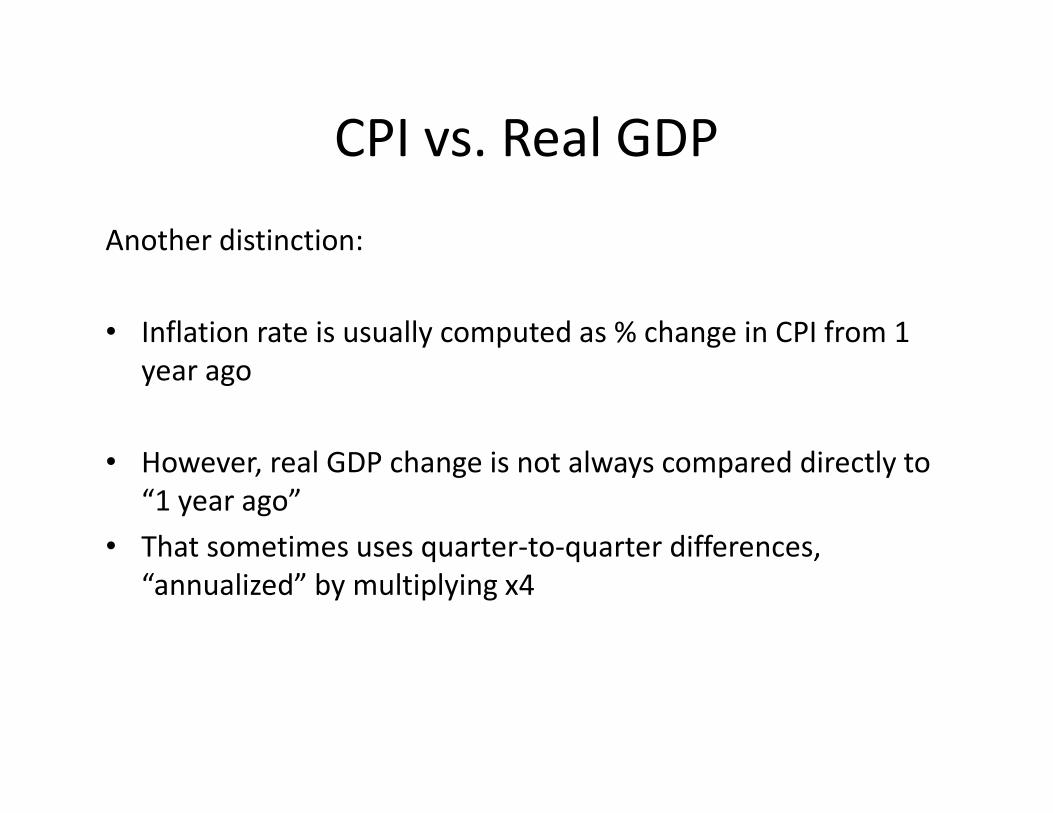
CPI vs. Real GDP
Another distinction:
• Inflation rate is usually computed as % change in CPI from 1
year ago
• However, real GDP change is not always compared directly to
“1 year ago”
• That sometimes uses quarter-to-quarter differences,
“annualized” by multiplying x4
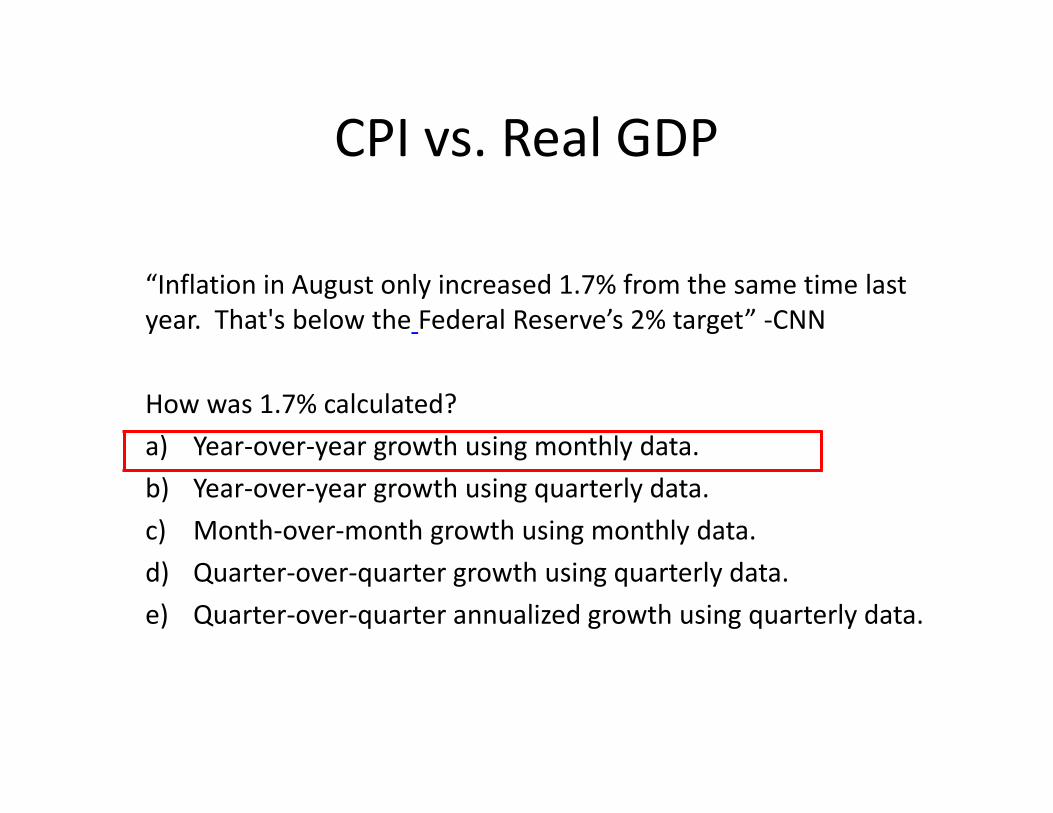
CPI vs. Real GDP
“Inflation in August only increased 1.7% from the same time last
year. That's below the Federal Reserve’s 2% target” -CNN
How was 1.7% calculated?
a) Year-over-year growth using monthly data.
b) Year-over-year growth using quarterly data.
c) Month-over-month growth using monthly data.
d) Quarter-over-quarter growth using quarterly data.
e) Quarter-over-quarter annualized growth using quarterly data.
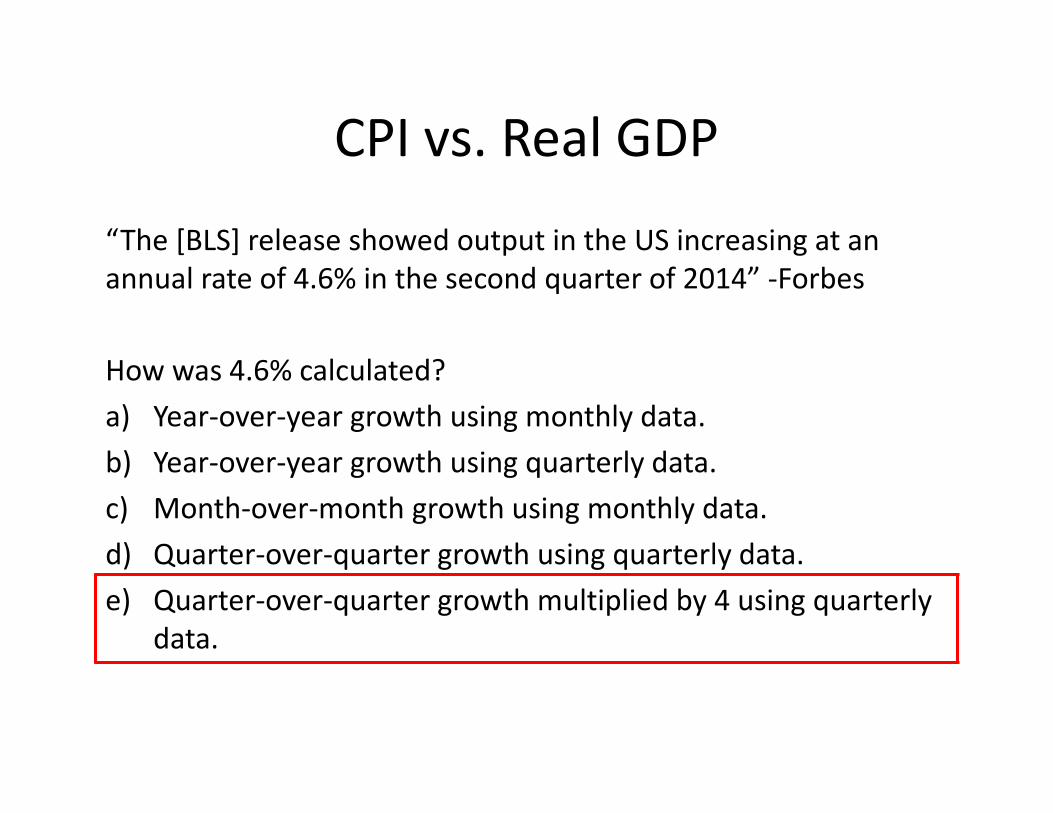
CPI vs. Real GDP
“The [BLS] release showed output in the US increasing at an
annual rate of 4.6% in the second quarter of 2014” -Forbes
How was 4.6% calculated?
a) Year-over-year growth using monthly data.
b) Year-over-year growth using quarterly data.
c) Month-over-month growth using monthly data.
d) Quarter-over-quarter growth using quarterly data.
e) Quarter-over-quarter growth multiplied by 4 using quarterly
data.
Adjusting for Inflation
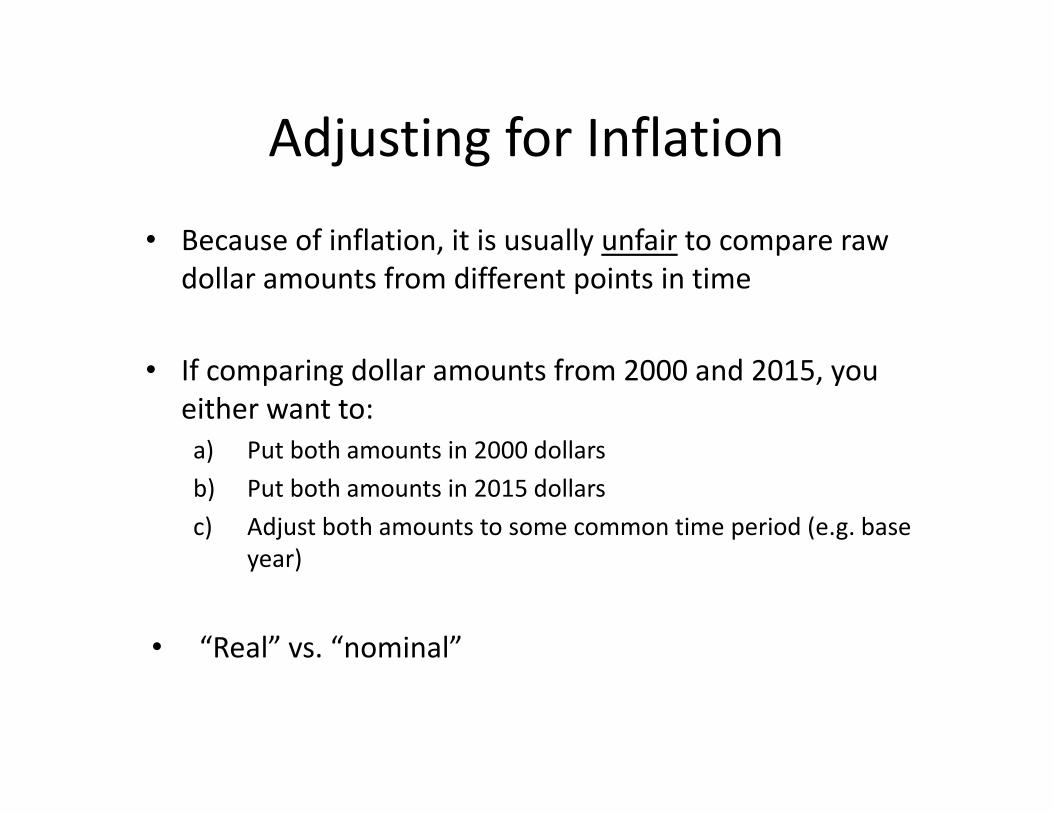
• Because of inflation, it is usually unfair to compare raw
dollar amounts from different points in time
• If comparing dollar amounts from 2000 and 2015, you
either want to:
a) Put both amounts in 2000 dollars
b) Put both amounts in 2015 dollars
c) Adjust both amounts to some common time period (e.g. base
year)
• “Real” vs. “nominal”
Adjusting for Inflation
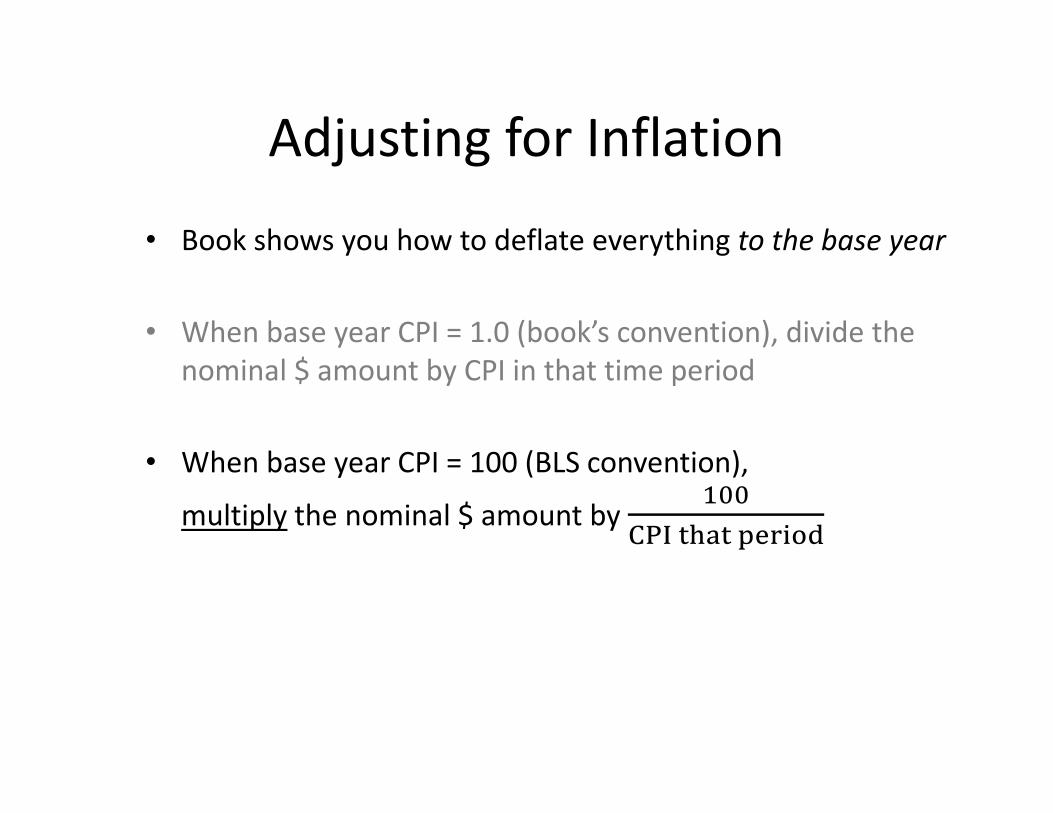
• Book shows you how to deflate everything to the base year
• When base year CPI = 1.0 (book’s convention), divide the
nominal $ amount by CPI in that time period
• When base year CPI = 100 (BLS convention),
multiply the nominal $ amount by "**
+,- ./0. 123456
Adjusting for Inflation
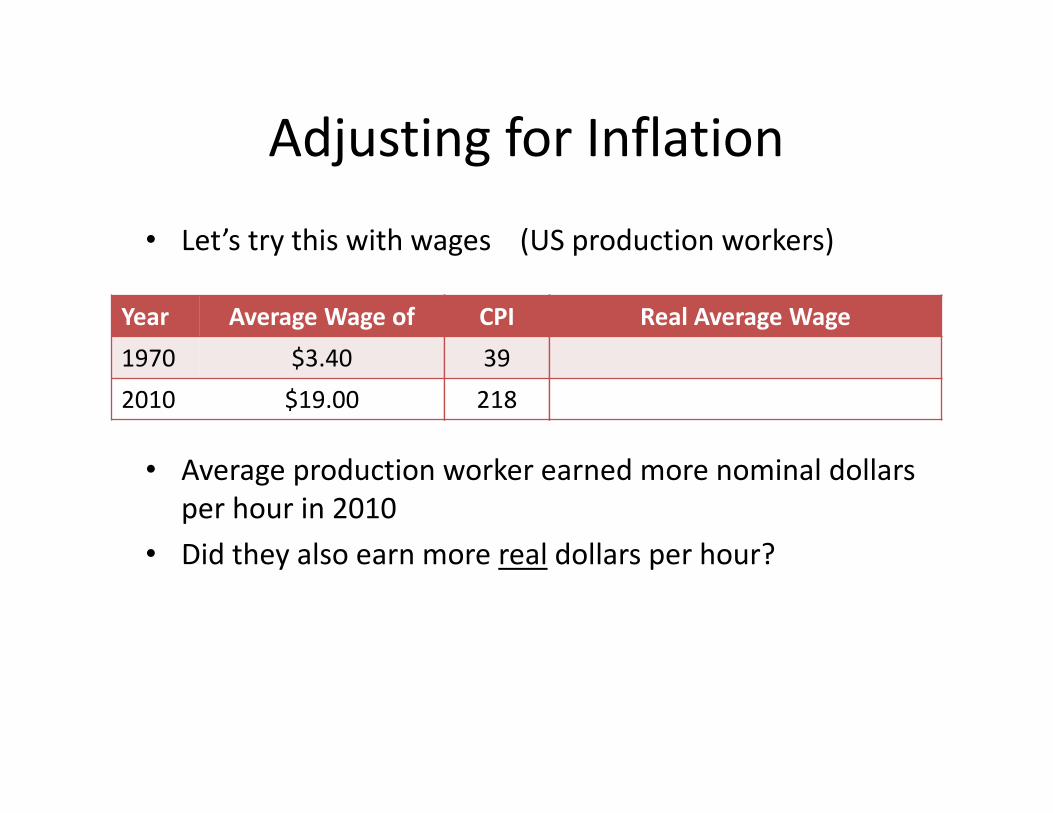
• Let’s try this with wages (US production workers)
• Average production worker earned more nominal dollars
per hour in 2010
• Did they also earn more real dollars per hour?
Year Average Wage of
1970 $3.40
2010 $19.00
CPI
39
218
Real Average Wage
Adjusting for Inflation
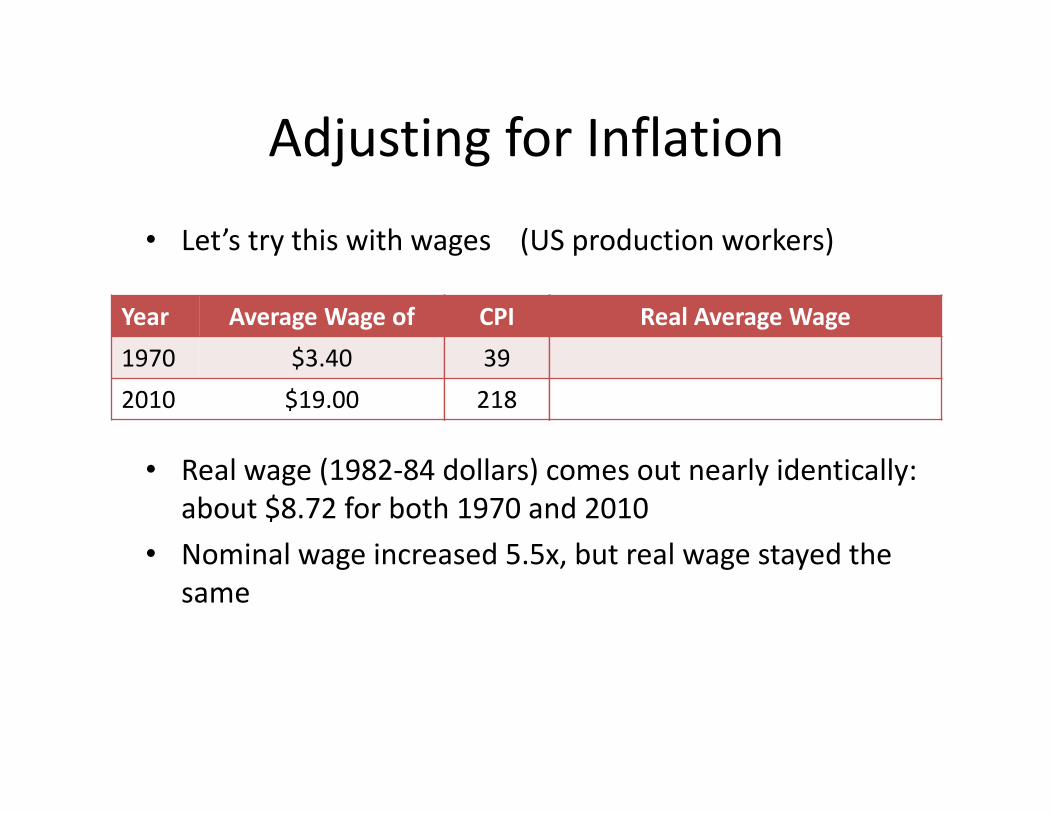
• Let’s try this with wages (US production workers)
• Real wage (1982-84 dollars) comes out nearly identically:
about $8.72 for both 1970 and 2010
• Nominal wage increased 5.5x, but real wage stayed the
same
Year Average Wage of
1970 $3.40
2010 $19.00
CPI
39
218
Real Average Wage
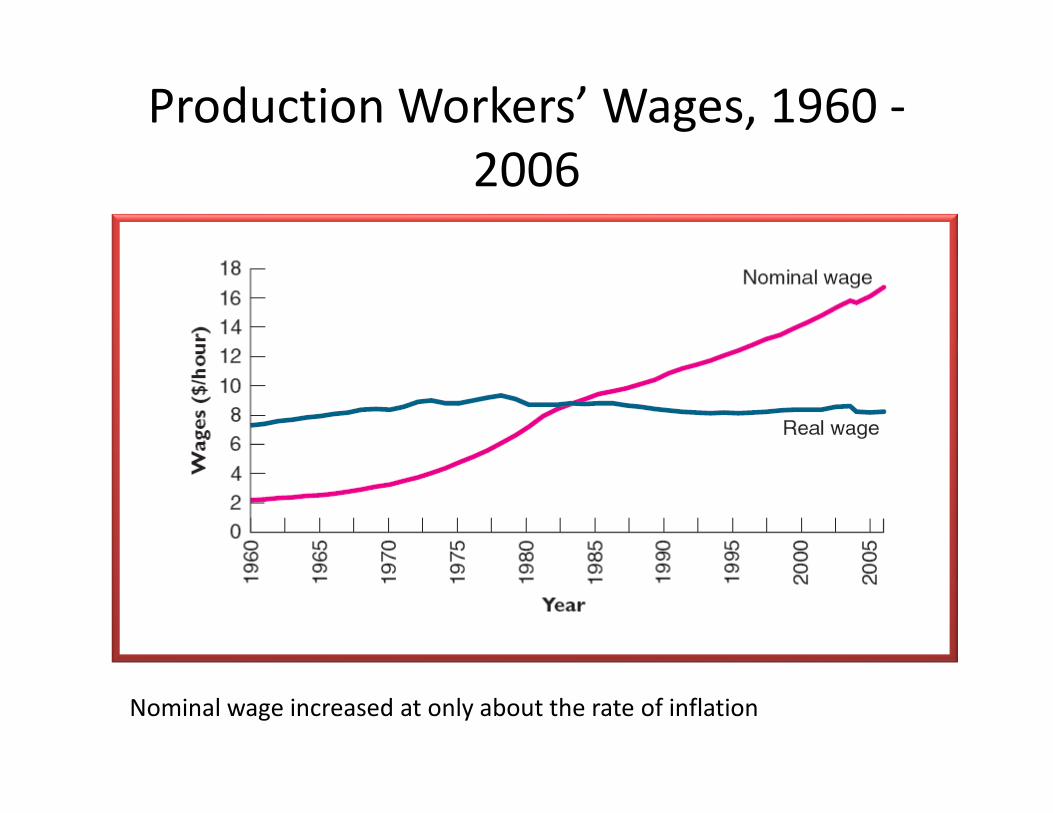
Production Workers’ Wages, 1960 -
2006
Nominal wage increased at only about the rate of inflation
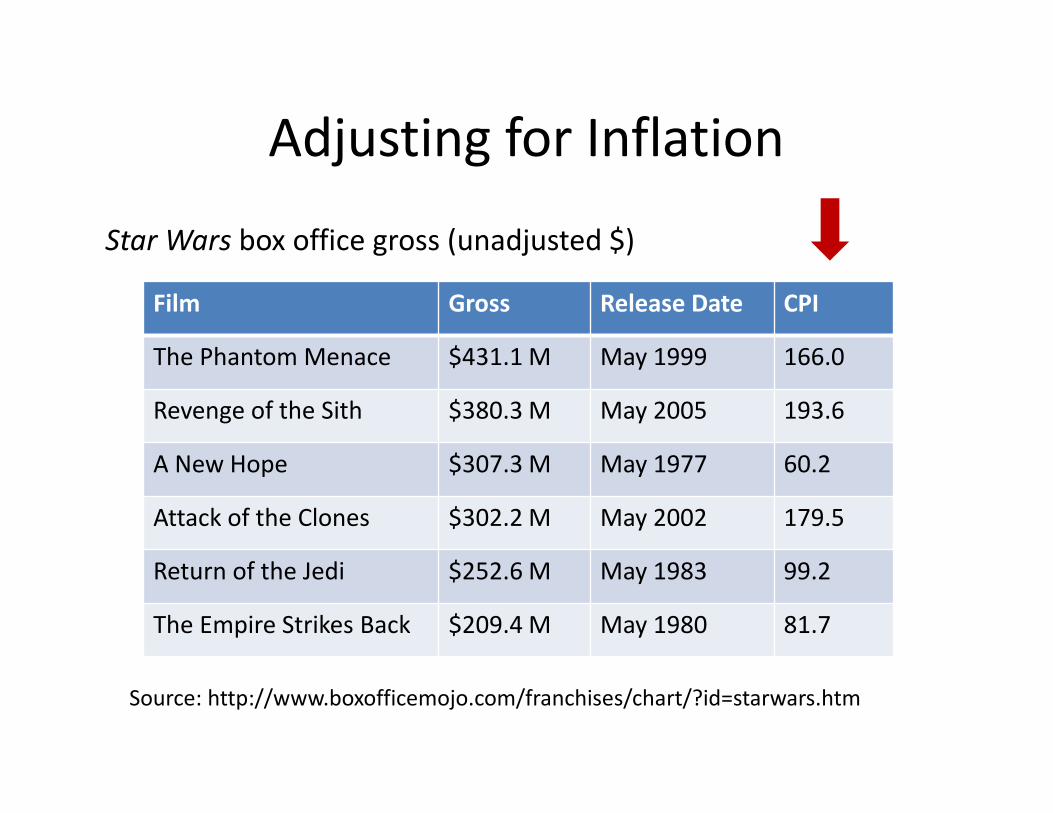
Adjusting for Inflation
Star Wars box office gross (unadjusted $)
Film Gross Release Date CPI
The Phantom Menace $431.1 M May 1999 166.0
Revenge of the Sith $380.3 M May 2005 193.6
A New Hope $307.3 M May 1977 60.2
Attack of the Clones $302.2 M May 2002 179.5
Return of the Jedi $252.6 M May 1983 99.2
The Empire Strikes Back $209.4 M May 1980 81.7
Source: http://www.boxofficemojo.com/franchises/chart/?id=starwars.htm
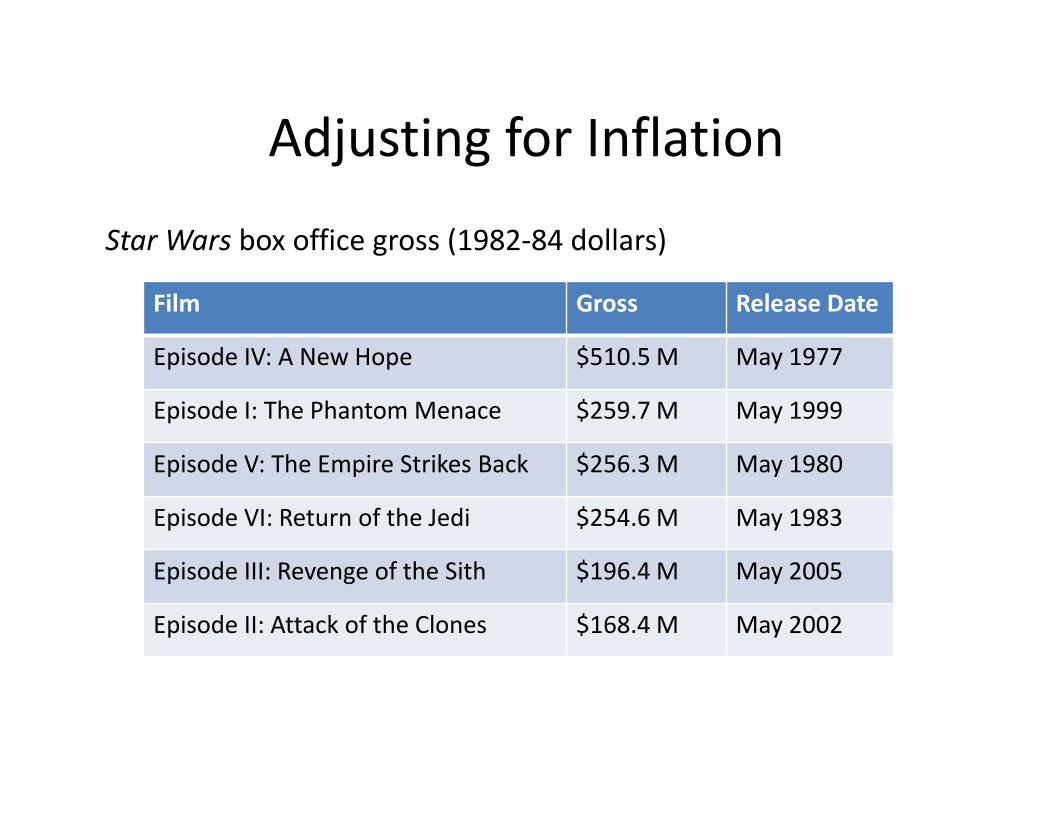
Adjusting for Inflation
Star Wars box office gross (1982-84 dollars)
Film Gross Release Date
Episode IV: A New Hope $510.5 M May 1977
Episode I: The Phantom Menace $259.7 M May 1999
Episode V: The Empire Strikes Back $256.3 M May 1980
Episode VI: Return of the Jedi $254.6 M May 1983
Episode III: Revenge of the Sith $196.4 M May 2005
Episode II: Attack of the Clones $168.4 M May 2002
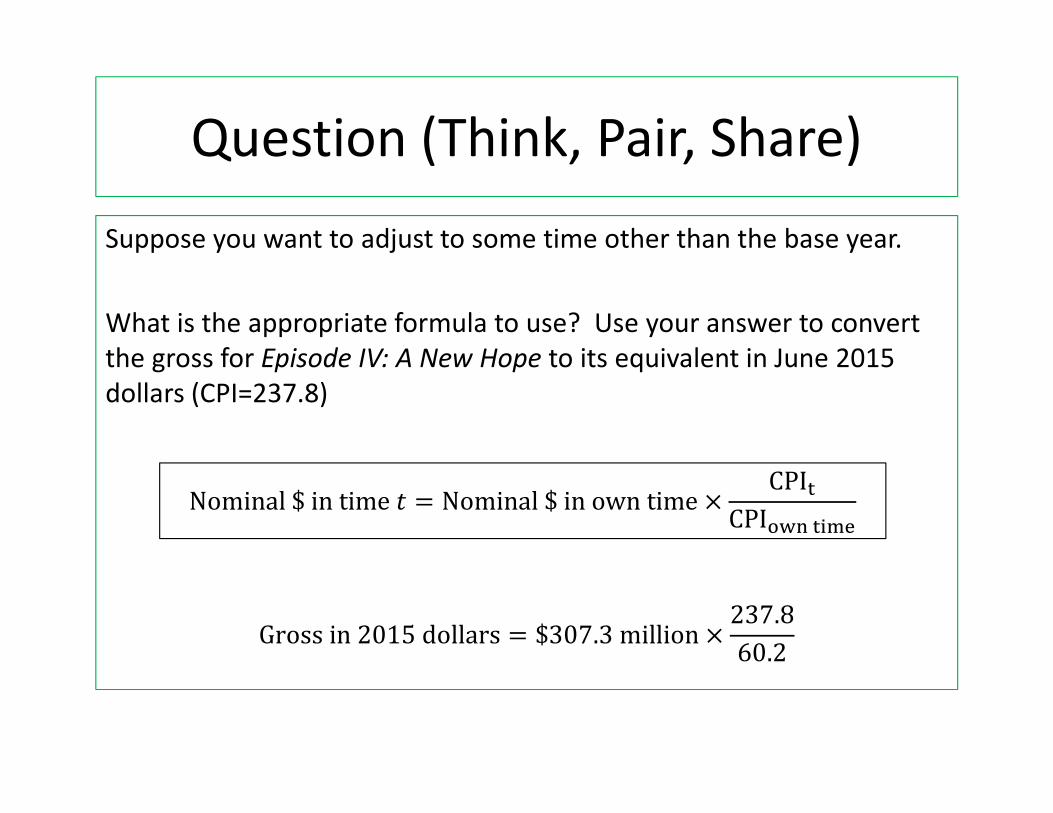
Question (Think, Pair, Share)
Suppose you want to adjust to some time other than the base year.
What is the appropriate formula to use? Use your answer to convert
the gross for Episode IV: A New Hope to its equivalent in June 2015
dollars (CPI=237.8)
Gross in 2015 dollars = $307.3 million ×237.8
60.2
Nominal $ in time = = Nominal $ in own time ×CPI.
CPI5?@ .4A2
Adjusting for Inflation
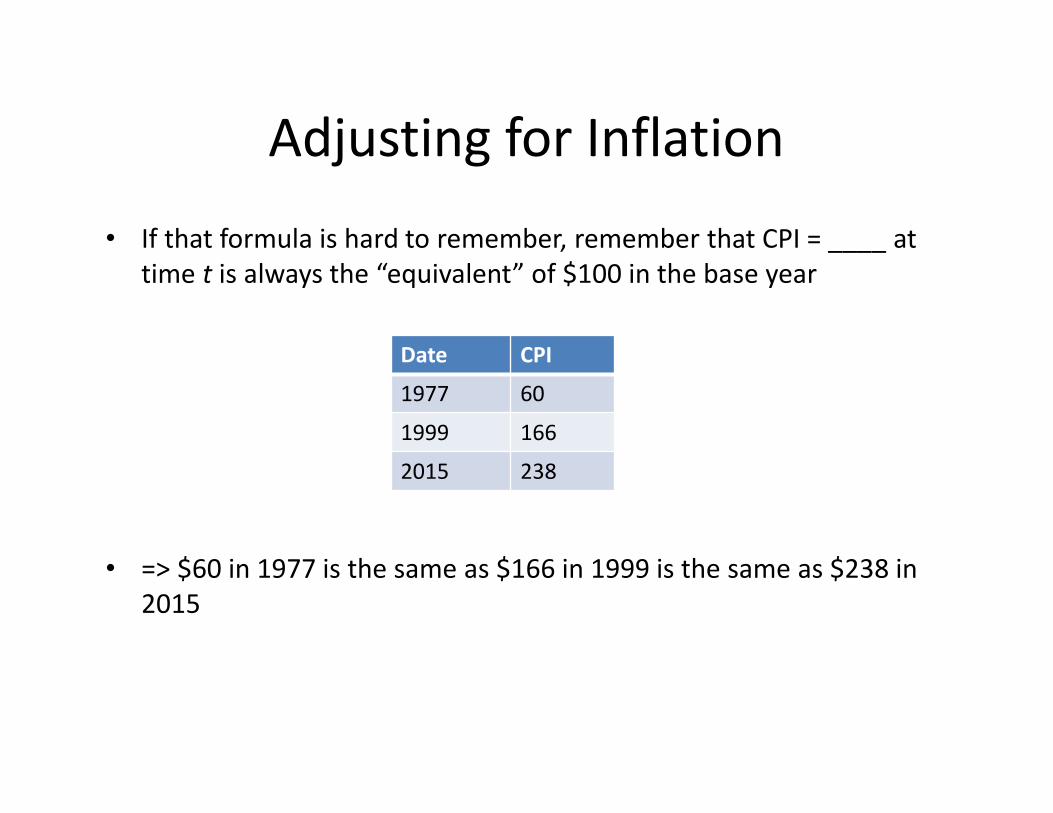
• If that formula is hard to remember, remember that CPI = ____ at
time t is always the “equivalent” of $100 in the base year
• => $60 in 1977 is the same as $166 in 1999 is the same as $238 in
2015
Date CPI
1977 60
1999 166
2015 238
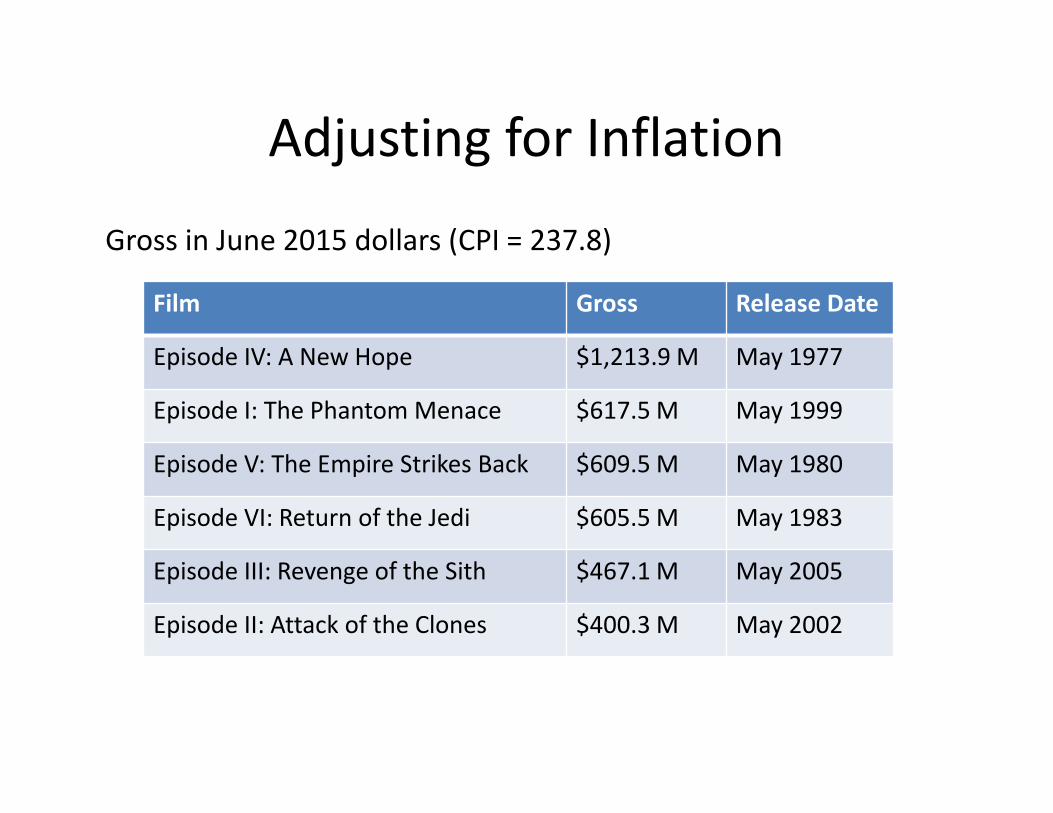
Adjusting for Inflation
Gross in June 2015 dollars (CPI = 237.8)
Film Gross Release Date
Episode IV: A New Hope $1,213.9 M May 1977
Episode I: The Phantom Menace $617.5 M May 1999
Episode V: The Empire Strikes Back $609.5 M May 1980
Episode VI: Return of the Jedi $605.5 M May 1983
Episode III: Revenge of the Sith $467.1 M May 2005
Episode II: Attack of the Clones $400.3 M May 2002
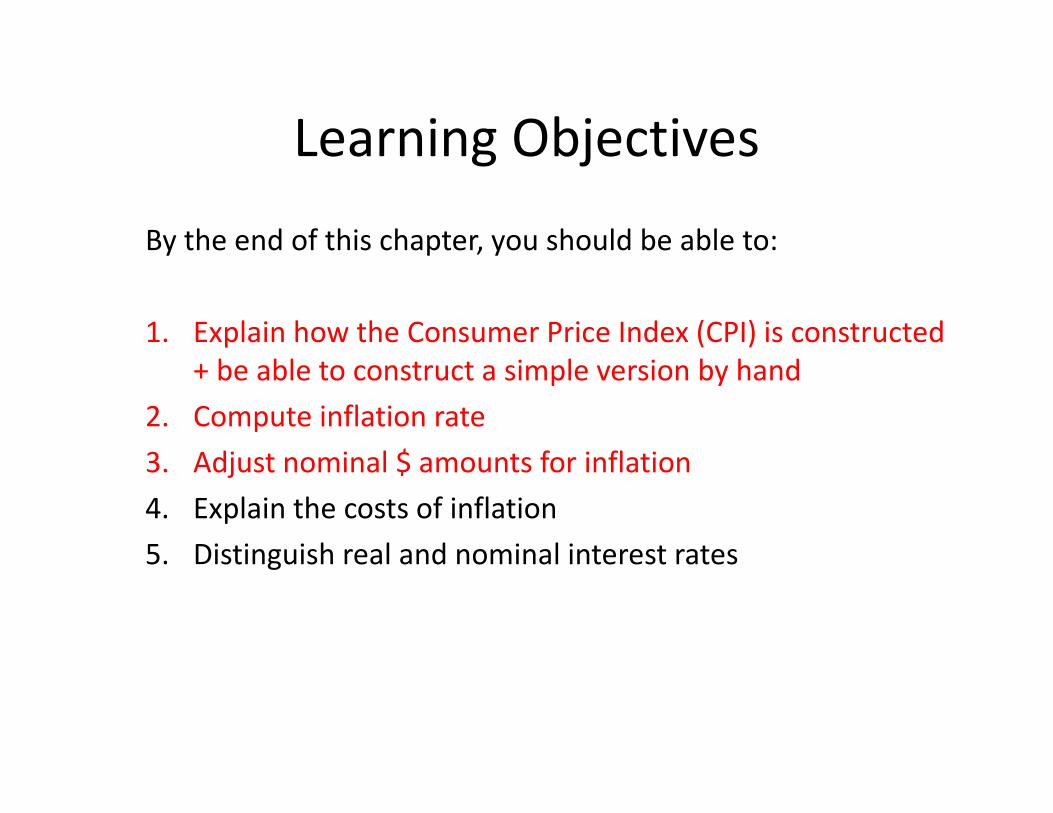
Learning Objectives
By the end of this chapter, you should be able to:
1. Explain how the Consumer Price Index (CPI) is constructed
+ be able to construct a simple version by hand
2. Compute inflation rate
3. Adjust nominal $ amounts for inflation
4. Explain the costs of inflation
5. Distinguish real and nominal interest rates
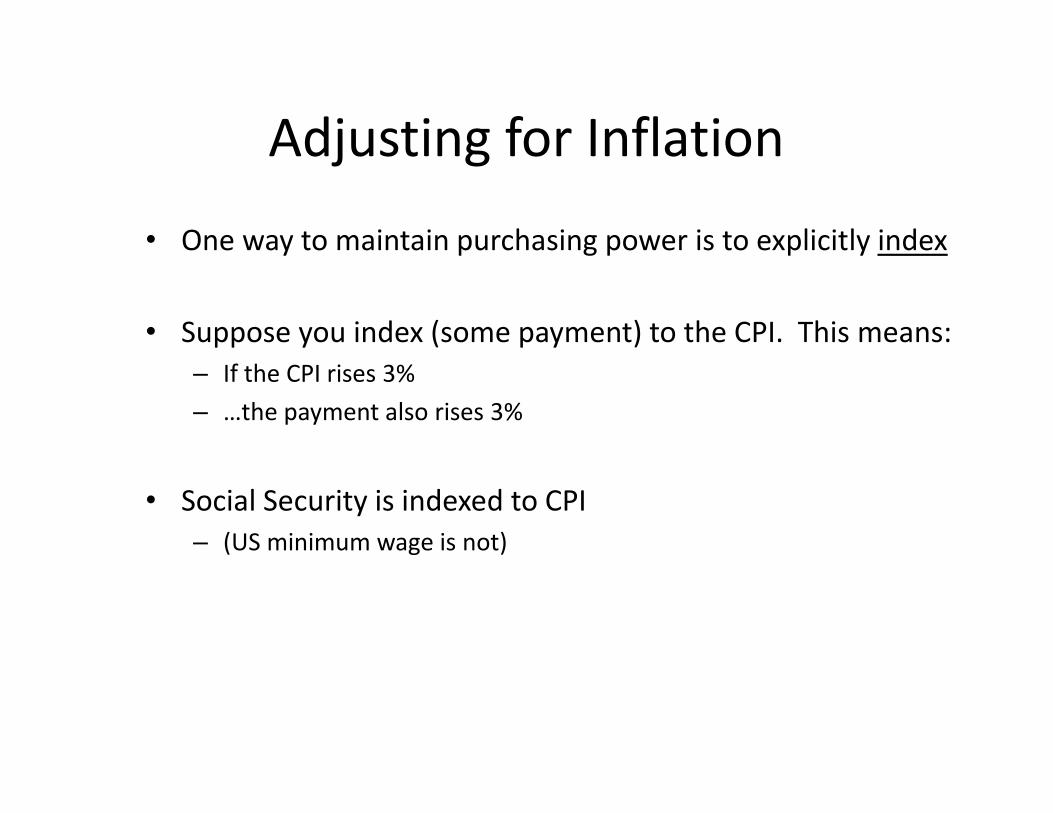
Adjusting for Inflation
• One way to maintain purchasing power is to explicitly index
• Suppose you index (some payment) to the CPI. This means:
– If the CPI rises 3%
– …the payment also rises 3%
• Social Security is indexed to CPI
– (US minimum wage is not)
Does CPI measure “true” inflation?
• We have put a lot of faith in our measure
• But does the CPI accurately measure “true” inflation?– (Does it systematically over/understate the extra $ needed to
maintain standard of living?)
• 1996 report concludes the CPI overstates inflation by 1 to 2 percentage points per year (why?)
Two important reasons:
1. Quality improvements
2. Fixed basket
Does CPI measure “true” inflation?
Issue 1: Quality adjustment bias
• Many products improve over time, but price increases from
quality get treated the same as pure inflation
– iPhone 6 vs. iPhone 5
• Hard to adjust CPI for this in practice
– Further complicated by introduction of new goods
(no exact base year comparison)
Does CPI measure “true” inflation?
Issue 2: Substitution bias
• CPI uses a fixed basket of goods and services
• In reality, people can substitute away from goods that
become more expensive
• (Book has numeric example, pp.449-450)
Costs of Inflation
• Higher prices themselves are not viewed as a true cost of
inflation
• If prices doubled overnight, but so did all other $ amounts
(e.g. your pay, your bank account), nobody is any worse off
• In reality, things do not all adjust instantly with prices. This
gives rise to the remaining items that are “true” costs.
Costs of Inflation
1. Noise in the price system
2. Distortions of the tax system
3. Shoe-leather + Menu costs
4. Unexpected redistribution of wealth
5. Interference with long-term planning
Costs of Inflation
Issue 1: Noise in the Price System
• Economic agents respond to prices
• When inflation is high, it becomes harder to tell if a price
increase is just inflation or something more meaningful
Issue 2: Distortions of the Tax System
• Some tax codes set in nominal terms
• => Inflation distorts resulting incentives to work, save, and
invest
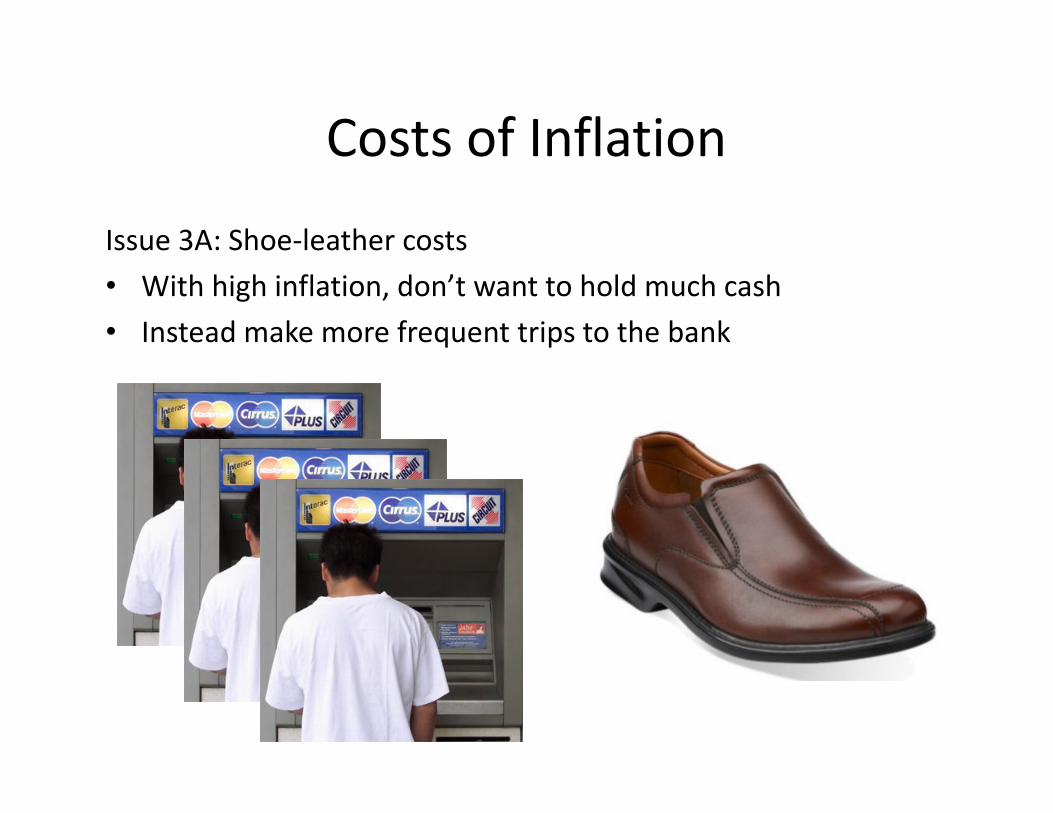
Costs of Inflation
Issue 3A: Shoe-leather costs
• With high inflation, don’t want to hold much cash
• Instead make more frequent trips to the bank
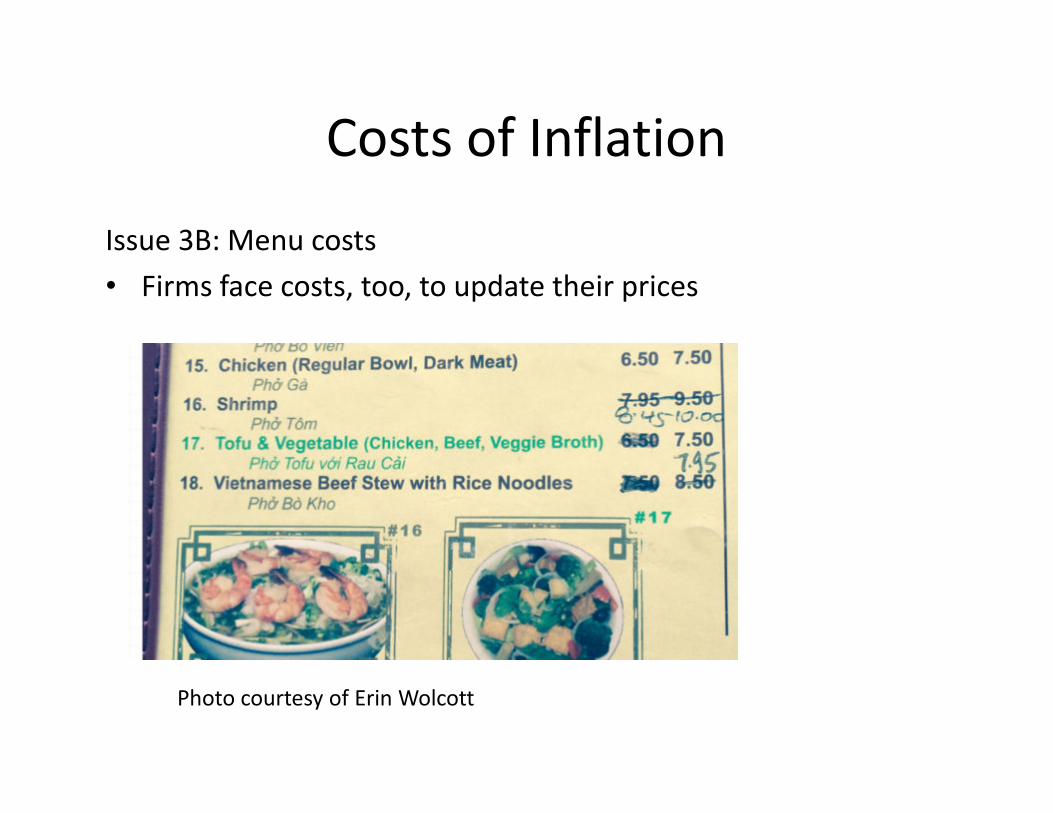
Costs of Inflation
Issue 3B: Menu costs
• Firms face costs, too, to update their prices
Photo courtesy of Erin Wolcott
Costs of Inflation
• “Shoe-leather” and “Menu” are figurative names
– Not literally just the cost of new shoes and new menus
• Includes time/effort costs in general
Costs of Inflation
Issue 4: Unexpected redistributions of wealth
• People often enter into agreements with nominal $ terms
• If prices change unexpectedly during this period (esp. multi-
year agreements)
– One party may “gain”
– While the other “loses”
• Examples:
a) Wage contracts
b) Loans
Costs of Inflation
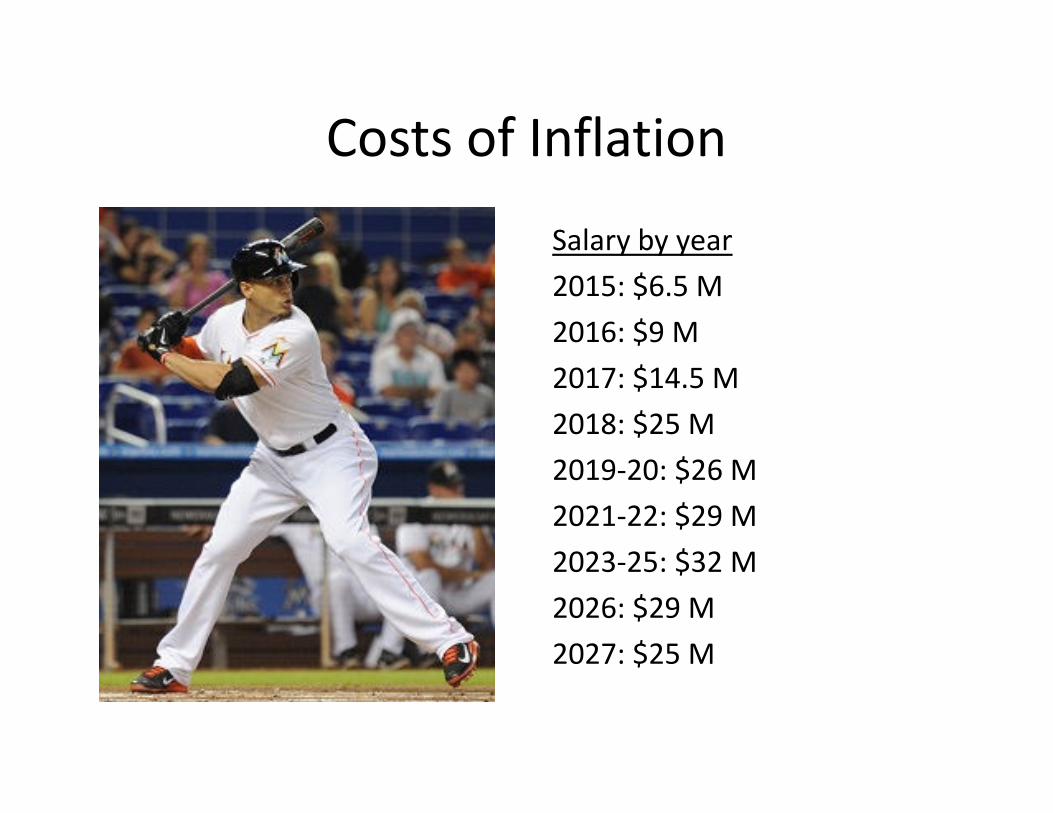
Salary by year
2015: $6.5 M
2016: $9 M
2017: $14.5 M
2018: $25 M
2019-20: $26 M
2021-22: $29 M
2023-25: $32 M
2026: $29 M
2027: $25 M

Costs of Inflation
He expected inflation to be
2% per year, when signing in
2014
If so, his salary in the last year
(2027) is worth $19.3 M in
2014 dollars

Costs of Inflation
Instead, inflation is actually
10% per year
Now his salary in the last year
(2027) is only $7.2 M in 2014
dollars
(“only”)
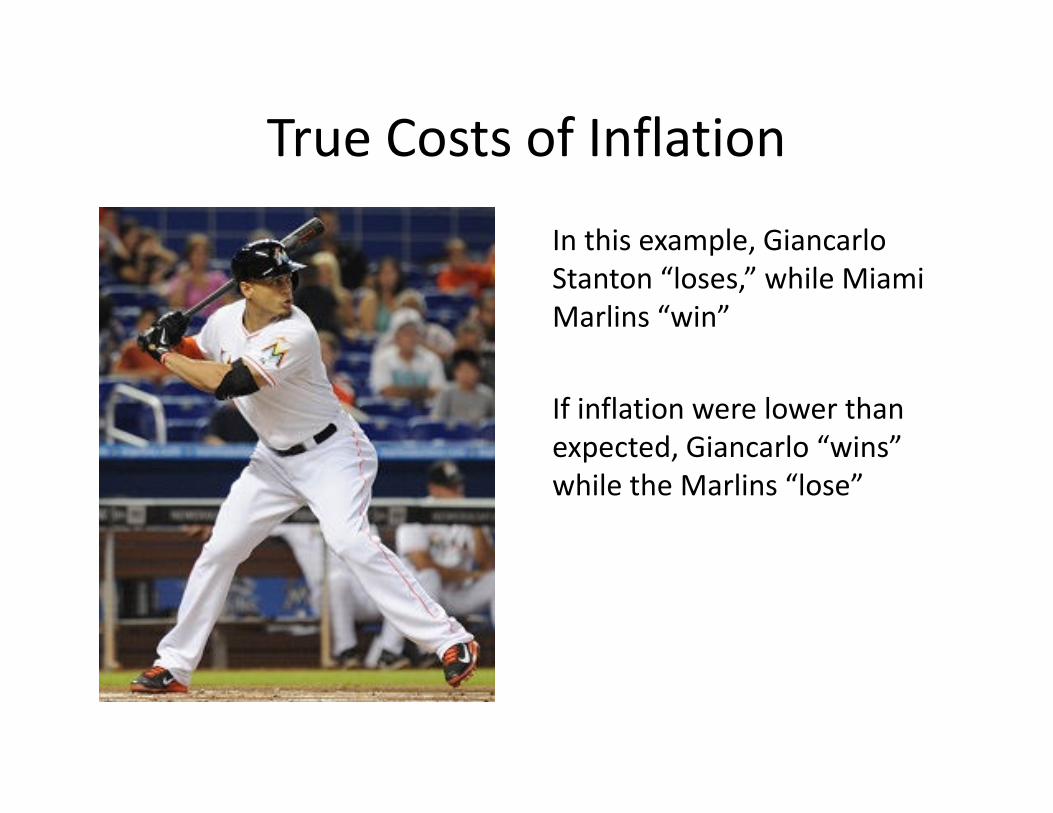
True Costs of Inflation
In this example, Giancarlo
Stanton “loses,” while Miami
Marlins “win”
If inflation were lower than
expected, Giancarlo “wins”
while the Marlins “lose”
Costs of Inflation
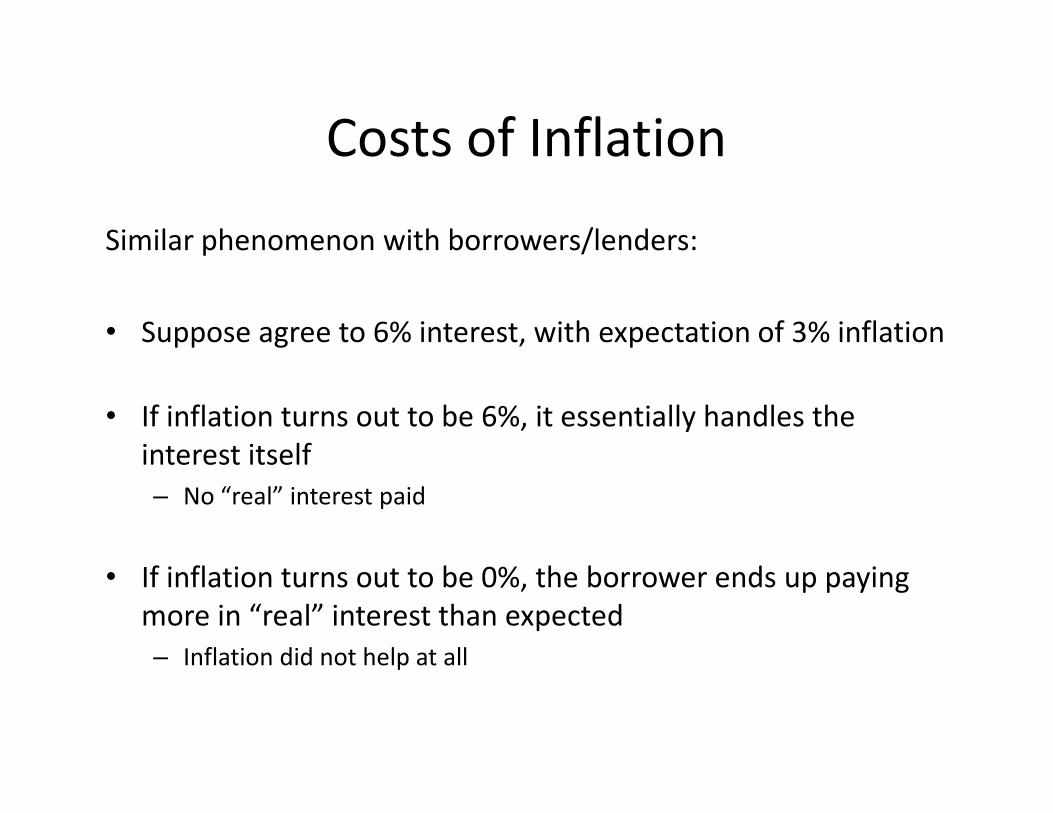
Similar phenomenon with borrowers/lenders:
• Suppose agree to 6% interest, with expectation of 3% inflation
• If inflation turns out to be 6%, it essentially handles the
interest itself
– No “real” interest paid
• If inflation turns out to be 0%, the borrower ends up paying
more in “real” interest than expected
– Inflation did not help at all
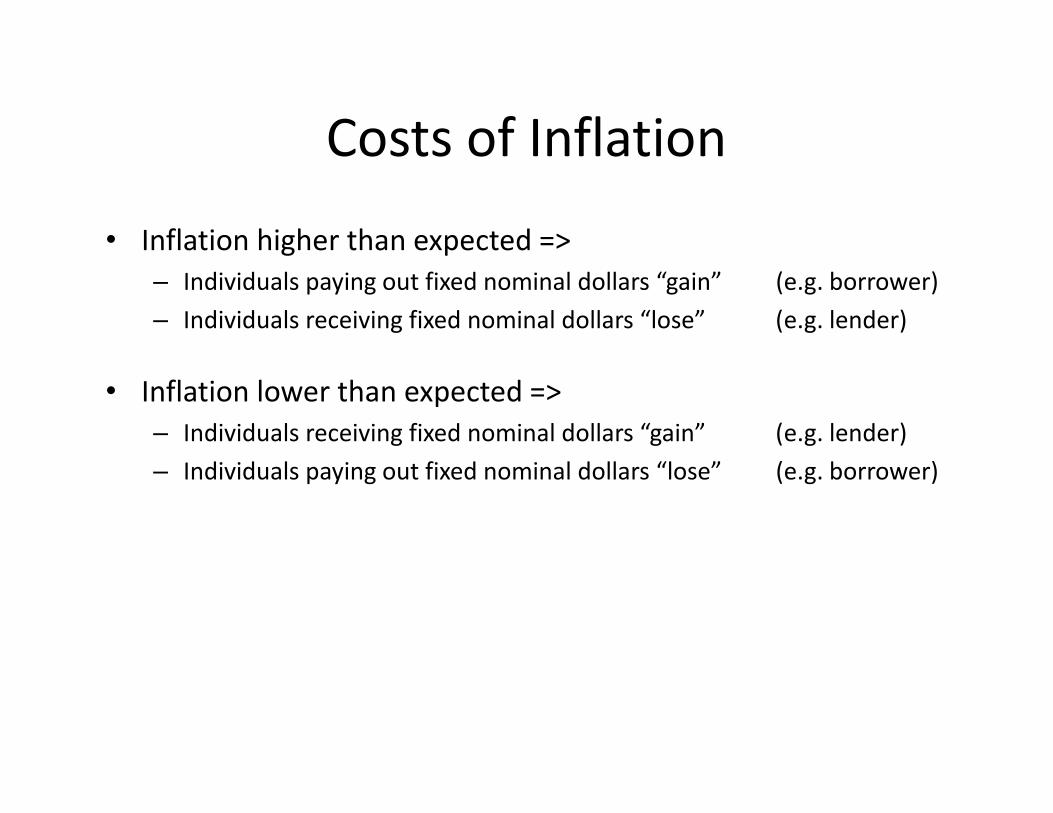
Costs of Inflation
• Inflation higher than expected =>
– Individuals paying out fixed nominal dollars “gain” (e.g. borrower)
– Individuals receiving fixed nominal dollars “lose” (e.g. lender)
• Inflation lower than expected =>
– Individuals receiving fixed nominal dollars “gain” (e.g. lender)
– Individuals paying out fixed nominal dollars “lose” (e.g. borrower)
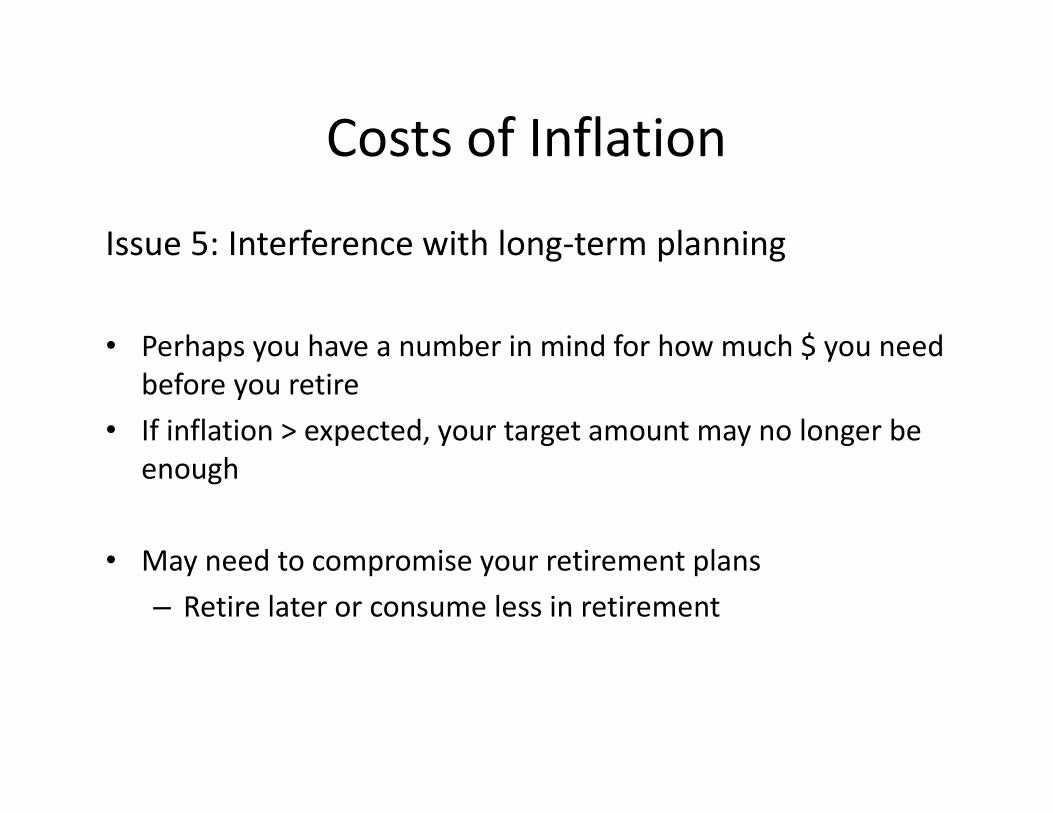
Costs of Inflation
Issue 5: Interference with long-term planning
• Perhaps you have a number in mind for how much $ you need
before you retire
• If inflation > expected, your target amount may no longer be
enough
• May need to compromise your retirement plans
– Retire later or consume less in retirement
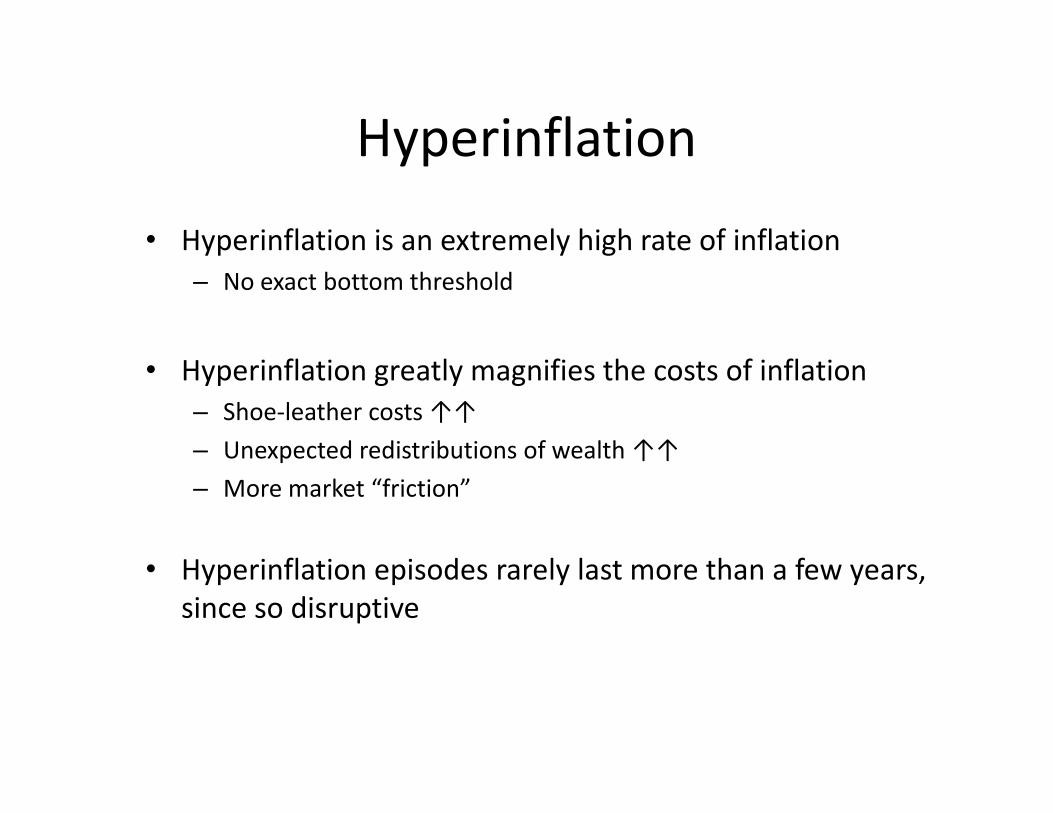
Hyperinflation
• Hyperinflation is an extremely high rate of inflation
– No exact bottom threshold
• Hyperinflation greatly magnifies the costs of inflation
– Shoe-leather costs ↑↑
– Unexpected redistributions of wealth ↑↑
– More market “friction”
• Hyperinflation episodes rarely last more than a few years,
since so disruptive
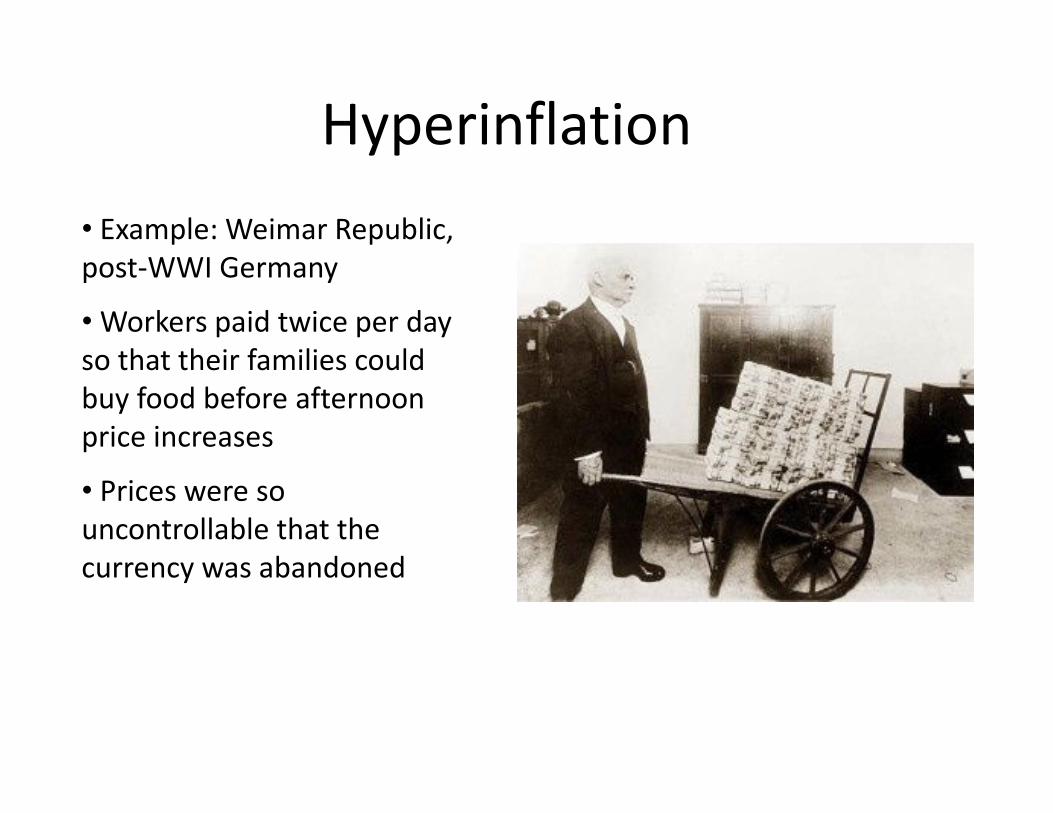
Hyperinflation
• Example: Weimar Republic,
post-WWI Germany
• Workers paid twice per day
so that their families could
buy food before afternoon
price increases
• Prices were so
uncontrollable that the
currency was abandoned
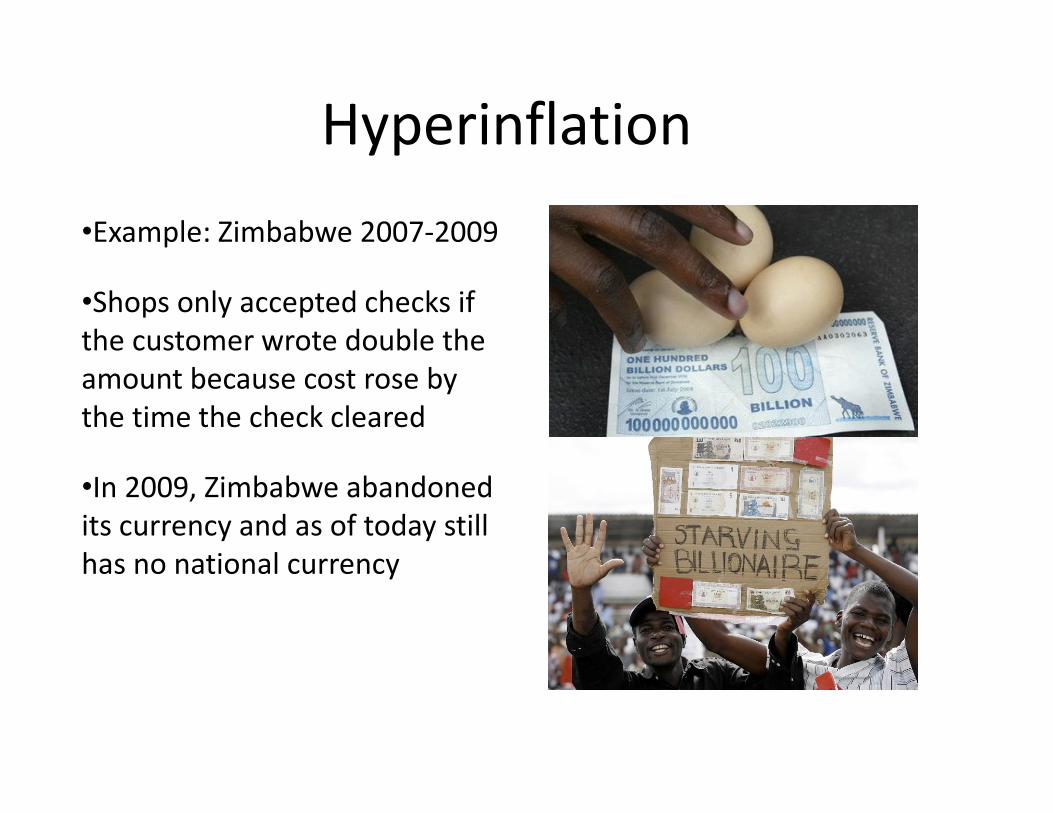
Hyperinflation
•Example: Zimbabwe 2007-2009
•Shops only accepted checks if
the customer wrote double the
amount because cost rose by
the time the check cleared
•In 2009, Zimbabwe abandoned
its currency and as of today still
has no national currency
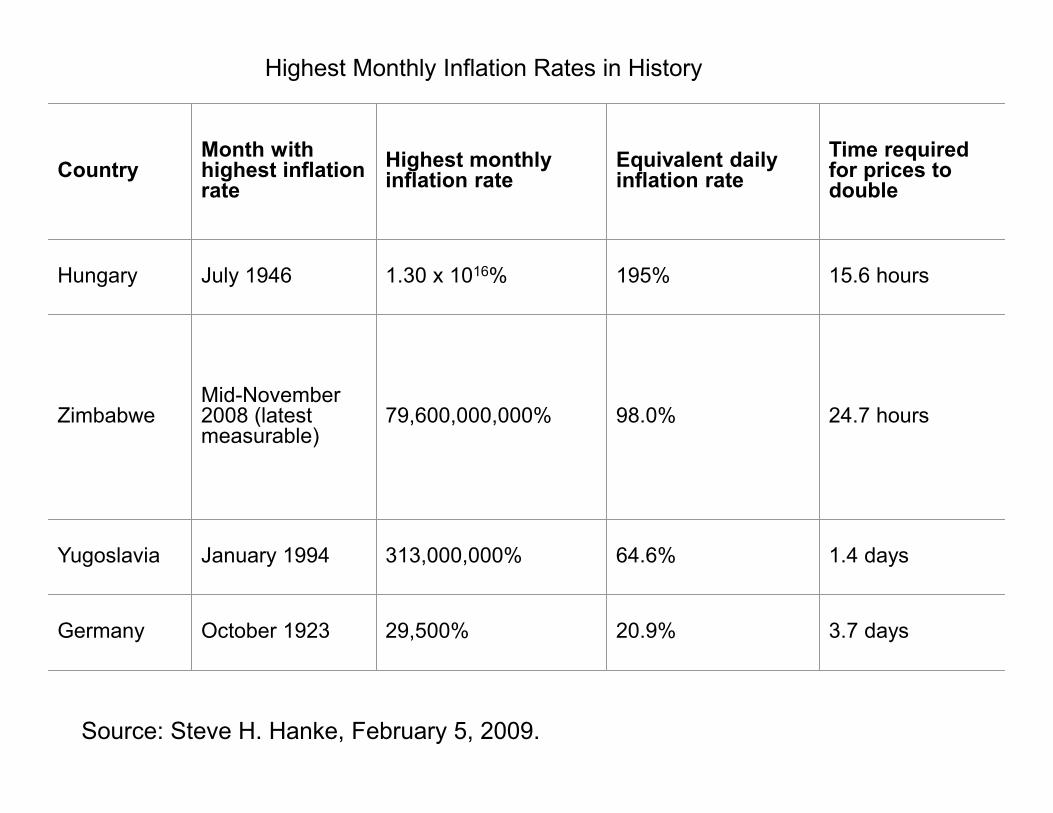
Highest Monthly Inflation Rates in History
CountryMonth with highest inflation rate
Highest monthly inflation rate
Equivalent daily inflation rate
Time required for prices to double
Hungary July 1946 1.30 x 10¹⁶% 195% 15.6 hours
ZimbabweMid-November 2008 (latest measurable)
79,600,000,000% 98.0% 24.7 hours
Yugoslavia January 1994 313,000,000% 64.6% 1.4 days
Germany October 1923 29,500% 20.9% 3.7 days
Source: Steve H. Hanke, February 5, 2009.
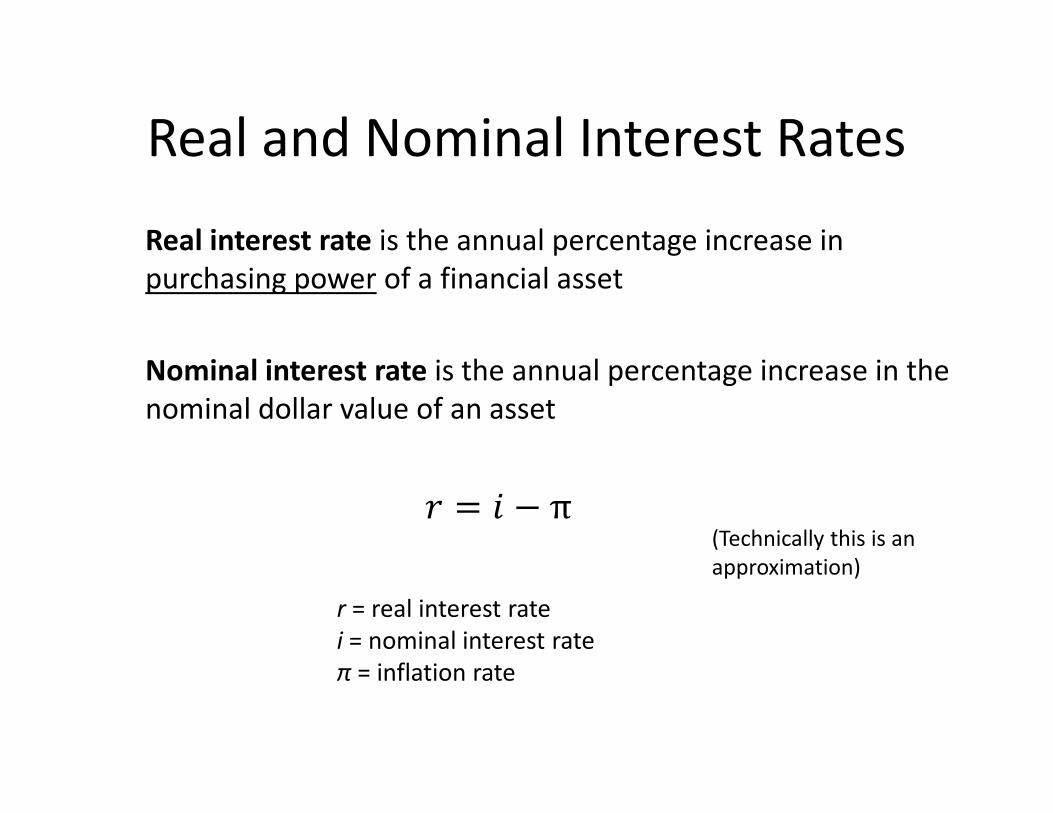
Real and Nominal Interest Rates
Real interest rate is the annual percentage increase in
purchasing power of a financial asset
Nominal interest rate is the annual percentage increase in the
nominal dollar value of an asset
B = C − π
r = real interest rate
i = nominal interest rate
π = inflation rate
(Technically this is an
approximation)
LO 17 - 5
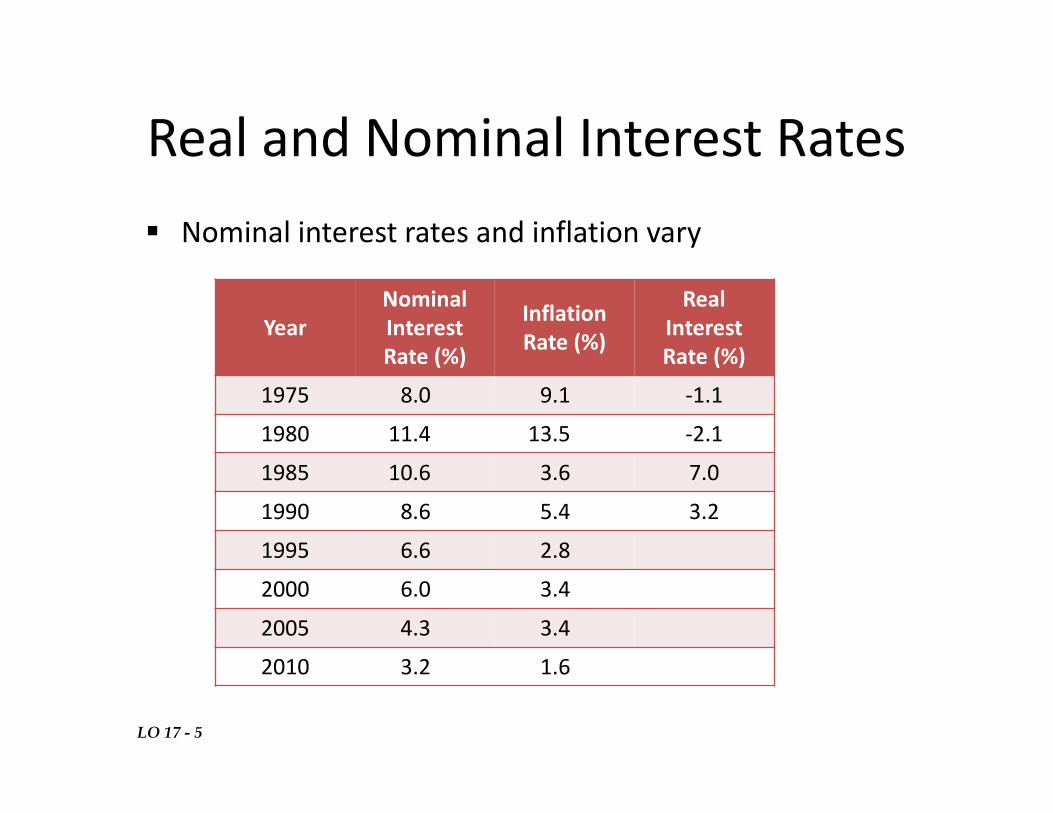
Real and Nominal Interest Rates
� Nominal interest rates and inflation vary
Year
Nominal
Interest
Rate (%)
Inflation
Rate (%)
Real
Interest
Rate (%)
1975 8.0 9.1 -1.1
1980 11.4 13.5 -2.1
1985 10.6 3.6 7.0
1990 8.6 5.4 3.2
1995 6.6 2.8
2000 6.0 3.4
2005 4.3 3.4
2010 3.2 1.6
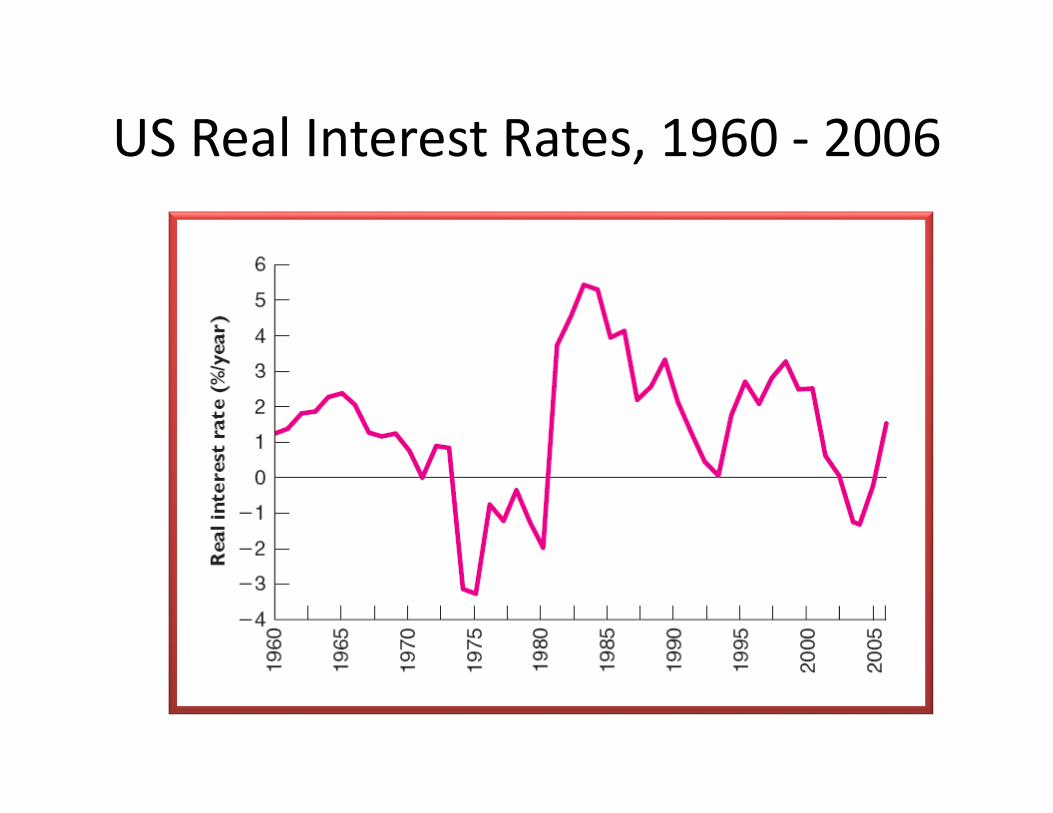
US Real Interest Rates, 1960 - 2006
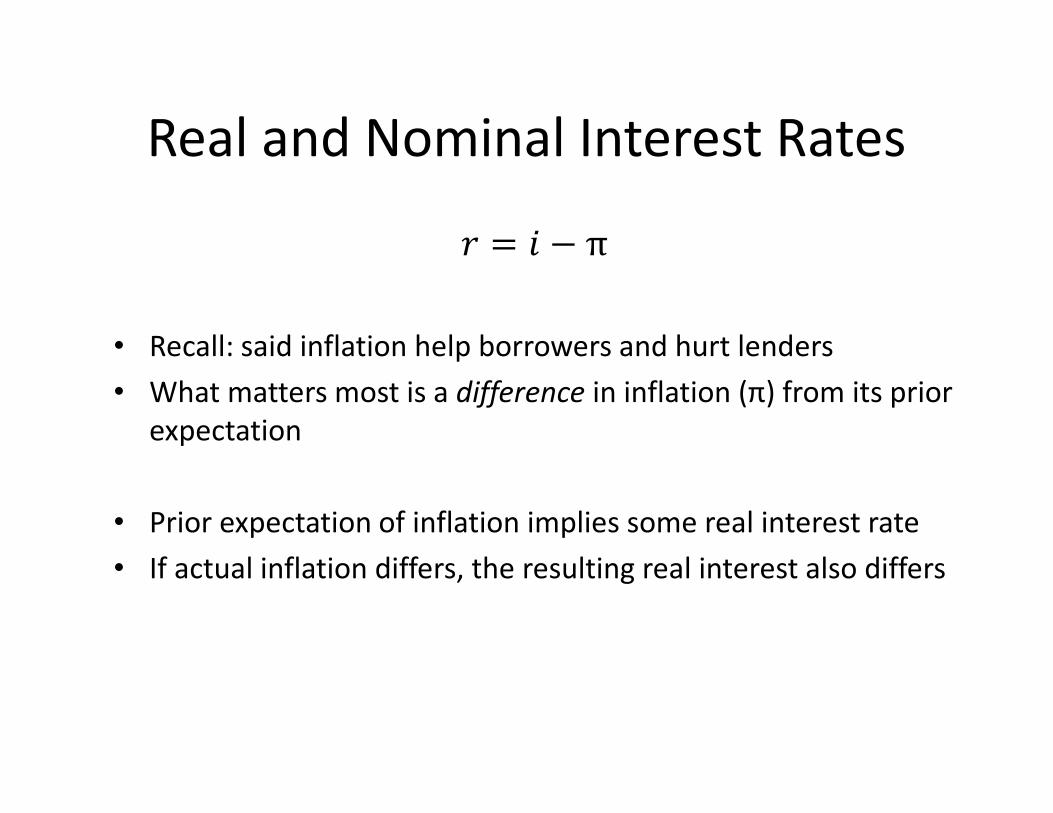
Real and Nominal Interest Rates
B = C − π
• Recall: said inflation help borrowers and hurt lenders
• What matters most is a difference in inflation (π) from its prior
expectation
• Prior expectation of inflation implies some real interest rate
• If actual inflation differs, the resulting real interest also differs
Real and Nominal Interest Rates
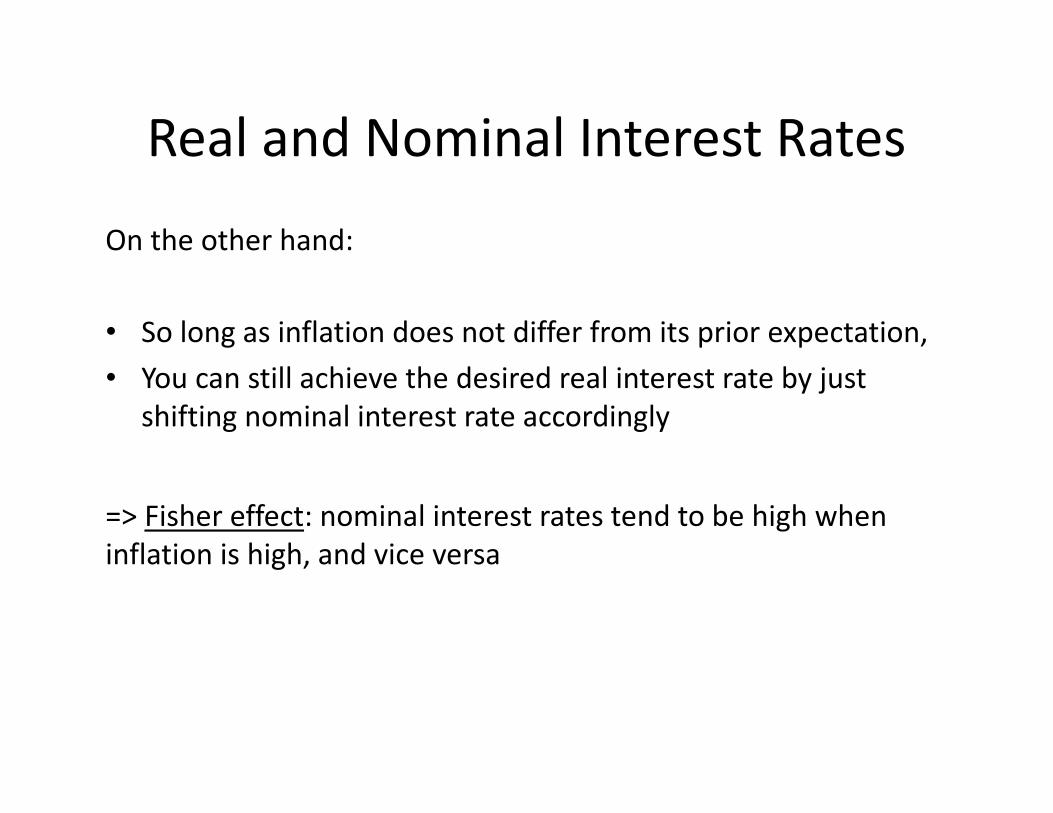
On the other hand:
• So long as inflation does not differ from its prior expectation,
• You can still achieve the desired real interest rate by just
shifting nominal interest rate accordingly
=> Fisher effect: nominal interest rates tend to be high when
inflation is high, and vice versa
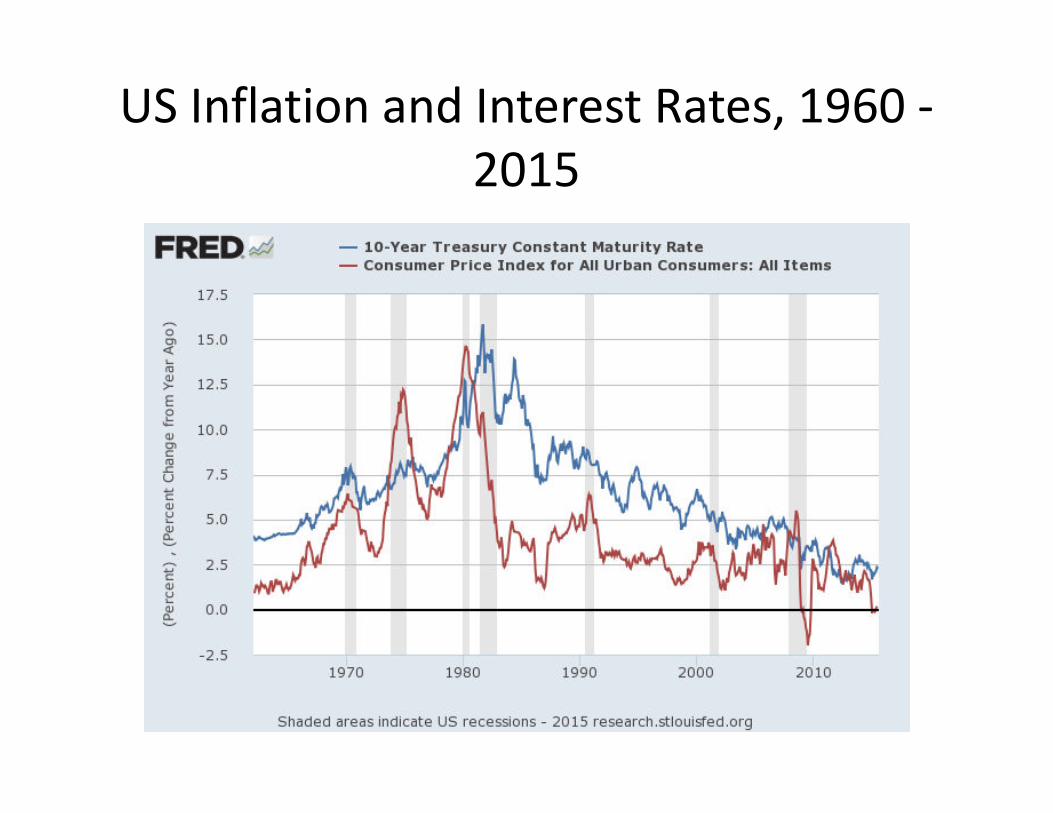
US Inflation and Interest Rates, 1960 -
2015
Real and Nominal Interest Rates
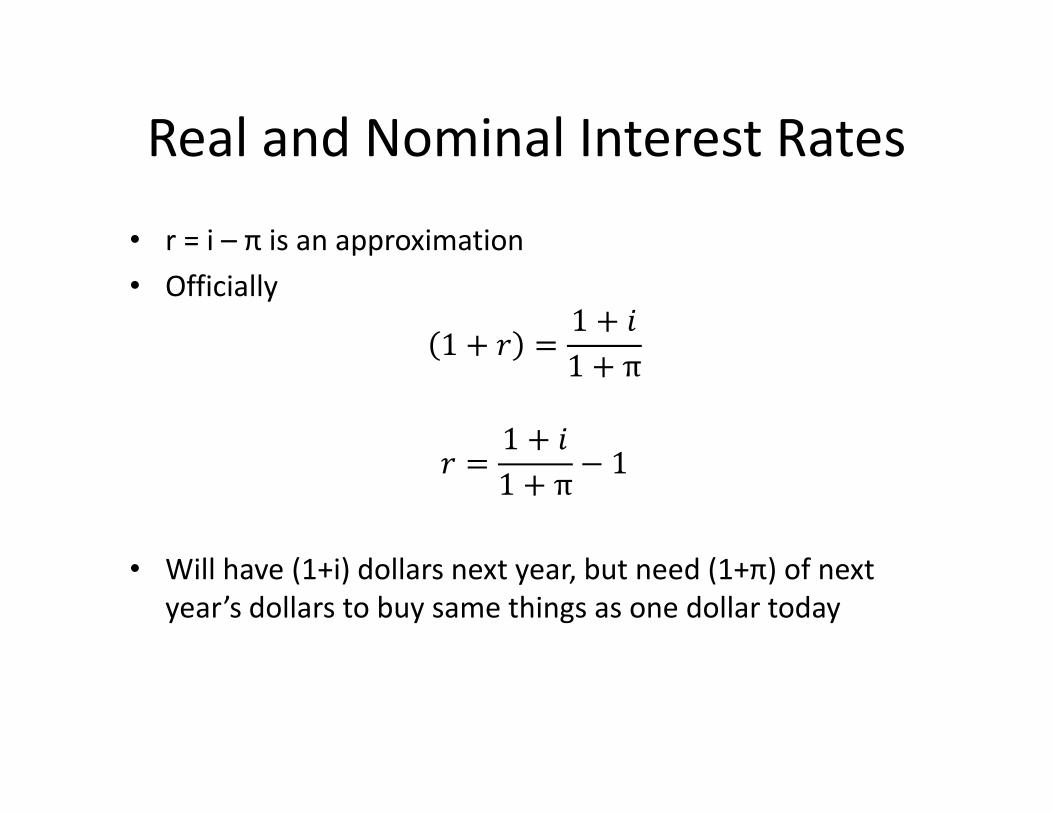
• r = i – π is an approximation
• Officially
1 + B =1 + C
1 + π
B =1 + C
1 + π− 1
• Will have (1+i) dollars next year, but need (1+π) of next
year’s dollars to buy same things as one dollar today
Real and Nominal Interest Rates
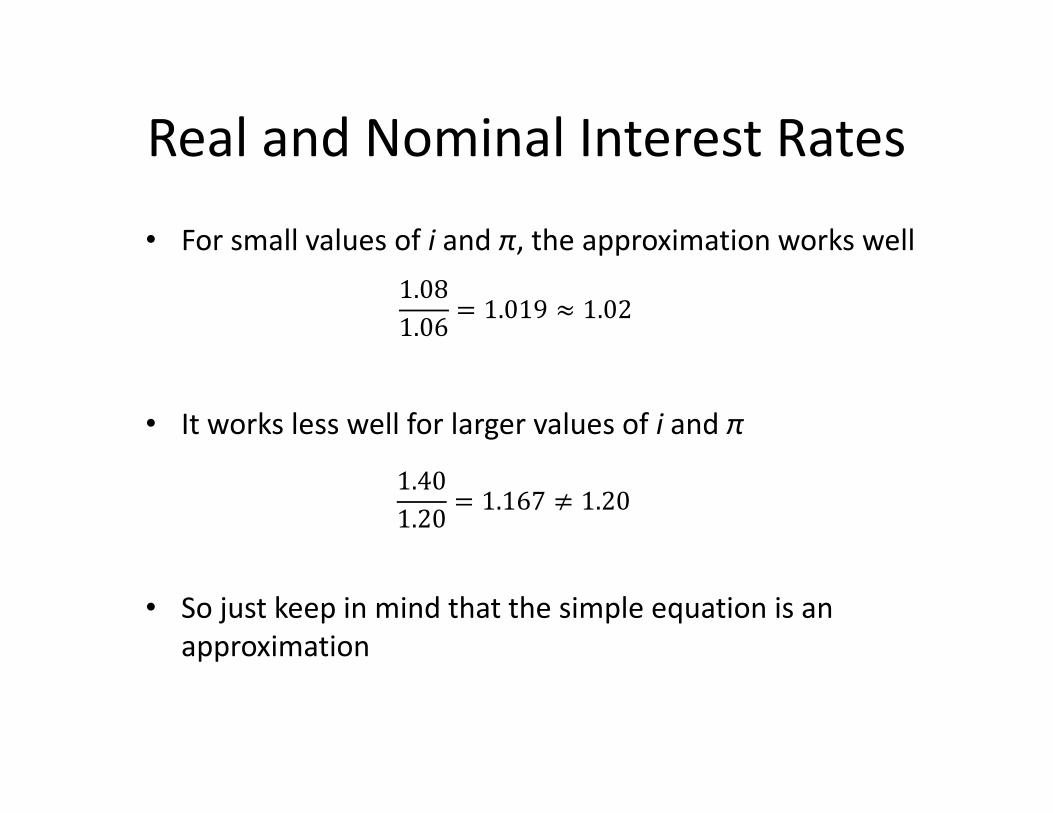
• For small values of i and π, the approximation works well
• It works less well for larger values of i and π
• So just keep in mind that the simple equation is an
approximation
1.08
1.06= 1.019 ≈ 1.02
1.40
1.20= 1.167 ≠ 1.20
Learning Objectives
By the end of this chapter, you should be able to:
1. Explain how the Consumer Price Index (CPI) is constructed
+ be able to construct a simple version by hand
2. Compute inflation rate
3. Adjust nominal $ amounts for inflation
4. Explain the costs of inflation
5. Distinguish real and nominal interest rates
What’s wrong with too much
?
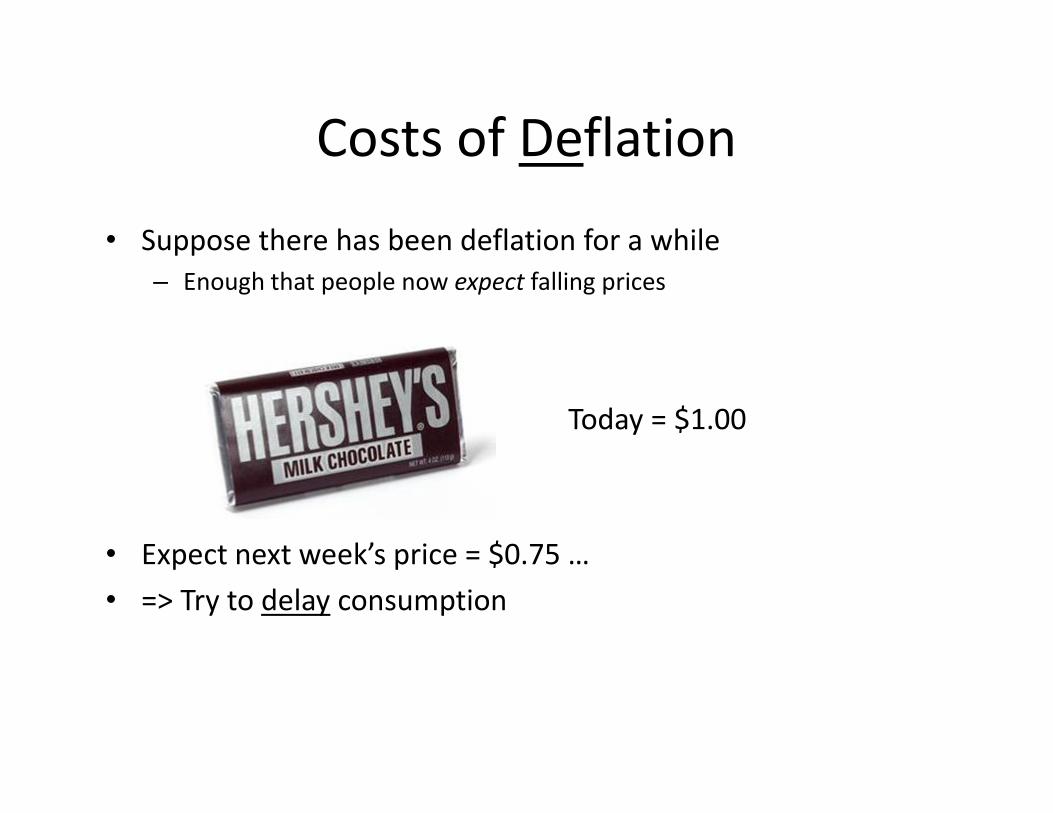
Costs of Deflation
• Suppose there has been deflation for a while
– Enough that people now expect falling prices
• Expect next week’s price = $0.75 …
• => Try to delay consumption
Today = $1.00
Costs of Deflation
(continuing from previous)
• But you are not alone in this decision
• Your neighbor faces the same choice, and likely also tries to
delay consumption
• => With enough people delaying consumption…
Current demand is weak
Costs of Deflation
(continuing from previous)
• Firms will respond to weak demand
• Cut back production
• Note: rare to see nominal wages decrease
• If cannot cut wages… firms may lay off workers instead
Costs of Deflation
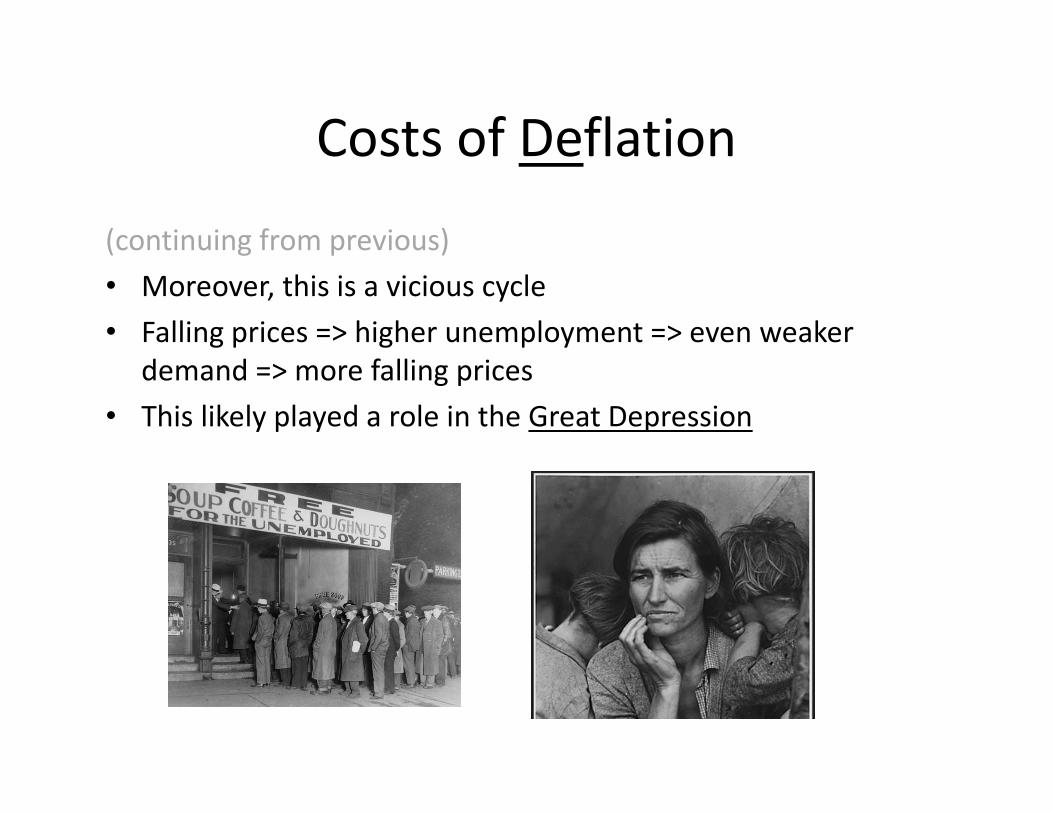
(continuing from previous)
• Moreover, this is a vicious cycle
• Falling prices => higher unemployment => even weaker
demand => more falling prices
• This likely played a role in the Great Depression
Costs of Deflation
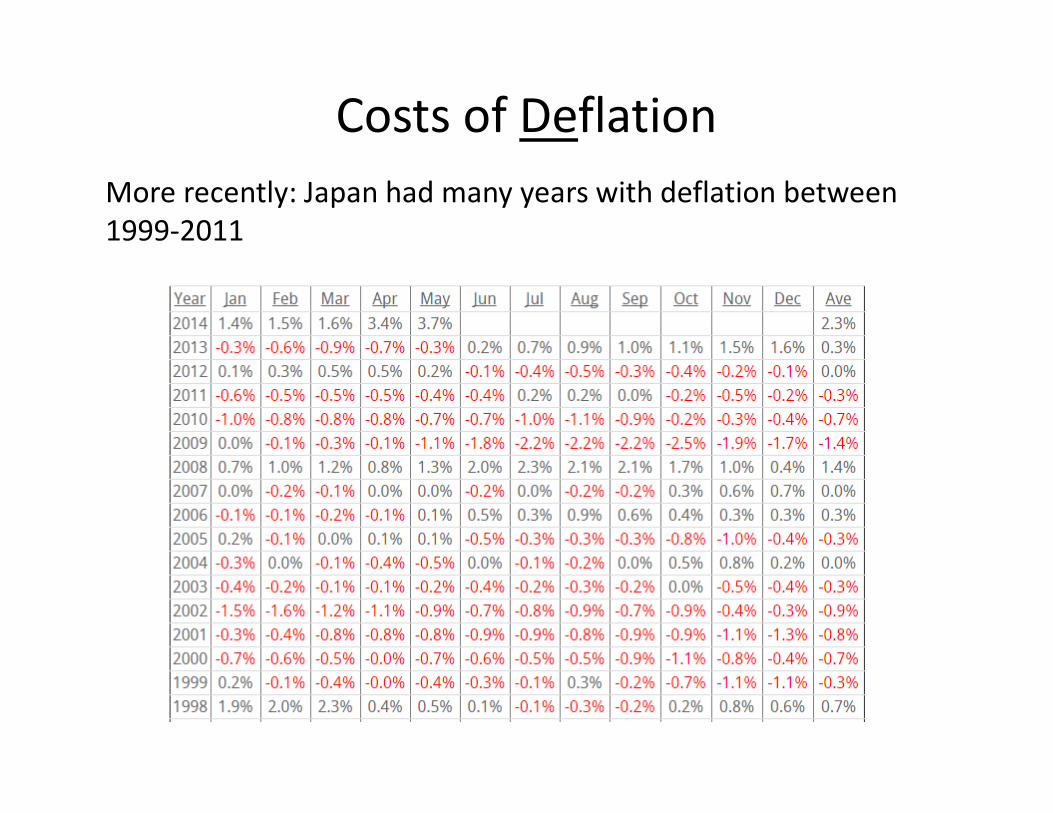
More recently: Japan had many years with deflation between
1999-2011
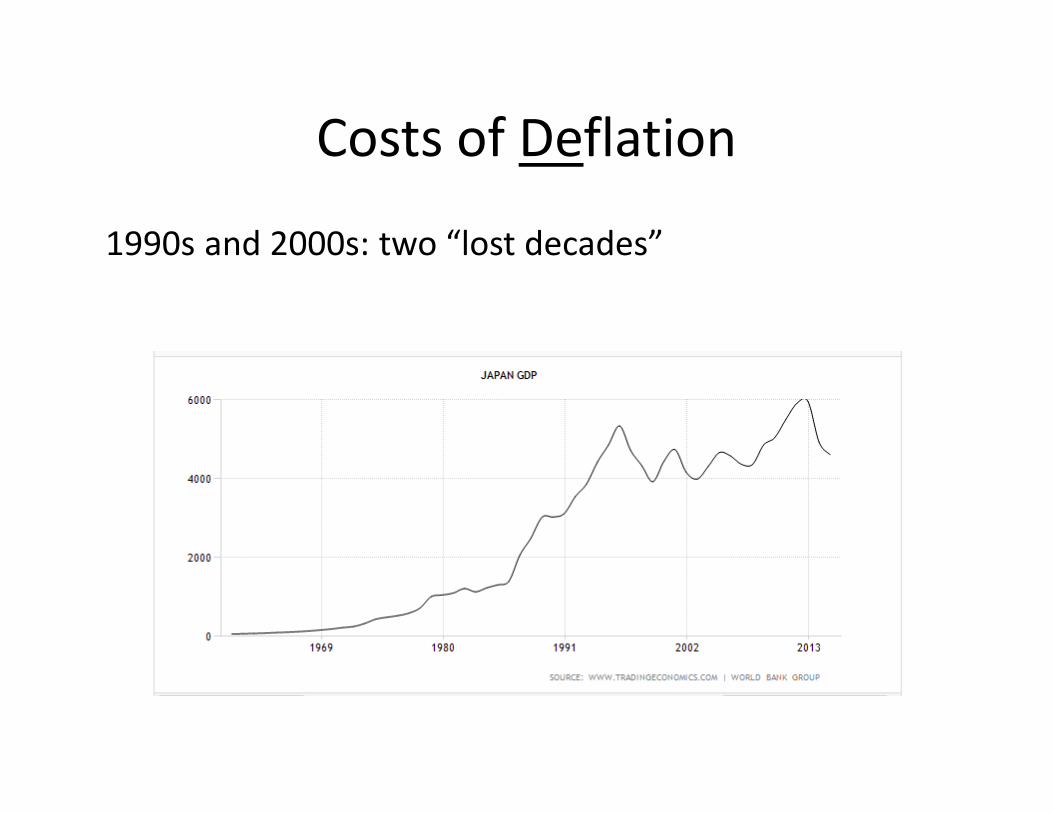
Costs of Deflation
1990s and 2000s: two “lost decades”