portfolio compass - wealth management firm in denver,...
TRANSCRIPT
PORTFOL IO COMPASS
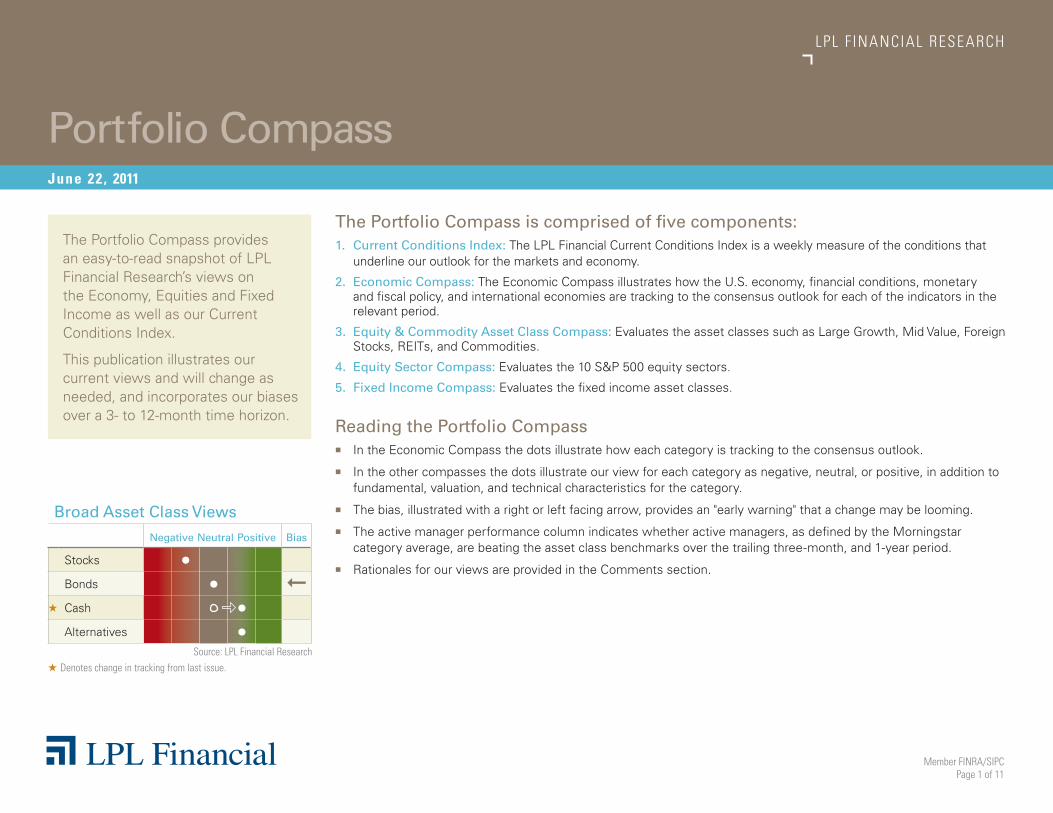
Broad Asset Class Views
Negative Neutral Positive Bias
Stocks •Bonds •
➞
★ Cash •Alternatives •
RESEARCH
June 22 , 2011
LPL F INANCIAL RESEARCH
Member FINRA/SIPCPage 1 of 11
Source: LPL Financial Research★ Denotes change in tracking from last issue.
The Portfolio Compass is comprised of five components:1. Current Conditions Index: The LPL Financial Current Conditions Index is a weekly measure of the conditions that
underline our outlook for the markets and economy.
2. Economic Compass: The Economic Compass illustrates how the U.S. economy, financial conditions, monetary and fiscal policy, and international economies are tracking to the consensus outlook for each of the indicators in the relevant period.
3. Equity & Commodity Asset Class Compass: Evaluates the asset classes such as Large Growth, Mid Value, Foreign Stocks, REITs, and Commodities.
4. Equity Sector Compass: Evaluates the 10 S&P 500 equity sectors.
5. Fixed Income Compass: Evaluates the fixed income asset classes.
Reading the Portfolio Compass � In the Economic Compass the dots illustrate how each category is tracking to the consensus outlook.
� In the other compasses the dots illustrate our view for each category as negative, neutral, or positive, in addition to fundamental, valuation, and technical characteristics for the category.
� The bias, illustrated with a right or left facing arrow, provides an "early warning" that a change may be looming.
� The active manager performance column indicates whether active managers, as defined by the Morningstar category average, are beating the asset class benchmarks over the trailing three-month, and 1-year period.
� Rationales for our views are provided in the Comments section.
The Portfolio Compass provides an easy-to-read snapshot of LPL Financial Research’s views on the Economy, Equities and Fixed Income as well as our Current Conditions Index.
This publication illustrates our current views and will change as needed, and incorporates our biases over a 3- to 12-month time horizon.
Portfolio Compass

Page 2 of 11
CURRENT CONDIT IONS INDEX
Current Conditions Index June 22, 2011
Over the past week, the LPL Financial Current Conditions Index fell to 213, a level not seen since August 2010 when the summer economic soft spot had emerged. The level of the CCI indicates an environment fostering growth in the economy and markets.
The growth momentum in the index has stalled as the economy transitions from strong recovery to uneven, modest growth. Over the past year, the index has been flat. Seven of the 10 CCI components have turned down over the past quarter, and four of the 10 over the past year.
Most components of the CCI point to an environment of slowing growth momentum over the past 13- and 52-weeks. In the past week, Commodity prices softened and market volatility rose boosting the VIX. While Business Lending remains on an uptrend, Shipping Traffic has slowed to a mere 3% year-over-year gain, one the weakest readings since the year-over-year growth in shipping began in January of 2010. The weakness in Shipping Traffic is concentrated in auto shipments and bulk commodities.
Nov
08
Sep
08
Jul 0
8
May
08
Nov
09
Sep
09
Jul 0
9
May
09
Mar
09
Jan
09
Jan
11
Nov
10
Sep
10
Jul 1
0
May
10
Mar
10
Jan
10
Mar
11
May
11
Mar
08
Jan
08
300
200
100
0
-100
-200
Strong Growth
Growth
Contraction
Crisis
Slow Growth
Source: LPL Financial 06/22/11
Nov
08
Sep
08
Jul 0
8
May
08
Nov
09
Sep
09
Jul 0
9
May
09
Mar
09
Jan
09
Jan
11
Nov
10
Sep
10
Jul 1
0
May
10
Mar
10
Jan
10
Mar
11
May
11
Mar
08
Jan
08
300
200
100
0
-100
-200
-300
13-Week Change52-Week Change
Source: LPL Financial 06/22/11
LPL Financial Research CCI Growth Momentum
How are the Components Affecting the Index Right Now?
LPL Financial Research Current Conditions Index
Source: LPL Financial 06/22/11
LPL Financial Research CCI Components
Mortgage Applications
Retail Sales
Commodities
Initial Jobless Claims
VIX Index
Money Market Fund AssetsShipping Traffic
Fed Spread
Business Lending
BAA Spreads
Crisis Contraction Slow Growth Growth Strong
Growth
-500 -250 0 250 500
13-Week Change52-Week Change
Page 3 of 11
ECONOMIC COMPASS
Economic Compass June 22, 2011
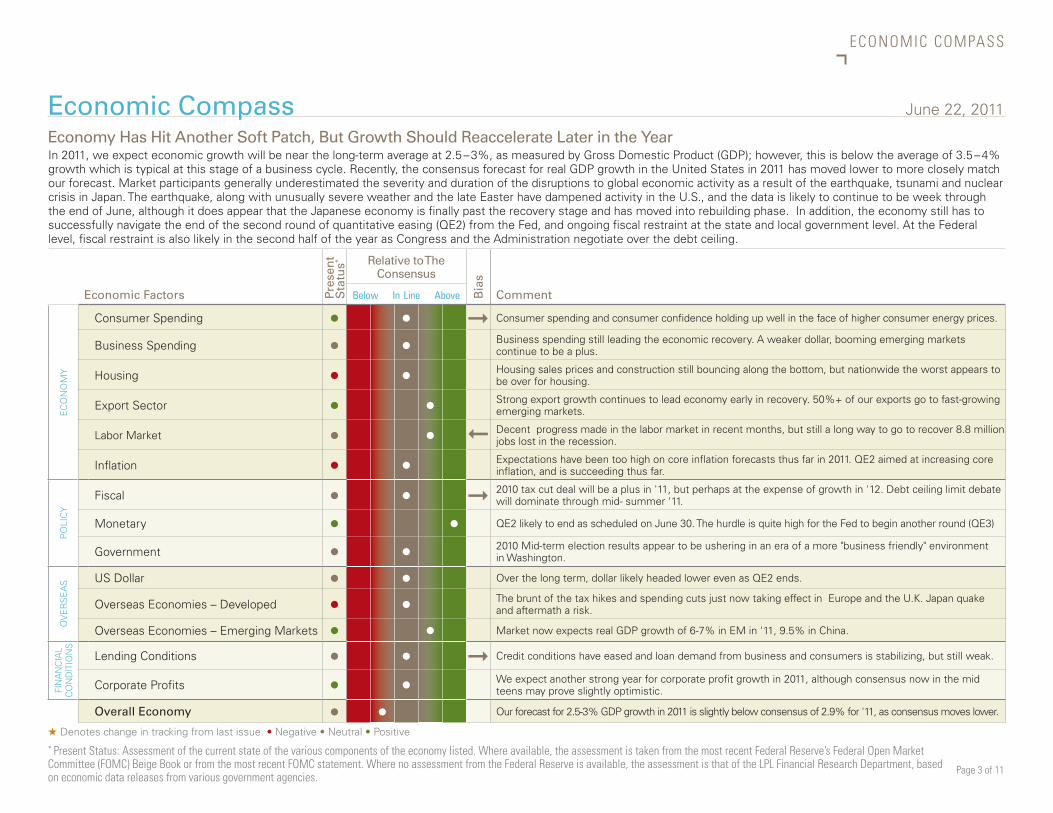
In 2011, we expect economic growth will be near the long-term average at 2.5 – 3%, as measured by Gross Domestic Product (GDP); however, this is below the average of 3.5 – 4% growth which is typical at this stage of a business cycle. Recently, the consensus forecast for real GDP growth in the United States in 2011 has moved lower to more closely match our forecast. Market participants generally underestimated the severity and duration of the disruptions to global economic activity as a result of the earthquake, tsunami and nuclear crisis in Japan. The earthquake, along with unusually severe weather and the late Easter have dampened activity in the U.S., and the data is likely to continue to be week through the end of June, although it does appear that the Japanese economy is finally past the recovery stage and has moved into rebuilding phase. In addition, the economy still has to successfully navigate the end of the second round of quantitative easing (QE2) from the Fed, and ongoing fiscal restraint at the state and local government level. At the Federal level, fiscal restraint is also likely in the second half of the year as Congress and the Administration negotiate over the debt ceiling.
Pres
ent
Sta
tus* Relative to The
Consensus
Bia
s
CommentEconomic Factors Below In Line Above
EC
ON
OM
Y
Consumer Spending • • ➞ Consumer spending and consumer confidence holding up well in the face of higher consumer energy prices.
Business Spending • • Business spending still leading the economic recovery. A weaker dollar, booming emerging markets continue to be a plus.
Housing • • Housing sales prices and construction still bouncing along the bottom, but nationwide the worst appears to be over for housing.
Export Sector • • Strong export growth continues to lead economy early in recovery. 50%+ of our exports go to fast-growing emerging markets.
Labor Market • •
➞
Decent progress made in the labor market in recent months, but still a long way to go to recover 8.8 million jobs lost in the recession.
Inflation • • Expectations have been too high on core inflation forecasts thus far in 2011. QE2 aimed at increasing core inflation, and is succeeding thus far.
PO
LIC
Y
Fiscal • • ➞ 2010 tax cut deal will be a plus in '11, but perhaps at the expense of growth in '12. Debt ceiling limit debate will dominate through mid- summer '11.
Monetary • • QE2 likely to end as scheduled on June 30. The hurdle is quite high for the Fed to begin another round (QE3)
Government • • 2010 Mid-term election results appear to be ushering in an era of a more "business friendly" environment in Washington.
OV
ER
SE
AS US Dollar • • Over the long term, dollar likely headed lower even as QE2 ends.
Overseas Economies – Developed • • The brunt of the tax hikes and spending cuts just now taking effect in Europe and the U.K. Japan quake and aftermath a risk.
Overseas Economies – Emerging Markets • • Market now expects real GDP growth of 6-7% in EM in '11, 9.5% in China.
FIN
AN
CIA
L C
ON
DIT
ION
S
Lending Conditions • • ➞ Credit conditions have eased and loan demand from business and consumers is stabilizing, but still weak.
Corporate Profits • • We expect another strong year for corporate profit growth in 2011, although consensus now in the mid teens may prove slightly optimistic.
Overall Economy • • Our forecast for 2.5-3% GDP growth in 2011 is slightly below consensus of 2.9% for '11, as consensus moves lower.
Economy Has Hit Another Soft Patch, But Growth Should Reaccelerate Later in the Year
★ Denotes change in tracking from last issue. • Negative • Neutral • Positive* Present Status: Assessment of the current state of the various components of the economy listed. Where available, the assessment is taken from the most recent Federal Reserve’s Federal Open Market Committee (FOMC) Beige Book or from the most recent FOMC statement. Where no assessment from the Federal Reserve is available, the assessment is that of the LPL Financial Research Department, based on economic data releases from various government agencies.

Page 4 of 11
ASSET CLASS COMPASS
Equity & Commodity Asset Class Compass June 22, 2011
We continue to favor Commodities, supported by the Reflation theme (weak dollar), EM growth, supply shortages and geopolitical risk. Our bias is towards precious metals due to low short term interest rates, the U.S. budget battle, heightened geopolitical risk and building global inflation pressures. We expect food prices to continue their upward trend and recently added livestock exposure to some models. Higher feed costs and foreign demand particularly from China continue to push hog and cattle prices higher. We maintain our preference for Emerging Markets as monetary tightening campaigns near an end, focusing on infrastructure as overall populations and middle classes grow. We continue to favor the U.S. over Large Foreign as European sovereign debt issues persist and Japan is only just starting to rebuild. Our neutral REIT review reflects a lackluster job market despite attractive yields. Uncertainty surrounding Chinese growth increases the short-term risk profile for Industrial metals.
Fun
dam
enta
ls
Tech
nic
als
Valu
atio
n
View
Bia
s
Comment
Act
ive
M
anag
er
Perf
orm
ance
(t
raili
ng
)
Negative Neutral Positive3
mo. 1 yr
STY
LE /
CA
PIT
ALI
ZATI
ON
Large Growth • • • • We favor Growth over Value due to better earnings trends and decelerating economic growth; Financials weakness has been a sizable drag on Value.
- -Large Value • • • • + -Mid Growth • • • • Earnings trends and Merger & Acquisition (M&A) activity are positive for Mid Caps, which have
outpaced Large and Small in 2011 based on Russell indices. Expect solid second half coming out of current soft spot.
- -Mid Value • • • • - -Small Growth • • • • Continue to prefer Mid to Small. Would consider a more positive Small Cap view as we emerge from
current soft spot. Business cycle stage still favorable for Small in 2011 but a pause is likely warranted.+ -
Small Value • • • • + +
RE
GIO
N
U.S. Stocks • • • •We continue to favor Emerging Markets as we expect monetary policy tightening to ease. Attractive earnings growth and expanding middle classes support our focus on Emerging Markets, particularly Infrastructure. We maintain our preference for domestic equities over developed foreign due to stronger and more stable economic growth and benign inflation. With Euro zone debt woes ongoing and Japan only starting to rebuild, we continue to largely avoid developed foreign markets.
Large Foreign • • • • + +Small Foreign • • • • + +Emerging Markets • • • • ➞ + +
REITS REITs • • • • Near-term outlook diminished on disappointing jobs report and credit market volatility. + -
CO
MM
OD
ITIE
S Commodities - Industrial Metals • • •We continue to favor commodities asset classes due to the Reflation theme (weak dollar), EM growth, supply concerns and geopolitical risk. With very low short term real interest rates, rising global inflation and a looming battle over the Federal budget and debt ceiling in Washington, we find precious metals particularly attractive. Oil faces weaker seasonality.
Commodities - Precious Metals • • •Commodities - Energy • • •Commodities - Agricultural • • •
★ Denotes change in view from last issue. • Negative • Neutral • Positive
Real Estate/REITs may result in potential illiquidity and there is no assurance the objectives of the program will be attained. The fast price swings of commodities will result in significant volatility in an investor's holdings. International and emerging markets involve special risks such as currency fluctuation and political instability. The price of small and mid-cap stocks are generally more volatile than large cap stocks. Value investments can perform differently from the market as a whole. They can remain undervalued by the market for long periods of time. Precious metal investing is subject to substantial fluctuation and potential for loss. These securities may not be suitable for all investors.
Continue to Favor Commodities Over Equities; Focus on Precious Metals and Agriculture
Page 5 of 11
EQUITY SECTOR COMPASS
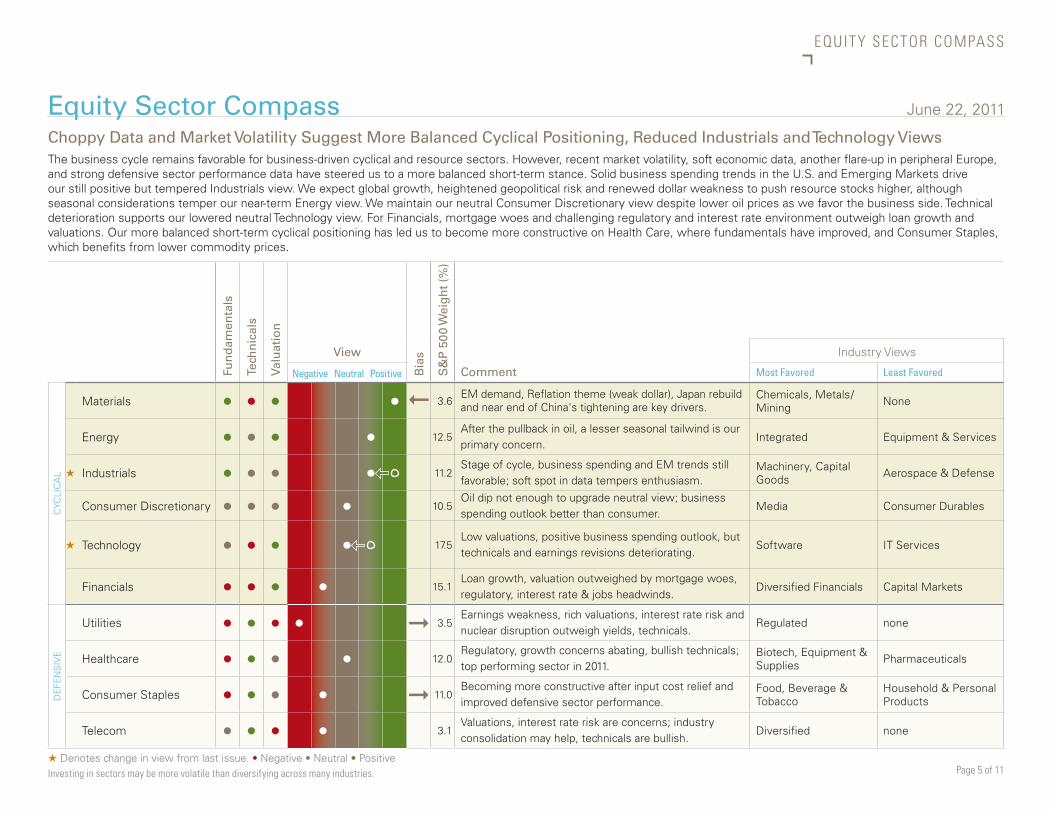
Choppy Data and Market Volatility Suggest More Balanced Cyclical Positioning, Reduced Industrials and Technology ViewsThe business cycle remains favorable for business-driven cyclical and resource sectors. However, recent market volatility, soft economic data, another flare-up in peripheral Europe, and strong defensive sector performance data have steered us to a more balanced short-term stance. Solid business spending trends in the U.S. and Emerging Markets drive our still positive but tempered Industrials view. We expect global growth, heightened geopolitical risk and renewed dollar weakness to push resource stocks higher, although seasonal considerations temper our near-term Energy view. We maintain our neutral Consumer Discretionary view despite lower oil prices as we favor the business side. Technical deterioration supports our lowered neutral Technology view. For Financials, mortgage woes and challenging regulatory and interest rate environment outweigh loan growth and valuations. Our more balanced short-term cyclical positioning has led us to become more constructive on Health Care, where fundamentals have improved, and Consumer Staples, which benefits from lower commodity prices.
Equity Sector Compass June 22, 2011
Fun
dam
enta
ls
Tech
nic
als
Valu
atio
n
View
Bia
s
S&
P 5
00 W
eig
ht
(%)
Comment
Industry Views
Negative Neutral Positive Most Favored Least Favored
CYC
LIC
AL
Materials • • • •➞
3.6EM demand, Reflation theme (weak dollar), Japan rebuild and near end of China's tightening are key drivers.
Chemicals, Metals/Mining None
Energy • • • • 12.5After the pullback in oil, a lesser seasonal tailwind is our primary concern.
Integrated Equipment & Services
★ Industrials • • • • 11.2Stage of cycle, business spending and EM trends still favorable; soft spot in data tempers enthusiasm.
Machinery, Capital Goods Aerospace & Defense
Consumer Discretionary • • • • 10.5Oil dip not enough to upgrade neutral view; business spending outlook better than consumer.
Media Consumer Durables
★ Technology • • • • 17.5Low valuations, positive business spending outlook, but technicals and earnings revisions deteriorating.
Software IT Services
Financials • • • • 15.1Loan growth, valuation outweighed by mortgage woes, regulatory, interest rate & jobs headwinds.
Diversified Financials Capital Markets
DE
FEN
SIV
E
Utilities • • • • ➞ 3.5Earnings weakness, rich valuations, interest rate risk and nuclear disruption outweigh yields, technicals.
Regulated none
Healthcare • • • • 12.0Regulatory, growth concerns abating, bullish technicals; top performing sector in 2011.
Biotech, Equipment & Supplies Pharmaceuticals
Consumer Staples • • • • ➞ 11.0Becoming more constructive after input cost relief and improved defensive sector performance.
Food, Beverage & Tobacco
Household & Personal Products
Telecom • • • • 3.1Valuations, interest rate risk are concerns; industry consolidation may help, technicals are bullish.
Diversified none
★ Denotes change in view from last issue. • Negative • Neutral • PositiveInvesting in sectors may be more volatile than diversifying across many industries.
Page 6 of 11
F IXED INCOME COMPASS
Fixed Income Compass June 22, 2011
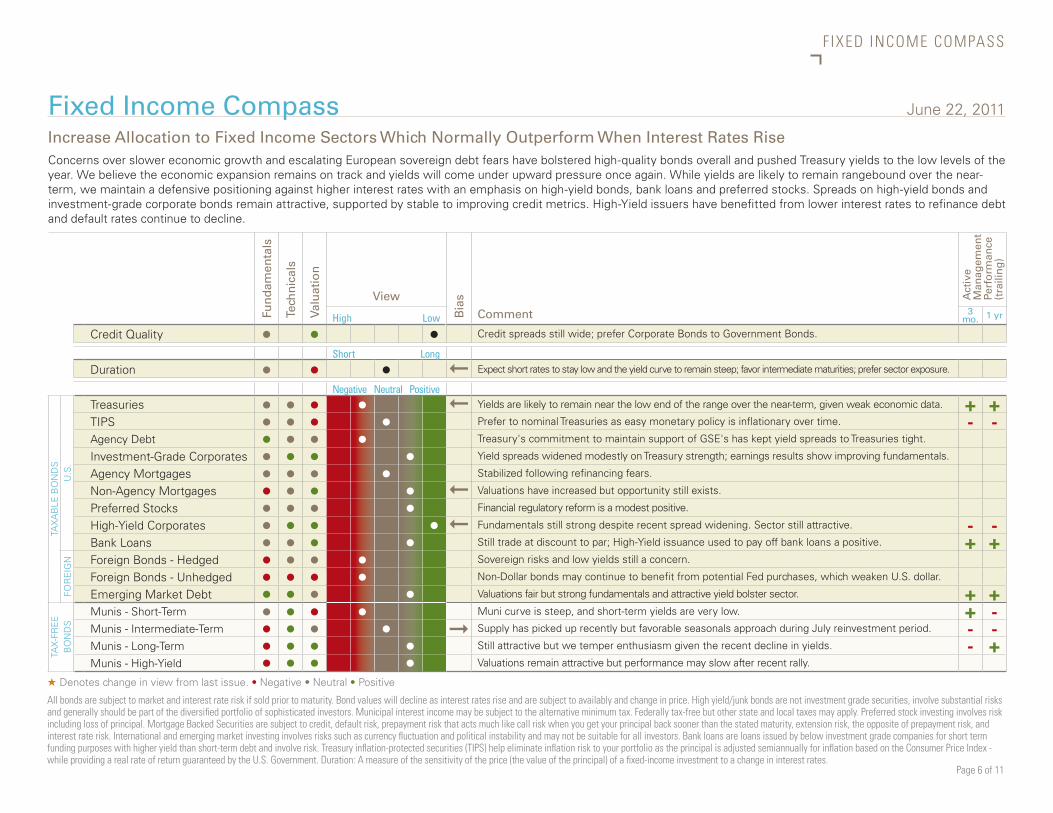
Concerns over slower economic growth and escalating European sovereign debt fears have bolstered high-quality bonds overall and pushed Treasury yields to the low levels of the year. We believe the economic expansion remains on track and yields will come under upward pressure once again. While yields are likely to remain rangebound over the near-term, we maintain a defensive positioning against higher interest rates with an emphasis on high-yield bonds, bank loans and preferred stocks. Spreads on high-yield bonds and investment-grade corporate bonds remain attractive, supported by stable to improving credit metrics. High-Yield issuers have benefitted from lower interest rates to refinance debt and default rates continue to decline.
Fun
dam
enta
ls
Tech
nic
als
Valu
atio
nView
Bia
s
Comment
Act
ive
M
anag
emen
t Pe
rfo
rman
ce
(tra
ilin
g)
High Low 3
mo. 1 yr
Credit Quality • • • Credit spreads still wide; prefer Corporate Bonds to Government Bonds.
Short LongDuration • • •
➞
Expect short rates to stay low and the yield curve to remain steep; favor intermediate maturities; prefer sector exposure.
Negative Neutral Positive
TAX
AB
LE B
ON
DS
U.S
.
Treasuries • • • •➞
Yields are likely to remain near the low end of the range over the near-term, given weak economic data. + +TIPS • • • • Prefer to nominal Treasuries as easy monetary policy is inflationary over time. - -Agency Debt • • • • Treasury's commitment to maintain support of GSE's has kept yield spreads to Treasuries tight.
Investment-Grade Corporates • • • • Yield spreads widened modestly on Treasury strength; earnings results show improving fundamentals.
Agency Mortgages • • • • Stabilized following refinancing fears.
Non-Agency Mortgages • • • •
➞
Valuations have increased but opportunity still exists.
Preferred Stocks • • • • Financial regulatory reform is a modest positive.
High-Yield Corporates • • • •
➞
Fundamentals still strong despite recent spread widening. Sector still attractive. - -Bank Loans • • • • Still trade at discount to par; High-Yield issuance used to pay off bank loans a positive. + +
FOR
EIG
N Foreign Bonds - Hedged • • • • Sovereign risks and low yields still a concern.
Foreign Bonds - Unhedged • • • • Non-Dollar bonds may continue to benefit from potential Fed purchases, which weaken U.S. dollar.
Emerging Market Debt • • • • Valuations fair but strong fundamentals and attractive yield bolster sector. + +
TAX
-FR
EE
BO
ND
S
Munis - Short-Term • • • • Muni curve is steep, and short-term yields are very low. + -Munis - Intermediate-Term • • • • ➞ Supply has picked up recently but favorable seasonals approach during July reinvestment period. - -Munis - Long-Term • • • • Still attractive but we temper enthusiasm given the recent decline in yields. - +Munis - High-Yield • • • • Valuations remain attractive but performance may slow after recent rally.
★ Denotes change in view from last issue. • Negative • Neutral • Positive
All bonds are subject to market and interest rate risk if sold prior to maturity. Bond values will decline as interest rates rise and are subject to availably and change in price. High yield/junk bonds are not investment grade securities, involve substantial risks and generally should be part of the diversified portfolio of sophisticated investors. Municipal interest income may be subject to the alternative minimum tax. Federally tax-free but other state and local taxes may apply. Preferred stock investing involves risk including loss of principal. Mortgage Backed Securities are subject to credit, default risk, prepayment risk that acts much like call risk when you get your principal back sooner than the stated maturity, extension risk, the opposite of prepayment risk, and interest rate risk. International and emerging market investing involves risks such as currency fluctuation and political instability and may not be suitable for all investors. Bank loans are loans issued by below investment grade companies for short term funding purposes with higher yield than short-term debt and involve risk. Treasury inflation-protected securities (TIPS) help eliminate inflation risk to your portfolio as the principal is adjusted semiannually for inflation based on the Consumer Price Index - while providing a real rate of return guaranteed by the U.S. Government. Duration: A measure of the sensitivity of the price (the value of the principal) of a fixed-income investment to a change in interest rates.
Increase Allocation to Fixed Income Sectors Which Normally Outperform When Interest Rates Rise

Page 7 of 11
APPENDIX - CC I
Real-Time TrackingThe LPL Financial Research Current Conditions Index is a weekly measure of the conditions that underline our outlook for the markets and economy. The CCI provides real-time context and insight into the trends that shape our recommended actions to manage portfolios. This index has been a useful tool for investment decision making.
This weekly index is not intended to be a leading index or predictive of where conditions are headed, but a coincident measure of where they are right now. We want to track the conditions in real-time to aid in investment decision making. There are thousands of indicators-some lead the economy, some lag, while others merely offer a lot of statistical noise. We chose to create our own index tailored to the current environment to provide the clearest and most useful way to track conditions. The components of the CCI are periodically changed to re-tune the index to those factors most critical to the markets and economy so it may continue to be a valuable investment decision-making tool.
To create the index we found 10 indicators that provided a weekly, real-time measure of the conditions in the economic and market environment. Each component is important and measures a different driver of the environment. The 10 components of the CCI are described below:
1. Initial Claims Filed for Unemployment Benefits – Measures the number of people filing for unemployment benefits. A rise in the number of new claims acts as a negative on the CCI.
2. Fed Spread – A measure of future monetary policy, the futures market gives us the difference between the current federal funds rate and the expected federal funds rate six months from now. Typically, a rise in rate hike expectations weighs on the markets since higher rates increase the cost of bank borrowing and have tended to slow the growth in the economy and profits. A rise in the Fed Spread acts as a negative for the CCI.
3. Baa Spreads – The yield on corporate bonds above the rate on comparable maturity Treasury debt is a market based estimate of the amount of fear in the bond market. Baa-rated bonds are the lowest quality bonds still considered investment grade, rather than high-yield. Therefore, they best reflect the stresses across the quality spectrum. A rise in Baa spreads acts as a negative for the CCI.
4. Retail Sales – International Council of Shopping Centers tabulates data on major retailer’s sales compared to the same week a year earlier. This measures the current pace of consumer spending. Consumer spending makes up two-thirds of GDP. Rising retail sales acts as a positive for the CCI.
5. Shipping Traffic – A measure of trade, the Association of American Railroads tracks the number of carloads of cargo that moves by rail in the U.S. each week. A growing economy moves more cargo. A rise in railroad traffic acts as a positive for the CCI.
6. Business Lending – A good gauge of business’ willingness to borrow to fund growth, the Federal Reserve tabulates demand for Commercial & Industrial loans at U.S. commercial banks. More borrowing reflects increasing optimism by business leaders in the strength of demand. A rise in loan growth acts as a positive for the CCI.
7. VIX – The VIX is a measure of the volatility implied in the prices of options contracts for the S&P 500. It is a market based estimate of future volatility. While this is not necessarily predictive it does measure the current degree of fear present in the stock market. A rise in the VIX acts as a negative on the CCI.
8. Money Market Asset Growth – A measure of the willingness to take risk by investors, the year-over-year change in money market fund assets tracked by Investment Company Institute shows the change in total assets in cash equivalent money market funds. A rise in money market asset growth acts as a negative for the CCI.
9. Commodity Prices – While retail sales captures end user demand for goods, commodity prices reflect the demand for the earliest stages of production of goods. Commodity prices can offer an indicator of the pace of economic activity. The CRB Commodity Index includes copper, cotton, etc. A rise in commodity prices acts as a positive on the CCI.
10. Mortgage Applications – The weekly index measuring mortgage applications provides an indication of housing demand. With much of the credit crisis tied to housing, keeping tabs on real time buying activity can offer insight on how the crisis is evolving. A rise in the index of mortgage applications acts as a positive on the CCI.
Appendix - CCI Components
Page 8 of 11
DEF INIT IONS
ECONOMIC DEFINITIONS
Consumer Spending: Real Personal Consumption Expenditures from the U.S. Government’s National Income and Product Accounts.
Business Spending: Business Investment in Equipment and Inventories from the U.S. Government’s National Income and Product Accounts.
Housing: Amalgamation of housing prices and housing construction activity.
Export Sector: Real Net Exports from the U.S. Government’s National Income and Product Accounts.
Labor Market: Unemployment Rate and Nonfarm Payroll job count from the U.S. Bureau of Labor Statistics.
Inflation: Consumer Price Index, overall and excluding food and energy, from the U.S. Bureau of Labor Statistics.
Fiscal Policy: The U.S. Federal government’s spending and tax policies.
Monetary Policy: The U.S Federal Reserve’s policies on interest rates and the money supply.
Government Policy: Overall U.S. government policy as it relates to the banking and housing crises.
US dollar: Broad measure of the US dollar versus the currencies of its major trading partners (Canada, Eurozone, Japan, UK, etc.)
International Economies – Developed: Proxy for economic, fiscal, and monetary health of major developed international economies (Canada, Eurozone, Japan, UK, etc.)
International Economies – Emerging: Proxy for economic, fiscal, and monetary health of major emerging international economies (China, India, Russia, Brazil, Eastern Europe, Latin America, etc.)
Financial Conditions: A measure of the health of the financial system relative to "normal" times. Indicators include, but are not limited to: short term credit spreads, overnight bank lending rates, spreads on corporate debt, willingness of banks to lend to each other, willingness of banks to lend to customers, and the ability of corporations to finance themselves in the short-and long-term debt and equity markets
Yield Curve: Difference in basis points between the 10-year Treasury note and the 3-month T-Bill.
Corporate Profits: S&P 500 Operating profits as compiled by Thomson Financial.
Present Status: Assessment of the current state of the various components of the economy listed. Where available, the assessment is taken from the most recent Federal Reserve’s Federal Open Market Committee (FOMC) Beige Book or from the most recent FOMC statement. Where no assessment from the Federal Reserve is available, the assessment is that of the LPL Financial Research Department, based on economic data releases from various government agencies.
Earnings Per Share (EPS): The portion of a company's profit allocated to each outstanding share of common stock. Earnings per share serves as an indicator of a company's profitability.
EQUITY AND COMMODITY ASSET CLASSES
Large Growth: Stocks in the top 70% of the capitalization of the U.S. equity market are defined as Large Cap. Growth is defined based on fast growth (high growth rates for earnings, sales, book value, and cash flow) and high valuations (high price ratios and low dividend yields).
Large Value: Stocks in the top 70% of the capitalization of the U.S. equity market are defined as Large Cap. Value is defined based on low valuations (low price ratios and high dividend yields) and slow growth (low growth rates for earnings, sales, book value, and cash flow).
Mid Growth: The U.S. mid-cap range for market capitalization typically falls between $1 billion and $8 billion and represents 20% of the total capitalization of the U.S. equity market. Growth is defined based on fast growth (high growth rates for earnings, sales, book value, and cash flow) and high valuations (high price ratios and low dividend yields).
Mid Value: The U.S. Mid Cap range for market capitalization typically falls between $1 billion and $8 billion and represents 20% of the total capitalization of the U.S. equity market. Value is defined based on low valuations (low price ratios and high dividend yields) and slow growth (low growth rates for earnings, sales, book value, and cash flow).
Small Growth: Stocks in the bottom 10% of the capitalization of the U.S. equity market are defined as Small Cap. Growth is defined based on fast growth (high growth rates for earnings, sales, book value, and cash flow) and high valuations (high price ratios and low dividend yields).
Small Value: Stocks in the bottom 10% of the capitalization of the U.S. equity market are defined as Small Cap. Value is defined based on low valuations (low price ratios and high dividend yields) and slow growth (low growth rates for earnings, sales, book value, and cash flow).
Portfolio Compass Definitions
Page 9 of 11
EQUITY AND COMMODITY ASSET CLASSES (CONT.)
U.S. Stocks: Stock of companies domiciled in the U.S.
Large Foreign: Large-cap foreign stocks have market capitalizations greater than $5 billion. The majority of the holdings in the large foreign category are in the MSCI EAFE Index.
Emerging Markets: Stocks of a single developing country or a grouping of developing countries. For the most part, these countries are in Eastern Europe, Africa, the Middle East, Latin America, the Far East and Asia.
REITs: REITs are companies that develop and manage real-estate properties. There are several different types of REITs, including apartment, factory-outlet, health-care, hotel, industrial, mortgage, office, and shopping center REITs. This would also include real-estate operating companies.
Commodities – Industrial Metals: Stocks in companies that mine base metals such as copper, aluminum and iron ore. Also included are the actual metals themselves. Industrial metals companies are typically based in North America, Australia, or South Africa.
Commodities – Precious Metals: Stocks of companies that do gold- silver-, platinum-, and base-metal-mining. Precious-metals companies are typically based in North America, Australia, or South Africa.
Commodities – Energy: Stocks of companies that focus on integrated energy, oil & gas services, oil & gas exploration and equipment. Public energy companies are typically based in North America, Europe, the UK, and Latin America.
Small Foreign – Small - cap foreign stocks typically have market capitalizations of $250M to $1B. The majority of the holdings in the small foreign category are in the MSCI Small Cap EAFE Index.
EQUITY SECTORS
Consumer Discretionary: Companies that tend to be the most sensitive to economic cycles. Its manufacturing segment includes automotive, household durable goods, textiles and apparel, and leisure equipment. The service segment includes hotels, restaurants and other leisure facilities, media production and services, consumer retailing and services and education services.
Consumer Staples: Companies whose businesses are less sensitive to economic cycles. It includes manufacturers and distributors of food, beverages and tobacco, and producers of non-durable household goods and personal products. It also includes food and drug retailing companies.
Energy: Companies whose businesses are dominated by either of the following activities: The construction or provision of oil rigs, drilling equipment and other energy-related service and equipment, including seismic data collection or the exploration, production, marketing, refining and/or transportation of oil and gas products, coal and consumable fuels.
Financials: Companies involved in activities such as banking, consumer finance, investment banking and brokerage, asset management, insurance and investment, and real estate, including REITs.
Healthcare: Companies in two main industry groups: Healthcare equipment and supplies or companies that provide healthcare-related services, including distributors of healthcare products, providers of basic healthcare services, and owners and operators of healthcare facilities and organizations or companies primarily involved in the research, development, production and marketing of pharmaceuticals and biotechnology products.
Industrials: Companies whose businesses: Manufacture and distribute capital goods, including aerospace and defense, construction, engineering and building products, electrical equipment and industrial machinery; provide commercial services and supplies, including printing, employment, environmental and office services; provide transportation services, including airlines, couriers, marine, road and rail, and transportation infrastructure.
Technology: Companies that primarily develop software in various fields such as the Internet, applications, systems and/or database management and companies that provide information technology consulting and services. Technology hardware & equipment include manufacturers and distributors of communications equipment, computers and peripherals, electronic equipment and related instruments, and semiconductor equipment and products.
Materials: Companies that engage in a wide range of commodity-related manufacturing. Included in this sector are companies that manufacture chemicals, construction materials, glass, paper, forest products and related packaging products, metals, minerals and mining companies, including producers of steel.
Telecommunications: Companies that provide communications services primarily through a fixed line, cellular, wireless, high bandwidth and/or fiber-optic cable network.
Utilities: Companies considered electric, gas or water utilities, or companies that operate as independent producers and/or distributors of power.
Portfolio Compass Definitions (CONT.)
DEF INIT IONS

Page 10 of 11
FIXED INCOME ASSET CLASSES
Credit Quality: An individual bond's credit rating is determined by private independent rating agencies such as Standard & Poor's, Moody's and Fitch. Their credit quality designations range from high ('AAA' to 'AA') to medium ('A' to 'BBB') to low ('BB', 'B', 'CCC', 'CC' to 'C').
Duration: A measure of the sensitivity of the price (the value of principal) of a fixed-income investment to a change in interest rates. Duration is expressed as a number of years. Rising interest rates mean falling bond prices, while declining interest rates mean rising bond prices. The bigger the duration number, the greater the interest-rate risk or reward for bond prices.
Treasuries: A marketable, fixed-interest U.S. government debt security. Treasury bonds make interest payments semi-annually and the income that holders receive is only taxed at the federal level.
TIPS (Treasury Inflation Protected Securities): A special type of Treasury note or bond that offers protection from inflation. Like other Treasuries, an inflation-indexed security pays interest every six months and pays the principal when the security matures. The difference is that the underlying principal is automatically adjusted for inflation as measured by the consumer price index (CPI).
Agencies: Securities issued by corporations and agencies created by the U.S. government, such as the Federal Home Loan Bank Board and Fannie Mae.
Investment-Grade Corporates: Securities issued by corporations with a credit ratning of BBB- or higher. Bond rating firms, such as Standard & Poor's, use different designations consisting of upper- and lower-case letters 'A' and 'B' to identify a bond's investment grade credit quality rating. 'AAA' and 'AA' (high credit quality) and 'A' and 'BBB' (medium credit quality) are considered investment grade.
Mortgage-Backed Securities: A Mortgage Backed Security (MBS) is an asset-backed security whose cash flows are backed by the principal and interest payments of a set of mortgage loans. Payments are typically made monthly over the lifetime of the underlying loans.
Agency MBS: These are issued by agencies created by the U.S. Government. Non-agency MBS are issued by private companies and include jumbo, Alt-A, and sub-prime mortgages.
Preferred Stocks: A class of ownership in a corporation that has a higher claim on the assets and earnings than common stock. Preferred stock generally has a dividend that must be paid out before dividends to common stockholders and the shares usually do not have voting rights.
High-Yield Corporates: Securities issued by corporations with a credit rating of BB+ and below. These bonds generally offer higher yields than investment grade bonds, but they are also more vulnerable to economic and credit risk.
Bank Loans: In exchange for their credit risk, these floating-rate bank loans offer interest payments that typically float above a common short-term benchmark such as the London interbank offered rate, or LIBOR.
Foreign Bonds – Hedged: Non-U.S. fixed income securities generally from investment grade issuers in developed countries, with hedged currency exposure.
Foreign Bonds – Unhedged: Non-U.S. fixed income securities normally denominated in major foreign currencies.
Emerging Market Debt: The debt of sovereigns, agencies, local issues, and corporations of emerging markets countries and subject to currency risk.
Munis – Short-term: Bonds issued by various state and local governments to fund public projects. The income from these bonds is generally free from federal taxes. These bonds generally have maturities of less than three years.
Munis – Intermediate: Bonds issued by various state and local governments to fund public projects. The income from these bonds is generally free from federal taxes. These bonds generally have maturities of between 3 and 10 years.
Munis – Long-term: Bonds issued by various state and local governments to fund public projects. The income from these bonds is generally free from federal taxes. These bonds generally have maturities of more than 10 years.
Munis – High Yield: Bonds issued by various state and local governments to fund public projects. The income from these bonds is generally free from federal taxes. These bonds generally offer higher yields than other types of bonds, but they are also more vulnerable to economic and credit risk. These bonds are rated BB+ and below.
Portfolio Compass Definitions (CONT.)
DEF INIT IONS

IMPORTANT DISCLOSURES
The opinions voiced in this material are for general information only and are not intended to provide or be construed as providing specific investment advice or recommendations for any individual. To determine which investments may be appropriate for you, consult your financial advisor prior to investing. All performance referenced is historical and is no guarantee of future results. All indices are unmanaged and cannot be invested in directly.
Treasury Bills are guaranteed by the U.S. government as to the timely payment of principal and interest and, if held to maturity, offer a fixed rate of return and fixed principal value.
Corporate bonds are considered higher risk than government bonds but normally offer a higher yield and are subject to market, interest rate and credit risk as well as additional risks based on the quality of issuer coupon rate, price, yield, maturity and redemption features.
Investing in alternative investments may not be suitable for all investors and involve special risks such as risk associated with leveraging the investment, potential adverse market forces, regulatory changes, and potential illiquidity. There is no assurance that the investment objective will be attained.
Long positions may decline as short positions rise, thereby accelerating potential losses to the investor.
Stock investing involves risk including loss of principal.
The Standard & Poor’s 500 Index is a capitalization-weighted index of 500 stocks designed to measure performance of the broad domestic economy through changes in the aggregate market value of 500 stocks representing all major industries.
Quantitative Easing is a government monetary policy occasionally used to increase the money supply by buying government securities or other securities from the market. Quantitative easing increases the money supply by flooding financial institutions with capital in an effort to promote increased lending and liquidity.
Member FINRA/SIPCPage 11 of 11
RES 3210 0611Tracking #740302 (Exp. 06/12)
Not FDIC or NCUA/NCUSIF Insured | No Bank or Credit Union Guarantee | May Lose Value | Not Guaranteed by any Government Agency | Not a Bank/Credit Union Deposit
This research material has been prepared by LPL Financial.
The LPL Financial family of affiliated companies includes LPL Financial and UVEST Financial Services Group, Inc., each of which is a member of FINRA/SIPC.
To the extent you are receiving investment advice from a separately registered independent investment advisor, please note that LPL Financial is not an affiliate of and makes no representation with respect to such entity.
D ISCLOSURES