population pyramids objective: interpret population pyramids to determine population patterns and...
TRANSCRIPT
Population Pyramids
Objective: Interpret population pyramids to determine population patterns and specific challenges that country may face
Population Pyramids
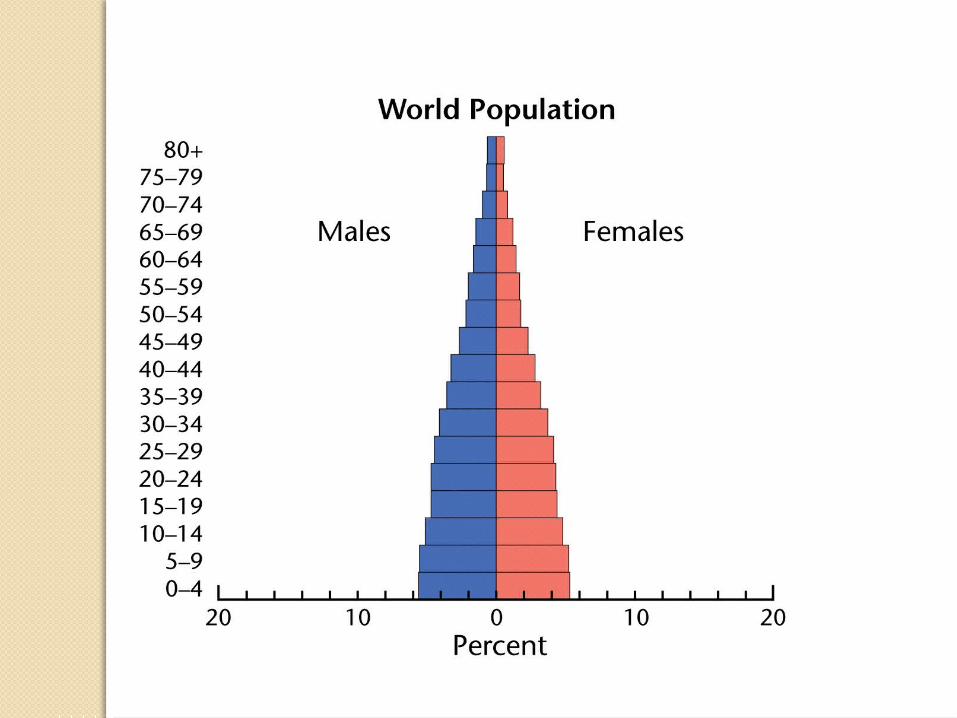
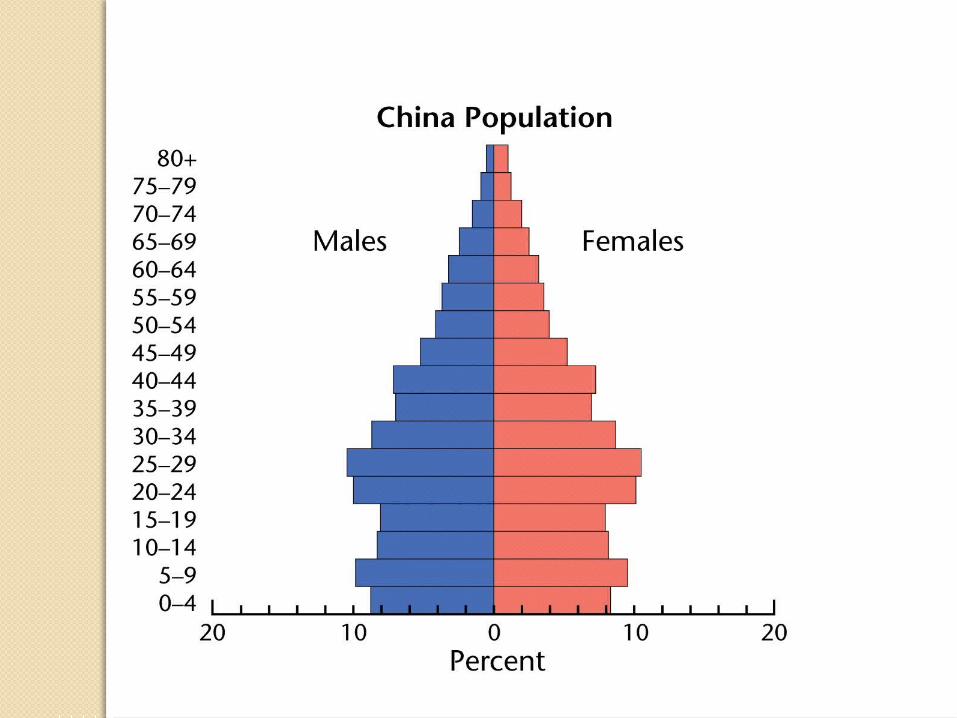
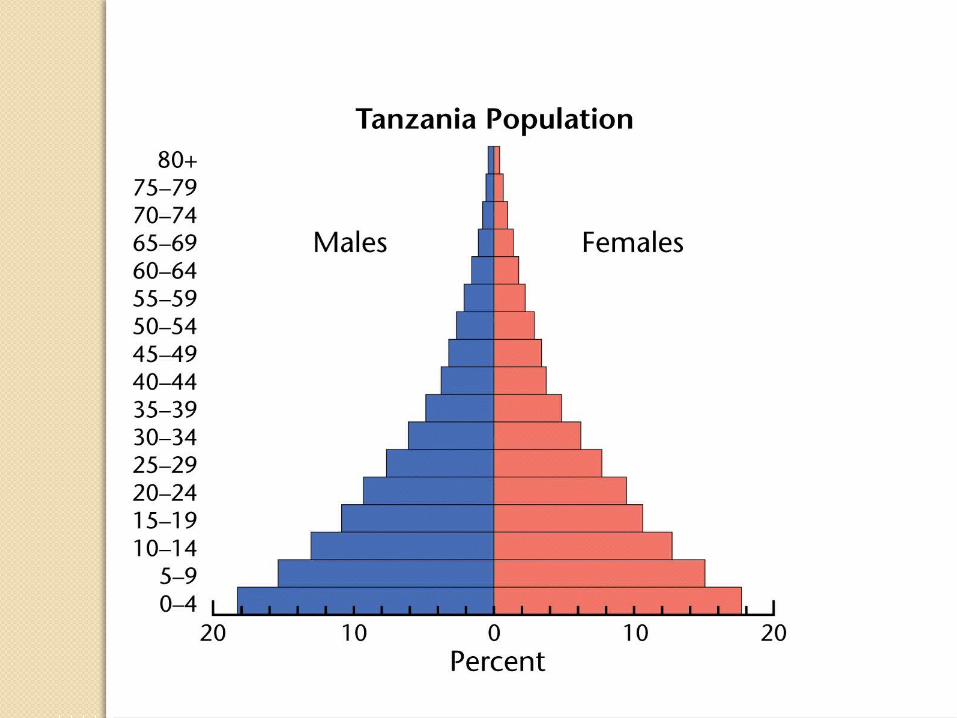
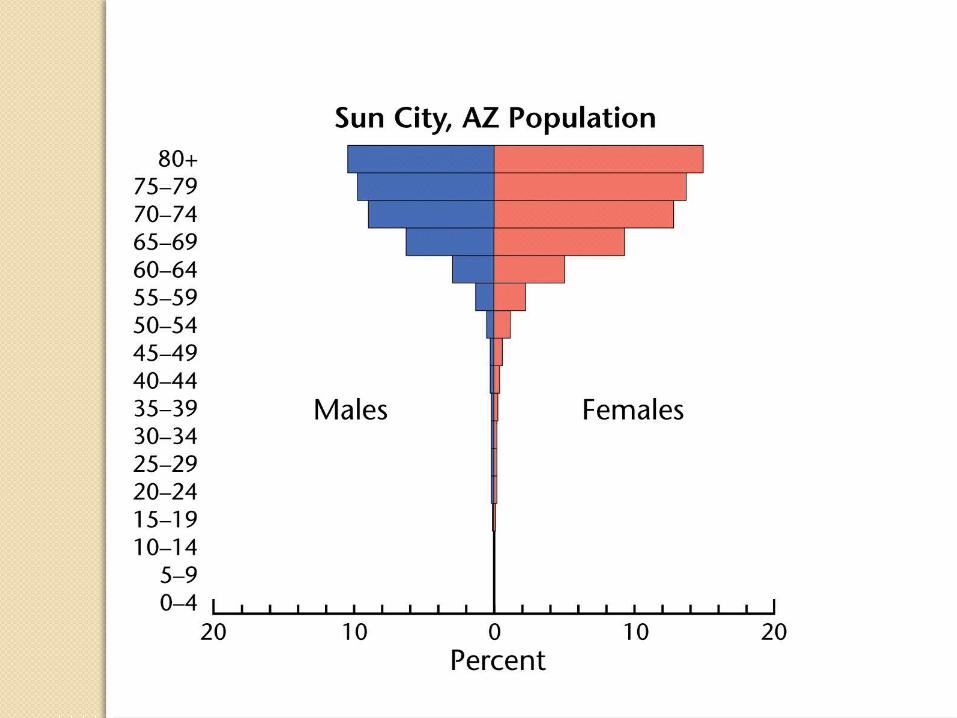
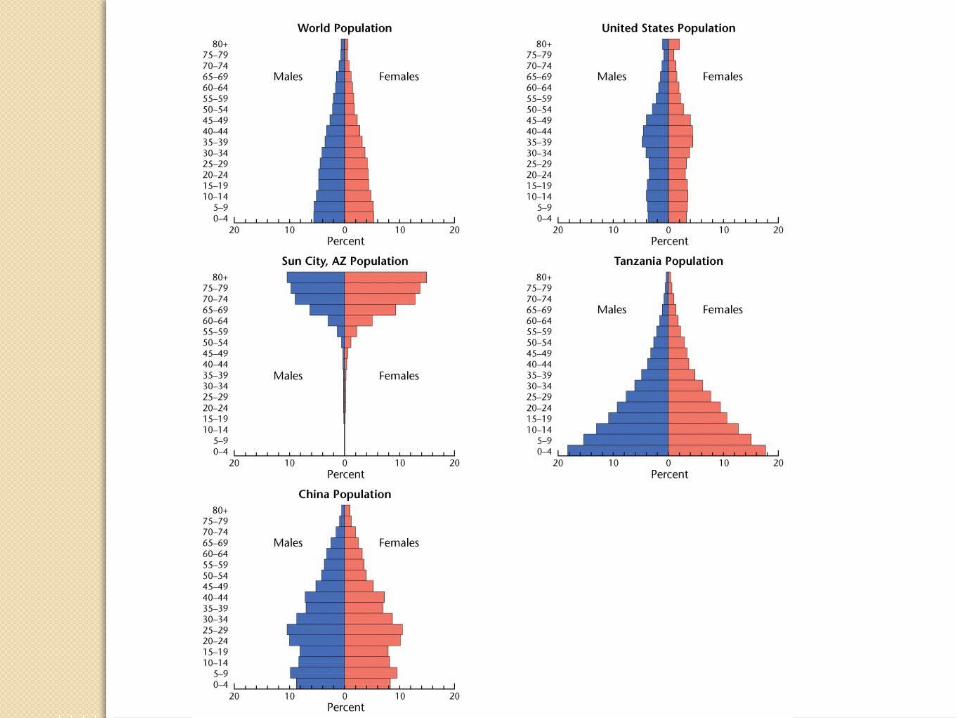
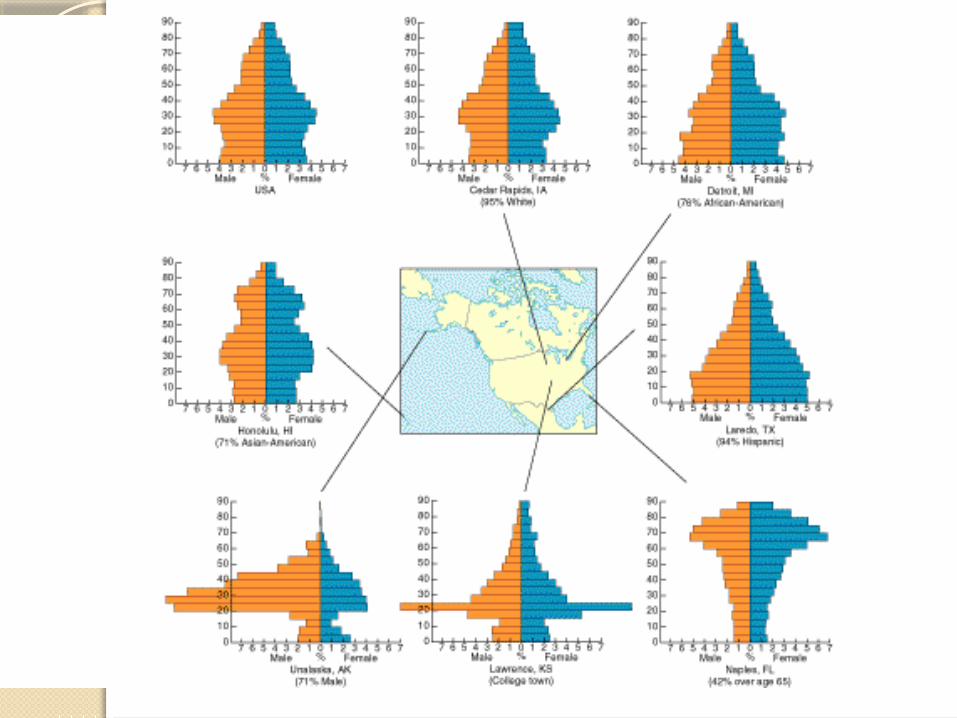
A population pyramid, also known as an age-sex pyramid, is a graphical illustration that shows the distribution of various age groups in a population (typically that of a country or region of the world), which normally forms the shape of a pyramid.
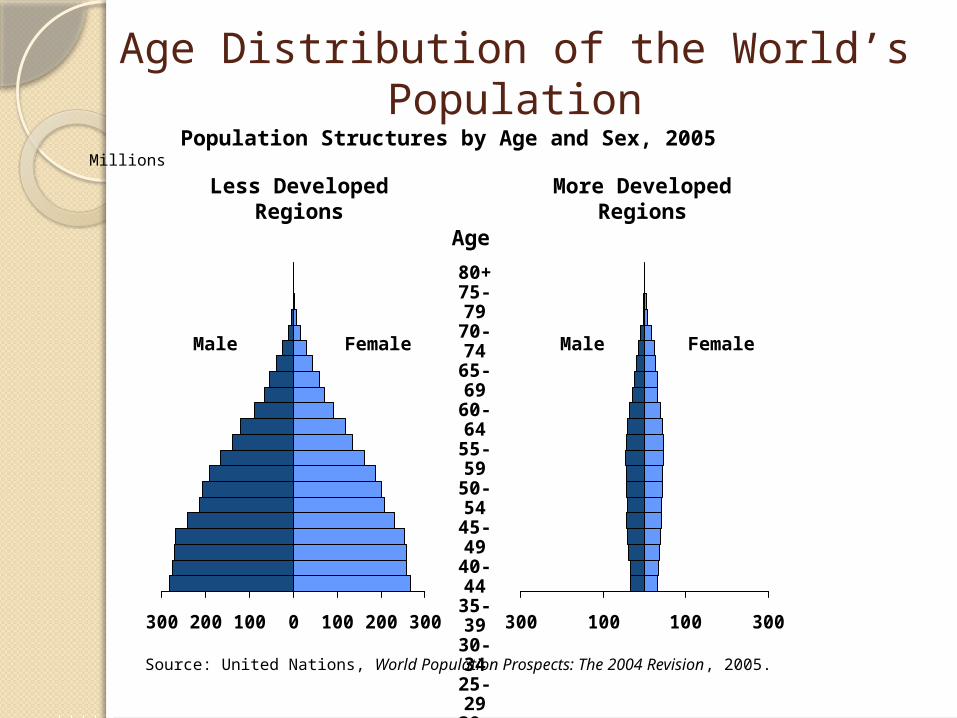
Population Structures by Age and Sex, 2005 Millions
Male
Female Male
Female
300 100 100 300300 200 100 0 100 200 300
Less Developed Regions
More Developed Regions
80+ 75-79 70-74 65-69 60-64 55-59 50-54 45-49 40-44 35-39 30-34 25-29 20-24 15-19 10-14 5-90-4
Age
Source: United Nations, World Population Prospects: The 2004 Revision, 2005.
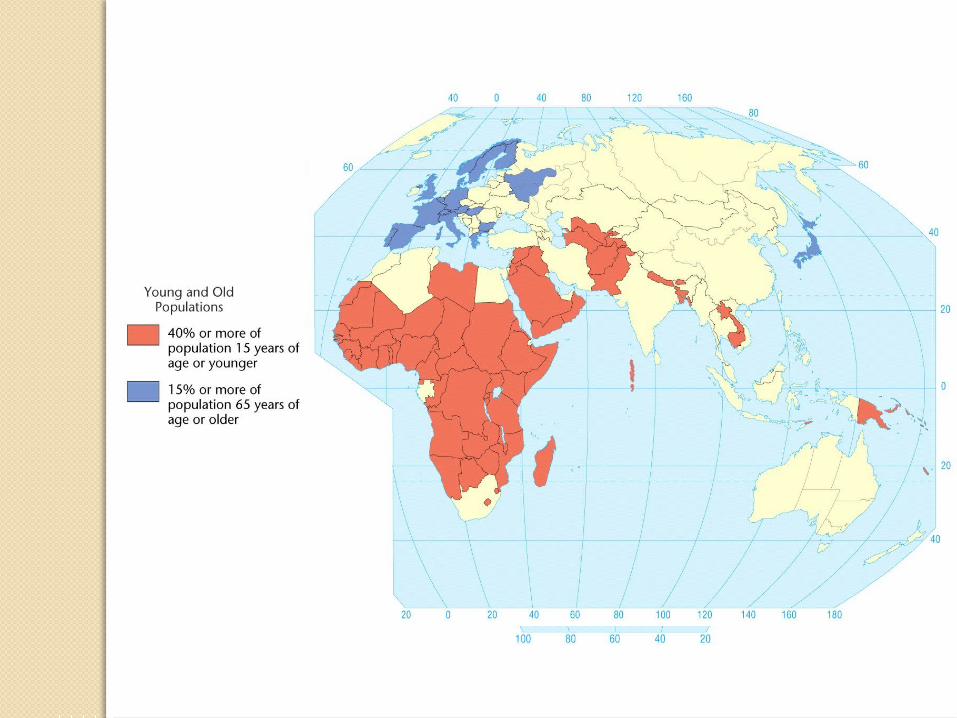
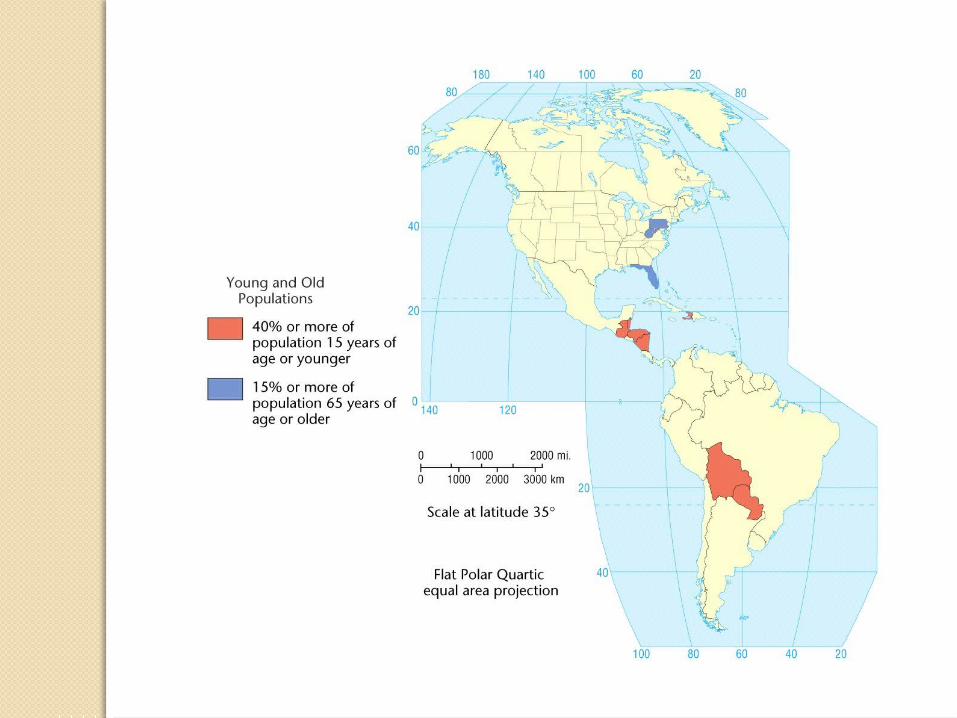
Age Distribution of the World’s Population
Notes on Age Distribution of the World’s Population
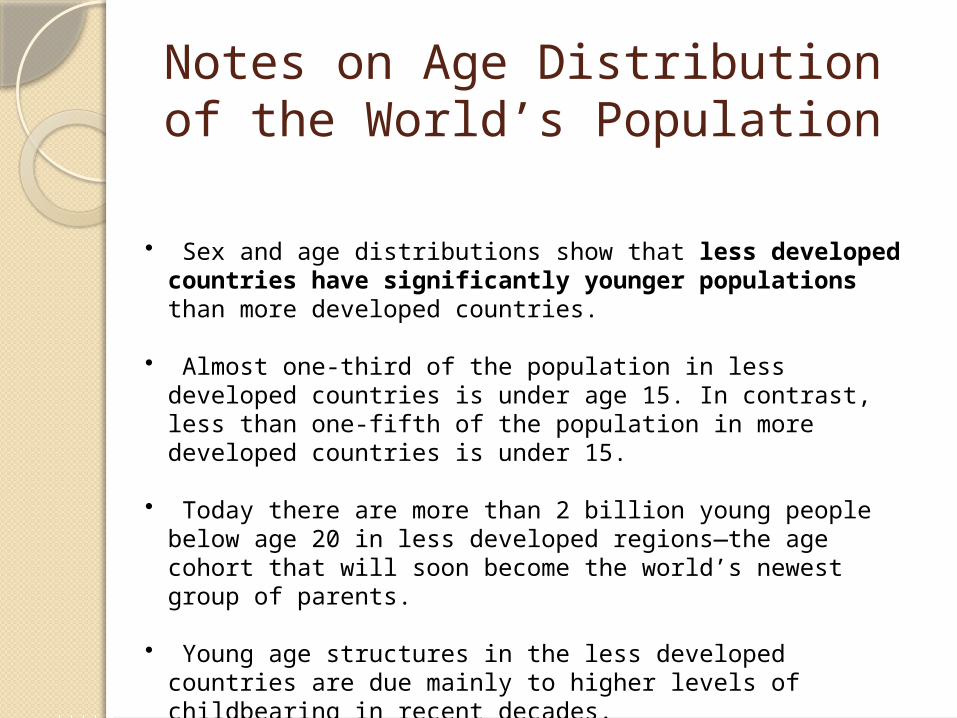
• Sex and age distributions show that less developed countries have significantly younger populations than more developed countries.
• Almost one-third of the population in less developed countries is under age 15. In contrast, less than one-fifth of the population in more developed countries is under 15.
• Today there are more than 2 billion young people below age 20 in less developed regions—the age cohort that will soon become the world’s newest group of parents.
• Young age structures in the less developed countries are due mainly to higher levels of childbearing in recent decades.
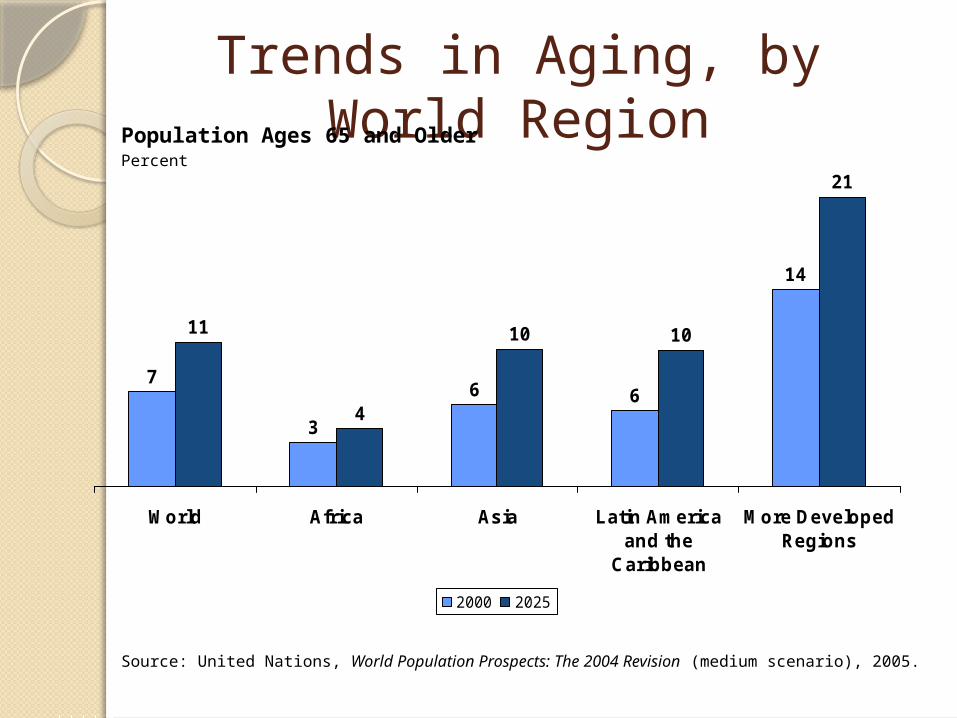
Trends in Aging, by World RegionPopulation Ages 65 and Older
Percent
7
3
6 6
14
11
4
10 10
21
World Africa Asia Latin Americaand the
Caribbean
More DevelopedRegions
2000 2025
Source: United Nations, World Population Prospects: The 2004 Revision (medium scenario), 2005.
Notes on Trends in Aging, by World Region
• By 2025, over 20 percent of the population in more developed regions will be ages 65 and older.
• By 2025, one-tenth of the world’s population will be over age 65.
• Asia will see the proportion of its elderly population almost double, from about 6 percent in 2000 to 10 percent in 2025. In absolute terms, this represents a stark increase in just 25 years: from about 216 million to about 480 million older people.

Dependency Ratio
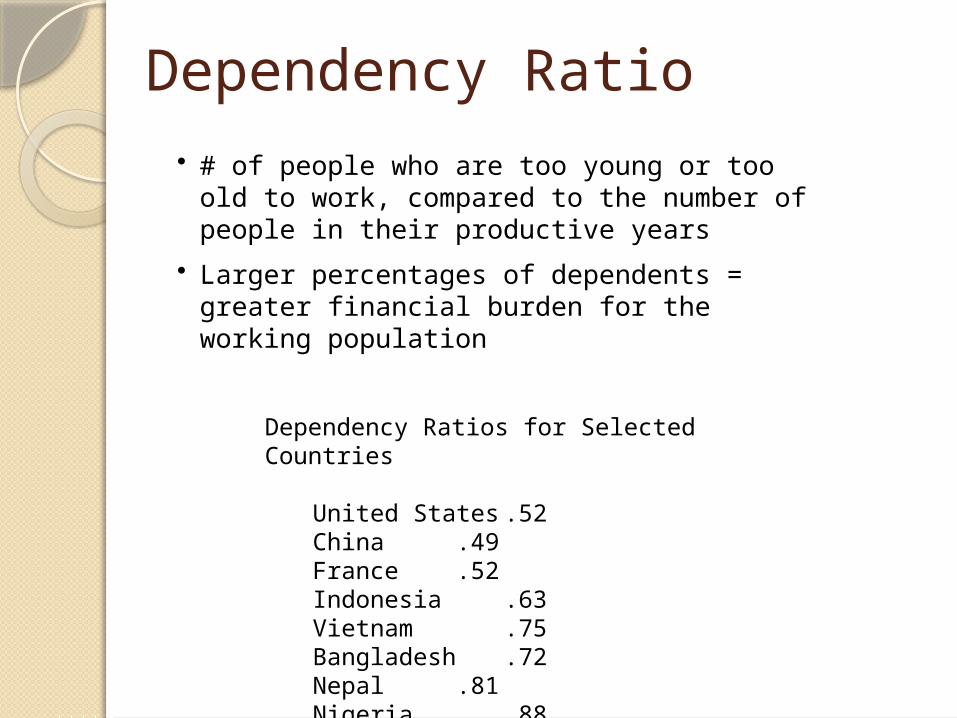
Dependency Ratios for Selected Countries
United States .52China .49France .52Indonesia .63Vietnam .75Bangladesh .72Nepal .81Nigeria .88
• # of people who are too young or too old to work, compared to the number of people in their productive years
• Larger percentages of dependents = greater financial burden for the working population
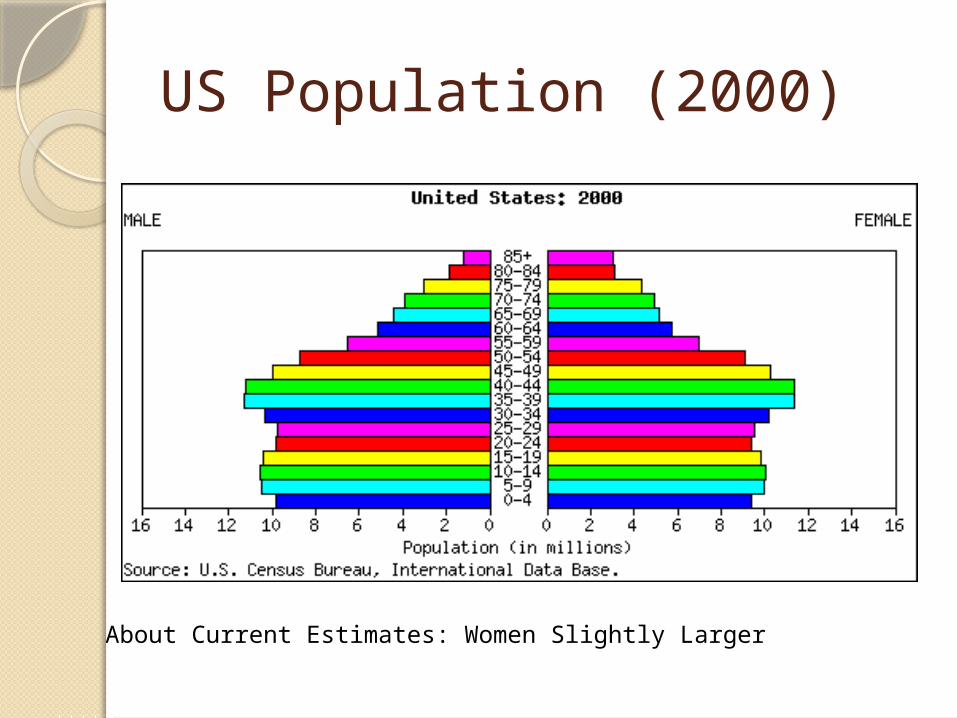
US Population (2000)
About Current Estimates: Women Slightly Larger
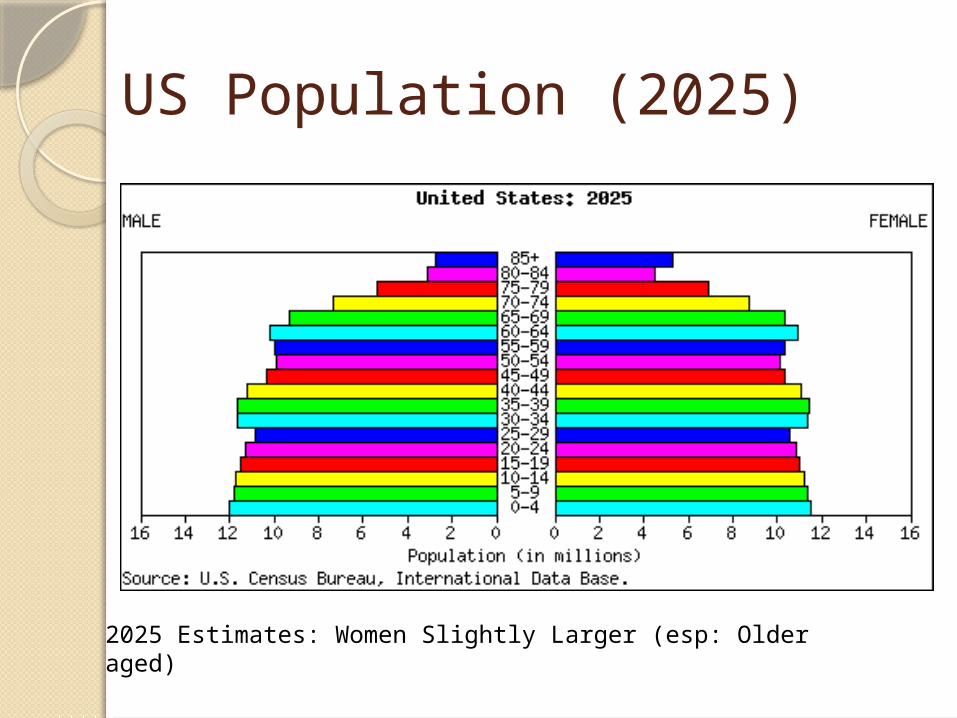
US Population (2025)
2025 Estimates: Women Slightly Larger (esp: Older aged)
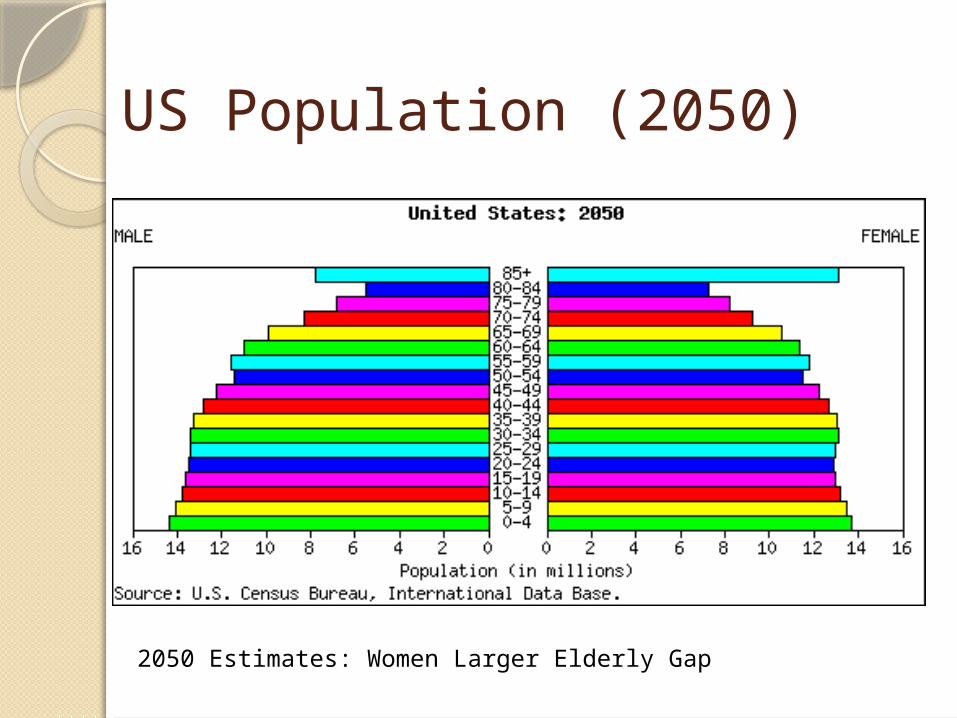
US Population (2050)
2050 Estimates: Women Larger Elderly Gap
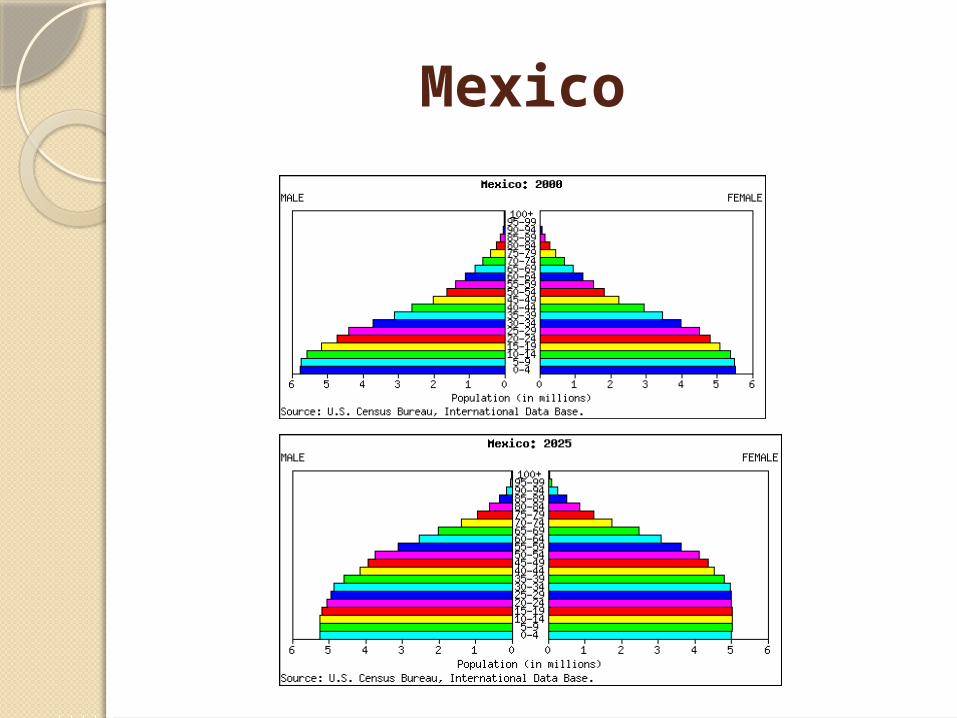
Mexico
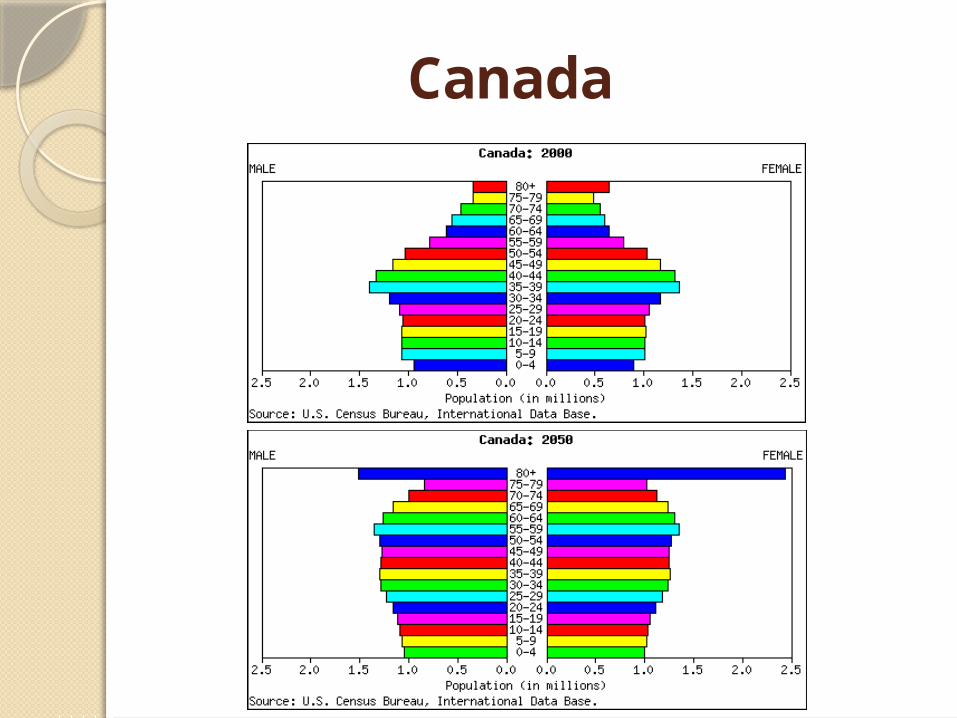
Canada

THE END….
information source: International Data Base, U.S. Census Bureau; applied pyramids were modified using Canvas, GraphicConverter and GIFBuilder.See other countries age