population projections australia - … · million and 5.0 million people respectively in 2051,...
TRANSCRIPT

149Bibliography . . . . . . . . . . . . . . . . . . . . . . . . . . . . . . . . . . . . . . . . . .145Glossary . . . . . . . . . . . . . . . . . . . . . . . . . . . . . . . . . . . . . . . . . . . . .142Explanatory Notes . . . . . . . . . . . . . . . . . . . . . . . . . . . . . . . . . . . . . . .
A D D I T I O N A L I N F O R M A T I O N
78Detailed tables5 . . . . . . . . . . . . . . . . . . . . . . . . . . . . . . . . . . . . . . .49Projection results – States and territories4 . . . . . . . . . . . . . . . . . . . . . .36Projection results – Australia3 . . . . . . . . . . . . . . . . . . . . . . . . . . . . . .
7Assumptions2 . . . . . . . . . . . . . . . . . . . . . . . . . . . . . . . . . . . . . . . . .3Main features1 . . . . . . . . . . . . . . . . . . . . . . . . . . . . . . . . . . . . . . . .
C H A P T E R S
2Notes . . . . . . . . . . . . . . . . . . . . . . . . . . . . . . . . . . . . . . . . . . . . . . . .page
C O N T E N T S
E M B A R G O : 1 1 . 3 0 A M ( C A N B E R R A T I M E ) T U E S 2 9 N O V 2 0 0 5
POPULATION PROJECTIONS A U S T R A L I A
3222.02 0 0 4 T O 2 1 0 1
For further informationabout these and relatedstatistics, contact theNational Information andReferral Service on1300 135 070 orMatthew Montgomery onCanberra (02) 6252 6487.
I N Q U I R I E S
w w w . a b s . g o v . a u

Population estimates and projections in this publication have been rounded to the
nearest hundred. Calculations of percentage and numeric change and proportions are
based on unrounded data.
RO U N D I N G
The projections are not intended as predictions or forecasts, but are illustrations of
growth and change in the population that would occur if assumptions made about future
demographic trends were to prevail over the projection period.
While the assumptions are formulated on the basis of an assessment of past
demographic trends, both in Australia and overseas, there is no certainty that any of the
assumptions will be realised. In addition, no assessment has been made of changes in
non-demographic conditions.
DA T A NO T E S
This publication contains projections of Australia's population by age and sex for the
period 2004–2101, and projections of the states, territories and capital cities/balances of
state for the period 2004–2051. The 30 June 2004 figures are revised estimated resident
population.
Three main series of projections have been presented in this publication. Detailed
information for these series can be obtained free of charge from the ABS web site
<http://www.abs.gov.au>. For further information on additional statistics available see
paragraphs 18–20 of the Explanatory Notes.
AB O U T TH I S I S S U E
Western AustraliaWA
VictoriaVic.
total fertility rateTFR
TasmaniaTas.
statistical local areaSLA
statistical divisionSD
South AustraliaSA
QueenslandQld
Northern TerritoryNT
New South WalesNSW
net overseas migrationNOM
net interstate migrationNIM
estimated resident populationERP
Australian Government Department of Immigration and Multicultural and
Indigenous Affairs
DIMIA
AustraliaAust.
Australian Capital TerritoryACT
Australian Bureau of StatisticsABSAB B R E V I A T I O N S
De n n i s T r e w i n
Au s t r a l i a n S t a t i s t i c i a n
2 A B S • P O P U L A T I O N P R O J E C T I O N S , A U S T R A L I A • 3 2 2 2 . 0 • 2 0 0 4 T O 2 1 0 1
N O T E S

CHAP T E R 1 MA I N FE A T U R E S . . . . . . . . . . . . . . . . . . . . . . . . . . . . . . . . . . . . .
Australia's estimated resident population (ERP) at June 2004 of 20.1 million people is
projected to increase to between 24.9 and 33.4 million in 2051, and to between 22.4 and
43.5 million in 2101. Series A projects the highest growth, while in Series C Australia's
population reaches a peak of 24.9 million in 2048, then declines.
PO P U L A T I O N S I Z E AN D
GR O W T H
(a) From 2050–51.(b) From 2018.(c) From 2007–08 in Series A and C. From 2004–05 in Series B.
22.424.988.084.980 0001.5Series C30.628.288.084.9110 0001.7Series B43.533.495.192.7140 0001.9Series A
millionmillionyearsyearspersons per
yearbabies per
woman
21012051FemalesMales
Net overseas
migration(c)
Total
fertility
rate(b)
Life expectancy
at birth(a)
PROJECTEDPOPULATIONAT 30 JUNEASSUMPTIONS
MAIN PROJECT ION SERIES, Aust ra l ia
The population projections presented in this publication cover the period June 2004 to
June 2101 for Australia and June 2004 to June 2051 for the states, territories, capital cities
and balances of state.
The projections are not predictions or forecasts, but are simply illustrations of the
growth and change in population which would occur if certain assumptions about future
levels of fertility, mortality, internal migration and net overseas migration (NOM) were to
prevail over the projection period.
This chapter discusses the projection results, in terms of population size and growth,
and the changing age structure and distribution of the population. Three main series of
projections, Series A, B and C, have been selected from a possible 72 individual
combinations of the various assumptions.
I N T R O D U C T I O N
A B S • P O P U L A T I O N P R O J E C T I O N S , A U S T R A L I A • 3 2 2 2 . 0 • 2 0 0 4 T O 2 1 0 1 3

The ageing of Australia's population, already evident in the current age structure, will
continue. This is the result of sustained low levels of fertility combined with increasing
life expectancy at birth. The median age of Australia's population, 36.4 years at June 2004,
is projected to increase to between 39.9 years and 41.7 years in 2021 (Series A and C
respectively) and to between 44.6 years and 48.2 years in 2051 (Series A and C).
The age composition of Australia's population is projected to change considerably as a
result of population ageing. By 2051 there will be a much greater proportion of people
aged 65 years and over than in 2004, and a lower proportion of people aged under 15
years. In 2004 people aged 65 years and over made up 13% of Australia's population. This
proportion is projected to increase to between 26% and 38% in 2051 (Series B and C
respectively) and to between 27% and 31% in 2101 (Series B and C). The proportion of
people aged under 15 years is projected to decrease from 20% in 2004 to between 13%
and 16% in 2051 (Series C and A respectively) and to remain within the same range in
2101.
There were just under 300,000 people aged 85 years and over in Australia in 2004,
making up 1.5% of the population. In all main series this group is projected to grow, to
2%–3% by 2021, to 6%–8% by 2051, and to 7%–10% by 2101.
PO P U L A T I O N AG E I N G
Since the early 1990s Australia's population has grown by around 1.2% and 1.3% per year,
with just over half of this growth resulting from natural increase (the excess of births
over deaths) and just under half from net overseas migration (NOM). In 2003–04 there
were 252,100 births in Australia and 133,200 deaths, resulting in natural increase of
118,900 people, while NOM contributed a further 100,000 people to Australia's
population.
In two of the three main series (Series B and C) a state of natural decrease, in which
deaths outnumber births, is reached during the projection period (by 2044 and 2034
respectively). In Series B net overseas migration more than compensates for losses due
to natural decrease, and Australia's population continues to increase throughout the
projection period. In Series C however, gains due to overseas migration fail to
compensate for natural decrease, and as a result Australia's population declines from
2049 onwards.
2001 2021 2041 2061 2081 2101At 30 June
million
20
25
30
35
40
45Series ASeries BSeries C
PROJECTED POPULAT ION, Aust ra l i aPO P U L A T I O N S I Z E AN D
GR O W T H c o n t i n u e d
4 A B S • P O P U L A T I O N P R O J E C T I O N S , A U S T R A L I A • 3 2 2 2 . 0 • 2 0 0 4 T O 2 1 0 1
CH A P T E R 1 • MA I N FE A T U R E S

In Series B, all capital cities are projected to experience higher percentage growth than
their respective balances, resulting in further concentration of Australia's population
within the capital cities. At June 2004, 64% of Australians lived in a capital city. By 2051
this proportion is projected to increase to 66%.
Sydney and Melbourne will remain the two most populous cities in Australia, with 5.6
million and 5.0 million people respectively in 2051, while the population of Darwin is
expected to exceed that of Hobart in 2048.
Capital city growth
Compared to Series B, Series A assumes higher levels of components of population
change (fertility, life expectancy, and migration) while Series C assumes lower levels. As a
result, Series A results in larger projected populations by 2051 and Series C results in
lower populations.
Series A and C
Series B projects continuing population growth throughout the period 2004 to 2051 for
all states and territories other than South Australia and Tasmania.
By 2051 the population of New South Wales is projected to reach 8.7 million people, an
increase of 2.0 million people (or 30%) since 2004, while Victoria is projected to reach
6.6 million people, an increase of 1.6 million people (or 32%).
Queensland is projected to experience the largest increase in population between 2004
and 2051, increasing by 3.0 million people (77%) to reach 6.9 million people, resulting in
Queensland replacing Victoria as Australia's second most populous state in 2041.
Western Australia is projected to increase by 1.2 million people (60%) to reach a
population of 3.2 million people in 2051.
South Australia's population is projected to reach 1.65 million people in 2032, and to
then gradually decrease to 1.58 million people in 2051.
Tasmania's population is projected to peak at 504,500 people in 2023 or 2024, and to
then decrease to 453,000 people in 2051. This is 6% fewer people than in 2004.
The Northern Territory's population is projected to increase by 150,200 people between
2004 and 2051, to 350,000 people. Although a smaller absolute increase than those
projected for the larger states, this is a significant increase (75%, second only to
Queensland's projected increase of 77%) relative to the Northern Territory's 2004
population of just under 200,000 people.
The population of the ACT is projected to increase by 77,500 people (24%) between
2004 and 2051, reaching 401,600 people.
ST A T E S AN D TE R R I T O R I E S
Series B
A B S • P O P U L A T I O N P R O J E C T I O N S , A U S T R A L I A • 3 2 2 2 . 0 • 2 0 0 4 T O 2 1 0 1 5
CH A P T E R 1 • MA I N FE A T U R E S

(c) Includes Other Territories.(a) Estimated resident population, base population.(b) Includes the Australian Capital Territory.
24 864.528 169.733 389.822 988.423 871.424 878.420 091.5Australia(c)
8 447.09 650.111 521.78 196.68 528.78 886.37 279.6Total balance of state
16 413.818 515.721 863.714 788.715 339.415 988.812 809.3Total capital cities(b)
289.5401.6547.1330.1364.5402.1324.1Total Australian Capital Territory
224.3350.0470.5215.3250.9279.2199.8Total Northern Territory
153.0232.3295.5127.5149.7164.8109.4Darwin
335.4453.0620.1466.8504.0543.7482.2Total Tasmania
178.2219.6286.9207.4220.2235.7202.2Hobart
2 578.63 164.53 890.22 328.92 498.42 655.91 978.1Total Western Australia
2 017.62 453.62 999.21 749.41 875.31 994.21 454.6Perth
1 537.51 580.71 736.11 620.71 625.21 635.81 532.7Total South Australia
1 138.51 203.91 326.81 186.91 201.31 212.51 123.2Adelaide
5 744.16 899.08 584.84 816.35 149.25 526.93 888.1Total Queensland
2 778.13 354.74 202.02 238.32 403.62 597.41 777.7Brisbane
6 191.26 574.17 428.75 681.85 761.75 886.84 963.0Total Victoria
4 566.85 041.15 894.64 135.34 253.44 411.23 593.0Melbourne
7 960.48 742.710 107.97 525.47 714.47 944.66 720.8Total New South Wales
5 292.15 608.86 311.64 813.84 871.54 970.94 225.1Sydney
'000'000'000'000'000'000'000
Series CSeries BSeries ASeries CSeries BSeries AObserved
AT 30 JUNE 2051AT 30 JUNE 2021AT 30 JUNE 2004(a)
Cap i t a l c i t y / b a l ance of
s ta t e
POPULAT ION SIZE, Observed and pro jec ted
6 A B S • P O P U L A T I O N P R O J E C T I O N S , A U S T R A L I A • 3 2 2 2 . 0 • 2 0 0 4 T O 2 1 0 1
CH A P T E R 1 • MA I N FE A T U R E S

CHAP T E R 2 AS S U M P T I O N S . . . . . . . . . . . . . . . . . . . . . . . . . . . . . . . . . . . . . . .
Range ofoutcomes
in foreseeablefuture
Current long-term levels
ABS low assumption
ABS high assumption
Assumptions have been formulated on the basis of demographic trends over the past
decade and longer, both in Australia and overseas, in conjunction with consultation with
various individuals and government departments at the national and state/territory level.
They do not attempt to allow for non-demographic factors (such as major government
policy decisions, economic factors, catastrophes, wars) which may affect future
demographic behaviour.
As future levels of fertility, mortality, overseas migration and internal migration are
unpredictable, two or more assumptions have been made for each component. These
are intended to illustrate a range of possible future outcomes, although there can be no
certainty that any particular outcome will be realised, or that future outcomes will
necessarily fall within these ranges.
SU M M A R Y OF
AS S U M P T I O N S
The Australian Bureau of Statistics (ABS) uses the cohort-component method for
producing population projections. In this method, assumptions made about future levels
of fertility, mortality, overseas migration and internal migration are applied to a base
population (split by sex and single year of age) to obtain a projected population for the
following year. The assumptions are then applied to this new (projected) population to
obtain a projected population for the next year. This process is repeated until the end of
the projection period is reached.
The projections span the period June 2004 to June 2101 for Australia, and June 2004 to
June 2051 for the states, territories, capital cities and balances of state.
I N T R O D U C T I O N
A B S • P O P U L A T I O N P R O J E C T I O N S , A U S T R A L I A • 3 2 2 2 . 0 • 2 0 0 4 T O 2 1 0 1 7

Three assumptions have been made about Australia's future levels of net overseas
migration (NOM):
! high assumption: annual NOM gain will increase to 140,000 people per year by
2007–08 and remain constant thereafter;
! medium assumption: annual NOM gain will be constant at 110,000 people per year
throughout the projection period; and
! low assumption: annual NOM gain will decline to 80,000 people per year by 2007–08
and remain constant thereafter.
A zero net overseas migration assumption has been included to facilitate analysis of the
impact of overseas migration to Australia's future population.
Overseas migrat ion
For the mortality component, assumptions are made about future levels of life
expectancy at birth for males and females. Two assumptions have been made:
! medium assumption: life expectancy at birth will reach 84.9 years for males and 88.0
years for females by 2050–51, and remain constant thereafter. Under this assumption
life expectancy at birth will increase by 0.40 years per year for males and 0.30 years
per year for females until 2005–06, then by 0.30 years per year for males and 0.25
years per year for females until 2010–11, after which mortality improvement will
gradually decline until 2050–51; and
! high assumption: life expectancy at birth will reach 92.7 years for males and 95.1
years for females by 2050–51 and remain constant thereafter. Under this assumption
male and female life expectancy at birth will increase by 0.40 years per year for males
and 0.30 years per year for females until 2005–06, then by 0.30 years per year for
males and 0.25 years per year for females until 2050–51.
For both assumptions, the change in age/sex-specific death rates derived from 1991–2002
mortality data is assumed to continue until 2025–26. Thereafter, the age-specific death
rates are scaled to conform to the assumed life expectancy at birth for future years.
Mortal i ty
For the fertility component, assumptions are made about future total fertility rates
(TFRs), age-specific fertility rates, and the sex ratio at birth. Three assumptions have
been made about Australia's future TFR:
! high assumption: the TFR will increase to 1.9 babies per woman by 2018, and remain
constant thereafter;
! medium assumption: the TFR will decline to 1.7 babies per woman by 2018, and
remain constant thereafter; and
! low assumption: the TFR will decline to 1.5 babies per woman by 2018, and remain
constant thereafter.
Under all three scenarios the trend towards older ages of mothers at birth of children is
assumed to continue to 2018, and then remain constant. The sex ratio at birth is
assumed to be 105.5 male births per 100 female births for all years.
Fert i l i ty
8 A B S • P O P U L A T I O N P R O J E C T I O N S , A U S T R A L I A • 3 2 2 2 . 0 • 2 0 0 4 T O 2 1 0 1
CH A P T E R 2 • A S S U M P T I O N S

Future uncertainty, along with the subjective nature of assessing current trends, means
that using a range of possible outcomes rather than a single projection series give a more
realistic view of the possible future size, distribution and age structure of Australia's
population.
Different series, constructed from varying combinations of assumptions, are appropriate
for different time horizons (shorter or longer term), the geographic region(s) in
question, and any volatility in the components. All series can more or less accommodate
possible future levels of fertility and mortality, as both are fairly predictable. There is less
certainty regarding future levels of overseas and interstate migration, given their
historical volatility. This volatility is expected to continue over time due to future
government policies and decision making, and economic, social and other determinants
and influences, in Australia and overseas.
WHICH SERIES TO USE
The assumptions above can be combined to create 54 sets of population projections.
Including a zero net overseas migration assumption increases the total number of
projections to 72. Three main series have been selected to provide a range, although not
the full range, of projections for analysis and discussion in Chapters 3 and 4. These series
are referred to as the 'high' (Series A), 'medium' (Series B) and 'low' (Series C)
projections. At times, to simplify the analysis, the medium series, Series B, has been
chosen.
For Australia the three main series, including projected populations by age and sex,
components of population change, and summary statistics, are published in Chapter 5.
Summary data for the remaining series are also provided. For the states and territories,
capital cities and balances of state, summary information for all series is provided.
Detailed information for the three main series can be obtained free of charge from the
ABS web site <http://www.abs.gov.au>. Data for the remaining series can be made
available on request. A charge is usually incurred for providing this data service. For
further information on additional statistics available see paragraphs 18–20 of the
Explanatory Notes.
SERIES
The base population for all geographic areas is the revised estimated resident population
(ERP) at 30 June 2004.
BASE POPULATION
Three assumptions have been made about future net interstate migration levels:
! high assumption: 'large' net population gains and losses for the states and territories;
! medium assumption: 'medium' net population gains and losses for the states and
territories; and
! low assumption: 'small' net population gains and losses for the states and territories.
The medium series assumptions are based on long-term averages for the states and
territories, while the high and low series provide for a range of possible future outcomes.
Interstate migrat ion
A B S • P O P U L A T I O N P R O J E C T I O N S , A U S T R A L I A • 3 2 2 2 . 0 • 2 0 0 4 T O 2 1 0 1 9
CH A P T E R 2 • A S S U M P T I O N S

(a) High and low interstate migration refer to high/low flow scenarios, and will therefore reflecthigh/low losses rather than high/low gains in some jurisdictions.
727170696867054(C)535251504980 000
363534333231110 000181716151413140 000
LO W FE R T I L I T Y ( 1 . 5 )
666564636261048474645444380 0003029(B)28272625110 000121110987140 000
ME D I U M FE R T I L I T Y (1 . 7 )
605958575655042414039383780 000242322212019110 000
654321(A)140 000
H I G H FE R T I L I T Y ( 1 . 9 )
Net
interstate
migration
(low)(a)
Net
interstate
migration
(medium)
Net
interstate
migration
(high)(a)
Net
interstate
migration
(low)(a)
Net
interstate
migration
(medium)
Net
interstate
migration
(high)(a)
MEDIUM LIFEEXPECTANCY AT BIRTHHIGH LIFE EXPECTANCY AT BIRTH
Net
ove r s ea s
mig ra t i on
PROJECT ION SERIES, Assumpt ions usedWHICH SERIES TO USE
cont inue d
10 A B S • P O P U L A T I O N P R O J E C T I O N S , A U S T R A L I A • 3 2 2 2 . 0 • 2 0 0 4 T O 2 1 0 1
CH A P T E R 2 • A S S U M P T I O N S

(a) Babies per woman.
1923 1943 1963 1983 2003
rate
1.5
2.0
2.5
3.0
3.5
4.0
TOTAL FERTIL ITY RATE (a) , Aust ra l ia
In 1961, at the height of the 'baby boom', Australia's TFR peaked at 3.5 babies per
woman. Since then, fertility has declined, falling sharply during the early 1960s as the oral
contraceptive pill became more widely available, before hovering at 2.9 babies per
woman in the years 1966–1971. The reinterpretation of abortion law in New South Wales
in 1971 in the case of R v Wall et al, had a substantial impact on women's ability to
control their fertility. Subsequently a fall in births to young women contributed to a
further decrease in the TFR and an increase in the median age of mothers (Carmichael,
1998). The TFR reached replacement level (2.1) in 1976, and continued to fall as
increasing numbers of women chose to delay or forgo having children.
Fertility stabilised somewhat during the 1980s, before resuming a more gradual decline
during the 1990s (from 1.9 in 1990 to 1.8 in 1995). Since 1998 the TFR has been relatively
stable, varying between 1.73 and 1.76 babies per woman (ABS, 2004). In 2003 Australia's
TFR was 1.75 babies per woman.
Cohort fertility rates show a similar gradual decline over time, with women born in the
early 1960s, now nearing the end of their reproductive years, having just over two babies,
on average, per woman.
Trends in the total fert i l i ty
rate
Future trends in fertility are an important determinant of Australia's future population
size, structure and growth. To produce ABS population projections using the
cohort-component method, assumptions for each year of the projection period are
required for age-specific fertility rates and the sex ratio at birth.
Three long-term assumptions have been made regarding Australia's future TFR: low
fertility (a TFR of 1.5 babies per woman), medium fertility (1.7) and high fertility (1.9).
The trend towards older ages of mothers at birth of children is assumed to continue to
2018, while the sex ratio at birth is assumed to be 105.5 male births per 100 female
births.
Assumptions for lower geographic levels (state/territory and capital city/balance of state)
are derived from current differentials between Australia and each state/territory, and
between each state/territory and its capital city/balance of state.
FE R T I L I T Y AS S U M P T I O N S
Summary
A B S • P O P U L A T I O N P R O J E C T I O N S , A U S T R A L I A • 3 2 2 2 . 0 • 2 0 0 4 T O 2 1 0 1 11
CH A P T E R 2 • A S S U M P T I O N S

(a) Babies per woman.
1983 1988 1993 1998 2003 2008 2013 2018
rate
1.4
1.5
1.6
1.7
1.8
1.9
2.0
ObservedHigh assumptionMedium assumptionLow assumption
TOTAL FERTIL I TY RATE (a) , Aust ra l ia —Observed and assumed
The three assumptions for Australia's future levels of fertility are made with regard to
recent trends in the TFR, especially those of the last decade.
The high fertility scenario assumes that Australia's TFR will reach 1.9 babies per woman
by 2018 and remain constant thereafter, reflecting levels of fertility recorded since 1975
of between 1.7 and 2.1 babies per woman, and acknowledging the possibility that the
TFR could stabilise in this range.
The medium and low fertility assumptions are based on the downward trend evident in
Australia's TFR over the past two decades. These scenarios assume a continuation of
factors associated with declining fertility, such as delayed childbearing from increased
participation of women in education and in the labour force. Further delays in
childbearing may result in smaller families and increasing childlessness, both of which
would lower the TFR.
The medium scenario assumes a gradual continuation of the downward trend in fertility,
with the TFR reaching 1.7 babies per woman by 2018 and remaining constant thereafter.
This reflects a fertility level already reached in some parts of Australia: Victoria, for
example, recorded a TFR of 1.7 babies per woman in 2003.
Under the low fertility assumption, the TFR is projected to decline at a faster rate,
reaching 1.5 babies per woman by 2018 and remaining constant thereafter. Fertility rates
have reached such levels in many European countries, and recent projections indicate
this is considered a possibility in several others. Within Australia, fertility in the ACT has
fluctuated around 1.5 to 1.6 babies per woman since the late 1990s.
Under the high and medium fertility scenarios an increase in the TFR is assumed for
2004, while for the low fertility scenario the TFR is held constant. Recent birth
registration data suggest that an upswing in fertility may be starting, the dimensions and
duration of which it is not possible to gauge.
Assumed total fert i l i ty
rates
12 A B S • P O P U L A T I O N P R O J E C T I O N S , A U S T R A L I A • 3 2 2 2 . 0 • 2 0 0 4 T O 2 1 0 1
CH A P T E R 2 • A S S U M P T I O N S

(a) Babies per 1,000 women.
15 20 25 30 35 40 45Age (years)
rate
0
30
60
90
120
150199320032018 (High)2018 (Medium)2018 (Low)
AGE-SPECIF IC FERTIL I TY RATES (a) , Aust ra l ia —Observed and assumed
Population projections require assumptions about future age-specific fertility rates,
which are derived from assumed TFRs and age distributions of fertility. These rates are
applied to the projected female population in each year of the projection period in order
to determine future numbers of births, and therefore the size of the future population.
Over the past 10 years, age-specific fertility rates have been declining for the younger age
groups (those below age 30), whilst increasing among women aged 30 years and over,
representing a gradual shift in fertility towards older ages. These trends are assumed to
continue under all three fertility scenarios to 2018.
As a result, the mean age of the fertility schedule has risen from 28.7 years in 1993 to 29.9
years in 2003. Assuming this trend continues, the mean age of the fertility schedule will
increase to 31.9 years by 2018 for all three fertility scenarios.
TFRs of 1.9, 1.7 and 1.5 are assumed for 2018. Linear interpolation is employed to obtain
TFRs for each year between the base year (2004) and 2018. The assumption of
continuing deferment of fertility is calculated by applying the average annual change in
the percentage age distribution of fertility over the last five years to the base distribution,
to obtain the assumed age distribution of fertility. The assumed distribution is then
applied to the assumed TFR for the corresponding projection year.
Trends in age-specif ic
fert i l i ty rates
A B S • P O P U L A T I O N P R O J E C T I O N S , A U S T R A L I A • 3 2 2 2 . 0 • 2 0 0 4 T O 2 1 0 1 13
CH A P T E R 2 • A S S U M P T I O N S

(a) Babies per 1,000 women.(b) Babies per woman.
31.91.501.017.477.1101.464.030.78.4201831.81.521.016.975.9102.166.332.18.9201731.61.530.916.574.7103.068.733.69.3201631.51.550.916.173.5103.871.135.19.8201531.41.570.915.772.3104.673.636.610.3201431.21.590.815.370.9105.576.138.210.8201331.11.610.814.869.6106.378.639.811.3201231.01.620.814.368.2107.181.241.411.9201130.81.640.713.866.7107.983.843.012.4201030.71.660.713.365.2108.786.544.612.9200930.61.680.712.863.6109.589.246.313.5200830.41.700.612.362.0110.391.948.014.0200730.31.710.611.860.4111.194.749.714.6200630.11.730.511.258.7111.897.551.515.2200530.01.750.510.656.9112.6100.353.315.72004
LO W AS S U M P T I O N
31.91.701.119.787.4114.972.634.89.5201831.81.711.119.185.6115.274.836.210.0201731.61.721.118.583.6115.176.837.610.4201631.51.721.017.981.5115.078.838.910.9201531.41.731.017.279.4115.080.840.211.3201431.21.730.916.677.3114.982.941.611.8201331.11.740.916.075.2114.884.942.912.2201231.01.740.815.373.0114.887.044.312.7201130.81.750.814.770.9114.789.145.713.2201030.71.750.714.168.7114.691.247.113.6200930.61.760.713.466.6114.593.348.414.1200830.41.760.712.864.4114.495.449.814.6200730.31.770.612.162.2114.497.551.215.0200630.11.770.611.460.0114.399.652.615.5200530.01.770.510.757.6113.9101.553.915.92004
ME D I U M AS S U M P T I O N
31.91.901.322.097.7128.481.138.910.6201831.81.891.221.194.7127.482.740.111.1201731.61.891.220.391.9126.684.441.311.5201631.51.881.119.589.1125.786.142.511.9201531.41.871.118.786.2124.987.843.712.3201431.21.871.017.983.4124.189.544.912.7201331.11.860.917.280.7123.291.246.113.1201231.01.860.916.477.9122.492.847.313.5201130.81.850.815.675.2121.694.448.413.9201030.71.840.814.872.4120.896.149.614.4200930.61.840.714.069.7119.997.750.714.7200830.41.830.713.367.0119.199.351.915.1200730.31.830.612.564.3118.3100.953.015.5200630.11.820.611.861.7117.5102.454.115.9200530.01.790.510.958.2115.2102.654.516.12004
H I G H AS S U M P T I O N
yearsraterateraterateraterateraterate
45–4940–4435–3930–3425–2920–2415–19
Mean
age
of
motherTFR(b)
AGE GROUP (YEARS)
Yea r
AGE– SPECIF IC FERTIL ITY RATES (a) , Aust ra l ia —AssumedTrends in age-specif ic
fert i l i ty rates cont inue d
14 A B S • P O P U L A T I O N P R O J E C T I O N S , A U S T R A L I A • 3 2 2 2 . 0 • 2 0 0 4 T O 2 1 0 1
CH A P T E R 2 • A S S U M P T I O N S

. . not applicable(a) Average for 2001, 2002 and 2003.(b) Fertility differentials show the relationship of the average TFR for 2001–2003 for each state/territory, capital
city and balance of state to the Australian level.(c) Includes Other Territories.
100.0. .. .1.75. .. .Australia(c)
91.4. .. .1.57. .. .Australian Capital Territory131.7149.4114.32.322.701.96Northern Territory113.0116.5107.91.982.041.89Tasmania
98.4118.292.81.722.021.64Western Australia97.6116.991.41.712.041.60South Australia
101.1106.196.61.791.871.71Queensland95.7110.092.01.661.911.59Victoria
103.3112.499.61.791.951.73New South Wales
%%%rateraterate
Total
Balance
of stateCapital cityTotal
Balance
of stateCapital city
ASSUMED DIFFERENTIAL(b)TOTAL FERTILITY RATE(a)(b)
TOTAL FERTIL ITY RATES AND FERTIL ITY DIFFERENT IALS
TFRs for Australian capital cities are generally lower than TFRs for their respective states
and territories, while TFRs for state balances are higher. In 2003, the TFR for Darwin was
11% lower than the TFR for the Northern Territory overall, while TFRs for Melbourne,
Brisbane, Adelaide and Perth were 4–5% lower than their respective state levels. TFRs for
Sydney and Hobart were 3% lower than the rates for New South Wales and Tasmania
respectively.
Assumed TFRs for the capital cities and state balances are derived by applying the
average differential (for 2001–2003) between the region and its respective state/territory
to the respective state/territory TFR. It is assumed that 2001–2003 based total and
age-specific differentials between the capital city and balance within each state or
territory will remain constant throughout the projection period.
Regional variat ions in
fert i l i ty
In recent years, TFRs for Victoria, South Australia, Western Australia and the ACT have
been lower than rates for Australia as a whole, while TFRs for the remaining states, and
the Northern Territory in particular, have been higher.
Fertility assumptions for the states and territories are derived by applying differentials
based on the years 2001–2003 between each state/territory and Australia to the national
assumption. It is assumed that the state and territory total and age-specific fertility
differentials remain constant throughout the projection period.
State var iat ions in fert i l i ty
Projections require an assumed sex ratio at birth (the ratio of male to female births,
multiplied by 100), so that total projected births can be split into male and female births.
The sex ratio fluctuates around 105.5 males births per 100 female births. The sex ratio
was 105.9 in 2003, 105.2 in 2001, and 105.5 in 1993. A constant ratio of 105.5 male births
per 100 female births has been used for the duration of the projection period.
Trends in the sex rat io
A B S • P O P U L A T I O N P R O J E C T I O N S , A U S T R A L I A • 3 2 2 2 . 0 • 2 0 0 4 T O 2 1 0 1 15
CH A P T E R 2 • A S S U M P T I O N S

In countries where fertility is low, the medium variant of the latest United Nations
projections shows fertility following recently observed trends for the first 5 to 10 years
following 2005, before increasing slowly until 2045–2050. According to this variant, all
TFRs are projected to converge towards 1.85 babies per woman, though not all countries
reach this level during the projection period.
International project ions
Fertility levels vary considerably between countries. There are many factors that can
influence a country's fertility rate, such as differences in social and economic
development and contraceptive prevalence. In general, developing countries have higher
fertility rates while developed countries have lower fertility rates. According to the
Population Reference Bureau (PRB) 2004 world population data sheet, more-developed
countries have an average TFR of 1.6, while less-developed countries have an average
TFR of 3.1.
Australia's TFR for 2003 of 1.75 babies per woman is one of the lowest in the world, and
well below the PRB world average of 2.8 babies per woman. Compared to other
developed countries, Australia's TFR is among the middle ranked nations. Fertility in
Hong Kong has reached 0.9 babies per woman, while several European countries have
very low fertility (Poland, Romania and the Ukraine, all 1.2), as does Japan (1.3). In
contrast, African countries have relatively high fertility rates, with Niger (8.0) and Somalia
(7.1) among the highest.
International fertility rates provide a frame of reference for the three fertility assumptions
made for Australia in the current set of population projections. A TFR of 1.9, as assumed
under the high fertility scenario, equates to the current fertility level in France and is
comparable to countries such as New Zealand, Ireland and the United States (all 2.0).
The medium fertility scenario (a TFR of 1.7) would bring Australian fertility into line with
current levels in countries such as the United Kingdom, China, Sweden and Thailand. At
1.5, Australia's assumed low fertility scenario TFR is comparable to current levels in
countries such as Canada and Switzerland (1.5 and 1.4 respectively).
International context
(b) Includes Other Territories.. . not applicable(a) Babies per woman.
1.50. .. .1.70. .. .1.90. .. .Australia(b)
1.37. .. .1.55. .. .1.74. .. .Australian Capital Territory1.982.241.712.242.541.942.502.842.17Northern Territory1.701.751.621.921.981.842.152.212.05Tasmania1.481.771.391.672.011.581.872.251.76Western Australia1.461.751.371.661.991.551.862.221.74South Australia1.521.591.451.721.801.641.922.021.83Queensland1.441.651.381.631.871.561.822.091.75Victoria1.551.691.491.761.911.691.962.141.89New South Wales
rateraterateraterateraterateraterate
Total
Balance
of state
Capital
cityTotal
Balance
of state
Capital
cityTotal
Balance
of state
Capital
city
LOW ASSUMPTIONMEDIUM ASSUMPTIONHIGH ASSUMPTION
ASSUMED TOTAL FERTIL ITY RATES (a) , From 2018 —States and ter r i to r ies
16 A B S • P O P U L A T I O N P R O J E C T I O N S , A U S T R A L I A • 3 2 2 2 . 0 • 2 0 0 4 T O 2 1 0 1
CH A P T E R 2 • A S S U M P T I O N S
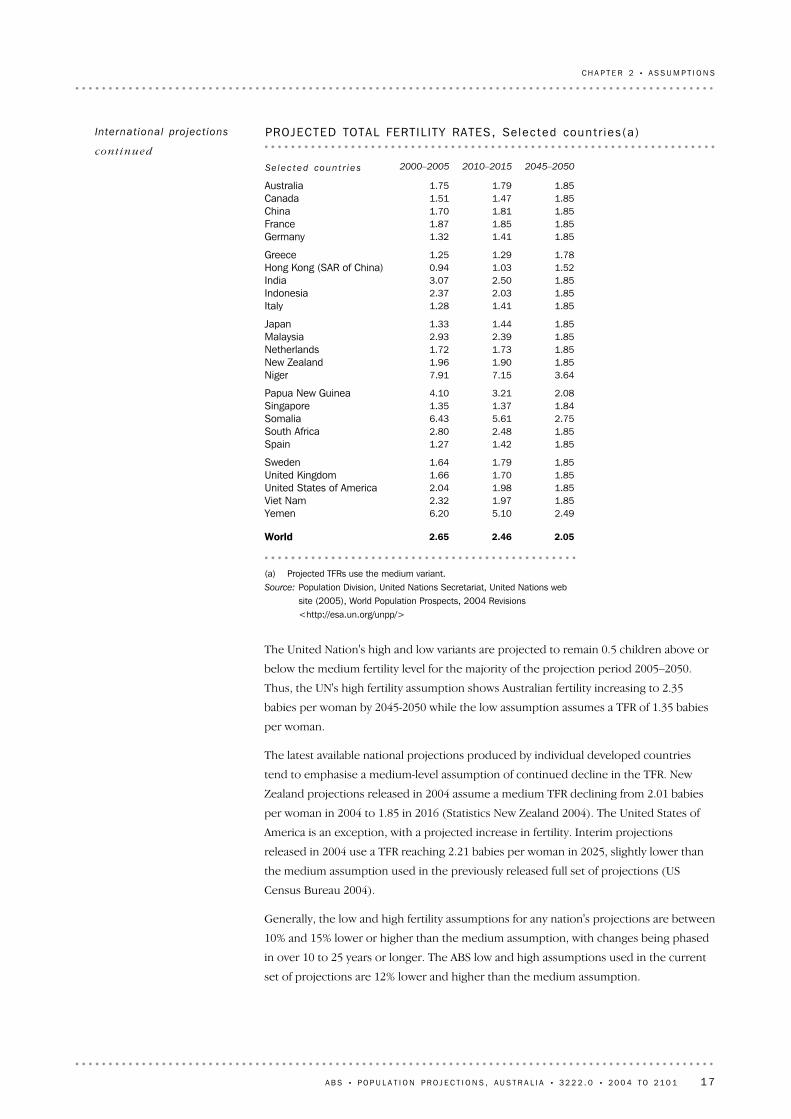
The United Nation's high and low variants are projected to remain 0.5 children above or
below the medium fertility level for the majority of the projection period 2005–2050.
Thus, the UN's high fertility assumption shows Australian fertility increasing to 2.35
babies per woman by 2045-2050 while the low assumption assumes a TFR of 1.35 babies
per woman.
The latest available national projections produced by individual developed countries
tend to emphasise a medium-level assumption of continued decline in the TFR. New
Zealand projections released in 2004 assume a medium TFR declining from 2.01 babies
per woman in 2004 to 1.85 in 2016 (Statistics New Zealand 2004). The United States of
America is an exception, with a projected increase in fertility. Interim projections
released in 2004 use a TFR reaching 2.21 babies per woman in 2025, slightly lower than
the medium assumption used in the previously released full set of projections (US
Census Bureau 2004).
Generally, the low and high fertility assumptions for any nation's projections are between
10% and 15% lower or higher than the medium assumption, with changes being phased
in over 10 to 25 years or longer. The ABS low and high assumptions used in the current
set of projections are 12% lower and higher than the medium assumption.
(a) Projected TFRs use the medium variant.Source: Population Division, United Nations Secretariat, United Nations web
site (2005), World Population Prospects, 2004 Revisions<http://esa.un.org/unpp/>
2.052.462.65World
2.495.106.20Yemen 1.851.972.32Viet Nam1.851.982.04United States of America1.851.701.66United Kingdom1.851.791.64Sweden
1.851.421.27Spain1.852.482.80South Africa2.755.616.43Somalia 1.841.371.35Singapore2.083.214.10Papua New Guinea
3.647.157.91Niger1.851.901.96New Zealand1.851.731.72Netherlands1.852.392.93Malaysia1.851.441.33Japan
1.851.411.28Italy1.852.032.37Indonesia1.852.503.07India1.521.030.94Hong Kong (SAR of China)1.781.291.25Greece
1.851.411.32Germany1.851.851.87France1.851.811.70China1.851.471.51Canada1.851.791.75Australia
2045–20502010–20152000–2005Se l ec t ed coun t r i e s
PROJECTED TOTAL FERTIL ITY RATES, Selec ted count r ies (a )International project ions
cont inue d
A B S • P O P U L A T I O N P R O J E C T I O N S , A U S T R A L I A • 3 2 2 2 . 0 • 2 0 0 4 T O 2 1 0 1 17
CH A P T E R 2 • A S S U M P T I O N S

Between 1980–1982 and 2001–2003, life expectancy has improved each year by around
0.30 years for males and 0.25 years for females. This trend has been observed since the
early 1970s. For both sexes the smallest increase during this period was recorded
between 1995–1997 and 1996–1998 (with male life expectancy increasing by 0.17 years
and female life expectancy by 0.15 years) while the largest growth was recorded between
1902 1922 1942 1962 1982 2002
Age (years)
50
60
70
80
90MalesFemales
LIFE EXPECTANCY AT BIRTH, Aust ra l i a
Male life expectancy at birth has increased from 55.2 years in the period 1901–1910 to
77.8 years in 2001–2003. Over the same period female life expectancy increased from
58.8 years to 82.8 years. The gains made in the early part of the 20th century are
primarily attributed to improved living conditions such as improved water supply,
sewerage systems, food quality and health education. The continuing increases in the
latter part of that century are mainly due to improving social conditions and advances in
medical technology such as mass immunisation and antibiotics.
The past two decades have seen further improvements in life expectancy. These
increases are due in part to lower infant mortality, fewer deaths among children and
young adults from accidents, and fewer deaths among older men from heart disease.
Trends in life expectancy
Australian life expectancy has improved steadily for both men and women since
Federation. While continued improvements in life expectancy are anticipated, the extent
of any further increase is a matter for debate. Many assume there is an upper limit to
human longevity. However, what that limit may be, when humanity will reach it and how
mortality will be experienced until that time are uncertain (Booth, MainDonald & Smith,
2002).
For the purpose of these projections, one assumption is that life expectancy will
continue to improve until 2010–11 and then gradually slow down to give a projected life
expectancy of 84.9 years for males and 88.0 years for females in 2050–51. An alternative
assumption is that life expectancy will continue to improve at the historical rate to the
end of the projection period, giving a projected life expectancy of 92.7 years for males
and 95.1 years for females in 2050–51.
Assumptions for mortality at lower geographical levels are based on 2001–2003
differentials between Australia and each state/territory, and between each state/territory
and its capital city/balance of state.
MO R T A L I T Y AS S U M P T I O N S
Summary
18 A B S • P O P U L A T I O N P R O J E C T I O N S , A U S T R A L I A • 3 2 2 2 . 0 • 2 0 0 4 T O 2 1 0 1
CH A P T E R 2 • A S S U M P T I O N S

The medium mortality assumption assumes life expectancy at birth will reach 84.9 years
for males and 88.0 years for females by 2050–51, from the 2001–2003 levels of 77.8 years
for males and 82.8 years for females, and remain constant thereafter. Specifically, it is
assumed that life expectancy at birth will increase by 0.40 years per year for males and
0.30 years per year for females until 2005–06, then by 0.30 years per year for males and
0.25 years per year for females until 2010–11, after which mortality improvement will
gradually decline until 2050–51.
The high assumption assumes life expectancy at birth will reach 92.7 years for males and
95.1 years for females by 2050–51 and remain constant thereafter. Specifically, it is
assumed that life expectancy at birth will increase by 0.40 years per year for males and
0.30 years per year for females until 2005–06, then by 0.30 years per year for males and
0.25 years per year for females until 2050–51.
Assumed life expectancy
at birth
The faster increase in male life expectancy has narrowed the gap between male and
female expectation of life. In 2001–2003 female life expectancy exceeded male life
expectancy by 5.1 years, in contrast to the peak difference of 7.0 years in 1980–1982.
. . not applicable(a) Life expectancy calculated using three years of data.(b) Over previous period.(c) Australian Government Actuary estimates for Census years.(d) Based on linear trend between 1970–1972 and 2001–2003.
. .0.250.30. .. .Average annual increase(d)
5.080.250.3682.8477.762001–20035.190.180.3782.5977.402000–20025.380.370.4782.4177.031999–20015.480.270.3482.0476.561998–20005.550.250.3681.7776.221997–19995.660.150.1781.5275.861996–1998
5.230.300.3982.8777.642000–2002(c)5.680.200.2781.3775.691995–1997(c)6.070.240.3280.3974.321990–1992(c)6.460.190.3079.2072.741985–1987(c)7.04. .. .78.2771.231980–1982(c)
yearsyearsyearsyearsyears
FemalesMalesFemalesMales
Difference
between
female and
male life
expectancy
INCREASEPER YEAR(b)
LIFE EXPECTANCYAT BIRTH
Per i od
LIFE EXPECTANCY AT BIRTH (a) , 1980– 1982 to 2001– 2003
1998–2000 and 1999–2001 (with male life expectancy increasing by 0.47 years and female
life expectancy by 0.37 years).
Trends in life expectancy
cont inue d
A B S • P O P U L A T I O N P R O J E C T I O N S , A U S T R A L I A • 3 2 2 2 . 0 • 2 0 0 4 T O 2 1 0 1 19
CH A P T E R 2 • A S S U M P T I O N S

The inputs of the mortality component into producing population projections are
'survivorship ratios' obtained from projected life tables. Life tables for each year up to
2050–51 are calculated in two steps: (1) expectancy of life at birth for each projection
year is determined; and (2) a life table is generated which gives the desired life
expectancy at birth and allows for a shift in the age curve of mortality over time.
The shifting age curve of mortality over time should ideally represent current trends in
age-sex differentials projected into the future. To achieve this, rates of change indicative
of recent trends for each age-sex group are incorporated in the production of the
projected life tables. Determining assumed rates of change was achieved by observing
historical patterns in age-specific death rates.
Between 1981 and 2002 children aged 1–14 experienced the fastest decline in
age-specific death rates. Infants, males aged 50–59 and females aged 45–59 also
experienced notable improvements in mortality. Death rates of males aged 30–39 years
and females aged 30–34 years showed little improvement. Males aged 85–94 years and
females aged 90–99 years also showed little improvement. In more recent times
(1991–2002) the fastest declines in male mortality were for those aged 55–69 years and in
female mortality, for those aged 0–9 years. All age-specific death rates declined over the
1981–2002 period.
Trends in age-specif ic
death rates
(a) Includes an adjustment to account for the transition from life expectancy at birth for year ended 31 December 2002 (i.e.2001–2003) to life expectancy at birth for year ended 30 June 2006.
2.480.250.3095.1492.662050–513.730.250.3088.8985.162025–263.980.250.3087.6483.662020–214.230.250.3086.3982.162015–164.480.250.3085.1480.662010–114.730.300.40(a)83.89(a)79.162005–06
CO N S T A N T IM P R O V E M E N T IN L I F E EX P E C T A N C Y ( h i g h a s s u m p t i o n )
3.130.050.0888.0484.912050–513.880.080.1086.7982.912025–263.980.100.1586.3982.412020–214.230.150.2085.8981.662015–164.480.250.3085.1480.662010–114.730.300.40(a)83.89(a)79.162005–06
DE C L I N I N G IM P R O V E M E N T IN L I F E EX P E C T A N C Y (m e d i u m a s s u m p t i o n )
yearsyearsyearsyearsyears
FemalesMalesFemalesMales
Difference between
female and male
life expectancy
INCREASE PER YEARLIFE EXPECTANCY AT BIRTH
Per i od
LIFE EXPECTANCY AT BIRTH, Assumed
20 A B S • P O P U L A T I O N P R O J E C T I O N S , A U S T R A L I A • 3 2 2 2 . 0 • 2 0 0 4 T O 2 1 0 1
CH A P T E R 2 • A S S U M P T I O N S

(a) Rates of change are based on a linear trend fitted to age-specific death rates for eachof the time periods shown.
0 5–9 15–19 25–29 35–39 45–49 55–59 65–69 75–79 85–89 95–99
change(%)
–0.10
–0.08
–0.06
–0.04
–0.02
0
Accepted1981–20021991–20021996–2002
RATE OF CHANGE (a) , Age-spec i f i c death rates —Females
(a) Rates of change are based on a linear trend fitted to age-specific death rates for eachof the time periods shown.
0 5–9 15–19 25–29 35–39 45–49 55–59 65–69 75–79 85–89 95–99
change(%)
–0.10
–0.08
–0.06
–0.04
–0.02
0
Accepted1981–20021991–20021996–2002
RATE OF CHANGE (a) , Age-spec i f i c death rates —Males
Rates of change identified as representative of recent trends in age-sex differentials, and
used to generate the projected life tables, were based on the 1991–2002 trends in
age-specific death rates. Some adjustments were made to prevent future age-specific
death rates for females exceeding those for males. The assumed rates of change continue
to 2025–26, after which age-specific death rates are scaled up or down to conform to the
assumed life expectancy at birth for future years.
Rate of change in
age-specif ic deaths rates
A B S • P O P U L A T I O N P R O J E C T I O N S , A U S T R A L I A • 3 2 2 2 . 0 • 2 0 0 4 T O 2 1 0 1 21
CH A P T E R 2 • A S S U M P T I O N S

Mortality differentials continue to exist across the states and territories, and between
capital cities and their respective balances of state. It is assumed that the mortality
differentials based on those observed during 2001–2003 will remain throughout the
projection period. Additional adjustments were made to some differentials to ensure
projected deaths were consistent with the historical trend.
Assumed state and
terr i tory and capital
city/balance of state
mortal i ty dif ferent ials
FEMALE MORTAL ITY RATES (a) , Medium assumpt ion
0.0001
0.001
0.01
0.1
1
0 5 15 25 35 45 55 65 75 85 95Age (years)
rate(b)
2001�20032024�20262050�2052
(a) Mortality rates are the q(x) values from the life table.
(b) Y-axis is on a logarithm scale.
MALE MORTAL ITY RATES (a) , Medium assumpt ion
0.0001
0.001
0.01
0.1
1
0 5 15 25 35 45 55 65 75 85 95Age (years)
rate(b)
2001�20032024�20262050�2052
(a) Mortality rates are the q(x) values from the life table.
(b) Y-axis is on a logarithm scale.
Projected age-specific mortality rates show significant declines for males and females in
all age groups except those around 30–39 years and at the very oldest ages (95 years and
over). The ratio of male to female projected mortality rates continues to show higher
male to female mortality.
Assumed age-specif ic
mortal i ty rates
22 A B S • P O P U L A T I O N P R O J E C T I O N S , A U S T R A L I A • 3 2 2 2 . 0 • 2 0 0 4 T O 2 1 0 1
CH A P T E R 2 • A S S U M P T I O N S

Australian life expectancy is currently amongst the highest in the world. According to the
Population Reference Bureau (PRB) 2004 world data sheet, the combined life expectancy
of males and females globally is 67 years. Australian life expectancy (estimated by the PRB
to be 80 years for both males and females combined) is above that for countries such as
the United States of America (77 years), Greece (78 years), New Zealand (78 years),
United Kingdom (78 years) and Canada (79 years). Australia's current life expectancy of
80 years is similar to that of Italy, Norway, Sweden and Switzerland (each 80 years), but
behind Hong Kong (81 years) and Japan (82 years).
The United Nations (2005) projects global life expectancy to reach 75 years by 2045–2050
and Australian life expectancy to be 85 years, continuing to rank amongst the highest in
the world. The ABS projected life expectancy for males and females combined in
2050–51 is 86.4 years under the medium assumption and 93.9 years under the high
assumption.
International comparison
of project ions
. . not applicable(a) Mortality differentials for the states and territories are based on the relationship of 1981–2003 and 2001–2003 life
expectancies at birth, compared with the Australian level. Mortality differentials for the capital cities and balances of state arebased on 2001–2003 life expectancies at birth, compared with the Australian level.
(b) Includes Other Territories.
100.0. .. .100.0. .. .82.877.8Australia(b)
100.9. .. .102.0. .. .83.879.2Australian Capital Territory93.089.096.592.786.997.077.372.0Northern Territory98.097.998.098.197.298.481.476.6Tasmania
100.499.7101.0100.699.3101.283.078.1Western Australia99.899.799.999.898.4100.282.777.7South Australia99.598.799.799.398.999.982.877.6Queensland
100.199.1100.7100.398.8101.283.178.2Victoria99.899.3100.499.898.6100.882.977.7New South Wales
%%%%%%yearsyears
State/
territory
Balance
of state
Capital
city
State/
territory
Balance
of state
Capital
cityFemalesMales
FEMALE MORTALITYDIFFERENTIALS
MALE MORTALITYDIFFERENTIALS
LIFEEXPECTANCYAT BIRTH,2001–2003
LIFE EXPECTANCY AT BIRTH AND MORTAL ITY DIFFERENT IALS (a)
A B S • P O P U L A T I O N P R O J E C T I O N S , A U S T R A L I A • 3 2 2 2 . 0 • 2 0 0 4 T O 2 1 0 1 23
CH A P T E R 2 • A S S U M P T I O N S

(a) Medium variant.Source: Population Division, United Nations Secretariat, United Nations web site (2005), World Population
Prospects, 2004 Revisions <http://esa.un.org/unpp/>
9.89.677.572.872.367.767.763.2World
14.312.776.071.870.766.961.759.1Yemen5.05.385.079.982.376.980.074.6United States of America4.85.685.481.582.978.680.675.9United Kingdom5.35.687.683.484.880.682.377.8Sweden5.25.688.381.485.678.583.175.8Spain
15.813.871.668.563.661.955.854.7Papua New Guinea17.616.861.961.050.550.544.344.2Niger
5.05.786.382.483.980.081.376.7New Zealand4.85.085.880.683.378.081.075.6Netherlands7.25.892.584.189.281.385.378.3Japan
5.15.488.182.285.479.483.076.8Italy10.310.378.974.973.770.368.664.6Indonesia13.412.178.173.872.068.164.761.7India
4.95.189.583.786.881.084.678.6Hong Kong (SAR of China)3.74.084.579.682.677.580.875.6Greece
5.15.386.580.984.078.481.475.6Germany5.05.788.081.585.378.583.075.8France7.66.880.976.676.972.273.369.8China5.35.787.783.084.980.282.477.3Canada4.65.187.482.785.180.482.877.6Australia
yearsyearsyearsyearsyearsyearsyearsyears
FemalesMalesFemalesMalesFemalesMalesFemalesMales
INCREASE2000–2005 TO2045–20502045–20502020–20252000–2005
Se l ec t ed coun t r i e s
PROJECTED LIFE EXPECTANCY AT BIRTH (a) , Selec ted count r iesInternational comparison
of project ions cont inu ed
24 A B S • P O P U L A T I O N P R O J E C T I O N S , A U S T R A L I A • 3 2 2 2 . 0 • 2 0 0 4 T O 2 1 0 1
CH A P T E R 2 • A S S U M P T I O N S

Net overseas migration consists of two parts: permanent movement and long-term
movement (stays of 12 months or more). Migration adjustment is added to these
components to calculate NOM. Due to the provisional nature of estimation of migration
adjustment, and because long-term movement is likely to be more affected by the review
of migration adjustment than permanent movement, long-term movement and
migration adjustment are considered together. Permanent movement is also affected,
but to a lesser extent.
Components of net
overseas migrat ion
Annual levels of NOM have fluctuated considerably in Australia. Over the last 12 years,
the level has varied between 30,000 (1992–93) and 135,700 (2000–01). In 2003–04 NOM
was 117,600 people.
Measures of NOM in recent years have been affected by the calculation of migration
adjustment (previously known as category jumping). Migration adjustment accounts for
differences between intended duration of stay (in the case of visitors) or absence (in the
case of residents) recorded by travellers, and the length of time travellers actually spend
in Australia or overseas. For further information see Australian Demographic Statistics,
December Quarter 2004 (cat. no. 3101.0).
Recently, the ABS has identified that many travellers spend extended periods in Australia
(visitors) or overseas (residents) without an unbroken 12-month period. This can arise
where, for instance, overseas students visiting Australia for several years return to their
country of origin for end-of-year holidays.
The method used to calculate migration adjustment was found to produce erroneous
results for the period 1997–98 to 2000–01. Migration adjustment was therefore set to
zero until the method could be reviewed. As a result of a preliminary review, the
problem of interrupted periods of stay or absence was discovered and this has resulted
in a further review of the method. The outcome of this review is pending.
Trends
Three assumptions have been made about Australia's future levels of net overseas
migration: 140,000 people per year from 2007–08 (high assumption), 110,000 people per
year throughout the entire projection period (medium assumption), and 80,000 people
per year from 2007–08 (low assumption). These levels are based on 10-year moving
averages of NOM over the last 50 years, and recent increases in NOM. The assumed
future levels also incorporate past fluctuations in NOM and the associated influence of
economic cycles. In addition, consideration was given to the ageing of the population
and expected increases in aged dependency ratios.
NE T OV E R S E A S
MI G R A T I O N
Summary
A B S • P O P U L A T I O N P R O J E C T I O N S , A U S T R A L I A • 3 2 2 2 . 0 • 2 0 0 4 T O 2 1 0 1 25
CH A P T E R 2 • A S S U M P T I O N S

P e r m a n e n t mo v e m e n t
Numbers of permanent arrivals (settlers) are affected by Federal Government annual
migration and humanitarian program targets. However, many permanent arrivals (mainly
New Zealand citizens) come to Australia without the requirement of a visa prior to travel.
In 2003–04, of the 111,600 permanent arrivals who came to Australia, 'non-program'
migration comprised 20,000 (18%). Permanent departures are unrestricted. Permanent
departures have been lower than permanent arrivals each year since shortly after the
Second World War.
L on g - t e r m mo v e m e n t
It might be expected that, over time, long-term movement would have no impact on
population size, as theoretically all long-term resident departures and long-term visitor
arrivals return to their original country of residence. However this does not happen for
many reasons, such as deaths, births to overseas visitors, granting of permanent visas
onshore, indefinite overstayers or erroneous reporting by travellers. The number of
overseas visitors granted permanent residency after arriving in Australia rose to 36,700 in
2003–04, although it is not known what proportion of these reported their arrival as
short-term, long-term or permanent (Department of Immigration and Multicultural and
Indigenous Affairs, 2004).
Also, if numbers of long-term visitor arrivals continue to increase, and remain higher
than numbers of long-term resident departures, then in most circumstances net
long-term movement will remain positive. As it is not possible to determine how many
long-term movers complete the second leg of their journey, the net long-term
component is based on recent trends.
Further, as mentioned above, the method used to estimate migration adjustment is likely
to be revised, therefore assumptions for long-term movement have been considered
together with migration adjustment. In the table on page 28 (Overseas migration,
Australia—Category of movement: Observed and assumed), net long-term visitor
movements and migration adjustment are presented in aggregate. This measure has
fluctuated between a low of 9,000 and a high of 84,900 over the 10-year period to
2003–04.
Components of net
overseas migrat ion
cont inue d
26 A B S • P O P U L A T I O N P R O J E C T I O N S , A U S T R A L I A • 3 2 2 2 . 0 • 2 0 0 4 T O 2 1 0 1
CH A P T E R 2 • A S S U M P T I O N S

Assumed values of the components of overseas migration were generated by analysing
the trends of each component and their interrelationship.
Under the high assumption, it is assumed there will be 60,000 net permanent
movements and 73,000 net long-term and migration adjustment movements in 2004–05.
From then, net permanent movements will increase while net long-term and migration
adjustment movements will decrease, such that by 2007–08 these numbers will each be
70,000 movements, resulting in NOM of 140,000 for the year. For the remainder of the
projection period NOM is held constant at this level.
Assumed components of
overseas migrat ion
Three assumptions have been made about Australia's future levels of net overseas
migration: 140,000 people per year from 2007–08 (high assumption), 110,000 people per
year throughout the entire projection period (medium assumption), and 80,000 people
per year from 2007–08 (low assumption).
Historically there has been only a slight relationship between population size and NOM,
unlike births and deaths. Despite the population more than doubling over the period,
NOM has fluctuated across a wide range, exceeding the 2004 level (117,600) for ten of
those years and falling below the 1955 level (81,900) for 27 of those years. Assumptions
for NOM have therefore been set at numeric levels rather than rates, in contrast to
assumptions on fertility and mortality.
Over the last fifty years NOM has exceeded 140,000 in two years only (1988 and 1989),
whereas levels have fallen below 80,000 for twenty of those years. Over the past ten years
however, levels of NOM have increased. The high and medium assumptions are
therefore based on this more recent trend, as well as the possibility of increasing
demand for skilled labour immigration in response to rising aged dependency ratios as a
result of the ageing of Australia's population.
In addition to the three main assumptions, a zero NOM scenario has been included. This
is intended to facilitate analysis of population growth and provide an indication of the
cumulative effect of varying levels of NOM over the projection period.
(a) The average net overseas migration for the previous ten years.
1951 1961 1971 1981 1991 2001 2011 2021 2031 2041 2051Year ended 30 June
'000
0
30
60
90
120
150
180
ObservedMoving averageLow assumptionMedium assumptionHigh assumption
NET OVERSEAS MIGRAT ION, Observed, 10 year mov ing average(a)and assumed
Assumed future levels of NOM were developed by analysing a 10-year moving average
over the last fifty years. This average represents medium long-term levels.
Assumed net overseas
migrat ion
A B S • P O P U L A T I O N P R O J E C T I O N S , A U S T R A L I A • 3 2 2 2 . 0 • 2 0 0 4 T O 2 1 0 1 27
CH A P T E R 2 • A S S U M P T I O N S

(a) Annual averages. Numbers are rounded.
80 00045 000–5 00040 00092 00045 00087 00085 0002008–210185 00046 000–5 00044 00092 00046 00087 00090 000200790 00047 000–5 00048 00092 00047 00087 00095 0002006
100 00055 000–5 00050 00092 00050 00087 000100 0002005
LO W AS S U M P T I O N
110 00055 000055 00090 00055 00090 000110 0002008–2101110 00055 000055 00090 00055 00090 000110 0002007110 00055 000055 00090 00055 00090 000110 0002006110 00055 000055 00090 00055 00090 000110 0002005
ME D I U M AS S U M P T I O N
140 00065 0005 00070 00087 00065 00092 000135 0002008–2101137 00066 0005 00066 00087 00064 00092 000130 0002007135 00067 0005 00063 00087 00062 00092 000125 0002006133 00068 0005 00060 00087 00060 00092 000120 0002005
H I G H AS S U M P T I O N
117 63251 05614 06452 51284 33659 07898 400111 5902004116 49863 4749 57343 45186 21150 46395 78493 9142003110 55673 370–3 47340 65992 07148 24188 59888 9002002135 67384 880–10 05260 84592 94546 52182 893107 3662001107 27561 348–5 26751 19484 91841 07879 65192 2722000
96 48362 472–14 95148 96282 86135 18167 91084 143199979 16228 8844 93645 34279 42231 98584 35877 327199887 07924 7916 39355 89573 77729 85780 17085 7521997
104 13724 7158 95370 46970 25328 67079 20699 139199680 1258 95910 68660 48068 37726 94879 06387 428199571 2501 721–1 09370 62265 32128 65964 22999 2811990 to 1994(a)
121 31524 1262 81094 37951 69720 10554 506114 4841985 to 1989(a)
OB S E R V E D
no.no.no.no.no.no.no.no.
Net
overseas
migration
Long-term
visitors &
migration
adjustment
Long-term
residentsPermanent
Long-term
resident
departures
Permanent
departures
Long-term
resident
arrivals
Permanent
arrivalsYea r ended
30 June
OVERSEAS MIGRAT ION, Aust ra l i a —Category of movement : Obser ved and assumed
Under the medium assumption, it is assumed there will be 55,000 net permanent
movements and 55,000 net long-term and migration adjustment movements in 2004–05.
These levels are held constant throughout the projection period, resulting in NOM of
110,000 per year.
Under the low assumption, it is assumed there will be 50,000 net permanent movements
and 50,000 net long-term and migration adjustment movements in 2004–05. These are
assumed to decrease to 40,000 each by 2007–08, resulting in NOM of 80,000 per year. For
the remainder of the projection period NOM is held constant at this level.
Assumed components of
overseas migrat ion
cont inue d
28 A B S • P O P U L A T I O N P R O J E C T I O N S , A U S T R A L I A • 3 2 2 2 . 0 • 2 0 0 4 T O 2 1 0 1
CH A P T E R 2 • A S S U M P T I O N S

(a) Includes Other Territories.(b) All series. Based on analysis of last 5 years, including and excluding migration adjustment (category
jumping).
100.00.50.60.513.83.520.025.535.62008100.00.50.60.513.83.519.525.536.12007100.00.50.60.513.83.519.025.536.62006100.00.50.60.513.83.518.525.537.12005
AS S U M E D SH A R E (b) (% )
117 63221560763817 1465 49219 67034 55239 3302004116 4988853251 01415 5753 90427 12226 77740 9192003110 55669865530714 9702 79826 48820 25244 4112002135 67371987810116 2632 76521 00335 33658 6192001107 275–9994243513 9933 82917 51426 98243 6892000
96 483–2251 00617113 3812 68213 71024 69141 088199979 162–2425603911 9933 16012 49019 31331 843199887 079–7054125412 2803 10612 62021 07837 2911997
104 13739056939812 3393 65313 05125 69248 045199680 12513046731010 5082 88310 58019 29535 952199546 549–4181951926 7181 9945 24110 69821 929199430 042–603441034 6401 5463 7197 96512 628199368 58028164367 6652 8978 25018 36231 1781992
OB S E R V E D ( n o . )
Aust.(a)ACTNTTas.WASAQldVic.NSW
Yea r
ended
30 June
NET OVERSEAS MIGRAT ION, States and ter r i to r ies —Observed andassumed
Each state/territory's share was based on an analysis of the last five calendar and financial
years of NOM, with and without migration adjustment, with longer term historical
patterns favoured amid recent volatility. Targeted regional programs away from Sydney,
and Queensland's increasing proportion of NOM, were taken into consideration.
Current uncertainty regarding NOM estimates, and in particular migration adjustment,
makes it difficult to assess recent trends in the distribution of NOM between the states
and territories. The assumptions used have the limitation that they do not account for
future changes in each state/territory's share of NOM over the long term.
It is expected that the review into methods for calculating NOM, mentioned above, will
yield improved migration data, which may impact on each state/territory's future share of
NOM.
For all three assumptions, NOM was allocated as follows: New South Wales received
37.1% of total NOM in 2004–05, declining to 35.6% by 2007–08 and remaining constant
thereafter; Victoria (25.5% for all years of the projection period); Queensland (18.5% in
2004–05, increasing to 20.0% by 2007–08); South Australia (3.5% for all years); and
Western Australia (13.8% for all years). Tasmania (0.5%), Northern Territory (0.6%) and
the Australian Capital Territory (0.5%) received only a small proportion of NOM per year.
Assumed state and
terr i tory net overseas
migrat ion
A B S • P O P U L A T I O N P R O J E C T I O N S , A U S T R A L I A • 3 2 2 2 . 0 • 2 0 0 4 T O 2 1 0 1 29
CH A P T E R 2 • A S S U M P T I O N S

. . not applicable
80 00040048040011 0402 80016 00020 40028 480Total7 175. .201192280835 97137672Balance
72 82540027920810 7602 71710 02920 02428 408Capital city
LO W AS S U M P T I O N
110 00055066055015 1803 85022 00028 05039 160Total12 102. .2722616771888 4881 0061 210Balance97 89855038828914 5033 66213 51227 04437 950Capital city
ME D I U M AS S U M P T I O N
140 00070084070019 3204 90028 00035 70049 840Total17 085. .3453311 08229411 0131 6472 373Balance
122 91570049536918 2384 60616 98734 05347 467Capital city
H I G H AS S U M P T I O N
Aust.ACTNTTas.WASAQldVic.NSW
ASSUMED NET OVERSEAS MIGRAT ION, Capi ta l ci t y /Ba lance ofstate —2007– 08 onwards
NOM at the capital city/balance of state level was derived from the 1996 and 2001 census
questions on residence overseas one year and five years ago. As overseas arrivals and
departures (OAD) data are not available below the state/territory level, an indirect
method is used. The process behind the assumptions involves:
! capital city/balance of state arrivals from census data; that is, people resident
overseas one year ago;
! capital city/balance of state census overseas departures data—a synthesis of the one
year and five years ago census data; that is, data for those residing in Australia five
years previously and who were overseas residents one year ago, but then were
Australian residents again on census night;
! scaling of this census departure data to state/territory permanent and long-term
(OAD) departures data by Australian and non-Australian citizenship;
! proportions of arrivals and departures to each capital city/balance of state were
applied to the state/territory arrival and departure assumptions. These share-of-state
proportions were held constant for the entire projection period under all three
assumptions; and
! disaggregation of capital city/balance of state arrival and departure assumptions into
age/sex groups using the same process.
Assumed capital
city/balance of state net
overseas migrat ion
30 A B S • P O P U L A T I O N P R O J E C T I O N S , A U S T R A L I A • 3 2 2 2 . 0 • 2 0 0 4 T O 2 1 0 1
CH A P T E R 2 • A S S U M P T I O N S

(b) Numbers are rounded.(a) Net interstate migration for 1996 to 2001 will not add tozero due to Other Territories (not shown).
–1 693–2 698953–1 974–2 09935 698702–28 8882002–2004–953–2 118–382–2 244–2 44929 1142 497–23 4512000–2004
–1 086–955–1 743613–3 24527 212–2 627–18 1461995–20041 336–947–2873 085–1 77331 993–15 472–17 9341985–1994
Average, year ended 30 June(b)
–2 392–2 1082 4751 272–3 19736 686–2 291–30 4452004–1 644–3 3891 895–2 810–1 49739 20728–31 7902003–1 044–2 596–1 512–4 385–1 60231 2014 368–24 4302002
407–1 592–2 136–3 110–2 41820 0245 163–16 3152001–91–907–2 632–2 187–3 53118 4535 219–14 2742000
–506–953–3 317296–1 63116 6822 527–13 0501999–1 982–472–3 6333 227–1 99617 424–270–12 2491998–2 4701 754–3 3254 660–3 31819 605–6 195–10 6611997
–656328–2 5904 066–6 19232 614–12 800–14 7701996–486384–2 6565 101–7 06940 224–22 020–13 4781995–426–875–2 1073 825–3 97844 936–29 195–12 1801994
1 316–699–1 494–152–5 21049 162–25 388–17 53519931 365–969–289–1 314–65834 099–18 427–13 80719922 932–1 152816–1 7911 54529 709–14 853–17 20619911 330–1 1702 7903 012–25238 102–7 829–35 9831990–114–1 4692035 017–22147 062–12 504–37 9741989
2 062–3 129–1 9244 274–1 24027 720–14 423–13 34019881 940–120–1 5086 576–3 97719 718–13 105–9 52419871 783–493–1389 428–1 41716 500–13 201–12 46219861 1696087771 970–2 31712 920–5 799–9 3281985
Year ended 30 JuneACTNTTas.WASAQldVic.NSW
NET INTERSTATE MIGRAT ION (a)
Net interstate migration estimates since 1985 are shown below. These are calculated
using Medicare change of address records and census data on usual residence one year
ago and five years ago.
Histor ical data
Interstate migration is the most volatile and consequently weakest component in any
population estimation or projection. The movement of people between the states and
territories of Australia is unrestricted and depends on many factors such as their varying
economic opportunities, overseas immigration and settlement patterns, and lifestyle
choices of the populations. As none of these factors can be foreseen, trends in levels of
past net interstate migration are used as the basis for future levels.
NE T IN T E R S T A T E
M I G R A T I O N
Summary
A B S • P O P U L A T I O N P R O J E C T I O N S , A U S T R A L I A • 3 2 2 2 . 0 • 2 0 0 4 T O 2 1 0 1 31
CH A P T E R 2 • A S S U M P T I O N S

Levels of assumed interstate migration were derived by analysing trends over the past
three decades and constraining them so that they sum to zero. Three assumptions have
been made to provide a range of interstate migration scenarios.
The high assumption uses high levels of net gains and losses, with medium and low
assumptions adopting medium and low levels respectively. Overall, the medium
assumption most closely reflects the long-term average net interstate migration
experience of the states and territories. The high and low levels are intended to provide
a wider range of possible future outcomes, especially in the short-term. It should be
noted that as the high assumption for some states corresponds to high losses, the low
assumption yields greater population growth in such cases. Each assumption remains
constant after a transitional period from 2004–05 to 2006–07.
Assumed net interstate
migrat ion
Over the period 1995 to 2004 New South Wales has continued to record large net
interstate migration losses, with losses in 2003 and 2004 being particularly large. At the
same time Queensland has recorded the largest gains.
Historically Victoria has recorded large net interstate migration losses, with the exception
of the years 1999 to 2003 when small to moderate gains were recorded. In 2004 Victoria
recorded a relatively small net loss (in comparison to previous years) in interstate
migration.
South Australia has continued to record small to moderate losses over the past 10 years,
while net interstate migration for Western Australia moved from positive levels during
the mid to late 1990s to negative levels between 2000 and 2003, and returned to a small
positive level in 2004.
After experiencing relatively large negative levels of net interstate migration throughout
the 1990s and early 2000s, Tasmania recorded positive net interstate migration in 2003
and 2004. The long-term average remains a moderate net interstate migration loss.
In recent years the Northern Territory has continued to experience historically large net
interstate migration losses. Recent data indicates this may be returning to less negative
levels. Similarly, the Australian Capital Territory has recorded larger than usual net losses
in interstate migration in recent years.
Histor ical data cont inue d
32 A B S • P O P U L A T I O N P R O J E C T I O N S , A U S T R A L I A • 3 2 2 2 . 0 • 2 0 0 4 T O 2 1 0 1
CH A P T E R 2 • A S S U M P T I O N S

(a) High and low interstate migration refer to high/low flow scenarios, and will thereforereflect high/low losses rather than high/low gains in some jurisdictions.
–2.0–2.0–2.5–1.0–0.518.01.0–11.02007–2051–2.5–1.5–1.00.0–1.024.00.0–18.02006–2.5–1.50.01.0–2.030.0–1.0–24.02005
LO W AS S U M P T I O N (a)
–0.5–0.5–1.02.5–2.527.0–7.0–18.02007–2051–1.5–0.50.02.5–2.530.0–5.0–23.02006–2.0–1.01.02.0–3.033.0–3.0–27.02005
ME D I U M AS S U M P T I O N
1.00.50.54.5–4.537.0–14.0–25.02007–20510.00.51.04.0–4.536.0–9.0–28.02006
–1.0–0.51.53.0–4.036.0–5.0–30.02005
H I G H AS S U M P T I O N (a)
'000'000'000'000'000'000'000'000
ACTNTTas.WASAQldVic.NSWYea r ended
30 June
NET INTERSTATE MIGRAT ION, Assumed —2004– 2051
Net interstate migration assumptions for the states and territories are as follows:Assumed net interstate
migrat ion cont inued
A B S • P O P U L A T I O N P R O J E C T I O N S , A U S T R A L I A • 3 2 2 2 . 0 • 2 0 0 4 T O 2 1 0 1 33
CH A P T E R 2 • A S S U M P T I O N S

(a) High and low interstate migration refer to high/low flow scenarios, and will therefore reflect high/lowlosses rather than gains in some jurisdictions.
–0.5–0.5–1.5–1.06.0–6.0–19.02007–20510.0–0.5–0.5–1.58.0–8.0–25.020060.00.00.0–2.511.0–11.0–31.02005
LO W AS S U M P T I O N (a)
0.50.01.0–2.010.0–10.0–30.02007–20510.50.01.0–2.511.0–11.0–33.020060.00.50.5–3.013.0–12.0–35.02005
ME D I U M AS S U M P T I O N
1.00.52.0–3.515.0–13.0–40.02007–20511.00.51.5–3.514.0–13.0–40.020060.51.01.0–3.514.0–13.0–40.02005
H I G H AS S U M P T I O N (a)
–0.41.20.2–3.914.7–12.4–37.02004
–1.40.7–3.8–2.116.4–6.4–39.62003–0.7–0.4–4.5–1.111.9–1.4–34.12002–0.1–0.3–4.5–1.55.4–3.8–30.820010.3–0.6–4.1–2.95.1–1.1–26.020000.1–0.9–1.2–1.24.6–3.5–20.91999
0.7–0.8–0.8–1.25.9–3.0–19.819981.6–0.61.1–2.35.4–12.7–19.519970.5–0.41.6–4.813.0–8.0–15.319960.2–0.85.2–4.813.0–11.8–12.41995
–0.1–0.34.3–3.717.0–20.4–16.01994
OB S E R V E D
'000'000'000'000'000'000'000
DarwinHobartPerthAdelaideBrisbaneMelbourneSydneyYea r ended
30 June
NET INTERNAL MIGRAT ION, Capi ta l ci t ies —Observed and assumed
Internal migration assumptions for capital cities and balances of states were based on
indirectly estimated historical trends. Net total migration (overseas and internal) for each
capital city/balance of state was assumed to be the difference between population growth
and natural increase for these regions. Net internal migration was then assumed to be
the difference between net total migration and NOM.
The state/territory assumptions have been split into capital city/balance of state
assumptions as follows:
Capital city/balance of
state net internal
migrat ion assumptions
34 A B S • P O P U L A T I O N P R O J E C T I O N S , A U S T R A L I A • 3 2 2 2 . 0 • 2 0 0 4 T O 2 1 0 1
CH A P T E R 2 • A S S U M P T I O N S

All assumptions are translated into arrivals and departures for each state/territory and
capital city/balance of state. Age/sex arrival and departure rates for the states and
territories are generated from 1991, 1996 and 2001 census movement data, while 1996
and 2001 census data is used to generate age/sex arrival levels and departure rates for
each capital city/balance of state. All age/sex arrival and departure disaggregations sum to
the net internal migration assumptions.
Age/sex structure of
interstate migrat ion
(a) High and low interstate migration refer to high/low flow scenarios, and will therefore reflecthigh/low losses rather than high/low gains in some jurisdictions.
–1.5–2.00.50.512.07.08.02007–2051–1.5–0.50.50.516.08.07.02006–1.50.01.00.519.010.07.02005
LO W AS S U M P T I O N (a)
–1.0–1.01.5–0.517.03.012.02007–2051–1.00.01.50.019.06.010.02006–1.00.51.50.020.09.08.02005
ME D I U M AS S U M P T I O N
–0.50.02.5–1.022.0–1.015.02007–2051
–0.50.52.5–1.022.04.012.02006–1.00.52.0–0.522.08.010.02005
H I G H AS S U M P T I O N (a)
–1.71.31.10.722.010.16.52004
–2.01.21.00.622.86.47.82003–1.8–1.10.1–0.519.35.89.62002–1.5–1.91.4–0.914.68.914.52001–1.2–2.12.0–0.613.46.411.72000–1.0–2.41.5–0.412.06.07.81999
–1.1–2.84.0–0.811.52.87.519980.1–2.83.6–1.014.26.58.81997
–0.2–2.22.4–1.419.6–4.80.519960.1–1.8–0.1–2.227.2–10.2–1.11995
–0.8–1.8–0.5–0.328.0–8.83.81994
OB S E R V E D
'000'000'000'000'000'000'000
Balance
of NT
Balance
of Tas.
Balance
of WA
Balance
of SA
Balance
of Qld
Balance
of Vic.
Balance
of NSWYea r ended
30 June
NET INTERNAL MIGRAT ION, Balance of states —Observed and assumedCapital city/balance of
state net internal
migrat ion assumptions
cont inue d
A B S • P O P U L A T I O N P R O J E C T I O N S , A U S T R A L I A • 3 2 2 2 . 0 • 2 0 0 4 T O 2 1 0 1 35
CH A P T E R 2 • A S S U M P T I O N S

CHAP T E R 3 PR O J E C T I O N RE S U L T S — AU S T R A L I A . . . . . . . . . . . . . .
As stated in Chapter 2, three assumptions have been made about future fertility, two
assumptions about future mortality, three assumptions about future levels of net
overseas migration and three assumptions about net interstate migration. In addition, a
zero net overseas migration assumption has been included to facilitate analysis of the
impact of overseas migration to Australia's future population. From these assumptions,
72 projection series have been generated.
Using the estimated resident population (ERP) at June 2004 as the base for all
projections, three main population projection series (Series A, B and C) have been
selected for presentation and analysis in this publication:
Series A—assumes the TFR will reach 1.9 babies per woman by 2018 and then remain
constant, life expectancy at birth will continue to increase until 2050–51 (reaching 92.7
years for males and 95.1 years for females), NOM will reach 140,000 by 2007–08 and then
remain constant, and high levels of net interstate migration.
Series B—assumes the TFR will decrease to 1.7 babies per woman by 2018 and then
remain constant, life expectancy at birth will continue to increase each year until
2050–51, though at a declining rate (reaching 84.9 years for males and 88.0 years for
females), NOM will be held constant at 110,000 per year throughout the projection
period, and medium levels of net interstate migration.
Series C—assumes the TFR will decrease to 1.5 babies per woman by 2018 and then
remain constant, life expectancy at birth will continue to increase each year until
2050–51, though at a declining rate (reaching 84.9 years for males and 88.0 years for
females), NOM will reach 80,000 per year by 2007–08 and then remain constant, and low
levels of net interstate migration.
Unless otherwise stated the following analysis uses Series A and C to depict a range,
although not the full range, of projected populations. At times, to simplify the analysis,
the medium series, Series B, has been chosen.
AS S U M P T I O N S FO R
SE R I E S A , B AN D C
Population projections presented in this publication are not predictions or forecasts.
They are an assessment of what would happen to Australia's population if the assumed
levels of the components of population change—births, deaths and migration—were to
be realised over the next 50 to 100 years.
The projections reveal the size, structure and distribution of the future population under
various assumptions on future levels of fertility, mortality and migration. These levels are
based on long and short-term trends, current debate, and likely future scenarios dictated
by research in Australia and elsewhere.
I N T R O D U C T I O N
36 A B S • P O P U L A T I O N P R O J E C T I O N S , A U S T R A L I A • 3 2 2 2 . 0 • 2 0 0 4 T O 2 1 0 1
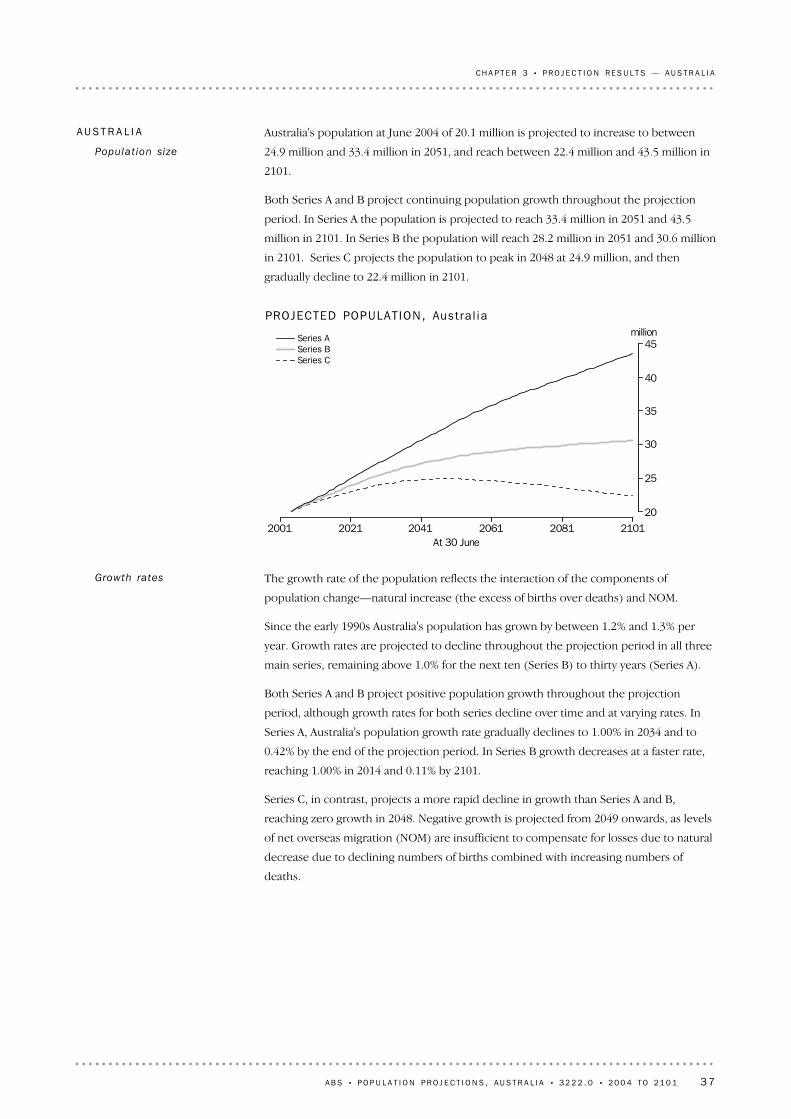
The growth rate of the population reflects the interaction of the components of
population change—natural increase (the excess of births over deaths) and NOM.
Since the early 1990s Australia's population has grown by between 1.2% and 1.3% per
year. Growth rates are projected to decline throughout the projection period in all three
main series, remaining above 1.0% for the next ten (Series B) to thirty years (Series A).
Both Series A and B project positive population growth throughout the projection
period, although growth rates for both series decline over time and at varying rates. In
Series A, Australia's population growth rate gradually declines to 1.00% in 2034 and to
0.42% by the end of the projection period. In Series B growth decreases at a faster rate,
reaching 1.00% in 2014 and 0.11% by 2101.
Series C, in contrast, projects a more rapid decline in growth than Series A and B,
reaching zero growth in 2048. Negative growth is projected from 2049 onwards, as levels
of net overseas migration (NOM) are insufficient to compensate for losses due to natural
decrease due to declining numbers of births combined with increasing numbers of
deaths.
Growth rates
2001 2021 2041 2061 2081 2101At 30 June
million
20
25
30
35
40
45Series ASeries BSeries C
PROJECTED POPULAT ION, Aust ra l i a
Australia's population at June 2004 of 20.1 million is projected to increase to between
24.9 million and 33.4 million in 2051, and reach between 22.4 million and 43.5 million in
2101.
Both Series A and B project continuing population growth throughout the projection
period. In Series A the population is projected to reach 33.4 million in 2051 and 43.5
million in 2101. In Series B the population will reach 28.2 million in 2051 and 30.6 million
in 2101. Series C projects the population to peak in 2048 at 24.9 million, and then
gradually decline to 22.4 million in 2101.
AU S T R A L I A
Populat ion size
A B S • P O P U L A T I O N P R O J E C T I O N S , A U S T R A L I A • 3 2 2 2 . 0 • 2 0 0 4 T O 2 1 0 1 37
CH A P T E R 3 • P R O J E C T I O N R E S U L T S — A U S T R A L I A

There were 252,100 births and 133,200 deaths in Australia during 2003–04, resulting in
natural increase of 118,900 people. The three main series present quite different
scenarios for projected births.
Series A projects the largest increase in births over the projection period, increasing to
361,700 in 2050–51 and 447,600 in 2100–01. In Series B births are projected to increase
slightly, to 275,300 in 2050–51 and 292,300 in 2100–01.
In Series C the number of births initially declines, reaching 222,200 in 2018–19, then
stabilises for around a decade, before gradually declining to 202,500 in 2050–51 and
179,900 in 2100–01.
Births
According to United Nations population projections, a number of developed countries
also show low positive to negative population growth rates between 2000–2005 and
2045–2050. Japan experienced average annual population growth of 0.2% in 2000–2005.
The United Nations has projected that during 2045–2050 the population of Japan will
decline by an average of 0.5% each year to a level below its current population. The
United States of America experienced population growth of 1.0% each year during
2000–2005. During 2045–2050 it is projected that the growth in the United States of
America's population will be 0.4% per year on average. New Zealand experienced
population growth of 1.1% each year during 2000–2005. By 2045–2050 New Zealand's
population growth is projected to be 0.1% per year on average. The United Kingdom
experienced population growth of 0.3% each year during 2000–2005. By 2045–2050, the
United Kingdom is projected to grow by 0.2% per year on average.
International
comparison—populat ion
growth
(a) At end of period.
–0.2622 382.80.1230 594.70.4343 464.22091–2101–0.2822 964.00.1230 241.00.4641 634.32081–2091–0.2423 605.80.1429 879.90.4939 772.02071–2081
–0.1824 181.40.1929 458.20.5637 861.92061–2071–0.1024 612.40.2628 903.90.7035 815.62051–20610.0324 864.50.3628 169.70.8633 389.82041–20510.2524 780.00.5327 169.30.9730 643.22031–20410.5024 171.60.7725 772.91.1327 833.72021–2031
0.7022 988.40.9623 871.41.2424 878.42011–20210.8921 441.21.0921 699.21.3021 987.72006–20111.0120 514.21.1420 555.31.3020 617.52005–20061.0820 309.51.1620 323.71.3020 352.02004–2005
%'000%'000%'000
Average
annual
growth
ratePopulation(a)
Average
annual
growth
ratePopulation(a)
Average
annual
growth
ratePopulation(a)
SERIES CSERIES BSERIES A
Per i od
ended 30
June
PROJECTED SIZE AND GROWTH OF AUSTRAL IA 'S POPULAT IONGrowth rates cont inue d
38 A B S • P O P U L A T I O N P R O J E C T I O N S , A U S T R A L I A • 3 2 2 2 . 0 • 2 0 0 4 T O 2 1 0 1
CH A P T E R 3 • P R O J E C T I O N R E S U L T S — A U S T R A L I A

The number of projected deaths in Series B and C remains similar over the projection
period as both series use the same mortality assumption. Initially deaths are projected to
increase at current rates of around 0.8% to 0.9% per year. Between 2012 and the late
2040s deaths are projected to increase more rapidly (up to 2.7% per year, in 2030–31) as
a result of ageing of the population and in particular the progression of the large cohorts
born during the post World War II 'baby boom', together with those former migrants
born in 1947, into older age groups. From the middle of the century onwards the
number of deaths increase at gradually declining rates.
From 133,200 deaths in 2003–04, Series C and B project deaths to more than double to
between 290,300 and 296,400 respectively in 2050–51; the number of deaths continue to
increase in Series B to 367,900 in 2100–01, while in Series C deaths reach a maximum of
330,400 in 2082–83 and then decline, to 313,900 in 2100–01.
Series A assumes higher life expectancy at birth than Series B and C, therefore lower
numbers of deaths are projected over the first half of the century. The cessation of
improvements in life expectancy from 2051 onwards results in a rapid increase in deaths
in Series A, compounded by the larger population size due to the combination of high
fertility, low mortality and high net overseas migration assumptions used.
Series A projects 228,100 deaths in 2050–51, increasing to 406,400 in 2100–01, the
highest of all three main series.
Deaths
2001 2021 2041 2061 2081 2101Year ended 30 June
'000
100
200
300
400
500Series ASeries BSeries C
PROJECTED BIRTHS, Aust ra l i aBirths cont inued
A B S • P O P U L A T I O N P R O J E C T I O N S , A U S T R A L I A • 3 2 2 2 . 0 • 2 0 0 4 T O 2 1 0 1 39
CH A P T E R 3 • P R O J E C T I O N R E S U L T S — A U S T R A L I A

While changes in fertility have the biggest impact on the youngest ages of the
population, and changes in mortality are felt predominantly in older age groups, NOM
affects the population of all ages. Although the age structure of migrants at arrival in
Australia is younger than the Australian population as a whole, migrants age along with
the rest of the population in the years following their arrival. Changes in NOM therefore
affect the size of the population more than the age distribution.
Impact of net overseas
migrat ion
2001 2021 2041 2061 2081 2101Year ended 30 June
'000
–200
–100
0
100
200
Series ASeries BSeries C
PROJECTED NATURAL INCREASE, Aust ra l ia
All three series project natural increase to decline over the projection period, with
differing patterns to be experienced in the first 50 years. While Series A maintains a
relatively steady level of natural increase, Series B and C project a state of natural
decrease (where deaths outnumber births) from 2044 and 2034 respectively. In 2050–51
natural increase will contribute 133,600 to population growth in Series A, while in Series
B and C natural decrease will result in population losses of 21,100 and 87,800 in 2050–51.
By 2100–01 Series A projects natural increase will contribute 41,200 to population
growth, whereas Series B and C project natural decrease to result in population losses of
75,600 and 134,000 respectively.
Natural increase
2001 2021 2041 2061 2081 2101Year ended 30 June
'000
100
200
300
400
500Series ASeries BSeries C
PROJECTED DEATHS, Aust ra l iaDeaths cont inued
40 A B S • P O P U L A T I O N P R O J E C T I O N S , A U S T R A L I A • 3 2 2 2 . 0 • 2 0 0 4 T O 2 1 0 1
CH A P T E R 3 • P R O J E C T I O N R E S U L T S — A U S T R A L I A

Of the changes projected to occur in Australia's population, ageing is the most dramatic,
with significant changes to the age structure of the population, particularly over the next
fifty years. Ageing of the population is a trend which has been evident over recent
decades as a result of fertility remaining below replacement level and declining mortality
rates. In all three series this trend is projected to continue.
The proportion of the population aged under 15 years is projected to decrease from 20%
(4.0 million) of the population at June 2004 to 13%–16% (3.3 million to 5.4 million) in
2051, and to remain within the same range of proportions to 2101 (to between 2.9
million and 6.8 million).
The proportion of the population aged 50 years and over will increase from 30% (6.0
million) at June 2004 to between 44%–48% (11.9 million to 14.6 million) in 2051 and
45%–49% (11.0 million to 19.9 million) in 2101.
Populat ion ageing
2001 2021 2041 2061 2081 2101At 30 June
million
0
5
10
15
20
25Series ASeries BSeries C
CONTRIBUT ION OF NOM TO PROJECTED POPULAT ION, Aust ra l ia
NOM contributes to population growth through both the net number of permanent and
long-term arrivals and departures, and by children born to migrants to Australia. The
effect of NOM can be determined by comparing the projected population of each of the
three main series with the projected population resulting from an assumed NOM level of
zero. In 2003–04 NOM contributed 100,000 people to Australia's population.
In Series A, NOM will contribute a total of 9.5 million people to Australia's population
between 2004 and 2051, and 22.0 million people between 2004 and 2101. In Series B,
NOM contributes fewer people to the population (7.1 million by 2051, and 14.7 million
by 2101), while NOM contributes the least people in Series C (5.0 million by 2051, and
9.7 million by 2101).
Impact of net overseas
migrat ion cont inued
A B S • P O P U L A T I O N P R O J E C T I O N S , A U S T R A L I A • 3 2 2 2 . 0 • 2 0 0 4 T O 2 1 0 1 41
CH A P T E R 3 • P R O J E C T I O N R E S U L T S — A U S T R A L I A

(a) Estimated resident population, base population.
–0.50.10.6–0.30.20.5–0.30.10.4–0.20.10.42091–21012.22.34.00.70.81.7–0.10.20.6–0.50.10.62041–20514.24.26.01.41.52.2–0.10.30.6–0.20.10.42031–20413.93.95.22.62.63.10.00.30.6–0.30.30.82021–2031
3.13.13.53.53.53.70.40.50.7–0.70.21.02011–20215.45.45.43.03.03.00.91.01.2–0.6–0.10.42006–20116.86.86.82.52.52.51.11.21.4–0.4–0.10.22005–20065.45.45.42.42.42.51.21.21.4–0.10.00.22004–2005
AV E R A G E AN N U A L GR O W T H RA T E (% )
1 736.12 006.04 324.36 873.78 394.312 800.112 647.517 671.223 877.42 861.64 529.36 786.721011 824.31 983.74 093.17 059.68 267.012 181.312 988.417 496.622 918.02 915.94 477.46 535.020911 603.71 620.02 690.07 041.57 279.49 048.814 561.516 645.818 953.53 261.54 244.55 387.420511 287.01 293.71 810.06 592.56 696.97 656.714 771.116 272.017 911.93 416.44 200.45 074.62041
853.2856.11 006.35 740.75 780.16 154.414 952.115 842.216 807.03 478.74 150.64 872.32031
583.7584.4608.84 457.04 472.04 554.214 945.615 360.715 809.13 585.84 038.74 515.12021431.7431.8431.93 167.83 171.63 176.114 426.914 566.314 723.33 846.63 961.34 088.32011332.7332.7332.72 734.72 735.22 736.213 820.913 844.213 883.13 958.63 975.93 998.22006311.5311.5311.62 668.12 668.32 668.813 668.413 676.013 694.73 972.93 979.43 988.52005295.6295.6295.62 604.92 604.92 604.913 507.913 507.913 507.93 978.83 978.83 978.82004(a)
NU M B E R ( ' 0 0 0 )
Series CSeries BSeries ASeries CSeries BSeries ASeries CSeries BSeries ASeries CSeries BSeries A
85 YEARS AND OVER65 YEARS AND OVER15–64 YEARS0–14 YEARS
At 30 June
PROJECTED POPULAT ION, By age group —Aust ra l ia
PROJECTED POPULAT ION, SERIES B, AUSTRAL IA — AT 30 JUNE
012345
0–4
5–9
10–14
15–19
20–24
25–29
30–34
35–39
40–44
45–49
50–54
55–59
60–64
65–69
70–74
75–79
80–84
85+
0 1 2 3 4 5
0�4 5�9
10�1415�1920�2425�2930�3435�3940�4445�4950�5455�5960�6465�6970�7475�7980�84
85+
2004
2051
2101
Males Females%
Age group (years)
42 A B S • P O P U L A T I O N P R O J E C T I O N S , A U S T R A L I A • 3 2 2 2 . 0 • 2 0 0 4 T O 2 1 0 1
CH A P T E R 3 • P R O J E C T I O N R E S U L T S — A U S T R A L I A

2001 2021 2041 2061 2081 2101At 30 June
million
1
2
3
4
5Series ASeries BSeries C
PROJECTED POPULAT ION AGED 5–14 YEARS, Aust ra l i a
Changes in the number of children aged 5–14 years, an age group closely aligned to
compulsory ages for schooling, will impact upon the provision of primary and secondary
education. As a result of relatively high fertility, Series A projects the largest increase,
from 2.7 million at June 2004 to 3.6 million in 2051 and 4.5 million in 2101. Series B
projects only a small increase, while Series C projects a decrease, to 2.2 million in 2051
and 2.0 million in 2101.
The proportion of children aged 5–14 years will decline in all three main series. At June
2004, 5–14 year olds represented 14% of the population, increasing to between 9%–11%
by 2051. Between 2051 and 2101 little change in the proportion is projected.
Populat ion aged 5–14
years
2001 2021 2041 2061 2081 2101At 30 June
years
36
39
42
45
48
51Series ASeries BSeries C
PROJECTED POPULAT ION, Median age —Aust ra l i a
Changes in Australia's age structure are reflected in the median age, which is projected to
increase from 36.4 years in June 2004 to between 39.9 years and 41.7 years in 2021 and to
between 44.6 years and 48.2 years in 2051. Over the second half of the century the
median age increases only slightly, to between 46.1 years and 49.3 years in 2101.
Populat ion ageing
cont inue d
A B S • P O P U L A T I O N P R O J E C T I O N S , A U S T R A L I A • 3 2 2 2 . 0 • 2 0 0 4 T O 2 1 0 1 43
CH A P T E R 3 • P R O J E C T I O N R E S U L T S — A U S T R A L I A

Among other considerations such as health and housing services, growth in this age
group has particular implications for retirement income planning (Department of
Treasury, 2002).
The population aged 65 years and over will increase rapidly throughout the first half of
the projection period, in terms of both numbers and proportions of the total population.
This age group will increase from 2.6 million at June 2004 to between 4.5 million and 4.6
million in 2021, and to between 7.0 million and 9.0 million in 2051. By 2101 this age
group is projected to reach between 6.9 million and 12.8 million.
As a proportion of the population, this age group is projected to increase from 13% in
2004 to 18%–19% in 2021, to 26%–28% in 2051, and to 27%–31% in 2101.
Populat ion aged 65 years
and over
Within the 15–64 years age group, ageing will occur in all three series, particularly during
the first half of the projection period. At June 2004, 25% of this group were aged 50–64
years. This proportion is projected to increase over the next 20 years, to 29%–30% in
2021. By 2051, 50–64 year olds will make up between 29% and 33% of all people aged
15–64 years. From 2051 onwards the proportion remains more or less the same. The
proportion of people aged 15–29 years is projected to decline slightly in all three series,
from 30% in 2004 to 29% in 2021 and to between 26% and 29% by 2051, and to remain at
these levels until 2101. The proportion of people aged 30–49 years decreases from 44%
in 2004 to between 41% and 42% in 2021, and remains between 41% and 43% until 2101.
2001 2021 2041 2061 2081 2101At 30 June
million
12
15
17
20
22
25Series ASeries BSeries C
PROJECTED POPULAT ION AGED 15–64 YEARS, Aust ra l i a
The population aged 15–64 years, which encompasses the working-age population,
numbered 13.5 million people and made up 67% of Australia's population at June 2004.
Both Series A and B project this group to continue to increase throughout the projection
period, reaching between 16.6 million (Series B) and 19.0 million (Series A) in 2051 and
between 17.7 million (Series B) and 23.9 million (Series A) in 2101. In Series C the
population aged 15–64 years peaks at 15.0 million in 2025 and then declines to 12.6
million in 2101.
Despite different outcomes in terms of population size, the proportion of the total
population of 15–64 year olds will be similar for all three main series throughout the
projection period. The proportion declines from 67% at June 2004 to between 57%–59%
in 2051 and 55%–58% in 2101.
Populat ion aged 15–64
years
44 A B S • P O P U L A T I O N P R O J E C T I O N S , A U S T R A L I A • 3 2 2 2 . 0 • 2 0 0 4 T O 2 1 0 1
CH A P T E R 3 • P R O J E C T I O N R E S U L T S — A U S T R A L I A

The projected number of people aged 85 years and over has implications for the
provision of health services and appropriate housing, given that non-private dwellings
are currently the most common form of housing for people in this age group
(Department of Treasury, 2002).
At June 2004 there were 295,600 people aged 85 years and over in Australia. This age
group is projected to increase dramatically throughout the projection period. In Series A,
which uses the high life expectancy at birth assumption, the population is projected to
more than double within 20 years (to 608,800 people in 2021), to double again by 2034
(1.25 million), and to double once more by 2049 (2.5 million). By 2101 the number of
people aged 85 years and over is projected to be 4.3 million.
Populat ion aged 85 years
and over
2001 2021 2041 2061 2081 2101At 30 June
%
0
1
2
3
4
5
ANNUAL GROWTH RATES, 65 years and over , Aust ra l ia —Ser ies B
The annual growth rate for people aged 65 years and over will peak in 2012 at 4.4% in all
three series, when the large cohort born in 1947, part of the post World War II 'baby
boom', together with those former migrants born in 1947, reach 65 years. In Series B and
C growth rates then rapidly decline to under 1.0% around 2040. For the remainder of the
projection period rates gradually decline, with Series C becoming negative around 2072.
Growth rates remain higher in Series A from 2012 onwards due to higher assumed life
expectancy at birth.
2001 2021 2041 2061 2081 2101At 30 June
million
2.5
5.0
7.5
10.0
12.5
15.0Series ASeries BSeries C
PROJECTED POPULAT ION AGED 65 YEARS AND OVER, Aust ra l i aPopulat ion aged 65 years
and over cont inue d
A B S • P O P U L A T I O N P R O J E C T I O N S , A U S T R A L I A • 3 2 2 2 . 0 • 2 0 0 4 T O 2 1 0 1 45
CH A P T E R 3 • P R O J E C T I O N R E S U L T S — A U S T R A L I A

A noticeable change within this age group is the decreasing proportion of women, due
to the narrowing of the gap between male and female life expectancy. At June 2004
women accounted for 68% of all people aged 85 years and over. This proportion is
projected to decline to 62% in 2021, 56%–58% in 2051, and 53%–56% in 2101.
2001 2021 2041 2061 2081 2101At 30 June
%
–2
0
2
4
6
8
ANNUAL GROWTH RATES, 85 years and over , Aust ra l ia —Ser ies B
The population aged 85 years and over is projected to experience the highest growth
rates of all age groups. Growth for this group will peak at 7% in 2006, and again in 2032
at between 7% and 9%. The peak at 2006 is due to the large cohort of people born in
1921 reaching 85 years, while the peak in 2032 is due to the large cohort born in 1947.
2001 2021 2041 2061 2081 2101At 30 June
million
0
1
2
3
4
5Series ASeries BSeries C
PROJECTED POPULAT ION AGED 85 YEARS AND OVER, Aust ra l i a
Series B and C also project high growth, though considerably less than Series A from
around 2030 onwards. By 2051 the population is projected to be 1.6 million in both
series, and between 1.7 and 2.0 million in 2101.
People aged 85 years and over made up 1.5% of Australia's population at June 2004. This
age group is projected to account for around 6%–8% of the population in 2051, and
7%–10% in 2101.
Populat ion aged 85 years
and over cont inue d
46 A B S • P O P U L A T I O N P R O J E C T I O N S , A U S T R A L I A • 3 2 2 2 . 0 • 2 0 0 4 T O 2 1 0 1
CH A P T E R 3 • P R O J E C T I O N R E S U L T S — A U S T R A L I A

(a) The sum of people aged 0–14 years and 65 years and over divided by the number ofpeople aged 15–64 years, multiplied by 100.
2001 2021 2041 2061 2081 2101At 30 June
ratio
40
50
60
70
80
90Series ASeries BSeries C
PROJECTED DEPENDENCY RATIO (a) , Aust ra l ia
The dependency ratio is a measure used to compare the size of the working age
population to the size of the non-working age population, calculated as the sum of
people aged 0–14 years and 65 years and over (that is, 'dependents') divided by the
number of people aged 15–64 years, multiplied by 100.
While the ratio may oversimplify the implication of dependency—for example, many
young adults are dependent on their parents during tertiary study, many people aged
15–64 years are not part of the workforce, many people retire before 65 years of age,
while others continue to work beyond 65—it provides another measure of the structure
of the population.
A dependency ratio of 100 denotes an equal number of non-working age and working
age people. A ratio larger than 100 denotes more dependents than people of working
age, while a ratio of less than 100 denotes fewer dependents than people of working age.
At June 2004 there were 49 people in non-working age groups for every 100 working age
people. The dependency ratio is projected to increase rapidly in all three main series
from 2015, reaching between 69 and 76 in 2051, and increasing slightly thereafter (to
between 73 and 82 in 2101).
In Series A high fertility and high life expectancy result in increasing numbers of the
non-working age population, resulting in the dependency ratio remaining the highest of
the three main series throughout the projection period.
Series C projects lower dependency ratios than Series B until 2036, after which they
remain higher. This is due to higher fertility in Series B, which boosts the 0–14 year age
group early in the projection period, resulting in higher ratios than in Series C. As these
children move into the 15–64 year age group they boost the working-age population,
reducing the dependency ratio.
Dependency rat io
Projections of the number of people in age groups older than 85 years can be obtained
from the ABS web site <http://www.abs.gov.au>. For further information on additional
statistics available see paragraphs 18–20 of the Explanatory Notes.
At June 2004 there were 4,300 Australian residents aged 100 years or more. In Series B
this is projected to increase to 67,900 in 2051 and 118,200 in 2101. As a proportion of the
total population, this represents a rise from 0.02% in 2004 to 1.98% in 2101.
Populat ion aged 100
years and over
A B S • P O P U L A T I O N P R O J E C T I O N S , A U S T R A L I A • 3 2 2 2 . 0 • 2 0 0 4 T O 2 1 0 1 47
CH A P T E R 3 • P R O J E C T I O N R E S U L T S — A U S T R A L I A

Source: Population Division, United Nations Secretariat, UnitedNations web site (2005), World Population Prospects,2004 Revisions <http://esa.un.org/unpp/>
(a) Medium variant.(b) Series B.
21.758.120.29 075.910.461.428.26 464.8World
26.456.317.3395.016.762.520.8298.2United States of America29.454.216.467.121.260.917.959.7United Kingdom12.165.022.910.63.955.840.35.9Papua New Guinea30.053.916.04.816.761.921.34.0New Zealand
31.353.115.617.119.262.618.216.3Netherlands41.744.913.4112.226.359.714.0128.1Japan41.345.513.150.925.660.414.058.1Italy23.758.717.6284.68.463.328.3222.8Indonesia20.761.018.31 592.77.960.032.11 103.4India
38.748.812.49.215.470.214.47.0Hong Kong (SAR of China)36.849.613.710.723.062.714.311.1Greece31.053.315.71 392.310.967.721.41 315.8China31.852.415.742.817.964.517.632.3Canada31.753.215.128.117.862.619.620.3Australia(b)
%%%million%%%million
Persons
aged 60
years
and over
Persons
aged
15–59
years
Persons
aged
under
15 yearsPopulation
Persons
aged 60
years
and over
Persons
aged
15–59
years
Persons
aged
under
15 yearsPopulation
AT 30 JUNE 2050AT 30 JUNE 2005
Coun t r y
PROJECTED POPULAT ION (a) , Selec ted count r ies
United Nations population projections indicate that many other countries throughout
the world may also experience population ageing over the next 50 years.
The proportion of people aged under 15 years is projected to decline for all countries
presented in the table below. The proportion of people aged 60 years and over will more
than double in China, Hong Kong, India, Indonesia and Papua New Guinea by 2050.
Many countries, including Australia, are projected to have 25% or more of their
population aged 60 years and over.
International
comparison—populat ion
ageing
48 A B S • P O P U L A T I O N P R O J E C T I O N S , A U S T R A L I A • 3 2 2 2 . 0 • 2 0 0 4 T O 2 1 0 1
CH A P T E R 3 • P R O J E C T I O N R E S U L T S — A U S T R A L I A

CHAP T E R 4 PR O J E C T I O N RE S U L T S — ST A T E S AN DTE R R I T O R I E S . . . . . . . . . . . . . . . . . . . . . . . . . . . . . . . . . . . . . . . . .
In Series B all capital cities will experience larger percentage growth than their respective
balances, resulting in further concentration of Australia's population within the capital
cities. At June 2004, 64% of Australians lived in capital cities, and by 2051 this proportion
will increase to 66%.
Series B projects Sydney and Melbourne to remain the two most populous cities in
Australia, with 5.6 million and 5.0 million people respectively in 2051, followed by
Brisbane (3.4 million), Perth (2.5 million), Adelaide (1.2 million), the Australian Capital
Territory (401,600), Darwin (232,300) and Hobart (219,600). Darwin's population will
exceed Hobart's in 2048.
Capital city growth and
share
In Series B New South Wales is projected to remain the most populous state in Australia,
although its share of Australia's population will decline slightly, from 33% at June 2004 to
31% in 2051. Queensland will replace Victoria in 2041 as the second most populous state,
with Queensland's share of Australia's population increasing from 19% to 24% over the
next 50 years, and Victoria's share decreasing from 25% to 23%.
In Series B Western Australia will increase its share of Australia's population from 9.8% at
June 2004 to 11.2% in 2051, while South Australia's share will decline from 7.6% to 5.6%
over the same period. Similarly, Tasmania's share will decline from 2.4% in 2004 to 1.6%
in 2051. The Northern Territory's share will remain more or less the same, increasing
marginally from 1.0% to 1.2%. Likewise the Australian Capital Territory's share will
change only marginally, decreasing from 1.6% to 1.4%.
Changing state/terr i tory
share
Projections of the states and territories reveal the size, structure and distribution of their
future populations. Unless otherwise stated the following analysis uses Series A and C to
depict a range, although not the full range, of future outcomes. At times, to simplify the
analysis, the medium series, Series B, has been chosen.
Series B projects continuing population growth over the next 50 years in all states and
territories except Tasmania and South Australia. Between 2004 and 2051 the population
of Queensland is projected to increase by 77%, the Northern Territory by 75% and
Western Australia by 60%, well above the projected growth for Australia of 40%.
ST A T E S AN D TE R R I T O R I E S
A B S • P O P U L A T I O N P R O J E C T I O N S , A U S T R A L I A • 3 2 2 2 . 0 • 2 0 0 4 T O 2 1 0 1 49

(c) Includes Other Territories.(a) Estimated resident population, base population.(b) Includes the Australian Capital Territory.
24 864.528 169.733 389.822 988.423 871.424 878.420 091.5Australia(c)
8 447.09 650.111 521.78 196.68 528.78 886.37 279.6Total balance of state
16 413.818 515.721 863.714 788.715 339.415 988.812 809.3Total capital cities(b)
289.5401.6547.1330.1364.5402.1324.1Total Australian Capital Territory
224.3350.0470.5215.3250.9279.2199.8Total Northern Territory
71.3117.7175.087.8101.2114.590.4Balance of Northern Territory153.0232.3295.5127.5149.7164.8109.4Darwin
335.4453.0620.1466.8504.0543.7482.2Total Tasmania
157.2233.5333.2259.4283.8308.0280.1Balance of Tasmania178.2219.6286.9207.4220.2235.7202.2Hobart
2 578.63 164.53 890.22 328.92 498.42 655.91 978.1Total Western Australia
560.9710.9891.0579.5623.0661.7523.5Balance of Western Australia2 017.62 453.62 999.21 749.41 875.31 994.21 454.6Perth
1 537.51 580.71 736.11 620.71 625.21 635.81 532.7Total South Australia
399.0376.8409.3433.8424.0423.3409.5Balance of South Australia1 138.51 203.91 326.81 186.91 201.31 212.51 123.2Adelaide
5 744.16 899.08 584.84 816.35 149.25 526.93 888.1Total Queensland
2 966.03 544.34 382.82 578.02 745.62 929.42 110.4Balance of Queensland2 778.13 354.74 202.02 238.32 403.62 597.41 777.7Brisbane
6 191.26 574.17 428.75 681.85 761.75 886.84 963.0Total Victoria
1 624.41 533.01 534.21 546.51 508.31 475.61 370.0Balance of Victoria4 566.85 041.15 894.64 135.34 253.44 411.23 593.0Melbourne
7 960.48 742.710 107.97 525.47 714.47 944.66 720.8Total New South Wales
2 668.23 133.93 796.32 711.62 842.92 973.72 495.7Balance of New South Wales5 292.15 608.86 311.64 813.84 871.54 970.94 225.1Sydney
NU M B E R ( ' 0 0 0 )
Series CSeries BSeries ASeries CSeries BSeries AObserved
AT 30 JUNE 2051AT 30 JUNE 2021AT 30 JUNE 2004(a)
Cap i t a l c i t y / b a l ance of
s ta t e
POPULAT ION SIZE, Observed and pro jec ted
50 A B S • P O P U L A T I O N P R O J E C T I O N S , A U S T R A L I A • 3 2 2 2 . 0 • 2 0 0 4 T O 2 1 0 1
CH A P T E R 4 • P R O J E C T I O N R E S U L T S — ST A T E S A N D T E R R I T O R I E S

(c) Includes Other Territories.(a) Estimated resident population, base population.(b) Includes the Australian Capital Territory.
100.0100.0100.0100.0100.0100.0100.0Australia(c)
34.034.334.535.735.735.736.2Total balance of state
66.065.765.564.364.364.363.8Total capital cities(b)
1.21.41.61.41.51.61.6Total Australian Capital Territory
0.91.21.40.91.11.11.0Total Northern Territory
0.30.40.50.40.40.50.4Balance of Northern Territory0.60.80.90.60.60.70.5Darwin
1.31.61.92.02.12.22.4Total Tasmania
0.60.81.01.11.21.21.4Balance of Tasmania0.70.80.90.90.90.91.0Hobart
10.411.211.710.110.510.79.8Total Western Australia
2.32.52.72.52.62.72.6Balance of Western Australia8.18.79.07.67.98.07.2Perth
6.25.65.27.06.86.67.6Total South Australia
1.61.31.21.91.81.72.0Balance of South Australia4.64.34.05.25.04.95.6Adelaide
23.124.525.721.021.622.219.4Total Queensland
11.912.613.111.211.511.810.5Balance of Queensland11.211.912.69.710.110.48.8Brisbane
24.923.322.224.724.123.724.7Total Victoria
6.55.44.66.76.35.96.8Balance of Victoria18.417.917.718.017.817.717.9Melbourne
32.031.030.332.732.331.933.5Total New South Wales
10.711.111.411.811.912.012.4Balance of New South Wales21.319.918.920.920.420.021.0Sydney
D I S T R I B U T I O N (% )
Series CSeries BSeries ASeries CSeries BSeries AObserved
AT 30 JUNE 2051AT 30 JUNE 2021AT 30 JUNE 2004(a)
Cap i t a l c i t y / b a l ance of
s ta t e
POPULAT ION DISTRIBUT ION, Observed and pro jec ted
A B S • P O P U L A T I O N P R O J E C T I O N S , A U S T R A L I A • 3 2 2 2 . 0 • 2 0 0 4 T O 2 1 0 1 51
CH A P T E R 4 • P R O J E C T I O N R E S U L T S — ST A T E S A N D T E R R I T O R I E S

(a) Estimated resident population, base population.
100.0100.0100.0100.0100.0100.0100.0Total Northern Territory
31.833.637.240.840.341.045.2Balance of Northern Territory68.266.462.859.259.759.054.8Darwin
100.0100.0100.0100.0100.0100.0100.0Total Tasmania
46.951.553.755.656.356.758.1Balance of Tasmania53.148.546.344.443.743.341.9Hobart
100.0100.0100.0100.0100.0100.0100.0Total Western Australia
21.822.522.924.924.924.926.5Balance of Western Australia78.277.577.175.175.175.173.5Perth
100.0100.0100.0100.0100.0100.0100.0Total South Australia
26.023.823.626.826.125.926.7Balance of South Australia74.076.276.473.273.974.173.3Adelaide
100.0100.0100.0100.0100.0100.0100.0Total Queensland
51.651.451.153.553.353.054.3Balance of Queensland48.448.648.946.546.747.045.7Brisbane
100.0100.0100.0100.0100.0100.0100.0Total Victoria
26.223.320.727.226.225.127.6Balance of Victoria73.876.779.372.873.874.972.4Melbourne
100.0100.0100.0100.0100.0100.0100.0Total New South Wales
33.535.837.636.036.937.437.1Balance of New South Wales66.564.262.464.063.162.662.9Sydney
SH A R E OF ST A T E ( % )
Series CSeries BSeries ASeries CSeries BSeries AObserved
AT 30 JUNE 2051AT 30 JUNE 2021AT 30 JUNE 2004(a)
Cap i t a l c i t y / b a l ance of
s ta t e
CAPITAL CITY/BALANCE OF STATE POPULAT ION SHARE, Observed and pro jec ted
In Series B all capital cities are projected to increase their share of their respective state
or territory population over the next 50 years. By 2051 Perth, Melbourne and Adelaide
will have the largest shares, with 78% of Western Australians living in Perth (compared to
74% in 2004), 77% of Victorians living in Melbourne (72% in 2004), and 76% of South
Australians living in Adelaide (73% in 2004). Darwin will experience the largest gain in
share, increasing by 12 percentage points to 66% of the Northern Territory's population
in 2051 (from 55% in 2004). Sydney will experience the smallest gain, increasing to 64%
(from 63% in 2004). Brisbane's share of Queensland's population is projected to increase
to 49% in 2051 (from 46% in 2004) while Hobart's share is projected to increase to 48%
(from 42% in 2004).
Conversely, each balance of state/territory's share will decrease over the period 2004 to
2051. The populations of the balances of Tasmania and Queensland will remain larger
than their respective capital cities, with 52% and 51% of their state's population
respectively. The balance of the Northern Territory will experience the largest decrease
in share, from 45% of the Northern Territory's population in 2004 to 34% in 2051.
Capital city growth and
share cont inued
52 A B S • P O P U L A T I O N P R O J E C T I O N S , A U S T R A L I A • 3 2 2 2 . 0 • 2 0 0 4 T O 2 1 0 1
CH A P T E R 4 • P R O J E C T I O N R E S U L T S — ST A T E S A N D T E R R I T O R I E S
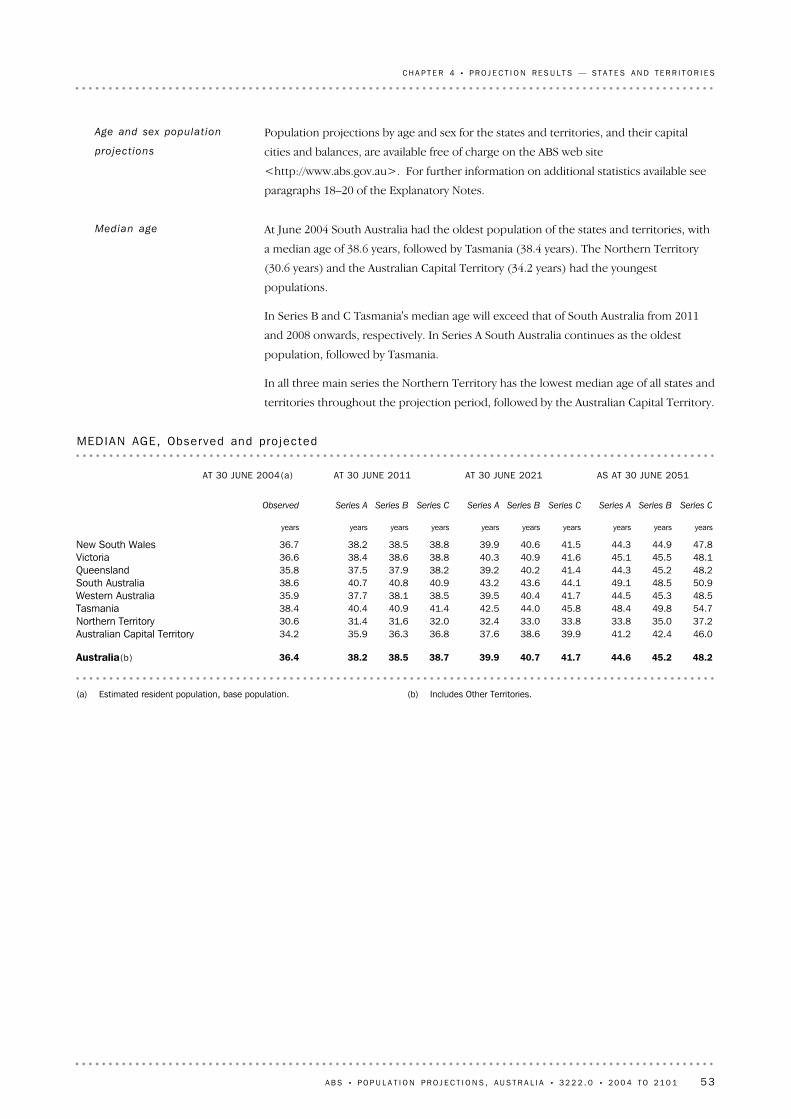
(b) Includes Other Territories.(a) Estimated resident population, base population.
48.245.244.641.740.739.938.738.538.236.4Australia(b)
46.042.441.239.938.637.636.836.335.934.2Australian Capital Territory37.235.033.833.833.032.432.031.631.430.6Northern Territory54.749.848.445.844.042.541.440.940.438.4Tasmania48.545.344.541.740.439.538.538.137.735.9Western Australia50.948.549.144.143.643.240.940.840.738.6South Australia48.245.244.341.440.239.238.237.937.535.8Queensland48.145.545.141.640.940.338.838.638.436.6Victoria47.844.944.341.540.639.938.838.538.236.7New South Wales
yearsyearsyearsyearsyearsyearsyearsyearsyearsyears
Series CSeries BSeries ASeries CSeries BSeries ASeries CSeries BSeries AObserved
AS AT 30 JUNE 2051AT 30 JUNE 2021AT 30 JUNE 2011AT 30 JUNE 2004(a)
MEDIAN AGE, Observed and pro jec ted
At June 2004 South Australia had the oldest population of the states and territories, with
a median age of 38.6 years, followed by Tasmania (38.4 years). The Northern Territory
(30.6 years) and the Australian Capital Territory (34.2 years) had the youngest
populations.
In Series B and C Tasmania's median age will exceed that of South Australia from 2011
and 2008 onwards, respectively. In Series A South Australia continues as the oldest
population, followed by Tasmania.
In all three main series the Northern Territory has the lowest median age of all states and
territories throughout the projection period, followed by the Australian Capital Territory.
Median age
Population projections by age and sex for the states and territories, and their capital
cities and balances, are available free of charge on the ABS web site
<http://www.abs.gov.au>. For further information on additional statistics available see
paragraphs 18–20 of the Explanatory Notes.
Age and sex populat ion
project ions
A B S • P O P U L A T I O N P R O J E C T I O N S , A U S T R A L I A • 3 2 2 2 . 0 • 2 0 0 4 T O 2 1 0 1 53
CH A P T E R 4 • P R O J E C T I O N R E S U L T S — ST A T E S A N D T E R R I T O R I E S

(b) Population has no turning point.(c) Includes Other Territories.
. . not applicable(a) Year or range of years in which population peaks, based on figures
rounded to nearest hundred.
2048(b)(b). .. .. .. .. .. .Australia(c)
2016–2017(b)(b). .. .. .. .. .. .Australian Capital Territory(b)(b)(b) 2006(b)(b)(b)(b)(b)Northern Territory
20062023–2024(b) 20062013–2016(b)2016–20202033–2035(b)Tasmania(b)(b)(b) 2032(b)(b)(b)(b)(b)Western Australia
2030 2032(b)2027–20282022–20232029–2030 2031 2035(b)South Australia(b)(b)(b)(b)(b)(b)(b)(b)(b)Queensland
2050(b)(b) 2041 20372044–2045(b)(b)(b)Victoria 2044(b)(b)2033–2034(b)(b)(b)(b)(b)New South Wales
yearyearyearyearyearyearyearyearyear
Series CSeries BSeries ASeries CSeries BSeries ASeries CSeries BSeries A
TOTALBALANCE OF STATECAPITAL CITY
POPULAT ION TURNING POINTS (a)
Between 2004 and 2051 the populations of some states and territories will continue to
increase, while for others a turning point will be reached at some point; that is, the
population will reach a peak and then decline.
In Series A the populations of all states and territories are projected to continue to
increase between 2004 and 2051.
In Series B only Tasmania and South Australia will reach turning points during the
projection period. The population of Tasmania is projected to peak between 2023 and
2024, while the population of South Australia will peak in 2032.
In Series C the populations of New South Wales, Victoria, South Australia, Tasmania and
the Australian Capital Territory will peak at some point during the projection period,
while the populations of Queensland, Western Australia and the Northern Territory will
continue to increase.
In Series A the populations of all capital cities are projected to continue to increase
between 2004 and 2051. In both Series B and C, Hobart and Adelaide are the only capital
cities that will experience a turning point. The population of the Australian Capital
Territory will continue to increase in Series A and B, but will decrease from around 2016
and 2017 in Series C.
For Australia, the population will reach a peak in Series C only, in 2048.
Populat ion turning points
54 A B S • P O P U L A T I O N P R O J E C T I O N S , A U S T R A L I A • 3 2 2 2 . 0 • 2 0 0 4 T O 2 1 0 1
CH A P T E R 4 • P R O J E C T I O N R E S U L T S — ST A T E S A N D T E R R I T O R I E S

2001 2011 2021 2031 2041 2051At 30 June
million
4.0
4.5
5.0
5.5
6.0
6.5Series ASeries BSeries C
PROJECTED POPULAT ION, Sydney
The majority of the growth in New South Wales' population will occur in Sydney, where
the population is projected to increase from 4.2 million at June 2004 to between 5.3
million and 6.3 million in 2051. Population growth in the balance of New South Wales
will be relatively small, from 2.5 million at June 2004 to between 2.7 million and 3.8
million in 2051.
2001 2011 2021 2031 2041 2051At 30 June
million
6
7
9
10
11Series ASeries BSeries C
PROJECTED POPULAT ION, New South Wales
Assumptions underlying all series, including the three main series, of population
projections for New South Wales, Sydney and the Balance of New South Wales are
presented in tables 5.8 to 5.10.
From 6.7 million people at June 2004, Series A projects the largest population for New
South Wales, of 10.1 million in 2051. Series B projects an increase in the New South
Wales' population to 8.7 million in 2051. The smallest population (8.0 million people) of
the three main series is projected in Series C. In Series C the population peaks in 2044 at
just under 8.0 million, then gradually declines.
NE W SO U T H WA L E S
Populat ion size
A B S • P O P U L A T I O N P R O J E C T I O N S , A U S T R A L I A • 3 2 2 2 . 0 • 2 0 0 4 T O 2 1 0 1 55
CH A P T E R 4 • P R O J E C T I O N R E S U L T S — ST A T E S A N D T E R R I T O R I E S

PROJECTED POPULAT ION, SERIES B, NEW SOUTH WALES — AT 30 JUNE
012345
0–4
5–9
10–14
15–19
20–24
25–29
30–34
35–39
40–44
45–49
50–54
55–59
60–64
65–69
70–74
75–79
80–84
85+
0 1 2 3 4 5
0–4
5–9
10–14
15–19
20–24
25–29
30–34
35–39
40–44
45–49
50–54
55–59
60–64
65–69
70–74
75–79
80–84
85+
2004
2051
Males Females%
Age group (years)
Population projections by age and sex for New South Wales, Sydney and the Balance of
New South Wales, are available free of charge on the ABS web site
<http://www.abs.gov.au>. For further information on additional statistics available see
paragraphs 18–20 of the Explanatory Notes.
Populat ion by age and sex
In 2003–04 there were 85,700 births and 46,400 deaths in New South Wales, resulting in
natural increase of 39,400 people. In Series B and C natural increase will decline, with the
number of deaths first exceeding the number of births in 2046–47 and 2034–35
respectively. In Series A natural increase will continue, as deaths do not exceed births
during the projection period.
Births and deaths
2001 2011 2021 2031 2041 2051At 30 June
million
2.5
3.0
3.5
4.0Series ASeries BSeries C
PROJECTED POPULAT ION, Balance of New South WalesPopulat ion size cont inue d
56 A B S • P O P U L A T I O N P R O J E C T I O N S , A U S T R A L I A • 3 2 2 2 . 0 • 2 0 0 4 T O 2 1 0 1
CH A P T E R 4 • P R O J E C T I O N R E S U L T S — ST A T E S A N D T E R R I T O R I E S

The number of people aged 65 years and over in New South Wales is projected to
increase from 907,300 at June 2004 to between 2.2 and 2.7 million in 2051. By then
people aged 65 years and over will account for between 26% and 28% of the population,
compared to 13% in 2004.
The number of people aged 85 years and over is projected to increase even more
dramatically. At June 2004 there were 104,100 people in this age group in New South
Wales. By 2051 this number is projected to increase to between 501,900 and 819,800,
making up 6%–8% of the population, compared to 2% in 2004.
Older people
At June 2004 children aged 0–14 years represented 20% (1.3 million) of the population of
New South Wales. By 2051 this age group is projected to represent between 13% and
16% (between 1.1 and 1.6 million) of the population.
In Series A the number of children aged 0–14 years in New South Wales will increase by
25% between 2004 and 2051, reflecting the high fertility scenario used in this series. In
Series B the number of children will remain more or less the same. Series C projects a
20% decrease in the number of children by 2051.
Young people
The ageing of the population of New South Wales, as in the rest of Australia, is projected
to continue as a result of sustained low fertility combined with increased life expectancy.
The age structure will change substantially by 2051, with greater proportions of older
people and fewer younger people, resulting in the median age increasing from 36.7 years
in 2004 to between 44.3 years and 47.8 years in 2051.
Populat ion ageing
A B S • P O P U L A T I O N P R O J E C T I O N S , A U S T R A L I A • 3 2 2 2 . 0 • 2 0 0 4 T O 2 1 0 1 57
CH A P T E R 4 • P R O J E C T I O N R E S U L T S — ST A T E S A N D T E R R I T O R I E S

2001 2011 2021 2031 2041 2051At 30 June
million
3.5
4.0
4.5
5.0
5.5
6.0Series ASeries BSeries C
PROJECTED POPULAT ION, Melbourne
Most of Victoria's growth is projected to occur in Melbourne, where the population will
increase from 3.6 million at June 2004 to between 4.6 million and 5.9 million in 2051. The
population of the balance of Victoria is projected to peak at some time between 2037
and 2045, before declining to between 1.5 million and 1.6 million by 2051.
2001 2011 2021 2031 2041 2051At 30 June
million
4.5
5.0
5.5
6.0
6.5
7.0
7.5Series ASeries BSeries C
PROJECTED POPULAT ION, Vic to r ia
Assumptions underlying all series, including the three main series, of population
projections for Victoria, Melbourne and the Balance of Victoria are presented in tables
5.12 to 5.14.
At June 2004, Victoria's population was 5.0 million. Series A projects the largest
population for Victoria, of 7.4 million in 2051. Series B projects an increase in Victoria's
population to 6.6 million at June 2051. The smallest population (6.2 million people) of
the three main series is projected in Series C. In Series A and B the population is
projected to continue to increase throughout the projection period, while in Series C the
population peaks in 2050.
V I C T O R I A
Populat ion size
58 A B S • P O P U L A T I O N P R O J E C T I O N S , A U S T R A L I A • 3 2 2 2 . 0 • 2 0 0 4 T O 2 1 0 1
CH A P T E R 4 • P R O J E C T I O N R E S U L T S — ST A T E S A N D T E R R I T O R I E S

PROJECTED POPULAT ION, SERIES B, VICTORIA — AT 30 JUNE
012345
0–4
5–9
10–14
15–19
20–24
25–29
30–34
35–39
40–44
45–49
50–54
55–59
60–64
65–69
70–74
75–79
80–84
85+
0 1 2 3 4 5
0–4
5–9
10–14
15–19
20–24
25–29
30–34
35–39
40–44
45–49
50–54
55–59
60–64
65–69
70–74
75–79
80–84
85+
2004
2051
Males Females%
Age group (years)
Population projections by age and sex for Victoria, Melbourne and the Balance of
Victoria, are available free of charge on the ABS web site <http://www.abs.gov.au>. For
further information on additional statistics available see paragraphs 18–20 of the
Explanatory Notes.
Populat ion by age and sex
In 2003–04 there were 61,900 births and 33,100 deaths in Victoria, resulting in natural
increase of 28,800 people. In Series B and C natural increase will decline, with the
number of deaths first exceeding the number of births in 2040–41 and 2033–34
respectively. In Series A natural increase will continue, as deaths do not exceed births
during the projection period.
Births and deaths
2001 2011 2021 2031 2041 2051At 30 June
million
1.3
1.4
1.5
1.6
1.7Series ASeries BSeries C
PROJECTED POPULAT ION, Balance of Vic to r iaPopulat ion size cont inue d
A B S • P O P U L A T I O N P R O J E C T I O N S , A U S T R A L I A • 3 2 2 2 . 0 • 2 0 0 4 T O 2 1 0 1 59
CH A P T E R 4 • P R O J E C T I O N R E S U L T S — ST A T E S A N D T E R R I T O R I E S
The number of people aged 65 years and over in Victoria is projected to increase from
663,200 at June 2004 to between 1.7 million and 2.1 million in 2051. By then people aged
65 years and over will account for between 26% and 28% of the population, compared to
13% in 2004.
The number of people aged 85 years and over will also increase substantially. At June
2004 there were 76,200 people in this age group in Victoria. By 2051 this number is
projected to increase to between 402,400 and 635,200, making up 6%–9% of the
population, compared to 2% in 2004.
Older people
At June 2004 children aged 0–14 years represented 19% (1.0 million) of the population of
Victoria. By 2051 this age group is projected to represent between 13% and 16%
(between 793,800 and 1.2 million) of the population.
In Series A the number of children aged 0–14 years in Victoria is projected to increase by
20% between 2004 and 2051, reflecting the high fertility assumption used in this series,
while in Series B the number of children will remain more or less the same. Series C
projects a 17% decrease in the number of children by 2051.
Young people
The ageing of the population of Victoria, as in other states and territories, is projected to
continue. The age structure will change substantially by 2051, with greater proportions of
older people and fewer younger people, resulting in the median age increasing from 36.6
years in 2004 to between 45.1 years and 48.1 years in 2051.
Populat ion ageing
60 A B S • P O P U L A T I O N P R O J E C T I O N S , A U S T R A L I A • 3 2 2 2 . 0 • 2 0 0 4 T O 2 1 0 1
CH A P T E R 4 • P R O J E C T I O N R E S U L T S — ST A T E S A N D T E R R I T O R I E S

2001 2011 2021 2031 2041 2051At 30 June
million
1.5
2.0
2.5
3.0
3.5
4.0
4.5Series ASeries BSeries C
PROJECTED POPULAT ION, Br isbane
In contrast to New South Wales and Victoria, Queensland's capital city and balance of
state populations continue to increase throughout the projection period in all three
series. The population of Brisbane is projected to increase from 1.8 million in 2004 to
between 2.8 million and 4.2 million in 2051, while the balance of Queensland is
projected to increase from 2.1 million in 2004 to between 3.0 million and 4.4 million in
2051, and continuing to account for more than half of Queensland's population.
2001 2011 2021 2031 2041 2051At 30 June
million
3
4
5
6
7
8
9Series ASeries BSeries C
PROJECTED POPULAT ION, Queens land
Assumptions underlying all series, including the three main series, of population
projections for Queensland, Brisbane and the Balance of Queensland are presented in
tables 5.16 to 5.18.
The population of Queensland is projected to increase continuously in all three main
projection series from it's June 2004 level of 3.9 million people. Series A projects the
largest population for Queensland, of 8.6 million in 2051. Series B projects an increase in
Queensland's population to 6.9 million by 2051. The smallest population (5.7 million
people) of the three main series is projected in Series C.
QU E E N S L A N D
Populat ion size
A B S • P O P U L A T I O N P R O J E C T I O N S , A U S T R A L I A • 3 2 2 2 . 0 • 2 0 0 4 T O 2 1 0 1 61
CH A P T E R 4 • P R O J E C T I O N R E S U L T S — ST A T E S A N D T E R R I T O R I E S

PROJECTED POPULAT ION, SERIES B, QUEENSLAND — AT 30 JUNE
012345
0–4
5–9
10–14
15–19
20–24
25–29
30–34
35–39
40–44
45–49
50–54
55–59
60–64
65–69
70–74
75–79
80–84
85+
0 1 2 3 4 5
0–4
5–9
10–14
15–19
20–24
25–29
30–34
35–39
40–44
45–49
50–54
55–59
60–64
65–69
70–74
75–79
80–84
85+
2004
2051
Males Females%
Age group (years)
Population projections by age and sex for Queensland, Brisbane and the Balance of
Queensland, are available free of charge on the ABS web site <http://www.abs.gov.au>.
For further information on additional statistics available see paragraphs 18–20 of the
Explanatory Notes.
Populat ion by age and sex
In 2003–04 there were 49,200 births and 24,200 deaths in Queensland, resulting in
natural increase of 25,000 people. In Series B and C natural increase will decline, with the
number of deaths first exceeding the number of births in 2045–46 and 2034–35
respectively. In Series A natural increase will continue, as deaths do not exceed births
during the projection period.
Births and deaths
2001 2011 2021 2031 2041 2051At 30 June
million
2.0
2.5
3.0
3.5
4.0
4.5Series ASeries BSeries C
PROJECTED POPULAT ION, Balance of Queens landPopulat ion size cont inue d
62 A B S • P O P U L A T I O N P R O J E C T I O N S , A U S T R A L I A • 3 2 2 2 . 0 • 2 0 0 4 T O 2 1 0 1
CH A P T E R 4 • P R O J E C T I O N R E S U L T S — ST A T E S A N D T E R R I T O R I E S

The number of people aged 65 years and over in Queensland is projected to increase
from 465,700 in 2004 to between 1.6 million and 2.3 million in 2051. By then people aged
65 years and over will account for between 25% and 28% of the population, compared to
12% in 2004.
The number of people aged 85 years and over will also increase substantially. At June
2004 there were 51,000 people in this age group in Queensland. By 2051 this number is
projected to increase to between 349,100 and 631,700, making up 5%–7% of the
population, compared to 1% in 2004.
Older people
At June 2004 children aged 0–14 years represented 21% (799,700) of Queensland's
population. By 2051 this age group is projected to represent between 13% and 16%
(between 763,300 and 1.4 million) of the population.
The number of children aged 0–14 years in Queensland is projected to increase in two of
the three main projection series. In Series A the number increases by 76% between 2004
and 2051, reflecting the high fertility scenario used in this series, while Series B also
projects an increase (of 32%). In Series C, which assumes low levels of fertility, the
number of children is projected to decline by 5%.
Young people
The ageing of the population of Queensland, as in other states and territories, is
projected to continue. The age structure will change substantially by 2051, with greater
proportions of older people and fewer younger people, resulting in the median age
increasing from 35.8 years in 2004 to between 44.3 years and 48.2 years in 2051.
Populat ion ageing
A B S • P O P U L A T I O N P R O J E C T I O N S , A U S T R A L I A • 3 2 2 2 . 0 • 2 0 0 4 T O 2 1 0 1 63
CH A P T E R 4 • P R O J E C T I O N R E S U L T S — ST A T E S A N D T E R R I T O R I E S

2001 2011 2021 2031 2041 2051At 30 June
million
1.1
1.2
1.3
1.4Series ASeries BSeries C
PROJECTED POPULAT ION, Ade la ide
Just under three quarters of South Australia's population live in Adelaide, a proportion
projected to increase marginally over the projection period. In Series A the population of
Adelaide will increase from 1.1 million in 2004 to 1.3 million in 2051. In Series C
Adelaide's population will peak at 1.2 million in 2031 while in Series B it will peak at just
over 1.2 million in 2035, before declining over the rest of the projection period.
The population of the balance of South Australia at June 2004 was 409,500 people. After
increases in all series for around twenty years, the population is projected to decline to
between 376,800 and 409,300 in 2051.
2001 2011 2021 2031 2041 2051At 30 June
million
1.4
1.5
1.6
1.7
1.8Series ASeries BSeries C
PROJECTED POPULAT ION, South Aust ra l i a
Assumptions underlying all series, including the three main series, of population
projections for South Australia, Adelaide and the Balance of South Australia are
presented in tables 5.20 to 5.22.
In two of the three main series the population of South Australia is projected to increase
over the next two and a half decades and then decline. In Series B and C the population
peaks at just over 1.6 million people in 2032 and 2030 respectively, and by 2051 is
projected to decline to 1.6 million and 1.5 million, respectively, numbers only slightly
higher than the 2004 population (1.5 million). In Series A the population of South
Australia is projected to continue to increase, reaching 1.7 million in 2051.
SO U T H AU S T R A L I A
Populat ion size
64 A B S • P O P U L A T I O N P R O J E C T I O N S , A U S T R A L I A • 3 2 2 2 . 0 • 2 0 0 4 T O 2 1 0 1
CH A P T E R 4 • P R O J E C T I O N R E S U L T S — ST A T E S A N D T E R R I T O R I E S

PROJECTED POPULAT ION, SERIES B, SOUTH AUSTRAL IA — AT 30 JUNE
012345
0–4
5–9
10–14
15–19
20–24
25–29
30–34
35–39
40–44
45–49
50–54
55–59
60–64
65–69
70–74
75–79
80–84
85+
0 1 2 3 4 5
0–4
5–9
10–14
15–19
20–24
25–29
30–34
35–39
40–44
45–49
50–54
55–59
60–64
65–69
70–74
75–79
80–84
85+
2004
2051
Males Females%
Age group (years)
Population projections by age and sex for South Australia, Adelaide and the Balance of
South Australia, are available free of charge on the ABS web site
<http://www.abs.gov.au>. For further information on additional statistics available see
paragraphs 18–20 of the Explanatory Notes.
Populat ion by age and sex
In 2003–04 there were 17,200 births and 11,900 deaths in South Australia, resulting in
natural increase of 5,300 people. In Series B and C natural increase will decline, with the
number of deaths first exceeding the number of births in 2024–25 and 2029–30
respectively. In Series A natural increase will continue, as deaths do not exceed births
during the projection period.
Births and deaths
2001 2011 2021 2031 2041 2051At 30 June
'000
360
380
400
420
440Series ASeries BSeries C
PROJECTED POPULAT ION, Balance of South Aust ra l i aPopulat ion size cont inue d
A B S • P O P U L A T I O N P R O J E C T I O N S , A U S T R A L I A • 3 2 2 2 . 0 • 2 0 0 4 T O 2 1 0 1 65
CH A P T E R 4 • P R O J E C T I O N R E S U L T S — ST A T E S A N D T E R R I T O R I E S

The number of people aged 65 years and over in South Australia is projected to increase
from 230,700 in 2004 to between 472,000 and 563,200 in 2051. By then people aged 65
years and over will account for almost one-third (30% to 32%) of South Australia's
population, compared to 15% in 2004.
The number of people aged 85 years and over will also increase substantially. At June
2004 there were 28,000 people in this age group in South Australia. By 2051 this number
is projected to increase to between 116,200 and 188,200, making up 7%–11% of the
population, compared to 2% in 2004.
Older people
At June 2004 children aged 0–14 years represented 19% (285,800) of South Australia's
population. By 2051 this age group is projected to represent between 12% and 14%
(between 187,100 and 251,600) of the population.
The number of children aged 0–14 years in South Australia is projected to decrease in all
three main series. In Series A the number will decrease by 12% between 2004 and 2051,
while Series B and C project decreases of 23% and 35% respectively.
Young people
The ageing of the population of South Australia, as in the rest of Australia, is projected to
continue. In 2004 South Australia had the oldest population of the states and territories
with a median age of 38.6 years, compared to 36.4 years for Australia. South Australia's
age structure will change substantially by 2051, with greater proportions of older people
and fewer younger people, resulting in the median age increasing to between 48.5 years
and 50.9 years in 2051.
Populat ion ageing
66 A B S • P O P U L A T I O N P R O J E C T I O N S , A U S T R A L I A • 3 2 2 2 . 0 • 2 0 0 4 T O 2 1 0 1
CH A P T E R 4 • P R O J E C T I O N R E S U L T S — ST A T E S A N D T E R R I T O R I E S

2001 2011 2021 2031 2041 2051At 30 June
million
1.0
1.5
2.0
2.5
3.0Series ASeries BSeries C
PROJECTED POPULAT ION, Per th
In all three main series the population of Perth is projected to increase over the entire
projection period, to between 2.0 million and 3.0 million in 2051 from the June 2004
population of 1.5 million.
In two of the three series the population of the balance of Western Australia is projected
to increase, from 523,500 at June 2004 to 710,900 (Series B) and 891,000 (Series A). In
Series C the population is projected to increase slowly, peaking at 591,900 in 2032,
before declining to 560,900 in 2051.
2001 2011 2021 2031 2041 2051At 30 June
million
1.5
2.0
2.5
3.0
3.5
4.0Series ASeries BSeries C
PROJECTED POPULAT ION, Weste rn Aust ra l i a
Assumptions underlying all series, including the three main series, of population
projections for Western Australia, Perth and the Balance of Western Australia are
presented in tables 5.24 to 5.26.
From 2.0 million at June 2004, the population of Western Australia is projected to
increase continuously in all three main projection series. Series A projects the largest
population for Western Australia, of 3.9 million in 2051. Series B projects an increase in
Western Australia's population to 3.2 million in 2051. The smallest population
(2.6 million people) of the three main series is projected in Series C.
WE S T E R N AU S T R A L I A
Populat ion size
A B S • P O P U L A T I O N P R O J E C T I O N S , A U S T R A L I A • 3 2 2 2 . 0 • 2 0 0 4 T O 2 1 0 1 67
CH A P T E R 4 • P R O J E C T I O N R E S U L T S — ST A T E S A N D T E R R I T O R I E S

PROJECTED POPULAT ION, SERIES B, WESTERN AUSTRAL IA — AT 30 JUNE
012345
0–4
5–9
10–14
15–19
20–24
25–29
30–34
35–39
40–44
45–49
50–54
55–59
60–64
65–69
70–74
75–79
80–84
85+
0 1 2 3 4 5
0–4
5–9
10–14
15–19
20–24
25–29
30–34
35–39
40–44
45–49
50–54
55–59
60–64
65–69
70–74
75–79
80–84
85+
2004
2051
Males Females%
Age group (years)
Population projections by age and sex for Western Australia, Perth and the Balance of
Western Australia, are available free of charge on the ABS web site
<http://www.abs.gov.au>. For further information on additional statistics available see
paragraphs 18–20 of the Explanatory Notes.
Populat ion by age and sex
In 2003–04 there were 24,500 births and 11,300 deaths in Western Australia, resulting in
natural increase of 13,200 people. In Series B and C natural increase will decline, with the
number of deaths first exceeding the number of births in 2045–46 and 2033–34
respectively. In Series A natural increase will continue, as deaths do not exceed births
during the projection period.
Births and deaths
2001 2011 2021 2031 2041 2051At 30 June
'000
500
600
700
800
900Series ASeries BSeries C
PROJECTED POPULAT ION, Balance of Weste rn Aust ra l i aPopulat ion size cont inue d
68 A B S • P O P U L A T I O N P R O J E C T I O N S , A U S T R A L I A • 3 2 2 2 . 0 • 2 0 0 4 T O 2 1 0 1
CH A P T E R 4 • P R O J E C T I O N R E S U L T S — ST A T E S A N D T E R R I T O R I E S

The number of people aged 65 years and over in Western Australia is projected to
increase from 230,200 at June 2004 to between 739,300 and 1.0 million in 2051. By then
people aged 65 years and over will account for between 26% and 29% of the population,
compared to 12% in 2004.
The number of people aged 85 years and over will also increase substantially. At June
2004 there were 25,000 people in this age group in Western Australia. By 2051 this
number is projected to increase to between 172,400 and 304,300, making up 6%–8% of
the population, compared to 1% in 2004.
Older people
At June 2004 children aged 0–14 years represented 20% (398,700) of Western Australia's
population. By 2051 this age group is projected to represent between 13% and 16%
(between 332,300 and 623,000) of the population.
The number of children aged 0–14 years in Western Australia is projected to increase in
two of the three main projection series. In Series A the number will increase by 56%
between 2004 and 2051, reflecting the high fertility scenario used in this series, while
Series B projects the number to increase by 18%. In Series C the number of children is
projected to decrease by 17%.
Young people
The ageing of the population of Western Australia, as in other states and territories, is
projected to continue. The age structure is projected to change substantially by 2051,
with greater proportions of older people and fewer younger people, resulting in the
median age increasing from 35.9 years in 2004 to between 44.5 years and 48.5 years in
2051.
Populat ion ageing
A B S • P O P U L A T I O N P R O J E C T I O N S , A U S T R A L I A • 3 2 2 2 . 0 • 2 0 0 4 T O 2 1 0 1 69
CH A P T E R 4 • P R O J E C T I O N R E S U L T S — ST A T E S A N D T E R R I T O R I E S

The proportion of Tasmania's population living in Hobart is projected to increase from
42% in 2004 to between 46% and 53% in 2051. At June 2004 the population of Hobart
was 202,200. Series A projects continuing growth throughout the projection for Hobart,
reaching 286,900 in 2051. In Series B the population will initially increase, peaking at
226,000 between 2033 and 2035, before declining to 219,600 in 2051. In Series C Hobart's
population will increase only slightly, to a peak of 207,500 between 2016 and 2020,
before decreasing to 178,200 in 2051 (24,000, or 12%, fewer people than in 2004).
The population of the balance of Tasmania will continue to increase in Series A (from
280,100 at June 2004 to 333,200 in 2051), but will decrease from 2015 onwards in
Series B (reaching 233,500 in 2051) and from 2006 onwards in Series C (to 157,200 in
2051).
2001 2011 2021 2031 2041 2051At 30 June
'000
300
400
500
600
700Series ASeries BSeries C
PROJECTED POPULAT ION, Tasman ia
Assumptions underlying all series, including the three main series, of population
projections for Tasmania, Hobart and the Balance of Tasmania are presented in tables
5.28 to 5.30.
At June 2004 the population of Tasmania was 482,200 people. The population of
Tasmania is projected to decline over the period 2004 to 2051 in two of the three main
series. In Series B the population will initially increase gradually, peaking at 504,500 in
2023 or 2024 before declining to 453,000 in 2051, while in Series C the population will
decline from 2006 onwards, reaching 335,400 in 2051. In Series A Tasmania's population
will continue to increase throughout the projection period, from 482,200 at June 2004 to
620,100 in 2051.
TA S M A N I A
Populat ion size
70 A B S • P O P U L A T I O N P R O J E C T I O N S , A U S T R A L I A • 3 2 2 2 . 0 • 2 0 0 4 T O 2 1 0 1
CH A P T E R 4 • P R O J E C T I O N R E S U L T S — ST A T E S A N D T E R R I T O R I E S

Population projections by age and sex for Tasmania, Hobart and the Balance of
Tasmania, are available free of charge on the ABS web site <http://www.abs.gov.au>. For
further information on additional statistics available see paragraphs 18–20 of the
Explanatory Notes.
Populat ion by age and sex
In 2003–04 there were 5,700 births and 4,000 deaths in Tasmania, resulting in natural
increase of 1,800 people. In Series B and C natural increase will decline, with deaths first
exceeding births in 2027–28 and 2020–21 respectively. In Series A natural increase will
continue, as deaths do not exceed births during the projection period.
Births and deaths
2001 2011 2021 2031 2041 2051At 30 June
'000
150
200
250
300
350Series ASeries BSeries C
PROJECTED POPULAT ION, Balance of Tasman ia
2001 2011 2021 2031 2041 2051At 30 June
'000
175
200
225
250
275
300Series ASeries BSeries C
PROJECTED POPULAT ION, Hobar tPopulat ion size cont inue d
A B S • P O P U L A T I O N P R O J E C T I O N S , A U S T R A L I A • 3 2 2 2 . 0 • 2 0 0 4 T O 2 1 0 1 71
CH A P T E R 4 • P R O J E C T I O N R E S U L T S — ST A T E S A N D T E R R I T O R I E S

The number of people aged 65 years and over in Tasmania is projected to increase from
68,900 at June 2004 to between 121,600 and 196,600 in 2051. By then people aged 65
years and over will account for around one-third (31% to 36%) of the population,
compared to 14% in 2004.
The number of people aged 85 years and over will also increase substantially. At June
2004 there were 7,700 people in this age group in Tasmania. By 2051 this number is
projected to increase to between 30,700 and 61,900, making up 7%–10% of the
population, compared to 2% in 2004.
Older people
At June 2004 children aged 0–14 years represented 20% (97,100) of Tasmania's
population. By 2051 this age group is projected to represent between 12% and 16%
(between 40,900 and 100,300 children) of the population.
The number of children aged 0–14 years in Tasmania is projected to decrease in two of
the three main series. In Series C the number will decrease by 58% between 2004 and
2051, while Series B projects a decrease of 31%. In Series A the number of children is
projected to increase only marginally (by 3%) by 2051.
Young people
At June 2004 the median age of Tasmania's population was 38.4 years, the second highest
of the states and territories. By 2051 the median age is projected to increase to between
48.4 years and 54.7 years, largely as a result of proportionally large declines in younger
age groups together with increases in older age groups, as shown in Tasmania's age
profile on the previous page.
Populat ion ageing
PROJECTED POPULAT ION, SERIES B, TASMANIA — AT 30 JUNE
012345
0–4
5–9
10–14
15–19
20–24
25–29
30–34
35–39
40–44
45–49
50–54
55–59
60–64
65–69
70–74
75–79
80–84
85+
0 1 2 3 4 5
0–4
5–9
10–14
15–19
20–24
25–29
30–34
35–39
40–44
45–49
50–54
55–59
60–64
65–69
70–74
75–79
80–84
85+
2004
2051
Males Females%
Age group (years)
72 A B S • P O P U L A T I O N P R O J E C T I O N S , A U S T R A L I A • 3 2 2 2 . 0 • 2 0 0 4 T O 2 1 0 1
CH A P T E R 4 • P R O J E C T I O N R E S U L T S — ST A T E S A N D T E R R I T O R I E S

2001 2011 2021 2031 2041 2051At 30 June
'000
100
150
200
250
300Series ASeries BSeries C
PROJECTED POPULAT ION, Darwin
The proportion of the Northern Territory population living in Darwin is projected to
increase from 55% at June 2004 to between 63% and 68% in 2051. The population of
Darwin will continue to increase in all three main series, from 109,400 at June 2004 to
between 153,000 and 295,500 in 2051.
The population of the balance of Northern Territory is projected to increase in Series A
and B, from 90,400 at June 2004 to 117,700 and 175,000 respectively in 2051. In Series C
the population will decrease throughout the projection period, reaching 71,300 in 2051.
2001 2011 2021 2031 2041 2051At 30 June
'000
100
200
300
400
500Series ASeries BSeries C
PROJECTED POPULAT ION, Nor thern Ter r i to r y
Assumptions underlying all series, including the three main series, of population
projections for the Northern Territory, Darwin and the Balance of the Northern Territory
are presented in tables 5.32 to 5.34.
The population of the Northern Territory is projected to increase in all three main series,
from 199,800 at June 2004 to 224,300 in Series C (lowest), 350,000 in Series B (medium),
and 470,500 in Series A (highest), by 2051.
NO R T H E R N TE R R I T O R Y
Populat ion size
A B S • P O P U L A T I O N P R O J E C T I O N S , A U S T R A L I A • 3 2 2 2 . 0 • 2 0 0 4 T O 2 1 0 1 73
CH A P T E R 4 • P R O J E C T I O N R E S U L T S — ST A T E S A N D T E R R I T O R I E S

PROJECTED POPULAT ION, SERIES B, NORTHERN TERRITORY — AT 30JUNE
012345
0�4 5�9 10�1415�1920�2425�2930�3435�3940�4445�4950�5455�5960�6465�6970�7475�7980�8485+
0 1 2 3 4 5
0–4
5–9
10–14
15–19
20–24
25–29
30–34
35–39
40–44
45–49
50–54
55–59
60–64
65–69
70–74
75–79
80–84
85+
2004
2051
Males Females%
Age group (years)
Population projections by age and sex for the Northern Territory, Darwin and the
Balance of the Northern Territory, are available free of charge on the ABS web site
<http://www.abs.gov.au>. For further information on additional statistics available see
paragraphs 18–20 of the Explanatory Notes.
Populat ion by age and sex
In 2003–04 there were 3,600 births and 870 deaths in the Northern Territory, resulting in
natural increase of 2,800 people. The Northern Territory is the only state or territory in
which all three main series project natural increase to continue throughout the
projection period. In Series A natural increase will steadily rise, in Series B natural
increase will remain close to the 2003–04 level, while in Series C natural increase will
decline, but remain positive.
Births and deaths
2001 2011 2021 2031 2041 2051At 30 June
'000
50
75
100
125
150
175Series ASeries BSeries C
PROJECTED POPULAT ION, Balance of Nor thern Ter r i to r yPopulat ion size cont inue d
74 A B S • P O P U L A T I O N P R O J E C T I O N S , A U S T R A L I A • 3 2 2 2 . 0 • 2 0 0 4 T O 2 1 0 1
CH A P T E R 4 • P R O J E C T I O N R E S U L T S — ST A T E S A N D T E R R I T O R I E S

The number of people aged 65 years and over in the Northern Territory is projected to
increase from 8,800 at June 2004 to between 28,600 and 56,600 in 2051. By then people
aged 65 years and over will account for between 12% and 13% of the population,
compared to 4% in 2004.
The number of people aged 85 years and over will also increase. At June 2004 there were
600 people in this age group in the Northern Territory. By 2051 this number is projected
to increase to between 3,700 and 9,400, making up 1%–2% of the population compared
to 0.3% in 2004.
Older people
At June 2004 children aged 0–14 years represented 25% (50,400) of the Northern
Territory's population. By 2051 this age group is projected to represent between 19% and
23% (between 43,000 and 108,700) of the population.
The number of children aged 0–14 years in the Northern Territory is projected to
increase in two of the three main series. In Series A the number will more than double
(increasing by 116%) between 2004 and 2051, while Series B projects an increase of 49%.
In Series C the number of children is projected to decrease 15% by 2051.
Young people
The Northern Territory will experience considerably less ageing of the population than
other states and territories, largely due to comparatively high assumed fertility levels.
The Northern Territory has the youngest population of the states and territories, with a
median age of 30.6 years (compared to 36.4 years for Australia as a whole) at June 2004.
This is projected to increase to between 33.8 years and 37.2 years in 2051.
The Northern Territory's age structure is considerably different to the other states and
territories, with a more triangular shape, as shown on the previous page.
Populat ion ageing
A B S • P O P U L A T I O N P R O J E C T I O N S , A U S T R A L I A • 3 2 2 2 . 0 • 2 0 0 4 T O 2 1 0 1 75
CH A P T E R 4 • P R O J E C T I O N R E S U L T S — ST A T E S A N D T E R R I T O R I E S

Population projections by age and sex for the Australian Capital Territory are available
free of charge on the ABS web site <http://www.abs.gov.au>. For further information on
additional statistics available see paragraphs 18–20 of the Explanatory Notes.
Populat ion by age and sex
In 2003–04 there were 4,200 births and 1,500 deaths in the Australian Capital Territory,
resulting in natural increase of 2,700 people. In Series B and C natural increase will
decline, with Series C projecting the number of deaths to first exceed the number of
births in 2038–39. In Series A natural increase will fluctuate at levels higher than the
current level.
Births and deaths
2001 2011 2021 2031 2041 2051At 30 June
'000
200
300
400
500
600Series ASeries BSeries C
PROJECTED POPULAT ION, Aust ra l ian Capi ta l Ter r i to r y
Assumptions underlying all series, including the three main series, of population
projections for the Australian Capital Territory are presented in table 5.36.
The population of the Australian Capital Territory is projected to increase in two of the
three main series, from 324,100 at June 2004 to 401,600 (Series A) or 547,100 (Series B)
in 2051. In Series C the population will increase only slightly to a peak of 330,800 in 2017,
before decreasing to 289,500 by 2051.
AU S T R A L I A N CA P I T A L
TE R R I T O R Y
Populat ion size
76 A B S • P O P U L A T I O N P R O J E C T I O N S , A U S T R A L I A • 3 2 2 2 . 0 • 2 0 0 4 T O 2 1 0 1
CH A P T E R 4 • P R O J E C T I O N R E S U L T S — ST A T E S A N D T E R R I T O R I E S

The number of people aged 65 years and over in the Australian Capital Territory is
projected to increase from 30,100 at June 2004 to between 75,500 and 128,000 in 2051.
By then people aged 65 years and over are projected to account for between 23% and
26% of the population, compared to 9% in 2004.
The number of people aged 85 years and over is projected to increase even more
substantially. At June 2004 there were 3,000 people in this age group in the Australian
Capital Territory. This number is projected to increase more than six fold by 2051 to
between 18,200 and 39,200, making up 5%–7% of the population, compared to 1% in
2004.
Older people
At June 2004 children aged 0–14 years represented 20% (63,200) of the population of the
Australian Capital Territory. By 2051 this age group is projected to represent between
13% and 17% (between 38,100 and 90,400) of the population.
In Series A the number of children aged 0–14 years is projected to increase by 43%
between 2004 and 2051, reflecting the high fertility scenario used in this series. In
Series B the number of children will remain more or less the same, while Series C
projects a 40% decrease in the number of children by 2051.
Young people
The ageing of the population of the Australian Capital Territory, as in the rest of
Australia, is projected to continue as a result of sustained low fertility combined with
increased life expectancy. The age structure will change substantially by 2051, with
greater proportions of older people and fewer younger people, resulting in the median
age increasing from 34.2 years in 2004 to between 41.2 years and 46.0 years in 2051.
Populat ion ageing
PROJECTED POPULAT ION, SERIES B, AUSTRAL IAN CAPITAL TERRITORY — AT 30 JUNE
012345
0�4 5�9 10�1415�1920�2425�2930�3435�3940�4445�4950�5455�5960�6465�6970�7475�7980�8485+
0 1 2 3 4 5
0–4
5–9
10–14
15–19
20–24
25–29
30–34
35–39
40–44
45–49
50–54
55–59
60–64
65–69
70–74
75–79
80–84
85+
2004
2051
Males Females%
Age group (years)
A B S • P O P U L A T I O N P R O J E C T I O N S , A U S T R A L I A • 3 2 2 2 . 0 • 2 0 0 4 T O 2 1 0 1 77
CH A P T E R 4 • P R O J E C T I O N R E S U L T S — ST A T E S A N D T E R R I T O R I E S

CHAP T E R 5 DE T A I L E D TA B L E S . . . . . . . . . . . . . . . . . . . . . . . . . . . . . . . . . . .
L I S T O F T A B L E S
117Projected population, Capital city/balance of state—South Australia5.23 . . . . . .115
Projected population, Varying component levels—Balance of South
Australia
5.22. . . . . . . . . . . . . . . . . . . . . . . . . . . . . . . . . . . . . . . . . . .
113Projected population, Varying component levels—Adelaide5.21 . . . . . . . . . . .111Projected population, Varying component levels—South Australia5.20 . . . . . . .
SO U T H AU S T R A L I A
110Projected population, Capital city/balance of state—Queensland5.19 . . . . . . . .108
Projected population, Varying component levels—Balance of
Queensland
5.18. . . . . . . . . . . . . . . . . . . . . . . . . . . . . . . . . . . . . . . . .
106Projected population, Varying component levels—Brisbane5.17 . . . . . . . . . . .104Projected population, Varying component levels—Queensland5.16 . . . . . . . . .
QU E E N S L A N D
103Projected population, Capital city/balance of state—Victoria5.15 . . . . . . . . . . .101Projected population, Varying component levels—Balance of Victoria5.14 . . . .99Projected population, Varying component levels—Melbourne5.13 . . . . . . . . . .97Projected population, Varying component levels—Victoria5.12 . . . . . . . . . . . .
V I C T O R I A
96Projected population, Capital city/balance of state—New South Wales5.11 . . . . .94
Projected population, Varying component levels—Balance of New South
Wales
5.10. . . . . . . . . . . . . . . . . . . . . . . . . . . . . . . . . . . . . . . . . . . . . .
92Projected population, Varying component levels—Sydney5.9 . . . . . . . . . . . . .90Projected population, Varying component levels—New South Wales5.8 . . . . . .
NE W SO U T H WA L E S
89Summary statistics, Australia5.7 . . . . . . . . . . . . . . . . . . . . . . . . . . . . . . .88Components of population, Australia5.6 . . . . . . . . . . . . . . . . . . . . . . . . . .86Projected population, Age and sex—Australia: Series C5.5 . . . . . . . . . . . . . . .84Projected population, Age and sex—Australia: Series B5.4 . . . . . . . . . . . . . . .82Projected population, Age and sex—Australia: Series A5.3 . . . . . . . . . . . . . . .81Projected population, Sex—Australia5.2 . . . . . . . . . . . . . . . . . . . . . . . . . .80Projected population, Varying component levels—Australia5.1 . . . . . . . . . . . .
AU S T R A L I A
page
78 A B S • P O P U L A T I O N P R O J E C T I O N S , A U S T R A L I A • 3 2 2 2 . 0 • 2 0 0 4 T O 2 1 0 1

141Projected population, Australian Capital Territory5.37 . . . . . . . . . . . . . . . . .139
Projected population, Varying component levels—Australian Capital
Territory
5.36. . . . . . . . . . . . . . . . . . . . . . . . . . . . . . . . . . . . . . . . . . .
AU S T R A L I A N CA P I T A L T E R R I T O R Y
138Projected population, Capital city/balance of state—Northern Territory5.35 . . . .136
Projected population, Varying component levels—Balance of Northern
Territory
5.34. . . . . . . . . . . . . . . . . . . . . . . . . . . . . . . . . . . . . . . . . . .
134Projected population, Varying component levels—Darwin5.33 . . . . . . . . . . . .132Projected population, Varying component levels—Northern Territory5.32 . . . .
NO R T H E R N TE R R I T O R Y
131Projected population, Capital city/balance of state—Tasmania5.31 . . . . . . . . .129Projected population, Varying component levels—Balance of Tasmania5.30 . . .127Projected population, Varying component levels—Hobart5.29 . . . . . . . . . . . .125Projected population, Varying component levels—Tasmania5.28 . . . . . . . . . .
TA S M A N I A
124Projected population, Capital city/balance of state—Western Australia5.27 . . . .122
Projected population, Varying component levels—Balance of Western
Australia
5.26. . . . . . . . . . . . . . . . . . . . . . . . . . . . . . . . . . . . . . . . . . .
120Projected population, Varying component levels—Perth5.25 . . . . . . . . . . . . .118Projected population, Varying component levels—Western Australia5.24 . . . . .
WE S T E R N AU S T R A L I A
page
A B S • P O P U L A T I O N P R O J E C T I O N S , A U S T R A L I A • 3 2 2 2 . 0 • 2 0 0 4 T O 2 1 0 1 79
CH A P T E R 5 • D E T A I L E D T A B L E S

(a) Average annual growth rate.
–1.0–0.20.514 351.921 407.521 454.220 801.820 320.020 208.4 67, 68, 690 –0.30.30.924 742.826 463.723 066.821 441.220 514.220 309.5 49, 50, 5180 000 –0.10.41.128 657.028 318.023 618.221 628.120 544.820 319.6 31, 32, 33110 000 0.00.61.232 600.130 205.224 196.521 837.820 593.920 342.8 13, 14, 15140 0001.5
–0.60.00.517 660.622 617.621 753.020 869.820 330.420 212.5 61, 62, 630 0.00.41.029 058.727 875.423 389.921 511.620 524.720 313.6 43, 44, 4580 000 0.10.61.133 353.329 804.523 950.121 699.220 555.320 323.7 25, 26, 27110 000 0.20.71.237 682.931 768.624 537.721 909.720 604.520 347.0 7, 8, 9140 0001.7
–0.20.10.621 492.323 879.122 052.020 943.720 343.220 217.5 55, 56, 570 0.20.61.033 997.429 342.323 713.021 588.120 537.720 318.6 37, 38, 3980 000 0.30.71.238 709.831 347.324 281.721 776.320 568.320 328.7 19, 20, 21110 000 0.40.91.343 464.233 389.824 878.421 987.720 617.520 352.0 1(A), 2, 3140 0001.9
CO N S T A N T IM P R O V E M E N T IN L I F E EX P E C T A N C Y ( h i g h a s s u m p t i o n )
–1.0–0.50.512 670.119 897.621 377.120 801.820 320.020 208.4 70, 71, 720 –0.30.00.922 382.824 864.522 988.421 441.220 514.220 309.5 52, 53, 54(C)80 000 –0.10.21.126 046.626 688.523 539.621 628.120 544.820 319.6 34, 35, 36110 000 0.00.31.229 736.628 544.224 117.521 837.820 593.920 342.8 16, 17, 18140 0001.5
–0.6–0.30.515 855.521 103.221 675.820 869.820 330.420 212.5 64, 65, 660 0.00.21.026 557.426 271.223 311.521 511.620 524.720 313.6 46, 47, 4880 000 0.10.41.130 594.728 169.723 871.421 699.220 555.320 323.7 28, 29(B), 30110 000 0.20.51.234 664.430 102.124 458.621 909.720 604.520 347.0 10, 11, 12140 0001.7
–0.3–0.10.619 557.122 360.221 974.820 943.720 343.220 217.5 58, 59, 600 0.20.41.031 347.027 732.823 634.521 588.120 537.720 318.6 40, 41, 4280 000 0.30.51.235 795.229 707.124 202.921 776.320 568.320 328.7 22, 23, 24110 000 0.40.71.340 282.231 717.424 799.221 987.720 617.520 352.0 4, 5, 6140 0001.9
DE C L I N I N G IM P R O V E M E N T IN L I F E EX P E C T A N C Y (m e d i u m a s s u m p t i o n )
%%%'000'000'000'000'000'000SeriesNOMTFR
2091–
2101
2041–
2051
2004–
2011210120512021201120062005
GROWTH RATE(a)AT 30 JUNE
PROJECTED POPULAT ION, Vary ing component leve l s —Aust ra l i a5.1 . . . . . . . . . . . . . . . .
80 A B S • P O P U L A T I O N P R O J E C T I O N S , A U S T R A L I A • 3 2 2 2 . 0 • 2 0 0 4 T O 2 1 0 1
CH A P T E R 5 • D E T A I L E D T A B L E S

(a) Estimated resident population, base population.
22 382.811 166.811 216.030 594.715 233.415 361.243 464.221 502.121 962.12101
24 864.512 457.612 406.928 169.714 089.614 080.133 389.816 641.216 748.6205124 872.312 465.012 407.428 080.814 049.114 031.733 116.216 510.416 605.8205024 877.412 470.712 406.727 990.014 007.513 982.532 842.416 379.216 463.2204924 879.312 474.712 404.627 897.113 964.713 932.532 568.416 247.616 320.8204824 877.812 476.812 401.127 801.913 920.513 881.532 294.116 115.616 178.52047
24 872.612 476.712 395.927 704.113 874.713 829.432 019.315 982.916 036.4204624 863.212 474.312 388.927 603.513 827.313 776.231 744.315 849.915 894.4204524 849.612 469.612 380.027 499.913 778.113 721.831 469.215 716.515 752.7204424 831.312 462.212 369.127 393.213 727.113 666.031 193.915 582.715 611.2204324 808.212 452.212 356.027 283.013 674.113 608.930 918.615 448.615 470.02042
24 780.012 439.312 340.827 169.313 619.013 550.330 643.215 314.215 329.0204124 746.512 423.412 323.227 051.613 561.513 490.130 367.515 179.215 188.2204024 707.512 404.312 303.126 929.813 501.713 428.130 091.215 043.815 047.4203924 662.512 382.112 280.526 803.513 439.313 364.229 814.214 907.714 906.6203824 611.512 356.412 255.126 672.413 374.113 298.329 536.214 770.814 765.52037
24 554.312 327.412 226.926 536.313 306.113 230.129 256.914 633.014 623.9203624 490.712 294.912 195.826 394.813 235.313 159.628 976.114 494.214 481.8203524 420.612 259.012 161.626 247.913 161.413 086.528 693.514 354.414 339.1203424 344.112 219.712 124.426 095.213 084.613 010.728 408.914 213.514 195.4203324 261.012 177.012 084.025 936.913 004.712 932.228 122.314 071.514 050.92032
24 171.612 131.012 040.525 772.912 922.012 850.927 833.713 928.413 905.3203124 075.912 081.911 994.025 603.312 836.412 766.927 543.113 784.213 758.9203023 974.312 029.911 944.425 428.212 748.112 680.127 250.613 639.113 611.5202923 867.011 975.011 892.025 248.012 657.312 590.826 956.613 493.213 463.3202823 754.411 917.611 836.825 062.912 564.112 498.926 661.213 346.713 314.52027
23 636.811 857.711 779.124 873.312 468.712 404.626 365.013 199.813 165.2202623 514.511 795.711 718.824 679.412 371.312 308.126 068.313 052.713 015.6202523 388.211 731.911 656.424 482.012 272.412 209.625 770.912 905.412 865.5202423 258.311 666.411 591.924 281.312 172.112 109.225 473.212 758.012 715.2202323 125.011 599.511 525.524 077.712 070.512 007.225 175.612 610.812 564.82022
22 988.411 531.211 457.223 871.411 967.711 903.624 878.412 463.912 414.5202122 849.011 461.711 387.323 662.611 864.011 798.624 581.912 317.412 264.5202022 707.111 391.111 316.023 452.011 759.511 692.524 286.012 171.212 114.7201922 563.011 319.511 243.523 239.711 654.311 585.423 990.912 025.511 965.4201822 415.811 246.511 169.323 025.311 548.211 477.123 697.711 880.711 816.92017
22 264.011 171.411 092.622 808.511 440.911 367.523 406.911 737.211 669.8201622 107.611 094.111 013.522 589.611 332.811 256.823 118.711 594.811 523.9201521 947.211 014.910 932.322 369.311 224.111 145.322 832.711 453.611 379.1201421 782.810 933.910 848.922 147.611 114.711 032.922 549.011 313.611 235.4201321 614.210 850.810 763.421 924.311 004.610 919.722 267.311 174.711 092.72012
21 441.210 765.710 675.521 699.210 893.710 805.521 987.711 036.810 951.0201121 263.810 678.410 585.421 472.310 781.910 690.421 710.110 899.910 810.2201021 082.910 589.410 493.521 244.510 669.610 574.821 434.010 763.710 670.3200920 898.510 498.710 399.821 015.710 556.910 458.821 159.410 628.310 531.1200820 710.610 406.210 304.320 786.010 443.710 342.320 886.210 493.510 392.72007
20 514.210 309.510 204.720 555.310 330.010 225.420 617.510 360.910 256.6200620 309.510 208.610 100.820 323.710 215.710 108.020 352.010 229.810 122.2200520 091.510 101.09 990.520 091.510 101.09 990.520 091.510 101.09 990.52004(a)
'000'000'000'000'000'000'000'000'000
PersonsFemalesMalesPersonsFemalesMalesPersonsFemalesMales
SERIES CSERIES BSERIES A
At 30 June
PROJECTED POPULAT ION, By sex —Aust ra l i a5.2 . . . . . . . . . . . . . . . . . . . . . . . . . . . . . . . . . .
A B S • P O P U L A T I O N P R O J E C T I O N S , A U S T R A L I A • 3 2 2 2 . 0 • 2 0 0 4 T O 2 1 0 1 81
CH A P T E R 5 • D E T A I L E D T A B L E S

(a) Estimated resident population, base population.
21 502.116 641.215 314.213 928.412 463.911 036.810 360.910 229.810 101.0All ages
2 298.41 497.81 033.5589.8377.0282.4224.7211.6202.085 years and over982.8735.9663.7540.3321.7259.5242.6238.1230.380–84
1 047.6795.1739.6630.6443.7306.3304.2302.2302.175–79
1 080.6811.1786.2726.8612.6384.8331.0328.0327.070–741 100.9879.2817.4769.3666.4482.3399.8390.1378.065–691 124.2902.4817.6797.7744.1638.0490.6468.7448.160–641 154.8927.8878.6819.6775.5678.2644.2621.1596.355–59
1 185.5922.9899.9816.7799.7750.8682.0673.2664.750–541 209.3926.9923.7875.9818.8777.7751.5735.9721.245–491 216.2959.4906.9885.3803.2788.2767.2773.4774.140–441 207.1970.5888.3886.4839.8783.5764.4743.2735.235–391 187.8971.9896.4844.5823.9742.2747.2762.5765.230–341 155.8939.6877.6795.8794.6748.5687.9676.4672.625–29
1 129.1900.7863.6788.3736.8716.7696.2690.3678.320–241 116.6875.4848.7786.9705.3704.6679.5672.5668.415–191 112.3871.7837.1800.1725.0673.8679.3679.7675.610–141 101.7874.5820.7794.1732.4650.9645.1645.6647.75–91 091.3878.3814.7780.2743.3668.3623.3617.4614.30–4
FE M A L E S
21 962.116 748.615 329.013 905.312 414.510 951.010 256.610 122.29 990.5All ages
2 025.91 192.2776.5416.5231.8149.6108.0100.093.685 years and over969.6678.6594.3471.3270.8198.6169.2162.0154.580–84
1 057.2759.7694.1577.1412.0266.4256.3252.3247.675–79
1 104.2806.7753.8688.6581.0366.1306.2301.4301.470–741 132.7892.5797.7744.3637.2480.0394.1383.1368.465–691 162.6923.9824.0778.4722.6629.5499.3477.5456.860–641 198.4957.1900.4809.6762.4664.0643.5626.0606.555–591 233.5953.1927.3829.9788.5739.7672.8664.3658.050–54
1 259.2959.7956.0901.7813.5770.9742.9727.1712.445–491 265.8993.6936.1912.6817.2778.7760.7767.8768.640–441 257.21 006.7919.3917.6865.6778.6755.6734.5726.335–391 237.21 008.9928.4872.3850.8756.2741.8754.5755.630–341 210.4981.9916.1829.5829.6778.8707.0692.1683.725–29
1 191.4950.3910.7831.0776.0755.8733.9726.9714.020–241 175.4920.8892.3827.0741.2742.7714.7707.1702.015–191 170.1916.1879.5840.3761.0706.6715.5715.9711.910–141 160.6920.9863.9835.6770.5684.8678.1679.3682.35–91 150.6925.9858.7822.1783.0703.9656.8650.7647.00–4
MA L E S
'000'000'000'000'000'000'000'000'000
210120512041203120212011200620052004(a)
AT 30 JUNE
PROJECTED POPULAT ION, By age and sex —Aust ra l i a : Ser ies A5.3 . . . . . . . . . . . . . . . .
82 A B S • P O P U L A T I O N P R O J E C T I O N S , A U S T R A L I A • 3 2 2 2 . 0 • 2 0 0 4 T O 2 1 0 1
CH A P T E R 5 • D E T A I L E D T A B L E S

(a) Estimated resident population, base population.
43 464.233 389.830 643.227 833.724 878.421 987.720 617.520 352.020 091.5All ages
4 324.32 690.01 810.01 006.3608.8431.9332.7311.6295.685 years and over1 952.51 414.51 258.01 011.6592.4458.1411.8400.1384.880–842 104.81 554.81 433.71 207.7855.7572.7560.5554.5549.775–79
2 184.81 617.71 540.01 415.31 193.6750.9637.2629.5628.470–742 233.71 771.71 615.11 513.61 303.6962.4793.9773.1746.465–692 286.81 826.31 641.61 576.21 466.71 267.5989.9946.1904.960–642 353.21 884.91 779.01 629.21 537.91 342.21 287.81 247.11 202.855–59
2 419.01 876.01 827.21 646.61 588.21 490.51 354.91 337.51 322.750–542 468.41 886.61 879.81 777.71 632.31 548.61 494.41 463.01 433.645–492 482.01 953.11 843.01 797.91 620.51 566.91 527.91 541.21 542.640–442 464.31 977.21 807.61 804.01 705.41 562.11 520.01 477.71 461.435–392 425.11 980.81 824.81 716.91 674.71 498.41 489.01 516.91 520.730–342 366.21 921.51 793.71 625.41 624.21 527.31 394.81 368.41 356.325–29
2 320.61 851.01 774.31 619.31 512.81 472.51 430.21 417.11 392.320–242 291.91 796.21 741.01 614.01 446.51 447.31 394.21 379.61 370.515–192 282.51 787.81 716.61 640.41 485.91 380.41 394.81 395.61 387.510–142 262.31 795.41 684.61 629.61 502.81 335.81 323.31 324.91 330.05–92 241.91 804.21 673.41 602.31 526.31 372.21 280.11 268.01 261.20–4
PE R S O N S
'000'000'000'000'000'000'000'000'000
210120512041203120212011200620052004(a)
AT 30 JUNE
PROJECTED POPULAT ION, By age and sex —Aust ra l i a : Ser ies A co n t i n u e d5.3 . . . . . . . .
A B S • P O P U L A T I O N P R O J E C T I O N S , A U S T R A L I A • 3 2 2 2 . 0 • 2 0 0 4 T O 2 1 0 1 83
CH A P T E R 5 • D E T A I L E D T A B L E S

(a) Estimated resident population, base population.
15 233.414 089.613 619.012 922.011 967.710 893.710 330.010 215.710 101.0All ages
1 129.7942.0761.7507.9362.4282.3224.7211.6202.085 years and over709.8635.9596.3505.8314.6259.4242.6238.1230.380–84801.3719.1691.2605.4436.8305.9304.1302.1302.175–79
848.7743.7747.0706.8605.9384.0330.9328.0327.070–74870.9809.5778.2751.1660.4481.1399.5389.9378.065–69883.6834.0772.6777.9738.0636.6490.2468.5448.160–64894.7859.7824.7793.9767.4676.7643.8620.9596.355–59905.0853.1842.6780.7787.1748.6681.5672.9664.750–54
913.0848.1864.1829.3798.8773.1750.6735.5721.245–49910.9851.2845.9835.6773.6780.7765.7772.7774.140–44895.7838.3821.0837.5802.8772.4762.3742.3735.235–39869.1819.2803.5798.4788.3726.1743.9761.0765.230–34829.2788.1766.5749.3766.0731.3683.4674.2672.625–29
794.4754.1736.8721.2716.1706.3692.2688.2678.320–24771.0725.4720.1698.6681.4698.4678.0671.7668.415–19755.2706.5704.9687.7672.1667.1677.9679.1675.610–14735.4688.5681.2675.9654.4637.2643.6644.9647.75–9716.0673.0660.6659.1641.8626.3615.1614.1614.30–4
FE M A L E S
15 361.214 080.113 550.312 850.911 903.610 805.510 225.410 108.09 990.5All ages
876.3678.0532.1348.2222.0149.5108.0100.093.685 years and over652.6550.3507.4427.9262.9198.5169.2162.0154.580–84775.5661.5628.6543.2403.6266.2256.3252.3247.675–79
846.5725.3703.3662.1572.9365.6306.0301.4301.470–74882.9814.1751.2721.6630.5479.2393.9383.0368.465–69904.6849.6774.2755.0715.6628.3499.0477.3456.860–64921.4884.0843.1780.5752.6662.4643.1625.8606.555–59935.8879.1867.3791.6773.7736.9672.2663.9658.050–54
946.1876.9894.3853.9791.4765.4741.8726.6712.445–49944.5880.9873.9863.0787.1770.4758.9767.0768.640–44930.4869.4851.0869.4829.4766.9753.3733.4726.335–39903.6850.7833.7827.4817.0741.0738.6753.0755.630–34868.3824.6801.6783.5802.6762.9703.0690.2683.725–29
838.9796.3777.8761.2755.2745.4729.7724.6714.020–24811.2763.0757.3734.5716.6736.5713.1706.3702.015–19793.7742.3740.5722.2705.7700.1714.2715.3711.910–14774.3724.8717.0711.3688.5670.8676.8678.7682.35–9754.6709.3696.1694.4676.1659.7648.3647.3647.00–4
MA L E S
'000'000'000'000'000'000'000'000'000
210120512041203120212011200620052004(a)
AT 30 JUNE
PROJECTED POPULAT ION, By age and sex —Aust ra l i a : Ser ies B5.4 . . . . . . . . . . . . . . . .
84 A B S • P O P U L A T I O N P R O J E C T I O N S , A U S T R A L I A • 3 2 2 2 . 0 • 2 0 0 4 T O 2 1 0 1
CH A P T E R 5 • D E T A I L E D T A B L E S

(a) Estimated resident population, base population.
30 594.728 169.727 169.325 772.923 871.421 699.220 555.320 323.720 091.5All ages
2 006.01 620.01 293.7856.1584.4431.8332.7311.5295.685 years and over1 362.41 186.21 103.7933.7577.6457.9411.8400.1384.880–841 576.81 380.61 319.81 148.6840.4572.1560.4554.4549.775–79
1 695.31 469.01 450.21 369.01 178.7749.6636.9629.3628.470–741 753.81 623.61 529.41 472.81 290.8960.3793.4772.9746.465–691 788.21 683.71 546.71 532.91 453.61 264.9989.2945.8904.960–641 816.01 743.71 667.91 574.41 520.01 339.11 286.91 246.71 202.855–591 840.81 732.21 709.91 572.31 560.81 485.41 353.81 336.91 322.750–54
1 859.01 725.01 758.41 683.21 590.21 538.51 492.41 462.11 433.645–491 855.41 732.11 719.81 698.71 560.71 551.21 524.61 539.71 542.640–441 826.01 707.71 672.01 706.91 632.21 539.41 515.61 475.71 461.435–391 772.71 669.91 637.31 625.71 605.31 467.11 482.41 513.91 520.730–341 697.41 612.71 568.01 532.71 568.61 494.21 386.41 364.51 356.325–29
1 633.31 550.41 514.71 482.41 471.31 451.71 421.81 412.81 392.320–241 582.21 488.41 477.41 433.01 398.01 434.81 391.11 378.01 370.515–191 548.91 448.81 445.51 409.91 377.81 367.21 392.11 394.41 387.510–141 509.71 413.41 398.21 387.21 342.91 308.01 320.41 323.61 330.05–91 470.71 382.31 356.71 353.41 318.01 286.01 263.41 261.41 261.20–4
PE R S O N S
'000'000'000'000'000'000'000'000'000
210120512041203120212011200620052004(a)
AT 30 JUNE
PROJECTED POPULAT ION, By age and sex —Aust ra l i a : Ser ies B co n t i n u e d5.4 . . . . . . . .
A B S • P O P U L A T I O N P R O J E C T I O N S , A U S T R A L I A • 3 2 2 2 . 0 • 2 0 0 4 T O 2 1 0 1 85
CH A P T E R 5 • D E T A I L E D T A B L E S

(a) Estimated resident population, base population.
11 166.812 457.612 439.312 131.011 531.210 765.710 309.510 208.610 101.0All ages
978.4932.8757.5506.0361.9282.2224.7211.6202.085 years and over578.3623.8591.7503.4313.8259.2242.6238.1230.380–84647.7698.2683.1601.8435.1305.6304.1302.1302.175–79
680.9710.4733.2701.8603.4383.4330.8327.9327.070–74689.9763.8756.3743.1657.3480.0399.4389.9378.065–69685.9780.8739.1764.9734.1635.4490.0468.4448.160–64676.6802.0779.6773.3761.0675.5643.6620.8596.355–59667.9790.8790.4748.6775.9746.7681.3672.9664.750–54
662.6776.1808.2786.1780.3769.2750.2735.4721.245–49654.0750.4787.6787.5745.8774.1764.8772.4774.140–44635.9710.9757.2789.9767.9762.5760.9741.8735.235–39607.5673.8715.8753.3753.6711.8741.7760.2765.230–34567.4646.2658.6705.2738.2716.3680.5673.2672.625–29
532.7618.7616.2658.3696.1696.5690.0687.6678.320–24506.6589.8600.2612.6659.4692.6676.9671.4668.415–19486.4560.8583.3580.8623.0660.9676.9678.7675.610–14464.5528.5555.7566.1578.6625.5642.5644.6647.75–9443.5499.8525.8548.3545.8588.1608.7611.7614.30–4
FE M A L E S
11 216.012 406.912 340.812 040.511 457.210 675.510 204.710 100.89 990.5All ages
757.7670.9529.6347.2221.7149.5108.0100.093.685 years and over532.5538.9503.5426.3262.3198.4169.2162.0154.580–84627.8640.5620.6540.5402.4265.9256.2252.3247.675–79
680.1692.4689.0657.5571.0365.1306.0301.4301.470–74700.3769.8728.0713.1627.9478.5393.8382.9368.465–69703.1797.1739.9740.6711.6627.3498.8477.2456.860–64697.6826.6798.4757.6745.2661.1642.9625.7606.555–59691.8816.8815.3758.2760.8734.6672.0663.9658.050–54
687.9804.9838.6811.1770.9760.6741.2726.4712.445–49679.6779.2816.5816.0759.0763.1757.8766.6768.640–44662.4740.2788.3823.2796.1756.3751.8732.9726.335–39633.6702.6746.1784.3784.4727.4736.2752.1755.630–34596.6679.0691.7740.6776.3749.7700.6689.4683.725–29
564.6654.9652.1696.2735.0735.7727.7724.2714.020–24533.1620.6631.5644.5694.0730.5712.0705.9702.015–19510.9589.2612.8610.1654.5693.8713.2714.9711.910–14489.0556.4584.9595.9609.0658.7675.6678.2682.35–9467.4526.8554.0577.6575.0619.5641.6644.7647.00–4
MA L E S
'000'000'000'000'000'000'000'000'000
210120512041203120212011200620052004(a)
AT 30 JUNE
PROJECTED POPULAT ION, By age and sex —Aust ra l i a : Ser ies C5.5 . . . . . . . . . . . . . . . .
86 A B S • P O P U L A T I O N P R O J E C T I O N S , A U S T R A L I A • 3 2 2 2 . 0 • 2 0 0 4 T O 2 1 0 1
CH A P T E R 5 • D E T A I L E D T A B L E S

(a) Estimated resident population, base population.
22 382.824 864.524 780.024 171.622 988.421 441.220 514.220 309.520 091.5All ages
1 736.11 603.71 287.0853.2583.7431.7332.7311.5295.685 years and over1 110.81 162.71 095.3929.7576.1457.6411.7400.1384.880–841 275.51 338.71 303.71 142.3837.6571.5560.3554.4549.775–79
1 361.01 402.81 422.21 359.31 174.4748.5636.8629.3628.470–741 390.31 533.61 484.31 456.21 285.2958.5793.2772.8746.465–691 388.91 577.91 478.91 505.51 445.71 262.8988.9945.6904.960–641 374.21 628.61 578.01 530.91 506.21 336.61 286.51 246.51 202.855–591 359.71 607.61 605.71 506.81 536.71 481.31 353.31 336.81 322.750–54
1 350.51 581.01 646.81 597.21 551.21 529.81 491.41 461.81 433.645–491 333.61 529.61 604.11 603.51 504.81 537.21 522.71 539.01 542.640–441 298.41 451.11 545.51 613.11 564.11 518.81 512.61 474.71 461.435–391 241.11 376.51 461.91 537.61 537.91 439.21 477.91 512.41 520.730–341 164.01 325.31 350.31 445.91 514.51 466.01 381.11 362.61 356.325–29
1 097.41 273.71 268.31 354.51 431.11 432.21 417.71 411.71 392.320–241 039.61 210.41 231.71 257.21 353.41 423.11 388.91 377.31 370.515–19
997.21 150.01 196.11 190.91 277.51 354.81 390.11 393.61 387.510–14953.41 084.81 140.61 162.01 187.61 284.11 318.21 322.81 330.05–9910.91 026.61 079.81 125.91 120.81 207.61 250.41 256.41 261.20–4
PE R S O N S
'000'000'000'000'000'000'000'000'000
210120512041203120212011200620052004(a)
AT 30 JUNE
PROJECTED POPULAT ION, By age and sex —Aust ra l i a : Ser ies C co n t i n u e d5.5 . . . . . . . .
A B S • P O P U L A T I O N P R O J E C T I O N S , A U S T R A L I A • 3 2 2 2 . 0 • 2 0 0 4 T O 2 1 0 1 87
CH A P T E R 5 • D E T A I L E D T A B L E S

(b) Per 1,000 mid-year population.(a) Estimated resident population, base population.
–0.20.00.10.40.60.81.01.11.1rateTotal growth
3.63.23.23.33.53.74.45.05.0rateTotal migration3.83.74.04.34.65.46.16.36.4rateStandardised death rate
1.501.501.501.501.501.631.721.741.76rateTotal fertility rateRate(b)
22 382.824 864.524 780.024 171.622 988.421 441.220 514.220 309.520 091.5no.End population–54.0–7.833.595.6139.5177.4204.8217.9218.9no.Total growth80.080.080.080.080.080.090.0100.0100.0no.Total migration
–134.0–87.8–46.515.659.597.4114.8117.9118.9no.Natural increase313.9290.3258.9207.3164.0138.6132.9131.9133.2no.Deaths179.9202.5212.4222.9223.4236.0247.6249.8252.1no.Births
22 436.824 872.324 746.524 075.922 849.021 263.820 309.520 091.519 872.6no.Start populationComponents of population change
SE R I E S C
0.10.30.40.70.91.11.11.21.1rateTotal growth
3.63.94.14.34.65.15.45.45.0rateTotal migration3.73.74.04.34.65.46.16.36.4rateStandardised death rate
1.701.701.701.701.701.741.771.771.76rateTotal fertility rateRate(b)
30 594.728 169.727 169.325 772.923 871.421 699.220 555.320 323.720 091.5no.End population34.488.9117.6169.6208.8226.9231.6232.2218.9no.Total growth
110.0110.0110.0110.0110.0110.0110.0110.0100.0no.Total migration–75.6–21.17.659.698.8116.9121.6122.2118.9no.Natural increase367.9296.4262.2209.0164.8138.9132.9131.9133.2no.Deaths292.3275.3269.8268.6263.6255.8254.5254.1252.1no.Births
30 560.328 080.827 051.625 603.323 662.621 472.320 323.720 091.519 872.6no.Start populationComponents of population change
SE R I E S B
0.40.80.91.11.21.31.31.31.1rateTotal growth
3.24.24.65.15.76.46.66.65.0rateTotal migration1.61.62.23.04.15.46.16.36.4rateStandardised death rate
1.901.901.901.901.901.851.821.811.76rateTotal fertility rateRate(b)
43 464.233 389.830 643.227 833.724 878.421 987.720 617.520 352.020 091.5no.End population181.2273.6275.7290.6296.5277.6265.4260.5218.9no.Total growth140.0140.0140.0140.0140.0140.0135.0133.0100.0no.Total migration
41.2133.6135.7150.6156.5137.6130.4127.5118.9no.Natural increase406.4228.1200.0168.1150.2139.2133.0131.9133.2no.Deaths447.6361.7335.8318.8306.6276.8263.5259.4252.1no.Births
43 283.033 116.230 367.527 543.124 581.921 710.120 352.020 091.519 872.6no.Start populationComponents of population change
SE R I E S A
210120512041203120212011200620052004(a)
YEAR ENDED 30 JUNE
COMPONENTS OF POPULAT ION CHANGE, Aus t ra l ia5.6 . . . . . . . . . . . . . . . . . . . . . . . . . . . .
88 A B S • P O P U L A T I O N P R O J E C T I O N S , A U S T R A L I A • 3 2 2 2 . 0 • 2 0 0 4 T O 2 1 0 1
CH A P T E R 5 • D E T A I L E D T A B L E S

(b) Males per 100 females.(a) Estimated resident population, base population.
77.070.867.861.753.848.648.448.648.7ratioDependency ratio
7.86.45.23.52.52.01.61.51.5%85 years and over30.728.326.623.719.414.813.313.113.0%65 years and over56.558.659.661.965.067.367.467.367.2%15–64 years12.813.113.814.415.617.919.319.619.8%Under 15 years
Proportion of population
100.499.699.299.399.499.299.098.998.9ratioSex ratio(b)
49.348.246.644.441.738.737.036.736.4yearsPersons50.249.247.645.442.739.637.837.537.2yearsFemales48.447.245.643.340.737.936.235.935.7yearsMales
Median age
SE R I E S C
73.169.267.062.755.449.048.548.648.7ratioDependency ratio
6.65.84.83.32.42.01.61.51.5%85 years and over27.425.824.622.418.714.613.313.113.0%65 years and over57.859.159.961.564.367.167.467.367.2%15–64 years14.815.115.516.116.918.319.319.619.8%Under 15 years
Proportion of population
100.899.999.599.599.599.299.098.998.9ratioSex ratio(b)
46.145.244.442.840.738.537.036.736.4yearsPersons46.946.245.443.841.739.337.837.537.2yearsFemales45.344.343.441.839.837.636.235.935.7yearsMales
Median age
SE R I E S B
82.076.271.165.657.449.348.548.648.7ratioDependency ratio
9.98.15.93.62.42.01.61.51.5%85 years and over29.427.125.022.118.314.413.313.113.0%65 years and over54.956.858.560.463.567.067.367.367.2%15–64 years15.616.116.617.518.118.619.419.619.8%Under 15 years
Proportion of population
102.1100.6100.199.899.699.299.098.998.9ratioSex ratio(b)
46.244.643.641.839.938.236.936.736.4yearsPersons46.845.444.542.740.839.037.737.537.2yearsFemales45.643.742.741.039.037.336.135.935.7yearsMales
Median age
SE R I E S A
210120512041203120212011200620052004(a)
AT 30 JUNE
SUMMARY STAT IST ICS, Aust ra l i a5.7 . . . . . . . . . . . . . . . . . . . . . . . . . . . . . . . . . . . . . . . . . . .
A B S • P O P U L A T I O N P R O J E C T I O N S , A U S T R A L I A • 3 2 2 2 . 0 • 2 0 0 4 T O 2 1 0 1 89
CH A P T E R 5 • D E T A I L E D T A B L E S

(a) Average annual growth rate.
–0.70.36 147.76 934.26 860.76 755.66 736.172–11 000 –0.90.25 779.66 810.16 815.96 747.66 733.171–18 000 –1.00.15 411.16 685.76 771.16 739.56 730.170–25 00000
0.00.87 960.47 525.47 094.56 827.56 773.754(C)–11 000 –0.10.77 587.77 401.07 049.76 819.46 770.753–18 000 –0.20.67 214.47 276.47 004.96 811.46 767.752–25 00028 50080 000
0.20.98 627.27 726.47 162.36 838.86 777.436–11 000 0.10.88 252.97 601.97 117.56 830.76 774.435–18 000 0.00.77 878.27 477.27 072.76 822.76 771.434–25 00039 200110 000
0.31.19 306.67 937.57 238.66 856.96 786.118–11 000 0.31.08 930.87 812.97 193.86 848.96 783.117–18 000 0.20.98 554.77 688.27 148.96 840.86 780.116–25 00049 800140 0001.55
–0.50.36 542.07 034.36 883.76 759.26 737.566–11 000 –0.60.26 158.86 908.66 838.86 751.16 734.565–18 000 –0.80.25 774.96 782.86 793.96 743.16 731.564–25 00000
0.20.88 435.87 635.87 118.66 831.16 775.148–11 000 0.10.78 047.87 509.97 073.76 823.06 772.147–18 000
–0.10.67 659.57 383.87 028.86 815.06 769.146–25 00028 50080 000
0.31.09 132.37 840.37 186.76 842.46 778.930–11 000 0.20.98 742.77 714.47 141.76 834.36 775.929(B)–18 000 0.20.88 352.87 588.27 096.86 826.36 772.928–25 00039 200110 000
0.51.19 842.28 055.37 263.36 860.56 787.512–11 000 0.41.09 451.27 929.27 218.46 852.56 784.511–18 000 0.30.99 059.87 802.97 173.46 844.46 781.510–25 00049 800140 0001.76
–0.30.46 954.57 134.56 908.86 763.56 739.260–11 000 –0.40.36 555.67 007.46 863.86 755.46 736.259–18 000 –0.60.26 156.26 880.26 818.76 747.46 733.258–25 00000
0.30.98 931.17 746.27 144.86 835.56 776.842–11 000 0.20.88 527.57 618.87 099.76 827.46 773.841–18 000 0.10.78 123.67 491.37 054.76 819.46 770.840–25 00028 50080 000
0.51.09 657.77 954.37 213.16 846.86 780.524–11 000 0.40.99 252.67 826.87 168.16 838.76 777.523–18 000 0.30.88 847.27 699.27 123.06 830.76 774.522–25 00039 200110 000
0.71.210 398.78 173.07 290.16 864.96 789.26–11 000 0.61.19 992.18 045.47 245.06 856.96 786.25–18 000 0.51.09 585.27 917.67 200.06 848.86 783.24–25 00049 800140 0001.96
DE C L I N I N G IM P R O V E M E N T IN L I F E EX P E C T A N C Y (m e d i u m a s s u m p t i o n )
%%'000'000'000'000'000SeriesNIMNOMNSW
NOMAust.TFR
2041–
2051
2004–
201120512021201120062005
GROWTHRATE(a)AT 30 JUNE
PROJECTED POPULAT ION, Vary ing component leve l s —New South Wales5.8 . . . . . . . . .
90 A B S • P O P U L A T I O N P R O J E C T I O N S , A U S T R A L I A • 3 2 2 2 . 0 • 2 0 0 4 T O 2 1 0 1
CH A P T E R 5 • D E T A I L E D T A B L E S

(a) Average annual growth rate.
–0.40.36 630.06 960.76 860.76 755.66 736.169–11 000 –0.50.26 249.96 836.46 815.96 747.66 733.168–18 000 –0.70.15 869.16 711.96 771.16 739.56 730.167–25 00000
0.20.88 477.77 552.47 094.56 827.56 773.751–11 000 0.10.78 093.37 427.97 049.76 819.46 770.750–18 000 0.00.67 708.47 303.17 004.96 811.46 767.749–25 00028 50080 000
0.40.99 155.77 753.67 162.36 838.86 777.433–11 000 0.30.88 769.87 628.97 117.56 830.76 774.432–18 000 0.20.78 383.67 504.17 072.76 822.76 771.431–25 00039 200110 000
0.61.19 846.67 964.87 238.66 856.96 786.115–11 000 0.51.09 459.57 840.17 193.86 848.96 783.114–18 000 0.40.99 072.07 715.17 148.96 840.86 780.113–25 00049 800140 0001.55
–0.20.37 026.47 060.86 883.76 759.26 737.563–11 000 –0.30.26 631.26 935.06 838.86 751.16 734.562–18 000 –0.50.26 235.46 809.06 793.96 743.16 731.561–25 00000
0.40.88 955.37 662.87 118.66 831.16 775.145–11 000 0.30.78 555.87 536.87 073.76 823.06 772.144–18 000 0.20.68 156.07 410.57 028.86 815.06 769.143–25 00028 50080 000
0.61.09 663.07 867.67 186.76 842.46 778.927–11 000 0.50.99 262.17 741.47 141.76 834.36 775.926–18 000 0.40.88 860.97 615.07 096.86 826.36 772.925–25 00039 200110 000
0.71.110 384.68 082.77 263.36 860.56 787.59–11 000 0.61.09 982.37 956.37 218.46 852.56 784.58–18 000 0.60.99 579.87 829.97 173.46 844.46 781.57–25 00049 800140 0001.76
0.00.47 440.87 161.06 908.86 763.56 739.257–11 000 –0.10.37 030.27 033.86 863.86 755.46 736.256–18 000 –0.30.26 619.16 906.36 818.76 747.46 733.255–25 00000
0.60.99 452.97 773.37 144.86 835.56 776.839–11 000 0.50.89 037.97 645.87 099.76 827.46 773.838–18 000 0.40.78 622.77 518.17 054.76 819.46 770.837–25 00028 50080 000
0.71.010 190.87 981.57 213.16 846.86 780.521–11 000 0.60.99 774.47 853.97 168.16 838.76 777.520–18 000 0.50.89 357.87 726.17 123.06 830.76 774.519–25 00039 200110 000
0.91.210 943.68 200.37 290.16 864.96 789.23–11 000 0.81.110 525.88 072.67 245.06 856.96 786.22–18 000 0.71.010 107.97 944.67 200.06 848.86 783.21(A)–25 00049 800140 0001.96
CO N S T A N T IM P R O V E M E N T IN L I F E EX P E C T A N C Y ( h i g h a s s u m p t i o n )
%%'000'000'000'000'000SeriesNIMNOMNSW
NOMAust.TFR
2041–
2051
2004–
201120512021201120062005
GROWTHRATE(a)AT 30 JUNE
PROJECTED POPULAT ION, Vary ing component leve l s —New South Wales co n t i n u e d5.8 .
A B S • P O P U L A T I O N P R O J E C T I O N S , A U S T R A L I A • 3 2 2 2 . 0 • 2 0 0 4 T O 2 1 0 1 91
CH A P T E R 5 • D E T A I L E D T A B L E S

(a) Average annual growth rate.
–1.00.13 490.94 226.54 262.44 230.04 225.272–19 000 –1.6–0.12 894.94 031.54 192.74 217.94 221.271–30 000 –2.3–0.32 348.83 852.84 128.14 205.84 216.270–40 00000
0.10.95 292.14 813.84 494.04 300.44 261.954(C)–19 000 –0.10.74 694.24 618.54 424.24 288.34 257.953–30 000 –0.50.44 146.64 439.54 359.64 276.34 252.952–40 00028 40080 000
0.41.15 885.44 992.74 554.44 310.54 265.336–19 000 0.10.95 286.44 797.24 484.64 298.44 261.335–30 000
–0.10.64 738.04 618.14 420.04 286.44 256.334–40 00038 000110 000
0.61.36 487.85 179.84 622.04 326.54 272.918–19 000 0.41.15 887.84 984.24 552.34 314.44 268.917–30 000 0.20.95 338.64 805.04 487.64 302.44 263.916–40 00047 500140 0001.49
–0.70.23 730.34 289.94 277.54 232.34 226.266–19 000 –1.3–0.13 109.94 092.54 207.64 220.24 222.265–30 000 –2.0–0.32 541.43 911.54 142.84 208.24 217.264–40 00000
0.30.95 612.84 887.54 510.04 302.84 262.948–19 000 0.00.74 990.24 689.64 440.14 290.74 258.947–30 000
–0.30.54 420.24 508.44 375.34 278.64 253.946–40 00028 40080 000
0.51.16 232.35 069.44 570.74 312.94 266.230–19 000 0.30.95 608.84 871.54 500.84 300.84 262.229(B)–30 000 0.10.75 038.04 690.14 436.04 288.84 257.228–40 00038 000110 000
0.71.36 861.85 259.94 638.74 328.94 273.812–19 000 0.51.16 237.35 061.84 568.74 316.94 269.811–30 000 0.40.95 665.64 880.34 503.94 304.84 264.810–40 00047 500140 0001.69
–0.50.23 980.64 353.64 293.94 235.24 227.360–19 000 –1.00.03 335.24 153.84 223.84 223.14 223.359–30 000 –1.7–0.22 743.93 970.54 158.94 211.04 218.358–40 00000
0.51.05 946.04 961.24 527.54 305.74 264.042–19 000 0.20.85 298.44 760.94 457.44 293.74 260.041–30 000
–0.10.64 705.54 577.44 392.44 281.64 255.040–40 00028 40080 000
0.71.26 592.45 146.24 588.54 315.84 267.424–19 000 0.51.05 943.84 945.84 518.34 303.84 263.423–30 000 0.30.85 350.14 762.14 453.34 291.74 258.422–40 00038 000110 000
0.91.47 249.45 339.94 656.74 331.94 275.06–19 000 0.71.26 599.75 139.34 586.64 319.84 271.05–30 000 0.51.06 005.24 955.54 521.64 307.74 266.04–40 00047 500140 0001.89
DE C L I N I N G IM P R O V E M E N T IN L I F E EX P E C T A N C Y (m e d i u m a s s u m p t i o n )
%%'000'000'000'000'000SeriesNIMNOM
SydneyNOMAust.TFR
2041–
2051
2004–
201120512021201120062005
GROWTHRATE(a)AT 30 JUNE
PROJECTED POPULAT ION, Vary ing component leve l s —Sydney5.9 . . . . . . . . . . . . . . . . . .
92 A B S • P O P U L A T I O N P R O J E C T I O N S , A U S T R A L I A • 3 2 2 2 . 0 • 2 0 0 4 T O 2 1 0 1
CH A P T E R 5 • D E T A I L E D T A B L E S

(a) Average annual growth rate.
–0.60.13 765.34 241.54 262.44 230.04 225.269–19 000 –1.2–0.13 147.94 046.24 192.74 217.94 221.268–30 000 –1.8–0.32 582.53 867.24 128.14 205.84 216.267–40 00000
0.40.95 609.04 829.54 494.04 300.44 261.951–19 000 0.10.74 990.74 633.84 424.24 288.34 257.950–30 000
–0.20.44 424.74 454.64 359.64 276.34 252.949–40 00028 40080 000
0.61.16 213.75 008.54 554.44 310.54 265.333–19 000 0.40.95 594.74 812.74 484.64 298.44 261.332–30 000 0.10.65 028.34 633.34 420.04 286.44 256.331–40 00038 000110 000
0.81.36 827.65 195.74 622.04 326.54 272.915–19 000 0.61.16 208.04 999.84 552.34 314.44 268.914–30 000 0.40.95 641.14 820.34 487.64 302.44 263.913–40 00047 500140 0001.49
–0.40.24 006.14 305.04 277.54 232.34 226.263–19 000 –0.9–0.13 364.54 107.24 207.64 220.24 222.262–30 000 –1.6–0.32 776.83 925.94 142.84 208.24 217.261–40 00000
0.50.95 931.14 903.24 510.04 302.84 262.945–19 000 0.30.75 288.54 705.04 440.14 290.74 258.944–30 000 0.00.54 700.34 523.44 375.34 278.64 253.943–40 00028 40080 000
0.71.16 562.35 085.34 570.74 312.94 266.227–19 000 0.50.95 918.94 887.04 500.84 300.84 262.226–30 000 0.30.75 330.24 705.34 436.04 288.84 257.225–40 00038 000110 000
0.91.37 203.35 275.84 638.74 328.94 273.89–19 000 0.71.16 559.35 077.44 568.74 316.94 269.88–30 000 0.60.95 970.14 895.64 503.94 304.84 264.87–40 00047 500140 0001.69
–0.20.24 257.84 368.74 293.94 235.24 227.357–19 000 –0.70.03 591.34 168.54 223.84 223.14 223.356–30 000 –1.3–0.22 981.13 985.04 158.94 211.04 218.355–40 00000
0.71.06 266.04 976.94 527.54 305.74 264.039–19 000 0.40.85 598.44 776.34 457.44 293.74 260.038–30 000 0.20.64 987.44 592.54 392.44 281.64 255.037–40 00028 40080 000
0.91.26 923.95 162.14 588.54 315.84 267.421–19 000 0.71.06 255.74 961.34 518.34 303.84 263.420–30 000 0.50.85 644.34 777.44 453.34 291.74 258.419–40 00038 000110 000
1.11.47 592.65 355.94 656.74 331.94 275.03–19 000 0.91.26 923.75 155.04 586.64 319.84 271.02–30 000 0.71.06 311.64 970.94 521.64 307.74 266.01(A)–40 00047 500140 0001.89
CO N S T A N T IM P R O V E M E N T IN L I F E EX P E C T A N C Y ( h i g h a s s u m p t i o n )
%%'000'000'000'000'000SeriesNIMNOM
SydneyNOMAust.TFR
2041–
2051
2004–
201120512021201120062005
GROWTHRATE(a)AT 30 JUNE
PROJECTED POPULAT ION, Vary ing component leve l s —Sydney co n t i n u e d5.9 . . . . . . . . . .
A B S • P O P U L A T I O N P R O J E C T I O N S , A U S T R A L I A • 3 2 2 2 . 0 • 2 0 0 4 T O 2 1 0 1 93
CH A P T E R 5 • D E T A I L E D T A B L E S

(a) Average annual growth rate.
–0.30.62 656.72 707.82 598.32 525.72 510.9728 000 –0.10.72 884.82 778.62 623.22 529.72 511.97112 000 0.00.83 062.32 832.92 643.02 533.72 513.97015 00000
–0.30.62 668.22 711.62 600.62 527.12 511.854(C)8 000 –0.10.72 893.52 782.52 625.52 531.12 512.85312 000 0.00.83 067.92 836.92 645.32 535.12 514.85215 0007080 000
–0.20.62 741.82 733.72 607.92 528.32 512.2368 000 0.00.82 966.52 804.72 632.92 532.32 513.23512 000 0.10.93 140.22 859.12 652.72 536.32 515.23415 0001 200110 000
–0.20.72 818.72 757.82 616.52 530.42 513.2188 000 0.00.83 043.02 828.72 641.52 534.42 514.21712 000 0.20.93 216.12 883.22 661.32 538.52 516.21615 0002 400140 0001.69
–0.10.62 811.72 744.32 606.22 526.92 511.3668 000 0.10.83 048.92 816.12 631.22 530.92 512.36512 000 0.20.93 233.62 871.32 651.12 534.92 514.36415 00000
–0.10.62 823.12 748.32 608.62 528.32 512.2488 000 0.10.83 057.62 820.22 633.62 532.32 513.24712 000 0.20.93 239.32 875.42 653.52 536.32 515.24615 0007080 000
–0.10.72 899.92 770.92 615.92 529.52 512.6308 000 0.10.83 133.92 842.92 641.02 533.52 513.629(B)12 000 0.30.93 314.82 898.12 660.82 537.52 515.62815 0001 200110 000
0.00.72 980.42 795.52 624.62 531.62 513.7128 000 0.20.93 213.92 867.42 649.72 535.62 514.71112 000 0.31.03 394.22 922.72 669.52 539.62 516.71015 0002 400140 0001.91
0.00.72 973.92 780.92 614.92 528.32 511.9608 000 0.20.83 220.42 853.72 639.92 532.32 512.95912 000 0.40.93 412.32 909.62 659.92 536.42 514.95815 00000
0.10.72 985.22 785.02 617.22 529.72 512.8428 000 0.20.83 229.12 857.92 642.32 533.72 513.84112 000 0.40.93 418.12 913.92 662.32 537.82 515.84015 0007080 000
0.10.73 065.42 808.02 624.62 530.92 513.2248 000 0.30.93 308.72 881.02 649.72 534.92 514.22312 000 0.41.03 497.22 937.02 669.72 539.02 516.22215 0001 200110 000
0.20.83 149.32 833.12 633.42 533.02 514.268 000 0.40.93 392.32 906.02 658.52 537.12 515.2512 000 0.51.03 580.02 962.12 678.42 541.12 517.2415 0002 400140 0002.14
DE C L I N I N G IM P R O V E M E N T IN L I F E EX P E C T A N C Y (m e d i u m a s s u m p t i o n )
%%'000'000'000'000'000SeriesNIMNOM
Bal. of NSWNOMAust.TFR
2041–
2051
2004–
201120512021201120062005
GROWTHRATE(a)AT 30 JUNE
PROJECTED POPULAT ION, Vary ing component leve l s —Balance of New South
Wales5.10 . . . . . . . . . . . . . . . . . . . . . . . . . . . . . . . . . . . . . . . . . . . . . . . . . . . . . . . . . . . . . . . . . . .
94 A B S • P O P U L A T I O N P R O J E C T I O N S , A U S T R A L I A • 3 2 2 2 . 0 • 2 0 0 4 T O 2 1 0 1
CH A P T E R 5 • D E T A I L E D T A B L E S

(a) Average annual growth rate.
0.00.62 864.72 719.22 598.32 525.72 510.9698 000 0.20.73 102.02 790.22 623.22 529.72 511.96812 000 0.30.83 286.62 844.72 643.02 533.72 513.96715 00000
0.00.62 868.82 723.02 600.62 527.12 511.8518 000 0.20.73 102.62 794.02 625.52 531.12 512.85012 000 0.30.83 283.72 848.62 645.32 535.12 514.84915 0007080 000
0.10.62 942.12 745.12 607.92 528.32 512.2338 000 0.20.83 175.22 816.22 632.92 532.32 513.23212 000 0.40.93 355.32 870.72 652.72 536.32 515.23115 0001 200110 000
0.10.73 019.02 769.12 616.52 530.42 513.2158 000 0.30.83 251.52 840.22 641.52 534.42 514.21412 000 0.40.93 431.02 894.82 661.32 538.52 516.21315 0002 400140 0001.69
0.20.63 020.32 755.82 606.22 526.92 511.3638 000 0.30.83 266.72 827.82 631.22 530.92 512.36212 000 0.50.93 458.62 883.02 651.12 534.92 514.36115 00000
0.20.63 024.22 759.72 608.62 528.32 512.2458 000 0.30.83 267.42 831.82 633.62 532.32 513.24412 000 0.50.93 455.82 887.12 653.52 536.32 515.24315 0007080 000
0.20.73 100.82 782.32 615.92 529.52 512.6278 000 0.40.83 343.22 854.42 641.02 533.52 513.62612 000 0.50.93 530.62 909.72 660.82 537.52 515.62515 0001 200110 000
0.30.73 181.32 806.82 624.62 531.62 513.798 000 0.40.93 423.02 878.92 649.72 535.62 514.7812 000 0.61.03 609.72 934.32 669.52 539.62 516.7715 0002 400140 0001.91
0.30.73 183.02 792.32 614.92 528.32 511.9578 000 0.50.83 438.82 865.32 639.92 532.32 512.95612 000 0.60.93 638.02 921.42 659.92 536.42 514.95515 00000
0.30.73 186.92 796.42 617.22 529.72 512.8398 000 0.50.83 439.52 869.42 642.32 533.72 513.83812 000 0.60.93 635.32 925.62 662.32 537.82 515.83715 0007080 000
0.40.73 266.92 819.42 624.62 530.92 513.2218 000 0.50.93 518.72 892.52 649.72 534.92 514.22012 000 0.71.03 713.62 948.72 669.72 539.02 516.21915 0001 200110 000
0.40.83 350.92 844.52 633.42 533.02 514.238 000 0.60.93 602.12 917.62 658.52 537.12 515.2212 000 0.71.03 796.32 973.72 678.42 541.12 517.21(A)15 0002 400140 0002.14
CO N S T A N T IM P R O V E M E N T IN L I F E EX P E C T A N C Y ( h i g h a s s u m p t i o n )
%%'000'000'000'000'000SeriesNIMNOM
Bal. of NSWNOMAust.TFR
2041–
2051
2004–
201120512021201120062005
GROWTHRATE(a)AT 30 JUNE
PROJECTED POPULAT ION, Vary ing component leve l s —Balance of New South
Wales co n t i n u e d5.10 . . . . . . . . . . . . . . . . . . . . . . . . . . . . . . . . . . . . . . . . . . . . . . . . . . . . . . . . . . .
A B S • P O P U L A T I O N P R O J E C T I O N S , A U S T R A L I A • 3 2 2 2 . 0 • 2 0 0 4 T O 2 1 0 1 95
CH A P T E R 5 • D E T A I L E D T A B L E S

(a) Estimated resident population, base population.
2 668.23 133.93 796.35 292.15 608.86 311.67 960.48 742.710 107.920512 677.93 130.93 770.85 289.35 593.56 267.87 967.28 724.310 038.720502 687.43 127.73 745.45 285.85 577.86 224.07 973.28 705.59 969.420492 696.63 124.43 719.95 281.65 561.66 180.27 978.38 686.09 900.220482 705.63 120.83 694.45 276.75 545.16 136.47 982.38 665.99 830.92047
2 714.23 117.03 668.95 271.05 528.06 092.57 985.28 645.09 761.420462 722.43 112.93 643.25 264.55 510.56 048.77 986.98 623.49 691.920452 730.23 108.53 617.55 257.15 492.46 004.87 987.28 600.99 622.420442 737.43 103.73 591.85 248.85 473.85 961.17 986.28 577.59 552.920432 744.13 098.63 566.05 239.65 454.65 917.47 983.78 553.29 483.42042
2 750.23 092.93 540.15 229.55 434.95 873.87 979.68 527.89 413.920412 755.73 086.93 514.15 218.45 414.55 830.27 974.08 501.39 344.320402 760.53 080.33 488.05 206.25 393.45 786.67 966.78 473.69 274.720392 764.63 073.13 461.85 193.15 371.65 743.07 957.68 444.79 204.820382 767.93 065.33 435.45 178.85 349.05 699.37 946.78 414.39 134.72037
2 770.43 056.93 408.85 163.55 325.55 655.47 933.98 382.49 064.220362 772.23 047.83 381.95 147.15 301.25 611.37 919.28 349.08 993.220352 773.13 037.93 354.75 129.55 276.05 567.07 902.58 313.98 921.720342 773.13 027.33 327.25 110.85 249.85 522.47 883.98 277.28 849.620332 772.23 015.93 299.45 091.05 222.75 477.57 863.28 238.78 776.82032
2 770.53 003.83 271.25 070.15 194.75 432.37 840.68 198.48 703.420312 768.02 990.83 242.65 048.25 165.65 386.77 816.18 156.48 629.420302 764.52 977.03 213.85 025.25 135.75 340.97 789.88 112.88 554.720292 760.32 962.53 184.55 001.35 105.05 294.97 761.78 067.58 479.420282 755.32 947.33 155.04 976.65 073.55 248.77 731.98 020.78 403.72027
2 749.52 931.33 125.24 951.05 041.35 202.57 700.67 972.58 327.720262 743.12 914.63 095.34 924.75 008.35 156.27 667.87 923.08 251.520252 736.02 897.43 065.14 897.84 974.85 109.87 633.87 872.38 174.920242 728.42 879.73 034.74 870.34 940.85 063.57 598.77 820.68 098.220232 720.22 861.53 004.34 842.34 906.45 017.17 562.57 767.98 021.42022
2 711.62 842.92 973.74 813.84 871.54 970.97 525.47 714.47 944.620212 702.52 823.82 943.24 784.84 836.24 924.87 487.37 660.07 868.020202 693.02 804.52 912.74 755.54 800.64 878.87 448.47 605.17 791.520192 683.22 784.92 882.44 725.74 764.64 832.97 408.97 549.57 715.220182 673.02 765.02 852.34 695.34 728.24 787.27 368.37 493.37 639.52017
2 662.22 744.92 822.54 664.04 691.34 742.17 326.37 436.27 564.620162 650.92 724.42 793.14 631.84 654.04 697.47 282.67 378.47 490.420152 639.02 703.82 763.94 598.74 616.34 653.07 237.77 320.17 416.920142 626.72 683.02 735.14 564.74 578.24 608.97 191.47 261.27 344.020132 613.92 662.12 706.64 529.84 539.74 565.17 143.77 201.87 271.72012
2 600.62 641.02 678.44 494.04 500.84 521.67 094.57 141.77 200.020112 586.72 619.62 650.54 457.14 461.44 478.37 043.87 081.07 128.820102 572.52 598.22 622.84 419.54 421.74 435.36 992.07 019.97 058.120092 557.82 576.72 595.44 381.24 381.84 392.46 939.06 958.56 987.820082 542.82 555.22 568.14 342.14 341.74 349.86 884.96 896.86 917.92007
2 527.12 533.52 541.14 300.44 300.84 307.76 827.56 834.36 848.820062 511.82 513.62 517.24 261.94 262.24 266.06 773.76 775.96 783.220052 495.72 495.72 495.74 225.14 225.14 225.16 720.86 720.86 720.82004(a)
'000'000'000'000'000'000'000'000'000
Series CSeries BSeries ASeries CSeries BSeries ASeries CSeries BSeries A
BALANCE OF NEWSOUTH WALESSYDNEYTOTAL NEW SOUTH WALES
At 30 June
PROJECTED POPULAT ION, By cap i ta l ci t y /ba lance of state —New South Wales5.11 . . . .
96 A B S • P O P U L A T I O N P R O J E C T I O N S , A U S T R A L I A • 3 2 2 2 . 0 • 2 0 0 4 T O 2 1 0 1
CH A P T E R 5 • D E T A I L E D T A B L E S

(a) Average annual growth rate.
–0.50.54 911.55 269.15 131.45 015.44 989.4721 000 –0.80.34 495.35 130.15 082.65 008.44 987.471–7 000 –1.00.24 133.15 008.85 040.15 002.34 985.470–14 00000
0.10.96 191.25 681.85 294.45 064.95 015.254(C)1 000 –0.10.85 769.85 542.55 245.65 057.95 013.253–7 000 –0.20.75 403.15 421.05 203.15 051.85 011.252–14 00020 40080 000
0.21.16 657.65 822.45 341.95 072.75 017.7361 000 0.10.96 234.55 683.05 293.25 065.75 015.735–7 000 0.00.85 866.45 561.55 250.75 059.65 013.734–14 00028 100110 000
0.41.27 132.45 969.95 395.35 085.25 023.7181 000 0.31.16 707.75 830.45 346.55 078.25 021.717–7 000 0.11.06 338.25 708.75 304.05 072.15 019.716–14 00035 700140 0001.44
–0.30.55 197.25 340.95 147.65 017.94 990.4661 000 –0.60.44 765.05 200.35 098.85 010.84 988.465–7 000 –0.80.34 389.05 077.65 056.25 004.84 986.464–14 00000
0.21.06 528.25 759.95 311.35 067.45 016.1481 000 0.10.86 090.75 619.05 262.45 060.35 014.147–7 000
–0.10.75 710.15 496.15 219.85 054.35 012.146–14 00020 40080 000
0.41.17 013.35 902.75 359.05 075.25 018.7301 000 0.31.06 574.15 761.75 310.15 068.15 016.729(B)–7 000 0.10.96 192.35 638.75 267.55 062.15 014.728–14 00028 100110 000
0.51.27 507.46 052.55 412.65 087.75 024.7121 000 0.41.17 066.65 911.45 363.75 080.75 022.711–7 000 0.31.06 683.45 788.35 321.15 074.65 020.710–14 00035 700140 0001.63
–0.20.65 494.95 412.95 165.45 020.94 991.6601 000 –0.40.45 046.45 270.75 116.55 013.94 989.659–7 000 –0.60.34 656.35 146.75 073.85 007.94 987.658–14 00000
0.41.06 877.95 838.15 329.75 070.55 017.3421 000 0.20.96 424.15 695.65 280.75 063.45 015.341–7 000 0.10.86 029.65 571.45 238.05 057.45 013.340–14 00020 40080 000
0.51.27 382.25 983.15 377.65 078.35 019.9241 000 0.41.06 926.65 840.55 328.65 071.25 017.923–7 000 0.30.96 530.85 716.15 285.95 065.25 015.922–14 00028 100110 000
0.71.37 896.06 135.25 431.45 090.85 025.861 000 0.61.27 438.85 992.55 382.45 083.85 023.85–7 000 0.51.17 041.55 868.15 339.65 077.75 021.84–14 00035 700140 0001.82
DE C L I N I N G IM P R O V E M E N T IN L I F E EX P E C T A N C Y (m e d i u m a s s u m p t i o n )
%%'000'000'000'000'000SeriesNIMNOMVic.
NOMAust.TFR
2041–
2051
2004–
201120512021201120062005
GROWTHRATE(a)AT 30 JUNE
PROJECTED POPULAT ION, Vary ing component leve l s —Vic to r ia5.12 . . . . . . . . . . . . . . . . .
A B S • P O P U L A T I O N P R O J E C T I O N S , A U S T R A L I A • 3 2 2 2 . 0 • 2 0 0 4 T O 2 1 0 1 97
CH A P T E R 5 • D E T A I L E D T A B L E S

(a) Average annual growth rate.
–0.20.55 283.65 287.85 131.45 015.44 989.4691 000 –0.40.34 854.55 148.65 082.65 008.44 987.468–7 000 –0.60.24 480.75 027.15 040.15 002.34 985.467–14 00000
0.30.96 583.85 700.75 294.45 064.95 015.2511 000 0.20.86 149.95 561.35 245.65 057.95 013.250–7 000 0.00.75 772.25 439.65 203.15 051.85 011.249–14 00020 40080 000
0.51.17 057.45 841.45 341.95 072.75 017.7331 000 0.30.96 622.05 701.85 293.25 065.75 015.732–7 000 0.20.86 243.05 580.15 250.75 059.65 013.731–14 00028 100110 000
0.61.27 539.65 988.95 395.35 085.25 023.7151 000 0.51.17 102.75 849.35 346.55 078.25 021.714–7 000 0.41.06 722.55 727.55 304.05 072.15 019.713–14 00035 700140 0001.44
0.00.55 570.25 359.65 147.65 017.94 990.4631 000 –0.20.45 125.25 218.85 098.85 010.84 988.462–7 000 –0.40.34 737.95 095.95 056.25 004.84 986.461–14 00000
0.51.06 921.75 778.85 311.35 067.45 016.1451 000 0.30.86 472.05 637.75 262.45 060.35 014.144–7 000 0.20.76 080.65 514.75 219.85 054.35 012.143–14 00020 40080 000
0.61.17 414.25 921.75 359.05 075.25 018.7271 000 0.51.06 962.95 780.55 310.15 068.15 016.726–7 000 0.40.96 570.35 657.35 267.55 062.15 014.725–14 00028 100110 000
0.71.27 915.76 071.65 412.65 087.75 024.791 000 0.61.17 463.05 930.35 363.75 080.75 022.78–7 000 0.51.07 069.25 807.15 321.15 074.65 020.77–14 00035 700140 0001.63
0.10.65 868.85 431.65 165.45 020.94 991.6571 000 –0.10.45 407.75 289.35 116.55 013.94 989.656–7 000 –0.30.35 006.55 165.15 073.85 007.94 987.655–14 00000
0.61.07 272.55 857.05 329.75 070.55 017.3391 000 0.50.96 806.75 714.45 280.75 063.45 015.338–7 000 0.30.86 401.55 590.05 238.05 057.45 013.337–14 00020 40080 000
0.71.27 784.26 002.15 377.65 078.35 019.9211 000 0.61.07 316.75 859.35 328.65 071.25 017.920–7 000 0.50.96 910.35 734.85 285.95 065.25 015.919–14 00028 100110 000
0.91.38 305.56 154.35 431.45 090.85 025.831 000 0.81.27 836.56 011.55 382.45 083.85 023.82–7 000 0.71.17 428.75 886.85 339.65 077.75 021.81(A)–14 00035 700140 0001.82
CO N S T A N T IM P R O V E M E N T IN L I F E EX P E C T A N C Y ( h i g h a s s u m p t i o n )
%%'000'000'000'000'000SeriesNIMNOMVic.
NOMAust.TFR
2041–
2051
2004–
201120512021201120062005
GROWTHRATE(a)AT 30 JUNE
PROJECTED POPULAT ION, Vary ing component leve l s —Vic to r ia co n t i n u e d5.12 . . . . . . . . .
98 A B S • P O P U L A T I O N P R O J E C T I O N S , A U S T R A L I A • 3 2 2 2 . 0 • 2 0 0 4 T O 2 1 0 1
CH A P T E R 5 • D E T A I L E D T A B L E S

(a) Average annual growth rate.
–0.70.43 319.33 731.23 682.23 618.93 605.072–6 000 –0.90.33 112.03 661.73 657.43 614.93 604.071–10 000 –1.00.22 958.23 609.73 638.83 611.93 603.070–13 00000
0.11.04 566.84 135.33 841.53 666.93 630.054(C)–6 000 0.00.94 357.94 065.73 816.73 662.93 629.053–10 000
–0.10.84 202.54 013.73 798.13 659.93 628.052–13 00020 00080 000
0.31.14 992.24 263.93 885.13 674.13 632.336–6 000 0.21.04 782.74 194.33 860.33 670.13 631.335–10 000 0.21.04 626.64 142.23 841.73 667.13 630.334–13 00027 000110 000
0.51.35 424.24 398.43 933.83 685.53 637.718–6 000 0.41.25 214.24 328.73 909.03 681.53 636.717–10 000 0.41.15 057.74 276.73 890.43 678.53 635.716–13 00034 100140 0001.38
–0.50.43 517.83 783.03 694.13 620.73 605.766–6 000 –0.70.33 302.93 712.73 669.33 616.73 604.765–10 000 –0.80.23 143.53 660.13 650.73 613.73 603.764–13 00000
0.31.04 815.74 193.33 854.03 668.83 630.748–6 000 0.20.94 599.34 122.83 829.23 664.83 629.747–10 000 0.10.84 438.44 070.33 810.63 661.83 628.746–13 00020 00080 000
0.51.25 258.14 323.83 897.83 676.03 633.130–6 000 0.41.15 041.14 253.43 872.93 671.93 632.129(B)–10 000 0.31.04 879.84 200.83 854.33 668.93 631.128–13 00027 000110 000
0.61.45 707.64 460.53 946.73 687.33 638.512–6 000 0.61.35 490.34 390.03 921.83 683.33 637.511–10 000 0.51.25 328.44 337.33 903.23 680.33 636.510–13 00034 100140 0001.56
–0.30.43 724.93 835.13 707.23 623.03 606.660–6 000 –0.50.43 502.33 764.03 682.33 619.03 605.659–10 000 –0.60.33 337.23 710.93 663.73 615.93 604.658–13 00000
0.41.15 073.94 251.33 867.73 671.13 631.642–6 000 0.31.04 850.04 180.23 842.83 667.13 630.641–10 000 0.30.94 683.64 127.03 824.23 664.13 629.640–13 00020 00080 000
0.61.25 533.74 383.93 911.63 678.33 634.024–6 000 0.51.15 309.24 312.73 886.73 674.23 633.023–10 000 0.51.15 142.34 259.53 868.13 671.23 632.022–13 00027 000110 000
0.81.46 001.14 522.63 960.73 689.73 639.36–6 000 0.71.35 776.24 451.33 935.83 685.63 638.35–10 000 0.71.25 608.84 398.23 917.13 682.63 637.34–13 00034 100140 0001.75
DE C L I N I N G IM P R O V E M E N T IN L I F E EX P E C T A N C Y (m e d i u m a s s u m p t i o n )
%%'000'000'000'000'000SeriesNIMNOM
MelbourneNOMAust.TFR
2041–
2051
2004–
201120512021201120062005
GROWTHRATE(a)AT 30 JUNE
PROJECTED POPULAT ION, Vary ing component leve l s —Melbourne5.13 . . . . . . . . . . . . . . .
A B S • P O P U L A T I O N P R O J E C T I O N S , A U S T R A L I A • 3 2 2 2 . 0 • 2 0 0 4 T O 2 1 0 1 99
CH A P T E R 5 • D E T A I L E D T A B L E S

(a) Average annual growth rate.
–0.40.43 571.63 744.03 682.23 618.93 605.069–6 000 –0.50.33 358.93 674.33 657.43 614.93 604.068–10 000 –0.70.23 201.43 622.33 638.83 611.93 603.067–13 00000
0.41.04 843.44 148.33 841.53 666.93 630.051–6 000 0.30.94 629.54 078.63 816.73 662.93 629.050–10 000 0.20.84 470.84 026.63 798.13 659.93 628.049–13 00020 00080 000
0.51.15 276.24 277.03 885.13 674.13 632.333–6 000 0.51.05 061.84 207.33 860.33 670.13 631.332–10 000 0.41.04 902.64 155.23 841.73 667.13 630.331–13 00027 000110 000
0.71.35 715.84 411.63 933.83 685.53 637.715–6 000 0.61.25 501.04 341.83 909.03 681.53 636.714–10 000 0.61.15 341.14 289.73 890.43 678.53 635.713–13 00034 100140 0001.38
–0.20.43 770.83 795.83 694.13 620.73 605.763–6 000 –0.40.33 550.83 725.43 669.33 616.73 604.762–10 000 –0.50.23 387.83 672.83 650.73 613.73 603.761–13 00000
0.51.05 093.24 206.33 854.03 668.83 630.745–6 000 0.40.94 872.04 135.83 829.23 664.83 629.744–10 000 0.30.84 707.74 083.13 810.63 661.83 628.743–13 00020 00080 000
0.71.25 543.14 336.93 897.83 676.03 633.127–6 000 0.61.15 321.44 266.43 872.93 671.93 632.126–10 000 0.51.05 156.74 213.73 854.33 668.93 631.125–13 00027 000110 000
0.81.46 000.24 473.63 946.73 687.33 638.59–6 000 0.81.35 778.14 403.13 921.83 683.33 637.58–10 000 0.71.25 613.04 350.43 903.23 680.33 636.57–13 00034 100140 0001.56
0.00.43 978.63 847.93 707.23 623.03 606.657–6 000 –0.20.43 750.83 776.73 682.33 619.03 605.656–10 000 –0.30.33 582.43 723.53 663.73 615.93 604.655–13 00000
0.61.15 352.24 264.43 867.73 671.13 631.639–6 000 0.61.05 123.64 193.13 842.83 667.13 630.638–10 000 0.50.94 954.04 140.03 824.23 664.13 629.637–13 00020 00080 000
0.81.25 819.64 397.03 911.63 678.33 634.021–6 000 0.71.15 590.44 325.73 886.73 674.23 633.020–10 000 0.71.15 420.44 272.53 868.13 671.23 632.019–13 00027 000110 000
1.01.46 294.74 535.83 960.73 689.73 639.33–6 000 0.91.36 065.14 464.53 935.83 685.63 638.32–10 000 0.91.25 894.64 411.23 917.13 682.63 637.31(A)–13 00034 100140 0001.75
CO N S T A N T IM P R O V E M E N T IN L I F E EX P E C T A N C Y ( h i g h a s s u m p t i o n )
%%'000'000'000'000'000SeriesNIMNOM
MelbourneNOMAust.TFR
2041–
2051
2004–
201120512021201120062005
GROWTHRATE(a)AT 30 JUNE
PROJECTED POPULAT ION, Vary ing component leve l s —Melbourne co n t i n u e d5.13 . . . . . . .
10 0 A B S • P O P U L A T I O N P R O J E C T I O N S , A U S T R A L I A • 3 2 2 2 . 0 • 2 0 0 4 T O 2 1 0 1
CH A P T E R 5 • D E T A I L E D T A B L E S

(a) Average annual growth rate.
–0.20.81 592.21 537.91 449.21 396.51 384.4727 000 –0.50.61 383.31 468.41 425.31 393.51 383.4713 000 –0.90.31 174.91 399.11 401.31 390.51 382.470–1 00000
–0.10.81 624.41 546.51 452.91 397.91 385.254(C)7 000 –0.40.61 411.91 476.81 428.91 394.91 384.2533 000 –0.80.41 200.61 407.41 405.01 391.91 383.252–1 00038080 000
0.00.91 665.41 558.51 456.91 398.61 385.4367 000 –0.30.61 451.81 488.81 432.91 395.61 384.4353 000 –0.70.41 239.71 419.21 409.01 392.51 383.434–1 0001 000110 000
0.00.91 708.21 571.51 461.51 399.71 385.9187 000 –0.30.71 493.41 501.71 437.51 396.71 384.9173 000 –0.70.41 280.51 432.11 413.61 393.71 383.916–1 0001 600140 0001.65
0.00.81 679.41 557.91 453.51 397.21 384.6667 000 –0.30.61 462.01 487.61 429.51 394.11 383.6653 000 –0.70.41 245.61 417.51 405.51 391.11 382.664–1 00000
0.10.91 712.51 566.61 457.21 398.61 385.4487 000 –0.20.61 491.41 496.11 433.21 395.61 384.4473 000 –0.70.41 271.71 425.81 409.21 392.61 383.446–1 00038080 000
0.10.91 755.31 578.91 461.21 399.21 385.7307 000 –0.20.71 533.01 508.31 437.21 396.21 384.729(B)3 000 –0.60.41 312.51 437.91 413.21 393.21 383.728–1 0001 000110 000
0.21.01 799.81 592.11 465.91 400.31 386.2127 000 –0.10.71 576.31 521.41 441.91 397.31 385.2113 000 –0.50.51 355.01 451.01 417.81 394.31 384.210–1 0001 600140 0001.87
0.20.91 770.01 577.81 458.21 398.01 384.9607 000 –0.10.71 544.11 506.81 434.21 394.91 383.9593 000 –0.50.41 319.11 435.81 410.11 391.91 382.958–1 00000
0.20.91 804.01 586.71 462.01 399.41 385.8427 000 –0.10.71 574.11 515.41 437.91 396.41 384.8413 000 –0.50.51 346.01 444.31 413.81 393.31 383.840–1 00038080 000
0.31.01 848.51 599.21 466.01 400.01 386.0247 000 0.00.71 617.41 527.81 441.91 397.01 385.0233 000
–0.40.51 388.51 456.61 417.81 394.01 384.022–1 0001 000110 000
0.41.01 894.81 612.61 470.71 401.11 386.567 000 0.10.81 662.51 541.21 446.61 398.11 385.553 000
–0.30.51 432.71 469.91 422.51 395.11 384.54–1 0001 600140 0002.09
DE C L I N I N G IM P R O V E M E N T IN L I F E EX P E C T A N C Y (m e d i u m a s s u m p t i o n )
%%'000'000'000'000'000SeriesNIMNOM
Bal. of Vic.NOMAust.TFR
2041–
2051
2004–
201120512021201120062005
GROWTHRATE(a)AT 30 JUNE
PROJECTED POPULAT ION, Vary ing component leve l s —Balance of Vic to r ia5.14 . . . . . . .
A B S • P O P U L A T I O N P R O J E C T I O N S , A U S T R A L I A • 3 2 2 2 . 0 • 2 0 0 4 T O 2 1 0 1 10 1
CH A P T E R 5 • D E T A I L E D T A B L E S

(a) Average annual growth rate.
0.10.81 712.11 543.81 449.21 396.51 384.4697 000 –0.20.61 495.61 474.21 425.31 393.51 383.4683 000 –0.50.31 279.21 404.81 401.31 390.51 382.467–1 00000
0.20.81 740.41 552.41 452.91 397.91 385.2517 000 –0.10.61 520.41 482.61 428.91 394.91 384.2503 000 –0.50.41 301.41 413.11 405.01 391.91 383.249–1 00038080 000
0.20.91 781.11 564.41 456.91 398.61 385.4337 000 0.00.61 560.21 494.61 432.91 395.61 384.4323 000
–0.40.41 340.41 424.91 409.01 392.51 383.431–1 0001 000110 000
0.30.91 823.71 577.31 461.51 399.71 385.9157 000 0.00.71 601.71 507.51 437.51 396.71 384.9143 000
–0.30.41 381.41 437.81 413.61 393.71 383.913–1 0001 600140 0001.65
0.30.81 799.41 563.81 453.51 397.21 384.6637 000 0.00.61 574.51 493.41 429.51 394.11 383.6623 000
–0.40.41 350.11 423.21 405.51 391.11 382.661–1 00000
0.30.91 828.61 572.51 457.21 398.61 385.4457 000 0.00.61 600.01 501.91 433.21 395.61 384.4443 000
–0.30.41 372.91 431.51 409.21 392.61 383.443–1 00038080 000
0.40.91 871.11 584.71 461.21 399.21 385.7277 000 0.10.71 641.61 514.11 437.21 396.21 384.7263 000
–0.30.41 413.61 443.61 413.21 393.21 383.725–1 0001 000110 000
0.41.01 915.51 597.91 465.91 400.31 386.297 000 0.20.71 684.81 527.21 441.91 397.31 385.283 000
–0.20.51 456.11 456.71 417.81 394.31 384.27–1 0001 600140 0001.87
0.50.91 890.21 583.71 458.21 398.01 384.9577 000 0.20.71 656.91 512.61 434.21 394.91 383.9563 000
–0.20.41 424.01 441.61 410.11 391.91 382.955–1 00000
0.50.91 920.31 592.61 462.01 399.41 385.8397 000 0.20.71 683.11 521.21 437.91 396.41 384.8383 000
–0.20.51 447.51 450.01 413.81 393.31 383.837–1 00038080 000
0.51.01 964.51 605.11 466.01 400.01 386.0217 000 0.30.71 726.31 533.61 441.91 397.01 385.0203 000
–0.10.51 489.91 462.31 417.81 394.01 384.019–1 0001 000110 000
0.61.02 010.81 618.51 470.71 401.11 386.537 000 0.30.81 771.41 547.01 446.61 398.11 385.523 000 0.00.51 534.21 475.61 422.51 395.11 384.51(A)–1 0001 600140 0002.09
CO N S T A N T IM P R O V E M E N T IN L I F E EX P E C T A N C Y ( h i g h a s s u m p t i o n )
%%'000'000'000'000'000SeriesNIMNOM
Bal. of Vic.NOMAust.TFR
2041–
2051
2004–
201120512021201120062005
GROWTHRATE(a)AT 30 JUNE
PROJECTED POPULAT ION, Vary ing component leve l s —Balance of Vic to r ia
co n t i n u e d5.14 . . . . . . . . . . . . . . . . . . . . . . . . . . . . . . . . . . . . . . . . . . . . . . . . . . . . . . . . . . . . . . . . .
10 2 A B S • P O P U L A T I O N P R O J E C T I O N S , A U S T R A L I A • 3 2 2 2 . 0 • 2 0 0 4 T O 2 1 0 1
CH A P T E R 5 • D E T A I L E D T A B L E S

(a) Estimated resident population, base population.
1 624.41 533.01 534.24 566.85 041.15 894.66 191.26 574.17 428.720511 626.91 536.31 535.04 564.85 024.35 846.56 191.76 560.67 381.520501 629.21 539.51 535.84 562.35 007.15 798.46 191.56 546.67 334.120491 631.41 542.61 536.44 559.14 989.45 750.26 190.56 532.07 286.620481 633.41 545.61 536.94 555.24 971.25 701.96 188.66 516.87 238.82047
1 635.11 548.41 537.24 550.64 952.65 653.66 185.76 501.07 190.820461 636.61 551.01 537.44 545.24 933.45 605.26 181.76 484.57 142.620451 637.71 553.41 537.44 538.94 913.75 556.96 176.76 467.17 094.320441 638.61 555.61 537.34 531.84 893.45 508.56 170.46 449.07 045.820431 639.11 557.51 537.04 523.94 872.55 460.16 162.96 430.06 997.12042
1 639.21 559.21 536.54 515.04 850.95 411.76 154.26 410.16 948.220411 638.91 560.61 535.94 505.14 828.65 363.36 144.06 389.26 899.220401 638.21 561.61 535.04 494.34 805.75 314.86 132.56 367.26 849.820391 637.11 562.21 533.94 482.54 781.95 266.26 119.66 344.26 800.220381 635.51 562.51 532.64 469.74 757.45 217.56 105.16 319.96 750.12037
1 633.41 562.41 531.14 455.84 732.05 168.66 089.26 294.46 699.720361 630.81 561.81 529.24 440.94 705.85 119.56 071.66 267.66 648.720351 627.61 560.81 527.14 424.94 678.75 070.16 052.66 239.46 597.220341 624.01 559.31 524.74 407.94 650.65 020.56 031.96 209.96 545.220331 619.91 557.31 521.94 389.94 621.74 970.66 009.76 179.06 492.52032
1 615.21 554.91 518.94 370.84 591.84 920.45 986.06 146.76 439.320311 610.11 552.01 515.64 350.84 561.14 869.95 960.96 113.16 385.520301 604.51 548.61 512.04 329.84 529.64 819.25 934.36 078.26 331.220291 598.51 544.91 508.14 307.94 497.24 768.35 906.46 042.16 276.420281 592.11 540.71 504.04 285.24 464.14 717.35 877.36 004.76 221.32027
1 585.21 536.11 499.74 261.84 430.34 666.25 847.05 966.46 165.920261 578.01 531.11 495.24 237.64 395.94 615.15 815.65 927.06 110.320251 570.61 525.81 490.54 212.84 360.94 564.05 783.45 886.76 054.620241 562.81 520.31 485.74 187.54 325.54 513.05 750.35 845.75 998.720231 554.81 514.41 480.74 161.64 289.64 462.05 716.45 804.05 942.72022
1 546.51 508.31 475.64 135.34 253.44 411.25 681.85 761.75 886.820211 538.01 501.91 470.44 108.54 216.74 360.65 646.55 718.75 831.020201 529.41 495.41 465.14 081.34 179.84 310.05 610.75 675.25 775.220191 520.61 488.71 459.84 053.74 142.64 259.65 574.45 631.35 719.420181 511.71 481.81 454.44 025.74 105.04 209.45 537.35 586.85 663.82017
1 502.51 474.81 449.03 996.84 067.04 159.85 499.35 541.85 608.820161 493.01 467.51 443.73 967.24 028.84 110.55 460.25 496.35 554.220151 483.31 460.11 438.43 936.93 990.24 061.65 420.25 450.35 500.020141 473.41 452.61 433.13 905.83 951.44 013.15 379.25 404.05 446.220131 463.31 445.01 427.83 874.03 912.33 964.95 337.35 357.35 392.72012
1 452.91 437.21 422.53 841.53 872.93 917.15 294.45 310.15 339.620111 442.31 429.21 417.23 808.13 833.23 869.75 250.45 262.45 286.820101 431.51 421.21 411.83 774.13 793.23 822.45 205.65 214.45 234.220091 420.61 413.01 406.33 739.43 753.03 775.45 160.05 166.05 181.720081 409.41 404.71 400.73 704.13 712.63 728.65 113.55 117.25 129.32007
1 397.91 396.21 395.13 666.93 671.93 682.65 064.95 068.15 077.720061 385.21 384.71 384.53 630.03 632.13 637.35 015.25 016.75 021.820051 370.01 370.01 370.03 593.03 593.03 593.04 963.04 963.04 963.02004(a)
'000'000'000'000'000'000'000'000'000
Series CSeries BSeries ASeries CSeries BSeries ASeries CSeries BSeries A
BALANCE OF VICTORIAMELBOURNETOTAL VICTORIA
At 30 June
PROJECTED POPULAT ION, By cap i ta l ci t y /ba lance of state —Victo r ia5.15 . . . . . . . . . . . .
A B S • P O P U L A T I O N P R O J E C T I O N S , A U S T R A L I A • 3 2 2 2 . 0 • 2 0 0 4 T O 2 1 0 1 10 3
CH A P T E R 5 • D E T A I L E D T A B L E S

(a) Average annual growth rate.
–0.11.14 786.84 506.34 186.23 990.43 942.67218 000 0.11.35 244.14 662.74 242.13 999.43 945.67127 000 0.31.55 753.54 835.64 303.24 008.43 948.67037 00000
0.31.55 744.14 816.34 309.34 026.63 961.254(C)18 000 0.51.76 207.74 973.04 365.34 035.73 964.25327 000 0.61.96 724.35 146.34 426.44 044.73 967.25237 00016 00080 000
0.51.66 098.24 923.84 345.94 032.43 963.13618 000 0.61.86 563.95 080.74 401.84 041.43 966.13527 000 0.72.07 082.65 254.14 463.04 050.53 969.13437 00022 000110 000
0.61.76 457.65 036.24 386.74 041.63 967.41818 000 0.71.96 925.35 193.14 442.64 050.63 970.41727 000 0.82.17 446.05 366.74 503.84 059.63 973.41637 00028 000140 0001.52
0.11.15 056.74 567.74 199.83 992.43 943.46618 000 0.31.35 531.54 725.84 255.84 001.43 946.46527 000 0.41.56 060.54 900.74 317.04 010.53 949.46437 00000
0.51.56 048.34 881.64 323.34 028.63 962.04818 000 0.61.76 529.55 040.14 379.44 037.73 965.04727 000 0.81.97 065.55 215.34 440.64 046.73 968.04637 00016 00080 000
0.61.66 415.74 990.64 360.04 034.43 963.93018 000 0.71.86 899.05 149.24 416.04 043.43 966.929(B)27 000 0.92.07 437.25 324.64 477.34 052.53 969.92837 00022 000110 000
0.71.86 788.85 104.64 400.94 043.63 968.21218 000 0.82.07 274.05 263.34 457.04 052.63 971.21127 000 0.92.27 814.45 438.84 518.34 061.73 974.21037 00028 000140 0001.72
0.31.25 337.14 629.04 214.53 994.93 944.36018 000 0.41.35 829.64 788.84 270.74 003.93 947.35927 000 0.61.66 378.74 965.54 332.04 013.03 950.35837 00000
0.61.66 363.64 946.84 338.44 031.23 963.04218 000 0.81.86 862.55 106.94 394.64 040.23 966.04127 000 0.92.07 418.45 284.04 456.04 049.33 969.04037 00016 00080 000
0.81.76 744.55 057.24 375.24 036.93 964.92418 000 0.91.97 245.65 217.64 431.44 046.03 967.92327 000 1.02.17 803.65 394.84 492.94 055.03 970.92237 00022 000110 000
0.91.87 131.55 172.84 416.34 046.13 969.2618 000 1.02.07 634.55 333.24 472.54 055.23 972.2527 000 1.12.28 194.85 510.74 534.04 064.23 975.2437 00028 000140 0001.92
DE C L I N I N G IM P R O V E M E N T IN L I F E EX P E C T A N C Y (m e d i u m a s s u m p t i o n )
%%'000'000'000'000'000SeriesNIMNOM
QldNOMAust.TFR
2041–
2051
2004–
201120512021201120062005
GROWTHRATE(a)AT 30 JUNE
PROJECTED POPULAT ION, Vary ing component leve l s —Queens land5.16 . . . . . . . . . . . . . .
10 4 A B S • P O P U L A T I O N P R O J E C T I O N S , A U S T R A L I A • 3 2 2 2 . 0 • 2 0 0 4 T O 2 1 0 1
CH A P T E R 5 • D E T A I L E D T A B L E S

(a) Average annual growth rate.
0.21.15 115.34 521.64 186.23 990.43 942.66918 000 0.41.35 588.44 678.24 242.13 999.43 945.66827 000 0.51.56 115.44 851.44 303.24 008.43 948.66737 00000
0.61.56 090.04 831.84 309.34 026.63 961.25118 000 0.71.76 568.84 988.84 365.34 035.73 964.25027 000 0.81.97 101.95 162.34 426.44 044.73 967.24937 00016 00080 000
0.71.66 450.44 939.44 345.94 032.43 963.13318 000 0.81.86 931.15 096.54 401.84 041.43 966.13227 000 0.92.07 466.25 270.14 463.04 050.53 969.13137 00022 000110 000
0.81.76 816.45 051.84 386.74 041.63 967.41518 000 0.91.97 298.85 209.14 442.64 050.63 970.41427 000 1.02.17 835.85 382.84 503.84 059.63 973.41337 00028 000140 0001.52
0.41.15 385.44 583.04 199.83 992.43 943.46318 000 0.51.35 875.84 741.44 255.84 001.43 946.46227 000 0.71.56 422.04 916.54 317.04 010.53 949.46137 00000
0.71.56 394.74 897.14 323.34 028.63 962.04518 000 0.81.76 890.75 055.84 379.44 037.73 965.04427 000 1.01.97 443.15 231.34 440.64 046.73 968.04337 00016 00080 000
0.81.66 768.55 006.24 360.04 034.43 963.92718 000 0.91.87 266.45 165.14 416.04 043.43 966.92627 000 1.12.07 820.85 340.74 477.34 052.53 969.92537 00022 000110 000
0.91.87 148.25 120.34 400.94 043.63 968.2918 000 1.02.07 647.95 279.24 457.04 052.63 971.2827 000 1.12.28 204.25 455.04 518.34 061.73 974.2737 00028 000140 0001.72
0.51.25 666.24 644.34 214.53 994.93 944.35718 000 0.71.36 174.04 804.34 270.74 003.93 947.35627 000 0.81.66 739.84 981.34 332.04 013.03 950.35537 00000
0.91.66 710.44 962.34 338.44 031.23 963.03918 000 1.01.87 224.15 122.74 394.64 040.23 966.03827 000 1.12.07 796.05 300.04 456.04 049.33 969.03737 00016 00080 000
1.01.77 097.85 072.94 375.24 036.93 964.92118 000 1.11.97 613.35 233.44 431.44 046.03 967.92027 000 1.22.18 187.35 410.94 492.94 055.03 970.91937 00022 000110 000
1.11.87 491.55 188.54 416.34 046.13 969.2318 000 1.22.08 008.85 349.24 472.54 055.23 972.2227 000 1.32.28 584.85 526.94 534.04 064.23 975.21(A)37 00028 000140 0001.92
CO N S T A N T IM P R O V E M E N T IN L I F E EX P E C T A N C Y ( h i g h a s s u m p t i o n )
%%'000'000'000'000'000SeriesNIMNOM
QldNOMAust.TFR
2041–
2051
2004–
201120512021201120062005
GROWTHRATE(a)AT 30 JUNE
PROJECTED POPULAT ION, Vary ing component leve l s —Queens land co n t i n u e d5.16 . . . . . .
A B S • P O P U L A T I O N P R O J E C T I O N S , A U S T R A L I A • 3 2 2 2 . 0 • 2 0 0 4 T O 2 1 0 1 10 5
CH A P T E R 5 • D E T A I L E D T A B L E S
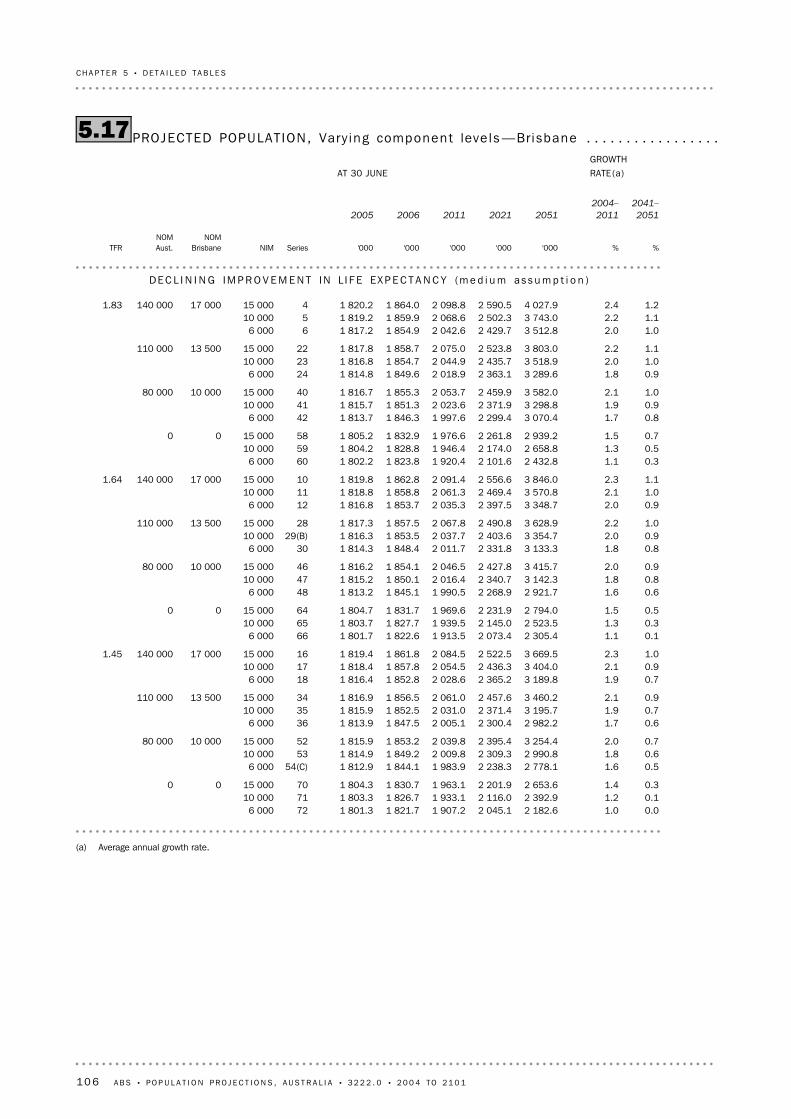
(a) Average annual growth rate.
0.01.02 182.62 045.11 907.21 821.71 801.3726 000 0.11.22 392.92 116.01 933.11 826.71 803.37110 000 0.31.42 653.62 201.91 963.11 830.71 804.37015 00000
0.51.62 778.12 238.31 983.91 844.11 812.954(C)6 000 0.61.82 990.82 309.32 009.81 849.21 814.95310 000 0.72.03 254.42 395.42 039.81 853.21 815.95215 00010 00080 000
0.61.72 982.22 300.42 005.11 847.51 813.9366 000 0.71.93 195.72 371.42 031.01 852.51 815.93510 000 0.92.13 460.22 457.62 061.01 856.51 816.93415 00013 500110 000
0.71.93 189.82 365.22 028.61 852.81 816.4186 000 0.92.13 404.02 436.32 054.51 857.81 818.41710 000 1.02.33 669.52 522.52 084.51 861.81 819.41615 00017 000140 0001.45
0.11.12 305.42 073.41 913.51 822.61 801.7666 000 0.31.32 523.52 145.01 939.51 827.71 803.76510 000 0.51.52 794.02 231.91 969.61 831.71 804.76415 00000
0.61.62 921.72 268.91 990.51 845.11 813.2486 000 0.81.83 142.32 340.72 016.41 850.11 815.24710 000 0.92.03 415.72 427.82 046.51 854.11 816.24615 00010 00080 000
0.81.83 133.32 331.82 011.71 848.41 814.3306 000 0.92.03 354.72 403.62 037.71 853.51 816.329(B)10 000 1.02.23 628.92 490.82 067.81 857.51 817.32815 00013 500110 000
0.92.03 348.72 397.52 035.31 853.71 816.8126 000 1.02.13 570.82 469.42 061.31 858.81 818.81110 000 1.12.33 846.02 556.62 091.41 862.81 819.81015 00017 000140 0001.64
0.31.12 432.82 101.61 920.41 823.81 802.2606 000 0.51.32 658.82 174.01 946.41 828.81 804.25910 000 0.71.52 939.22 261.81 976.61 832.91 805.25815 00000
0.81.73 070.42 299.41 997.61 846.31 813.7426 000 0.91.93 298.82 371.92 023.61 851.31 815.74110 000 1.02.13 582.02 459.92 053.71 855.31 816.74015 00010 00080 000
0.91.83 289.62 363.12 018.91 849.61 814.8246 000 1.02.03 518.92 435.72 044.91 854.71 816.82310 000 1.12.23 803.02 523.82 075.01 858.71 817.82215 00013 500110 000
1.02.03 512.82 429.72 042.61 854.91 817.266 000 1.12.23 743.02 502.32 068.61 859.91 819.2510 000 1.22.44 027.92 590.52 098.81 864.01 820.2415 00017 000140 0001.83
DE C L I N I N G IM P R O V E M E N T IN L I F E EX P E C T A N C Y (m e d i u m a s s u m p t i o n )
%%'000'000'000'000'000SeriesNIMNOM
BrisbaneNOMAust.TFR
2041–
2051
2004–
201120512021201120062005
GROWTHRATE(a)AT 30 JUNE
PROJECTED POPULAT ION, Vary ing component leve l s —Brisbane5.17 . . . . . . . . . . . . . . . . .
10 6 A B S • P O P U L A T I O N P R O J E C T I O N S , A U S T R A L I A • 3 2 2 2 . 0 • 2 0 0 4 T O 2 1 0 1
CH A P T E R 5 • D E T A I L E D T A B L E S
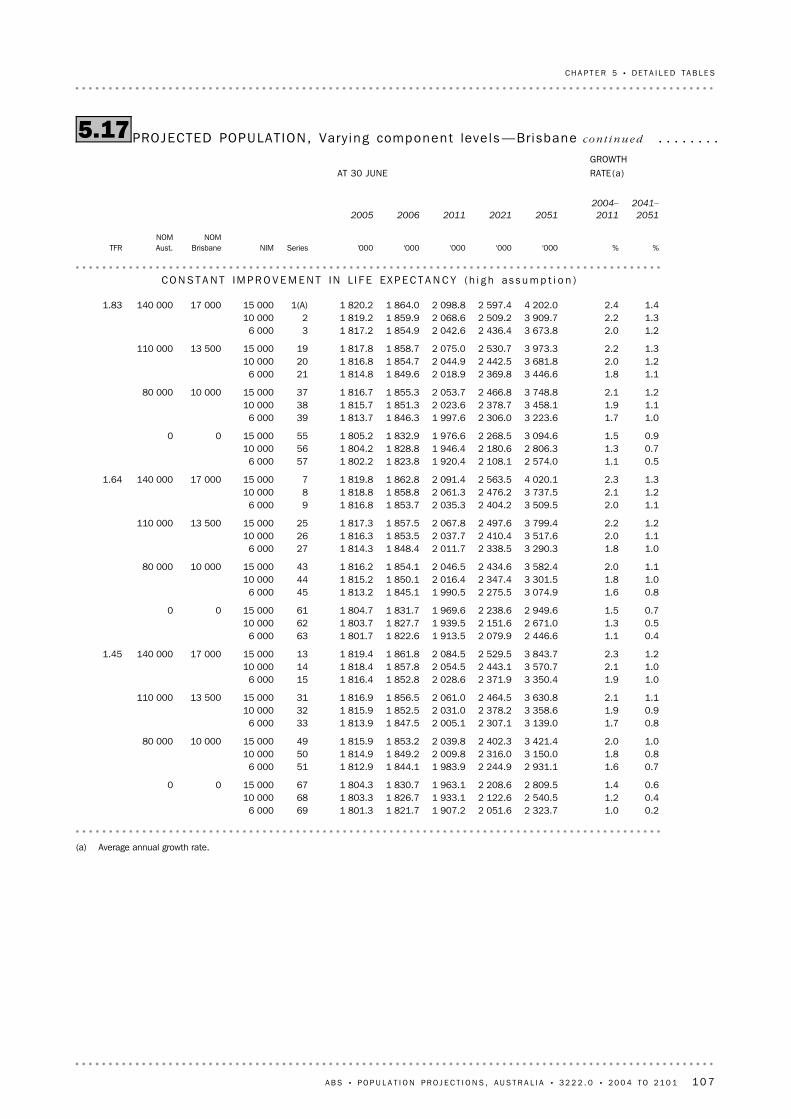
(a) Average annual growth rate.
0.21.02 323.72 051.61 907.21 821.71 801.3696 000 0.41.22 540.52 122.61 933.11 826.71 803.36810 000 0.61.42 809.52 208.61 963.11 830.71 804.36715 00000
0.71.62 931.12 244.91 983.91 844.11 812.9516 000 0.81.83 150.02 316.02 009.81 849.21 814.95010 000 1.02.03 421.42 402.32 039.81 853.21 815.94915 00010 00080 000
0.81.73 139.02 307.12 005.11 847.51 813.9336 000 0.91.93 358.62 378.22 031.01 852.51 815.93210 000 1.12.13 630.82 464.52 061.01 856.51 816.93115 00013 500110 000
1.01.93 350.42 371.92 028.61 852.81 816.4156 000 1.02.13 570.72 443.12 054.51 857.81 818.41410 000 1.22.33 843.72 529.52 084.51 861.81 819.41315 00017 000140 0001.45
0.41.12 446.62 079.91 913.51 822.61 801.7636 000 0.51.32 671.02 151.61 939.51 827.71 803.76210 000 0.71.52 949.62 238.61 969.61 831.71 804.76115 00000
0.81.63 074.92 275.51 990.51 845.11 813.2456 000 1.01.83 301.52 347.42 016.41 850.11 815.24410 000 1.12.03 582.42 434.62 046.51 854.11 816.24315 00010 00080 000
1.01.83 290.32 338.52 011.71 848.41 814.3276 000 1.12.03 517.62 410.42 037.71 853.51 816.32610 000 1.22.23 799.42 497.62 067.81 857.51 817.32515 00013 500110 000
1.12.03 509.52 404.22 035.31 853.71 816.896 000 1.22.13 737.52 476.22 061.31 858.81 818.8810 000 1.32.34 020.12 563.52 091.41 862.81 819.8715 00017 000140 0001.64
0.51.12 574.02 108.11 920.41 823.81 802.2576 000 0.71.32 806.32 180.61 946.41 828.81 804.25610 000 0.91.53 094.62 268.51 976.61 832.91 805.25515 00000
1.01.73 223.62 306.01 997.61 846.31 813.7396 000 1.11.93 458.12 378.72 023.61 851.31 815.73810 000 1.22.13 748.82 466.82 053.71 855.31 816.73715 00010 00080 000
1.11.83 446.62 369.82 018.91 849.61 814.8216 000 1.22.03 681.82 442.52 044.91 854.71 816.82010 000 1.32.23 973.32 530.72 075.01 858.71 817.81915 00013 500110 000
1.22.03 673.82 436.42 042.61 854.91 817.236 000 1.32.23 909.72 509.22 068.61 859.91 819.2210 000 1.42.44 202.02 597.42 098.81 864.01 820.21(A)15 00017 000140 0001.83
CO N S T A N T IM P R O V E M E N T IN L I F E EX P E C T A N C Y ( h i g h a s s u m p t i o n )
%%'000'000'000'000'000SeriesNIMNOM
BrisbaneNOMAust.TFR
2041–
2051
2004–
201120512021201120062005
GROWTHRATE(a)AT 30 JUNE
PROJECTED POPULAT ION, Vary ing component leve l s —Brisbane co n t i n u e d5.17 . . . . . . . .
A B S • P O P U L A T I O N P R O J E C T I O N S , A U S T R A L I A • 3 2 2 2 . 0 • 2 0 0 4 T O 2 1 0 1 10 7
CH A P T E R 5 • D E T A I L E D T A B L E S

(a) Average annual growth rate.
–0.11.12 604.22 461.22 279.02 168.72 141.27212 000 0.11.32 851.22 546.72 309.02 172.72 142.27117 000 0.21.53 099.92 633.62 340.12 177.72 144.27022 00000
0.21.42 966.02 578.02 325.42 182.52 148.454(C)12 000 0.31.63 216.92 663.72 355.52 186.52 149.45317 000 0.51.83 469.82 750.82 386.62 191.52 151.45222 0006 00080 000
0.31.53 116.02 623.42 340.82 184.92 149.23612 000 0.41.73 368.22 709.22 370.82 188.92 150.23517 000 0.61.93 622.42 796.42 402.02 193.92 152.23422 0008 500110 000
0.41.63 267.92 671.02 358.12 188.82 151.01812 000 0.51.83 521.32 756.92 388.12 192.82 152.01717 000 0.62.03 776.52 844.12 419.22 197.82 154.01622 00011 000140 0001.59
0.11.12 751.22 494.32 286.22 169.72 141.76612 000 0.21.33 008.02 580.82 316.32 173.72 142.76517 000 0.41.53 266.52 668.72 347.52 178.82 144.76422 00000
0.41.43 126.62 612.72 332.82 183.52 148.84812 000 0.51.63 387.22 699.42 362.92 187.62 149.84717 000 0.61.83 649.92 787.52 394.12 192.62 151.84622 0006 00080 000
0.51.53 282.42 658.82 348.32 185.92 149.63012 000 0.61.73 544.32 745.62 378.42 190.02 150.629(B)17 000 0.71.93 808.22 833.82 409.62 195.02 152.62822 0008 500110 000
0.61.63 440.22 707.12 365.62 189.92 151.41212 000 0.71.83 703.22 794.02 395.72 193.92 152.41117 000 0.82.03 968.42 882.22 426.92 198.92 154.41022 00011 000140 0001.80
0.21.22 904.32 527.42 294.12 171.02 142.26012 000 0.41.43 170.82 614.82 324.22 175.12 143.25917 000 0.61.63 439.52 703.72 355.52 180.12 145.25822 00000
0.51.53 293.22 647.42 340.92 184.92 149.34212 000 0.71.73 563.72 735.02 371.02 188.92 150.34117 000 0.81.93 836.42 824.12 402.32 193.92 152.34022 0006 00080 000
0.61.63 454.92 694.12 356.42 187.32 150.12412 000 0.71.83 726.72 781.92 386.52 191.32 151.12317 000 0.92.04 000.62 871.02 417.82 196.32 153.12222 0008 500110 000
0.71.73 618.62 743.12 373.72 191.22 151.9612 000 0.81.93 891.62 830.92 403.92 195.22 152.9517 000 0.92.14 166.82 920.22 435.22 200.32 154.9422 00011 000140 0002.01
DE C L I N I N G IM P R O V E M E N T IN L I F E EX P E C T A N C Y (m e d i u m a s s u m p t i o n )
%%'000'000'000'000'000SeriesNIMNOM
Bal. of QldNOMAust.TFR
2041–
2051
2004–
201120512021201120062005
GROWTHRATE(a)AT 30 JUNE
PROJECTED POPULAT ION, Vary ing component leve l s —Balance of Queens land5.18 . . . .
10 8 A B S • P O P U L A T I O N P R O J E C T I O N S , A U S T R A L I A • 3 2 2 2 . 0 • 2 0 0 4 T O 2 1 0 1
CH A P T E R 5 • D E T A I L E D T A B L E S

(a) Average annual growth rate.
0.21.12 791.62 470.02 279.02 168.72 141.26912 000 0.31.33 047.92 555.72 309.02 172.72 142.26817 000 0.51.53 305.92 642.72 340.12 177.72 144.26722 00000
0.51.43 158.92 586.92 325.42 182.52 148.45112 000 0.61.63 418.82 672.82 355.52 186.52 149.45017 000 0.71.83 680.52 760.02 386.62 191.52 151.44922 0006 00080 000
0.61.53 311.42 632.42 340.82 184.92 149.23312 000 0.71.73 572.52 718.32 370.82 188.92 150.23217 000 0.81.93 835.42 805.62 402.02 193.92 152.23122 0008 500110 000
0.61.63 466.02 680.02 358.12 188.82 151.01512 000 0.81.83 728.12 766.02 388.12 192.82 152.01417 000 0.92.03 992.12 853.42 419.22 197.82 154.01322 00011 000140 0001.59
0.31.12 938.82 503.12 286.22 169.72 141.76312 000 0.51.33 204.82 589.82 316.32 173.72 142.76217 000 0.61.53 472.32 677.82 347.52 178.82 144.76122 00000
0.61.43 319.82 621.62 332.82 183.52 148.84512 000 0.71.63 589.22 708.52 362.92 187.62 149.84417 000 0.91.83 860.62 796.72 394.12 192.62 151.84322 0006 00080 000
0.71.53 478.22 667.82 348.32 185.92 149.62712 000 0.81.73 748.82 754.72 378.42 190.02 150.62617 000 0.91.94 021.42 843.02 409.62 195.02 152.62522 0008 500110 000
0.81.63 638.72 716.12 365.62 189.92 151.4912 000 0.91.83 910.42 803.12 395.72 193.92 152.4817 000 1.02.04 184.12 891.52 426.92 198.92 154.4722 00011 000140 0001.80
0.51.23 092.22 536.22 294.12 171.02 142.25712 000 0.61.43 367.72 623.82 324.22 175.12 143.25617 000 0.81.63 645.22 712.82 355.52 180.12 145.25522 00000
0.71.53 486.82 656.32 340.92 184.92 149.33912 000 0.91.73 766.02 744.12 371.02 188.92 150.33817 000 1.01.94 047.22 833.32 402.32 193.92 152.33722 0006 00080 000
0.81.63 651.12 703.12 356.42 187.32 150.12112 000 1.01.83 931.52 791.02 386.52 191.32 151.12017 000 1.12.04 214.02 880.22 417.82 196.32 153.11922 0008 500110 000
0.91.73 817.72 752.12 373.72 191.22 151.9312 000 1.01.94 099.12 840.02 403.92 195.22 152.9217 000 1.12.14 382.82 929.42 435.22 200.32 154.91(A)22 00011 000140 0002.01
CO N S T A N T IM P R O V E M E N T IN L I F E EX P E C T A N C Y ( h i g h a s s u m p t i o n )
%%'000'000'000'000'000SeriesNIMNOM
Bal. of QldNOMAust.TFR
2041–
2051
2004–
201120512021201120062005
GROWTHRATE(a)AT 30 JUNE
PROJECTED POPULAT ION, Vary ing component leve l s —Balance of Queens land
co n t i n u e d5.18 . . . . . . . . . . . . . . . . . . . . . . . . . . . . . . . . . . . . . . . . . . . . . . . . . . . . . . . . . . . . . . . . .
A B S • P O P U L A T I O N P R O J E C T I O N S , A U S T R A L I A • 3 2 2 2 . 0 • 2 0 0 4 T O 2 1 0 1 10 9
CH A P T E R 5 • D E T A I L E D T A B L E S

(a) Estimated resident population, base population.
2 966.03 544.34 382.82 778.13 354.74 202.05 744.16 899.08 584.820512 962.53 525.64 336.22 767.03 328.04 147.15 729.56 853.68 483.320502 958.73 506.64 289.62 755.63 300.94 092.25 714.36 807.68 381.820492 954.53 487.34 243.02 743.73 273.64 037.45 698.26 760.98 280.420482 949.83 467.64 196.22 731.53 246.13 982.85 681.26 713.78 179.02047
2 944.53 447.54 149.32 718.83 218.33 928.25 663.46 665.78 077.520462 938.83 426.94 102.42 705.73 190.13 873.85 644.56 617.07 976.220452 932.53 405.94 055.32 692.13 161.73 819.65 624.66 567.67 874.920442 925.53 384.44 008.22 678.13 132.93 765.55 603.66 517.47 773.720432 917.93 362.43 961.02 663.53 103.93 711.55 581.46 466.37 672.62042
2 909.63 339.93 913.82 648.53 074.53 657.85 558.16 414.47 571.620412 900.63 316.83 866.52 632.93 044.73 604.25 533.56 361.57 470.620402 890.93 293.13 819.02 616.73 014.63 550.75 507.66 307.77 369.720392 880.33 268.73 771.42 600.12 984.03 497.35 480.46 252.87 268.720382 869.03 243.73 723.72 582.82 953.13 444.05 451.86 196.87 167.72037
2 856.83 218.03 675.82 565.02 921.73 390.75 421.86 139.77 066.520362 843.83 191.53 627.62 546.62 889.83 337.55 390.36 081.36 965.120352 829.93 164.33 579.22 527.62 857.53 284.25 357.46 021.86 863.520342 815.13 136.23 530.62 508.02 824.83 231.05 323.15 961.06 761.620332 799.43 107.43 481.62 487.82 791.53 177.85 287.35 899.06 659.42032
2 782.93 077.83 432.32 467.22 757.93 124.55 250.15 835.76 556.920312 765.53 047.53 382.82 446.02 723.83 071.35 211.55 771.26 454.120302 747.43 016.43 333.02 424.32 689.23 018.15 171.75 705.66 351.120292 728.42 984.53 283.02 402.22 654.42 964.95 130.65 638.96 247.920282 708.72 952.03 232.72 379.72 619.22 911.95 088.45 571.26 144.62027
2 688.32 918.83 182.42 356.82 583.72 859.05 045.15 502.66 041.320262 667.32 885.13 131.92 333.62 548.02 806.25 000.95 433.15 938.120252 645.72 850.93 081.32 310.12 512.12 753.74 955.85 362.95 835.020242 623.62 816.23 030.72 286.42 476.02 701.34 910.05 292.25 732.020232 601.02 781.12 980.02 262.52 439.92 649.24 863.45 220.95 629.32022
2 578.02 745.62 929.42 238.32 403.62 597.44 816.35 149.25 526.920212 554.62 709.82 878.92 214.02 367.32 545.94 768.65 077.15 424.820202 530.82 673.82 828.52 189.62 330.92 494.74 720.45 004.75 323.220192 506.82 637.62 778.22 165.02 294.62 443.94 671.84 932.15 222.020182 482.42 601.12 728.22 140.32 258.12 393.34 622.64 859.25 121.52017
2 457.52 564.42 678.52 115.12 221.52 343.24 572.54 785.95 021.720162 432.02 527.52 629.22 089.52 184.92 293.64 521.54 712.34 922.820152 406.12 490.42 580.22 063.72 148.12 244.34 469.74 638.64 824.520142 379.72 453.22 531.52 037.42 111.42 195.44 417.14 564.64 726.920132 352.82 415.92 483.22 010.82 074.62 146.94 363.64 490.44 630.12012
2 325.42 378.42 435.21 983.92 037.72 098.84 309.34 416.04 534.020112 297.62 340.72 387.51 956.62 000.72 051.04 254.24 341.44 438.520102 269.52 303.02 340.11 928.91 963.82 003.54 198.44 266.84 343.720092 240.92 265.32 293.11 901.11 926.91 956.44 142.04 192.24 249.520082 212.02 227.62 246.31 872.91 890.01 909.64 084.94 117.54 155.92007
2 182.52 190.02 200.31 844.11 853.51 864.04 026.64 043.44 064.220062 148.42 150.62 154.91 812.91 816.31 820.23 961.23 966.93 975.220052 110.42 110.42 110.41 777.71 777.71 777.73 888.13 888.13 888.12004(a)
'000'000'000'000'000'000'000'000'000
Series CSeries BSeries ASeries CSeries BSeries ASeries CSeries BSeries A
BALANCE OF QUEENSLANDBRISBANETOTAL QUEENSLAND
At 30 June
PROJECTED POPULAT ION, By cap i ta l ci t y /ba lance of sta te —Queens land5.19 . . . . . . . . .
11 0 A B S • P O P U L A T I O N P R O J E C T I O N S , A U S T R A L I A • 3 2 2 2 . 0 • 2 0 0 4 T O 2 1 0 1
CH A P T E R 5 • D E T A I L E D T A B L E S

(a) Average annual growth rate.
–0.80.21 360.01 564.51 555.71 539.61 535.972–500 –1.00.11 255.51 528.91 542.71 537.11 534.971–2 500 –1.30.01 150.11 492.71 529.21 534.11 533.970–4 50000
–0.40.41 537.51 620.71 578.01 546.41 539.554(C)–500 –0.60.31 432.01 585.11 565.01 543.91 538.553–2 500 –0.80.21 325.81 548.91 551.41 540.81 537.552–4 5002 80080 000
–0.30.51 601.81 639.81 584.51 547.41 539.836–500 –0.50.41 495.91 604.21 571.51 544.91 538.835–2 500 –0.70.21 389.41 568.01 557.91 541.91 537.834–4 5003 900110 000
–0.20.51 666.61 659.81 591.81 549.21 540.618–500 –0.40.41 560.51 624.21 578.81 546.61 539.617–2 500 –0.50.31 453.71 588.01 565.21 543.61 538.616–4 5004 900140 0001.46
–0.60.31 439.61 584.91 560.31 540.31 536.266–500 –0.80.11 331.01 548.91 547.21 537.81 535.265–2 500 –1.00.01 221.61 512.31 533.71 534.81 534.264–4 50000
–0.30.51 623.81 641.81 582.61 547.11 539.748–500 –0.40.31 514.31 605.81 569.61 544.61 538.747–2 500 –0.60.21 404.11 569.21 556.01 541.51 537.746–4 5002 80080 000
–0.10.51 690.61 661.21 589.21 548.11 540.130–500 –0.30.41 580.71 625.21 576.11 545.61 539.129(B)–2 500 –0.50.31 470.31 588.61 562.61 542.61 538.128–4 5003 900110 000
0.00.61 757.91 681.61 596.51 549.91 540.912–500 –0.20.51 647.81 645.51 583.41 547.31 539.911–2 500 –0.40.31 537.01 608.91 569.91 544.31 538.910–4 5004 900140 0001.66
–0.40.31 522.11 605.21 565.21 541.11 536.560–500 –0.60.21 409.41 568.81 552.21 538.61 535.559–2 500 –0.80.11 295.81 531.81 538.61 535.61 534.558–4 50000
–0.10.51 713.01 662.91 587.71 547.91 540.142–500 –0.20.41 599.41 626.51 574.61 545.41 539.141–2 500 –0.40.31 485.11 589.41 561.01 542.41 538.140–4 5002 80080 000
0.00.61 782.21 682.61 594.21 549.01 540.424–500 –0.10.41 668.31 646.21 581.21 546.51 539.423–2 500 –0.30.31 553.71 609.11 567.61 543.51 538.422–4 5003 900110 000
0.10.61 851.91 703.21 601.61 550.71 541.26–500 0.00.51 737.81 666.81 588.51 548.21 540.25–2 500
–0.20.41 623.01 629.71 574.91 545.21 539.24–4 5004 900140 0001.86
DE C L I N I N G IM P R O V E M E N T IN L I F E EX P E C T A N C Y (m e d i u m a s s u m p t i o n )
%%'000'000'000'000'000SeriesNIMNOM
SANOMAust.TFR
2041–
2051
2004–
201120512021201120062005
GROWTHRATE(a)AT 30 JUNE
PROJECTED POPULAT ION, Vary ing component leve l s —South Aust ra l i a5.20 . . . . . . . . . . .
A B S • P O P U L A T I O N P R O J E C T I O N S , A U S T R A L I A • 3 2 2 2 . 0 • 2 0 0 4 T O 2 1 0 1 11 1
CH A P T E R 5 • D E T A I L E D T A B L E S

(a) Average annual growth rate.
–0.40.21 474.91 570.71 555.71 539.61 535.969–500 –0.60.11 366.81 535.01 542.71 537.11 534.968–2 500 –0.90.01 258.01 498.81 529.21 534.11 533.967–4 50000
–0.10.41 654.61 626.81 578.01 546.41 539.551–500 –0.30.31 545.71 591.21 565.01 543.91 538.550–2 500 –0.50.21 436.11 554.91 551.41 540.81 537.549–4 5002 80080 000
0.00.51 719.71 646.01 584.51 547.41 539.833–500 –0.20.41 610.51 610.31 571.51 544.91 538.832–2 500 –0.30.21 500.71 574.01 557.91 541.91 537.831–4 5003 900110 000
0.10.51 785.51 666.01 591.81 549.21 540.615–500 –0.10.41 676.01 630.31 578.81 546.61 539.614–2 500 –0.20.31 566.01 594.11 565.21 543.61 538.613–4 5004 900140 0001.46
–0.30.31 554.91 591.01 560.31 540.31 536.263–500 –0.50.11 442.81 555.01 547.21 537.81 535.262–2 500 –0.70.01 330.01 518.41 533.71 534.81 534.261–4 50000
0.00.51 741.21 648.01 582.61 547.11 539.745–500 –0.10.31 628.41 611.91 569.61 544.61 538.744–2 500 –0.30.21 514.91 575.31 556.01 541.51 537.743–4 5002 80080 000
0.10.51 808.81 667.41 589.21 548.11 540.127–500 0.00.41 695.71 631.31 576.11 545.61 539.126–2 500
–0.20.31 581.91 594.71 562.61 542.61 538.125–4 5003 900110 000
0.20.61 877.11 687.81 596.51 549.91 540.99–500 0.10.51 763.71 651.71 583.41 547.31 539.98–2 500
–0.10.31 649.61 614.91 569.91 544.31 538.97–4 5004 900140 0001.66
–0.10.31 637.71 611.31 565.21 541.11 536.557–500 –0.30.21 521.51 574.91 552.21 538.61 535.556–2 500 –0.50.11 404.61 537.91 538.61 535.61 534.555–4 50000
0.20.51 830.71 669.11 587.71 547.91 540.139–500 0.00.41 713.91 632.61 574.61 545.41 539.138–2 500
–0.10.31 596.31 595.51 561.01 542.41 538.137–4 5002 80080 000
0.30.61 900.71 688.71 594.21 549.01 540.421–500 0.10.41 783.61 652.31 581.21 546.51 539.420–2 500 0.00.31 665.81 615.21 567.61 543.51 538.419–4 5003 900110 000
0.40.61 971.41 709.41 601.61 550.71 541.23–500 0.20.51 854.11 672.91 588.51 548.21 540.22–2 500 0.10.41 736.11 635.81 574.91 545.21 539.21(A)–4 5004 900140 0001.86
CO N S T A N T IM P R O V E M E N T IN L I F E EX P E C T A N C Y ( h i g h a s s u m p t i o n )
%%'000'000'000'000'000SeriesNIMNOM
SANOMAust.TFR
2041–
2051
2004–
201120512021201120062005
GROWTHRATE(a)AT 30 JUNE
PROJECTED POPULAT ION, Vary ing component leve l s —South Aust ra l i a co n t i n u e d5.20 . .
11 2 A B S • P O P U L A T I O N P R O J E C T I O N S , A U S T R A L I A • 3 2 2 2 . 0 • 2 0 0 4 T O 2 1 0 1
CH A P T E R 5 • D E T A I L E D T A B L E S

(a) Average annual growth rate.
–0.80.1970.21 132.81 133.91 126.11 124.372–1 000 –1.00.0917.31 114.81 127.11 124.61 123.871–2 000 –1.2–0.1838.41 088.61 117.81 123.11 123.370–3 50000
–0.40.41 138.51 186.91 155.41 132.61 127.754(C)–1 000 –0.50.31 085.21 168.91 148.61 131.11 127.253–2 000 –0.70.21 005.81 142.61 139.31 129.61 126.752–3 5002 70080 000
–0.20.51 195.01 203.91 161.21 133.61 128.036–1 000 –0.40.41 141.51 185.91 154.51 132.11 127.535–2 000 –0.50.31 061.91 159.71 145.11 130.61 127.034–3 5003 700110 000
–0.10.61 252.01 221.81 167.71 135.11 128.818–1 000 –0.20.51 198.41 203.81 161.01 133.61 128.317–2 000 –0.40.41 118.71 177.51 151.61 132.11 127.816–3 5004 600140 0001.37
–0.60.21 026.11 147.41 137.21 126.61 124.566–1 000 –0.80.1971.21 129.11 130.41 125.11 124.065–2 000 –1.00.0889.51 102.71 121.11 123.61 123.564–3 50000
–0.20.41 200.81 202.21 158.71 133.11 127.948–1 000 –0.30.41 145.61 184.01 152.01 131.61 127.447–2 000 –0.50.21 063.31 157.41 142.61 130.11 126.946–3 5002 70080 000
–0.10.51 259.31 219.51 164.61 134.11 128.230–1 000 –0.20.41 203.91 201.31 157.81 132.61 127.729(B)–2 000 –0.40.31 121.51 174.71 148.51 131.11 127.228–3 5003 700110 000
0.00.61 318.51 237.61 171.11 135.61 129.012–1 000 –0.10.51 263.11 219.41 164.41 134.11 128.511–2 000 –0.20.41 180.51 192.81 155.01 132.61 128.010–3 5004 600140 0001.55
–0.50.21 083.81 161.91 140.71 127.21 124.860–1 000 –0.60.11 027.01 143.51 134.01 125.71 124.359–2 000 –0.80.0942.21 116.71 124.61 124.21 123.858–3 50000
0.00.51 264.91 217.41 162.41 133.71 128.242–1 000 –0.20.41 207.81 199.01 155.61 132.21 127.741–2 000 –0.30.31 122.61 172.21 146.21 130.71 127.240–3 5002 70080 000
0.10.61 325.51 234.91 168.21 134.71 128.524–1 000 0.00.51 268.31 216.61 161.51 133.21 128.023–2 000
–0.20.41 182.91 189.71 152.11 131.71 127.522–3 5003 700110 000
0.20.61 386.91 253.31 174.81 136.21 129.26–1 000 0.10.61 329.61 234.91 168.01 134.71 128.75–2 000
–0.10.41 244.01 208.11 158.71 133.21 128.24–3 5004 600140 0001.74
DE C L I N I N G IM P R O V E M E N T IN L I F E EX P E C T A N C Y (m e d i u m a s s u m p t i o n )
%%'000'000'000'000'000SeriesNIMNOM
AdelaideNOMAust.TFR
2041–
2051
2004–
201120512021201120062005
GROWTHRATE(a)AT 30 JUNE
PROJECTED POPULAT ION, Vary ing component leve l s —Adela ide5.21 . . . . . . . . . . . . . . . . .
A B S • P O P U L A T I O N P R O J E C T I O N S , A U S T R A L I A • 3 2 2 2 . 0 • 2 0 0 4 T O 2 1 0 1 11 3
CH A P T E R 5 • D E T A I L E D T A B L E S

(a) Average annual growth rate.
–0.50.11 051.21 137.21 133.91 126.11 124.369–1 000 –0.60.0996.81 119.21 127.11 124.61 123.868–2 000 –0.9–0.1915.51 093.01 117.81 123.11 123.367–3 50000
–0.10.41 222.41 191.31 155.41 132.61 127.751–1 000 –0.20.31 167.81 173.31 148.61 131.11 127.250–2 000 –0.40.21 086.11 147.01 139.31 129.61 126.749–3 5002 70080 000
0.00.51 279.81 208.41 161.21 133.61 128.033–1 000 –0.10.41 225.01 190.41 154.51 132.11 127.532–2 000 –0.20.31 143.11 164.11 145.11 130.61 127.031–3 5003 700110 000
0.10.61 337.81 226.31 167.71 135.11 128.815–1 000 0.10.51 283.01 208.21 161.01 133.61 128.314–2 000
–0.10.41 200.91 181.91 151.61 132.11 127.813–3 5004 600140 0001.37
–0.30.21 107.31 151.81 137.21 126.61 124.563–1 000 –0.50.11 051.01 133.61 130.41 125.11 124.062–2 000 –0.70.0966.81 107.01 121.11 123.61 123.561–3 50000
0.10.41 284.91 206.61 158.71 133.11 127.945–1 000 0.00.41 228.41 188.41 152.01 131.61 127.444–2 000
–0.20.21 143.81 161.81 142.61 130.11 126.943–3 5002 70080 000
0.20.51 344.41 223.91 164.61 134.11 128.227–1 000 0.10.41 287.81 205.71 157.81 132.61 127.726–2 000
–0.10.31 203.01 179.11 148.51 131.11 127.225–3 5003 700110 000
0.30.61 404.61 242.01 171.11 135.61 129.09–1 000 0.20.51 347.91 223.81 164.41 134.11 128.58–2 000 0.00.41 263.01 197.21 155.01 132.61 128.07–3 5004 600140 0001.55
–0.20.21 165.21 166.31 140.71 127.21 124.857–1 000 –0.30.11 107.01 147.91 134.01 125.71 124.356–2 000 –0.50.01 019.91 121.11 124.61 124.21 123.855–3 50000
0.20.51 349.21 221.91 162.41 133.71 128.239–1 000 0.10.41 290.81 203.51 155.61 132.21 127.738–2 000
–0.10.31 203.31 176.61 146.21 130.71 127.237–3 5002 70080 000
0.30.61 410.71 239.41 168.21 134.71 128.521–1 000 0.20.51 352.31 221.01 161.51 133.21 128.020–2 000 0.10.41 264.71 194.11 152.11 131.71 127.519–3 5003 700110 000
0.40.61 473.21 257.81 174.81 136.21 129.23–1 000 0.30.61 414.61 239.31 168.01 134.71 128.72–2 000 0.20.41 326.81 212.51 158.71 133.21 128.21(A)–3 5004 600140 0001.74
CO N S T A N T IM P R O V E M E N T IN L I F E EX P E C T A N C Y ( h i g h a s s u m p t i o n )
%%'000'000'000'000'000SeriesNIMNOM
AdelaideNOMAust.TFR
2041–
2051
2004–
201120512021201120062005
GROWTHRATE(a)AT 30 JUNE
PROJECTED POPULAT ION, Vary ing component leve l s —Adela ide co n t i n u e d5.21 . . . . . . . .
11 4 A B S • P O P U L A T I O N P R O J E C T I O N S , A U S T R A L I A • 3 2 2 2 . 0 • 2 0 0 4 T O 2 1 0 1
CH A P T E R 5 • D E T A I L E D T A B L E S

(a) Average annual growth rate.
–0.70.4389.7431.7421.8413.5411.672500 –1.00.2338.2414.1415.6412.5411.171–500 –1.30.1311.6404.2411.4411.0410.670–1 00000
–0.60.5399.0433.8422.6413.8411.754(C)500 –0.90.2346.8416.2416.4412.8411.253–500 –1.20.1319.9406.2412.2411.2410.752–1 0008080 000
–0.50.5406.8435.9423.3413.9411.836500 –0.90.3354.4418.3417.0412.9411.335–500 –1.10.1327.5408.3412.8411.4410.834–1 000190110 000
–0.50.5414.6438.1424.1414.1411.918500 –0.80.3362.0420.4417.8413.0411.417–500 –1.00.1335.0410.5413.6411.5410.916–1 000290140 0001.75
–0.50.5413.5437.5423.1413.7411.666500 –0.80.3359.8419.7416.8412.7411.165–500 –1.00.1332.2409.6412.6411.2410.664–1 00000
–0.40.5423.0439.6423.9414.0411.848500 –0.70.3368.7421.8417.6412.9411.347–500 –0.90.1340.8411.7413.4411.4410.846–1 0008080 000
–0.30.5431.2441.8424.6414.1411.830500 –0.70.3376.8424.0418.3413.1411.329(B)–500 –0.90.2348.7413.9414.1411.6410.828–1 000190110 000
–0.30.5439.4444.0425.4414.2411.912500 –0.60.3384.6426.2419.1413.2411.411–500 –0.80.2356.5416.1414.9411.7410.910–1 000290140 0001.99
–0.30.5438.3443.3424.5413.9411.760500 –0.60.3382.4425.3418.2412.9411.259–500 –0.80.2353.6415.1414.0411.4410.758–1 00000
–0.20.5448.1445.5425.3414.2411.942500 –0.50.3391.6427.5419.0413.2411.441–500 –0.70.2362.5417.3414.8411.7410.940–1 0008080 000
–0.10.6456.7447.6426.0414.3411.924500 –0.50.4400.0429.6419.7413.3411.423–500 –0.70.2370.8419.4415.5411.8410.922–1 000190110 000
–0.10.6465.1449.9426.8414.5412.06500 –0.40.4408.3431.9420.5413.5411.55–500 –0.60.2379.0421.6416.2412.0411.04–1 000290140 0002.22
DE C L I N I N G IM P R O V E M E N T IN L I F E EX P E C T A N C Y (m e d i u m a s s u m p t i o n )
%%'000'000'000'000'000SeriesNIMNOM
Bal. of SANOMAust.TFR
2041–
2051
2004–
201120512021201120062005
GROWTHRATE(a)AT 30 JUNE
PROJECTED POPULAT ION, Vary ing component leve l s —Balance of South Aust ra l i a5.22
A B S • P O P U L A T I O N P R O J E C T I O N S , A U S T R A L I A • 3 2 2 2 . 0 • 2 0 0 4 T O 2 1 0 1 11 5
CH A P T E R 5 • D E T A I L E D T A B L E S

(a) Average annual growth rate.
–0.30.4423.7433.4421.8413.5411.669500 –0.60.2370.1415.8415.6412.5411.168–500 –0.80.1342.5405.8411.4411.0410.667–1 00000
–0.20.5432.1435.5422.6413.8411.751500 –0.60.2377.9417.9416.4412.8411.250–500 –0.80.1350.0407.9412.2411.2410.749–1 0008080 000
–0.20.5439.9437.6423.3413.9411.833500 –0.50.3385.4420.0417.0412.9411.332–500 –0.70.1357.6410.0412.8411.4410.831–1 000190110 000
–0.10.5447.6439.8424.1414.1411.915500 –0.50.3393.1422.1417.8413.0411.414–500 –0.60.1365.0412.1413.6411.5410.913–1 000290140 0001.75
–0.10.5447.6439.2423.1413.7411.663500 –0.50.3391.8421.4416.8412.7411.162–500 –0.70.1363.2411.4412.6411.2410.661–1 00000
–0.10.5456.3441.4423.9414.0411.845500 –0.40.3400.0423.6417.6412.9411.344–500 –0.60.1371.1413.4413.4411.4410.843–1 0008080 000
0.00.5464.4443.5424.6414.1411.827500 –0.30.3407.9425.6418.3413.1411.326–500 –0.50.2378.9415.5414.1411.6410.825–1 000190110 000
0.00.5472.5445.7425.4414.2411.99500 –0.30.3415.8427.9419.1413.2411.48–500 –0.50.2386.7417.7414.9411.7410.97–1 000290140 0001.99
0.00.5472.5445.0424.5413.9411.757500 –0.30.3414.5427.0418.2412.9411.256–500 –0.50.2384.7416.8414.0411.4410.755–1 00000
0.10.5481.5447.2425.3414.2411.939500 –0.20.3423.0429.2419.0413.2411.438–500 –0.40.2393.0418.9414.8411.7410.937–1 0008080 000
0.20.6490.0449.4426.0414.3411.921500 –0.20.4431.3431.3419.7413.3411.420–500 –0.30.2401.2421.1415.5411.8410.919–1 000190110 000
0.20.6498.2451.6426.8414.5412.03500 –0.10.4439.5433.6420.5413.5411.52–500 –0.30.2409.3423.3416.2412.0411.01(A)–1 000290140 0002.22
CO N S T A N T IM P R O V E M E N T IN L I F E EX P E C T A N C Y ( h i g h a s s u m p t i o n )
%%'000'000'000'000'000SeriesNIMNOM
Bal. of SANOMAust.TFR
2041–
2051
2004–
201120512021201120062005
GROWTHRATE(a)AT 30 JUNE
PROJECTED POPULAT ION, Vary ing component leve l s —Balance of South Aust ra l i a
co n t i n u e d5.22 . . . . . . . . . . . . . . . . . . . . . . . . . . . . . . . . . . . . . . . . . . . . . . . . . . . . . . . . . . . . . . . . .
11 6 A B S • P O P U L A T I O N P R O J E C T I O N S , A U S T R A L I A • 3 2 2 2 . 0 • 2 0 0 4 T O 2 1 0 1
CH A P T E R 5 • D E T A I L E D T A B L E S

(a) Estimated resident population, base population.
399.0376.8409.31 138.51 203.91 326.81 537.51 580.71 736.12051401.6379.6410.61 143.51 206.71 324.51 545.11 586.21 735.12050404.2382.3411.91 148.41 209.41 322.21 552.61 591.71 734.12049406.7385.1413.11 153.21 211.91 319.81 559.91 597.01 732.92048409.2387.8414.31 157.81 214.51 317.41 567.01 602.21 731.72047
411.6390.4415.51 162.31 216.91 314.81 574.01 607.31 730.32046414.0393.0416.61 166.71 219.21 312.21 580.71 612.21 728.82045416.3395.6417.61 170.91 221.41 309.61 587.11 616.91 727.22044418.5398.1418.61 174.81 223.41 306.81 593.31 621.41 725.52043420.6400.5419.61 178.61 225.21 304.01 599.11 625.71 723.62042
422.6402.8420.51 182.11 226.91 301.21 604.61 629.71 721.72041424.4405.0421.41 185.31 228.41 298.21 609.81 633.41 719.52040426.2407.2422.21 188.31 229.61 295.11 614.51 636.81 717.22039427.8409.2422.91 191.01 230.61 291.91 618.81 639.91 714.82038429.3411.2423.51 193.31 231.41 288.51 622.71 642.51 712.12037
430.7413.0424.11 195.41 231.81 285.01 626.11 644.81 709.12036431.9414.7424.61 197.11 231.91 281.31 629.01 646.61 705.92035433.0416.2425.11 198.41 231.71 277.41 631.31 647.91 702.52034433.9417.6425.41 199.41 231.21 273.31 633.21 648.81 698.72033434.6418.9425.71 200.01 230.31 269.11 634.61 649.21 694.72032
435.2420.0425.81 200.21 229.01 264.61 635.41 649.01 690.42031435.7421.0425.91 200.11 227.51 259.91 635.81 648.51 685.82030436.0421.8425.91 199.71 225.61 255.11 635.61 647.41 681.02029436.1422.5425.81 198.91 223.41 250.11 635.11 645.91 675.92028436.1423.1425.71 197.91 220.91 245.01 634.11 644.01 670.72027
436.0423.5425.51 196.61 218.21 239.71 632.61 641.71 665.22026435.8423.8425.21 195.01 215.21 234.41 630.81 639.01 659.62025435.4424.0424.81 193.31 212.01 229.01 628.71 636.01 653.82024435.0424.1424.41 191.31 208.61 223.61 626.31 632.71 647.92023434.4424.1423.91 189.21 205.01 218.01 623.61 629.11 641.92022
433.8424.0423.31 186.91 201.31 212.51 620.71 625.21 635.82021433.1423.7422.71 184.41 197.41 206.91 617.51 621.11 629.62020432.3423.4422.11 181.81 193.41 201.31 614.11 616.81 623.42019431.4423.1421.41 179.21 189.31 195.81 610.61 612.41 617.22018430.4422.6420.71 176.41 185.11 190.21 606.81 607.71 610.92017
429.4422.0420.01 173.31 180.81 184.81 602.71 602.91 604.82016428.2421.4419.31 170.11 176.41 179.51 598.31 597.81 598.72015426.9420.7418.51 166.71 171.91 174.21 593.61 592.61 592.72014425.6420.0417.81 163.11 167.31 169.01 588.71 587.31 586.82013424.2419.2417.01 159.31 162.61 163.81 583.51 581.81 580.82012
422.6418.3416.21 155.41 157.81 158.71 578.01 576.11 574.92011421.0417.4415.51 151.21 152.91 153.61 572.21 570.31 569.02010419.3416.4414.61 146.81 147.91 148.51 566.21 564.31 563.12009417.6415.3413.81 142.31 142.91 143.41 559.91 558.21 557.12008415.7414.2412.91 137.61 137.81 138.31 553.41 552.01 551.12007
413.8413.1412.01 132.61 132.61 133.21 546.41 545.61 545.22006411.7411.3411.01 127.71 127.71 128.21 539.51 539.11 539.22005409.5409.5409.51 123.21 123.21 123.21 532.71 532.71 532.72004(a)
'000'000'000'000'000'000'000'000'000
Series CSeries BSeries ASeries CSeries BSeries ASeries CSeries BSeries A
BALANCE OFSOUTH AUSTRALIAADELAIDETOTAL SOUTH AUSTRALIA
At 30 June
PROJECTED POPULAT ION, By cap i ta l ci t y /ba lance of state —South Aust ra l i a5.23 . . . . .
A B S • P O P U L A T I O N P R O J E C T I O N S , A U S T R A L I A • 3 2 2 2 . 0 • 2 0 0 4 T O 2 1 0 1 11 7
CH A P T E R 5 • D E T A I L E D T A B L E S

(a) Average annual growth rate.
–0.60.51 928.22 114.22 055.12 004.91 992.272–1 000 –0.40.72 117.82 176.42 077.02 008.41 993.2712 500 –0.30.82 227.72 212.72 090.12 010.91 994.2704 50000
0.11.12 578.62 328.92 141.82 031.62 006.154(C)–1 000 0.21.32 770.22 391.22 163.82 035.12 007.1532 500 0.31.42 881.42 427.52 176.92 037.62 008.1524 50011 00080 000
0.31.32 818.42 402.72 167.32 035.82 007.536–1 000 0.41.53 010.72 465.02 189.32 039.32 008.5352 500 0.51.53 122.32 501.42 202.32 041.82 009.5344 50015 200110 000
0.51.53 063.22 480.22 195.92 042.52 010.718–1 000 0.61.63 256.12 542.52 217.92 046.02 011.7172 500 0.61.73 368.02 578.92 230.92 048.62 012.7164 50019 300140 0001.48
–0.40.62 042.62 143.22 061.72 005.91 992.666–1 000 –0.20.72 239.22 206.22 083.72 009.41 993.6652 500 –0.10.82 353.22 242.92 096.82 011.91 994.6644 50000
0.21.22 716.42 360.52 148.72 032.62 006.548–1 000 0.41.32 915.22 423.52 170.72 036.12 007.5472 500 0.51.43 030.42 460.32 183.82 038.62 008.5464 50011 00080 000
0.41.42 965.12 435.32 174.32 036.82 007.930–1 000 0.61.53 164.52 498.42 196.32 040.32 008.929(B)2 500 0.61.63 280.12 535.22 209.42 042.82 009.9284 50015 200110 000
0.61.63 219.02 513.82 203.02 043.62 011.112–1 000 0.71.73 419.02 576.92 225.02 047.12 012.1112 500 0.81.83 535.02 613.72 238.12 049.62 013.1104 50019 300140 0001.67
–0.30.62 162.02 172.32 068.92 007.11 993.160–1 000 0.00.82 365.92 236.02 090.92 010.71 994.1592 500 0.10.92 484.02 273.12 104.12 013.21 995.1584 50000
0.41.22 859.72 392.12 156.22 033.82 007.042–1 000 0.51.43 065.72 455.92 178.22 037.42 008.0412 500 0.61.53 185.12 493.12 191.42 039.92 009.0404 50011 00080 000
0.61.43 117.52 467.82 181.82 038.12 008.424–1 000 0.71.63 324.12 531.62 203.92 041.62 009.4232 500 0.81.63 443.82 568.92 217.02 044.12 010.4224 50015 200110 000
0.81.63 380.72 547.32 210.62 044.82 011.66–1 000 0.91.73 587.92 611.22 232.72 048.32 012.652 500 0.91.83 707.92 648.52 245.82 050.92 013.644 50019 300140 0001.87
DE C L I N I N G IM P R O V E M E N T IN L I F E EX P E C T A N C Y (m e d i u m a s s u m p t i o n )
%%'000'000'000'000'000SeriesNIMNOM
WANOMAust.TFR
2041–
2051
2004–
201120512021201120062005
GROWTHRATE(a)AT 30 JUNE
PROJECTED POPULAT ION, Vary ing component leve ls —Weste rn Aust ra l i a5.24 . . . . . . . . .
11 8 A B S • P O P U L A T I O N P R O J E C T I O N S , A U S T R A L I A • 3 2 2 2 . 0 • 2 0 0 4 T O 2 1 0 1
CH A P T E R 5 • D E T A I L E D T A B L E S

(a) Average annual growth rate.
–0.30.52 079.32 121.22 055.12 004.91 992.269–1 000 –0.10.72 274.12 183.52 077.02 008.41 993.2682 500 0.00.82 386.92 219.82 090.12 010.91 994.2674 50000
0.41.12 743.12 336.12 141.82 031.62 006.151–1 000 0.51.32 939.92 398.52 163.82 035.12 007.1502 500 0.61.43 053.92 434.82 176.92 037.62 008.1494 50011 00080 000
0.51.32 987.52 409.92 167.32 035.82 007.533–1 000 0.71.53 184.82 472.32 189.32 039.32 008.5322 500 0.71.53 299.12 508.72 202.32 041.82 009.5314 50015 200110 000
0.71.53 236.92 487.52 195.92 042.52 010.715–1 000 0.81.63 434.82 549.92 217.92 046.02 011.7142 500 0.91.73 549.32 586.32 230.92 048.62 012.7134 50019 300140 0001.48
–0.10.62 194.12 150.32 061.72 005.91 992.663–1 000 0.10.72 395.82 213.32 083.72 009.41 993.6622 500 0.20.82 512.72 250.02 096.82 011.91 994.6614 50000
0.51.22 881.52 367.72 148.72 032.62 006.545–1 000 0.61.33 085.22 430.82 170.72 036.12 007.5442 500 0.71.43 203.22 467.62 183.82 038.62 008.5434 50011 00080 000
0.71.43 134.72 442.52 174.32 036.82 007.927–1 000 0.81.53 339.02 505.72 196.32 040.32 008.9262 500 0.81.63 457.42 542.52 209.42 042.82 009.9254 50015 200110 000
0.81.63 393.22 521.12 203.02 043.62 011.19–1 000 0.91.73 598.12 584.32 225.02 047.12 012.182 500 1.01.83 716.72 621.12 238.12 049.62 013.174 50019 300140 0001.67
0.00.62 313.92 179.32 068.92 007.11 993.157–1 000 0.20.82 522.82 243.12 090.92 010.71 994.1562 500 0.30.92 643.82 280.32 104.12 013.21 995.1554 50000
0.61.23 025.32 399.32 156.22 033.82 007.039–1 000 0.81.43 236.22 463.12 178.22 037.42 008.0382 500 0.81.53 358.42 500.42 191.42 039.92 009.0374 50011 00080 000
0.81.43 287.72 475.12 181.82 038.12 008.421–1 000 0.91.63 499.02 539.02 203.92 041.62 009.4202 500 1.01.63 621.52 576.32 217.02 044.12 010.4194 50015 200110 000
1.01.63 555.52 554.62 210.62 044.82 011.63–1 000 1.11.73 767.52 618.62 232.72 048.32 012.622 500 1.11.83 890.22 655.92 245.82 050.92 013.61(A)4 50019 300140 0001.87
CO N S T A N T IM P R O V E M E N T IN L I F E EX P E C T A N C Y ( h i g h a s s u m p t i o n )
%%'000'000'000'000'000SeriesNIMNOM
WANOMAust.TFR
2041–
2051
2004–
201120512021201120062005
GROWTHRATE(a)AT 30 JUNE
PROJECTED POPULAT ION, Vary ing component leve ls —Weste rn Aust ra l i a co n t i n u e d5.24
A B S • P O P U L A T I O N P R O J E C T I O N S , A U S T R A L I A • 3 2 2 2 . 0 • 2 0 0 4 T O 2 1 0 1 11 9
CH A P T E R 5 • D E T A I L E D T A B L E S

(a) Average annual growth rate.
–0.70.51 387.11 540.41 505.91 473.21 464.472–1 500 –0.40.61 525.41 584.51 521.01 475.21 464.9711 000 –0.30.71 581.71 602.51 527.31 476.21 465.4702 00000
0.21.32 017.61 749.41 590.21 498.91 477.754(C)–1 500 0.41.42 157.81 793.61 605.31 500.91 478.2531 000 0.41.52 214.81 811.61 611.61 501.91 478.7522 00010 80080 000
0.41.52 234.01 816.11 613.21 502.71 479.036–1 500 0.61.62 374.81 860.41 628.31 504.71 479.5351 000 0.61.72 431.91 878.41 634.61 505.71 480.0342 00014 500110 000
0.61.72 454.11 885.81 638.91 508.81 481.918–1 500 0.71.92 595.51 930.21 654.11 510.81 482.4171 000 0.81.92 652.71 948.21 660.31 511.81 482.9162 00018 200140 0001.39
–0.60.51 438.11 552.61 506.91 472.71 464.066–1 500 –0.30.61 579.01 597.01 522.01 474.71 464.5651 000 –0.20.71 635.31 614.91 528.21 475.71 465.0642 00000
0.31.32 087.51 763.61 591.31 498.41 477.448–1 500 0.51.42 230.51 808.01 606.41 500.41 477.9471 000 0.51.52 287.31 825.91 612.61 501.41 478.4462 00010 80080 000
0.61.52 310.01 830.81 614.41 502.21 478.730–1 500 0.71.62 453.61 875.31 629.51 504.31 479.229(B)1 000 0.71.72 510.51 893.31 635.71 505.31 479.7282 00014 500110 000
0.71.72 536.31 901.21 640.11 508.31 481.512–1 500 0.81.92 680.51 945.81 655.21 510.31 482.0111 000 0.91.92 737.51 963.71 661.51 511.31 482.5102 00018 200140 0001.58
–0.40.61 518.11 572.91 512.01 473.61 464.460–1 500 –0.10.71 664.11 617.71 527.11 475.61 464.9591 000 –0.10.81 722.11 635.81 533.41 476.61 465.4582 00000
0.51.32 190.21 786.21 596.61 499.31 477.742–1 500 0.61.52 338.31 831.11 611.81 501.31 478.2411 000 0.71.52 396.91 849.31 618.01 502.31 478.7402 00010 80080 000
0.71.52 420.61 854.31 619.81 503.11 479.024–1 500 0.81.72 569.31 899.31 634.91 505.21 479.5231 000 0.81.72 627.91 917.51 641.21 506.21 480.0222 00014 500110 000
0.91.82 655.11 925.61 645.61 509.21 481.96–1 500 1.01.92 804.41 970.61 660.81 511.21 482.451 000 1.02.02 863.11 988.71 667.01 512.21 482.942 00018 200140 0001.76
DE C L I N I N G IM P R O V E M E N T IN L I F E EX P E C T A N C Y (m e d i u m a s s u m p t i o n )
%%'000'000'000'000'000SeriesNIMNOMPerth
NOMAust.TFR
2041–
2051
2004–
201120512021201120062005
GROWTHRATE(a)AT 30 JUNE
PROJECTED POPULAT ION, Vary ing component leve l s —Per th5.25 . . . . . . . . . . . . . . . . . . . .
12 0 A B S • P O P U L A T I O N P R O J E C T I O N S , A U S T R A L I A • 3 2 2 2 . 0 • 2 0 0 4 T O 2 1 0 1
CH A P T E R 5 • D E T A I L E D T A B L E S

(a) Average annual growth rate.
–0.30.51 495.41 545.41 505.91 473.21 464.469–1 500 –0.10.61 637.31 589.61 521.01 475.21 464.9681 000 0.00.71 694.71 607.61 527.31 476.21 465.4672 00000
0.51.32 141.21 754.61 590.21 498.91 477.751–1 500 0.61.42 284.91 798.91 605.31 500.91 478.2501 000 0.71.52 342.81 816.91 611.61 501.91 478.7492 00010 80080 000
0.71.52 362.11 821.41 613.21 502.71 479.033–1 500 0.81.62 506.21 865.71 628.31 504.71 479.5321 000 0.81.72 564.31 883.71 634.61 505.71 480.0312 00014 500110 000
0.91.72 586.71 891.21 638.91 508.81 481.915–1 500 0.91.92 731.31 935.61 654.11 510.81 482.4141 000 1.01.92 789.51 953.61 660.31 511.81 482.9132 00018 200140 0001.39
–0.20.51 545.61 557.71 506.91 472.71 464.063–1 500 0.00.61 690.11 602.11 522.01 474.71 464.5621 000 0.10.71 747.41 620.01 528.21 475.71 465.0612 00000
0.61.32 210.51 768.81 591.31 498.41 477.445–1 500 0.71.42 356.81 813.31 606.41 500.41 477.9441 000 0.81.52 414.51 831.21 612.61 501.41 478.4432 00010 80080 000
0.81.52 437.31 836.11 614.41 502.21 478.727–1 500 0.91.62 584.21 880.71 629.51 504.31 479.2261 000 0.91.72 642.11 898.61 635.71 505.31 479.7252 00014 500110 000
0.91.72 668.21 906.61 640.11 508.31 481.59–1 500 1.01.92 815.61 951.21 655.21 510.31 482.081 000 1.11.92 873.51 969.11 661.51 511.31 482.572 00018 200140 0001.58
–0.10.61 625.81 577.91 512.01 473.61 464.457–1 500 0.10.71 775.21 622.81 527.11 475.61 464.9561 000 0.20.81 834.31 640.91 533.41 476.61 465.4552 00000
0.71.32 313.41 791.51 596.61 499.31 477.739–1 500 0.81.52 464.81 836.51 611.81 501.31 478.2381 000 0.91.52 524.31 854.61 618.01 502.31 478.7372 00010 80080 000
0.91.52 548.21 859.71 619.81 503.11 479.021–1 500 1.01.72 700.11 904.71 634.91 505.21 479.5201 000 1.01.72 759.61 922.81 641.21 506.21 480.0192 00014 500110 000
1.11.82 787.21 930.91 645.61 509.21 481.93–1 500 1.21.92 939.71 976.01 660.81 511.21 482.421 000 1.22.02 999.21 994.21 667.01 512.21 482.91(A)2 00018 200140 0001.76
CO N S T A N T IM P R O V E M E N T IN L I F E EX P E C T A N C Y ( h i g h a s s u m p t i o n )
%%'000'000'000'000'000SeriesNIMNOMPerth
NOMAust.TFR
2041–
2051
2004–
201120512021201120062005
GROWTHRATE(a)AT 30 JUNE
PROJECTED POPULAT ION, Vary ing component leve l s —Per th co n t i n u e d5.25 . . . . . . . . . . .
A B S • P O P U L A T I O N P R O J E C T I O N S , A U S T R A L I A • 3 2 2 2 . 0 • 2 0 0 4 T O 2 1 0 1 12 1
CH A P T E R 5 • D E T A I L E D T A B L E S

(a) Average annual growth rate.
–0.50.7541.1573.9549.2531.7527.972500 –0.30.9592.4591.9556.0533.2528.4711 500 –0.11.0646.0610.2562.8534.7528.9702 50000
–0.40.8560.9579.5551.7532.6528.454(C)500 –0.20.9612.4597.5558.5534.2528.9531 500 0.01.1666.6615.9565.3535.7529.4522 50028080 000
–0.30.8584.4586.6554.1533.0528.536500 –0.11.0635.9604.6560.9534.5529.0351 500 0.11.2690.3623.0567.7536.1529.5342 500680110 000
–0.20.9609.1594.3557.0533.7528.918500 0.01.1660.7612.3563.8535.3529.4171 500 0.21.2715.3630.7570.6536.8529.9162 5001 100140 0001.68
–0.20.8604.5590.6554.8533.2528.666500 0.01.0660.2609.2561.7534.7529.1651 500 0.21.2717.8628.1568.5536.2529.6642 50000
–0.10.9628.9596.9557.4534.1529.148500 0.11.1684.7615.5564.3535.7529.6471 500 0.31.3743.1634.4571.2537.2530.1462 50028080 000
0.01.0655.1604.4559.9534.5529.330500 0.21.1710.9623.0566.8536.1529.829(B)1 500 0.41.3769.6641.9573.7537.6530.3282 500680110 000
0.11.0682.7612.5562.9535.3529.612500 0.31.2738.5631.1569.7536.8530.1111 500 0.51.4797.4650.0576.6538.3530.6102 5001 100140 0002.01
0.00.9643.9599.4556.9533.5528.760500 0.21.1701.8618.3563.8535.0529.2591 500 0.41.2761.8637.3570.7536.5529.7582 50000
0.11.0669.5605.9559.6534.5529.342500 0.31.1727.4624.7566.4536.0529.8411 500 0.51.3788.3643.8573.4537.5530.3402 50028080 000
0.21.0696.9613.5562.1534.9529.424500 0.41.2754.7632.3569.0536.4529.9231 500 0.61.4815.9651.4575.8537.9530.4222 500680110 000
0.31.1725.6621.7565.0535.6529.86500 0.51.3783.5640.6571.9537.1530.351 500 0.61.4844.9659.7578.8538.6530.842 5001 100140 0002.25
DE C L I N I N G IM P R O V E M E N T IN L I F E EX P E C T A N C Y (m e d i u m a s s u m p t i o n )
%%'000'000'000'000'000SeriesNIMNOM
Bal. of WANOMAust.TFR
2041–
2051
2004–
201120512021201120062005
GROWTHRATE(a)AT 30 JUNE
PROJECTED POPULAT ION, Vary ing component leve l s —Balance of Weste rn
Aust ra l ia5.26 . . . . . . . . . . . . . . . . . . . . . . . . . . . . . . . . . . . . . . . . . . . . . . . . . . . . . . . . . . . . . . . . .
12 2 A B S • P O P U L A T I O N P R O J E C T I O N S , A U S T R A L I A • 3 2 2 2 . 0 • 2 0 0 4 T O 2 1 0 1
CH A P T E R 5 • D E T A I L E D T A B L E S

(a) Average annual growth rate.
–0.20.7583.9575.8549.2531.7527.969500 0.00.9636.7593.9556.0533.2528.4681 500 0.21.0692.2612.2562.8534.7528.9672 50000
–0.10.8601.9581.5551.7532.6528.451500 0.10.9654.9599.5558.5534.2528.9501 500 0.31.1711.0617.9565.3535.7529.4492 50028080 000
0.00.8625.4588.6554.1533.0528.533500 0.21.0678.5606.6560.9534.5529.0321 500 0.31.2734.8625.0567.7536.1529.5312 500680110 000
0.10.9650.2596.3557.0533.7528.915500 0.31.1703.4614.3563.8535.3529.4141 500 0.41.2759.8632.7570.6536.8529.9132 5001 100140 0001.68
0.10.8648.5592.6554.8533.2528.663500 0.31.0705.7611.2561.7534.7529.1621 500 0.51.2765.3630.1568.5536.2529.6612 50000
0.20.9671.1598.9557.4534.1529.145500 0.41.1728.4617.5564.3535.7529.6441 500 0.51.3788.8636.4571.2537.2530.1432 50028080 000
0.31.0697.4606.4559.9534.5529.327500 0.51.1754.8625.0566.8536.1529.8261 500 0.61.3815.3643.9573.7537.6530.3252 500680110 000
0.41.0725.0614.5562.9535.3529.69500 0.51.2782.5633.1569.7536.8530.181 500 0.71.4843.2652.1576.6538.3530.672 5001 100140 0002.01
0.30.9688.1601.4556.9533.5528.757500 0.51.1747.6620.3563.8535.0529.2561 500 0.61.2809.4639.4570.7536.5529.7552 50000
0.41.0711.9607.8559.6534.5529.339500 0.51.1771.3626.7566.4536.0529.8381 500 0.71.3834.1645.8573.4537.5530.3372 50028080 000
0.51.0739.4615.4562.1534.9529.421500 0.61.2798.9634.3569.0536.4529.9201 500 0.81.4861.9653.4575.8537.9530.4192 500680110 000
0.61.1768.3623.7565.0535.6529.83500 0.71.3827.8642.6571.9537.1530.321 500 0.81.4891.0661.7578.8538.6530.81(A)2 5001 100140 0002.25
CO N S T A N T IM P R O V E M E N T IN L I F E EX P E C T A N C Y ( h i g h a s s u m p t i o n )
%%'000'000'000'000'000SeriesNIMNOM
Bal. of WANOMAust.TFR
2041–
2051
2004–
201120512021201120062005
GROWTHRATE(a)AT 30 JUNE
PROJECTED POPULAT ION, Vary ing component leve l s —Balance of Weste rn
Aust ra l ia co n t i n u e d5.26 . . . . . . . . . . . . . . . . . . . . . . . . . . . . . . . . . . . . . . . . . . . . . . . . . . . . . . . .
A B S • P O P U L A T I O N P R O J E C T I O N S , A U S T R A L I A • 3 2 2 2 . 0 • 2 0 0 4 T O 2 1 0 1 12 3
CH A P T E R 5 • D E T A I L E D T A B L E S

(a) Estimated resident population, base population.
560.9710.9891.02 017.62 453.62 999.22 578.63 164.53 890.22051563.7709.8883.92 014.42 438.72 965.92 578.03 148.53 849.82050566.4708.6876.82 010.92 423.72 932.62 577.23 132.33 809.42049569.0707.4869.72 007.12 408.42 899.32 576.13 115.83 769.02048571.5706.1862.62 003.02 392.92 866.02 574.53 099.03 728.62047
573.9704.7855.41 998.62 377.22 832.72 572.63 082.03 688.12046576.3703.2848.21 993.92 361.32 799.42 570.23 064.53 647.62045578.5701.6841.01 988.82 345.22 766.12 567.33 046.83 607.12044580.5699.9833.71 983.42 328.72 732.92 563.93 028.63 566.62043582.4698.1826.41 977.62 312.02 699.72 560.03 010.13 526.12042
584.2696.1819.01 971.32 295.02 666.62 555.52 991.23 485.62041585.8694.0811.71 964.72 277.72 633.52 550.52 971.73 445.12040587.2691.8804.31 957.52 260.12 600.42 544.82 951.93 404.62039588.5689.4796.81 949.92 242.02 567.22 538.42 931.43 364.02038589.5686.9789.31 941.82 223.62 534.02 531.42 910.53 323.42037
590.4684.2781.81 933.22 204.82 500.82 523.62 889.03 282.62036591.1681.3774.21 924.12 185.62 467.52 515.22 866.83 241.72035591.6678.2766.61 914.52 165.92 434.12 506.02 844.13 200.72034591.8675.0758.91 904.32 145.82 400.62 496.12 820.83 159.42033591.9671.6751.11 893.72 125.22 367.02 485.52 796.83 118.12032
591.7668.0743.31 882.52 104.22 333.22 474.22 772.23 076.52031591.4664.2735.31 870.92 082.82 299.42 462.32 747.13 034.82030590.8660.3727.41 858.82 061.02 265.52 449.62 721.32 992.92029590.0656.1719.31 846.32 038.92 231.62 436.42 695.02 950.92028589.1651.9711.21 833.42 016.32 197.62 422.52 668.22 908.82027
587.9647.4703.11 820.21 993.42 163.62 408.12 640.82 866.72026586.6642.8694.91 806.51 970.32 129.62 393.12 613.02 824.52025585.0638.0686.71 792.61 946.82 095.62 377.72 584.92 782.32024583.4633.2678.41 778.41 923.22 061.72 361.82 556.32 740.12023581.5628.2670.11 764.01 899.32 027.92 345.52 527.52 698.02022
579.5623.0661.71 749.41 875.31 994.22 328.92 498.42 655.92021577.4617.8653.41 734.51 851.21 960.62 311.92 469.02 613.92020575.1612.5645.01 719.51 826.91 927.12 294.62 439.42 572.12019572.7607.1636.61 704.41 802.61 893.82 277.12 409.72 530.42018570.2601.6628.21 689.01 778.21 860.72 259.22 379.72 488.92017
567.5596.0619.91 673.31 753.61 827.82 240.82 349.52 447.72016564.6590.3611.61 657.31 728.91 795.12 221.92 319.12 406.72015561.6584.5603.31 641.01 704.11 762.72 202.52 288.62 366.12014558.4578.7595.11 624.31 679.31 730.62 182.82 258.02 325.72013555.1572.8586.91 607.41 654.41 698.72 162.52 227.22 285.62012
551.7566.8578.81 590.21 629.51 667.02 141.82 196.32 245.82011548.1560.7570.71 572.61 604.51 635.62 120.72 165.22 206.32010544.4554.6562.61 554.71 579.41 604.42 099.22 134.12 167.02009540.6548.5554.61 536.61 554.41 573.32 077.22 102.92 127.92008536.7542.3546.61 518.21 529.31 542.52 054.92 071.62 089.12007
532.6536.1538.61 498.91 504.31 512.22 031.62 040.32 050.92006528.4529.8530.81 477.71 479.21 482.92 006.12 008.92 013.62005523.5523.5523.51 454.61 454.61 454.61 978.11 978.11 978.12004(a)
'000'000'000'000'000'000'000'000'000
Series CSeries BSeries ASeries CSeries BSeries ASeries CSeries BSeries A
BALANCE OFWESTERN AUSTRALIAPERTHTOTAL WESTERN AUSTRALIA
At 30 June
PROJECTED POPULAT ION, By cap i ta l ci t y /ba lance of state —Weste rn Aus t ra l ia5.27 . . .
12 4 A B S • P O P U L A T I O N P R O J E C T I O N S , A U S T R A L I A • 3 2 2 2 . 0 • 2 0 0 4 T O 2 1 0 1
CH A P T E R 5 • D E T A I L E D T A B L E S

(a) Average annual growth rate
–1.8–0.1309.6458.7479.7485.0484.272–2 500 –1.10.2388.5485.8489.6487.1485.271–1 000 –0.60.5468.4512.5499.0488.6485.77050000
–1.50.0335.4466.8482.9486.0484.754(C)–2 500 –0.90.3414.7493.9492.8488.0485.753–1 000 –0.40.6494.8520.6502.2489.5486.25250040080 000
–1.40.0344.8469.5483.8486.2484.836–2 500 –0.80.3424.3496.7493.8488.2485.835–1 000 –0.40.6504.5523.4503.1489.7486.334500550110 000
–1.30.1354.3472.4484.9486.4484.918–2 500 –0.80.4433.9499.6494.8488.4485.917–1 000 –0.30.6514.3526.3504.2489.9486.416500700140 0001.70
–1.50.0333.4465.4481.3485.3484.366–2 500 –0.90.3415.9492.9491.2487.3485.365–1 000 –0.40.5499.4519.9500.6488.8485.86450000
–1.30.1360.3473.6484.5486.2484.848–2 500 –0.70.4443.1501.1494.4488.3485.847–1 000 –0.20.6526.8528.1503.8489.8486.34650040080 000
–1.20.1370.0476.4485.4486.4484.930–2 500 –0.60.4453.0504.0495.4488.4485.929(B)–1 000 –0.20.7536.9531.0504.8489.9486.428500550110 000
–1.10.1380.0479.3486.5486.6485.012–2 500 –0.50.4463.1506.9496.4488.7486.011–1 000 –0.10.7547.0533.9505.8490.2486.510500700140 0001.92
–1.30.0358.5472.1483.0485.6484.460–2 500 –0.60.3444.6500.0493.0487.6485.459–1 000 –0.20.6531.8527.3502.4489.1485.95850000
–1.00.1386.4480.4486.2486.5484.942–2 500 –0.50.4472.9508.3496.2488.6485.941–1 000 0.00.7560.2535.6505.6490.1486.44050040080 000
–0.90.1396.6483.3487.1486.7485.024–2 500 –0.40.4483.2511.2497.1488.7486.023–1 000 0.00.7570.6538.5506.6490.2486.522500550110 000
–0.90.2406.9486.3488.2486.9485.16–2 500 –0.30.5493.6514.2498.2489.0486.15–1 000 0.10.7581.1541.6507.6490.5486.64500700140 0002.15
DE C L I N I N G IM P R O V E M E N T IN L I F E EX P E C T A N C Y (m e d i u m a s s u m p t i o n )
%%'000'000'000'000'000SeriesNIMNOMTas.
NOMAust.TFR
2041–
2051
2004–
201120512021201120062005
GROWTHRATE(a)AT 30 JUNE
PROJECTED POPULAT ION, Vary ing component leve l s —Tasman ia5.28 . . . . . . . . . . . . . . . .
A B S • P O P U L A T I O N P R O J E C T I O N S , A U S T R A L I A • 3 2 2 2 . 0 • 2 0 0 4 T O 2 1 0 1 12 5
CH A P T E R 5 • D E T A I L E D T A B L E S

(a) Average annual growth rate
–1.4–0.1342.4460.7479.7485.0484.269–2 500 –0.70.2424.1487.9489.6487.1485.268–1 000 –0.30.5506.6514.6499.0488.6485.76750000
–1.10.0368.5468.8482.9486.0484.751–2 500 –0.50.3450.6496.0492.8488.0485.750–1 000 –0.10.6533.3522.7502.2489.5486.24950040080 000
–1.00.0378.1471.6483.8486.2484.833–2 500 –0.50.3460.2498.8493.8488.2485.832–1 000 –0.10.6543.0525.5503.1489.7486.331500550110 000
–0.90.1387.7474.5484.9486.4484.915–2 500 –0.40.4470.0501.7494.8488.4485.914–1 000 0.00.6553.0528.4504.2489.9486.413500700140 0001.70
–1.10.0366.4467.4481.3485.3484.363–2 500 –0.50.3451.7495.0491.2487.3485.362–1 000 –0.10.5537.7522.0500.6488.8485.86150000
–0.90.1393.6475.7484.5486.2484.845–2 500 –0.40.4479.2503.2494.4488.3485.844–1 000 0.10.6565.3530.3503.8489.8486.34350040080 000
–0.80.1403.6478.5485.4486.4484.927–2 500 –0.30.4489.2506.0495.4488.4485.926–1 000 0.10.7575.4533.1504.8489.9486.425500550110 000
–0.70.1413.6481.4486.5486.6485.09–2 500 –0.20.4499.4509.0496.4488.7486.08–1 000 0.10.7585.8536.1505.8490.2486.57500700140 0001.92
–0.90.0391.8474.2483.0485.6484.457–2 500 –0.30.3480.6502.1493.0487.6485.456–1 000 0.10.6570.2529.4502.4489.1485.95550000
–0.70.1420.0482.5486.2486.5484.939–2 500 –0.20.4509.1510.4496.2488.6485.938–1 000 0.20.7598.8537.8505.6490.1486.43750040080 000
–0.60.1430.3485.4487.1486.7485.021–2 500 –0.10.4519.5513.3497.1488.7486.020–1 000 0.30.7609.3540.7506.6490.2486.519500550110 000
–0.50.2440.8488.3488.2486.9485.13–2 500 0.00.5530.1516.3498.2489.0486.12–1 000 0.30.7620.1543.7507.6490.5486.61(A)500700140 0002.15
CO N S T A N T IM P R O V E M E N T IN L I F E EX P E C T A N C Y ( h i g h a s s u m p t i o n )
%%'000'000'000'000'000SeriesNIMNOMTas.
NOMAust.TFR
2041–
2051
2004–
201120512021201120062005
GROWTHRATE(a)AT 30 JUNE
PROJECTED POPULAT ION, Vary ing component leve l s —Tasman ia co n t i n u e d5.28 . . . . . . . .
12 6 A B S • P O P U L A T I O N P R O J E C T I O N S , A U S T R A L I A • 3 2 2 2 . 0 • 2 0 0 4 T O 2 1 0 1
CH A P T E R 5 • D E T A I L E D T A B L E S

(a) Average annual growth rate.
–1.00.2165.1203.2204.7203.6203.272–500 –0.60.4193.3212.8208.4204.6203.7710 –0.30.7222.2222.5212.1205.6204.27050000
–0.80.3178.2207.4206.4204.1203.454(C)–500 –0.40.5206.5217.0210.1205.1203.9530 –0.10.8235.7226.7213.8206.1204.45250021080 000
–0.70.3183.2208.9206.9204.2203.536–500 –0.40.6211.5218.5210.6205.2204.0350 –0.10.8240.8228.2214.3206.2204.534500290110 000
–0.60.4188.2210.4207.5204.3203.518–500 –0.30.6216.6220.0211.2205.3204.0170 0.00.9245.9229.8214.8206.3204.516500370140 0001.62
–0.90.2172.7205.0204.8203.5203.166–500 –0.50.4201.4214.6208.5204.5203.6650 –0.10.7230.8224.3212.2205.5204.16450000
–0.70.3185.8209.1206.5204.0203.348–500 –0.30.6214.5218.7210.1205.0203.8470 0.00.8244.3228.5213.8206.0204.34650021080 000
–0.60.3190.8210.6206.9204.0203.430–500 –0.20.6219.6220.2210.6205.0203.929(B)0 0.10.8249.5229.9214.3206.1204.428500290110 000
–0.50.4195.9212.1207.5204.2203.412–500 –0.20.6224.7221.7211.2205.2203.9110 0.10.9254.7231.5214.9206.2204.410500370140 0001.84
–0.70.2184.5207.9205.5203.6203.160–500 –0.30.5214.4217.6209.2204.6203.6590 0.10.7245.3227.5212.9205.6204.15850000
–0.40.3197.9212.1207.2204.1203.442–500 –0.10.6228.0221.8210.9205.1203.9410 0.20.9259.1231.7214.6206.1204.44050021080 000
–0.40.4203.3213.6207.7204.2203.424–500 0.00.6233.2223.4211.4205.2203.9230 0.30.9264.6233.2215.1206.2204.422500290110 000
–0.30.4208.5215.1208.2204.3203.56–500 0.00.7238.5224.9211.9205.3204.050 0.30.9269.9234.8215.6206.3204.54500370140 0002.05
DE C L I N I N G IM P R O V E M E N T IN L I F E EX P E C T A N C Y (m e d i u m a s s u m p t i o n )
%%'000'000'000'000'000SeriesNIMNOM
HobartNOMAust.TFR
2041–
2051
2004–
201120512021201120062005
GROWTHRATE(a)AT 30 JUNE
PROJECTED POPULAT ION, Vary ing component leve l s —Hobar t5.29 . . . . . . . . . . . . . . . . . .
A B S • P O P U L A T I O N P R O J E C T I O N S , A U S T R A L I A • 3 2 2 2 . 0 • 2 0 0 4 T O 2 1 0 1 12 7
CH A P T E R 5 • D E T A I L E D T A B L E S
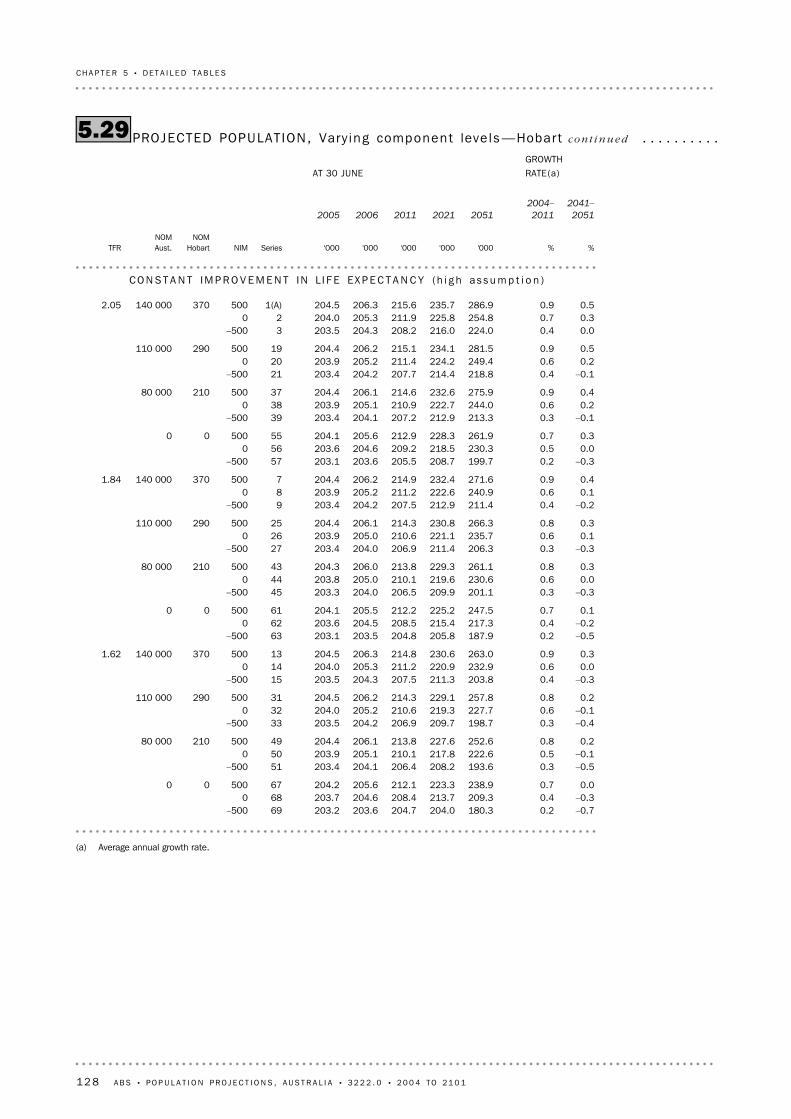
(a) Average annual growth rate.
–0.70.2180.3204.0204.7203.6203.269–500 –0.30.4209.3213.7208.4204.6203.7680 0.00.7238.9223.3212.1205.6204.26750000
–0.50.3193.6208.2206.4204.1203.451–500 –0.10.5222.6217.8210.1205.1203.9500 0.20.8252.6227.6213.8206.1204.44950021080 000
–0.40.3198.7209.7206.9204.2203.533–500 –0.10.6227.7219.3210.6205.2204.0320 0.20.8257.8229.1214.3206.2204.531500290110 000
–0.30.4203.8211.3207.5204.3203.515–500 0.00.6232.9220.9211.2205.3204.0140 0.30.9263.0230.6214.8206.3204.513500370140 0001.62
–0.50.2187.9205.8204.8203.5203.163–500 –0.20.4217.3215.4208.5204.5203.6620 0.10.7247.5225.2212.2205.5204.16150000
–0.30.3201.1209.9206.5204.0203.345–500 0.00.6230.6219.6210.1205.0203.8440 0.30.8261.1229.3213.8206.0204.34350021080 000
–0.30.3206.3211.4206.9204.0203.427–500 0.10.6235.7221.1210.6205.0203.9260 0.30.8266.3230.8214.3206.1204.425500290110 000
–0.20.4211.4212.9207.5204.2203.49–500 0.10.6240.9222.6211.2205.2203.980 0.40.9271.6232.4214.9206.2204.47500370140 0001.84
–0.30.2199.7208.7205.5203.6203.157–500 0.00.5230.3218.5209.2204.6203.6560 0.30.7261.9228.3212.9205.6204.15550000
–0.10.3213.3212.9207.2204.1203.439–500 0.20.6244.0222.7210.9205.1203.9380 0.40.9275.9232.6214.6206.1204.43750021080 000
–0.10.4218.8214.4207.7204.2203.421–500 0.20.6249.4224.2211.4205.2203.9200 0.50.9281.5234.1215.1206.2204.419500290110 000
0.00.4224.0216.0208.2204.3203.53–500 0.30.7254.8225.8211.9205.3204.020 0.50.9286.9235.7215.6206.3204.51(A)500370140 0002.05
CO N S T A N T IM P R O V E M E N T IN L I F E EX P E C T A N C Y ( h i g h a s s u m p t i o n )
%%'000'000'000'000'000SeriesNIMNOM
HobartNOMAust.TFR
2041–
2051
2004–
201120512021201120062005
GROWTHRATE(a)AT 30 JUNE
PROJECTED POPULAT ION, Vary ing component leve l s —Hobar t co n t i n u e d5.29 . . . . . . . . . .
12 8 A B S • P O P U L A T I O N P R O J E C T I O N S , A U S T R A L I A • 3 2 2 2 . 0 • 2 0 0 4 T O 2 1 0 1
CH A P T E R 5 • D E T A I L E D T A B L E S
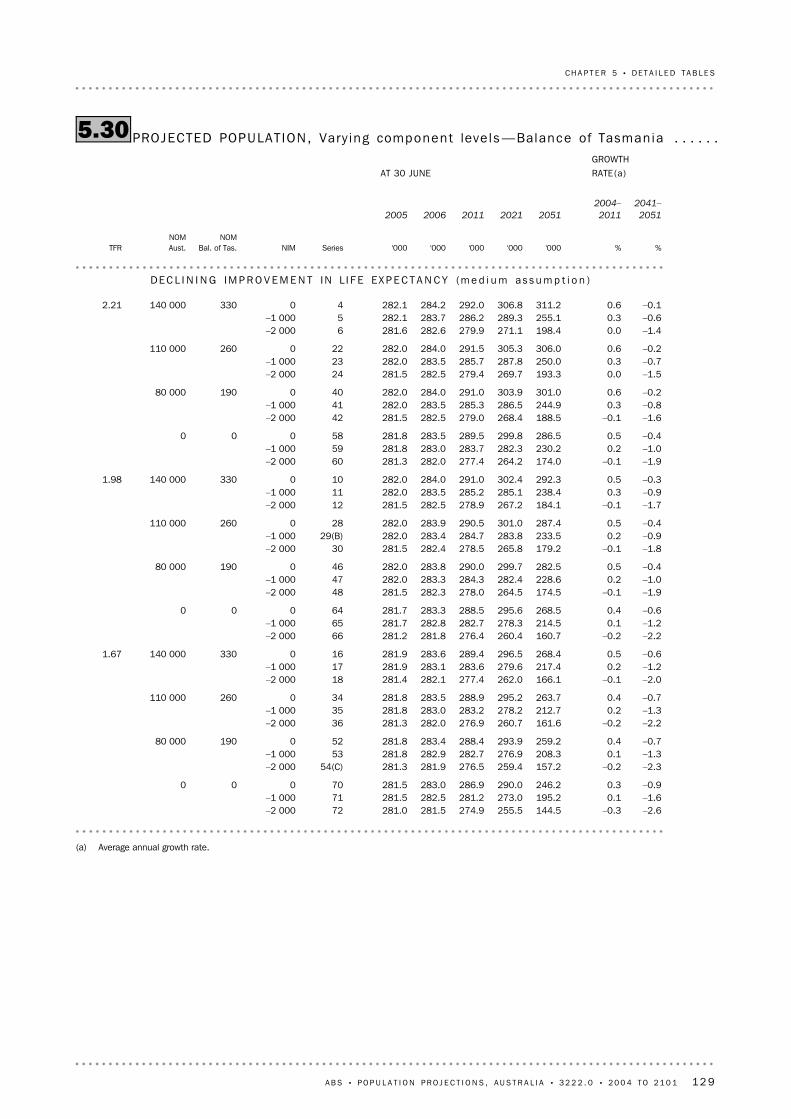
(a) Average annual growth rate.
–2.6–0.3144.5255.5274.9281.5281.072–2 000 –1.60.1195.2273.0281.2282.5281.571–1 000 –0.90.3246.2290.0286.9283.0281.570000
–2.3–0.2157.2259.4276.5281.9281.354(C)–2 000 –1.30.1208.3276.9282.7282.9281.853–1 000 –0.70.4259.2293.9288.4283.4281.852019080 000
–2.2–0.2161.6260.7276.9282.0281.336–2 000 –1.30.2212.7278.2283.2283.0281.835–1 000 –0.70.4263.7295.2288.9283.5281.8340260110 000
–2.0–0.1166.1262.0277.4282.1281.418–2 000 –1.20.2217.4279.6283.6283.1281.917–1 000 –0.60.5268.4296.5289.4283.6281.9160330140 0001.67
–2.2–0.2160.7260.4276.4281.8281.266–2 000 –1.20.1214.5278.3282.7282.8281.765–1 000 –0.60.4268.5295.6288.5283.3281.764000
–1.9–0.1174.5264.5278.0282.3281.548–2 000 –1.00.2228.6282.4284.3283.3282.047–1 000 –0.40.5282.5299.7290.0283.8282.046019080 000
–1.8–0.1179.2265.8278.5282.4281.530–2 000 –0.90.2233.5283.8284.7283.4282.029(B)–1 000 –0.40.5287.4301.0290.5283.9282.0280260110 000
–1.7–0.1184.1267.2278.9282.5281.512–2 000 –0.90.3238.4285.1285.2283.5282.011–1 000 –0.30.5292.3302.4291.0284.0282.0100330140 0001.98
–1.9–0.1174.0264.2277.4282.0281.360–2 000 –1.00.2230.2282.3283.7283.0281.859–1 000 –0.40.5286.5299.8289.5283.5281.858000
–1.6–0.1188.5268.4279.0282.5281.542–2 000 –0.80.3244.9286.5285.3283.5282.041–1 000 –0.20.6301.0303.9291.0284.0282.040019080 000
–1.50.0193.3269.7279.4282.5281.524–2 000 –0.70.3250.0287.8285.7283.5282.023–1 000 –0.20.6306.0305.3291.5284.0282.0220260110 000
–1.40.0198.4271.1279.9282.6281.66–2 000 –0.60.3255.1289.3286.2283.7282.15–1 000 –0.10.6311.2306.8292.0284.2282.140330140 0002.21
DE C L I N I N G IM P R O V E M E N T IN L I F E EX P E C T A N C Y (m e d i u m a s s u m p t i o n )
%%'000'000'000'000'000SeriesNIMNOM
Bal. of Tas.NOMAust.TFR
2041–
2051
2004–
201120512021201120062005
GROWTHRATE(a)AT 30 JUNE
PROJECTED POPULAT ION, Vary ing component leve l s —Balance of Tasman ia5.30 . . . . . .
A B S • P O P U L A T I O N P R O J E C T I O N S , A U S T R A L I A • 3 2 2 2 . 0 • 2 0 0 4 T O 2 1 0 1 12 9
CH A P T E R 5 • D E T A I L E D T A B L E S
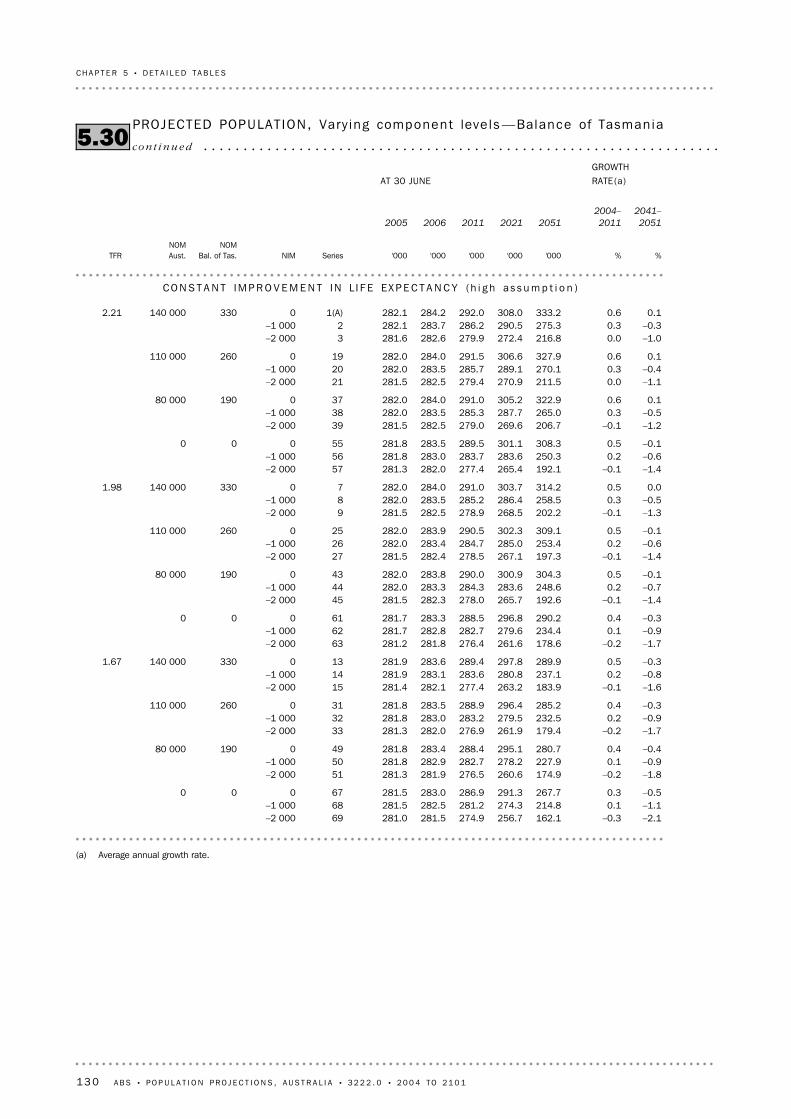
(a) Average annual growth rate.
–2.1–0.3162.1256.7274.9281.5281.069–2 000 –1.10.1214.8274.3281.2282.5281.568–1 000 –0.50.3267.7291.3286.9283.0281.567000
–1.8–0.2174.9260.6276.5281.9281.351–2 000 –0.90.1227.9278.2282.7282.9281.850–1 000 –0.40.4280.7295.1288.4283.4281.849019080 000
–1.7–0.2179.4261.9276.9282.0281.333–2 000 –0.90.2232.5279.5283.2283.0281.832–1 000 –0.30.4285.2296.4288.9283.5281.8310260110 000
–1.6–0.1183.9263.2277.4282.1281.415–2 000 –0.80.2237.1280.8283.6283.1281.914–1 000 –0.30.5289.9297.8289.4283.6281.9130330140 0001.67
–1.7–0.2178.6261.6276.4281.8281.263–2 000 –0.90.1234.4279.6282.7282.8281.762–1 000 –0.30.4290.2296.8288.5283.3281.761000
–1.4–0.1192.6265.7278.0282.3281.545–2 000 –0.70.2248.6283.6284.3283.3282.044–1 000 –0.10.5304.3300.9290.0283.8282.043019080 000
–1.4–0.1197.3267.1278.5282.4281.527–2 000 –0.60.2253.4285.0284.7283.4282.026–1 000 –0.10.5309.1302.3290.5283.9282.0250260110 000
–1.3–0.1202.2268.5278.9282.5281.59–2 000 –0.50.3258.5286.4285.2283.5282.08–1 000 0.00.5314.2303.7291.0284.0282.070330140 0001.98
–1.4–0.1192.1265.4277.4282.0281.357–2 000 –0.60.2250.3283.6283.7283.0281.856–1 000 –0.10.5308.3301.1289.5283.5281.855000
–1.2–0.1206.7269.6279.0282.5281.539–2 000 –0.50.3265.0287.7285.3283.5282.038–1 000 0.10.6322.9305.2291.0284.0282.037019080 000
–1.10.0211.5270.9279.4282.5281.521–2 000 –0.40.3270.1289.1285.7283.5282.020–1 000 0.10.6327.9306.6291.5284.0282.0190260110 000
–1.00.0216.8272.4279.9282.6281.63–2 000 –0.30.3275.3290.5286.2283.7282.12–1 000 0.10.6333.2308.0292.0284.2282.11(A)0330140 0002.21
CO N S T A N T IM P R O V E M E N T IN L I F E EX P E C T A N C Y ( h i g h a s s u m p t i o n )
%%'000'000'000'000'000SeriesNIMNOM
Bal. of Tas.NOMAust.TFR
2041–
2051
2004–
201120512021201120062005
GROWTHRATE(a)AT 30 JUNE
PROJECTED POPULAT ION, Vary ing component leve l s —Balance of Tasman ia
co n t i n u e d5.30 . . . . . . . . . . . . . . . . . . . . . . . . . . . . . . . . . . . . . . . . . . . . . . . . . . . . . . . . . . . . . . . . .
13 0 A B S • P O P U L A T I O N P R O J E C T I O N S , A U S T R A L I A • 3 2 2 2 . 0 • 2 0 0 4 T O 2 1 0 1
CH A P T E R 5 • D E T A I L E D T A B L E S

(a) Estimated resident population, base population.
157.2233.5333.2178.2219.6286.9335.4453.0620.12051161.3235.9332.8179.8220.2285.4341.1456.1618.22050165.4238.3332.4181.4220.7284.0346.8459.0616.42049169.5240.7332.0183.0221.3282.5352.5462.0614.52048173.6243.1331.5184.6221.9281.0358.1464.9612.62047
177.6245.5331.1186.1222.4279.5363.8467.8610.62046181.7247.8330.6187.6222.9278.0369.3470.7608.62045185.7250.1330.1189.1223.4276.5374.9473.5606.62044189.7252.4329.6190.6223.8275.0380.3476.2604.62043193.7254.6329.0192.0224.3273.5385.7478.9602.52042
197.6256.8328.5193.4224.7271.9391.0481.4600.42041201.5258.9327.9194.7225.0270.4396.2483.9598.22040205.3261.0327.3195.9225.3268.8401.3486.3596.12039209.1263.0326.6197.2225.6267.2406.2488.6593.82038212.8265.0325.9198.3225.8265.6411.1490.7591.52037
216.4266.8325.2199.4225.9264.0415.8492.8589.12036219.9268.6324.4200.4226.0262.3420.3494.6586.72035223.4270.3323.6201.3226.0260.6424.7496.4584.22034226.8272.0322.7202.2226.0258.9429.0497.9581.62033230.0273.5321.8203.0225.9257.1433.0499.3578.92032
233.2274.9320.8203.7225.7255.3436.9500.6576.12031236.3276.2319.8204.4225.4253.5440.6501.6573.32030239.2277.5318.7204.9225.1251.6444.2502.5570.32029242.1278.6317.5205.5224.7249.7447.6503.3567.22028244.9279.6316.3205.9224.2247.7450.8503.8564.12027
247.5280.5315.1206.3223.7245.8453.8504.2560.92026250.1281.4313.8206.6223.1243.8456.7504.4557.62025252.5282.1312.4206.9222.4241.8459.4504.5554.22024254.9282.7311.0207.1221.7239.7462.0504.5550.72023257.2283.3309.5207.3221.0237.7464.4504.3547.22022
259.4283.8308.0207.4220.2235.7466.8504.0543.72021261.5284.1306.5207.5219.4233.6468.9503.5540.12020263.5284.5304.9207.5218.5231.6471.0503.0536.42019265.4284.7303.3207.5217.6229.5473.0502.3532.82018267.3284.9301.6207.5216.7227.5474.8501.6529.12017
269.0285.0300.0207.5215.7225.4476.5500.7525.42016270.7285.0298.4207.3214.8223.4478.0499.8521.82015272.3285.0296.8207.2213.8221.4479.4498.8518.22014273.7285.0295.2207.0212.7219.5480.7497.7514.62013275.2284.9293.6206.7211.7217.6481.9496.6511.12012
276.5284.7292.0206.4210.6215.6482.9495.4507.62011277.7284.5290.4206.0209.5213.7483.8494.1504.22010278.9284.3288.8205.6208.4211.9484.5492.8500.72009280.0284.0287.3205.2207.3210.0485.1491.4497.32008281.0283.7285.7204.7206.2208.1485.7489.9493.92007
281.9283.4284.2204.1205.0206.3486.0488.4490.52006281.3282.0282.1203.4203.9204.5484.7485.9486.62005280.1280.1280.1202.2202.2202.2482.2482.2482.22004(a)
'000'000'000'000'000'000'000'000'000
Series CSeries BSeries ASeries CSeries BSeries ASeries CSeries BSeries A
BALANCE OF TASMANIAHOBARTTOTAL TASMANIA
At 30 June
PROJECTED POPULAT ION, By cap i ta l ci t y /ba lance of sta te —Tasman ia5.31 . . . . . . . . . . .
A B S • P O P U L A T I O N P R O J E C T I O N S , A U S T R A L I A • 3 2 2 2 . 0 • 2 0 0 4 T O 2 1 0 1 13 1
CH A P T E R 5 • D E T A I L E D T A B L E S

(a) Average annual growth rate.
–0.40.3189.7205.2204.2201.9200.972–2 000 0.41.0274.2231.9213.6203.4201.471–500 0.81.4330.4250.3220.4205.0201.97050000
0.00.6224.3215.3208.1203.1201.554(C)–2 000 0.71.2309.8242.0217.5204.6202.053–500 1.01.7366.7260.4224.3206.1202.55250048080 000
0.20.7237.1218.8209.2203.3201.636–2 000 0.81.3323.0245.6218.6204.8202.135–500 1.11.7380.3264.0225.5206.3202.634500660110 000
0.30.7249.8222.4210.5203.6201.718–2 000 0.91.4336.2249.2219.9205.1202.217–500 1.11.8393.6267.6226.7206.6202.716500840140 0001.98
–0.10.4209.8209.8205.4202.2201.066–2 000 0.71.0298.5236.9214.8203.7201.565–500 1.01.5357.6255.5221.7205.2202.06450000
0.30.7246.3220.2209.3203.4201.648–2 000 0.91.3336.0247.3218.8204.9202.147–500 1.21.7395.8265.9225.6206.4202.64650048080 000
0.50.7259.8223.7210.5203.6201.730–2 000 1.01.4350.0250.9219.9205.1202.229(B)–500 1.31.8410.1269.5226.8206.6202.728500660110 000
0.60.8273.3227.4211.7203.9201.812–2 000 1.11.5363.9254.5221.2205.4202.311–500 1.31.9424.2273.2228.0206.9202.810500840140 0002.24
0.20.5230.8214.4206.6202.5201.260–2 000 0.91.1323.9241.8216.1204.0201.759–500 1.21.6385.9260.7222.9205.5202.25850000
0.60.7269.3225.0210.6203.7201.842–2 000 1.21.4363.5252.4220.0205.2202.341–500 1.41.8426.0271.3226.9206.7202.84050048080 000
0.70.8283.5228.6211.7203.9201.824–2 000 1.31.5378.1256.0221.2205.4202.323–500 1.51.9441.1274.9228.0206.9202.822500660110 000
0.80.9297.7232.3213.0204.2202.06–2 000 1.31.5392.8259.8222.5205.7202.55–500 1.52.0456.0278.7229.3207.2203.04500840140 0002.50
DE C L I N I N G IM P R O V E M E N T IN L I F E EX P E C T A N C Y (m e d i u m a s s u m p t i o n )
%%'000'000'000'000'000SeriesNIMNOM
NTNOMAust.TFR
2041–
2051
2004–
201120512021201120062005
GROWTHRATE(a)AT 30 JUNE
PROJECTED POPULAT ION, Vary ing component leve l s —Northern Ter r i to r y5.32 . . . . . . . .
13 2 A B S • P O P U L A T I O N P R O J E C T I O N S , A U S T R A L I A • 3 2 2 2 . 0 • 2 0 0 4 T O 2 1 0 1
CH A P T E R 5 • D E T A I L E D T A B L E S

(a) Average annual growth rate.
–0.20.3198.7205.6204.2201.9200.969–2 000 0.61.0285.7232.4213.6203.4201.468–500 0.91.4343.7250.7220.4205.0201.96750000
0.20.6233.8215.8208.1203.1201.551–2 000 0.91.2321.7242.5217.5204.6202.050–500 1.11.7380.3260.9224.3206.1202.54950048080 000
0.40.7246.7219.2209.2203.3201.633–2 000 1.01.3335.1246.0218.6204.8202.132–500 1.21.7394.0264.5225.5206.3202.631500660110 000
0.50.7259.7222.8210.5203.6201.715–2 000 1.01.4348.4249.6219.9205.1202.214–500 1.31.8407.5268.1226.7206.6202.713500840140 0001.98
0.10.4219.0210.3205.4202.2201.063–2 000 0.81.0310.2237.4214.8203.7201.562–500 1.11.5371.0256.0221.7205.2202.06150000
0.50.7256.0220.6209.3203.4201.645–2 000 1.11.3348.2247.8218.8204.9202.144–500 1.31.7409.7266.4225.6206.4202.64350048080 000
0.60.7269.7224.2210.5203.6201.727–2 000 1.21.4362.3251.3219.9205.1202.226–500 1.41.8424.1270.0226.8206.6202.725500660110 000
0.70.8283.4227.8211.7203.9201.89–2 000 1.31.5376.4255.0221.2205.4202.38–500 1.51.9438.4273.7228.0206.9202.87500840140 0002.24
0.40.5240.3214.8206.6202.5201.257–2 000 1.11.1335.9242.3216.1204.0201.756–500 1.41.6399.7261.2222.9205.5202.25550000
0.80.7279.3225.4210.6203.7201.839–2 000 1.31.4376.0252.9220.0205.2202.338–500 1.51.8440.3271.8226.9206.7202.83750048080 000
0.90.8293.8229.0211.7203.9201.821–2 000 1.41.5390.8256.5221.2205.4202.320–500 1.61.9455.5275.4228.0206.9202.819500660110 000
1.00.9308.2232.7213.0204.2202.03–2 000 1.51.5405.6260.3222.5205.7202.52–500 1.72.0470.5279.2229.3207.2203.01(A)500840140 0002.50
CO N S T A N T IM P R O V E M E N T IN L I F E EX P E C T A N C Y ( h i g h a s s u m p t i o n )
%%'000'000'000'000'000SeriesNIMNOM
NTNOMAust.TFR
2041–
2051
2004–
201120512021201120062005
GROWTHRATE(a)AT 30 JUNE
PROJECTED POPULAT ION, Vary ing component leve l s —Northern Ter r i to r y co n t i n u e d5.32
A B S • P O P U L A T I O N P R O J E C T I O N S , A U S T R A L I A • 3 2 2 2 . 0 • 2 0 0 4 T O 2 1 0 1 13 3
CH A P T E R 5 • D E T A I L E D T A B L E S

(a) Average annual growth rate.
0.20.8133.2121.6115.6112.0110.772–500 0.91.5189.0138.9121.4112.5110.771500 1.01.9216.8148.5125.1113.5111.2701 00000
0.51.1153.0127.5117.9112.6111.154(C)–500 1.11.8209.6144.8123.7113.1111.153500 1.22.2238.0154.4127.4114.2111.6521 00028080 000
0.61.2160.8129.6118.6112.8111.136–500 1.21.8217.7146.9124.3113.3111.135500 1.32.3246.2156.6128.1114.3111.6341 000390110 000
0.71.2168.6131.8119.4112.9111.218–500 1.21.9225.8149.1125.1113.4111.217500 1.42.4254.4158.8128.8114.5111.7161 000500140 0001.71
0.40.9143.9124.0116.2112.1110.866–500 1.11.6202.2141.5122.0112.6110.865500 1.22.0231.2151.2125.7113.6111.3641 00000
0.71.1164.7130.0118.5112.8111.148–500 1.31.8223.9147.5124.3113.3111.147500 1.42.3253.5157.3128.0114.3111.6461 00028080 000
0.81.2172.9132.1119.2112.9111.230–500 1.31.9232.3149.7125.0113.4111.229(B)500 1.52.3262.0159.4128.7114.4111.7281 000390110 000
1.01.3181.1134.3120.0113.1111.212–500 1.42.0240.9151.9125.7113.6111.211500 1.52.4270.6161.7129.5114.6111.7101 000500140 0001.94
0.70.9155.0126.3116.8112.2110.860–500 1.31.6215.9143.9122.6112.7110.859500 1.42.1246.0153.8126.3113.8111.3581 00000
0.91.2176.7132.4119.1112.9111.242–500 1.41.9238.6150.1124.9113.4111.241500 1.62.3269.3160.0128.6114.4111.7401 00028080 000
1.11.3185.3134.5119.8113.0111.224–500 1.52.0247.3152.3125.6113.5111.223500 1.62.4278.2162.2129.3114.6111.7221 000390110 000
1.11.4193.9136.8120.6113.2111.36–500 1.62.1256.3154.6126.4113.7111.35500 1.72.5287.3164.5130.1114.7111.841 000500140 0002.17
DE C L I N I N G IM P R O V E M E N T IN L I F E EX P E C T A N C Y (m e d i u m a s s u m p t i o n )
%%'000'000'000'000'000SeriesNIMNOM
DarwinNOMAust.TFR
2041–
2051
2004–
201120512021201120062005
GROWTHRATE(a)AT 30 JUNE
PROJECTED POPULAT ION, Vary ing component leve l s —Darwin5.33 . . . . . . . . . . . . . . . . . .
13 4 A B S • P O P U L A T I O N P R O J E C T I O N S , A U S T R A L I A • 3 2 2 2 . 0 • 2 0 0 4 T O 2 1 0 1
CH A P T E R 5 • D E T A I L E D T A B L E S

(a) Average annual growth rate.
0.40.8138.7121.9115.6112.0110.769–500 1.01.5196.0139.2121.4112.5110.768500 1.21.9224.7148.8125.1113.5111.2671 00000
0.71.1158.7127.8117.9112.6111.151–500 1.21.8216.7145.1123.7113.1111.150500 1.42.2246.0154.7127.4114.2111.6491 00028080 000
0.81.2166.5129.9118.6112.8111.133–500 1.31.8224.8147.2124.3113.3111.132500 1.42.3254.1156.8128.1114.3111.6311 000390110 000
0.91.2174.5132.0119.4112.9111.215–500 1.41.9233.0149.4125.1113.4111.214500 1.52.4262.4159.0128.8114.5111.7131 000500140 0001.71
0.60.9149.5124.2116.2112.1110.863–500 1.21.6209.3141.7122.0112.6110.862500 1.42.0239.1151.5125.7113.6111.3611 00000
0.91.1170.4130.2118.5112.8111.145–500 1.41.8231.1147.8124.3113.3111.144500 1.52.3261.5157.5128.0114.3111.6431 00028080 000
1.01.2178.6132.4119.2112.9111.227–500 1.51.9239.6149.9125.0113.4111.226500 1.62.3270.1159.7128.7114.4111.7251 000390110 000
1.11.3187.0134.6120.0113.1111.29–500 1.52.0248.1152.1125.7113.6111.28500 1.62.4278.8161.9129.5114.6111.771 000500140 0001.94
0.80.9160.6126.5116.8112.2110.857–500 1.41.6223.1144.2122.6112.7110.856500 1.52.1254.0154.1126.3113.8111.3551 00000
1.11.2182.5132.6119.1112.9111.239–500 1.61.9245.8150.4124.9113.4111.238500 1.72.3277.4160.3128.6114.4111.7371 00028080 000
1.21.3191.2134.8119.8113.0111.221–500 1.62.0254.7152.6125.6113.5111.220500 1.82.4286.4162.5129.3114.6111.7191 000390110 000
1.31.4199.9137.0120.6113.2111.33–500 1.72.1263.7154.9126.4113.7111.32500 1.82.5295.5164.8130.1114.7111.81(A)1 000500140 0002.17
CO N S T A N T IM P R O V E M E N T IN L I F E EX P E C T A N C Y ( h i g h a s s u m p t i o n )
%%'000'000'000'000'000SeriesNIMNOM
DarwinNOMAust.TFR
2041–
2051
2004–
201120512021201120062005
GROWTHRATE(a)AT 30 JUNE
PROJECTED POPULAT ION, Vary ing component leve l s —Darwin co n t i n u e d5.33 . . . . . . . . . .
A B S • P O P U L A T I O N P R O J E C T I O N S , A U S T R A L I A • 3 2 2 2 . 0 • 2 0 0 4 T O 2 1 0 1 13 5
CH A P T E R 5 • D E T A I L E D T A B L E S
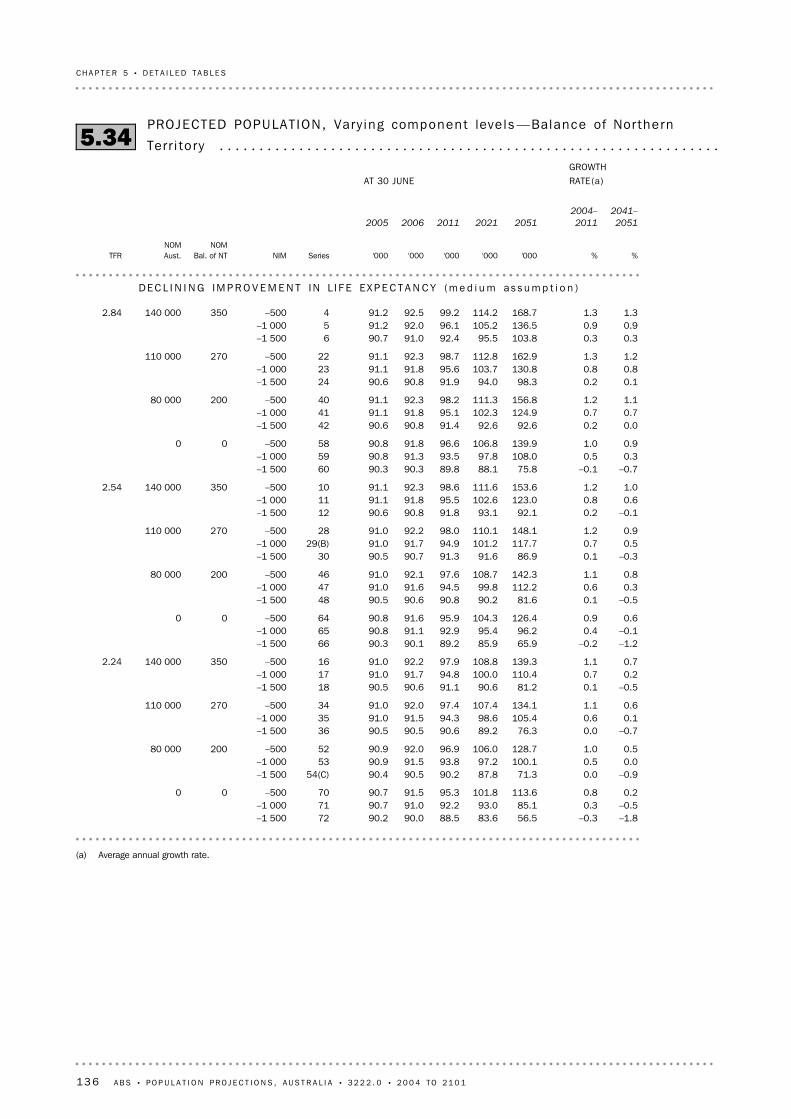
(a) Average annual growth rate.
–1.8–0.356.583.688.590.090.272–1 500 –0.50.385.193.092.291.090.771–1 000 0.20.8113.6101.895.391.590.770–50000
–0.90.071.387.890.290.590.454(C)–1 500 0.00.5100.197.293.891.590.953–1 000 0.51.0128.7106.096.992.090.952–50020080 000
–0.70.076.389.290.690.590.536–1 500 0.10.6105.498.694.391.591.035–1 000 0.61.1134.1107.497.492.091.034–500270110 000
–0.50.181.290.691.190.690.518–1 500 0.20.7110.4100.094.891.791.017–1 000 0.71.1139.3108.897.992.291.016–500350140 0002.24
–1.2–0.265.985.989.290.190.366–1 500 –0.10.496.295.492.991.190.865–1 000 0.60.9126.4104.395.991.690.864–50000
–0.50.181.690.290.890.690.548–1 500 0.30.6112.299.894.591.691.047–1 000 0.81.1142.3108.797.692.191.046–50020080 000
–0.30.186.991.691.390.790.530–1 500 0.50.7117.7101.294.991.791.029(B)–1 000 0.91.2148.1110.198.092.291.028–500270110 000
–0.10.292.193.191.890.890.612–1 500 0.60.8123.0102.695.591.891.111–1 000 1.01.2153.6111.698.692.391.110–500350140 0002.54
–0.7–0.175.888.189.890.390.360–1 500 0.30.5108.097.893.591.390.859–1 000 0.91.0139.9106.896.691.890.858–50000
0.00.292.692.691.490.890.642–1 500 0.70.7124.9102.395.191.891.141–1 000 1.11.2156.8111.398.292.391.140–50020080 000
0.10.298.394.091.990.890.624–1 500 0.80.8130.8103.795.691.891.123–1 000 1.21.3162.9112.898.792.391.122–500270110 000
0.30.3103.895.592.491.090.76–1 500 0.90.9136.5105.296.192.091.25–1 000 1.31.3168.7114.299.292.591.24–500350140 0002.84
DE C L I N I N G IM P R O V E M E N T IN L I F E EX P E C T A N C Y (m e d i u m a s s u m p t i o n )
%%'000'000'000'000'000SeriesNIMNOM
Bal. of NTNOMAust.TFR
2041–
2051
2004–
201120512021201120062005
GROWTHRATE(a)AT 30 JUNE
PROJECTED POPULAT ION, Vary ing component leve l s —Balance of Nor thern
Ter r i to ry5.34 . . . . . . . . . . . . . . . . . . . . . . . . . . . . . . . . . . . . . . . . . . . . . . . . . . . . . . . . . . . . . . .
13 6 A B S • P O P U L A T I O N P R O J E C T I O N S , A U S T R A L I A • 3 2 2 2 . 0 • 2 0 0 4 T O 2 1 0 1
CH A P T E R 5 • D E T A I L E D T A B L E S

(a) Average annual growth rate.
–1.5–0.360.083.788.590.090.269–1 500 –0.30.389.693.292.291.090.768–1 000 0.40.8119.0102.095.391.590.767–50000
–0.70.075.188.090.290.590.451–1 500 0.20.5104.997.493.891.590.950–1 000 0.71.0134.3106.296.992.090.949–50020080 000
–0.50.080.289.490.690.590.533–1 500 0.30.6110.298.894.391.591.032–1 000 0.81.1139.8107.697.492.091.031–500270110 000
–0.30.185.290.891.190.690.515–1 500 0.40.7115.4100.294.891.791.014–1 000 0.91.1145.1109.197.992.291.013–500350140 0002.24
–0.9–0.269.686.189.290.190.363–1 500 0.10.4100.995.792.991.190.862–1 000 0.70.9131.9104.695.991.690.861–50000
–0.20.185.690.490.890.690.545–1 500 0.50.6117.1100.094.591.691.044–1 000 1.01.1148.2108.997.692.191.043–50020080 000
–0.10.191.091.891.390.790.527–1 500 0.60.7122.8101.494.991.791.026–1 000 1.11.2154.0110.398.092.291.025–500270110 000
0.10.296.493.391.890.890.69–1 500 0.70.8128.2102.995.591.891.18–1 000 1.21.2159.6111.898.692.391.17–500350140 0002.54
–0.4–0.179.888.389.890.390.357–1 500 0.50.5112.898.193.591.390.856–1 000 1.01.0145.7107.196.691.890.855–50000
0.20.296.892.891.490.890.639–1 500 0.80.7130.1102.595.191.891.138–1 000 1.31.2162.9111.598.292.391.137–50020080 000
0.30.2102.694.291.990.890.621–1 500 1.00.8136.1103.995.691.891.120–1 000 1.41.3169.1113.098.792.391.119–500270110 000
0.50.3108.295.792.491.090.73–1 500 1.10.9141.9105.496.192.091.22–1 000 1.41.3175.0114.599.292.591.21(A)–500350140 0002.84
CO N S T A N T IM P R O V E M E N T IN L I F E EX P E C T A N C Y ( h i g h a s s u m p t i o n )
%%'000'000'000'000'000SeriesNIMNOM
Bal. of NTNOMAust.TFR
2041–
2051
2004–
201120512021201120062005
GROWTHRATE(a)AT 30 JUNE
PROJECTED POPULAT ION, Vary ing component leve l s —Balance of Nor thern
Ter r i to ry co n t i n u e d5.34 . . . . . . . . . . . . . . . . . . . . . . . . . . . . . . . . . . . . . . . . . . . . . . . . . . . . . . .
A B S • P O P U L A T I O N P R O J E C T I O N S , A U S T R A L I A • 3 2 2 2 . 0 • 2 0 0 4 T O 2 1 0 1 13 7
CH A P T E R 5 • D E T A I L E D T A B L E S

(a) Estimated resident population, base population.
71.3117.7175.0153.0232.3295.5224.3350.0470.5205172.0117.2172.5152.3229.3290.4224.3346.5462.9205072.8116.6170.0151.5226.4285.3224.3343.0455.3204973.5116.1167.6150.7223.5280.3224.3339.6447.9204874.2115.6165.2150.0220.6275.4224.2336.1440.62047
74.9115.1162.8149.2217.7270.5224.2332.7433.3204675.6114.5160.5148.4214.8265.7224.1329.3426.2204576.3114.0158.2147.7211.9260.9224.0326.0419.1204477.0113.5156.0146.9209.1256.2223.9322.6412.2204377.7113.0153.8146.1206.3251.6223.7319.3405.42042
78.3112.4151.6145.3203.5247.0223.6315.9398.6204178.9111.9149.5144.5200.7242.5223.4312.6392.0204079.6111.4147.4143.6197.9238.0223.2309.3385.4203980.2110.9145.4142.8195.2233.6223.0306.0379.0203880.7110.3143.3142.0192.4229.2222.7302.8372.62037
81.3109.8141.4141.1189.7224.9222.5299.5366.3203681.9109.3139.4140.3186.9220.6222.2296.2360.0203582.4108.7137.5139.4184.2216.4221.8293.0353.9203482.9108.2135.6138.6181.5212.2221.5289.7347.8203383.4107.6133.7137.7178.8208.0221.1286.4341.72032
83.9107.1131.8136.8176.1203.9220.7283.2335.8203184.3106.5130.0135.9173.4199.8220.2279.9329.8203084.8106.0128.2135.0170.7195.8219.8276.7324.0202985.2105.4126.4134.1168.0191.8219.3273.4318.2202885.6104.8124.6133.1165.4187.8218.8270.2312.42027
86.0104.2122.9132.2162.7183.9218.2266.9306.8202686.4103.6121.2131.3160.1180.0217.7263.7301.1202586.8103.0119.5130.3157.4176.1217.1260.4295.6202487.1102.4117.8129.4154.8172.3216.5257.2290.1202387.5101.8116.1128.5152.2168.5215.9254.0284.62022
87.8101.2114.5127.5149.7164.8215.3250.9279.2202188.1100.6112.9126.6147.1161.1214.7247.7273.9202088.4100.0111.2125.7144.6157.4214.1244.5268.7201988.799.4109.7124.7142.0153.8213.5241.4263.5201889.098.7108.1123.8139.5150.3212.8238.3258.32017
89.398.1106.5122.8137.1146.8212.1235.2253.3201689.597.5105.0121.9134.6143.3211.4232.1248.4201589.796.9103.5120.9132.2139.9210.6229.0243.5201489.996.2102.1119.9129.7136.6209.8226.0238.7201390.195.6100.6118.9127.3133.3209.0222.9234.02012
90.294.999.2117.9125.0130.1208.1219.9229.3201190.394.397.8116.9122.6126.9207.2216.9224.8201090.393.696.4115.8120.3123.8206.2213.9220.3200990.493.095.1114.8118.0120.7205.2210.9215.8200890.492.393.8113.7115.7117.7204.2208.0211.52007
90.591.792.5112.6113.4114.7203.1205.1207.2200690.491.091.2111.1111.2111.8201.5202.2203.0200590.490.490.4109.4109.4109.4199.8199.8199.82004(a)
'000'000'000'000'000'000'000'000'000
Series CSeries BSeries ASeries CSeries BSeries ASeries CSeries BSeries A
BALANCE OFNORTHERN TERRITORYDARWINTOTAL NORTHERN TERRITORY
At 30 June
PROJECTED POPULAT ION, By cap i ta l ci t y /ba lance of state —Northern Ter r i to r y5.35 .
13 8 A B S • P O P U L A T I O N P R O J E C T I O N S , A U S T R A L I A • 3 2 2 2 . 0 • 2 0 0 4 T O 2 1 0 1
CH A P T E R 5 • D E T A I L E D T A B L E S
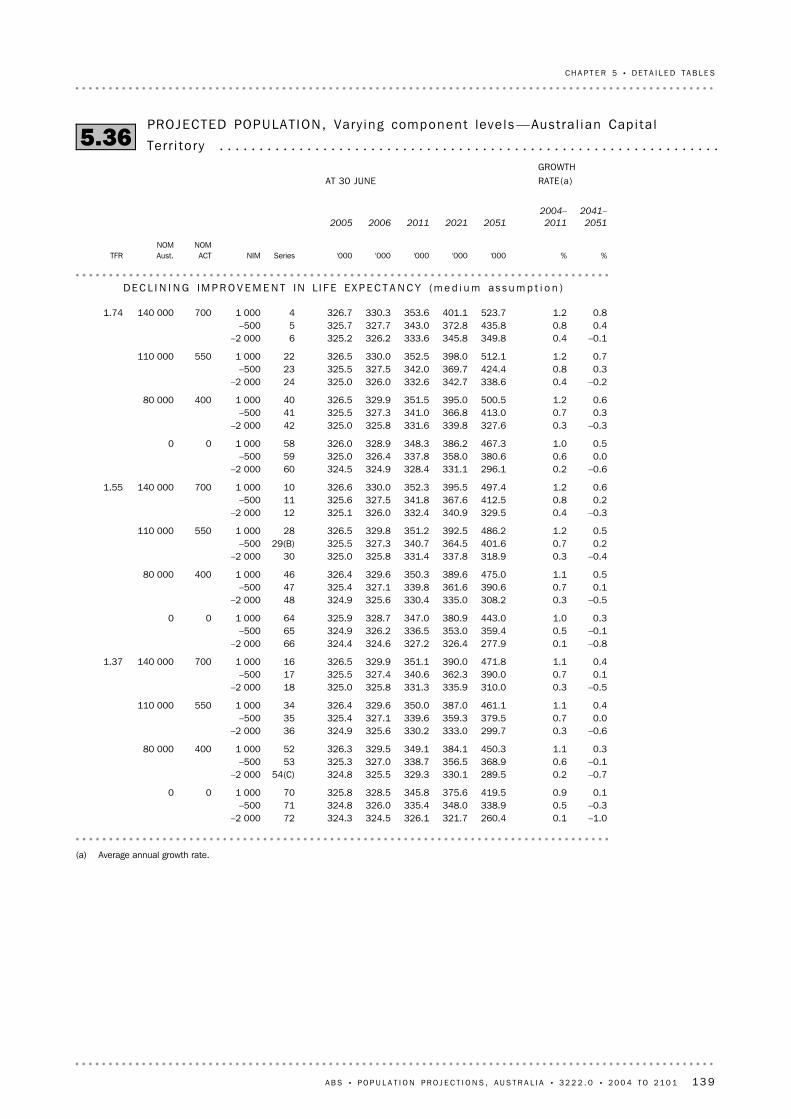
(a) Average annual growth rate.
–1.00.1260.4321.7326.1324.5324.372–2 000 –0.30.5338.9348.0335.4326.0324.871–500 0.10.9419.5375.6345.8328.5325.8701 00000
–0.70.2289.5330.1329.3325.5324.854(C)–2 000 –0.10.6368.9356.5338.7327.0325.353–500 0.31.1450.3384.1349.1329.5326.3521 00040080 000
–0.60.3299.7333.0330.2325.6324.936–2 000 0.00.7379.5359.3339.6327.1325.435–500 0.41.1461.1387.0350.0329.6326.4341 000550110 000
–0.50.3310.0335.9331.3325.8325.018–2 000 0.10.7390.0362.3340.6327.4325.517–500 0.41.1471.8390.0351.1329.9326.5161 000700140 0001.37
–0.80.1277.9326.4327.2324.6324.466–2 000 –0.10.5359.4353.0336.5326.2324.965–500 0.31.0443.0380.9347.0328.7325.9641 00000
–0.50.3308.2335.0330.4325.6324.948–2 000 0.10.7390.6361.6339.8327.1325.447–500 0.51.1475.0389.6350.3329.6326.4461 00040080 000
–0.40.3318.9337.8331.4325.8325.030–2 000 0.20.7401.6364.5340.7327.3325.529(B)–500 0.51.2486.2392.5351.2329.8326.5281 000550110 000
–0.30.4329.5340.9332.4326.0325.112–2 000 0.20.8412.5367.6341.8327.5325.611–500 0.61.2497.4395.5352.3330.0326.6101 000700140 0001.55
–0.60.2296.1331.1328.4324.9324.560–2 000 0.00.6380.6358.0337.8326.4325.059–500 0.51.0467.3386.2348.3328.9326.0581 00000
–0.30.3327.6339.8331.6325.8325.042–2 000 0.30.7413.0366.8341.0327.3325.541–500 0.61.2500.5395.0351.5329.9326.5401 00040080 000
–0.20.4338.6342.7332.6326.0325.024–2 000 0.30.8424.4369.7342.0327.5325.523–500 0.71.2512.1398.0352.5330.0326.5221 000550110 000
–0.10.4349.8345.8333.6326.2325.26–2 000 0.40.8435.8372.8343.0327.7325.75–500 0.81.2523.7401.1353.6330.3326.741 000700140 0001.74
DE C L I N I N G IM P R O V E M E N T IN L I F E EX P E C T A N C Y (m e d i u m a s s u m p t i o n )
%%'000'000'000'000'000SeriesNIMNOMACT
NOMAust.TFR
2041–
2051
2004–
201120512021201120062005
GROWTHRATE(a)AT 30 JUNE
PROJECTED POPULAT ION, Vary ing component leve ls —Aust ra l ian Cap i ta l
Ter r i to ry5.36 . . . . . . . . . . . . . . . . . . . . . . . . . . . . . . . . . . . . . . . . . . . . . . . . . . . . . . . . . . . . . . .
A B S • P O P U L A T I O N P R O J E C T I O N S , A U S T R A L I A • 3 2 2 2 . 0 • 2 0 0 4 T O 2 1 0 1 13 9
CH A P T E R 5 • D E T A I L E D T A B L E S

(a) Average annual growth rate.
–0.70.1279.4322.6326.1324.5324.369–2 000 –0.10.5360.2349.0335.4326.0324.868–500 0.40.9443.1376.6345.8328.5325.8671 00000
–0.40.2308.4331.1329.3325.5324.851–2 000 0.10.6390.0357.5338.7327.0325.350–500 0.51.1473.7385.1349.1329.5326.3491 00040080 000
–0.30.3318.6333.9330.2325.6324.933–2 000 0.20.7400.6360.3339.6327.1325.432–500 0.61.1484.4388.0350.0329.6326.4311 000550110 000
–0.20.3329.0336.9331.3325.8325.015–2 000 0.30.7411.2363.3340.6327.4325.514–500 0.61.1495.2391.0351.1329.9326.5131 000700140 0001.37
–0.50.1296.9327.3327.2324.6324.463–2 000 0.10.5380.7354.0336.5326.2324.962–500 0.51.0466.7381.9347.0328.7325.9611 00000
–0.20.3327.2335.9330.4325.6324.945–2 000 0.30.7411.8362.6339.8327.1325.444–500 0.71.1498.4390.6350.3329.6326.4431 00040080 000
–0.10.3337.8338.8331.4325.8325.027–2 000 0.40.7422.7365.5340.7327.3325.526–500 0.71.2509.5393.5351.2329.8326.5251 000550110 000
0.00.4348.6341.8332.4326.0325.19–2 000 0.40.8433.7368.6341.8327.5325.68–500 0.81.2520.8396.6352.3330.0326.671 000700140 0001.55
–0.30.2315.2332.0328.4324.9324.557–2 000 0.30.6402.0359.0337.8326.4325.056–500 0.71.0491.0387.2348.3328.9326.0551 00000
0.00.3346.6340.8331.6325.8325.039–2 000 0.50.7434.2367.7341.0327.3325.538–500 0.81.2523.9396.0351.5329.9326.5371 00040080 000
0.10.4357.7343.7332.6326.0325.021–2 000 0.50.8445.6370.7342.0327.5325.520–500 0.91.2535.4399.0352.5330.0326.5191 000550110 000
0.10.4368.9346.8333.6326.2325.23–2 000 0.60.8457.0373.8343.0327.7325.72–500 0.91.2547.1402.1353.6330.3326.71(A)1 000700140 0001.74
CO N S T A N T IM P R O V E M E N T IN L I F E EX P E C T A N C Y ( h i g h a s s u m p t i o n )
%%'000'000'000'000'000SeriesNIMNOMACT
NOMAust.TFR
2041–
2051
2004–
201120512021201120062005
GROWTHRATE(a)AT 30 JUNE
PROJECTED POPULAT ION, Vary ing component leve ls —Aust ra l ian Cap i ta l
Ter r i to ry co n t i n u e d5.36 . . . . . . . . . . . . . . . . . . . . . . . . . . . . . . . . . . . . . . . . . . . . . . . . . . . . . . .
14 0 A B S • P O P U L A T I O N P R O J E C T I O N S , A U S T R A L I A • 3 2 2 2 . 0 • 2 0 0 4 T O 2 1 0 1
CH A P T E R 5 • D E T A I L E D T A B L E S

(a) Estimated resident population, base population.
289.5401.6547.12051291.7401.1542.32050293.8400.5537.42049296.0399.9532.62048298.1399.3527.82047
300.2398.6523.02046302.2398.0518.22045304.2397.3513.42044306.1396.5508.62043308.0395.8503.92042
309.8394.9499.12041311.6394.1494.42040313.3393.2489.72039314.9392.2485.02038316.5391.2480.32037
318.0390.1475.52036319.4388.9470.82035320.7387.6466.02034321.9386.3461.22033323.0384.9456.42032
324.1383.4451.62031325.0381.8446.72030325.9380.2441.82029326.7378.4436.92028327.4376.6432.02027
328.0374.8427.02026328.6372.8422.02025329.0370.8417.12024329.5368.8412.12023329.8366.7407.12022
330.1364.5402.12021330.4362.3397.22020330.6360.1392.22019330.7357.8387.32018330.8355.5382.42017
330.8353.2377.52016330.7350.8372.72015330.5348.3367.82014330.2345.8363.12013329.8343.3358.32012
329.3340.7353.62011328.7338.1348.82010328.0335.5344.22009327.3332.8339.52008326.4330.0334.92007
325.5327.3330.32006324.8325.5326.72005324.1324.1324.12004(a)
'000'000'000
Series CSeries BSeries A
At 30 June
PROJECTED POPULAT ION, Aust ra l ian Cap i ta l Ter r i to r y5.37 . . . . . . . . . . . . . . . . . . . . . . .
A B S • P O P U L A T I O N P R O J E C T I O N S , A U S T R A L I A • 3 2 2 2 . 0 • 2 0 0 4 T O 2 1 0 1 14 1
CH A P T E R 5 • D E T A I L E D T A B L E S

EX P L A N A T O R Y NO T E S . . . . . . . . . . . . . . . . . . . . . . . . . . . . . . .
11 There are many techniques which may be used for population projections, ranging
from simple extrapolations through broad economic, social and time-series analysis to
detailed component methods. The ABS uses the cohort-component method, which
begins with a base population for each sex by single year of age and advances it year by
year by applying assumptions regarding future fertility, mortality and migration. This
procedure is repeated for each year in the projection period for each state and territory
and for Australia, as well as each capital city/balance of state in each state and territory.
The resulting population projections for each year for the states and territories, by sex
and single year of age, are adjusted to sum to the Australian results. Likewise, capital
PR O J E C T I O N TE C H N I Q U E S
9 The process of developing population projections involves research, analysis,
consultation and computation. Analysis of demographic trends, research into the
determinants of population growth and distribution, and consultation with government
agencies at both national and state levels are necessary to formulate the various
assumptions and to ensure their general relevance for the projection period.
10 Consultation occurred from August to October 2005, following which assumptions
for the population projections were finalised. For fertility three assumptions were
selected. Two assumptions were used for mortality, three assumptions were used
overseas migration and three assumptions were used for internal migration. In addition,
a zero net overseas migration assumption has been included to facilitate analysis of the
impact of overseas migration to Australia.
DE V E L O P M E N T
5 The ABS currently publishes population projections every two to three years in order
to regularly service the needs of users of population projections.
6 The projections are not intended as predictions or forecasts, but are illustrations of
growth and change in the population that would occur if assumptions made about future
demographic trends were to prevail over the projection period.
7 While the assumptions for the projections are formulated on the basis of an
assessment of past demographic trends, both in Australia and overseas, there is no
certainty that any of the assumptions will or will not be realised. In addition, no
assessment has been made of changes in non-demographic conditions.
8 Accordingly, alternative projections have been provided in recognition of this
uncertainty and to provide users with a range of options.
OB J E C T I V E S
1 This publication contains projections of Australia's population by age and sex for the
period 2004–2101, and projections of the states, territories and capital cities/balances of
state for the period 2004–2051. Capital city/balance of state projections were not
generated for the Australian Capital Territory.
2 Three main series of projections have been presented in this publication. These
series have been selected to provide a range, although not the full range, of projections
for analysis and discussion.
3 These projections supersede the 2002-based series, published in Population
Projections, Australia, 2002–2101 (cat. no. 3222.0) in September 2003.
4 The projections for Australia include Other Territories comprising, Christmas Island,
Cocos (Keeling) Islands and Jervis Bay Territory.
I N T R O D U C T I O N
14 2 A B S • P O P U L A T I O N P R O J E C T I O N S , A U S T R A L I A • 3 2 2 2 . 0 • 2 0 0 4 T O 2 1 0 1

15 Users may also wish to refer to the following ABS electronic data and publications:
AusStats - electronic data, ABS web site <http://www.abs.gov.au>
Australian Demographic Statistics (cat. no. 3101.0) — issued quarterly
Australian Demographic Trends (cat. no. 3102.0) — issued irregularly
Births, Australia (cat. no. 3301.0) — issued annually
Causes of Death, Australia (cat. no. 3303.0) — issued annually
Deaths, Australia (cat. no. 3302.0) — issued annually
Demographic Estimates and Projections: Concepts, Sources and Methods, Statistical
Concepts Library, ABS web site <http://www.abs.gov.au>
Experimental Projections of the Aboriginal and Torres Strait Islander Population
(cat. no. 3231.0) — issued irregularly
Household and Family Projections, Australia, 2001 to 2026 (cat. no. 3236.0) —
issued irregularly
Migration, Australia (cat. no. 3412.0) — issued annually
Overseas Arrivals and Departures, Australia (cat. no. 3401.0) — issued monthly
Population by Age and Sex, Australian States and Territories (cat. no. 3201.0) —
issued annually
16 Current publications and other products released by the ABS are listed in the
Catalogue of Publications and Products (cat. no. 1101.0). The Catalogue is available
from any ABS office. The ABS also issues a daily Release Advice on the web site which
details products to be released in the week ahead.
17 As well as the statistics included in this and related publications, additional
information is available from the ABS web site at <http://www.abs.gov.au> and
accessing the ABS Demography theme page by selecting Themes > Demography.
RE L A T E D PU B L I C A T I O N AN D
RE F E R E N C E S
14 ABS publications draw extensively on information provided freely by individuals,
businesses, governments and other organisations. Their continued cooperation is very
much appreciated; without it, the wide range of statistics published by the ABS would
not be available. Information received by the ABS is treated in strict confidence as
required by the Census and Statistics Act 1905.
AC K N O W L E D G M E N T
13 The ABS is currently undertaking a review of methods for estimating net overseas
migration. Until the completion of this review an interim method of adjusting these
components, known as migration adjustment, has been applied to NOM estimates for
the years ending June 2002 to June 2004. Further information will be available in the
forthcoming ABS Information Paper — Improved Methods for Estimating Net Overseas
Migration (cat. no. 3107.0.55.003), expected to be released on 10 February 2006.
Information about the interim method is provided in Demography Working Paper
2003/5 - Net Overseas Migration: Adjusting for Actual Duration of Stay or Absence
available from the ABS web site <http://www.abs.gov.au.au> by selecting Themes >
Demography > ABS Demography Working Papers.
RE V I E W OF NE T OV E R S E A S
M I G R A T I O N ME T H O D S
12 Assumptions regarding future levels of fertility, mortality and migration used to
produce the population projections, and how they were formulated, are discussed in
Chapter 2 — Assumptions.
AS S U M P T I O N S
city/balance of state projections are adjusted to sum to their respective state/territory
projections.
PR O J E C T I O N TE C H N I Q U E S
continued
A B S • P O P U L A T I O N P R O J E C T I O N S , A U S T R A L I A • 3 2 2 2 . 0 • 2 0 0 4 T O 2 1 0 1 14 3
EX P L A N A T O R Y N O T E S

18 More detailed information for the three main series presented in this publication
can be obtained free of charge from the ABS web site <http://www.abs.gov.au> by
selecting AusStats > Publications and Data > Data Cubes > by Catalogue/Subject, and
then selecting 32. Population trends and estimates, 3222.0 – Population Projections,
Australia. Data cubes provided are:
Population Projections for Australia, 2004–2101—in SuperTABLE format
Population Projections by Capital City/Balance of State, 2004–2051—in
SuperTABLE format
Projected Population, Components of Change and Summary Statistics, for
Australia, States and Territories, Capital Cities and Balances of State—in
Microsoft Excel format
19 Population projections are also available in Time Series Spreadsheet format from
the ABS web site <http://www.abs.gov.au> by selecting AusStats > Publications and
Data > Time Series Spreadsheets > by Catalogue/Subject, and then selecting 32.
Population trends and estimates, 3222.0 – Population Projections, Australia.
20 Detailed information for the remaining series can be made available on request by
contacting the National Information and Referral Service. A charge is usually incurred for
providing this data. The ABS is also able to produce customised projections to meet
specific requirements.
AD D I T I O N A L S T A T I S T I C S
AV A I L A B L E
14 4 A B S • P O P U L A T I O N P R O J E C T I O N S , A U S T R A L I A • 3 2 2 2 . 0 • 2 0 0 4 T O 2 1 0 1
EX P L A N A T O R Y N O T E S

GL O S S A R Y . . . . . . . . . . . . . . . . . . . . . . . . . . . . . . . . . . . . . . . . . . . .
Overseas arrivals and departures are classified according to length of stay (in Australia oroverseas), recorded in months and days by travellers on passenger cards. There are threemain categories of movement:! permanent movements! long-term movements (one year or more)! short-term movements (less than one year).
Category of movement
Category jumping was the name given to the adjustment made to the components of netoverseas migration, when these were applied, up until the year ending 30 June 1996.Category jumping was set to zero for the years ending 30 June 1997 to 2001. With theinterim method of adjusting these components, this adjustment is now known asoverseas migration adjustment. Category jumping was the term used to describe changesbetween intended and actual duration of stay of travellers to/from Australia, such thattheir classification as short-term or as long-term/permanent movers is different atarrival/departure from that after 12 months. For more information, see Chapter 6"Special article: Adjustments to overseas migration estimates", from Migration, Australia2002–03 (cat. no. 3412.0).
Category jumping
Refers to the Capital City Statistical Divisions of states and territories as defined inStatistical Geography: Volume 1. Australian Standard Geographical Classification(ASGC) (cat. no. 1216.0).
Capital city
The delivery of a child, irrespective of the duration of pregnancy, who, after being born,breathes or shows any evidence of life such as a heartbeat.
Birth
Baby boom refers to the generation born between the end of World War II and themid-1960s. Baby boomers are usually taken to be those born in the years 1946 to 1965inclusive.
Baby boom
The aggregation of all Statistical Divisions (SD) within a state or territory other than itsCapital City SD. See Major Statistical Region in Australian Standard GeographicalClassification (ASGC) (cat. no. 1216.0).
Balance of state/territory
The average annual population growth rate, r, is calculated as a percentage using theformula:
r =Pn
Po
1n − 1 % 100
where P0 is the population at the start of the period, Pn is the population at the end ofthe period and n is the length of the period between Pn and P0 in years.
Average annual growth rate
Age-specific fertility rates are the number of live births (occurred or registered) duringthe calendar year, according to the age of the mother, per 1,000 of the female estimatedresident population of the same age at 30 June. For calculating these rates, births tomothers under 15 years are included in the 15–19 years age group, and births to mothersaged 50 years and over are included in the 45–49 years age group.
Age-specific fertility rates
Age-specific death rates are the number of deaths (occurred or registered) during thecalendar year at a specified age per 1,000 of the estimated resident population of thesame age at mid-point of the year (30 June). Pro rata adjustment is made in respect ofdeaths for which the age of the deceased is not given.
Age-specific death rates
A B S • P O P U L A T I O N P R O J E C T I O N S , A U S T R A L I A • 3 2 2 2 . 0 • 2 0 0 4 T O 2 1 0 1 14 5

For any distribution the median value (age, duration, interval) is that value which dividesthe relevant population into two equal parts, half falling below the value, and halfexceeding it. Where the value for a particular record has not been stated, that record isexcluded from the calculation.
Median value
Long-term departures comprise:! Australian residents who intend to stay abroad for 12 months or more (but not
permanently)! overseas visitors departing who stayed 12 months or more in Australia.
Long-term departures
Long-term arrivals comprise:! overseas visitors who intend to stay in Australia for 12 months or more (but not
permanently)! Australian residents returning after an absence of 12 months or more overseas.
Long-term arrivals
Life expectancy refers to the average number of additional years a person of a given ageand sex might expect to live if the age-specific death rates of the given period continuedthroughout his or her lifetime.
Life expectancy
The difference between the number of persons who have changed their place of usualresidence by moving into a defined geographical area and the number who havechanged their place of usual residence by moving out of that defined geographical areaduring a specified time period. This difference may be either positive or negative.
Internal migration
Intercensal discrepancy is the difference between two estimates at 30 June of a censusyear population, the first based on the latest census and the second arrived at byupdating the 30 June estimate of the previous census year with intercensal componentsof population change which take account of information available from the latest census.It is caused by errors in the start and/or finish population estimates and/or in estimatesof births, deaths or migration in the intervening period which cannot be attributed to aparticular source.
Intercensal discrepancy
The number of deaths of children under one year of age in a calendar year per 1,000 livebirths in the same calendar year.
Infant mortality rate
A fertility schedule is a time series of age-specific fertility rates.Fertility schedule
The official measure of the population of Australia is based on the concept of residence.It refers to all people, regardless of nationality or citizenship, who usually live inAustralia, with the exception of foreign diplomatic personnel and their families. Itincludes usual residents who are overseas for less than 12 months. It excludes overseasvisitors who are in Australia for less than 12 months.
Estimated resident population
The dependency ratio is a measure used to compare the size of the working agepopulation to the size of the non-working age population, calculated as the sum ofpeople aged 0–14 and 65 years and over (that is, 'dependents') divided by the number ofpeople aged 15–64 years, multiplied by 100.
Dependency ratio
A significant number of travellers (i.e. overseas visitors to Australia on arrival andAustralian residents going abroad) state exactly 12 months or one year as their intendedperiod of stay. Many of them stay for less than that period and on their departure from,or return to, Australia are therefore classified as short-term.
Accordingly, in an attempt to maintain consistency between arrivals and departures,movements of travellers who report their actual or intended period of stay as being oneyear exactly are randomly allocated to long-term or short-term in proportion to thenumber of movements of travellers who report their actual length of stay as up to onemonth more, or one month less, than one year.
Category of movement continued
14 6 A B S • P O P U L A T I O N P R O J E C T I O N S , A U S T R A L I A • 3 2 2 2 . 0 • 2 0 0 4 T O 2 1 0 1
GL O S S A R Y

Short-term departures comprise:! Australian residents who intend to stay abroad for less than 12 months
Short-term departures
Short-term arrivals comprise:! overseas visitors who intend to stay in Australia for less than 12 months! Australian residents returning after a stay of less than 12 months overseas.
Short-term arrivals
The sex ratio relates to the number of males per 100 females. The sex ratio is defined fortotal population, at birth, at death and among age groups by appropriately selecting thenumerator and denominator of the ratio.
Sex ratio
Replacement level fertility is the number of babies a female would need to have over herreproductive life span to replace herself and her partner. Given the current mortality offemales up to age 49 years, replacement fertility is estimated at 2.1 babies per female.
Replacement fertility
Population change over a period as a proportion (percentage) of the population at thebeginning of the period.
Rate of population growth
For Australia, population growth is the sum of natural increase and net overseasmigration. For states and territories, population growth also includes net interstatemigration. After the census, intercensal population growth also includes an allowance forintercensal discrepancy.
Population growth
Permanent departures are Australian residents (including former settlers) who ondeparture state that they are departing permanently.
Permanent departures
Permanent arrivals (settlers) comprise:! travellers who hold migrant visas (regardless of stated intended period of stay)! New Zealand citizens who indicate an intention to settle! those who are otherwise eligible to settle (e.g. overseas-born children of Australian
citizens).
This definition of settlers is used by the Department of Immigration and Multiculturaland Indigenous Affairs (DIMIA). Prior to 1985 the definition of settlers used by the ABSwas the stated intention of the traveller only. Numerically the effect of the change indefinition is insignificant. The change was made to avoid the confusion caused by minordifferences between data on settlers published separately by the ABS and the DIMIA.
Permanent arrivals (settlers)
See Migration adjustment.Overseas migration adjustment
Other Territories comprises Christmas Island, Cocos (Keeling) Islands and Jervis BayTerritory.
Other Territories
The difference between the number of permanent (settler) and long-term arrivals fromoverseas and the number of permanent and long-term departures from Australia.Short-term movements are excluded.
Net permanent and long-termmigration
Net overseas migration is net permanent and long-term migration plus an adjustment forthe effect of category jumping.
Net overseas migration
The difference between the number of persons who have changed their place of usualresidence by moving into a given state or territory and the number who have changedtheir place of usual residence by moving out of that state or territory during a specifiedtime period. This difference can be either positive or negative.
Net interstate migration
The excess of births over deaths.Natural increase
The ABS applies a number of adjustments to overseas arrivals and departures data inorder to produce estimates of net overseas migration (NOM). These mainly compriseadjustments designed to reflect differences between stated travel intentions and actualtravel behaviour, but (in the case of revised NOM estimates) also include adjustments totransform numbers of overseas movements into numbers of travellers. Theseadjustments are collectively referred to as 'migration adjustments', although they havebeen referred to in the past as 'category jumping' adjustments.
Migration adjustment
A B S • P O P U L A T I O N P R O J E C T I O N S , A U S T R A L I A • 3 2 2 2 . 0 • 2 0 0 4 T O 2 1 0 1 14 7
GL O S S A R Y
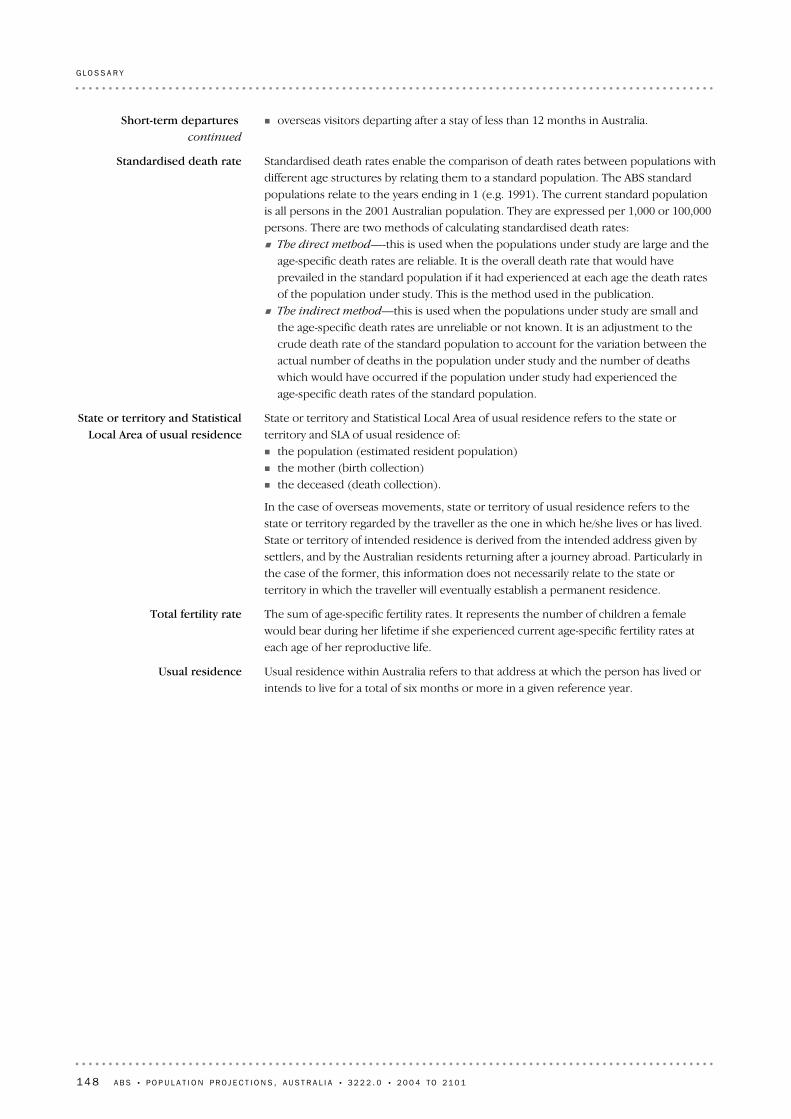
Usual residence within Australia refers to that address at which the person has lived orintends to live for a total of six months or more in a given reference year.
Usual residence
The sum of age-specific fertility rates. It represents the number of children a femalewould bear during her lifetime if she experienced current age-specific fertility rates ateach age of her reproductive life.
Total fertility rate
State or territory and Statistical Local Area of usual residence refers to the state orterritory and SLA of usual residence of:! the population (estimated resident population)! the mother (birth collection)! the deceased (death collection).
In the case of overseas movements, state or territory of usual residence refers to thestate or territory regarded by the traveller as the one in which he/she lives or has lived.State or territory of intended residence is derived from the intended address given bysettlers, and by the Australian residents returning after a journey abroad. Particularly inthe case of the former, this information does not necessarily relate to the state orterritory in which the traveller will eventually establish a permanent residence.
State or territory and StatisticalLocal Area of usual residence
Standardised death rates enable the comparison of death rates between populations withdifferent age structures by relating them to a standard population. The ABS standardpopulations relate to the years ending in 1 (e.g. 1991). The current standard populationis all persons in the 2001 Australian population. They are expressed per 1,000 or 100,000persons. There are two methods of calculating standardised death rates:! The direct method—-this is used when the populations under study are large and the
age-specific death rates are reliable. It is the overall death rate that would haveprevailed in the standard population if it had experienced at each age the death ratesof the population under study. This is the method used in the publication.
! The indirect method—this is used when the populations under study are small andthe age-specific death rates are unreliable or not known. It is an adjustment to thecrude death rate of the standard population to account for the variation between theactual number of deaths in the population under study and the number of deathswhich would have occurred if the population under study had experienced theage-specific death rates of the standard population.
Standardised death rate
! overseas visitors departing after a stay of less than 12 months in Australia.Short-term departures continued
14 8 A B S • P O P U L A T I O N P R O J E C T I O N S , A U S T R A L I A • 3 2 2 2 . 0 • 2 0 0 4 T O 2 1 0 1
GL O S S A R Y

B I B L I O G R A P H Y . . . . . . . . . . . . . . . . . . . . . . . . . . . . . . . . . . . . . . .
Department of Treasury 2002, Budget Paper No. 5: Intergenerational Report 2002–03,
Commonwealth of Australia, Canberra.
IM P L I C A T I O N S OF AG E I N G
Department of Immigration and Multicultural and Indigenous Affairs 2004, Immigration
Update 2003-04, Commonwealth of Australia, Canberra.
OV E R S E A S M I G R A T I O N
Booth, H, Maindonald, J & Smith, L 2002, 'Applying Lee-Carter under conditions of
variable mortality decline', Population Studies, vol. 56, no. 3, pp. 325–336.
MO R T A L I T Y
Australian Bureau of Statistics 2004, Births, Australia, 2003 (cat. no. 3301.0).
Carmichael, G 1998, 'Things Ain't What They Used To Be! Demography, Mental Cohorts,
Mortality and Values in Post-war Australia', Journal of the Population
Association, Vol. 15, no. 2, pp. 91–113 (Presidential Address to the Australian
Population Association).
Population Division of the Department of Economic and Social Affairs of the United
Nations Secretariat 2005, World Population Prospects: The 2004 Revision
<http://esa.un.org/unpp>.
Population Reference Bureau, 2004, World Population Data Sheet
<http://www.prb.org/pdf04/04WorldDataSheet_Eng.pdf>.
Statistics New Zealand 2004, National Population Projections,
<http://www.stats.govt.nz/datasets/population/population-projections.htm>
United States Census Bureau 2004, US Interim Projections by Age, Sex, Race and
Hispanic Origin, <http://www.census.gov/ipc/www/usinterimproj/>
FE R T I L I T Y
A B S • P O P U L A T I O N P R O J E C T I O N S , A U S T R A L I A • 3 2 2 2 . 0 • 2 0 0 4 T O 2 1 0 1 14 9


www.abs.gov.auWEB ADDRESS
All ABS publications can be downloaded free of chargefrom the ABS web site.
F R E E A C C E S S T O P U B L I C A T I O N S
Client Services, ABS, GPO Box 796, Sydney NSW 2001POST
1300 135 211FAX
1300 135 070PHONE
Data already published that can be provided within fiveminutes will be free of charge. Our information consultantscan also help you to access the full range of ABSinformation—ABS user pays services can be tailored toyour needs, time frame and budget. Publications may bepurchased. Specialists are on hand to help you withanalytical or methodological advice.
I N F O R M A T I O N S E R V I C E
This service now provides only current Consumer PriceIndex statistics call 1900 986 400 (call cost 77c perminute).
DIAL-A-STATISTIC
For current and historical Consumer Price Index data, call1902 981 074 (call cost 77c per minute).
CPI INFOLINE
A range of ABS publications is available from public andtertiary libraries Australia-wide. Contact your nearest libraryto determine whether it has the ABS statistics you require,or visit our web site for a list of libraries.
LIBRARY
www.abs.gov.au the ABS web site is the best place tostart for access to summary data from our latestpublications, information about the ABS, advice aboutupcoming releases, our catalogue, and Australia Now—astatistical profile.
INTERNET
F O R M O R E I N F O R M A T I O N . . .
ISSN 1442 75752322200001044
RRP $40.00
© Commonwealth of Australia 2005Produced by the Australian Bureau of Statistics
32
22
.0
•
PO
PU
LA
TI
ON
P
RO
JE
CT
IO
NS
, A
US
TR
AL
IA
•
20
04
to 2
10
1