population estimates for orleans parish july 2007
TRANSCRIPT

Population Estimates for Orleans ParishJuly 2007

Population of Orleans Parish

Recovery of Population
The repopulation of the city has remained steady throughout the two-year period since Hurricane Katrina.
Thus far, the overall population of the city has not reached a plateau.

Repopulation by Flood Depth
The pace at which areas have recovered is directly related to the amount of flooding they received following Katrina.

Neighborhood Recovery
Neighborhoods with significant flood damage have been slow to repopulate. In several of these neighborhoods, fewer than one-third of residents have returned.
Areas closest to the river, where flooding was minimal, recovered their population quickly and have retained nearly all of their pre-storm population.
On the Westbank, where no significant flooding occurred, the population has returned to its pre-storm level.
NeighborhoodJuly 2007
Population
% of 2000 Population Returned
Garden District 1,921 98%
Vieux Carre 3,712 97%
Touro 3,112 96%
West Riverside 4,905 94%
Audubon/University 13,951 94%
Marigny 2,908 93%
Irish Channel 3,899 92%
East Carrollton 4,052 91%
Black Pearl 1,616 91%
St. Thomas Area/Lower Garden District
4,042 90%
NeighborhoodJuly 2007
Population
% of 2000 Population Returned
St. Anthony 1,589 30%
Pontchartrain Park 800 29%
Desire Area 999 26%
Holy Cross 1,384 25%
Viavant/Venetial Isles 468 25%
Florida Area 708 22%
St. Bernard Area 1,224 19%
READ Boulevard West B 1,738 18%
Calliope Project 451 10%
Lower Ninth Ward 917 7%
Eastbank Neighborhoods with Highest and Lowest Rates of Repopulation

Population by City Council District
Council District 2000 Population July 2007 Population % of 2000
Council District A 96,079 61,939 64%
Council District B 97,079 57,147 59%
Council District C 97,808 85,392 87%
Council District D 96,964 36,144 37%
Council District E 96,744 32,977 34%
Total 484,674 273,598 56%

Resettlement Patterns
GCR tracks activity in the city on a block-by-block basis; therefore, we have been able to monitor the pace at which each area of New Orleans has repopulated.
Soon after the storm, the population in areas with little or minimal flood damaged made significant returns.
Throughout the recovery period, proximity to repopulated areas has been a critical component to the recovery of tangential areas. The repopulation has radiated from largely unaffected areas into blocks and neighborhoods connected to these areas.
Accordingly, areas disconnected from largely recovered areas have been slow to regain their population. This condition is most acute in the Lower Ninth Ward and parts of Gentilly.
Snapshots of Recovery
The following four slides contain maps of the city at four periods of time: August 2006, December 2006, March 2007, and July 2007. These maps demonstrate the trend described in the previous slide; namely, the fact that repopulation has radiated outward from areas which recovered quickly after the storm.
In each of these maps, red represents areas in which activity is less than 20% of its pre-Katrina level. Green represents areas in which activity is greater than 80% of its pre-Katrina level. Yellow and orange display areas in between.
Boundaries of New Orleans City Council Districts are also displayed.
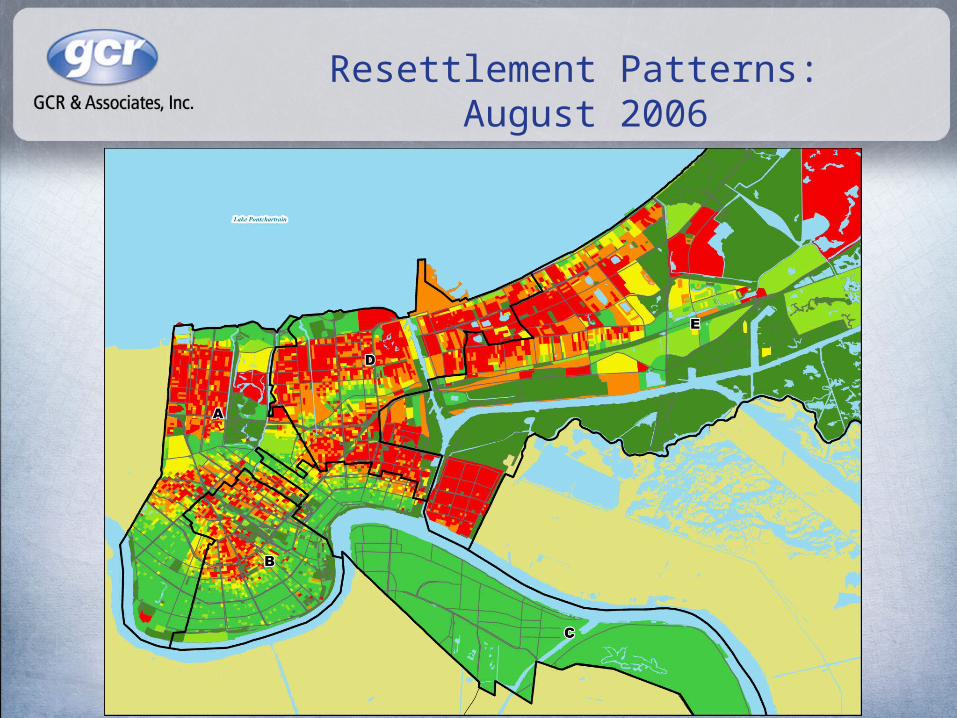
Resettlement Patterns: August 2006
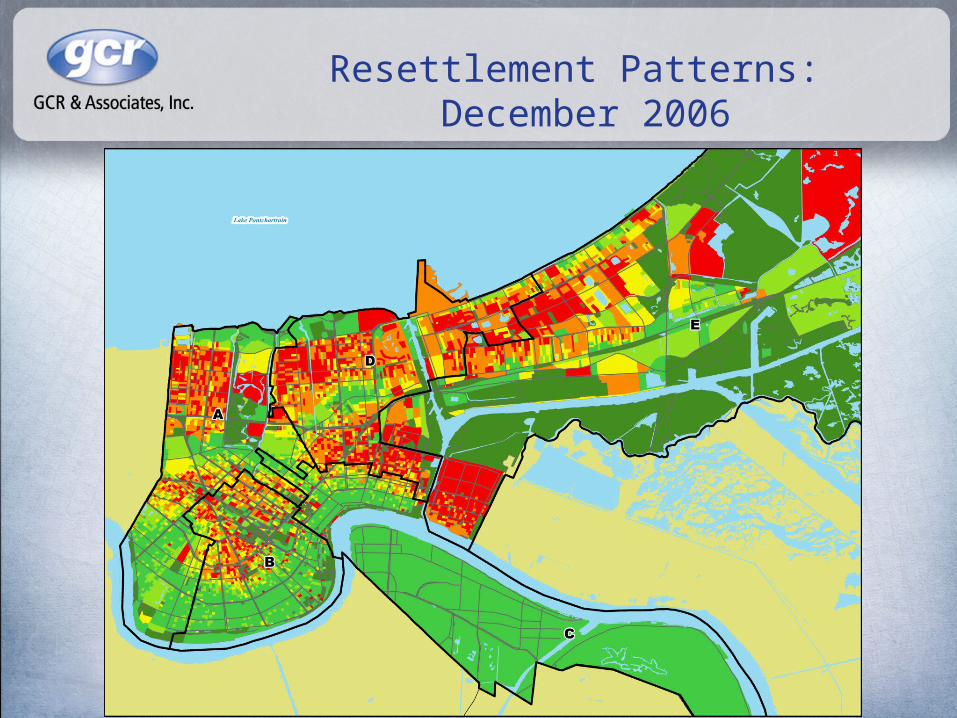
Resettlement Patterns: December 2006

Resettlement Patterns: March 2007

Resettlement Patterns: July 2007

GCR & Associates, Inc.Gregory C. Rigamer
504.304.2500 800.259.6192 fax 504.304.2525
2021 Lakeshore Drive New Orleans, LA 70122UNO Research & Technology ParkAdvanced Technology Center