population accessibility to radiotherapy services in nsw region of australia: a methodological...
TRANSCRIPT
1
Population Accessibility to Radiotherapy
Services in NSW Region of Australia: a
methodological contribution
Presented by: Dr. Nagesh Shukla
SMART Infrastructure Facility, University of Wollongong,
NSW, Australia 2500
Dr. R Wickramasuriya (SMART, Uni-Wollongong, Australia)
Prof. Andrew Miller (Illawarra Cancer Care Centre, ISLHD)
Prof. Pascal Perez (SMART, Uni-Wollongong, Australia)
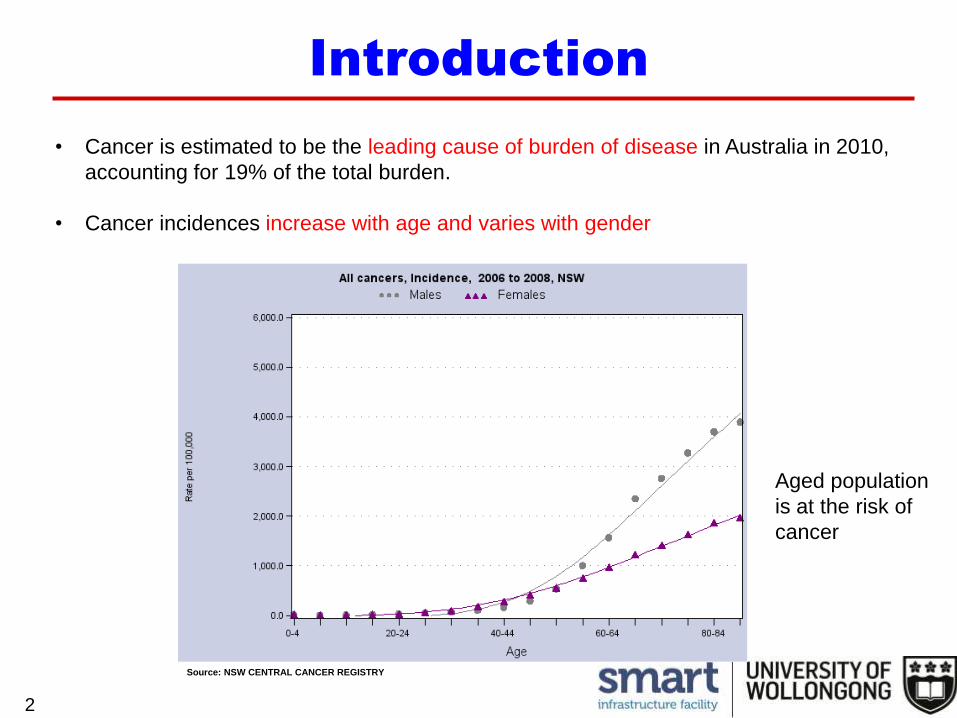
• Cancer is estimated to be the leading cause of burden of disease in Australia in 2010,
accounting for 19% of the total burden.
• Cancer incidences increase with age and varies with gender
Introduction
2
Source: NSW CENTRAL CANCER REGISTRY
Aged population
is at the risk of
cancer
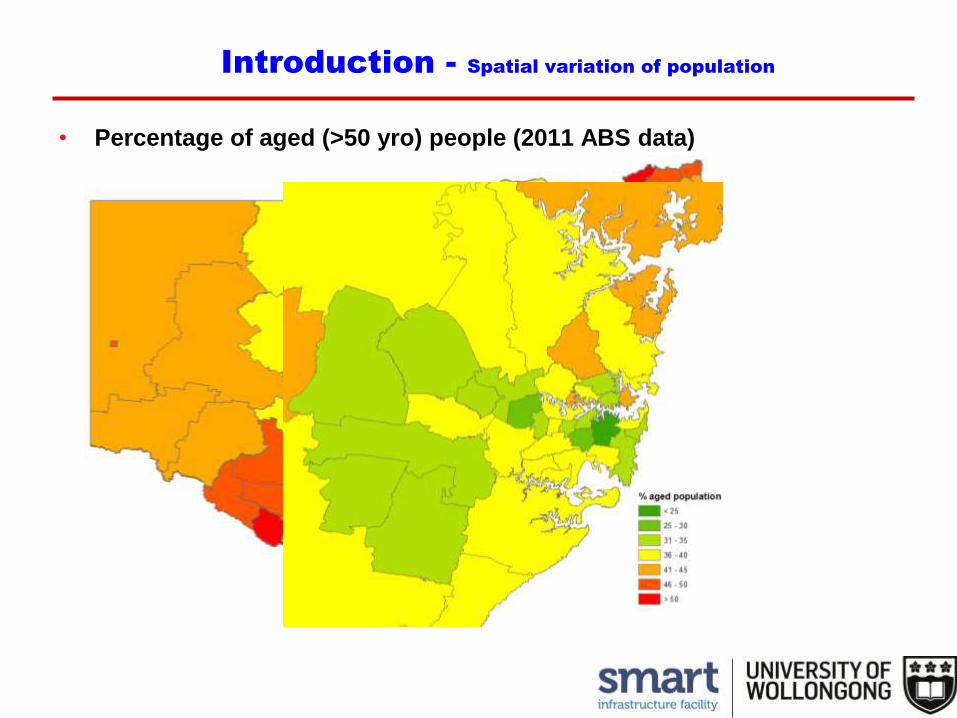
• Percentage of aged (>50 yro) people (2011 ABS data)
Introduction - Spatial variation of population
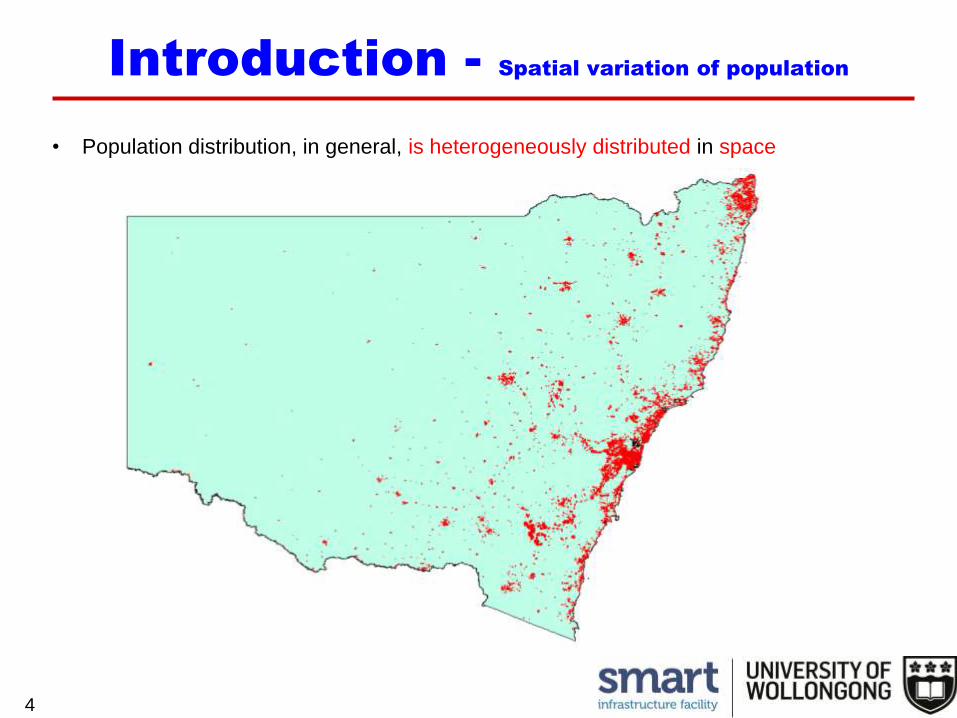
• Population distribution, in general, is heterogeneously distributed in space
Introduction - Spatial variation of population
4
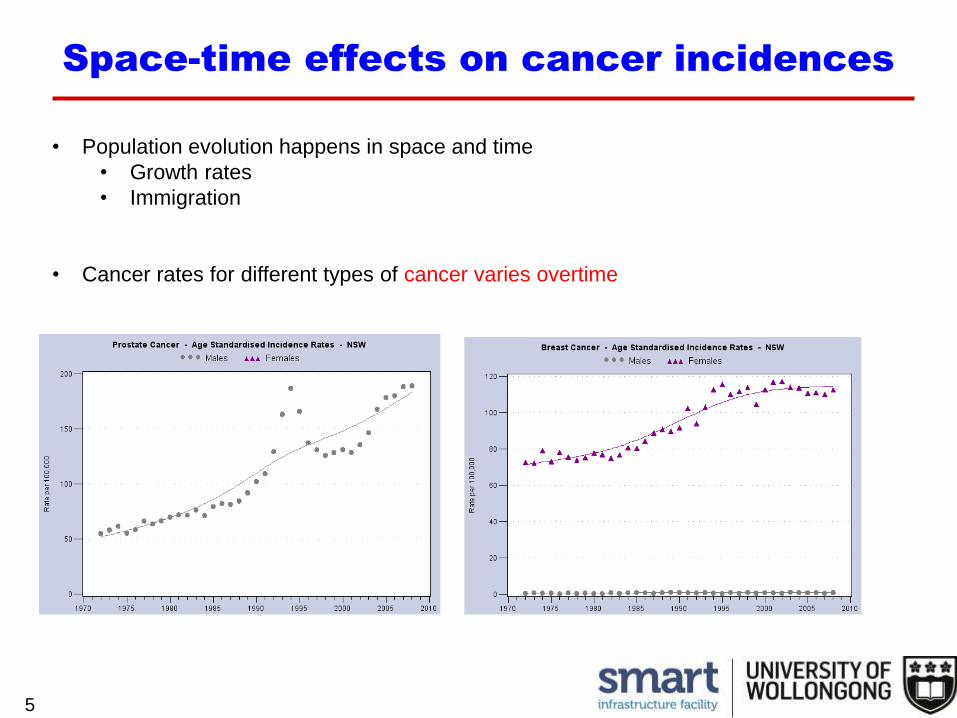
• Population evolution happens in space and time
• Growth rates
• Immigration
• Cancer rates for different types of cancer varies overtime
Space-time effects on cancer incidences
5
Regional Planning of Cancer Treatment services
6
• As life expectancy continues to grow; the proportion of elderly people in the
population will steadily increase over the next decades– it is expected that the number of cancer cases will continue to grow
• Thus, the pressure on specialised treatment services will increase as well,
calling for better planning and allocation of healthcare resources
• Radiotherapy (RT) is an essential mode of cancer treatment and contributes
to the cure of many cancer patients.– Evidence suggests that 52.3% of all diagnosed cancer cases in Australia would benefit from
RT
– However, only 38% of cancer sufferers receive radiotherapy at some point after the initial
detection
– This is largely due to the travel distance/access factors to RT centres
Regional Planning of RT services
7
• This research study proposes a methodology for location planning for RT
services with the help of:
– Population projections
– Cancer incidence rates estimation/prediction
– Road distance based accessibility to treatment centres
– Future RT demand estimation
Data Sources
8
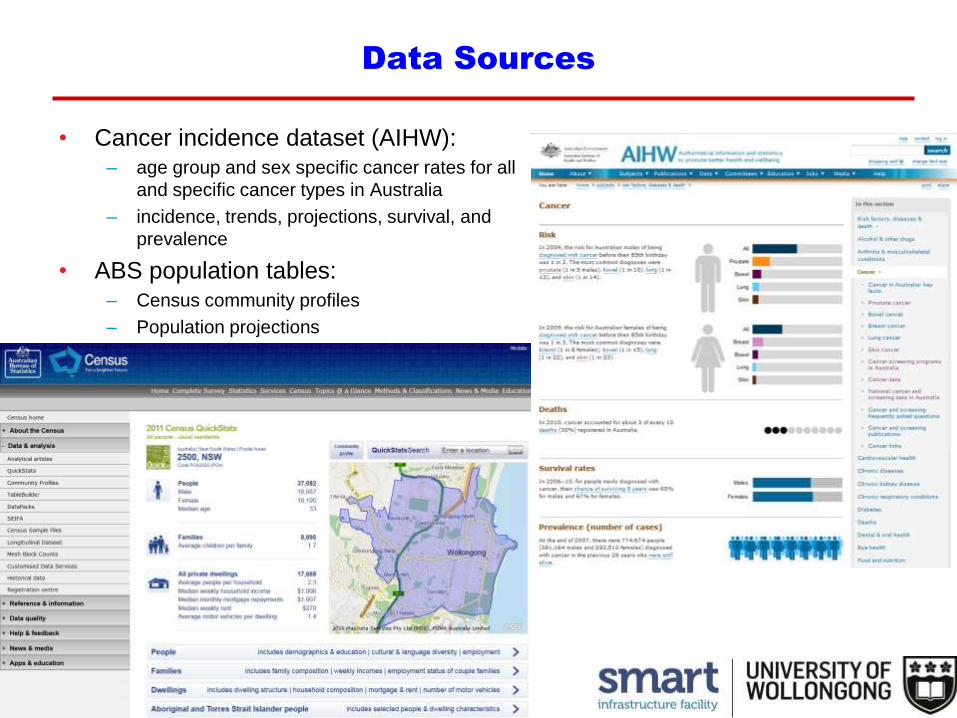
• Cancer incidence dataset (AIHW):– age group and sex specific cancer rates for all
and specific cancer types in Australia
– incidence, trends, projections, survival, and
prevalence
• ABS population tables:– Census community profiles
– Population projections
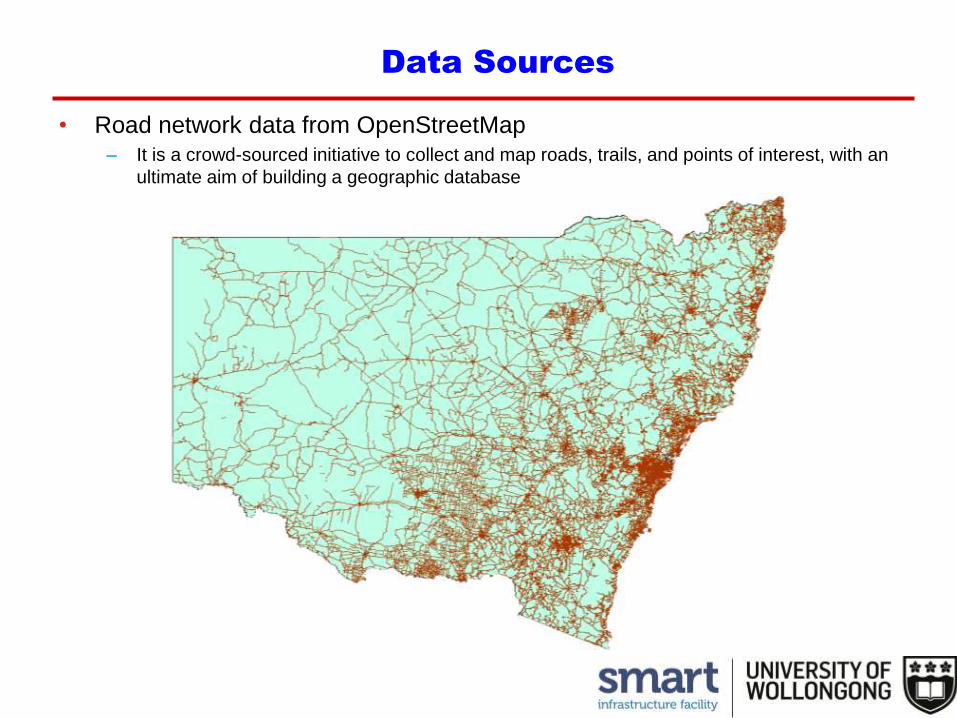
• Road network data from OpenStreetMap– It is a crowd-sourced initiative to collect and map roads, trails, and points of interest, with an
ultimate aim of building a geographic database
Data Sources
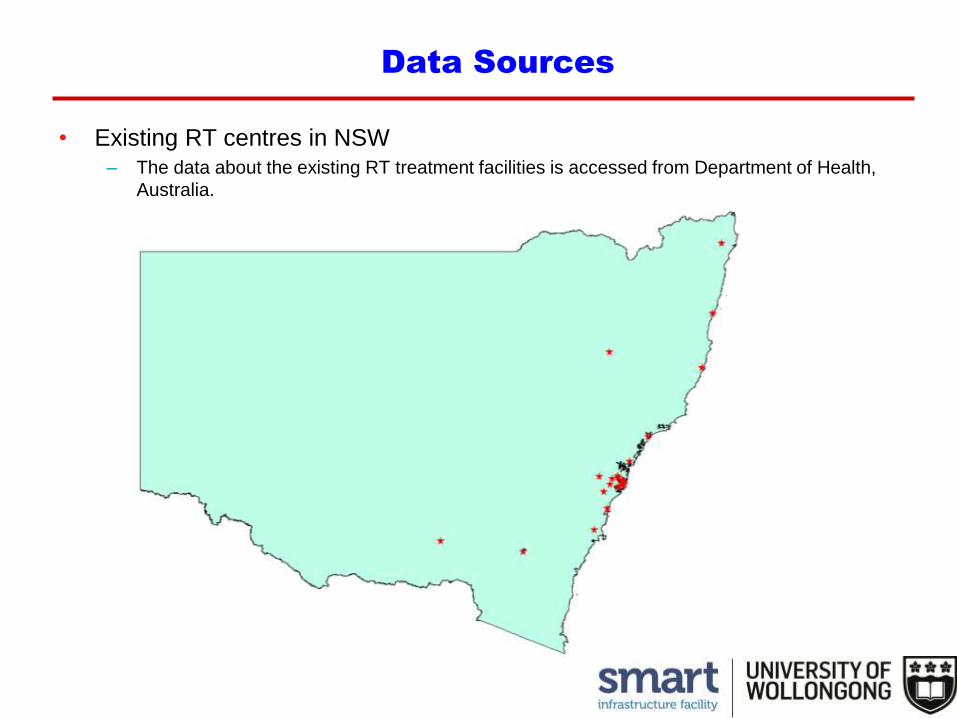
• Existing RT centres in NSW– The data about the existing RT treatment facilities is accessed from Department of Health,
Australia.
Data Sources
Proposed Methodology
11
• Age-sex specific rate (ASR) for cancer incidence modelling
– Linear regression is used to model the past trend of cancer incidences
– Models have been developed for each age-sex group
– Cancer incidences data for years 2000 to 2009 have been used
• Assumptions:
– incidence is homogeneous across different local government areas (LGAs)
– ages were grouped in 5 year interval assumes that each age group is
homogeneous
– it is assumed that the past trends will continue in future
Proposed Methodology
12
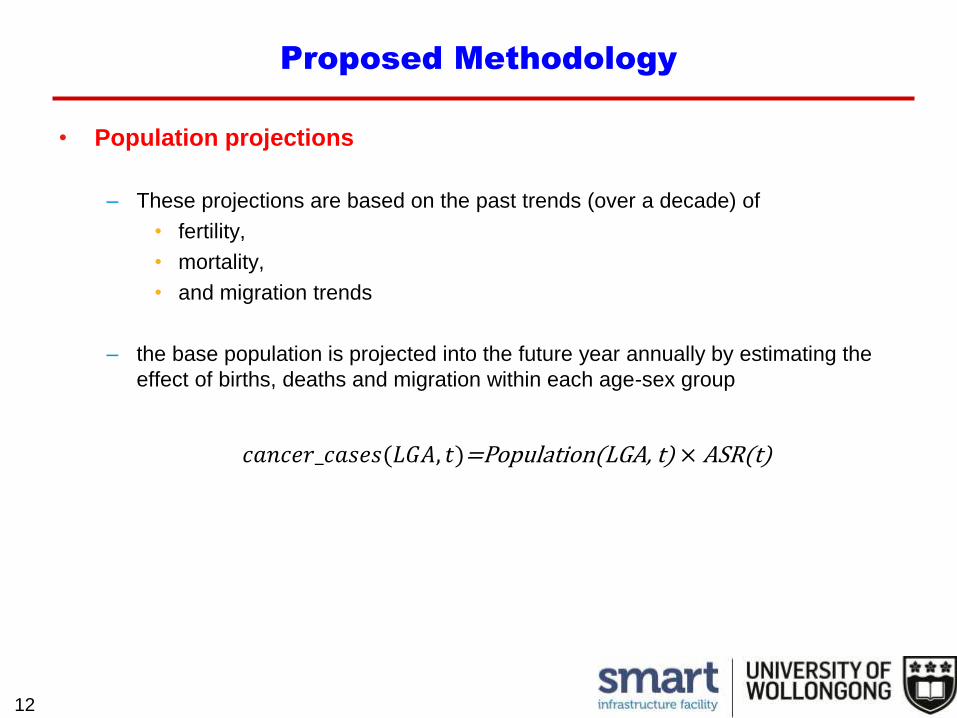
• Population projections
– These projections are based on the past trends (over a decade) of
• fertility,
• mortality,
• and migration trends
– the base population is projected into the future year annually by estimating the
effect of births, deaths and migration within each age-sex group
𝑐𝑎𝑛𝑐𝑒𝑟_𝑐𝑎𝑠𝑒𝑠(𝐿𝐺𝐴, 𝑡)=Population(LGA, t) × ASR(t)
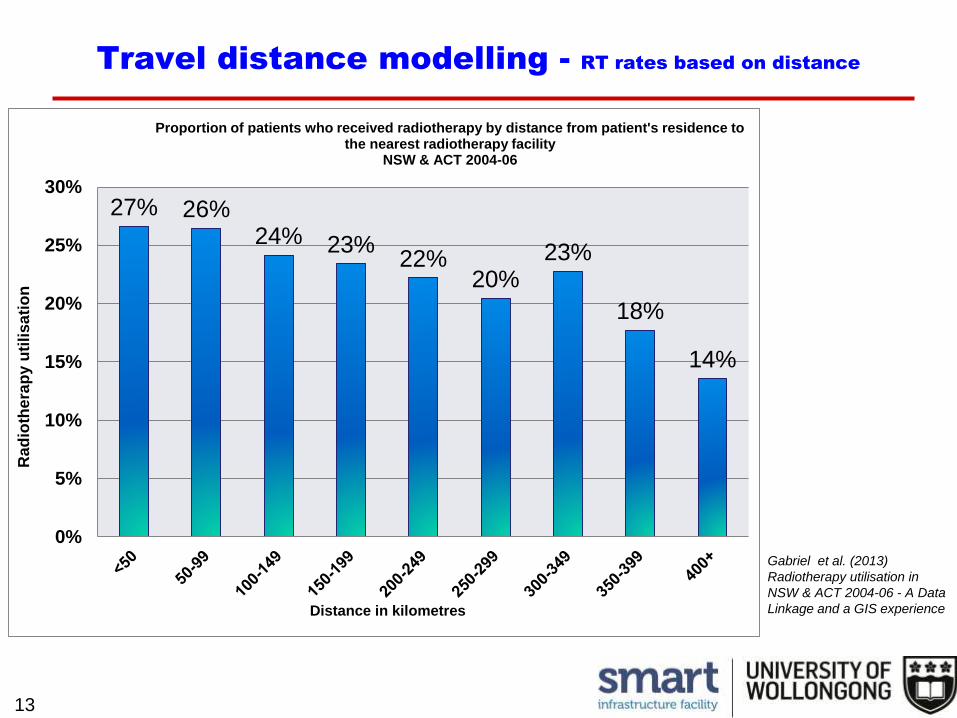
Travel distance modelling - RT rates based on distance
13
27% 26%24% 23%
22%20%
23%
18%
14%
0%
5%
10%
15%
20%
25%
30%
Rad
ioth
era
py u
tili
sa
tio
n
Distance in kilometres
Proportion of patients who received radiotherapy by distance from patient's residence to the nearest radiotherapy facility
NSW & ACT 2004-06
Gabriel et al. (2013)
Radiotherapy utilisation in
NSW & ACT 2004-06 - A Data
Linkage and a GIS experience
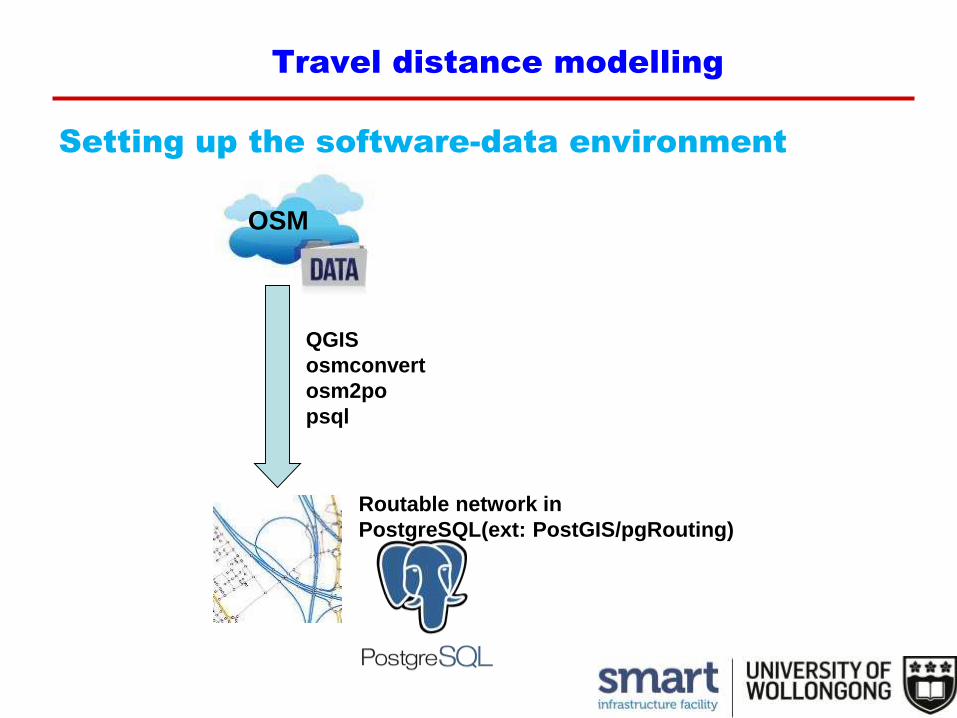
OSM
Setting up the software-data environment
Travel distance modelling
QGIS
osmconvert
osm2po
psql
Routable network in
PostgreSQL(ext: PostGIS/pgRouting)
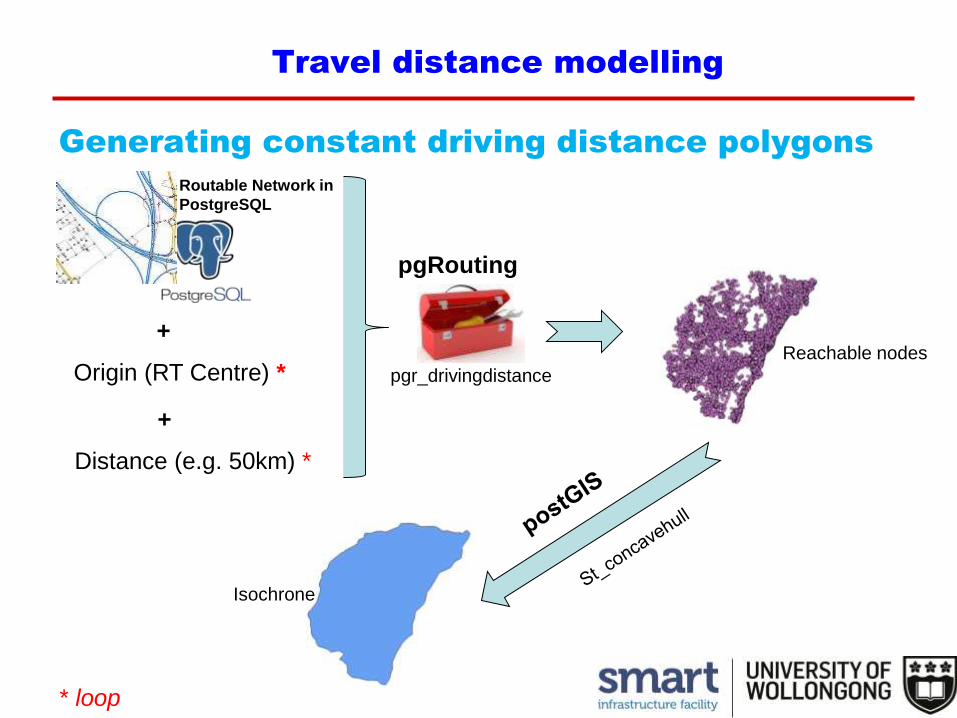
Generating constant driving distance polygons
Travel distance modelling
Routable Network in
PostgreSQL
+
Origin (RT Centre) *
+
Distance (e.g. 50km) *
pgRouting
pgr_drivingdistance
Reachable nodes
Isochrone
* loop
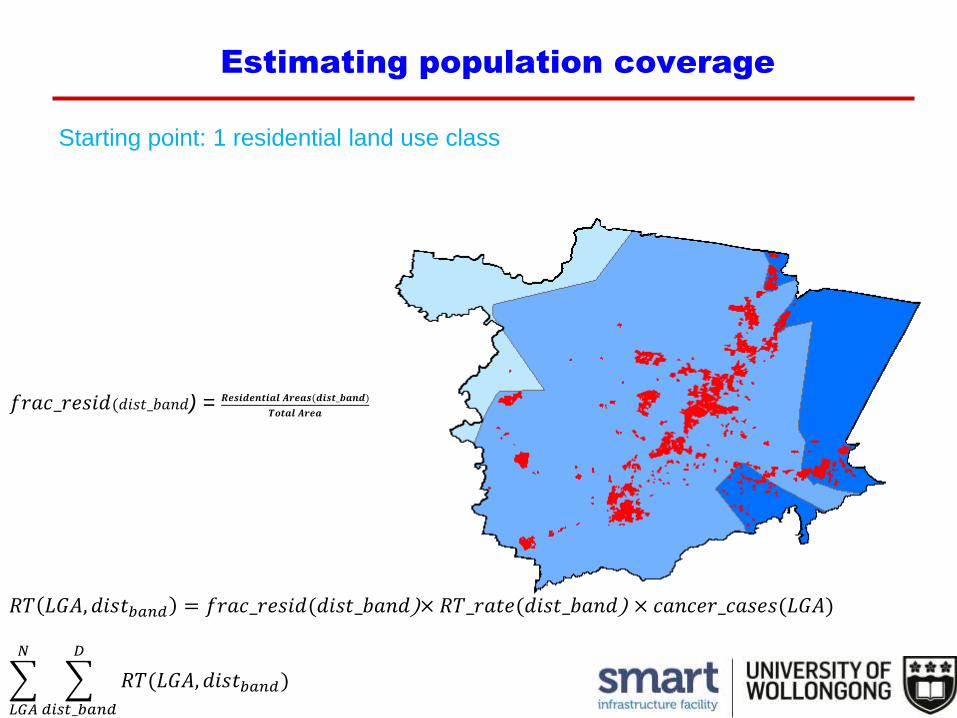
Starting point: 1 residential land use class
Estimating population coverage
𝑅𝑇 𝐿𝐺𝐴, 𝑑𝑖𝑠𝑡𝑏𝑎𝑛𝑑 = 𝑓𝑟𝑎𝑐_𝑟𝑒𝑠𝑖𝑑(𝑑𝑖𝑠𝑡_𝑏𝑎𝑛𝑑)× 𝑅𝑇_𝑟𝑎𝑡𝑒(𝑑𝑖𝑠𝑡_𝑏𝑎𝑛𝑑) × 𝑐𝑎𝑛𝑐𝑒𝑟_𝑐𝑎𝑠𝑒𝑠(𝐿𝐺𝐴)
𝐿𝐺𝐴
𝑁
𝑑𝑖𝑠𝑡_𝑏𝑎𝑛𝑑
𝐷
𝑅𝑇(𝐿𝐺𝐴, 𝑑𝑖𝑠𝑡𝑏𝑎𝑛𝑑)
𝑓𝑟𝑎𝑐_𝑟𝑒𝑠𝑖𝑑(𝑑𝑖𝑠𝑡_𝑏𝑎𝑛𝑑) = 𝑹𝒆𝒔𝒊𝒅𝒆𝒏𝒕𝒊𝒂𝒍 𝑨𝒓𝒆𝒂𝒔(𝒅𝒊𝒔𝒕_𝒃𝒂𝒏𝒅)
𝑻𝒐𝒕𝒂𝒍 𝑨𝒓𝒆𝒂
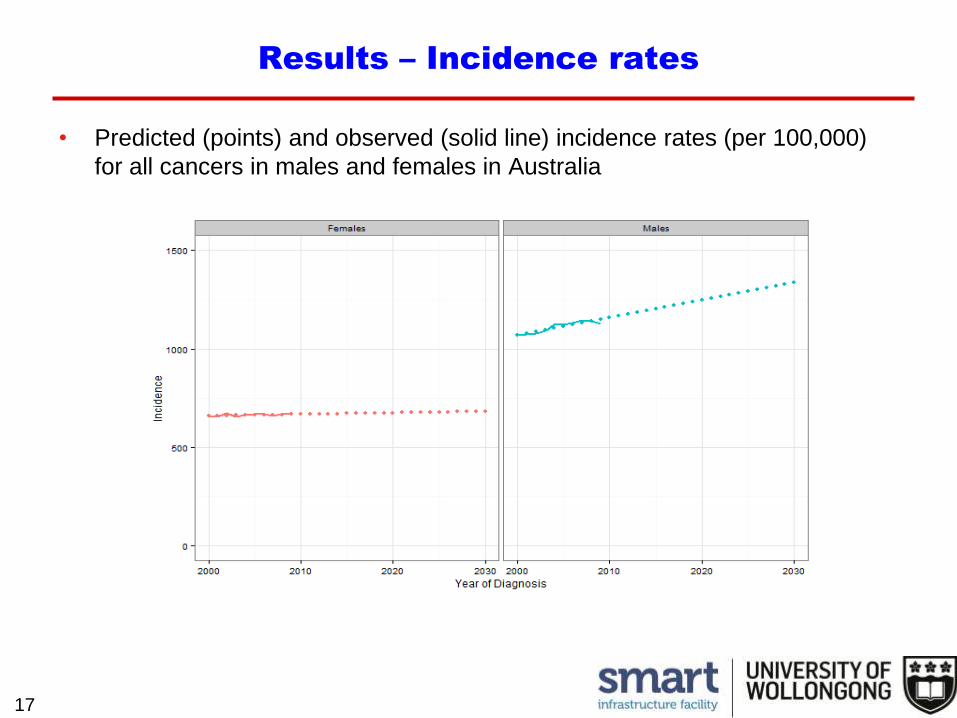
Results – Incidence rates
17
• Predicted (points) and observed (solid line) incidence rates (per 100,000)
for all cancers in males and females in Australia
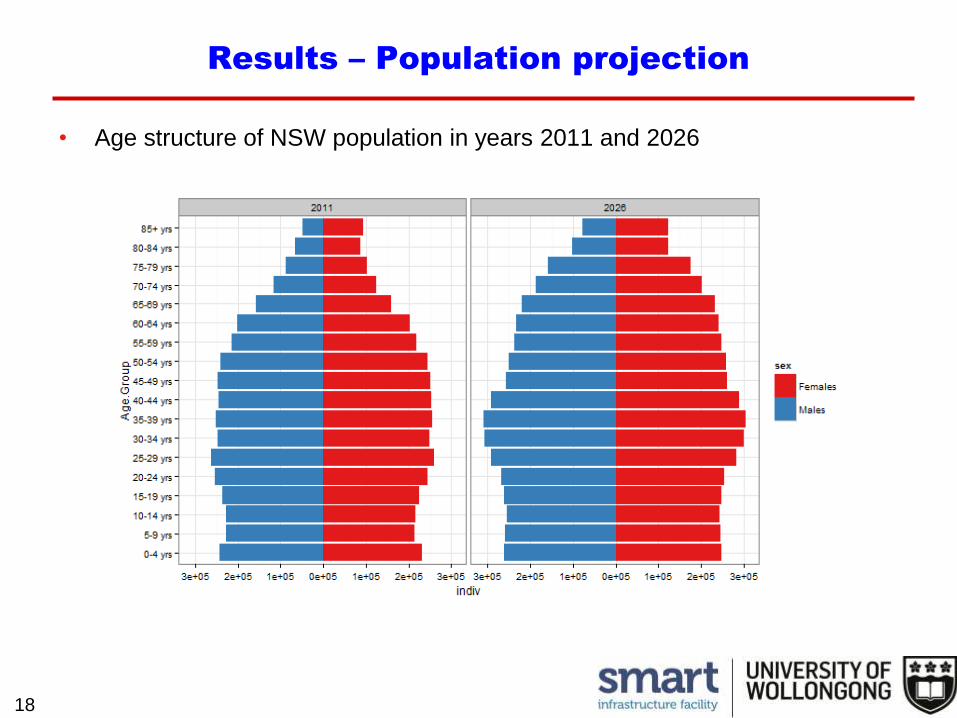
Results – Population projection
18
• Age structure of NSW population in years 2011 and 2026
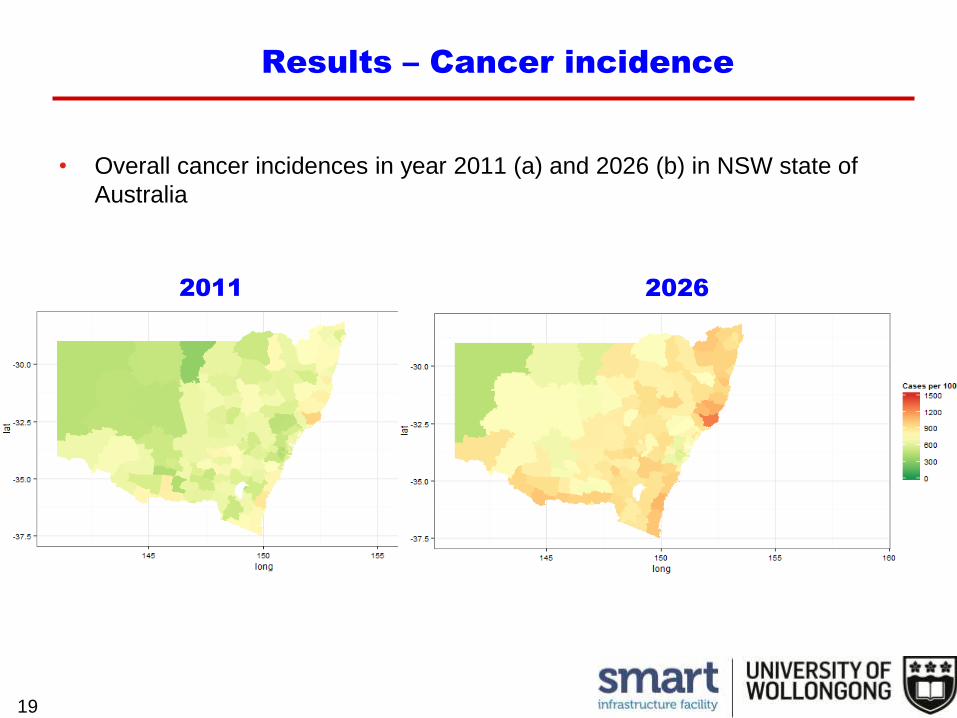
• Overall cancer incidences in year 2011 (a) and 2026 (b) in NSW state of
Australia
19
Results – Cancer incidence
2011 2026
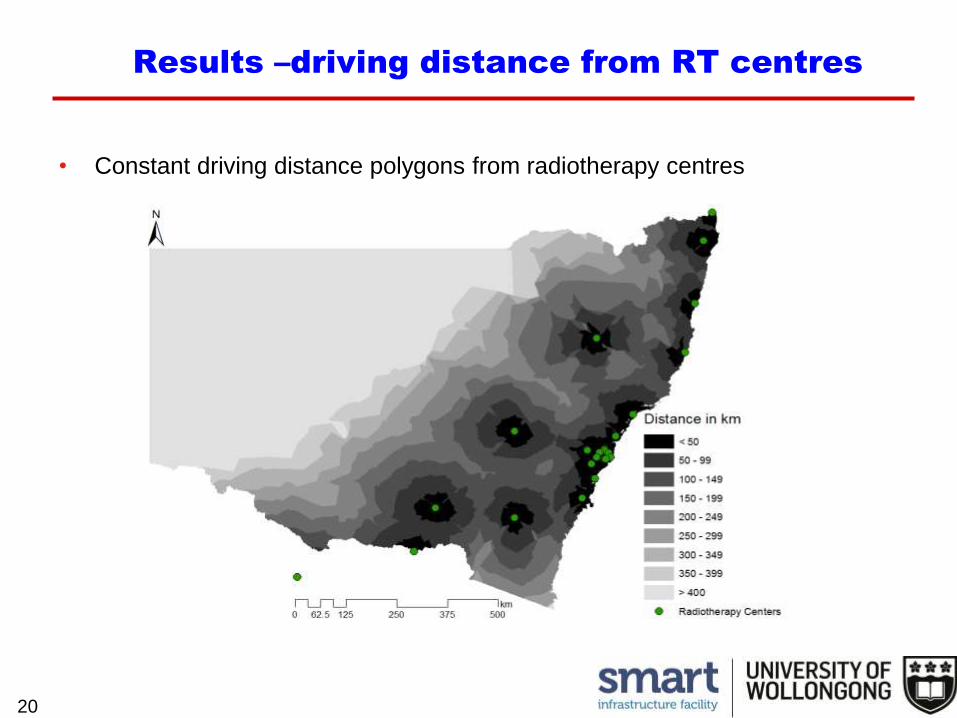
• Constant driving distance polygons from radiotherapy centres
20
Results –driving distance from RT centres
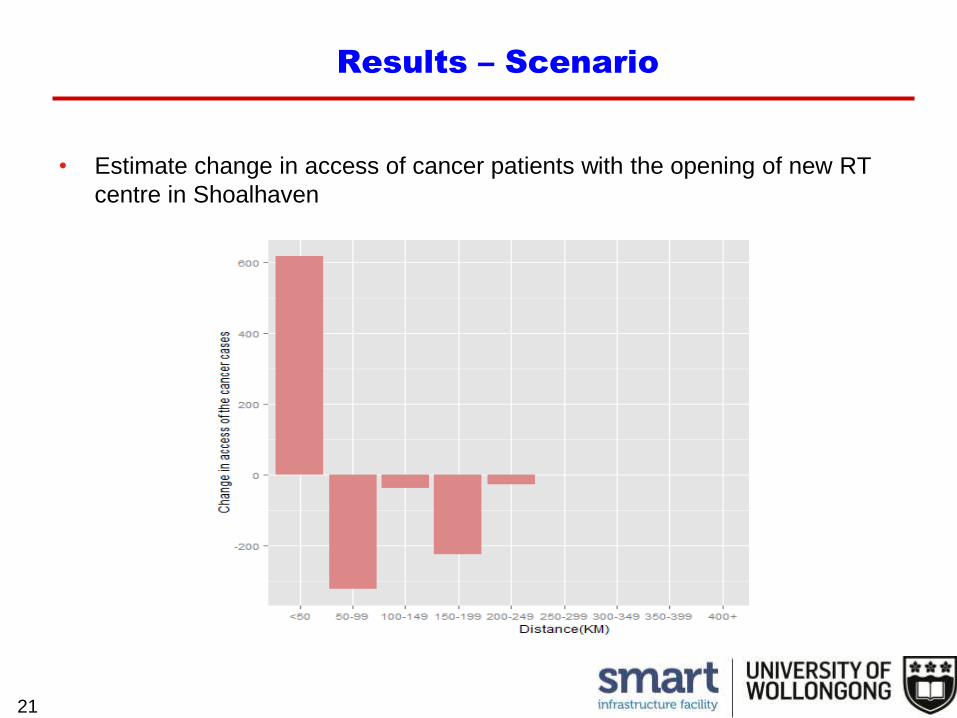
• Estimate change in access of cancer patients with the opening of new RT
centre in Shoalhaven
21
Results – Scenario
Validation in Local Health District
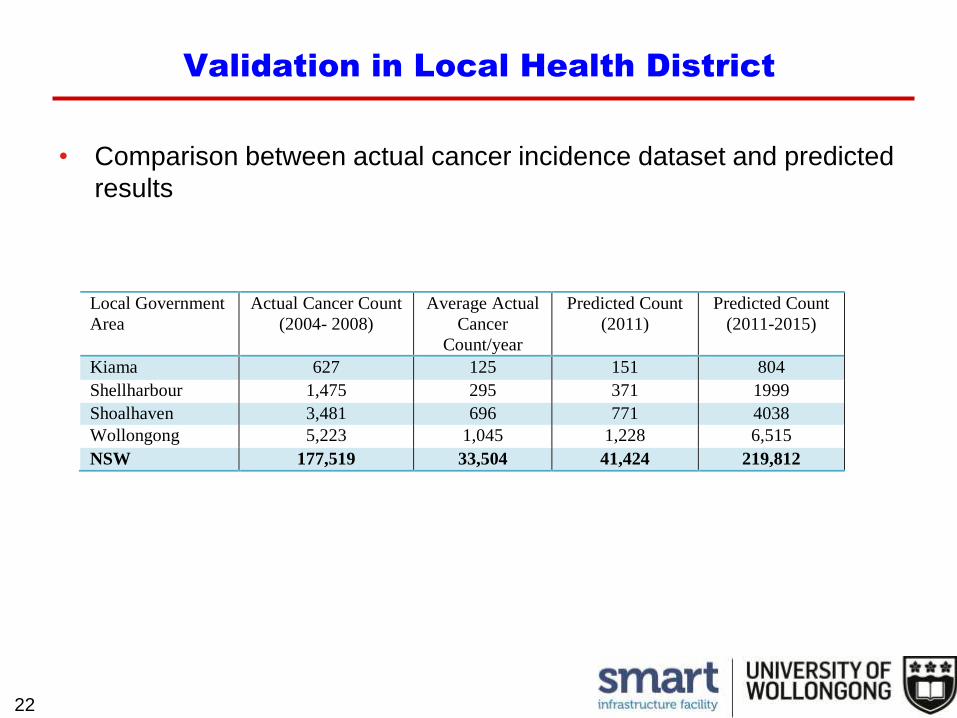
• Comparison between actual cancer incidence dataset and predicted
results
22
Local Government
Area
Actual Cancer Count
(2004- 2008)
Average Actual
Cancer
Count/year
Predicted Count
(2011)
Predicted Count
(2011-2015)
Kiama 627 125 151 804
Shellharbour 1,475 295 371 1999
Shoalhaven 3,481 696 771 4038
Wollongong 5,223 1,045 1,228 6,515
NSW 177,519 33,504 41,424 219,812
23
Conclusion and Future work
• The proposed methodology takes into account –– Varying cancer incidence rates
– Population evolution
– Accessibility to RT centres
• Tools developed in this work are open source – R
– PostgreSQL
– Python
– QGIS
• Future work – Modelling for different types of cancer
– Residential land use changes over time
– Use of synthetic population methodology for population evolution

Thank You
24
Dr. Nagesh Shukla
SMART Infrastructure Facility
University of Wollongong