polymer electrolyte membrane fuel cells: aging and … · polymer electrolyte membrane fuel cells:...
TRANSCRIPT
i
Polymer Electrolyte Membrane Fuel Cells:
Aging and Dynamic behaviour
Luis Carlos Pérez Martínez
LEPAE - Laboratory of Engineering Processes, Environment andEngineering
Chemical Engineering Department
Faculty of Engineering – University of Porto
Porto, 2013
Dissertation presented for the degree of
Doctor in Chemical and Biological Engineering
by
Porto University
Supervisors
Adélio Miguel Magalhães Mendes
José Manuel Ribeiro de Sousa


Acknowledgments
I acknowledge the Portuguese Foundation of Science and Technology (FCT) for my
PhD grant reference SFRH/BD/44684/2008. Financial support of FCT through projects
PTDC/EQU-EQU/70574/2006 and PTDC/EQU-EQU/104217/2008 is acknowledged
too. The financial support received from VTT – The Technical Research Centre of
Finland during my visits in 2010 and 2012 is acknowledged as well.
I want to thank my supervisors, Professors Adélio Mendes and José Sousa for
providing me the outstanding opportunity of studying my PhD at FEUP. I appreciate
all their support throughout the duration of my studies.
During this journey I met a lot of incredible people. It would be impossible to
mention all of them; however, the work presented in this thesis would not have been
possible without the support of Dr. Lucia Brandão, who helped me to build
confidence during the first part of my PhD. Her husband, José Luis, was a key person
for my integration in the Portuguese society. Their support and friendship proved to
be invaluable to me.
I would like to highlight the support of Dr. Marta Boaventura. It would have been
really interesting to arrive earlier to the faculty and learn more from her. She was
especially empathetic during the last part of my PhD and it would not have been
possible, literally, to deliver my thesis without her kind help.
My deepest gratitude to Dr. Jari Ihonen of VTT. Without his guidance and patience
this work could not have been possible. Apart of giving me the nice opportunity of
visiting Finland, he taught me technical and not so technical things that will be really
important for my life.
A few words to my wife, Joana. She was always by my side supporting me in the bad
times. I feel simply blessed for having this wonderful woman to share my life with
and for that reason this work is mostly dedicated to her.

To my family, I always felt your love and support despite the distance. You were
always there taking care of me. This work is also a gift for them.
Last but not least, I want to express my endless gratitude to my father and mother in
law, José Luis and Teresa. They showed how much they appreciate me during this
time and this work is a present for them.
To the best indoor soccer players of Portugal, the people of the FEUPsal team, are
worth to mention since we spent great times together.
To Portugal, from where I learnt the word “saudade” and to Finland, from where I
learnt the word “sisu”. These words have no translation in other languages so they
show how much I learnt a lot from these countries and their people.
Last but not least, I would like to express my gratitude to Olivier Thomann of VTT for
the last minute translation of the abstract to French.
v
Abstract
This thesis targets the study of Polymer Electrolyte Membrane Fuel Cells (PEMFC)
operating between 60-80 °C. This topic is of extreme importance since PEMFC may
substitute heat engines as the main energy conversion technology for small
stationary and transportation applications during the 21st century due to their higher
efficiency and environmental friendliness.
Firstly, it is presented a comprehensive literature review concerning segmented
PEMFC (SFC). It is highlighted that the local electrochemical activity of PEMFC varies
as a consequence of the interaction between several parameters. The different types
of SFC are categorized and fundamental considerations for their construction are
provided. It is shown how SFC are useful to study: i) the influence of the design,
assembly and operating parameters of the cell on the local electrochemical activity of
PEMFC and ii) the spatial distribution of gaseous species, water and temperature.
The local electrochemical activity of a SFC operated in fuel recirculation mode is
evaluated at 60 °C with the purpose of understanding the distribution of water within
the cell. Current density distribution (CDD) measurements are obtained for steady
state conditions and water balance and mean gas velocity calculations are
performed. Local flooded and dried zones of the cell are highlighted. It is concluded
that the recirculation rate strongly influences the distribution of water within the
cell, in contrast to other parameters such as anode pressure and purge frequency.
Furthermore, a technique for improving the accuracy of local electrochemical activity
measurements is introduced.
A methodology to mitigate the effect of CO in PEMFC for stationary applications is
described. The methodology minimizes the amount of O2 fed along with the H2-CO
mixture in order to oxidize the CO. For this, a novel arrangement of cells with
similarities to SFC is assembled and the anode exhaust gas composition is analyzed
with a gas chromatograph. Furthermore, the amount of CO adsorbed onto the
catalyst and the fraction of catalytic sites covered by CO are estimated. It is found
vi
that air volumetric flow rates below 1.0% (relative to the H2 volumetric flow rate) are
enough to mitigate the effect of CO at concentrations between 13-19 ppm and a cell
operating temperature of 65 °C.
The effect of fuel utilization on the dynamics of CO poisoning is studied under
operating conditions and CO concentrations relevant for automotive PEMFC systems.
Specifically, a membrane electrode assembly (MEA) with an anode catalyst loading of
0.05 mg Pt cm-2 and a cell temperature of 80 °C is used. Moreover, three fuel
utilizations, 70%, 40% and 25% and CO concentrations between 0.18-1 ppm are used.
The anode exhaust gas composition is analyzed with a gas chromatograph. It is
shown that the fuel utilization strongly influences the dynamics of CO poisoning in
PEMFC. It is demonstrated that as the fuel utilization decreases, the molar flow rate
of CO at the anode outlet increases, leading to a slower decrease in performance of
the cell.
vii
Sumário
A presente tese foca o estudo de células de combustível de electrólito de membrana
polimérica com alimentação de hidrogénio (PEMFC), que operam entre 60-80 °C. Este
tópico é de extrema importância dado que as PEMFC podem substituir os motores
térmicos como a principal tecnologia de conversão de energia para aplicações
estacionárias de pequena dimensão e de transportes no século 21, devido à sua
maior eficiência e menor impacto ambiental.
Esta tese apresenta primeiramente uma revisão da literatura sobre PEMFC
segmentadas (SFC). É realçada a variação da atividade eletroquímica local das PEMFC
em consequência da interação entre diversos parâmetros. Os diferentes tipos de SFC
são categorizados e fornecidas considerações fundamentais para a sua construção. A
utilidade das SFC é demonstrada para o estudo da i) influência do design, montagem
e dos parâmetros de operação na actividade electroquímica local da PEMFC e da ii)
distribuição espacial das espécies gasosas, água e temperatura.
A actividade electroquímica local de uma SFC, operando a 60 °C e com recirculação
de combustível, é avaliada de forma a compreender a distribuição de água na célula.
Foram obtidas medições de distribuição de densidades de corrente em estado
estacionário e foram calculados o balanço de água e a velocidade média de gás,
tendo sido realçadas as zonas da célula que estão encharcadas e aquelas que estão
secas. Conclui-se que a velocidade de recirculação influencia de forma significativa a
distribuição de água na célula, contrastando com outros parâmetros como a pressão
no ânodo e a frequência de purga. Foi ainda introduzida uma técnica para melhorar a
precisão das medições de distribuição de densidades de corrente.
No decorrer deste trabalho é desenvolvida uma metodologia para mitigar o efeito do
monóxido de carbono (CO) na PEMFC, em estado estacionário. Esta metodologia
baseia-se numa nova configuração de células com similaridades a SFC, que minimiza
a quantidade de oxigénio alimentado juntamente com a mistura H2-CO, de forma a
oxidar o CO. O gás à saída do ânodo foi analisado por cromatografia gasosa e a

viii
quantidade de CO adsorvido no catalisador e a fração de locais activos ocupados por
CO foram estimados. Foi observado que, para uma célula a operar a 65 °C, um caudal
de ar inferir a 1.0% (relativamente ao caudal de H2) é suficiente para mitigar o efeito
do CO a concentrações entre 13-19 ppm.
O efeito da utilização de combustível na dinâmica de envenenamento por CO foi
estudado a 80 °C em conjuntos membrana /eléctrodos (MEAs) com carga de platina
no ânodo de 0.05 mg Pt cm-2. Foram utilizadas concentrações de CO relevantes para
aplicação automóvel, entre 0.18-1 ppm. O gás à saída do ânodo foi analisado
recorrendo a cromatografia gasosa. Foi demostrado que a utilização de combustível
influencia fortemente a dinâmica de envenenamento da PEMFC. À medida que a
utilização de combustível diminui, o fluxo molar de CO à saída do ânodo aumenta,
originando uma menor diminuição de desempenho da célula.
ix
Sommaire
Cette thèse porte sur l’étude des piles à combustible à membrane électrolyte
polymère (PEMFC) fonctionnant entre 60-80 °C. Ce sujet d’étude est important car
les PEMFC pourraient remplacer les moteurs thermiques en tant que principale
technologie de conversion d’énergie pour les applications stationnaires petites et de
transport pendant le 21ème siècle grâce à leur haute efficacité et leur faible impact
environnemental.
Ce travail commence par une revue exhaustive de la littérature au sujet des PEMFC
segmentées (SFC). Il est mis en évidence que l’activité électrochimique locale des
PEMFC varie en conséquence de l’interaction de plusieurs paramètres. Les différents
types de SFC sont catégorisés et des considérations fondamentales pour leurs
constructions sont fournies. Il est expliqué comment les SFC sont utiles à l’étude de:
i) l’influence des principales conceptions, assemblages et paramètres de
fonctionnement sur l’activité électrochimique locale de la PEMFC et ii) la distribution
spatiale d’espèces gazeuses, de l’eau et de la température.
L’activité électrochimique locale d’une SFC fonctionnant avec recirculation du
combustible a été évaluée à 60 °C dans le but d’étudier la distribution de l’eau dans
la pile. Des mesures de distribution de la densité du courant (CDD) ont été obtenues
à condition stable et le bilan d’eau et la vitesse moyenne des gaz ont été calculés. Les
zones inondées et sèches de la pile sont mises en évidence. Il est conclu que le taux
de recirculation influence fortement la distribution de l’eau dans la pile, au contraire
d’autres paramètres comme la pression anodique et la fréquence des purges. De
plus, une technique pour améliorer la précision de la mesure de l’activité
électrochimique locale est présentée.
Une méthodologie pour diminuer l’effet d’empoisonnement au CO dans les PEMFC
pour applications stationnaires a été développée. La méthodologie minimise la
quantité d’O2 injecté avec le mélange de H2-CO afin d’oxyder le CO. Pour cela, un
nouvel arrangement de piles similaire au SFC a été assemblé et la composition des
gaz d’échappement de l’anode a été analysée avec un équipement de
x
chromatographie en phase gazeuse. En plus, la quantité de CO adsorbé sur le
catalyseur et la fraction de sites catalytiques couverte par le CO est estimée. Il a été
trouvé qu’un débit d’air en dessous de 1.0% (relativement au débit d’H2) est suffisant
pour atténuer l’effet du CO à des concentrations entre 13-19 ppm et avec une pile
fonctionnant à 65 °C.
L’effet de l’utilisation du combustible sur la dynamique de l’empoisonnement au CO
est étudié en condition de fonctionnement et avec des concentrations de CO
pertinentes pour des systèmes automobile de PEMFC. Spécifiquement, un
assemblage d’électrode membranaire (MEA) avec 0.05 mg Pt cm-2 sur l’anode, une
concentration de CO entre 0.18-1 ppm et une pile fonctionnant à 80 °C ont été
utilisés. La composition des gaz d’échappement a été analysée avec un équipement
de chromatographie en phase gazeuse. Il a été montré que l’utilisation du
combustible influence fortement la dynamique d’empoisonnement au CO d’une
PEMFC. Il est démontré que pour une moindre utilisation du combustible, le débit
molaire de CO à la sortie de l’anode augmente, ce qui se traduit par une plus lente
diminution de performance de la pile.
xi
Contents
Chapter I ................................................................................................................... 1
Chapter 1 Introduction .............................................................................................. 3
1.1. The energy challenge ...................................................................................... 3
1.2. Fuel cells .......................................................................................................... 5
1.2.1. Operating principles ................................................................................. 5
1.2.2. Types of fuel cells ..................................................................................... 6
1.3. Low temperature polymer electrolyte membrane fuel cells (PEMFC) ............... 8
1.3.1. Membrane ............................................................................................. 10
1.3.2. Catalysts ................................................................................................. 11
1.3.3. Gas diffusion layer (GDL) ........................................................................ 12
1.3.4. Bipolar plates (BP) .................................................................................. 13
1.4. Technological challenges of PEMFC ............................................................... 14
1.4.1. Water Management ............................................................................... 15
1.4.2. Effect of hydrogen impurities in PEMFC performance ............................. 18
1.5. Motivation and outline .................................................................................. 20
1.6. References ..................................................................................................... 22
Chapter II ................................................................................................................ 35
Chapter 2 Segmented PEMFC - A review .................................................................. 37
2.1. Abstract ........................................................................................................ 37
2.2. Introduction .................................................................................................. 38
2.3. Segmented PEMFC techniques ...................................................................... 40
2.3.1. Main invasive approaches ...................................................................... 40
xii
2.3.2. Components segmentation .................................................................... 46
2.3.3. Local current/voltage measurement ....................................................... 50
2.3.4. Fundamental considerations for SFC design ............................................ 52
2.3.5. Other invasive approaches ..................................................................... 55
2.3.6. Non-invasive approaches........................................................................ 56
2.4. Parameters influence on current density distribution .................................... 57
2.4.1. Flow field geometry ................................................................................ 58
2.4.2. Clamping pressure .................................................................................. 61
2.4.3. Relative humidity of reactants ................................................................ 61
2.4.4. Reactants flow rate ................................................................................ 64
2.4.5. Operating pressure ................................................................................. 67
2.4.6. Contaminant species .............................................................................. 68
2.4.7. Membranes and GDL .............................................................................. 69
2.5. Integrated analytical techniques ................................................................... 72
2.5.1. Gaseous species distribution .................................................................. 73
2.5.2. Condensed water accumulation ............................................................. 74
2.5.3. Temperature distribution ........................................................................... 77
2.6. High temperature SFC ................................................................................... 78
2.7. Conclusions ................................................................................................... 79
2.7. Acknowledgments ......................................................................................... 80
2.8. References .................................................................................................... 81
Chapter III ............................................................................................................... 91
Chapter III Water management studies .................................................................... 93
xiii
3.1. Abstract ........................................................................................................ 93
3.2. Introduction .................................................................................................. 94
3.3. Experimental ................................................................................................. 95
3.3.1. Test rig for studying water balance, nitrogen crossover and distributed
performance .................................................................................................... 95
3.3.2 Segmented PEMFC with partially segmented bipolar plates ..................... 98
3.3.3. Test protocol ........................................................................................ 101
3.4. Results and discussion ................................................................................. 102
3.4.1. Increase of in-plane resistance using partially segmented bipolar plates
...................................................................................................................... 102
3.4.2. Characterization and performance of the cell ....................................... 106
3.4.3. Current density distribution diagrams ................................................... 111
3.5. Conclusions ................................................................................................. 121
3.6. Acknowledgments ....................................................................................... 123
3.7. References .................................................................................................. 124
Chapter IV ............................................................................................................. 129
Chapter IV - Air bleed optimization studies ............................................................ 131
4.1. Abstract ...................................................................................................... 131
4.2. Introduction ................................................................................................ 132
4.3. Experimental ............................................................................................... 136
4.3.1. The arrangement of cells with similarities to a segmented PEMFC ........ 136
4.3.2. Test station, data logging and gas chromatograph analysis ................... 137
4.3.3. Description of the tests procedure........................................................ 139
4.3.4. Addressing the air bleed optimization based on molar flows ................ 140
xiv
4.4. Results and discussion ................................................................................. 143
4.4.1. CO2 sources at the anode inlet and outlet ............................................. 143
4.4.2. Response of the segmented PEMFC to severe CO poisoning and air bleed
...................................................................................................................... 144
4.4.3. Quantitative analysis of CO adsorption, breakthrough and oxidization . 150
4.4.4. Air bleed applied to different hydrogen volumetric flow rates .............. 153
4.5. Conclusions ................................................................................................. 157
4.6. Acknowledgements ..................................................................................... 158
4.7. References .................................................................................................. 159
Chapter V .............................................................................................................. 165
Chapter V- CO poisoning studies ............................................................................ 167
5.1. Abstract ...................................................................................................... 167
5.2. Introduction ................................................................................................ 168
5.3. Experimental ............................................................................................... 171
5.3.1. Set-up description ................................................................................ 171
5.3.2. Gas chromatograph description ............................................................ 173
5.3.3. Test procedure ..................................................................................... 174
5.4. Results and discussion ................................................................................. 175
5.4.1. Effect of fuel utilization for a constant CO feed concentration of 1 ppm 177
5.4.2. Effect of fuel utilization for a low constant CO molar flow rate ............. 179
5.4.3. Effect of fuel utilization for a ultra-low constant CO molar flow rate ..... 181
5.5. Conclusions ................................................................................................. 183
5.6. Aknowledgements ...................................................................................... 184
5.7. References .................................................................................................. 185
xv
Chapter VI ............................................................................................................. 189
Chapter VI - Conclusions and future work .............................................................. 191
Figure Captions
Figure 1.1. The global energy system in 2010 [1]........................................................ 4
Figure 1.2. Simplified scheme of a fuel cell................................................................. 5
Figure 1.3. Detailed scheme of a PEMFC. Adapted from [30] ..................................... 9
Figure 1.4. Basic structure of Nafion®. ..................................................................... 11
Figure 1.5. Main components of a PEMFC stack Adapted from [78]. ........................ 14
Figure 1.6. Water transport mechanisms in PEMFC. Adapted from [43]. .................. 17
Figure 2.1. Main approaches used for design, construction and electrochemical
characterization of SFC. ........................................................................................... 39
Figure 2.2. Exploded view of a segmented fuel cell assembly using the PCB approach.
From Ref. [25] with permission. ............................................................................... 43
Figure 2.3. Schematic of a segmented fuel cell using the resistors network approach
and passive method for characterization. Adapted from Ref. [33] with permission. . 45
Figure 2.4. Simplified scheme of a two-cell (1 + 1) stack with independent media
supplies and location of Hall effect sensors at the stack periphery. Adapted from Ref.
[41] with permission. ............................................................................................... 46
Figure 2.6. Illustration of the manufacturing process of a segmented flow field plate
made of graphite. From Ref. [27] with permission.................................................... 48
Figure 2.7. To the left, location of the current collection segments. To the right,
segmented bipolar plate fabricated by inserting conductive prism-shaped blocks
xvi
(silver gray blocks) into a non-conductive polymeric frame (in white). From Ref. [52]
with permission. ...................................................................................................... 49
Figure 2.8. Cross-sections from the segmented cathode flow-field plate. The left one
is the vertical and the right one is the horizontal cut. From Ref. [29] with permission.
................................................................................................................................ 50
Figure 2.9. Picture showing the location of the current distribution measurement
gasket. From Ref. [68] with permission. ................................................................... 56
Figure 2.10. Transient developments of the local current distribution, (a) parallel flow
field and (b) serpentine flow field, U = 0.5 V, Tcell = 40 °C, H2 = 1.5 and O2 = 2.5. From
Ref. [52] with permission. ........................................................................................ 60
Figure 2.11. Current distributions at different gas utilizations. Left figures—the
influence of fuel utilization at a constant oxygen utilization of 40%. Right figures—the
influence of oxygen utilization at a constant fuel utilization of 75%. Average current
density is set at 0.25 A·cm 2. The temperatures are kept at a constant of 75 °C by
circulation of coolant. Dew points of gases are kept at a constant of 65 °C. Adapted
from Ref. [37] with permission................................................................................. 64
Figure 2.12. Deviation of current density from average current density in the
segments 1–4 as function of total cell current. Cell operated in constant flow mode
with gas flows rates corresponding to H2 = 2 and air = 1.5 @ 80 A total cell current
(400 mA·cm-2). Tcell = Thum,a = Thum,c = 70 °C. From Ref. [57] with permission. .............. 65
Figure 2.13. Local current densities with air supply of 0.4 L·min-1 at OCV; anode mass
flow rate 17 kg·h-1; methanol concentration 1M. From Ref. [22] with permission..... 66
Figure 2.14. Potentiostatic (680 mV) current distribution steady-state of Pt-Ru/C for
different levels of air in 80 ppm CO, 50% H2, 40% CO2 and 10% N2 (reformate mix).
Stoichiometry cathode 2.4, anode 1.5. Cell temperature 60 °C. RH 100%. Pressure
ambient. From Ref. [94] with permission. ................................................................ 69
xvii
Figure 2.15. Current density distribution profiles for two different MEAs. GDL:
ElectroChem® 0.5 mg·cm-2 (10% wt. Pt/C). Current density distribution taken at
Vcell =638 mV. Counter flow feeding with H2 inlet at coordinate (1, 1) and outlet at (4,
4). Anode: H2, Q = 200 ml·min-1, P = 1.25 bar, dry. Cathode: Air, Q = 1500 ml·min-1, P =
1 bar, RH = 95%. Tcell = 30 °C ..................................................................................... 71
Figure 2.16. Net water transport coefficient profile for the humidifier temperature of
60 °C in both anode and cathode. The cell temperature is 80 °C. From Ref. [50] with
permission. .............................................................................................................. 74
Figure 2.17. Results in co-flow mode: Tcell = 70 °C, Icell = 14.6 A, Acell =29.2 cm2, H2 = O2
= 1.5, RHH2= 40%, dry O2, fmod = 10 mHz to 10 kHz, Nafion® 112 membrane, ETEK ELAT
V3.1 electrodes, 250 m PTFE gaskets (numbers denote segment). From Ref. [74]
with permission. ...................................................................................................... 76
Figure 2.18. Voltage rise and evolutions of local temperatures and current densities
when hydrogen is introduced in an anode full of air (fuel cell at open circuit). From
Ref. [53] with permission. ........................................................................................ 78
Figure 3.1. Scheme of the experimental test rig for water balance and nitrogen
crossover studies. PR: pressure regulator; PT: pressure transducer; H2O T: water trap;
SV: solenoid valve; MV: metering valve; H2 C: hydrogen concentration sensor; MFM:
mass flow meter; D, T: dew point and temperature probe; P: recirculation pump; F:
filter; MFC: mass flow controller; B: bubbler; BPR: Back pressure regulator; V:
ventilator. ................................................................................................................ 97
Figure 3.2. a) Cathode bipolar plate with the four-channel serpentine flow field and
detailed location of the inlet, outlet and segments. b) Back part of the anode bipolar
plate and detailed location of the hydrogen inlet, outlet and grooves. ..................... 99
Figure 3.3. Front and back of one printed circuit board (PCB) and electrical
connection schematic of the segmented cell incorporating partially segmented
bipolar plates. ........................................................................................................ 100
xviii
Figure 3.4. Through-plane to in-plane resistance ratio as a function of the groove
depth of the partially segmented bipolar plates. .................................................... 106
Figure 3.5. Hydrogen flow rate as a function of the voltage supplied to the pump
relative to maximum possible. The corresponding flow rates are STP (273.15 K and
0.100 MPa). ........................................................................................................... 107
Figure 3.6. Polarization curves for Experiments #1 to #10. Experimental conditions in
Table 4................................................................................................................... 109
Figure 3.7. Current density distribution diagrams for Experiments #1 (Vrel = 5%, I =
14.2 A) and #2 (Vrel = 17.5%, I = 14.5 A) and for 600 mV cell voltage. Other
experimental conditions are as in Table 4. ............................................................. 112
Figure 3.8. Current density distribution diagrams for Experiments #5 (Vrel = 5%,
I = 14.3 A) and #6 (Vrel = 17.5%, I = 14.6 A) and for 600 mV cell voltage. Other
experimental conditions are as in Table 4. ............................................................. 112
Figure 3.9. Current density distribution diagrams for experiments #2 (Pano = 0.110
MPa, I = 14.5 A) and #6 (Pano = 0.130 MPa, I = 14.6 A) and for 600 mV cell voltage.
Other experimental conditions are as in Table 4. ................................................... 120
Figure 3.10. Current density distribution diagrams for experiments #2
(purge cycle = 60/1 s, I = 14.5 A) and #4 (purge cycle = 240/1 s, I = 13.6 A) and for
600 mV cell voltage. Other experimental conditions are as in Table 4. ................... 121
Figure 4.1. Detailed view of the reactants distribution in two cells of the stack. The
crosses indicate the internal fuel distribution paths that were blocked so that the
anodes were fed “in series”. Since none of the internal oxidant distribution paths
were blocked, the cathodes were fed “in parallel”. ................................................ 136
Figure 4.2. Sketch of the experimental setup. F, mass flow controller; B, bubbler; CV,
check valve; P, pressure transducer; T, temperature transducer; H, heat exchanger;
NV, needle valve, WT, water trap; D, dryer; RH, relative humidity probe: R,
xix
rotameter; GC, gas chromatograph; S, separators; L, load and TB, thermostatic bath.
.............................................................................................................................. 139
Figure 4.3. Response of the segmented PEMFC to severe CO poisoning and high air
bleed. The CO concentration at the anode inlet was 16 ppm. Lower quality H2 was
used in this test (amount of impurities: O2 < 20 ppm, H2O < 20 ppm, CO2 < 20 ppm,
N2 < 500 ppm). Other experimental conditions as in Table 10. ............................... 145
Figure 4.4. CO and CO2 molar flows for experiment #1. The CO concentration at the
anode inlet is 16 ppm. Lower quality H2 (amount of impurities: O2 < 20 ppm, H2O < 20
ppm, CO2 < 20 ppm, N2 < 500 ppm) was used in this test. Other experimental
conditions as in Table 10. ....................................................................................... 146
Figure 4.5. Segments current response to gradual increase in air bleed (experiment
#2). The CO concentration the anode inlet was 15 ppm. Other experimental
conditions as in Table 10. ....................................................................................... 147
Figure 4.6. CO2 molar flow rate responses to gradual increase in air bleed
(Experiment #2). The CO concentration the anode inlet is 15 ppm. Other
experimental conditions as in Table 10. No CO was detected at the anode outlet. . 149
Figure 4.7. CO adsorbed and molar flow rates for: a) Experiment #1 and b)
Experiment #2. The dashed lines in the molar flow rate plots delimit the areas under
the curve considered to estimate the amount of CO adsorbed and the fraction of
catalytic sites covered by CO ( CO). Experimental conditions as in Table 10. ........... 151
Figure 4.8. Normalized current ratios as a function of time for Experiments #3 (a –
low H2 flow rate), #4 (b – intermediate H2 flow rate) and #5 (c – high H2 flow rate).
The molar flow rate of CO at the anode inlet was 7.3 x 10⁻⁹ mol s-1 for all experiments.
Experimental conditions as in Table 10. ................................................................. 153
Figure 4.9. CO2 molar flow rates at the anode outlet for experiments #3 (a – low H2
flow rate), #4 (b – intermediate H2 flow rate) and #5 (c – high H2 flow rate).
Experimental conditions as in Table 10. ................................................................. 155
xx
Figure 5.1. Simplified diagram of an automotive PEMFC system. PR, pressure
regulator; D, demister; PV, purge valve; RP, recirculation pump; E, ejector; F, filter; B,
blower; H, humidifier; WP, water pump; R, radiator; BPR, back pressure regulator.
Adapted from [17-20]. ........................................................................................... 169
Figure 5.2. Schematic of the experimental set-up. F, mass flow controller; B: bubbler,
T: thermocouple, WT: water trap, D, dryer; R, rotameter; RH, relative humidity probe;
P, diaphragm pump and NV, needle valve. ............................................................. 172
Figure 5.3. Performance of the fuel cell for µf = 70% and 1 ppm feed CO (Experiment
#1): a) potential drop history, b) CO concentration at the anode outlet as a function
of time and c) estimated molar flow rate of CO at the anode outlet as a function of
time. The CO is injected at t = 0 min. Other experimental conditions as in Table 13.
.............................................................................................................................. 176
Figure 5.4. Performance of the fuel cell for µf = 70% (Experiment #1), µf = 40% (#2)
and µf = 25% (#3) and 1 ppm feed CO: a) potential drop history, b) CO concentration
at the anode outlet as a function of time and c) estimated molar flow rate of CO at
the anode outlet as a function of time. The Y axis on the right of Figure 5.4c is the
corresponding molar flow rate of CO at the anode inlet. The CO is injected at t = 0
min. Other experimental conditions as in Table 13. ............................................... 178
Figure 5.5. Performance of the fuel cell for µf = 70% (Experiments #1), µf = 40% (#2)
and µf = 25% (#3) and molar flow rate of CO at inlet of 1.87x10⁻¹⁰ mol·s-1: a) potential
drop history, b) CO concentration at the anode outlet as a function of time; and c)
estimated molar flow rate of CO at the anode outlet as a function of time, for
Experiments #4, #5 and #6. The CO is injected at t = 0 min. Other experimental
conditions as in Table 13. ....................................................................................... 180
Figure 5.6. Performance of the fuel cell for µf = 70% (Experiments #1), µf = 40% (#2)
and µf = 25% (#3) and molar flow rate of CO at inlet of 0.93x10⁻¹⁰ mol·s-1: a) potential
drop history; b) CO concentration at the anode inlet as a function of time; and c)
estimated molar flow rate of CO at the anode outlet as a function of time. CO is
injected at t = 0 min. Other experimental conditions as in Table 13. ...................... 182
xxi
Table captions
Table 1 - References of studies divided by active area, number of segments and SFC
invasive technique. .................................................................................................. 41
Table 2 - References analyzing parameters that influence the current density
distribution using SFC. ............................................................................................. 58
Table 3 - References using complementary analytical techniques in SFC for
distributed analysis. ................................................................................................. 72
Table 4 - Summary of experimental conditions. The corresponding flow rates are STP
(273.15 K and 0.100 MPa). ..................................................................................... 101
Table 5 - Parameters obtained from the characterization of the anode loop and
evaluation of the SFC performance for Experiments #1 to #8. The corresponding flow
rates are STP (273.15 K and 0.100 MPa). Note: n.a. stands for no applicable since the
stoichiometry is dimensionless. ............................................................................. 111
Table 6 - Numerical values for the current density of each segment in the current
density distribution diagrams of Figures 3.7-3.10. The coordinates correspond to
those of the flow fields. ......................................................................................... 113
Table 7 - Results of the water balance calculations. ............................................... 116
Table 8 - Gas and liquid velocities and type of flow pattern. Note: n.a. states for no
applicable, there is no liquid phase at the anode outlet. ........................................ 119
Table 9 - Summary of literature review on external air bleed levels for PEMFCs. .... 135
Table 10 - Operating conditions of experiments performed. Hydrogen and air flow
rates are STP (273.15 K and 0.100 MPa). ................................................................ 140
Table 11 - Identified sources of CO2 at the anode inlet and outlet during the study.
.............................................................................................................................. 143

xxii
Table 12 - Hydrogen to oxygen, oxygen to carbon monoxide and air bleed to carbon
monoxide concentration ratios for selected experiments and air bleed values. ...... 156
Table 13 - Summary of experimental conditions. Note: n.a. states for no applicable.
.............................................................................................................................. 175

1
Chapter I

2

__________________________________________________Chapter I - Introduction
3
Chapter 1 - Introduction
1.1. The energy challenge
The current energy system faces critical challenges related to its lack of sustainability,
low stability and low efficiency. The supply and demand of energy relies mostly on
burning fossil fuels to produce heat and power at the lowest price. According to the
International Energy Agency, 81% of the world´s primary energy demand came from
oil, coal and natural gas in 2010 [1]. The lack of sustainability of the system is visible
from the fact that fossil fuels reserves are finite while the low stability of the system
becomes evident from the fact that the reserves are located in different geographic
zones from where they are intensively demanded.
Furthermore, the use of fossil fuels has led to growing environmental concerns
associated to the discharge of carbon dioxide (CO2), methane (CH4), nitrous oxide
(N2O) and volatile organic compounds (VOCs) to the atmosphere. These gases
represent a public health threat [2] and it is believed that most of them are
responsible for climate change [3].
Figure 1.1 shows a Sankey diagram of the global energy system in 2010 [1]. The
primary energy demand was complimented with renewable energy sources (mainly
hydropower but also biomass, wind and solar) and nuclear energy which accounted
for 13% and 6% of the total, respectively. In decreasing order, the energy demand by
sector was: buildings with 2931 million tons of oil equivalent (Mtoe), industry with
2421 Mtoe, transportation with 2377 Mtoe and others with 970 Mtoe. The possibility
of increasing the efficiency of the energy system becomes evident from the losses
depicted in Figure 1.1, which accounted for 21% of the total energy generated.
The main prospective scenario outlined in the world energy outlook of 2012 indicates
that the primary energy demand will rise by over one-third until 2035 in order to
satisfy the needs of the fast growing population. Under that scenario, the
consumption of natural gas, coal and oil increases 50%, 21% and 12% respectively. It

Chapter I - Introduction__________________________________________________
4
is projected that the share of renewable energy sources increases up to from 31%
from the current 20%.
Figure 0.1. The global energy system in 2010 [1].
The increase in the energy demand and the environmental concerns have created a
technological challenge to mankind. The nature of the energy system makes of heat
engines the most popular energy conversion technology. The issues with heat
engines are the emissions of noxious gases and their low efficiency, limited by the
Carnot efficiency [4]. Renewable energy sources seem to be a good option, however,
they are intermittent. Nuclear energy raises safety and security concerns and
technical difficulties handling the residues.
As observed, there is a need for energy conversion technologies that: i) run on
alternative fuels, ii) have higher efficiencies than heat engines, ii) operate
independently of the weather and iv) minimize the environmental impact. It is
believed that fuel cells incorporate such attributes which is why they are considered
the most promising energy conversion technologies of the 21st century.
__________________________________________________Chapter I - Introduction
5
1.2. Fuel cells
1.2.1. Operating principles
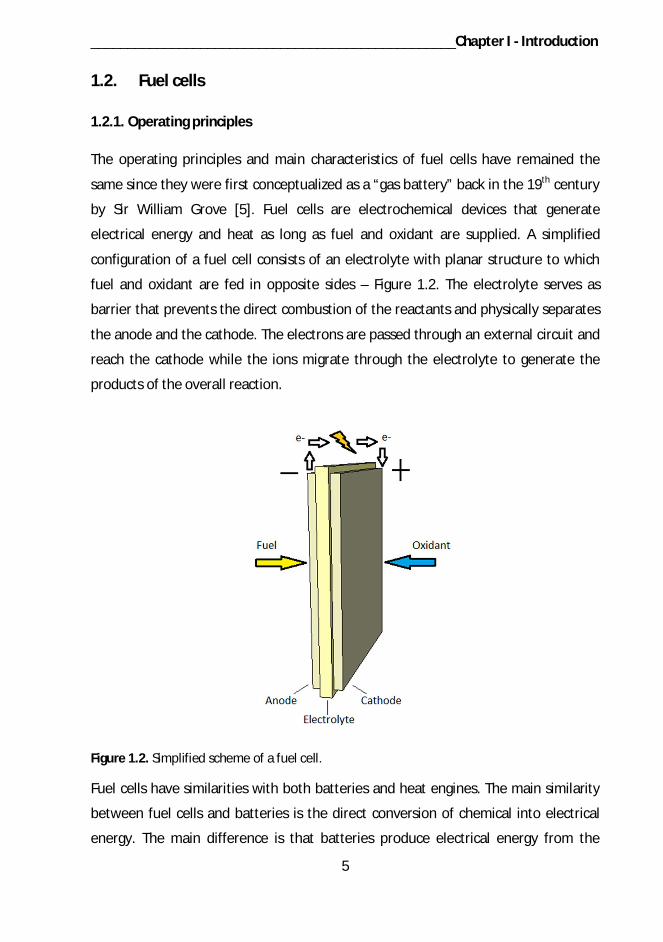
The operating principles and main characteristics of fuel cells have remained the
same since they were first conceptualized as a “gas battery” back in the 19th century
by Sir William Grove [5]. Fuel cells are electrochemical devices that generate
electrical energy and heat as long as fuel and oxidant are supplied. A simplified
configuration of a fuel cell consists of an electrolyte with planar structure to which
fuel and oxidant are fed in opposite sides – Figure 1.2. The electrolyte serves as
barrier that prevents the direct combustion of the reactants and physically separates
the anode and the cathode. The electrons are passed through an external circuit and
reach the cathode while the ions migrate through the electrolyte to generate the
products of the overall reaction.
Figure 1.2. Simplified scheme of a fuel cell.
Fuel cells have similarities with both batteries and heat engines. The main similarity
between fuel cells and batteries is the direct conversion of chemical into electrical
energy. The main difference is that batteries produce electrical energy from the
Chapter I - Introduction__________________________________________________
6
chemical energy stored within them and fuel cells will produce it as long as reactants
are fed. Either primary (disposable) or secondary (rechargeable) batteries are in
disadvantage to fuel cells in the latter point. Regarding heat engines, the main
similarity relies on the possibility of generating electrical energy and heat and as long
as reactants are supplied. The main difference is that fuel cells generate electricity
without intermediate heat exchange processes which is why they are more efficient.
1.2.2. Types of fuel cells
Fuel cells are typically classified according to their electrolyte and fuel [6]. Every type
of fuel cell has advantages and disadvantages but all share common challenges
regarding the development of materials for their construction, durability
improvement, cost reduction and some of them the absence of fuel distribution
infrastructure.
Solid oxide fuel cells (SOFC) use yttria stabilized zirconia (YSZ) as electrolyte. This
solid state electrolyte transports O2- ions from the cathode to the anode. The anode
is fed with different fuel sources such as hydrogen (H2), reformed hydrocarbons (CHn)
or others that can be converted to syngas (an H2-CO mixture) [7]. The cathode is fed
with oxygen (O2) from air and the products of the overall reaction are H2O and CO2.
This type of fuel cell can be further divided in: intermediate temperature SOFC (IT-
SOFC), ranging between 500-750 °C, and high temperature SOFC (HT-SOFC), ranging
between 850-1000 °C [8]. The operating temperature leads to slow start-ups and to
difficulties in finding suitable materials for their construction. Nonetheless, SOFC are
being actively integrated in combined heat and power (CHP) systems [9].
Molten carbonate fuel cells (MCFC) use lithium (Li2CO3), potassium (K2CO3) or sodium
(Na2CO3) carbonate as electrolyte. The electrolyte is in liquid phase and transports
CO3-2 ions from the cathode to the anode [10]. The anode is fed with H2, CHn or
syngas whilst the cathode is fed with O2 from air and CO2. The products of the
reaction are H2O and CO2. The typical operating temperature of 650 °C leads to slow
start-ups while the corrosive nature of the electrolyte tends to accelerate
degradation of the components.
__________________________________________________Chapter I - Introduction
7
Alkaline Fuel Cells (AFC) use potassium hydroxide (KOH) as electrolyte. The
electrolyte is a liquid solution and transports hydroxyl OH- ions from the cathode to
the anode [11]. The anode is fed with H2 and the cathode with O2 from air. The
product of the reaction is H2O. The operating temperature depends on the
concentration of the electrolyte but is in the range of 60-250 °C. Even though lower
operating temperatures provide faster start-ups; the low tolerance to CO2 has limited
the development of the technology as this compound depletes the electrolyte
producing K2CO3 [12].
Phosphoric acid fuel cells (PAFC) use phosphoric acid (H3PO4) as electrolyte. The
electrolyte is in liquid state and transports H+ ions from the anode to the cathode.
The anode is fed with H2 and the cathode with O2 from air. The product of the
reaction is H2O. The operating temperature ranges between 150-200 °C. PAFCs are in
commercial stage [13], however, it has low power density range and the catalyst is
platinum (Pt) as catalyst, which increases considerably its cost [6].
Direct methanol fuel cells are fed with methanol (CH3OH) in liquid or gaseous state at
the anode and O2 at the cathode. The electrolyte is a fluorinated or non-fluorinated
polymeric composite membrane [14]. The membrane transports H+ ions from the
anode to the cathode, being the overall products of the reaction CO2 at the anode
and H2O at the cathode. The operating temperature ranges between 20-200 °C
depending on the application. This type of cells has been highlighted as an ideal
power source for portable electronic devices [15]. A greater success of DMFC relies
on the possibility of increasing their power density, the lowest of all fuel cells, while
at the same time overpassing fuel management, design (miniaturization), durability
and cost issues [16].
Polymer Electrolyte Membrane Fuel Cells (PEMFC) are also called Proton Exchange
Membrane Fuel Cells [17]. The anode is fed with H2 and the membrane transports H+
ions (protons) from the anode to the cathode. The cathode is fed with O2, being the
overall product of the reaction H2O at the cathode. This type of fuel cell can be
further divided in two according to its operating temperature: low temperature
PEMFC (for simplicity referred as PEMFC), up to 80 °C, and high temperature PEMFC
Chapter I - Introduction__________________________________________________
8
(HT-PEMFC); ranging between 120-200 °C [18]. The operating temperature dictates
the chemical composition of the electrolyte. For PEMFC, polymeric composite
membranes based on perfluorosulfonic acid (PFSA) are commonly used [19, 20] while
for HT-PEMFC, the preferred electrolyte is based on polybenzimidazole (PBI) doped
with H3PO4 [21].
It is important to highlight the different state of development between PEMFC and
HT-PEMFC. Exemplarily, the higher operating temperature and characteristics of the
electrolyte of HT-PEMFC make necessary the development of compatible
components, accelerates components degradation and produces acid leaching [18].
Moreover, HT-PEMFC show slower start-up and shut-down capabilities than PEMFC.
PEMFC have the highest power density of all types of fuel cells and the widest range
of applications (e.g. transportation, stationary and portable) among other interesting
features. The interest and state of development of this type of fuel cell is such, that
87.2% of the worldwide fuel cells shipments were PEMFC, according to a survey of
2012 [22]. The main issue with PEMFC is that they are still not competitive in
durability and cost, with exception of some niche market applications [23].
1.3. Low temperature polymer electrolyte membrane fuel cells
(PEMFC)
As said before, this type of fuel cells have many interesting features which make
them very attractive: quick start-up and shut-down capabilities, sustained operation
at high current density, low weight, compactness, the potential for high volume
manufacturing and long lifetime [24-27].
Despite the effort made to bring PEMFC to market, there are still two issues that limit
the mass commercialization of this technology: i) the lack of a stable high purity H2
supply infrastructure [28, 29] and ii) overpass fundamental research issues [30, 31]
which involve interdisciplinary research and development (R&D) activities with
governmental support, in order to increase their durability and reduce costs.
__________________________________________________Chapter I - Introduction
9
It is believed that a stable high purity H2 supply is technically feasible and may even
lead to what is known as “hydrogen economy”, for which H2 is the main energy
vector [32, 33]. In turn, a better understanding of the operating parameters, with
focus on their effect in the phenomena occurring at the electrodes, and the
processes limiting its efficiency as well as the failure modes, causes and mechanisms
of degradation, can help us to increase the durability and reduce their cost [34-37].
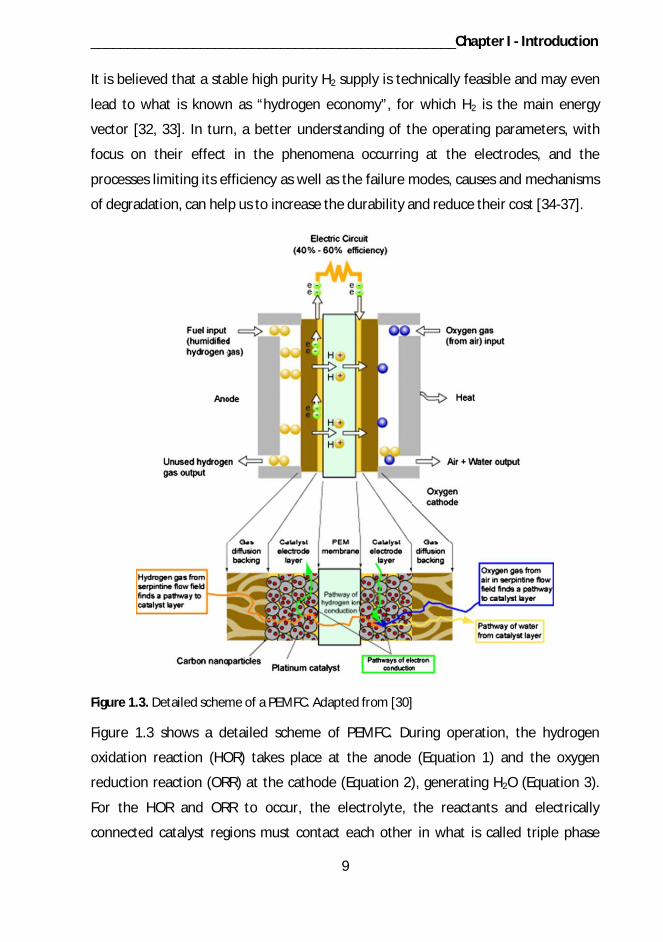
Figure 1.3. Detailed scheme of a PEMFC. Adapted from [30]
Figure 1.3 shows a detailed scheme of PEMFC. During operation, the hydrogen
oxidation reaction (HOR) takes place at the anode (Equation 1) and the oxygen
reduction reaction (ORR) at the cathode (Equation 2), generating H2O (Equation 3).
For the HOR and ORR to occur, the electrolyte, the reactants and electrically
connected catalyst regions must contact each other in what is called triple phase
Chapter I - Introduction__________________________________________________
10
boundary (TPB) [38]. The H2 and O2 are delivered to the gas diffusion backing (GDB),
also called gas diffusion layer (GDL), using gas flow fields with serpentine-type
geometry. The flow fields provide at the same time a path to remove the unused
reactants and the H2O. The main components of PEMFC are described in more detail
below.
H 2H + 2e (1)
12
O + 2H + 2e H O (2)
H +12
O H O (3)
1.3.1. Membrane
The core component of PEMFC is the membrane. If the membrane incorporates the
catalyst, a membrane electrode assembly (MEA) is formed. Another alternative to
this configuration is to deposit the catalyst on the GDL; nevertheless, the MEA
configuration is preferred since the power density may be up to 18% higher [39].
The desired properties of a membrane suitable for PEMFC are: good chemical,
mechanical and electrochemical stability, high proton conductivity and zero
electronic conductivity, thermal and hydrolytic stability, chemically compatible with
the electrode components, null permeability to reactants, high durability and low
cost.
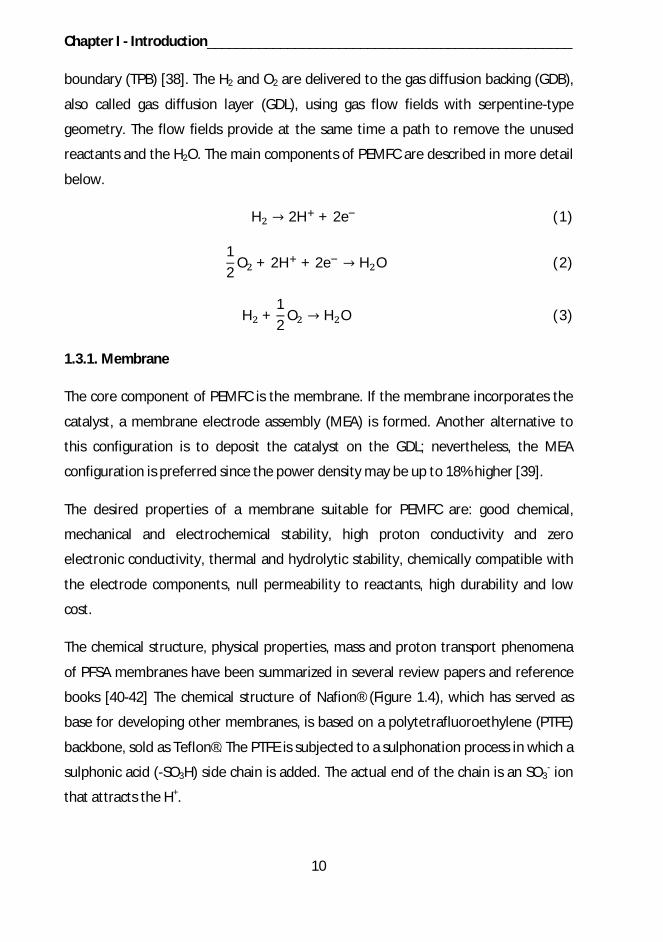
The chemical structure, physical properties, mass and proton transport phenomena
of PFSA membranes have been summarized in several review papers and reference
books [40-42] The chemical structure of Nafion® (Figure 1.4), which has served as
base for developing other membranes, is based on a polytetrafluoroethylene (PTFE)
backbone, sold as Teflon®. The PTFE is subjected to a sulphonation process in which a
sulphonic acid (-SO3H) side chain is added. The actual end of the chain is an SO3- ion
that attracts the H+.
__________________________________________________Chapter I - Introduction
11
The most relevant physical properties of PFSA membranes are its conductivity (or
resistivity), thickness, and ion exchange capacity (IEC). The proton conductivity of
PFSA membranes affects the efficiency of the electrochemical reaction [43]. The
thickness of the membrane influences the permeability of reactants [44] and
ultimately the efficiency of PEMFC. The IEC of the membranes is related to the
number of sulfonic sites which are susceptible to transport protons [45, 46]. The
conductivity of PFSA membranes ranges between 0.0051-0.114 S cm-1, the thickness
between 5-254 µm and the IEC between 0.9-2.7 mol equivalent g-1.
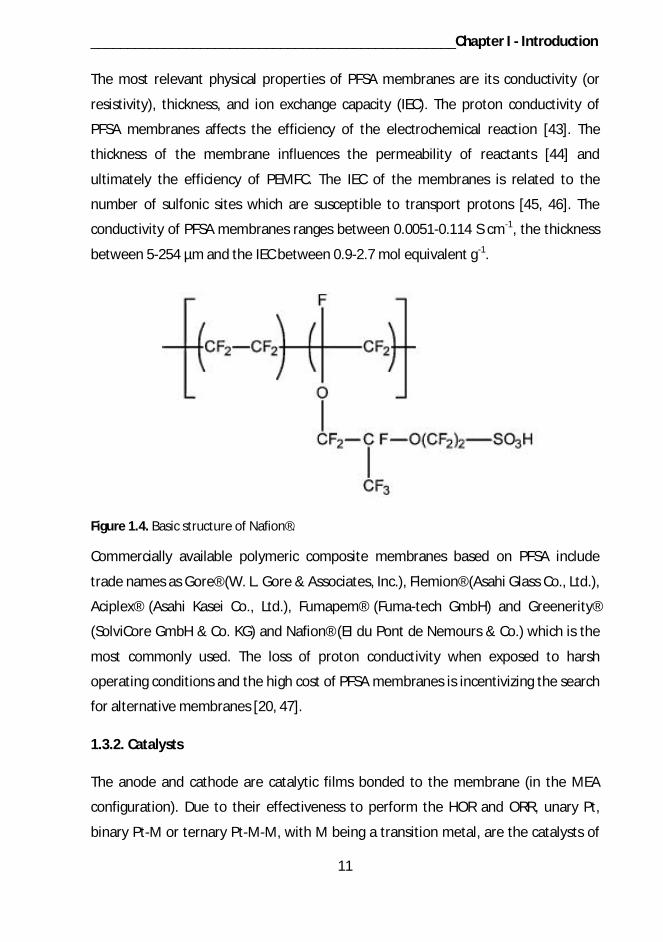
Figure 1.4. Basic structure of Nafion®.
Commercially available polymeric composite membranes based on PFSA include
trade names as Gore® (W. L. Gore & Associates, Inc.), Flemion® (Asahi Glass Co., Ltd.),
Aciplex® (Asahi Kasei Co., Ltd.), Fumapem® (Fuma-tech GmbH) and Greenerity®
(SolviCore GmbH & Co. KG) and Nafion® (EI du Pont de Nemours & Co.) which is the
most commonly used. The loss of proton conductivity when exposed to harsh
operating conditions and the high cost of PFSA membranes is incentivizing the search
for alternative membranes [20, 47].
1.3.2. Catalysts
The anode and cathode are catalytic films bonded to the membrane (in the MEA
configuration). Due to their effectiveness to perform the HOR and ORR, unary Pt,
binary Pt-M or ternary Pt-M-M, with M being a transition metal, are the catalysts of

Chapter I - Introduction__________________________________________________
12
choice [48, 49]; although the high cost of Pt [50] is motivating the search of
alternatives [51, 52]. The catalysts are supported on carbon based or non-
carbonaceous materials (i.e. titania, indium oxides, zirconia, silica, tungsten, etc.)
since this structures show improved stability and higher activity compared to
unsupported ones [53].
Conventional catalysts are based on Pt nanoparticles, 2-5 nm size, that are dispersed
onto the support, 20 to 50 times larger [54]. The thickness of the catalytic film
depends upon the amount of catalyst deposited on the membrane, which must be
minimized to reduce costs. Moreover, the thickness must be kept below 10 m
otherwise the protons do not reach the catalytic film, that becomes inactive [55].
Other parameter related to the amount of catalyst deposited on the membrane is
the catalyst loading, being this in the range of 0.05-0.4 mg Pt cm-2.
The most important parameter determining the performance of PEMFC catalyst is
the absolute ORR kinetic activity (A·cm-2), defined as the as the current density
measured at 900mV under one atmosphere of fully saturated O2 at 80 °C [54]. The
absolute ORR kinetic activity is then useful to compare catalysts with regard to their
area specific activity (A·cm-2 of Pt) and mass activity (A·mg of Pt).
The importance of the catalyst and catalyst support has led to extensive R&D in the
field [56-58]. Recent breakthroughs in this field of research include, optimization of
the molecular interactions between reactants and the catalyst surface by controlling
the structure of the catalyst (i.e. using core-shell structures) [59], development of
selective catalysts that suppress the undesired ORR at the anode side during startup
and shutdown [60], use of iron-based catalyst to perform the ORR [61], development
of PtNi alloys [54] or Pt monolayers on PdAu nanoparticles [62] in automotive PEMFC
applications and the incorporation of grapheme as catalyst support [63].
1.3.3. Gas diffusion layer (GDL)
The main roles of an ideal GDL include: i) to diffuse effectively the reactants into the
TPB, ii) to assist in the water management of the cell by allowing it to reach or
removing it from the TPB and iii) to transport the electrons [64, 65].

__________________________________________________Chapter I - Introduction
13
The GDL is a carbon-based porous material manufactured in single layer or multiple
layer configurations [55, 66]. Conventionally, the GDL consists of two layers, the first
in contact with the electrode (microporous layer - MPL) and the second in contact
with flow field (macroporous substrate - MPS) [67]. The MPL is a mixture of carbon
black and PTFE, and its function is to reduce the electric contact resistance between
the electrode and the MPS. The hydrophobic characteristics of the PTFE prevent the
accumulation of water. In turn, the MPS provide mechanical strength, charge and
mass transport capabilities to the MEA.
The most important characteristics of the GDL have been reviewed extensively [67,
68] and include: thickness, permeability, conductivity (or resistivity), porosity, and
mass transport properties. The GDL characteristics are usually determined using ex-
situ techniques [69, 70]. It is important to highlight that the GDL characteristics vary
as a function of its compression, ultimately influencing the performance of PEMFC
[71, 72]. Numerical studies report that compression of the GDL influences mainly the
mass transport [68, 73], contact resistance [74] and heat transfer [75, 76] of PEMFC.
The GDL thickness ranges between 150-360 m, the permeability (Gurley) between
0.35-170 cm3 cm-2 s-1 and the resistivity 6.7-14 m cm-2.
Commercially available GDL include trade names such as Sigracet® (SGL Carbon SE,
Germany), Pyrofil® (Mitsubishi Rayon Co. Ltd., Japan) and AvCarb® (AvCarb LLC, USA).
1.3.4. Bipolar plates (BP)
The BP are rigid and electrically conductive structures that incorporate the flow
fields. Whenever two or more repetitive units, each formed by one MEA, one anode
bipolar and one cathode bipolar plate, are electrically and hydraulically connected, a
PEMFC stack is formed (Figure 1.5). Each repetitive unit is called a single or individual
cell and they are usually connected in series in conventional stacks. The main
functions of the BP are [77]: i) to distribute the reactants within the cells, ii) to
facilitate the water management within the cells, iii) to collect the current from the
cells, iv) to separate individual cells of the stack and v) to facilitate heat management
of the stack.
Chapter I - Introduction__________________________________________________
14
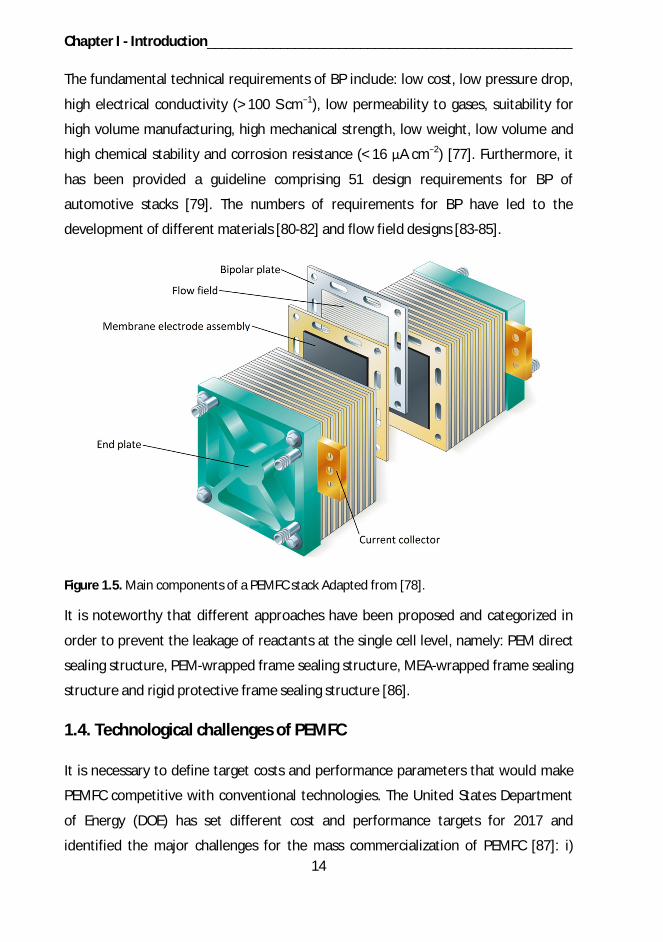
The fundamental technical requirements of BP include: low cost, low pressure drop,
high electrical conductivity (> 100 S cm 1), low permeability to gases, suitability for
high volume manufacturing, high mechanical strength, low weight, low volume and
high chemical stability and corrosion resistance (< 16 A cm 2) [77]. Furthermore, it
has been provided a guideline comprising 51 design requirements for BP of
automotive stacks [79]. The numbers of requirements for BP have led to the
development of different materials [80-82] and flow field designs [83-85].
Figure 1.5. Main components of a PEMFC stack Adapted from [78].
It is noteworthy that different approaches have been proposed and categorized in
order to prevent the leakage of reactants at the single cell level, namely: PEM direct
sealing structure, PEM-wrapped frame sealing structure, MEA-wrapped frame sealing
structure and rigid protective frame sealing structure [86].
1.4. Technological challenges of PEMFC
It is necessary to define target costs and performance parameters that would make
PEMFC competitive with conventional technologies. The United States Department
of Energy (DOE) has set different cost and performance targets for 2017 and
identified the major challenges for the mass commercialization of PEMFC [87]: i)
__________________________________________________Chapter I - Introduction
15
target cost of $30 kW-1 for automotive and $1,000–$1,700 kW-1 for stationary
applications, ii) durability of 5,000 h ( 240,000 km) and 40-80 °C operating
temperature for automotive and > 40,000 h of reliable operation between -35-40 °C
for stationary applications v) the need of improved heat recovery systems that allow
80% efficiency in stationary combined heat and power (CHP) applications iv) system
size comparable to that of current automotive technologies and iv) air, thermal and
water management for both automotive and stationary applications; since ancillary
equipments available (i.e. the balance of plant – BOP) are not optimized for fuel cell
applications and the performance of the cell is very sensitive to small differences in
operating conditions.
As of 2012, the cost and durability of PEMFC was $47 kW-1 and 2,500 h [87]. The
latter highlights the big effort that is still needed to bring the benefits of the
technology to society. Two key issues concerning the performance, reliability and
durability of PEMFC are the water management and the effect of hydrogen
impurities.
1.4.1. Water Management
The term water management refers to the study of the state of water (i.e. liquid or
gas), its transport mechanisms within the cell and their implications on the
performance and durability of PEMFC.
The water management issue becomes more sensitive at the MEA level since the
proton conductivity of PFSA membranes is a function of its water activity [88]. The
latter is explained since proton migration occurs in the ionomer hydrated phase after
dissociation of the sulfonic acid groups [89]; which contrasts to a dry ionomer phase
where the sulfonic acid groups are not dissociated, leading to a decrease in the
conductivity of the membrane.
There is a paradoxical effect of water in PEMFC. On the one hand, the water content
of the membrane needs to be maximized in order to achieve high proton
conductivity during operation. On the other, if the water vapor saturation pressure is
reached, the condensed water may hinder the paths for reactants distribution within
Chapter I - Introduction__________________________________________________
16
the cell. Whenever insufficient water is provided to the membrane and its proton
conductivity decreases, “membrane drying” occurs. In turn, if delivery of reactants is
limited by condensed water, “flooding” occurs. Interestingly, while membrane drying
is limited to that component, flooding happens at the catalyst, the GDL and/or the
flow fields [90].
It is important to know the parameters influencing the state of water and the water
transport mechanisms to address the water management within the cell. The state of
water within the cell is dictated by its saturation pressure, which is a function of the
temperature [91]. The water transport mechanisms within the cell have been
extensively studied both experimentally [92, 93] and numerically [94-96].
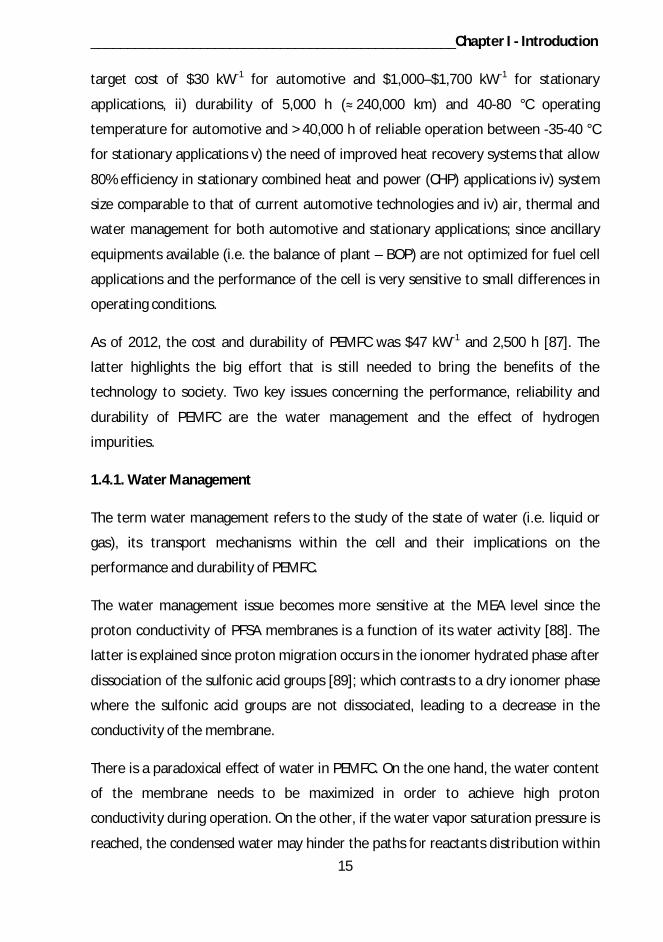
Figure 1.6 summarizes the water transport mechanisms in PEMFC. The electro-
osmotic drag (EOD) is associated to the simultaneous transport of water molecules
per each proton that migrates from the anode to the cathode due to electromotive
forces crosswise the membrane [97]. The EOD coefficient is defined as the ratio of
mole-of-water per mole-of-proton transported through the membrane in the
absence of concentration and pressure gradient [43].
At microscopic level, the protons interact with the electrons of surrounding water
molecules and form hydronium complexes (HmOn+, with m = 3, 5 or 9 and n = 1, 2 or
4), an aggregate that consists of one or several water molecules and a proton [98].
Moreover, if the transport of hydronium complexes happens from high to low
concentration regions (by diffusion) the vehicular mechanism of proton migration
takes place [99]. In the same way, if the water content of the membrane is high
enough to connect the polymer side chains, the protons may be directly transferred
from one water molecule to another, indicating that the hopping or Grothuss
mechanism of proton migration takes place [100].
The three other water transport mechanisms may be either well understood
(diffusion), negligible under many conditions (hydraulic permeation) or not yet well
understood (thermal-osmotic drag).
__________________________________________________Chapter I - Introduction
17
First, diffusion of water from the cathode to the anode, also referred to as “back
diffusion”, is linked to the water concentration gradient created due to the
generation of water at the cathode [43]. Second, hydraulic permeation occurs as a
consequence of a pressure gradient between the electrodes [101-103]. The latter
studies have shown that the hydraulic permeation is very low and that, added to
concerns regarding the mechanical constrain imposed to the membrane in
differentially pressurized electrodes, have not motivated deeper research on that
type of water transport mechanism. Third, the thermal-osmotic drag was observed to
be a result of the through-plane temperature gradient crosswise the membrane,
which transports water towards the colder zone [104, 105]. It is believed that the
heat-pipe effect, which occurs when water evaporation induces a water-vapor flux
down the temperature gradient, is the responsible for the thermal-osmotic drag in
PEMFC [106, 107]. However, more research is needed to fully understand the
thermal osmotic drag and its implications in PEMFC [108].
Figure 1.6. Water transport mechanisms in PEMFC. Adapted from [43].
It is observed that the spatial distribution of water not only determines the
electrochemical performance of PEMFC but also affects strongly their durability. To
operate the cell in dry conditions for short periods has immediate implications in the
Chapter I - Introduction__________________________________________________
18
electrochemical performance of PEMFC due to decreased conductivity of the
membrane [109]. In turn, longer periods of dry operation cause irreversible damage
to the membrane, which suffers mechanical degradation, becomes brittle and
develops hot spots due to reactants crossover [110-113].
It is noteworthy that depending on the dominating water transport mechanism
(Figure 1.6) flooding may appear at the anode and/or the cathode. Flooding causes
what is called “reactants starvation” [114] and its short term implications include a
decrease in the current or voltage [115]. The long term implications of reactants
starvation due to flooding are many. H2 starvation causes irreversible damage due to
corrosion of the cathode catalyst support [116] and the dissolution and
agglomeration of Pt into the membrane [117]. O2 starvation has reported to be less
critical than H2 starvation [118], nevertheless it also results in permanent
degradation due to dissolution and agglomeration of Pt into the membrane.
1.4.2. Effect of hydrogen impurities in PEMFC performance
Currently, H2 is produced mainly from fossil fuels [119, 120] but also from water
[121-124] and biomass [125-128]. The different feedstocks have led to the
development of a broad suite of H2 production technologies [129].
The type and amount of impurities depend strongly on the feedstock and the
technology used for the production of H2. If it is produced from H2O via electrolysis it
may contain trace amounts (approx. 10 ppm) of O2 and H2O [130]; not affecting the
performance PEMFC. However, if H2 is produced via gasification of coal or biomass,
pyrolysis of biomass, steam reforming, auto thermal reforming or partial oxidation of
different hydrocarbons, it will contain trace amounts (few to thousands of ppms) of
CO [131-137]; affecting the performance of PEMFC.
CO has attracted most of the attention among other impurities such as carbon
dioxide (CO2), hydrogen sulfide (H2S) and ammonia (NH3) in the fuel. CO
preferentially adsorbs onto the Pt and blocks the catalytic sites otherwise
participating in the HOR (Equation 1) [138, 139]. The last process is called “CO
__________________________________________________Chapter I - Introduction
19
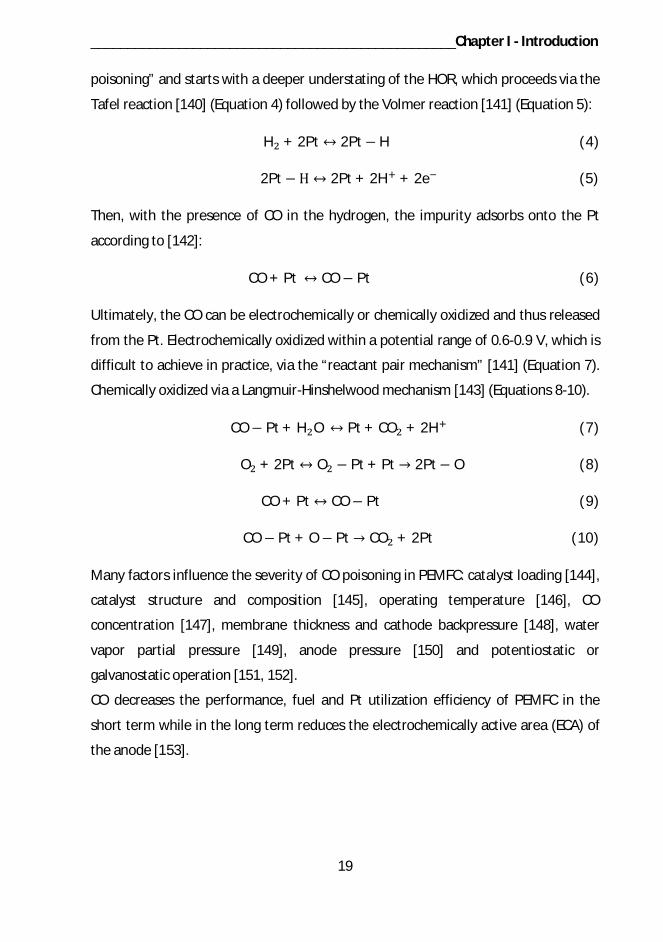
poisoning” and starts with a deeper understating of the HOR, which proceeds via the
Tafel reaction [140] (Equation 4) followed by the Volmer reaction [141] (Equation 5):
H + 2Pt 2Pt H (4)
2Pt 2Pt + 2H + 2e (5)
Then, with the presence of CO in the hydrogen, the impurity adsorbs onto the Pt
according to [142]:
CO + Pt CO Pt (6)
Ultimately, the CO can be electrochemically or chemically oxidized and thus released
from the Pt. Electrochemically oxidized within a potential range of 0.6-0.9 V, which is
difficult to achieve in practice, via the “reactant pair mechanism” [141] (Equation 7).
Chemically oxidized via a Langmuir-Hinshelwood mechanism [143] (Equations 8-10).
CO Pt + H O Pt + CO + 2H (7)
O + 2Pt O Pt + Pt 2Pt O (8)
CO + Pt CO Pt (9)
CO Pt + O Pt CO + 2Pt (10)
Many factors influence the severity of CO poisoning in PEMFC: catalyst loading [144],
catalyst structure and composition [145], operating temperature [146], CO
concentration [147], membrane thickness and cathode backpressure [148], water
vapor partial pressure [149], anode pressure [150] and potentiostatic or
galvanostatic operation [151, 152].
CO decreases the performance, fuel and Pt utilization efficiency of PEMFC in the
short term while in the long term reduces the electrochemically active area (ECA) of
the anode [153].
Chapter I - Introduction__________________________________________________
20
1.5. Motivation and outline
This thesis was motivated by two major objectives: i) develop tools to evaluate the
distributed performance of PEMFC with regard to water management and carbon
monoxide poisoning and ii) study the dynamics of carbon monoxide poisoning under
system-level relevant experimental conditions.
This thesis is divided in six Chapters. Chapter I is the Introduction; Chapter II is
entitled, “Segmented PEMFC – A review”; Chapter III, “Water management studies”;
Chapter IV, “Air bleed optimization studies”; Chapter V, “CO poisoning studies” and
Chapter VI, “Conclusions and future work”.
In Chapter II, a literature review on segmented Polymer Electrolyte Membrane Fuel
Cells (SFC) is presented. The different approaches for the design, construction and
electrochemical characterization of SFC are categorized. Recommendations for the
design, construction and electrochemical characterization of SFC are given and the
effect of different operating parameters on the current density distribution is
analyzed. It is shown how other techniques such as gaseous species, water and
temperature distribution can be coupled to SFC.
In Chapter III, an in-house designed and constructed test bench is built around a SFC
operated in hydrogen recirculation mode. A technique for reducing the lateral
current spreading in bipolar plates is presented. The local electrochemical activity of
the cell is studied by performing current density distribution measurements.
Complementarily, water balance analysis and mean gas velocity calculations are
performed. The effect of hydrogen recirculation rate, anode pressure and purge cycle
on the current density distribution is studied.
In Chapter IV, it is reported the design and construction of a new type of SFC suitable
for studying the effect of impurities in PEMFC. The SFC is used to study the local
effect of CO in PEMFC at relevant CO concentrations for PEMFC stationary
applications. Moreover, O2 is injected to the anode along with the fuel in order to
oxidize the CO and the minimal amounts of O2 needed to mitigate the effect of CO
__________________________________________________Chapter I - Introduction
21
are determined. The anode exhaust gas composition is measured using a gas
chromatograph, facilitating the mass balance of CO. This work was performed at VTT
– The Technical Research Centre of Finland.
In Chapter V, the effect of CO at relevant concentrations for PEMFC automotive
applications is studied. The decrease in performance of the cell is tracked and the
anode exhaust gas composition is continuously measured using a gas
chromatograph. The effect of fuel utilization on the CO poisoning dynamics of PEMFC
analyzed. This work was performed at VTT – The Technical Research Centre of
Finland.
Finally, in Chapter VI the most representative findings of the thesis are summarized
and research topics for the future are proposed.

Chapter I - Introduction__________________________________________________
22
1.6. References
[1] World Energy Outlook 2012, International Energy Agency.
[2] Haines, A., McMichael, A. J., Smith, K. R., Roberts, I., Woodcock, J., Markandya, A.,Armstrong, B. G., Campbell-Lendrum, D., Dangour, A. D., Davies, M., Bruce, N.,Tonne, C., Barrett, M., and Wilkinson, P., 2009, "Public health benefits of strategies toreduce greenhouse-gas emissions: overview and implications for policy makers," TheLancet, 374(9707), pp. 2104-2114.
[3] Tol, R. S. J., 2013, "Targets for global climate policy: An overview," Journal ofEconomic Dynamics and Control, 37(5), pp. 911-928.
[4] Lucia, U., 2013, "Carnot efficiency: Why?," Physica A: Statistical Mechanics and itsApplications, 392(17), pp. 3513-3517.
[5] Andújar, J. M., and Segura, F., 2009, "Fuel cells: History and updating. A walkalong two centuries," Renewable and Sustainable Energy Reviews, 13(9), pp. 2309-2322.
[6] Kirubakaran, A., Jain, S., and Nema, R. K., 2009, "A review on fuel cell technologiesand power electronic interface," Renewable and Sustainable Energy Reviews, 13(9),pp. 2430-2440.
[7] Adams, T. A., Nease, J., Tucker, D., and Barton, P. I., 2012, "Energy Conversionwith Solid Oxide Fuel Cell Systems: A Review of Concepts and Outlooks for the Short-and Long-Term," Industrial & Engineering Chemistry Research, 52(9), pp. 3089-3111.
[8] Brett, D. J. L., Atkinson, A., Brandon, N. P., and Skinner, S. J., 2008, "Intermediatetemperature solid oxide fuel cells," Chemical Society Reviews, 37(8), pp. 1568-1578.
[9] Choudhury, A., Chandra, H., and Arora, A., 2013, "Application of solid oxide fuelcell technology for power generation—A review," Renewable and Sustainable EnergyReviews, 20(0), pp. 430-442.
[10] Kulkarni, A., and Giddey, S., 2012, "Materials issues and recent developments inmolten carbonate fuel cells," Journal of Solid State Electrochemistry, 16(10), pp.3123-3146.
[11] Bidault, F., Brett, D. J. L., Middleton, P. H., and Brandon, N. P., 2009, "Review ofgas diffusion cathodes for alkaline fuel cells," Journal of Power Sources, 187(1), pp.39-48.
[12] Tewari, A., Sambhy, V., Urquidi Macdonald, M., and Sen, A., 2006,"Quantification of carbon dioxide poisoning in air breathing alkaline fuel cells,"Journal of Power Sources, 153(1), pp. 1-10.
__________________________________________________Chapter I - Introduction
23
[13] Mekhilef, S., Saidur, R., and Safari, A., 2012, "Comparative study of different fuelcell technologies," Renewable and Sustainable Energy Reviews, 16(1), pp. 981-989.
[14] Neburchilov, V., Martin, J., Wang, H. J., and Zhang, J. J., 2007, "A review ofpolymer electrolyte membranes for direct methanol fuel cells," Journal of PowerSources, 169(2), pp. 221-238.
[15] Rashidi, R., Dincer, I., Naterer, G. F., and Berg, P., 2009, "Performance evaluationof direct methanol fuel cells for portable applications," Journal of Power Sources,187(2), pp. 509-516.
[16] Li, X., and Faghri, A., 2013, "Review and advances of direct methanol fuel cells(DMFCs) part I: Design, fabrication, and testing with high concentration methanolsolutions," Journal of Power Sources, 226(0), pp. 223-240.
[17] Mench, M. M., 2008, Fuel Cell Engines, John Wiley & Sons, Inc., New Jersey.
[18] Chandan, A., Hattenberger, M., El-kharouf, A., Du, S., Dhir, A., Self, V., Pollet, B.G., Ingram, A., and Bujalski, W., 2013, "High temperature (HT) polymer electrolytemembrane fuel cells (PEMFC) – A review," Journal of Power Sources, 231(0), pp. 264-278.
[19] Jones, D. J., and Rozière, J., 2009, "FUEL CELLS – PROTON-EXCHANGEMEMBRANE FUEL CELLS | Membranes: Ambient Temperature," Encyclopedia ofElectrochemical Power Sources, G. Editor-in-Chief: Jürgen, ed., Elsevier, Amsterdam,pp. 667-679.
[20] Yee, R. S. L., Rozendal, R. A., Zhang, K., and Ladewig, B. P., 2012, "Cost effectivecation exchange membranes: A review," Chemical Engineering Research and Design,90(7), pp. 950-959.
[21] Li, Q., He, R., Jensen, J. O., and Bjerrum, N. J., 2004, "PBI-Based PolymerMembranes for High Temperature Fuel Cells – Preparation, Characterization and FuelCell Demonstration," Fuel Cells, 4(3), pp. 147-159.
[22] "The Fuel Cell Today Industry Review 2012."
[23] Dicks, A. L., 2012, "4.08 - PEM Fuel Cells: Applications," ComprehensiveRenewable Energy, S. Editor-in-Chief: Ali, ed., Elsevier, Oxford, pp. 203-245.
[24] Costamagna, P., and Srinivasan, S., 2001, "Quantum jumps in the PEMFC scienceand technology from the 1960s to the year 2000 Part I. Fundamental scientificaspects," Journal of Power Sources, 102(1-2), pp. 242-252.
[25] Costamagna, P., and Srinivasan, S., 2001, "Quantum jumps in the PEMFC scienceand technology from the 1960s to the year 2000: Part II. Engineering, technology
Chapter I - Introduction__________________________________________________
24
development and application aspects," Journal of Power Sources, 102(1–2), pp. 253-269.
[26] Gamburzev, S., and Appleby, A. J., 2002, "Recent progress in performanceimprovement of the proton exchange membrane fuel cell (PEMFC)," Journal of PowerSources, 107(1), pp. 5-12.
[27] Mehta, V., and Cooper, J. S., 2003, "Review and analysis of PEM fuel cell designand manufacturing," Journal of Power Sources, 114(1), pp. 32-53.
[28] Agnolucci, P., 2007, "Hydrogen infrastructure for the transport sector,"International Journal of Hydrogen Energy, 32(15), pp. 3526-3544.
[29] Agnolucci, P., and McDowall, W., 2013, "Designing future hydrogeninfrastructure: Insights from analysis at different spatial scales," International Journalof Hydrogen Energy, 38(13), pp. 5181-5191.
[30] Wang, Y., Chen, K. S., Mishler, J., Cho, S. C., and Adroher, X. C., 2011, "A reviewof polymer electrolyte membrane fuel cells: Technology, applications, and needs onfundamental research," Applied Energy, 88(4), pp. 981-1007.
[31] Behling, N., 2012, "Solving the fuel cell dilemma," Fuel Cells Bulletin, 2012(11),pp. 12-14.
[32] Dincer, I., and Zamfirescu, C., 2012, "Sustainable hydrogen production optionsand the role of IAHE," International Journal of Hydrogen Energy, 37(21), pp. 16266-16286.
[33] Mao, S. S., Shen, S., and Guo, L., 2012, "Nanomaterials for renewable hydrogenproduction, storage and utilization," Progress in Natural Science: MaterialsInternational, 22(6), pp. 522-534.
[34] Borup, R., Meyers, J., Pivovar, B., Kim, Y. S., Mukundan, R., Garland, N., Myers,D., Wilson, M., Garzon, F., Wood, D., Zelenay, P., More, K., Stroh, K., Zawodzinski, T.,Boncella, J., McGrath, J. E., Inaba, M., Miyatake, K., Hori, M., Ota, K., Ogumi, Z.,Miyata, S., Nishikata, A., Siroma, Z., Uchimoto, Y., Yasuda, K., Kimijima, K.-i., andIwashita, N., 2007, "Scientific Aspects of Polymer Electrolyte Fuel Cell Durability andDegradation," Chemical Reviews, 107(10), pp. 3904-3951.
[35] Wu, J. F., Yuan, X. Z., Wang, H. J., Blanco, M., Martin, J. J., and Zhang, J. J., 2008,"Diagnostic tools in PEM fuel cell research: Part I - Electrochemical techniques,"International Journal of Hydrogen Energy, 33(6), pp. 1735-1746.
[36] Schmittinger, W., and Vahidi, A., 2008, "A review of the main parametersinfluencing long-term performance and durability of PEM fuel cells," Journal of PowerSources, 180(1), pp. 1-14.
__________________________________________________Chapter I - Introduction
25
[37] Frank Bruijn, A., and Janssen, G. M., 2013, "PEM Fuel Cell Materials: Costs,Performance and Durability," Fuel Cells, K.-D. Kreuer, ed., Springer New York, pp.249-303.
[38] O’Hayre, R., Barnett, D. M., and Prinz, F. B., 2005, "The Triple Phase Boundary: AMathematical Model and Experimental Investigations for Fuel Cells," Journal of TheElectrochemical Society, 152(2), pp. A439-A444.
[39] Liu, C.-Y., and Sung, C.-C., 2012, "A review of the performance and analysis ofproton exchange membrane fuel cell membrane electrode assemblies," Journal ofPower Sources, 220(0), pp. 348-353.
[40] Smitha, B., Sridhar, S., and Khan, A. A., 2005, "Solid polymer electrolytemembranes for fuel cell applications—a review," Journal of Membrane Science,259(1–2), pp. 10-26.
[41] Mench, M. M., 2008, "Transport in Fuel Cell Systems," Fuel Cell Engines, JohnWiley & Sons, Inc., pp. 191-284.
[42] Peighambardoust, S. J., Rowshanzamir, S., and Amjadi, M., 2010, "Review of theproton exchange membranes for fuel cell applications," International Journal ofHydrogen Energy, 35(17), pp. 9349-9384.
[43] Dai, W., Wang, H., Yuan, X.-Z., Martin, J. J., Yang, D., Qiao, J., and Ma, J., 2009, "Areview on water balance in the membrane electrode assembly of proton exchangemembrane fuel cells," International Journal of Hydrogen Energy, 34(23), pp. 9461-9478.
[44] Sakai, T., Takenaka, H., Wakabayashi, N., Kawami, Y., and Torikai, E., 1985, "GasPermeation Properties of Solid Polymer Electrolyte (SPE) Membranes," Journal of TheElectrochemical Society, 132(6), pp. 1328-1332.
[45] Navessin, T., Eikerling, M., Wang, Q., Song, D., Liu, Z., Horsfall, J., Lovell, K. V.,and Holdcroft, S., 2005, "Influence of Membrane Ion Exchange Capacity on theCatalyst Layer Performance in an Operating PEM Fuel Cell," Journal of TheElectrochemical Society, 152(4), pp. A796-A805.
[46] Pereira, F., Vallé, K., Belleville, P., Morin, A., Lambert, S., and Sanchez, C., 2008,"Advanced Mesostructured Hybrid Silica Na on Membranes for High-PerformancePEM Fuel Cell," Chemistry of Materials, 20(5), pp. 1710-1718.
[47] Park, C. H., Lee, C. H., Guiver, M. D., and Lee, Y. M., 2011, "Sulfonatedhydrocarbon membranes for medium-temperature and low-humidity protonexchange membrane fuel cells (PEMFCs)," Progress in Polymer Science, 36(11), pp.1443-1498.
Chapter I - Introduction__________________________________________________
26
[48] Chuan-Jian Zhong and Jin Luo and Bin Fang and Bridgid, N. W. a. P. N. N. a. R. L.a. J. Y., 2010, "Nanostructured catalysts in fuel cells," Nanotechnology, 21(6), p.062001.
[49] Seo, A., Lee, J., Han, K., and Kim, H., 2006, "Performance and stability of Pt-basedternary alloy catalysts for PEMFC," Electrochimica Acta, 52(4), pp. 1603-1611.
[50] Sun, Y., Delucchi, M., and Ogden, J., 2011, "The impact of widespreaddeployment of fuel cell vehicles on platinum demand and price," InternationalJournal of Hydrogen Energy, 36(17), pp. 11116-11127.
[51] Chen, Z., Higgins, D., Yu, A., Zhang, L., and Zhang, J., 2011, "A review on non-precious metal electrocatalysts for PEM fuel cells," Energy & Environmental Science,4(9), pp. 3167-3192.
[52] Brouzgou, A., Song, S. Q., and Tsiakaras, P., 2012, "Low and non-platinumelectrocatalysts for PEMFCs: Current status, challenges and prospects," AppliedCatalysis B: Environmental, 127(0), pp. 371-388.
[53] Sharma, S., and Pollet, B. G., 2012, "Support materials for PEMFC and DMFCelectrocatalysts—A review," Journal of Power Sources, 208(0), pp. 96-119.
[54] Debe, M. K., 2012, "Electrocatalyst approaches and challenges for automotivefuel cells," Nature, 486(7401), pp. 43-51.
[55] Litster, S., and McLean, G., 2004, "PEM fuel cell electrodes," Journal of PowerSources, 130(1-2), pp. 61-76.
[56] Markovic, N. M., and Ross, P. N., 2002, "Surface science studies of model fuel cellelectrocatalysts," Surface Science Reports, 45(4-6), pp. 121-229.
[57] Zhong Cj Fau - Luo, J., Luo J Fau - Fang, B., Fang B Fau - Wanjala, B. N., WanjalaBn Fau - Njoki, P. N., Njoki Pn Fau - Loukrakpam, R., Loukrakpam R Fau - Yin, J., andYin, J., "Nanostructured catalysts in fuel cells," (1361-6528 (Electronic)).
[58] Yu, X., Yuan, J., and Sundén, B., 2011, "Review on the Properties of Nano-/Microstructures in the Catalyst Layer of PEMFC," Journal of Fuel Cell Science andTechnology, 8(3), pp. 034001-034001.
[59] Strasser, P., Koh, S., Anniyev, T., Greeley, J., More, K., Yu, C., Liu, Z., Kaya, S.,Nordlund, D., Ogasawara, H., Toney, M. F., and Nilsson, A., 2010, "Lattice-straincontrol of the activity in dealloyed core–shell fuel cell catalysts," Nat Chem, 2(6), pp.454-460.
[60] Genorio, B., Strmcnik, D., Subbaraman, R., Tripkovic, D., Karapetrov, G.,Stamenkovic, V. R., Pejovnik, S., and Markovi , N. M., 2010, "Selective catalysts for
__________________________________________________Chapter I - Introduction
27
the hydrogen oxidation and oxygen reduction reactions by patterning of platinumwith calix[4]arene molecules," Nat Mater, 9(12), pp. 998-1003.
[61] Proietti, E., Jaouen, F., Lefèvre, M., Larouche, N., Tian, J., Herranz, J., andDodelet, J.-P., 2011, "Iron-based cathode catalyst with enhanced power density inpolymer electrolyte membrane fuel cells," Nat Commun, 2, p. 416.
[62] Sasaki, K., Naohara, H., Choi, Y., Cai, Y., Chen, W.-F., Liu, P., and Adzic, R. R.,2012, "Highly stable Pt monolayer on PdAu nanoparticle electrocatalysts for theoxygen reduction reaction," Nat Commun, 3, p. 1115.
[63] Sun, S., Zhang, G., Gauquelin, N., Chen, N., Zhou, J., Yang, S., Chen, W., Meng, X.,Geng, D., Banis, M. N., Li, R., Ye, S., Knights, S., Botton, G. A., Sham, T.-K., and Sun, X.,2013, "Single-atom Catalysis Using Pt/Graphene Achieved through Atomic LayerDeposition," Sci. Rep., 3.
[64] Jordan, L. R., Shukla, A. K., Behrsing, T., Avery, N. R., Muddle, B. C., and Forsyth,M., 2000, "Diffusion layer parameters influencing optimal fuel cell performance,"Journal of Power Sources, 86(1–2), pp. 250-254.
[65] Meng, H., and Wang, C.-Y., 2004, "Electron Transport in PEFCs," Journal of TheElectrochemical Society, 151(3), pp. A358-A367.
[66] Park, S., Lee, J.-W., and Popov, B. N., 2012, "A review of gas diffusion layer inPEM fuel cells: Materials and designs," International Journal of Hydrogen Energy,37(7), pp. 5850-5865.
[67] Cindrella, L., Kannan, A. M., Lin, J. F., Saminathan, K., Ho, Y., Lin, C. W., andWertz, J., 2009, "Gas diffusion layer for proton exchange membrane fuel cells--Areview," Journal of Power Sources, 194(1), pp. 146-160.
[68] Jang, J.-H., Yan, W.-M., and Shih, C.-C., 2006, "Effects of the gas diffusion-layerparameters on cell performance of PEM fuel cells," Journal of Power Sources, 161(1),pp. 323-332.
[69] Lee, H.-K., Park, J.-H., Kim, D.-Y., and Lee, T.-H., 2004, "A study on thecharacteristics of the diffusion layer thickness and porosity of the PEMFC," Journal ofPower Sources, 131(1–2), pp. 200-206.
[70] Parikh, N., Allen, J. S., and Yassar, R. S., 2012, "Microstructure of Gas DiffusionLayers for PEM Fuel Cells," Fuel Cells, 12(3), pp. 382-390.
[71] Lee, W. K., Ho, C. H., Van Zee, J. W., and Murthy, M., 1999, "The effects ofcompression and gas diffusion layers on the performance of a PEM fuel cell," Journalof Power Sources, 84(1), pp. 45-51.
Chapter I - Introduction__________________________________________________
28
[72] Ge, J., Higier, A., and Liu, H., 2006, "Effect of gas diffusion layer compression onPEM fuel cell performance," Journal of Power Sources, 159(2), pp. 922-927.
[73] Shi, Z., Wang, X., and Guessous, L., 2010, "Effect of Compression on the WaterManagement of a Proton Exchange Membrane Fuel Cell With Different Gas DiffusionLayers," Journal of Fuel Cell Science and Technology, 7(2), pp. 021012-021012.
[74] Zhou, Y., Lin, G., Shih, A. J., and Hu, S. J., 2007, "A micro-scale model forpredicting contact resistance between bipolar plate and gas diffusion layer in PEMfuel cells," Journal of Power Sources, 163(2), pp. 777-783.
[75] Hottinen, T., and Himanen, O., 2007, "PEMFC temperature distribution causedby inhomogeneous compression of GDL," Electrochemistry Communications, 9(5),pp. 1047-1052.
[76] Ahmed, D. H., Sung, H. J., and Bae, J., 2008, "Effect of GDL permeability on waterand thermal management in PEMFCs—II. Clamping force," International Journal ofHydrogen Energy, 33(14), pp. 3786-3800.
[77] Hermann, A., Chaudhuri, T., and Spagnol, P., 2005, "Bipolar plates for PEM fuelcells: A review," International Journal of Hydrogen Energy, 30(12), pp. 1297-1302.
[78]http://www.theengineer.co.uk/in-depth/stack-assembly/292670.article,retrieved on July 2013.
[79] Cooper, J. S., 2004, "Design analysis of PEMFC bipolar plates considering stackmanufacturing and environment impact," Journal of Power Sources, 129(2), pp. 152-169.
[80] de las Heras, N., Roberts, E. P. L., Langton, R., and R. Hodgson, D., 2009, "Areview of metal separator plate materials suitable for automotive PEM fuel cells,"Energy & Environmental Science, 2(2), pp. 206-214.
[81] Wang, H., and Turner, J. A., 2010, "Reviewing Metallic PEMFC Bipolar Plates,"Fuel Cells, 10(4), pp. 510-519.
[82] Boyaci San, F. G., and Tekin, G., 2013, "A review of thermoplastic composites forbipolar plate applications," International Journal of Energy Research, 37(4), pp. 283-309.
[83] Li, X., and Sabir, I., 2005, "Review of bipolar plates in PEM fuel cells: Flow-fielddesigns," International Journal of Hydrogen Energy, 30(4), pp. 359-371.
[84] Aiyejina, A., and Sastry, M. K. S., 2011, "PEMFC Flow Channel GeometryOptimization: A Review," Journal of Fuel Cell Science and Technology, 9(1), pp.011011-011011.
__________________________________________________Chapter I - Introduction
29
[85] Arvay, A., French, J., Wang, J. C., Peng, X. H., and Kannan, A. M., 2013, "Natureinspired flow field designs for proton exchange membrane fuel cell," InternationalJournal of Hydrogen Energy, 38(9), pp. 3717-3726.
[86] Ye, D.-h., and Zhan, Z.-g., 2013, "A review on the sealing structures of membraneelectrode assembly of proton exchange membrane fuel cells," Journal of PowerSources, 231(0), pp. 285-292.
[87]http://www1.eere.energy.gov/hydrogenandfuelcells/fuelcells/fc_challenges.html, retrieved on July 2013."
[88] Carnes, B., and Djilali, N., 2006, "Analysis of coupled proton and water transportin a PEM fuel cell using the binary friction membrane model," Electrochimica Acta,52(3), pp. 1038-1052.
[89] Deabate, S., Gebel, G., Huguet, P., Morin, A., and Pourcelly, G., 2012, "3 In situand operando determination of the water content distribution in proton conductingmembranes for fuel cells: a critical review," Energy & Environmental Science, 5(10),pp. 8824-8847.
[90] Li, H., Tang, Y., Wang, Z., Shi, Z., Wu, S., Song, D., Zhang, J., Fatih, K., Zhang, J.,Wang, H., Liu, Z., Abouatallah, R., and Mazza, A., 2008, "A review of water floodingissues in the proton exchange membrane fuel cell," Journal of Power Sources, 178(1),pp. 103-117.
[91] Wagner, W., and Pruss, A., 2002, "The IAPWS Formulation 1995 for theThermodynamic Properties of Ordinary Water Substance for General and ScientificUse," Journal of Physical and Chemical Reference Data, 31(2), pp. 387-535.
[92] Bazylak, A., 2009, "Liquid water visualization in PEM fuel cells: A review,"International Journal of Hydrogen Energy, 34(9), pp. 3845-3857.
[93] Tsushima, S., and Hirai, S., 2011, "In situ diagnostics for water transport inproton exchange membrane fuel cells," Progress in Energy and Combustion Science,37(2), pp. 204-220.
[94] Fimrite, J., Struchtrup, H., and Djilali, N., 2005, "Transport Phenomena inPolymer Electrolyte Membranes: I. Modeling Framework," Journal of TheElectrochemical Society, 152(9), pp. A1804-A1814.
[95] Wu, H., Li, X., and Berg, P., 2009, "On the modeling of water transport inpolymer electrolyte membrane fuel cells," Electrochimica Acta, 54(27), pp. 6913-6927.
[96] Nasef, M. M., and Aly, A. A., 2012, "Water and charge transport models inproton exchange membranes: An overview," Desalination, 287(0), pp. 238-246.
Chapter I - Introduction__________________________________________________
30
[97] Jiao, K., and Li, X., 2011, "Water transport in polymer electrolyte membrane fuelcells," Progress in Energy and Combustion Science, 37(3), pp. 221-291.
[98] Pivovar, B. S., and Kim, Y. S., 2007, "The membrane-electrode interface inPEFCs," Journal of the Electrochemical Society, 154(8), pp. B739-B744.
[99] Kreuer, K.-D., Rabenau, A., and Weppner, W., 1982, "Vehicle Mechanism, A NewModel for the Interpretation of the Conductivity of Fast Proton Conductors,"Angewandte Chemie International Edition in English, 21(3), pp. 208-209.
[100] Agmon, N., 1995, "The Grotthuss mechanism," Chemical Physics Letters, 244(5–6), pp. 456-462.
[101] Husar, A., Higier, A., and Liu, H., 2008, "In situ measurements of water transferdue to different mechanisms in a proton exchange membrane fuel cell," Journal ofPower Sources, 183(1), pp. 240-246.
[102] Büchi, F. N., Wakizoe, M., and Srinivasan, S., 1996, "MicroelectrodeInvestigation of Oxygen Permeation in Perfluorinated Proton Exchange Membraneswith Different Equivalent Weights," Journal of The Electrochemical Society, 143(3),pp. 927-932.
[103] Bernardi, D. M., and Verbrugge, M. W., 1992, "A Mathematical Model of theSolid-Polymer-Electrolyte Fuel Cell," Journal of The Electrochemical Society, 139(9),pp. 2477-2491.
[104] Kim, S., and Mench, M. M., 2009, "Investigation of temperature-driven watertransport in polymer electrolyte fuel cell: Thermo-osmosis in membranes," Journal ofMembrane Science, 328(1–2), pp. 113-120.
[105] Zaffou, R., Yi, J. S., Kunz, H. R., and Fenton, J. M., 2006, "Temperature-DrivenWater Transport Through Membrane Electrode Assembly of Proton ExchangeMembrane Fuel Cells," Electrochemical and Solid-State Letters, 9(9), pp. A418-A422.
[106] Weber, A. Z., and Newman, J., 2006, "Coupled Thermal and WaterManagement in Polymer Electrolyte Fuel Cells," Journal of The ElectrochemicalSociety, 153(12), pp. A2205-A2214.
[107] Weber, A. Z., and Hickner, M. A., 2008, "Modeling and high-resolution-imagingstudies of water-content profiles in a polymer-electrolyte-fuel-cell membrane-electrode assembly," Electrochimica Acta, 53(26), pp. 7668-7674.
[108] Khandelwal, M., Lee, S., and Mench, M. M., 2009, "Model to PredictTemperature and Capillary Pressure Driven Water Transport in PEFCs AfterShutdown," Journal of The Electrochemical Society, 156(6), pp. B703-B715.
__________________________________________________Chapter I - Introduction
31
[109] Kang, J., and Kim, J., 2010, "Membrane electrode assembly degradation bydry/wet gas on a PEM fuel cell," International Journal of Hydrogen Energy, 35(23), pp.13125-13130.
[110] Huang, X., Solasi, R., Zou, Y., Feshler, M., Reifsnider, K., Condit, D., Burlatsky, S.,and Madden, T., 2006, "Mechanical endurance of polymer electrolyte membrane andPEM fuel cell durability," Journal of Polymer Science Part B: Polymer Physics, 44(16),pp. 2346-2357.
[111] Kusoglu, A., Karlsson, A. M., Santare, M. H., Cleghorn, S., and Johnson, W. B.,2007, "Mechanical behavior of fuel cell membranes under humidity cycles and effectof swelling anisotropy on the fatigue stresses," Journal of Power Sources, 170(2), pp.345-358.
[112] Chen, C., and Fuller, T. F., 2009, "The effect of humidity on the degradation ofNafion® membrane," Polymer Degradation and Stability, 94(9), pp. 1436-1447.
[113] Sethuraman, V. A., Weidner, J. W., Haug, A. T., and Protsailo, L. V., 2008,"Durability of Perfluorosulfonic Acid and Hydrocarbon Membranes: Effect ofHumidity and Temperature," Journal of The Electrochemical Society, 155(2), pp.B119-B124.
[114] Yousfi-Steiner, N., Moçotéguy, P., Candusso, D., and Hissel, D., 2009, "A reviewon polymer electrolyte membrane fuel cell catalyst degradation and starvationissues: Causes, consequences and diagnostic for mitigation," Journal of PowerSources, 194(1), pp. 130-145.
[115] Thounthong, P., Davat, B., Rael, S., and Sethakul, P., 2009, "Fuel starvation,"Industry Applications Magazine, IEEE, 15(4), pp. 52-59.
[116] Kang, J., Jung, D. W., Park, S., Lee, J.-H., Ko, J., and Kim, J., 2010, "Acceleratedtest analysis of reversal potential caused by fuel starvation during PEMFCsoperation," International Journal of Hydrogen Energy, 35(8), pp. 3727-3735.
[117] Kim, L., Chung, C. G., Sung, Y. W., and Chung, J. S., 2008, "Dissolution andmigration of platinum after long-term operation of a polymer electrolyte fuel cellunder various conditions," Journal of Power Sources, 183(2), pp. 524-532.
[118] Taniguchi, A., Akita, T., Yasuda, K., and Miyazaki, Y., 2008, "Analysis ofdegradation in PEMFC caused by cell reversal during air starvation," InternationalJournal of Hydrogen Energy, 33(9), pp. 2323-2329.
[119] Ahmed, S., Aitani, A., Rahman, F., Al-Dawood, A., and Al-Muhaish, F., 2009,"Decomposition of hydrocarbons to hydrogen and carbon," Applied Catalysis A:General, 359(1–2), pp. 1-24.
Chapter I - Introduction__________________________________________________
32
[120] Abbas, H. F., and Wan Daud, W. M. A., 2010, "Hydrogen production bymethane decomposition: A review," International Journal of Hydrogen Energy, 35(3),pp. 1160-1190.
[121] Currao, A., 2007, "Photoelectrochemical Water Splitting," CHIMIA InternationalJournal for Chemistry, 61(12), pp. 815-819.
[122] Rosen, M. A., 2010, "Advances in hydrogen production by thermochemicalwater decomposition: A review," Energy, 35(2), pp. 1068-1076.
[123] Laguna-Bercero, M. A., 2012, "Recent advances in high temperature electrolysisusing solid oxide fuel cells: A review," Journal of Power Sources, 203(0), pp. 4-16.
[124] Aricò, A. S., Siracusano, S., Briguglio, N., Baglio, V., Blasi, A., and Antonucci, V.,2013, "Polymer electrolyte membrane water electrolysis: status of technologies andpotential applications in combination with renewable power sources," Journal ofApplied Electrochemistry, 43(2), pp. 107-118.
[125] Tanksale, A., Beltramini, J. N., and Lu, G. M., 2010, "A review of catalytichydrogen production processes from biomass," Renewable and Sustainable EnergyReviews, 14(1), pp. 166-182.
[126] Levin, D. B., and Chahine, R., 2010, "Challenges for renewable hydrogenproduction from biomass," International Journal of Hydrogen Energy, 35(10), pp.4962-4969.
[127] Kruse, O., and Hankamer, B., 2010, "Microalgal hydrogen production," CurrentOpinion in Biotechnology, 21(3), pp. 238-243.
[128] Keskin, T., Abo-Hashesh, M., and Hallenbeck, P. C., 2011, "Photofermentativehydrogen production from wastes," Bioresource Technology, 102(18), pp. 8557-8568.
[129] Holladay, J. D., Hu, J., King, D. L., and Wang, Y., 2009, "An overview of hydrogenproduction technologies," Catalysis Today, 139(4), pp. 244-260.
[130] Ursua, A., Gandia, L. M., and Sanchis, P., 2012, "Hydrogen Production FromWater Electrolysis: Current Status and Future Trends," Proceedings of the Ieee,100(2), pp. 410-426.
[131] Onozaki, M., Watanabe, K., Hashimoto, T., Saegusa, H., and Katayama, Y., 2006,"Hydrogen production by the partial oxidation and steam reforming of tar from hotcoke oven gas," Fuel, 85(2), pp. 143-149.
[132] Galvita, V., Schröder, T., Munder, B., and Sundmacher, K., 2008, "Production ofhydrogen with low COx-content for PEM fuel cells by cyclic water gas shift reactor,"International Journal of Hydrogen Energy, 33(4), pp. 1354-1360.
__________________________________________________Chapter I - Introduction
33
[133] Besancon, B. M., Hasanov, V., Imbault-Lastapis, R., Benesch, R., Barrio, M., andMølnvik, M. J., 2009, "Hydrogen quality from decarbonized fossil fuels to fuel cells,"International Journal of Hydrogen Energy, 34(5), pp. 2350-2360.
[134] Mendes, D., Tosti, S., Borgognoni, F., Mendes, A., and Madeira, L. M., 2010,"Integrated analysis of a membrane-based process for hydrogen production fromethanol steam reforming," Catalysis Today, 156(3–4), pp. 107-117.
[135] Jang, J.-Y., Huang, Y.-X., and Cheng, C.-H., 2010, "The effects of geometric andoperating conditions on the hydrogen production performance of a micro-methanolsteam reformer," Chemical Engineering Science, 65(20), pp. 5495-5506.
[136] Song, T., Wu, J., Shen, L., and Xiao, J., 2012, "Experimental investigation onhydrogen production from biomass gasification in interconnected fluidized beds,"Biomass and Bioenergy, 36(0), pp. 258-267.
[137] Muradov, N., 2003, "Emission-free fuel reformers for mobile and portable fuelcell applications," Journal of Power Sources, 118(1–2), pp. 320-324.
[138] Zamel, N., and Li, X., 2011, "Effect of contaminants on polymer electrolytemembrane fuel cells," Progress in Energy and Combustion Science, 37(3), pp. 292-329.
[139] Cheng, X., Shi, Z., Glass, N., Zhang, L., Zhang, J. J., Song, D. T., Liu, Z. S., Wang, H.J., and Shen, J., 2007, "A review of PEM hydrogen fuel cell contamination: Impacts,mechanisms, and mitigation," Journal of Power Sources, 165(2), pp. 739-756.
[140] Stonehart, P., and Ross, P. N., 1975, "The Commonality of Surface Processes inElectrocatalysis and Gas-Phase Heterogeneous Catalysis," Catalysis Reviews, 12(1),pp. 1-35.
[141] Gilman, S., 1964, "The Mechanism of Electrochemical Oxidation of CarbonMonoxide and Methanol on Platinum. II. The “Reactant-Pair” Mechanism forElectrochemical Oxidation of Carbon Monoxide and Methanol1," The Journal ofPhysical Chemistry, 68(1), pp. 70-80.
[142] Vogel, W., Lundquist, L., Ross, P., and Stonehart, P., 1975, "Reaction pathwaysand poisons—II: The rate controlling step for electrochemical oxidation of hydrogenon Pt in acid and poisoning of the reaction by CO," Electrochimica Acta, 20(1), pp. 79-93.
[143] Santra, A. K., and Goodman, D. W., 2002, "Catalytic oxidation of CO by platinumgroup metals: from ultrahigh vacuum to elevated pressures," Electrochimica Acta,47(22–23), pp. 3595-3609.
Chapter I - Introduction__________________________________________________
34
[144] Hashimasa, Y., Matsuda, Y., and Akai, M., 2010, "Effects of Platinum Loading onPEFC Power Generation Performance Deterioration by Carbon Monoxide in HydrogenFuel," ECS Transactions, 26(1), pp. 131-142.
[145] Ehteshami, S. M. M., and Chan, S. H., 2013, "A review of electrocatalysts withenhanced CO tolerance and stability for polymer electrolyte membarane fuel cells,"Electrochimica Acta, 93(0), pp. 334-345.
[146] Angelo, M., St-Pierre, J., Bethune, K., and Rocheleau, R., 2011, "GasChromatography Study of Reactions of Carbon Monoxide at Different OperatingTemperatures within a PEMFC," ECS Transactions, 35(32), pp. 167-178.
[147] Jiménez, S., Soler, J., Valenzuela, R. X., and Daza, L., 2005, "Assessment of theperformance of a PEMFC in the presence of CO," Journal of Power Sources, 151(0),pp. 69-73.
[148] Wang, W., 2009, "The effect of internal air bleed on CO poisoning in a protonexchange membrane fuel cell," Journal of Power Sources, 191(2), pp. 400-406.
[149] Zhang, J. Z., Hongsirikarn, K., and Goodwin Jr, J. G., 2011, "The effect of lowconcentrations of CO on H2 adsorption and activation on Pt/C: Part 2—In thepresence of H2O vapor," Journal of Power Sources, 196(15), pp. 6186-6195.
[150] Murthy, M., Esayian, M., Lee, W.-k., and Zee, J. W. V., 2003, "The Effect ofTemperature and Pressure on the Performance of a PEMFC Exposed to Transient COConcentrations," Journal of the Electrochemical Society, 150(1), pp. A29-A34.
[151] Tingelöf, T., Hedström, L., Holmström, N., Alvfors, P., and Lindbergh, G., 2008,"The influence of CO2, CO and air bleed on the current distribution of a polymerelectrolyte fuel cell," International Journal of Hydrogen Energy, 33(8), pp. 2064-2072.
[152] Chung, C.-C., Chen, C.-H., and Weng, D.-Z., 2009, "Development of an airbleeding technique and specific duration to improve the CO tolerance of proton-exchange membrane fuel cells," Applied Thermal Engineering, 29(11–12), pp. 2518-2526.
[153] Angelo, M., Bethune, K., and Rocheleau, R., 2010, "The Impact of sub ppmCarbon Monoxide and ppm Level CO/Toluene and Methylcyclohexane/CO Mixtureson PEMFC Performance and Durability," ECS Transactions, 28(23), pp. 169-181.

35
Chapter II

36
___________________________________Chapter II - Segmented PEMFC - A review
37
Chapter 2 - Segmented PEMFC - A review1
2.1. Abstract
A complex interaction of many design, assembling and operating parameters as well
as the properties of the materials used in the construction of polymer electrolyte
membrane fuel cells (PEMFC) result in an uneven electrochemical performance over
the MEA active area. For more than one decade, segmented PEMFC (SFC) have been
used to study the factors responsible for that uneven performance. This paper
reviews relevant literature related to SFC published since 1998 focusing on the three
most important SFC design techniques: (1) printed circuit board, (2) resistors network
and (3) Hall effect sensors. First, the three techniques are described and fundamental
considerations for its design, construction and electrochemical characterization are
provided. After that, the effect of most important parameters on the current density
distribution is highlighted. Finally, representative results combining current density
distribution measurements with other analytical techniques for spatial analysis are
presented.
1 The content of this chapter is adapted from: Pérez, L. C., Brandão, L., Sousa, J. M., andMendes, A., 2011, "Segmented polymer electrolyte membrane fuel cells - A review,"Renewable and Sustainable Energy Reviews, 15(1), pp. 169-185.
Chapter II - Segmented PEMFC- A review____________________________________
38
2.2. Introduction
In order to accelerate the sluggish transition from R&D to full scale
commercialization of polymer electrolyte membrane fuel cells (PEMFC) [1], efforts
are still focused in overpassing delicate issues related to the hydrogen production
and storage [2,3] and the development of hydrogen delivery infrastructure [4]. In the
same way, recent publications highlight the need of cost reduction and further
understanding of PEMFC systems regarding their degradation mechanisms and
durability, water and thermal management, bipolar plates design and materials,
catalyst load reduction and CO tolerance as well as the materials of the membrane-
electrode assembly MEA [5,6,7]. To further understand PEMFC systems, a detailed
analysis of the influence of main parameters on its performance and the
development and combination of different in-situ analytical methods is fundamental.
On the one hand, it is relatively well documented that PEMFC performance is
affected by a complex interaction of many design, assembling and operating
parameters as well as by the properties and microstructure of materials used on their
construction. Design and assembling parameters include: i) flow field geometry and
ii) clamping pressure. Operating parameters include: i) species relative humidity,
partial pressure and flow rate, ii) temperature and iii) total pressure. Finally, issues
related to materials include: i) properties and ii) microstructure of materials, mainly
at the MEA level. On the other hand, it has been pointed out by several authors that
the most important implication of this complex interaction is an uneven
electrochemical response of the MEA active area, the same that may lead to low
reactants and electrocatalyst utilization, reducing the overall efficiency and
accelerating aging [8, 9, 10, 11].
In the last decade, segmented PEMFC (SFC) have proven to be an excellent in situ
diagnostic tool to study the factors responsible for the uneven electrochemical
response of the MEA active area. A SFC is similar to an ordinary fuel cell with the
exception that one of the electrodes is divided into smaller electrodes, each of which
can be interrogated for current, voltage and resistance, independently of the others
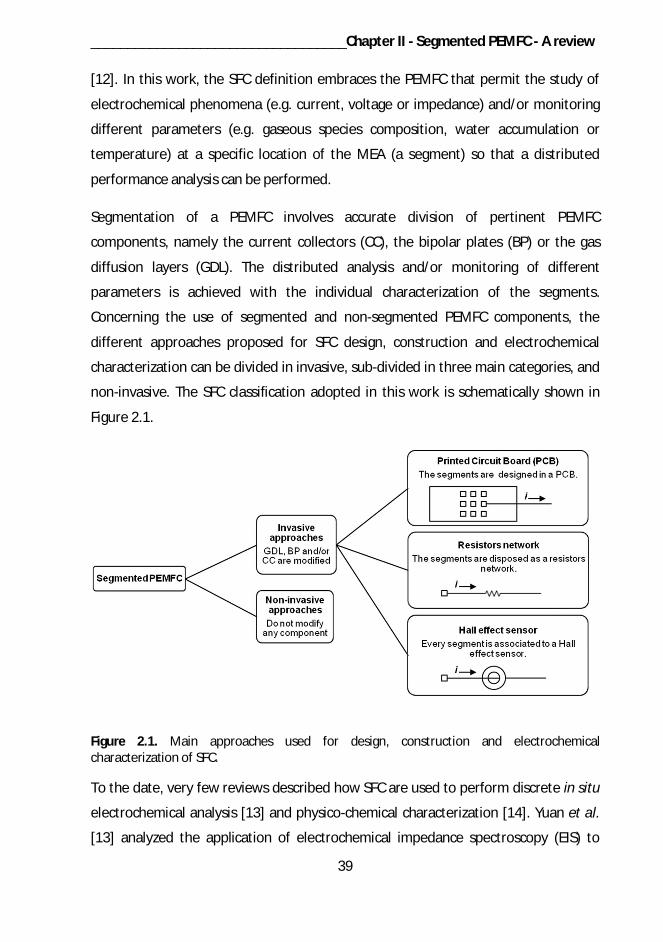
___________________________________Chapter II - Segmented PEMFC - A review
39
[12]. In this work, the SFC definition embraces the PEMFC that permit the study of
electrochemical phenomena (e.g. current, voltage or impedance) and/or monitoring
different parameters (e.g. gaseous species composition, water accumulation or
temperature) at a specific location of the MEA (a segment) so that a distributed
performance analysis can be performed.
Segmentation of a PEMFC involves accurate division of pertinent PEMFC
components, namely the current collectors (CC), the bipolar plates (BP) or the gas
diffusion layers (GDL). The distributed analysis and/or monitoring of different
parameters is achieved with the individual characterization of the segments.
Concerning the use of segmented and non-segmented PEMFC components, the
different approaches proposed for SFC design, construction and electrochemical
characterization can be divided in invasive, sub-divided in three main categories, and
non-invasive. The SFC classification adopted in this work is schematically shown in
Figure 2.1.
Figure 2.1. Main approaches used for design, construction and electrochemicalcharacterization of SFC.
To the date, very few reviews described how SFC are used to perform discrete in situ
electrochemical analysis [13] and physico-chemical characterization [14]. Yuan et al.
[13] analyzed the application of electrochemical impedance spectroscopy (EIS) to
Chapter II - Segmented PEMFC- A review____________________________________
40
PEMFC research and highlighted the most representative works that perform local
EIS measurements using SFC. Wu et al. [14] reviewed some approaches to measure
local quantities such as temperature and current density. Wang [15] categorized the
fundamental mathematical models that describe the physicochemical phenomena of
PEMFC systems and stated that SFC can provide the experimental data required to
validate them.
This Chapter targets: i) providing fundamental understanding of the design and
characterization techniques of SFC ii) to discuss the influence of the most important
design, assembling and operating parameters as well as the materials properties on
the current density distribution (CDD) of SFC and iii) present the analytical techniques
that have been combined with SFC since 1998.
2.3. Segmented PEMFC techniques
2.3.1. Main invasive approaches
The most frequently used invasive techniques for design, construction and
electrochemical characterization of SFC can be classified into three categories:
printed circuit board (PCB), resistors network and Hall effect sensors. These invasive
techniques require segmentation of one or both of the following components: the
CC, the BP and the GDL. There is no need to segment the membrane as it is ionically
but not electrically connected to the GDL [16]. The three main techniques have been
used at the German Aerospace Center (DLR) for both PEMFC and direct methanol
fuel cells (DMFC) [1] characterization, a brief discussion of the advantages and
disadvantages of each one was reported elsewhere [24]. It is noteworthy that SFC
with different MEA active areas and number of segments have been studied using
these techniques. The MEA active area is related to the power density of the cell
while the number of segments is related to the resolution desired for the
measurements. Small SFC with 1 cm2 [17], 3 cm2 [18], 5 cm2 [19] and large with 370
cm2 [9] and 578 cm2 [20] MEA active area have been reported. The number of
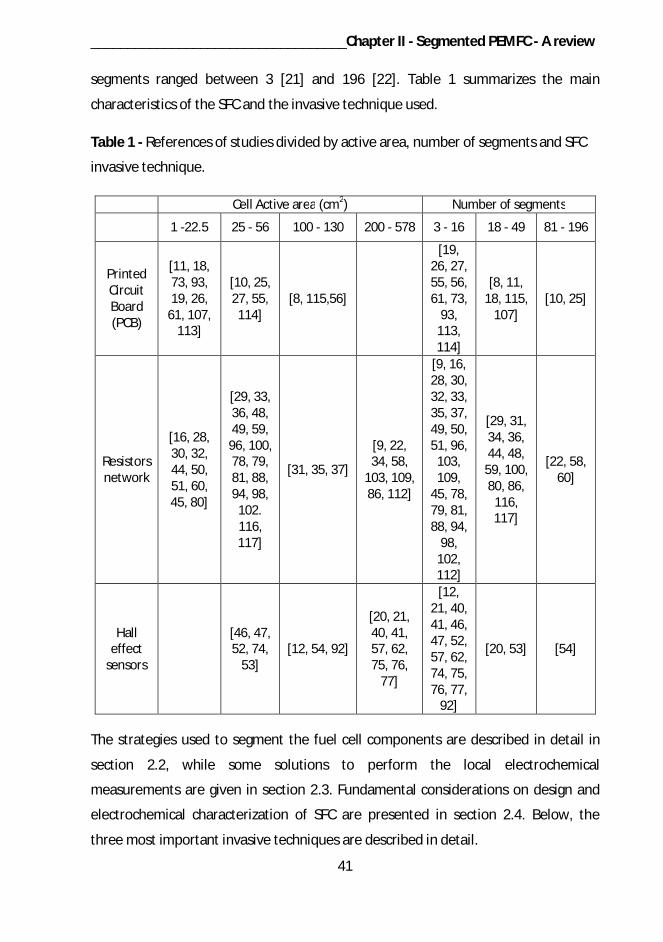
___________________________________Chapter II - Segmented PEMFC - A review
41
segments ranged between 3 [21] and 196 [22]. Table 1 summarizes the main
characteristics of the SFC and the invasive technique used.
Table 1 - References of studies divided by active area, number of segments and SFC
invasive technique.
Cell Active area (cm2) Number of segments
1 -22.5 25 - 56 100 - 130 200 - 578 3 - 16 18 - 49 81 - 196
PrintedCircuitBoard(PCB)
[11, 18,73, 93,19, 26,
61, 107,113]
[10, 25,27, 55,
114][8, 115,56]
[19,26, 27,55, 56,61, 73,
93,113,114]
[8, 11,18, 115,
107][10, 25]
Resistorsnetwork
[16, 28,30, 32,44, 50,51, 60,45, 80]
[29, 33,36, 48,49, 59,
96, 100,78, 79,81, 88,94, 98,
102.116,117]
[31, 35, 37]
[9, 22,34, 58,
103, 109,86, 112]
[9, 16,28, 30,32, 33,35, 37,49, 50,51, 96,
103,109,
45, 78,79, 81,88, 94,
98,102,112]
[29, 31,34, 36,44, 48,
59, 100,80, 86,
116,117]
[22, 58,60]
Halleffect
sensors
[46, 47,52, 74,
53][12, 54, 92]
[20, 21,40, 41,57, 62,75, 76,
77]
[12,21, 40,41, 46,47, 52,57, 62,74, 75,76, 77,
92]
[20, 53] [54]
The strategies used to segment the fuel cell components are described in detail in
section 2.2, while some solutions to perform the local electrochemical
measurements are given in section 2.3. Fundamental considerations on design and
electrochemical characterization of SFC are presented in section 2.4. Below, the
three most important invasive techniques are described in detail.
Chapter II - Segmented PEMFC- A review____________________________________
42
Printed circuit board (PCB)
The PCB technique for electrochemical characterization of SFC was introduced by
Cleghorn et al. [21]. The basic idea behind this technique is to replace one or both CC
with a PCB. Using PCB manufacturing techniques, a segmented current collector can
be designed on a thin, flat surface providing electrically isolated paths for individual
current/voltage measurement. The PCB is then placed between the flow field and the
end plate, minimizing the local influence of the PCB on the thermal and electrical
conductivity of the components while eliminating its interaction with the water
evolution and transport inside the cell. The PCB substrates are epoxy-fiber glass [10,
24] or polytetrafluoroethylene PTFE [25]. To facilitate the connection of the SFC to
the measurement unit, the PCB can be plated-through-hole (PTH) [8, 26]. The
segments of the PCB are usually gold coated to avoid corrosion and minimize contact
resistance. The reader is referred to [23] to deepen in PCB technology.
Interestingly, this technique offers the possibility to incorporate single straight [26],
single [24] and multiple channel [10, 8] serpentine flow fields directly on the PCB.
With this, the functions of the flow field are integrated in the current collector; less
components are needed to assembly the cell and the current is measured nearer the
reaction site as the PCB is in direct contact with the GDL. These characteristics allow
the insertion of the PCB between intermediate cells of PEMFC stacks [24]. In single
cells, when one current collector is replaced by a PCB the other can remain unaltered
so that the PCB can be placed between the anodic [8, 27] or cathodic [10, 26] bipolar
plate and the end plate. When the PCB is placed at the anode, the cathode is
available for complementary studies concerning water management [25]. The
electrode where the PCB is placed does not affect significantly the CDD
measurements [19]. An exploded view of a SFC incorporating a PCB as anodic current
collector is shown in Figure 2.2.
Company S++ (Germany) [111] offers three solutions for obtaining the CDD using the
PCB technique: one oriented to large fuel cells and stacks, one with improved
resolution capabilities (1152 segments) and the last with the flow fields incorporated
directly on the PCB.
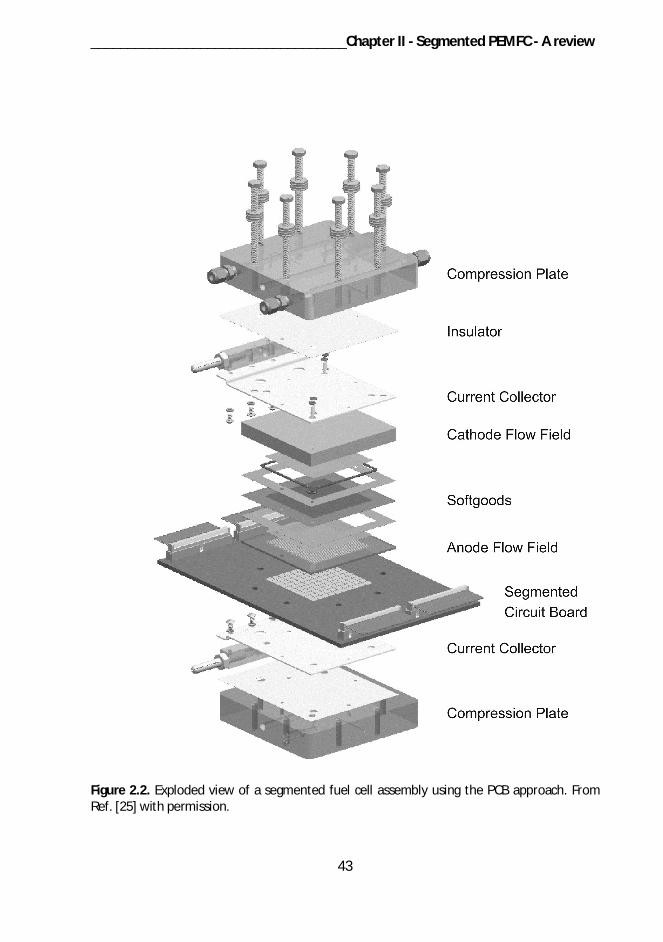
___________________________________Chapter II - Segmented PEMFC - A review
43
Figure 2.2. Exploded view of a segmented fuel cell assembly using the PCB approach. FromRef. [25] with permission.
Chapter II - Segmented PEMFC- A review____________________________________
44
Resistors network
The principles of the resistors network technique were introduced by Stumper et al.
[29] who developed two methodologies to measure the CDD in operating PEMFC.
The first one, the subcells approach, consists of punching out several circular pieces
of the GDL, replacing them with smaller, electrically isolated pieces with the same
characteristics, the subcells. In this form, the current density could be measured
independently at specific regions of the cell. The second methodology involves the
use of a current mapping plate formed by 121 identical graphite cylinders equally
distributed over a hexagonal area that matches the MEA active area. The graphite
cylinders were packed and placed between the flow field and the end plate, creating
a passive resistor network that assisted the CDD measurements.
Generically, in the resistors network approach, the anodic, the cathodic or both BP of
a PEMFC is/are divided into electrically isolated segments of the same shape, forming
a resistors network that incorporate a portion of the flow field. The electrochemical
characterization of the SFC can then be made in two ways: passively or actively. The
passive method involves the connection of a “precision”, “high resolution” or “shunt”
resistor in series with every resistor of the network so that the current density of
each segment can be calculated from the voltage drop over the precision resistor.
The nominal value of the precision resistors used in SFC characterization is 0.1 [29,
30, 31], 0.012 [32] or 0.01 [33]. The resistors network can be arranged in a
segmented current collector, permitting the use of unaltered BP and GDL [37]. A
detailed explanation of the measurement principles for the passive method is given
by Morimoto et al. [28]. Figure 2.3 schematizes a segmented fuel cell using the
resistors network technique and passive method for characterization. The cell has a
segmented bipolar plate and gas diffusion layer at the anode and a precision resistor
connected in series to each segment.
The active method involves direct connection of the resistors network to the
measurement unit, eliminating the use of the precision resistors [16, 35, 45, 49, 59,
60]. In this case, the current flowing through each resistor of the network is read
directly by the measurement unit.

___________________________________Chapter II - Segmented PEMFC - A review
45
Company Helmbold Messtechnik (Germany) [118] has developed a SFC with 196
segments and 244 cm2 active area using a segmented graphite plate as cathode.
Figure 2.3. Schematic of a segmented fuel cell using the resistors network approach andpassive method for characterization. Adapted from Ref. [33] with permission.
Hall effect sensors
The fundamentals of this technique were introduced by Wieser et al. [20]. This
technique involves the association of one Hall effect sensor to every single
electrically isolated segment of the segmented cell. A Hall effect sensor is a current
transducer with four terminals: two for the connections to a source of current and
two for the measurement of voltage across it [38]. Hall effect sensors work under the
Hall effect principle, which states that when a conductor that carries current is placed
into a magnetic field, a voltage is generated perpendicular to both the current and
the field [39]. When a Hall effect sensor is used in a SFC, the density of the magnetic
flux passing through the Hall element determines the output voltage of the sensor,
which is proportional to the current generated by the segment. Two Hall effect
sensors topologies, namely open loop [12] and closed loop [40] have been used for
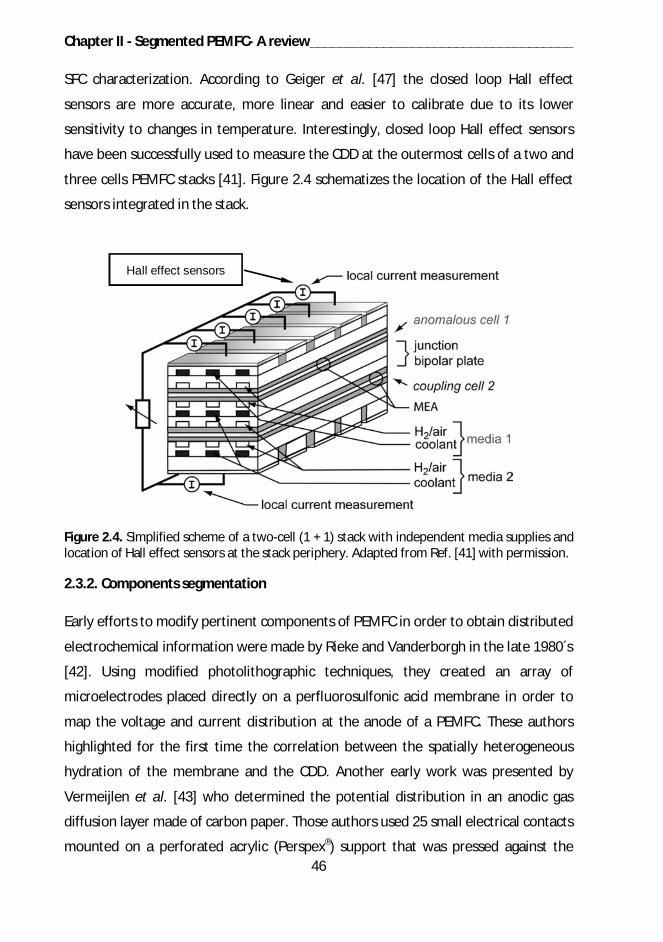
Chapter II - Segmented PEMFC- A review____________________________________
46
SFC characterization. According to Geiger et al. [47] the closed loop Hall effect
sensors are more accurate, more linear and easier to calibrate due to its lower
sensitivity to changes in temperature. Interestingly, closed loop Hall effect sensors
have been successfully used to measure the CDD at the outermost cells of a two and
three cells PEMFC stacks [41]. Figure 2.4 schematizes the location of the Hall effect
sensors integrated in the stack.
Figure 2.4. Simplified scheme of a two-cell (1 + 1) stack with independent media supplies andlocation of Hall effect sensors at the stack periphery. Adapted from Ref. [41] with permission.
2.3.2. Components segmentation
Early efforts to modify pertinent components of PEMFC in order to obtain distributed
electrochemical information were made by Rieke and Vanderborgh in the late 1980´s
[42]. Using modified photolithographic techniques, they created an array of
microelectrodes placed directly on a perfluorosulfonic acid membrane in order to
map the voltage and current distribution at the anode of a PEMFC. These authors
highlighted for the first time the correlation between the spatially heterogeneous
hydration of the membrane and the CDD. Another early work was presented by
Vermeijlen et al. [43] who determined the potential distribution in an anodic gas
diffusion layer made of carbon paper. Those authors used 25 small electrical contacts
mounted on a perforated acrylic (Perspex®) support that was pressed against the
Hall effect sensors
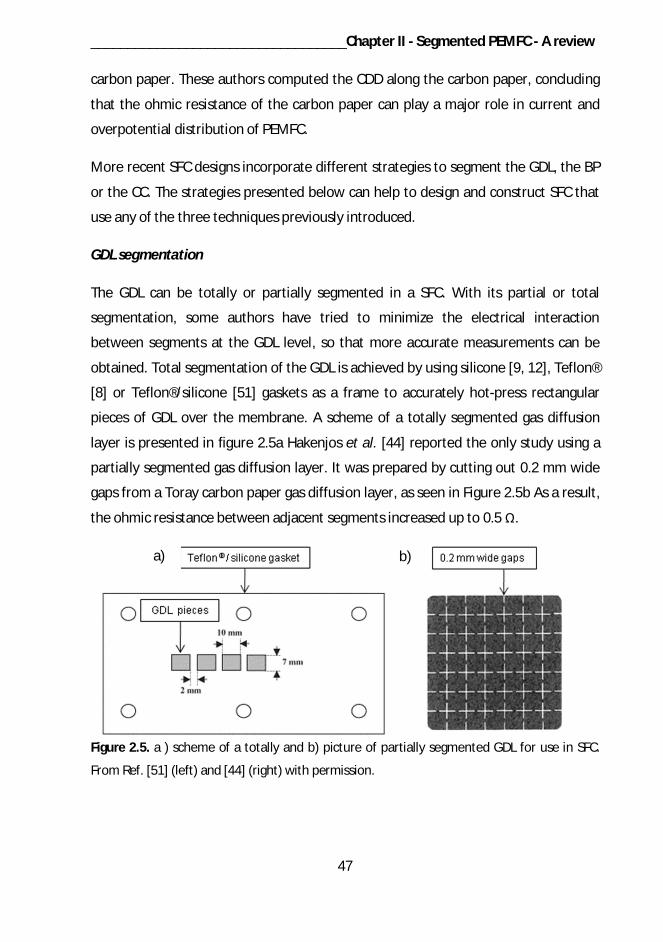
___________________________________Chapter II - Segmented PEMFC - A review
47
carbon paper. These authors computed the CDD along the carbon paper, concluding
that the ohmic resistance of the carbon paper can play a major role in current and
overpotential distribution of PEMFC.
More recent SFC designs incorporate different strategies to segment the GDL, the BP
or the CC. The strategies presented below can help to design and construct SFC that
use any of the three techniques previously introduced.
GDL segmentation
The GDL can be totally or partially segmented in a SFC. With its partial or total
segmentation, some authors have tried to minimize the electrical interaction
between segments at the GDL level, so that more accurate measurements can be
obtained. Total segmentation of the GDL is achieved by using silicone [9, 12], Teflon®
[8] or Teflon®/silicone [51] gaskets as a frame to accurately hot-press rectangular
pieces of GDL over the membrane. A scheme of a totally segmented gas diffusion
layer is presented in figure 2.5a Hakenjos et al. [44] reported the only study using a
partially segmented gas diffusion layer. It was prepared by cutting out 0.2 mm wide
gaps from a Toray carbon paper gas diffusion layer, as seen in Figure 2.5b As a result,
the ohmic resistance between adjacent segments increased up to 0.5 .
Figure 2.5. a ) scheme of a totally and b) picture of partially segmented GDL for use in SFC.
From Ref. [51] (left) and [44] (right) with permission.
a) b)
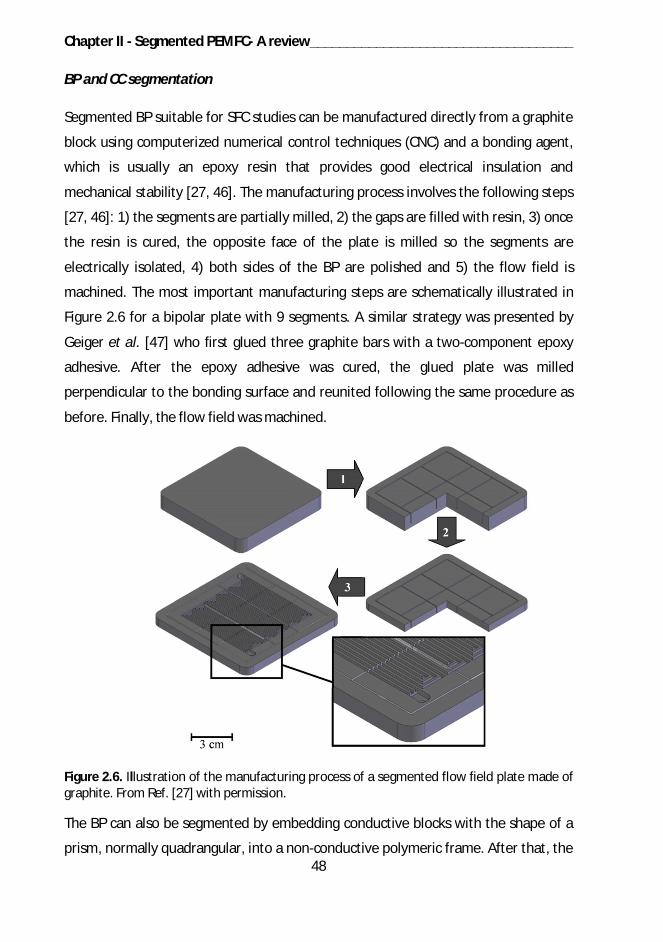
Chapter II - Segmented PEMFC- A review____________________________________
48
BP and CC segmentation
Segmented BP suitable for SFC studies can be manufactured directly from a graphite
block using computerized numerical control techniques (CNC) and a bonding agent,
which is usually an epoxy resin that provides good electrical insulation and
mechanical stability [27, 46]. The manufacturing process involves the following steps
[27, 46]: 1) the segments are partially milled, 2) the gaps are filled with resin, 3) once
the resin is cured, the opposite face of the plate is milled so the segments are
electrically isolated, 4) both sides of the BP are polished and 5) the flow field is
machined. The most important manufacturing steps are schematically illustrated in
Figure 2.6 for a bipolar plate with 9 segments. A similar strategy was presented by
Geiger et al. [47] who first glued three graphite bars with a two-component epoxy
adhesive. After the epoxy adhesive was cured, the glued plate was milled
perpendicular to the bonding surface and reunited following the same procedure as
before. Finally, the flow field was machined.
Figure 2.6. Illustration of the manufacturing process of a segmented flow field plate made ofgraphite. From Ref. [27] with permission.
The BP can also be segmented by embedding conductive blocks with the shape of a
prism, normally quadrangular, into a non-conductive polymeric frame. After that, the
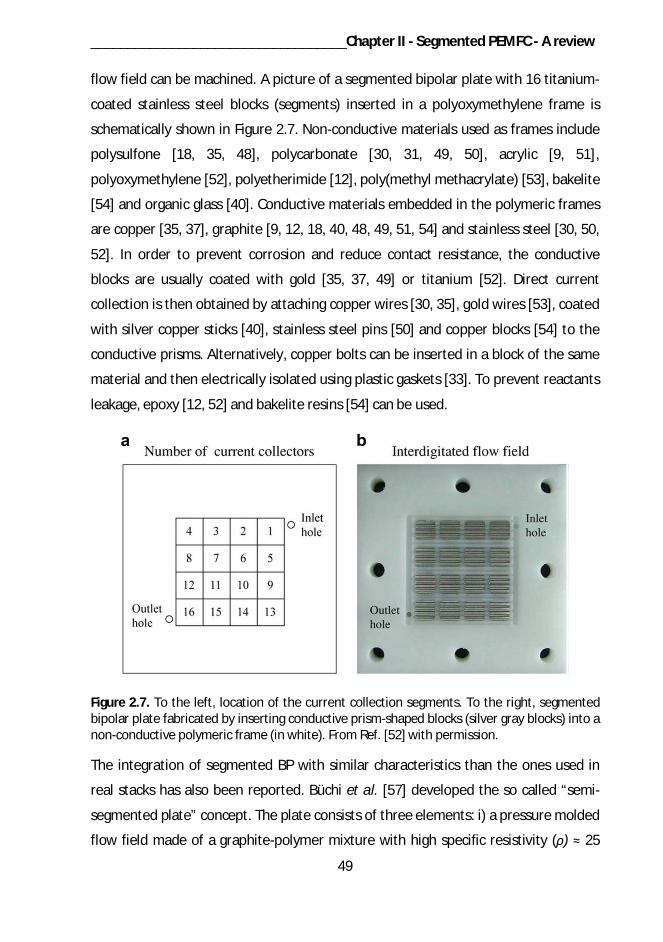
___________________________________Chapter II - Segmented PEMFC - A review
49
flow field can be machined. A picture of a segmented bipolar plate with 16 titanium-
coated stainless steel blocks (segments) inserted in a polyoxymethylene frame is
schematically shown in Figure 2.7. Non-conductive materials used as frames include
polysulfone [18, 35, 48], polycarbonate [30, 31, 49, 50], acrylic [9, 51],
polyoxymethylene [52], polyetherimide [12], poly(methyl methacrylate) [53], bakelite
[54] and organic glass [40]. Conductive materials embedded in the polymeric frames
are copper [35, 37], graphite [9, 12, 18, 40, 48, 49, 51, 54] and stainless steel [30, 50,
52]. In order to prevent corrosion and reduce contact resistance, the conductive
blocks are usually coated with gold [35, 37, 49] or titanium [52]. Direct current
collection is then obtained by attaching copper wires [30, 35], gold wires [53], coated
with silver copper sticks [40], stainless steel pins [50] and copper blocks [54] to the
conductive prisms. Alternatively, copper bolts can be inserted in a block of the same
material and then electrically isolated using plastic gaskets [33]. To prevent reactants
leakage, epoxy [12, 52] and bakelite resins [54] can be used.
Figure 2.7. To the left, location of the current collection segments. To the right, segmentedbipolar plate fabricated by inserting conductive prism-shaped blocks (silver gray blocks) into anon-conductive polymeric frame (in white). From Ref. [52] with permission.
The integration of segmented BP with similar characteristics than the ones used in
real stacks has also been reported. Büchi et al. [57] developed the so called “semi-
segmented plate” concept. The plate consists of three elements: i) a pressure molded
flow field made of a graphite-polymer mixture with high specific resistivity ( ) 25
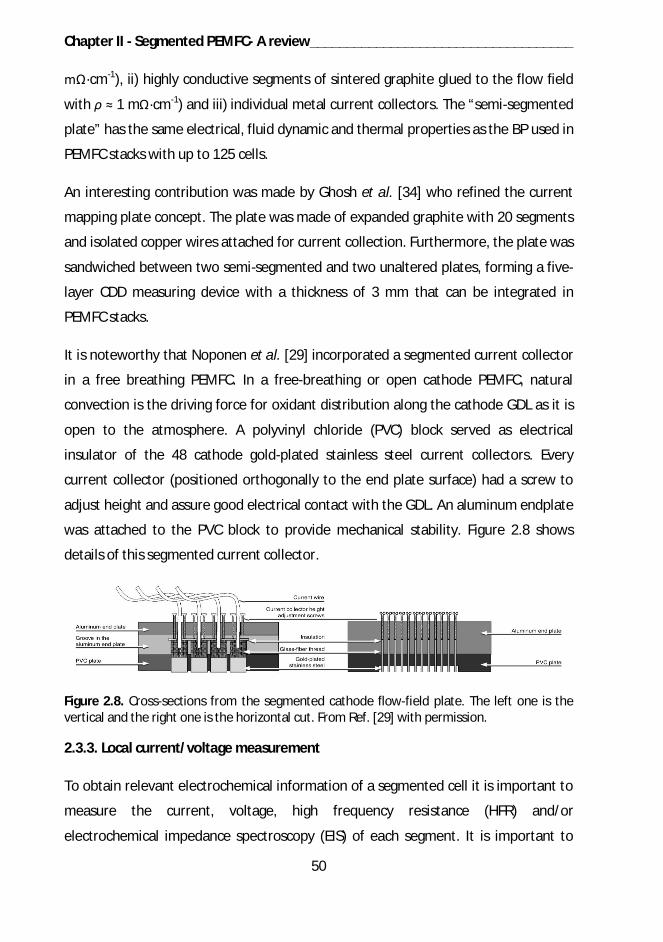
Chapter II - Segmented PEMFC- A review____________________________________
50
·cm-1), ii) highly conductive segments of sintered graphite glued to the flow field
with 1 m ·cm-1) and iii) individual metal current collectors. The “semi-segmented
plate” has the same electrical, fluid dynamic and thermal properties as the BP used in
PEMFC stacks with up to 125 cells.
An interesting contribution was made by Ghosh et al. [34] who refined the current
mapping plate concept. The plate was made of expanded graphite with 20 segments
and isolated copper wires attached for current collection. Furthermore, the plate was
sandwiched between two semi-segmented and two unaltered plates, forming a five-
layer CDD measuring device with a thickness of 3 mm that can be integrated in
PEMFC stacks.
It is noteworthy that Noponen et al. [29] incorporated a segmented current collector
in a free breathing PEMFC. In a free-breathing or open cathode PEMFC, natural
convection is the driving force for oxidant distribution along the cathode GDL as it is
open to the atmosphere. A polyvinyl chloride (PVC) block served as electrical
insulator of the 48 cathode gold-plated stainless steel current collectors. Every
current collector (positioned orthogonally to the end plate surface) had a screw to
adjust height and assure good electrical contact with the GDL. An aluminum endplate
was attached to the PVC block to provide mechanical stability. Figure 2.8 shows
details of this segmented current collector.
Figure 2.8. Cross-sections from the segmented cathode flow-field plate. The left one is thevertical and the right one is the horizontal cut. From Ref. [29] with permission.
2.3.3. Local current/voltage measurement
To obtain relevant electrochemical information of a segmented cell it is important to
measure the current, voltage, high frequency resistance (HFR) and/or
electrochemical impedance spectroscopy (EIS) of each segment. It is important to
___________________________________Chapter II - Segmented PEMFC - A review
51
mention the efforts made by some research groups aiming to compensate the
voltage drop across the segments when using the PCB and the resistors network
approach for CDD measurements.
Kulikovsky et al. [18] plugged the PCB of their SFC to a measurement unit that
incorporates a shunt resistor and an amplifier to convert the current into a voltage
signal. The unit included a circuit for voltage drop compensation across the PCB paths
and shunt resistor, providing in this way equal potential to all segments. A system for
active voltage drop compensation using a PCB was developed by Sauer et al. [11].
The system included the connection of the segments to a voltage source and a
transistor in series with a shunt resistor. Santiago et al. [27] proposed another
solution to measure the current and voltage in a PCB with voltage drop
compensation. Each path of the PCB permitted the connection of the segments to
individual low impedance (0.18 m ) closed loop Hall effect sensors. The current
measured by the Hall effect sensors was then converted to a potential by connecting
the former to individual precision resistors of 1 k .
Concerning the resistors network technique, Siroma et al. [60] reported the use of a
data logger and a 100 channel zero-shunt current/voltage converter to obtain the
current and minimize voltage drop through the segments. Tabe et al. [31] reported
another strategy, these authors connected variable resistances to each segment, so
that their individual resistance could be calibrated and the difference in contact
resistance compensated. At the beginning of the experiments, the overall cell
resistance was set to a constant value by adjusting the variable resistances in order
to obtain a uniform CDD of 0.5 A·cm-2.
The use of Hall effect sensors facilitates the measurement of the CDD, being
necessary only a data acquisition (DAQ) unit and a multiplexer as done by Wieser et
al. [20] and Geiger et al. [47].
Complementarily, HFR and EIS measurements can be performed with in-house built
measurement systems [46] or commercial Frequency Response Analyzer (FRA) [8, 12,
32, 61]. Companies Zahner-elektrik GmbH & Co. KG (Germany) and Arbin Instruments
Chapter II - Segmented PEMFC- A review____________________________________
52
(USA) offer multichannel potentiostats/galvanostats to perform both CDD and EIS
measurements.
2.3.4. Fundamental considerations for SFC design
Components
In this section, general recommendations for segmentation of the components are
given. First of all, it should be noted that GDL segmentation requires BP and CC
segmentation, increasing the complexity of the design and its assembly [40, 49]. To
overcome this, partial segmentation of the GDL is a fair option as it reduces electrical
interaction between segments and is not as time demanding as total segmentation.
Total segmentation of the GDL can lead to misalignment problems between
corresponding anodic and cathodic parts of the GDL, the same that can lead to
membrane failure due to thinning via chemical degradation and pinhole formation
[104].
If the BP are segmented, they must provide uniform and robust mechanical support
to the MEA, otherwise the MEA can break down at high current densities ( 1 A·cm-2)
from the places with poor mechanical support [59]. Gas leakages may appear if
segmented the BP are constructed by inserting conductive prisms into a non-
conductive polymer frame. The use of epoxy resins is a common practice as it
prevents gas leakages and glues the prisms to the frame. It is very important to
reduce the electrical resistances of metallic surfaces by coating them with titanium,
silver or gold; another option is to insert graphitic foils between them.
It is important to keep the pressure distribution between components as uniform as
possible or the segments will have different contact resistances, affecting the
measurements. The pressure distribution between surfaces can be checked with
pressure sensitive films [12, 36] while uneven contact resistance can be corrected by
connecting a variable resistance to every segment as stated above. More
sophisticated ways to evaluate the contact resistance variations between segments
involve measuring the HFR each segment at two different relative humidity (RH)
___________________________________Chapter II - Segmented PEMFC - A review
53
conditions with the SFC running on air at the anode and the cathode [53] or using the
four wire resistance measurement method to determine their impedance [27].
Regarding the wiring array used to connect the cell to the measurement unit, it must
be kept as short as possible to reduce ohmic losses [19].
Uncertainties associated to the use of SFC
There are uncertainties related to structural differences between SFC and regular
PEMFC. The evaluation of these uncertainties has served to validate the use of SFC as
analytical technique and has been focused on two aspects: i) the need of GDL and BP
segmentation and ii) the relative error introduced by the auxiliary measurement
circuitry system of SFC.
The discussion around the need of GDL and BP segmentation has been focused on
how the in-plane and through-plane electrical conductivity of components (i.e. the
use of non-segmented GDL along with segmented BP) affect the local
electrochemical characterization of the segments. Researchers have evaluated the
need of the GDL or the BP segmentation both numerically and experimentally. All the
mathematical models used to evaluate numerically the uncertainties aimed to
simulate the solid phase potential distribution in repetitive current-collecting
elements at different current densities [29, 51, 56].
For example, Noponen et al. [29] used 48 electrically isolated pins in direct contact
with a non-segmented GDL for direct current collection and observed a difference in
performance no greater than 10% between adjacent segments at different
experimental conditions. These authors also simulated the effect of using a non-
segmented GDL on the current collection of four neighboring segments using the
FEMLAB® multiphysics software package. From the simulations, they concluded that
current density from each segment can be measured with reasonable accuracy even
if the GDL is not segmented as far as the contact resistance differences between the
segments and the GDL are minimized. Natarajan and Nguyen [51] evaluated the
effect of GDL segmentation in a different form. These authors obtained galvanostatic
and potentiostatic polarization curves for each segment using segmented BP and CC.

Chapter II - Segmented PEMFC- A review____________________________________
54
Segmented and non-segmented GDL were used in the MEA and the results were
compared. For both segmented and non-segmented GDL, differences in segment
performance were minimal in the galvanostatic tests. The potentiostatic tests
showed a minimal difference in performance for each segment when using a
segmented GDL. For the non-segmented GDL, on the other hand, the potentiostatic
tests showed a significant difference in performance for each segment. Overall cell
performances were similar, irrespective of the type of test, potentiostatic or
galvanostatic. Finally, it was recommended: i) to segment the GDL along with the BP
and the CC as contact resistance variations between the BP and the GDL are
negligible, irrespective of the type of test and ii) to perform galvanostatic tests rather
than potentiostatic tests if the GDL is non-segmented, as this minimizes differences
for each segment performance due to uneven electrical contact resistances between
the segments and the GDL.
The need of BP segmentation was discussed by Eckl et al. [56], who evaluated the
effect of BP segmentation using a segmented anodic bipolar plate with resistors
network and a non-segmented anodic bipolar plate with a PCB as current collector.
The cathodic bipolar plate and current collector as well as the GDL remained
unaltered in both cases. For the resistors network case, the major parameters
causing lateral current spreading (from segment to segment) were found to be the
resistance difference of the individual measurement circuits and the current density
gradient between neighboring segments. Due to non-segmentation of the bipolar
plate, the PCB showed higher lateral current spreading; however, it was proposed by
these authors that the use of a PCB along with non-segmented BP provide a good
alternative for CDD measurements.
The error introduced by the auxiliary measurement circuitry has been evaluated
individually for each approach and concerns the use of PCB, resistors network and
Hall effect sensors. Regarding the use of PCB, Sauer et al. [11] used an empirical
formula to calculate the relative error in current measurements introduced by their
PCB with active voltage drop compensation. The cell was operated galvanostatically;
it had a non-segmented GDL and segmented anodic bipolar plate and current
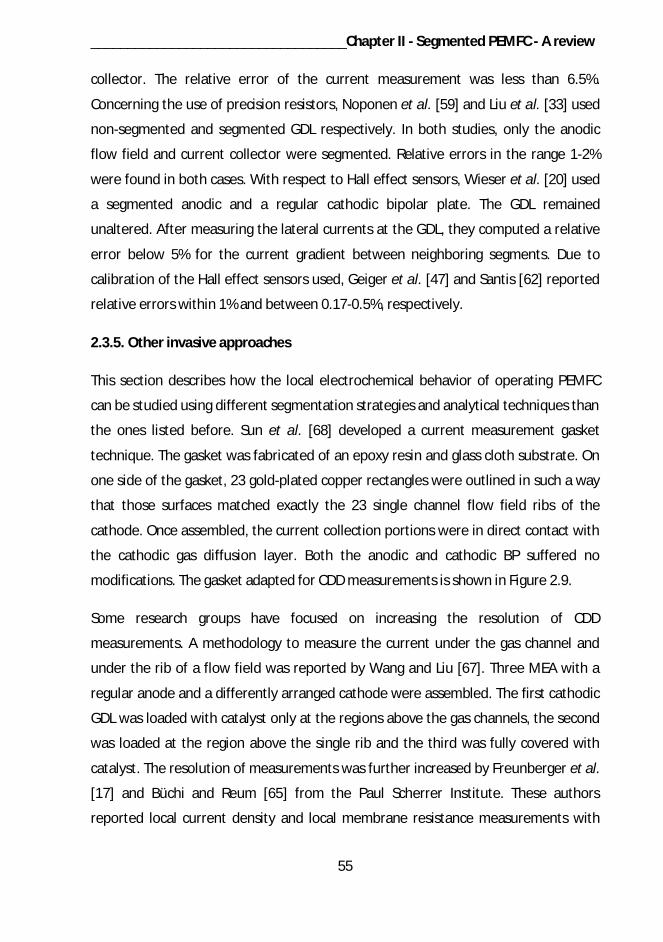
___________________________________Chapter II - Segmented PEMFC - A review
55
collector. The relative error of the current measurement was less than 6.5%.
Concerning the use of precision resistors, Noponen et al. [59] and Liu et al. [33] used
non-segmented and segmented GDL respectively. In both studies, only the anodic
flow field and current collector were segmented. Relative errors in the range 1-2%
were found in both cases. With respect to Hall effect sensors, Wieser et al. [20] used
a segmented anodic and a regular cathodic bipolar plate. The GDL remained
unaltered. After measuring the lateral currents at the GDL, they computed a relative
error below 5% for the current gradient between neighboring segments. Due to
calibration of the Hall effect sensors used, Geiger et al. [47] and Santis [62] reported
relative errors within 1% and between 0.17-0.5%, respectively.
2.3.5. Other invasive approaches
This section describes how the local electrochemical behavior of operating PEMFC
can be studied using different segmentation strategies and analytical techniques than
the ones listed before. Sun et al. [68] developed a current measurement gasket
technique. The gasket was fabricated of an epoxy resin and glass cloth substrate. On
one side of the gasket, 23 gold-plated copper rectangles were outlined in such a way
that those surfaces matched exactly the 23 single channel flow field ribs of the
cathode. Once assembled, the current collection portions were in direct contact with
the cathodic gas diffusion layer. Both the anodic and cathodic BP suffered no
modifications. The gasket adapted for CDD measurements is shown in Figure 2.9.
Some research groups have focused on increasing the resolution of CDD
measurements. A methodology to measure the current under the gas channel and
under the rib of a flow field was reported by Wang and Liu [67]. Three MEA with a
regular anode and a differently arranged cathode were assembled. The first cathodic
GDL was loaded with catalyst only at the regions above the gas channels, the second
was loaded at the region above the single rib and the third was fully covered with
catalyst. The resolution of measurements was further increased by Freunberger et al.
[17] and Büchi and Reum [65] from the Paul Scherrer Institute. These authors
reported local current density and local membrane resistance measurements with
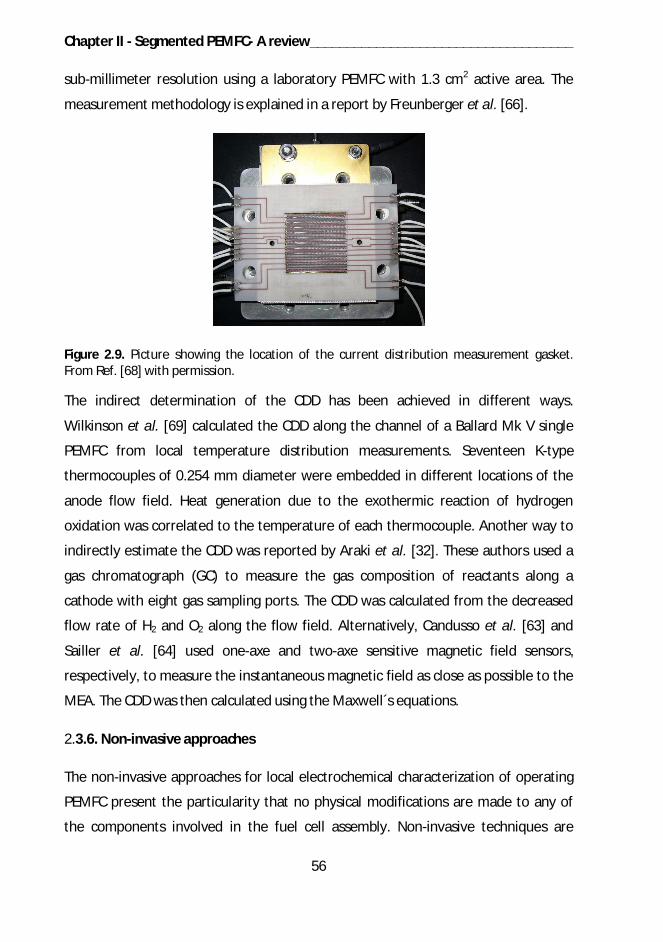
Chapter II - Segmented PEMFC- A review____________________________________
56
sub-millimeter resolution using a laboratory PEMFC with 1.3 cm2 active area. The
measurement methodology is explained in a report by Freunberger et al. [66].
Figure 2.9. Picture showing the location of the current distribution measurement gasket.From Ref. [68] with permission.
The indirect determination of the CDD has been achieved in different ways.
Wilkinson et al. [69] calculated the CDD along the channel of a Ballard Mk V single
PEMFC from local temperature distribution measurements. Seventeen K-type
thermocouples of 0.254 mm diameter were embedded in different locations of the
anode flow field. Heat generation due to the exothermic reaction of hydrogen
oxidation was correlated to the temperature of each thermocouple. Another way to
indirectly estimate the CDD was reported by Araki et al. [32]. These authors used a
gas chromatograph (GC) to measure the gas composition of reactants along a
cathode with eight gas sampling ports. The CDD was calculated from the decreased
flow rate of H2 and O2 along the flow field. Alternatively, Candusso et al. [63] and
Sailler et al. [64] used one-axe and two-axe sensitive magnetic field sensors,
respectively, to measure the instantaneous magnetic field as close as possible to the
MEA. The CDD was then calculated using the Maxwell´s equations.
2.3.6. Non-invasive approaches
The non-invasive approaches for local electrochemical characterization of operating
PEMFC present the particularity that no physical modifications are made to any of
the components involved in the fuel cell assembly. Non-invasive techniques are
___________________________________Chapter II - Segmented PEMFC - A review
57
supported by sophisticated magnetic field measurement devices. Claycomb et al. [70]
employed high temperature superconducting (HTS) and low temperature
superconducting (LTS) direct current Superconductive Quantum Interference Devices
(SQUID) and flux gate magnetometers to obtain spatial magnetic field maps of an
operating PEMFC. SQUID are magnetic flux-to-voltage transducers often used in non-
destructive and non-invasive analysis of materials [71]. Hauer et al. [72] introduced a
magnetic inducted tomography technique to indirectly measure the CDD. Two 3D
magnetic field sensors were used for the readings. One sensor scanned the upper
while the other scanned the lower part of the cell. The experimental set-up allowed
four-axis scan measurements, creating a CDD map of the fuel cell.
2.4. Parameters influence on current density distribution
The simplest way to study the distributed electrochemical performance over the
MEA active area is to measure the CDD. In this section, the effect of relevant design,
assembling and operating parameters as well as the use of different MEA materials
on CDD is discussed. To analyze the effect of one parameter, researchers have kept
constant the others. Table 2 summarizes the parameters studied using SFC.
The CDD profiles have been graphically presented in several forms, for example: as a
surface on which the current density is represented as discrete sections of the MEA
active area [54, 55, 86], as a trend line on which the current density is presented as a
function of the fractional distance from the inlet of the cell [109, 113] and as a trend
line on which the current density is presented as a function of every segment of the
cell [33, 48, 75].
Despite its importance, few authors have developed strategies for homogenizing the
CDD. Santis et al. [119] tried to achieve this goal by using cathodic GDL with different
Pt catalyst loading gradients along the air flow field channels. The anodic and
cathodic GDL had an average Pt loading of 0.6 mg·cm-2. Below, the effect of each
parameter on the CDD is discussed in detail.
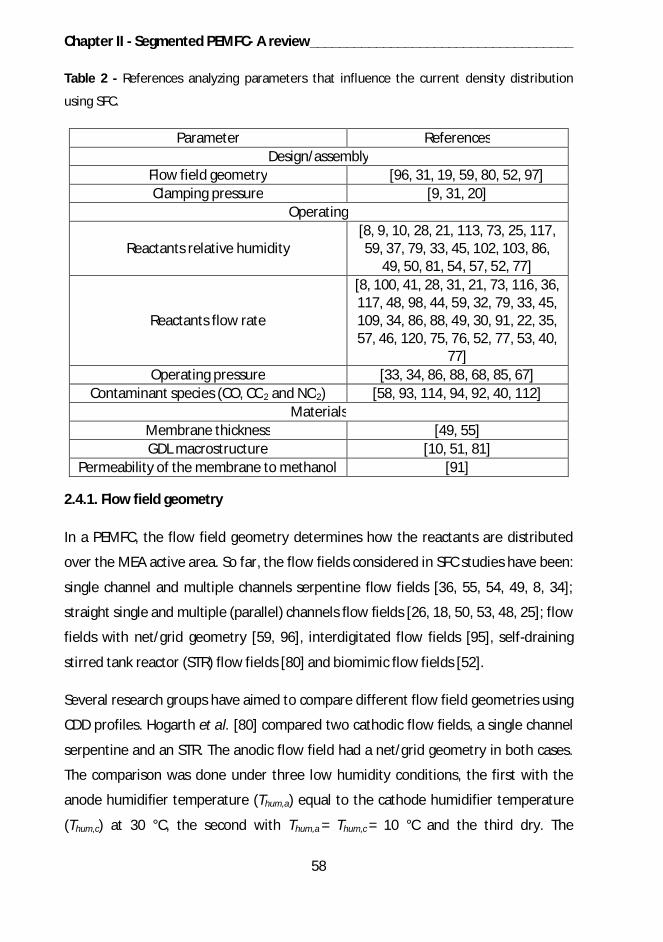
Chapter II - Segmented PEMFC- A review____________________________________
58
Table 2 - References analyzing parameters that influence the current density distribution
using SFC.
Parameter ReferencesDesign/assembly
Flow field geometry [96, 31, 19, 59, 80, 52, 97]Clamping pressure [9, 31, 20]
Operating
Reactants relative humidity[8, 9, 10, 28, 21, 113, 73, 25, 117,59, 37, 79, 33, 45, 102, 103, 86,
49, 50, 81, 54, 57, 52, 77]
Reactants flow rate
[8, 100, 41, 28, 31, 21, 73, 116, 36,117, 48, 98, 44, 59, 32, 79, 33, 45,109, 34, 86, 88, 49, 30, 91, 22, 35,57, 46, 120, 75, 76, 52, 77, 53, 40,
77]Operating pressure [33, 34, 86, 88, 68, 85, 67]
Contaminant species (CO, CO2 and NO2) [58, 93, 114, 94, 92, 40, 112]Materials
Membrane thickness [49, 55]GDL macrostructure [10, 51, 81]
Permeability of the membrane to methanol [91]
2.4.1. Flow field geometry
In a PEMFC, the flow field geometry determines how the reactants are distributed
over the MEA active area. So far, the flow fields considered in SFC studies have been:
single channel and multiple channels serpentine flow fields [36, 55, 54, 49, 8, 34];
straight single and multiple (parallel) channels flow fields [26, 18, 50, 53, 48, 25]; flow
fields with net/grid geometry [59, 96], interdigitated flow fields [95], self-draining
stirred tank reactor (STR) flow fields [80] and biomimic flow fields [52].
Several research groups have aimed to compare different flow field geometries using
CDD profiles. Hogarth et al. [80] compared two cathodic flow fields, a single channel
serpentine and an STR. The anodic flow field had a net/grid geometry in both cases.
The comparison was done under three low humidity conditions, the first with the
anode humidifier temperature (Thum,a) equal to the cathode humidifier temperature
(Thum,c) at 30 °C, the second with Thum,a = Thum,c = 10 °C and the third dry. The
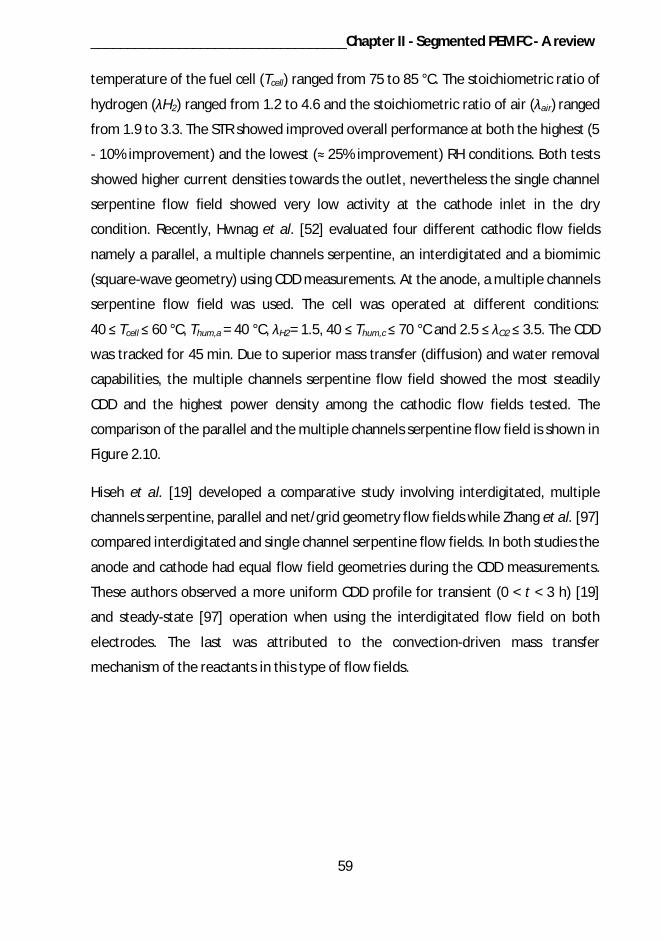
___________________________________Chapter II - Segmented PEMFC - A review
59
temperature of the fuel cell (Tcell) ranged from 75 to 85 °C. The stoichiometric ratio of
hydrogen ( H2) ranged from 1.2 to 4.6 and the stoichiometric ratio of air ( air) ranged
from 1.9 to 3.3. The STR showed improved overall performance at both the highest (5
- 10% improvement) and the lowest ( 25% improvement) RH conditions. Both tests
showed higher current densities towards the outlet, nevertheless the single channel
serpentine flow field showed very low activity at the cathode inlet in the dry
condition. Recently, Hwnag et al. [52] evaluated four different cathodic flow fields
namely a parallel, a multiple channels serpentine, an interdigitated and a biomimic
(square-wave geometry) using CDD measurements. At the anode, a multiple channels
serpentine flow field was used. The cell was operated at different conditions:
40 Tcell 60 °C, Thum,a = 40 °C, H2= 1.5, 40 Thum,c 70 °C and 2.5 O2 3.5. The CDD
was tracked for 45 min. Due to superior mass transfer (diffusion) and water removal
capabilities, the multiple channels serpentine flow field showed the most steadily
CDD and the highest power density among the cathodic flow fields tested. The
comparison of the parallel and the multiple channels serpentine flow field is shown in
Figure 2.10.
Hiseh et al. [19] developed a comparative study involving interdigitated, multiple
channels serpentine, parallel and net/grid geometry flow fields while Zhang et al. [97]
compared interdigitated and single channel serpentine flow fields. In both studies the
anode and cathode had equal flow field geometries during the CDD measurements.
These authors observed a more uniform CDD profile for transient (0 < t < 3 h) [19]
and steady-state [97] operation when using the interdigitated flow field on both
electrodes. The last was attributed to the convection-driven mass transfer
mechanism of the reactants in this type of flow fields.
Chapter II - Segmented PEMFC- A review____________________________________
60
Figure 2.10. Transient developments of the local current distribution, (a) parallel flow fieldand (b) serpentine flow field, U = 0.5 V, Tcell = 40 °C, H2 = 1.5 and O2 = 2.5. From Ref. [52] withpermission.
The effect of most relevant flow field geometric parameters (e.g. channel/rib width)
on CDD was investigated by Reum et al. [110]. Several channel/rib configurations
were used in their SFC with increased CDD measurement resolution. It was
concluded that a flow field design with wider ribs and smaller channels can lead to
higher and more homogeneous performances for a wide range of operating
conditions (oxygen fractions above 10%) due to improved water management.
It is accepted that, on a general basis, more uniform CDD profiles are observed when
reactants are fed in counter flow mode, that is, when the fuel and oxidant inlet and
outlet are located at opposite sites [28, 30, 46, 98].
___________________________________Chapter II - Segmented PEMFC - A review
61
Concerning DMFC, Gülzow et al. [96] compared a net/grid and a single channel
serpentine flow field placed at the cathode. A net/grid flow field was used at the
anode in both cases. The methanol flow rate (Qmet) was 20 ml·min-1 and had a 1.5 M
methanol concentration while the air flow rate (Qair) was 600 ml·min-1, dry. The
anode and cathode pressure was 2.5 and 3.5 bar respectively and Tcell = 90 °C. The
CDD profile for the serpentine flow field was more homogeneous and showed a low
current density zone near the cathode inlet associated to the drying effect of air on
the membrane. The net/grid flow field showed high activity at center while the
corners were producing almost no current.
2.4.2. Clamping pressure
In PEMFC systems, the clamping pressure is related to the tightening torque applied
to the bolts located at the endplates. The clamping pressure is equal to the force
required to compress the MEA, gaskets, BP and CC so that the pressure between
these components is as uniformly distributed as possible and the PEMFC is gas tight.
Due to differences in design and materials, every PEMFC system has its own clamping
pressure. Using SFC, few groups have investigated the effect of clamping pressure on
CDD; nonetheless, this is a parameter that must be taken into account when
assembling a single cell or stack. Indeed, a recent study [99] reported that the local
mass, charge and heat transfer properties of the GDL can vary significantly due to
inhomogeneous compression caused by the flow field geometry of the BP over the
MEA. Tabe et al. [31] analyzed how two different clamping pressures (0.6 and 1.2
MPa) affected the CDD at Thum,a = Thum,c = 40 °C and Tcell = 50 °C and for H2 = 1.3 and
O2 = 1.4. The CDD was measured 240 s after starting the experiments. The CDD was
higher for 0.6 MPa because of the lower mass transfer resistance of the GDL. On the
other hand, the higher clamping pressure exhibited a more uniform CDD due to a
more uniform contact pressure between the GDL and the BP.
2.4.3. Relative humidity of reactants
In technical fuel cells, gradients in reactant RH are unavoidable along the flow fields
[82]. The RH of reactants plays a key role in keeping a correct level of hydration of
Chapter II - Segmented PEMFC- A review____________________________________
62
the membrane and strongly influences the water transport mechanisms, namely the
electro-osmotic drag (from anode to cathode) and the back-diffusion (from cathode
to anode) of water [83]. Generally, as reactants are fed at lower saturation states,
the membrane will not achieve a good hydration level near the inlet, increasing the
local membrane resistance. On the other hand, if reactants are oversaturated, too
much water will be present near the outlet leading to GDL pore blocking (flooding).
Cleghorn et al. [8] studied the effect of increasing the anode RH on CDD and local
HFR for a SFC with multiple channels serpentine flow fields at Tcell = Thum,c = 80 °C,
Qair = 5000 ml·min-1 and hydrogen flow rate (QH2) of 700 ml·min-1. Three RH conditions
were considered for the anode, Thum,a = 80 °C and Thum,a = 100 °C and dry condition.
The oversaturated condition showed highest, more homogeneous current density
and the lowest, more homogeneous HFR. The other cases showed an increase in
current density and a decrease in HFR towards the outlet, with a better performance
for the saturated condition. Sun et al. [84] analyzed the effect of increasing the
anode RH for: i) dry cathode feed and ii) saturated cathode feed. For the first case
Tcell = 59.85 °C and for the second Tcell = 69.85 °C. For the first case, QH2 = 250 ml·min-1
and Qair = 700 ml·min-1, for the second, QH2 = 200 ml·min-1 and Qair = 600 ml·min-1.
Each run lasted 6.5 h and the Thum,a was gradually increased from
39.85 Thum,a 89.85 °C starting at non-humidified conditions. For the first case (dry
cathode feed), and even at oversaturated conditions of the anode, the membrane
never reached a fully hydrated state and the local current density increased towards
the outlet. For the second case (saturated cathode feed), the cell showed a steadily
decrease in current densities from the inlet to the outlet accentuated at anode
oversaturated conditions as a result of flooding.
Noponen et al. [59] studied the effect of feeding pure oxygen with two different RH.
These authors considered a segmented cell with an anodic net/grid geometry flow
field and a cathodic special flow field with multiple inlets and outlets. For the studies,
Thum,a = Tcell = 60 °C, H2= 3.4 and O2= 5.5. The Thum,c = 60 °C for the high humidity and
Thum,c = 40 °C for the low RH conditions. The high RH condition showed a more
uniform CDD. The low RH condition showed a slight increase in current density
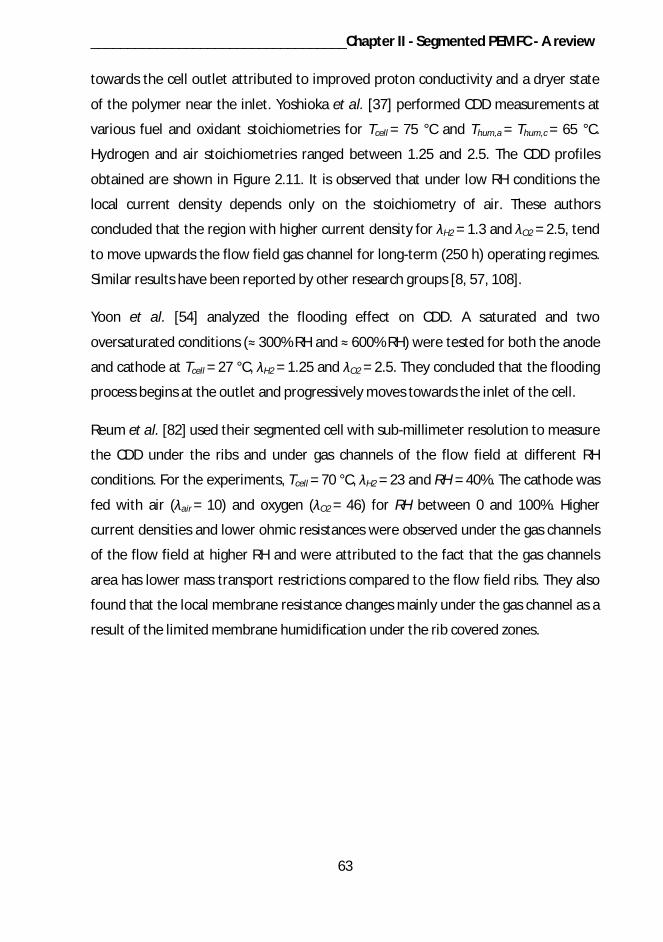
___________________________________Chapter II - Segmented PEMFC - A review
63
towards the cell outlet attributed to improved proton conductivity and a dryer state
of the polymer near the inlet. Yoshioka et al. [37] performed CDD measurements at
various fuel and oxidant stoichiometries for Tcell = 75 °C and Thum,a = Thum,c = 65 °C.
Hydrogen and air stoichiometries ranged between 1.25 and 2.5. The CDD profiles
obtained are shown in Figure 2.11. It is observed that under low RH conditions the
local current density depends only on the stoichiometry of air. These authors
concluded that the region with higher current density for H2 = 1.3 and O2 = 2.5, tend
to move upwards the flow field gas channel for long-term (250 h) operating regimes.
Similar results have been reported by other research groups [8, 57, 108].
Yoon et al. [54] analyzed the flooding effect on CDD. A saturated and two
oversaturated conditions ( 300% RH and 600% RH) were tested for both the anode
and cathode at Tcell = 27 °C, H2 = 1.25 and O2 = 2.5. They concluded that the flooding
process begins at the outlet and progressively moves towards the inlet of the cell.
Reum et al. [82] used their segmented cell with sub-millimeter resolution to measure
the CDD under the ribs and under gas channels of the flow field at different RH
conditions. For the experiments, Tcell = 70 °C, H2 = 23 and RH = 40%. The cathode was
fed with air ( air = 10) and oxygen ( O2 = 46) for RH between 0 and 100%. Higher
current densities and lower ohmic resistances were observed under the gas channels
of the flow field at higher RH and were attributed to the fact that the gas channels
area has lower mass transport restrictions compared to the flow field ribs. They also
found that the local membrane resistance changes mainly under the gas channel as a
result of the limited membrane humidification under the rib covered zones.
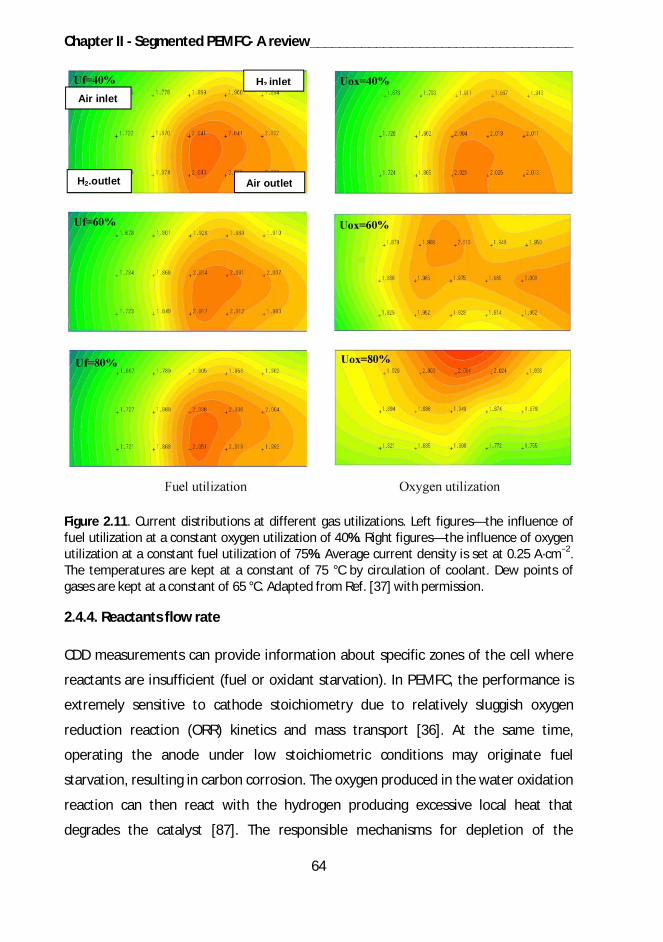
Chapter II - Segmented PEMFC- A review____________________________________
64
Figure 2.11. Current distributions at different gas utilizations. Left figures—the influence offuel utilization at a constant oxygen utilization of 40%. Right figures—the influence of oxygenutilization at a constant fuel utilization of 75%. Average current density is set at 0.25 A·cm 2.The temperatures are kept at a constant of 75 °C by circulation of coolant. Dew points ofgases are kept at a constant of 65 °C. Adapted from Ref. [37] with permission.
2.4.4. Reactants flow rate
CDD measurements can provide information about specific zones of the cell where
reactants are insufficient (fuel or oxidant starvation). In PEMFC, the performance is
extremely sensitive to cathode stoichiometry due to relatively sluggish oxygen
reduction reaction (ORR) kinetics and mass transport [36]. At the same time,
operating the anode under low stoichiometric conditions may originate fuel
starvation, resulting in carbon corrosion. The oxygen produced in the water oxidation
reaction can then react with the hydrogen producing excessive local heat that
degrades the catalyst [87]. The responsible mechanisms for depletion of the
H2 inlet
H2.outlet
Air inlet
Air outlet

___________________________________Chapter II - Segmented PEMFC - A review
65
reactants along the flow field channels are: upstream consumption, which leads to an
scarcity of reactants downstream, blockage of the flow field channel, inadequate
water removal from the flow field channels and restricted access of reactants to the
electrode due to poorly designed flow fields [73].
Figure 2.12. Deviation of current density from average current density in the segments 1–4 asfunction of total cell current. Cell operated in constant flow mode with gas flows ratescorresponding to H2 = 2 and air = 1.5 @ 80 A total cell current (400 mA·cm-2).Tcell = Thum,a = Thum,c = 70 °C. From Ref. [57] with permission.
Natarajan and Nguyen [45] studied the effect of hydrogen starvation in a straight
single channel segmented cell with five segments (organized as a horizontal row) at
Tcell 30 °C, Thum,a = 40 °C, Thum,c = 30 °C, QH2= 5.1 ml·min-1 and oxygen flow rate (QO2)
of 19 ml·min-1. Current density was tracked during 30 min for 0.70, 0.60 and 0.55 V.
When segments were at 0.70 V, hydrogen was in excess for the reaction and current
densities were stable for all segments. For 0.6 V, starvation effects were observed in
segments four and five as more than 70% of the hydrogen was consumed at the
three first segments. Finally, at 0.55 V the starvation effects were observed in
segments three, four and five, with the last two generating almost no current.
Büchi et al. [57] operated a segmented cell of technical relevance (200 cm2 cell active
area) at different oxidant stoichiometries 1.1 air 3. Other operating conditions
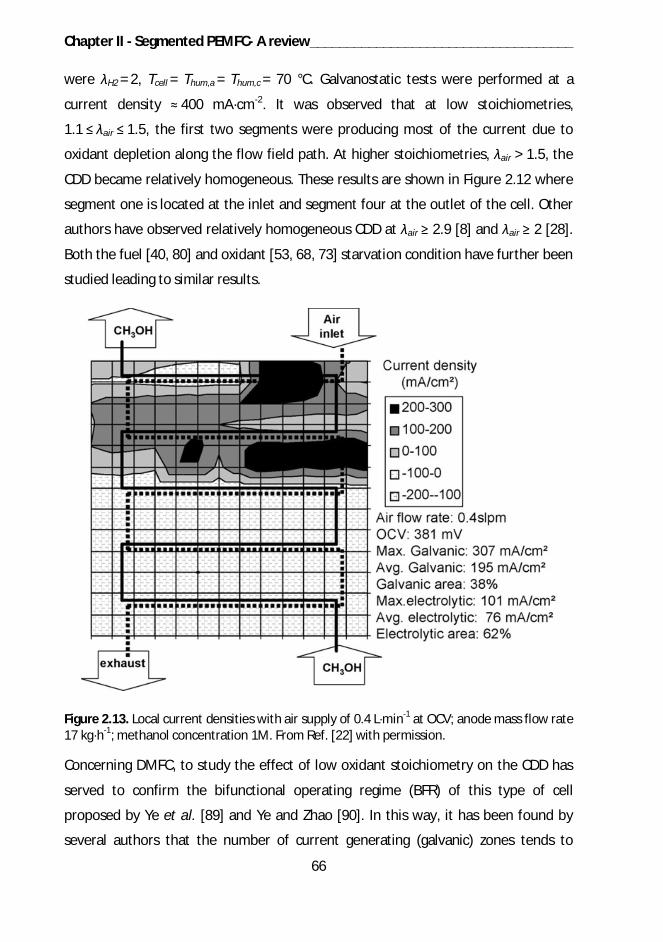
Chapter II - Segmented PEMFC- A review____________________________________
66
were H2 = 2, Tcell = Thum,a = Thum,c = 70 °C. Galvanostatic tests were performed at a
current density 400 mA·cm-2. It was observed that at low stoichiometries,
1.1 air 1.5, the first two segments were producing most of the current due to
oxidant depletion along the flow field path. At higher stoichiometries, air > 1.5, the
CDD became relatively homogeneous. These results are shown in Figure 2.12 where
segment one is located at the inlet and segment four at the outlet of the cell. Other
authors have observed relatively homogeneous CDD at air 2.9 [8] and air 2 [28].
Both the fuel [40, 80] and oxidant [53, 68, 73] starvation condition have further been
studied leading to similar results.
Figure 2.13. Local current densities with air supply of 0.4 L·min-1 at OCV; anode mass flow rate17 kg·h-1; methanol concentration 1M. From Ref. [22] with permission.
Concerning DMFC, to study the effect of low oxidant stoichiometry on the CDD has
served to confirm the bifunctional operating regime (BFR) of this type of cell
proposed by Ye et al. [89] and Ye and Zhao [90]. In this way, it has been found by
several authors that the number of current generating (galvanic) zones tends to
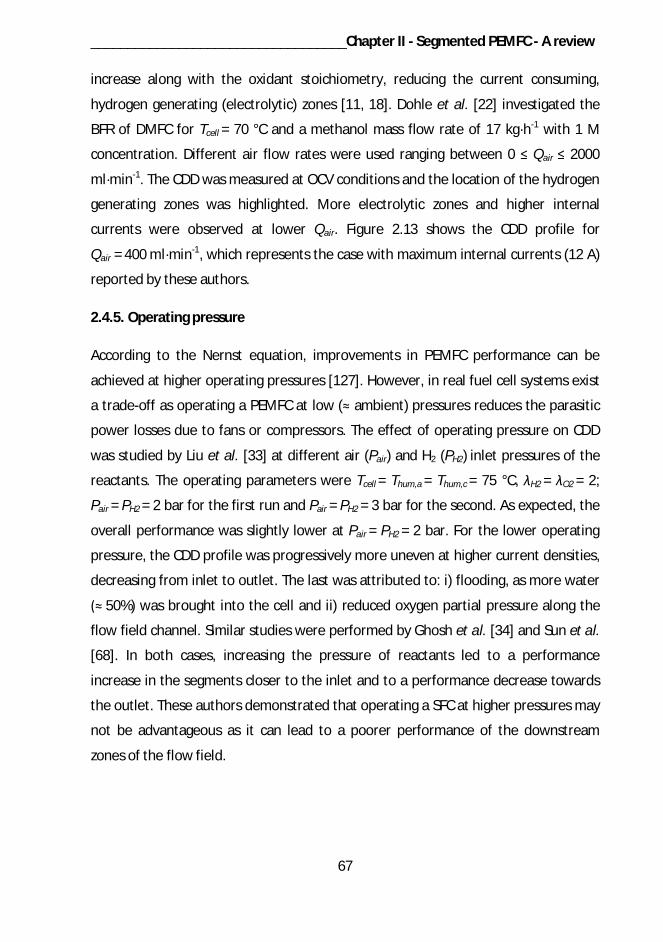
___________________________________Chapter II - Segmented PEMFC - A review
67
increase along with the oxidant stoichiometry, reducing the current consuming,
hydrogen generating (electrolytic) zones [11, 18]. Dohle et al. [22] investigated the
BFR of DMFC for Tcell = 70 °C and a methanol mass flow rate of 17 kg·h-1 with 1 M
concentration. Different air flow rates were used ranging between 0 Qair 2000
ml·min-1. The CDD was measured at OCV conditions and the location of the hydrogen
generating zones was highlighted. More electrolytic zones and higher internal
currents were observed at lower Qair. Figure 2.13 shows the CDD profile for
Qair = 400 ml·min-1, which represents the case with maximum internal currents (12 A)
reported by these authors.
2.4.5. Operating pressure
According to the Nernst equation, improvements in PEMFC performance can be
achieved at higher operating pressures [127]. However, in real fuel cell systems exist
a trade-off as operating a PEMFC at low ( ambient) pressures reduces the parasitic
power losses due to fans or compressors. The effect of operating pressure on CDD
was studied by Liu et al. [33] at different air (Pair) and H2 (PH2) inlet pressures of the
reactants. The operating parameters were Tcell = Thum,a = Thum,c = 75 °C, H2 = O2 = 2;
Pair = PH2 = 2 bar for the first run and Pair = PH2 = 3 bar for the second. As expected, the
overall performance was slightly lower at Pair = PH2 = 2 bar. For the lower operating
pressure, the CDD profile was progressively more uneven at higher current densities,
decreasing from inlet to outlet. The last was attributed to: i) flooding, as more water
50%) was brought into the cell and ii) reduced oxygen partial pressure along the
flow field channel. Similar studies were performed by Ghosh et al. [34] and Sun et al.
[68]. In both cases, increasing the pressure of reactants led to a performance
increase in the segments closer to the inlet and to a performance decrease towards
the outlet. These authors demonstrated that operating a SFC at higher pressures may
not be advantageous as it can lead to a poorer performance of the downstream
zones of the flow field.
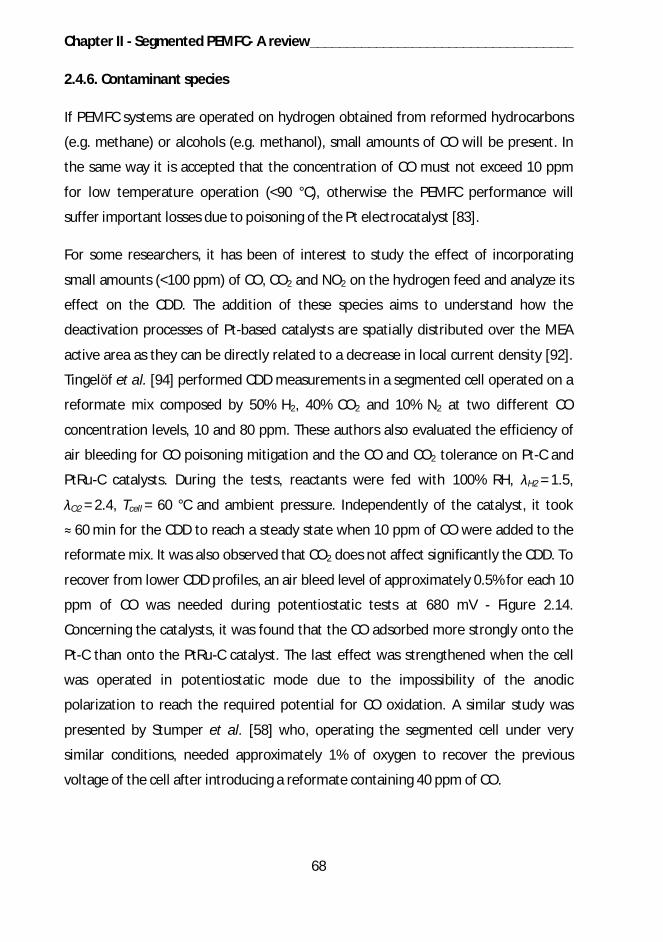
Chapter II - Segmented PEMFC- A review____________________________________
68
2.4.6. Contaminant species
If PEMFC systems are operated on hydrogen obtained from reformed hydrocarbons
(e.g. methane) or alcohols (e.g. methanol), small amounts of CO will be present. In
the same way it is accepted that the concentration of CO must not exceed 10 ppm
for low temperature operation (<90 °C), otherwise the PEMFC performance will
suffer important losses due to poisoning of the Pt electrocatalyst [83].
For some researchers, it has been of interest to study the effect of incorporating
small amounts (<100 ppm) of CO, CO2 and NO2 on the hydrogen feed and analyze its
effect on the CDD. The addition of these species aims to understand how the
deactivation processes of Pt-based catalysts are spatially distributed over the MEA
active area as they can be directly related to a decrease in local current density [92].
Tingelöf et al. [94] performed CDD measurements in a segmented cell operated on a
reformate mix composed by 50% H2, 40% CO2 and 10% N2 at two different CO
concentration levels, 10 and 80 ppm. These authors also evaluated the efficiency of
air bleeding for CO poisoning mitigation and the CO and CO2 tolerance on Pt-C and
PtRu-C catalysts. During the tests, reactants were fed with 100% RH, H2 = 1.5,
O2 = 2.4, Tcell = 60 °C and ambient pressure. Independently of the catalyst, it took
60 min for the CDD to reach a steady state when 10 ppm of CO were added to the
reformate mix. It was also observed that CO2 does not affect significantly the CDD. To
recover from lower CDD profiles, an air bleed level of approximately 0.5% for each 10
ppm of CO was needed during potentiostatic tests at 680 mV - Figure 2.14.
Concerning the catalysts, it was found that the CO adsorbed more strongly onto the
Pt-C than onto the PtRu-C catalyst. The last effect was strengthened when the cell
was operated in potentiostatic mode due to the impossibility of the anodic
polarization to reach the required potential for CO oxidation. A similar study was
presented by Stumper et al. [58] who, operating the segmented cell under very
similar conditions, needed approximately 1% of oxygen to recover the previous
voltage of the cell after introducing a reformate containing 40 ppm of CO.
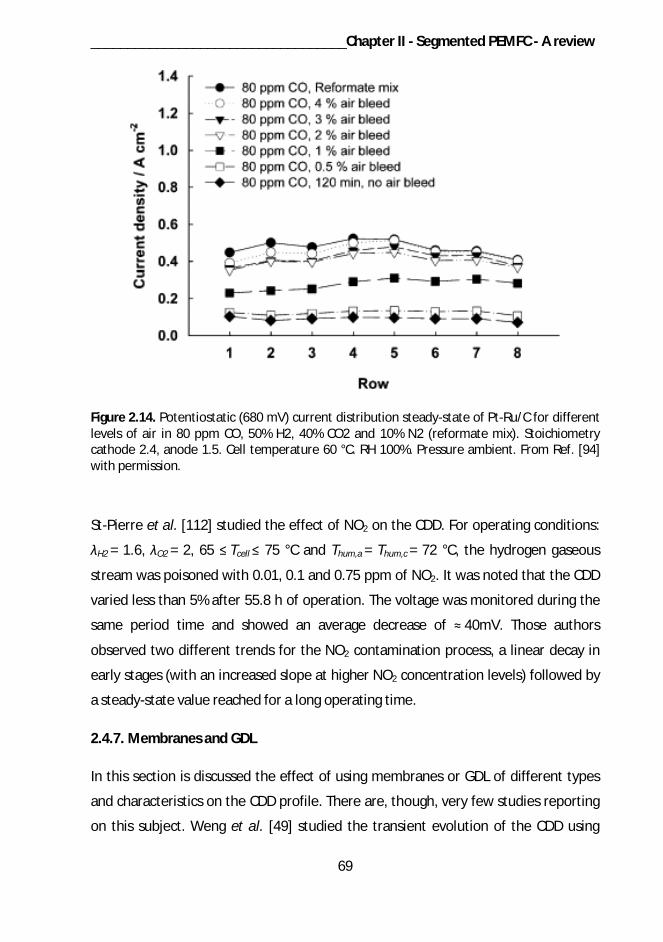
___________________________________Chapter II - Segmented PEMFC - A review
69
Figure 2.14. Potentiostatic (680 mV) current distribution steady-state of Pt-Ru/C for differentlevels of air in 80 ppm CO, 50% H2, 40% CO2 and 10% N2 (reformate mix). Stoichiometrycathode 2.4, anode 1.5. Cell temperature 60 °C. RH 100%. Pressure ambient. From Ref. [94]with permission.
St-Pierre et al. [112] studied the effect of NO2 on the CDD. For operating conditions:
H2 = 1.6, O2 = 2, 65 Tcell 75 °C and Thum,a = Thum,c = 72 °C, the hydrogen gaseous
stream was poisoned with 0.01, 0.1 and 0.75 ppm of NO2. It was noted that the CDD
varied less than 5% after 55.8 h of operation. The voltage was monitored during the
same period time and showed an average decrease of 40mV. Those authors
observed two different trends for the NO2 contamination process, a linear decay in
early stages (with an increased slope at higher NO2 concentration levels) followed by
a steady-state value reached for a long operating time.
2.4.7. Membranes and GDL
In this section is discussed the effect of using membranes or GDL of different types
and characteristics on the CDD profile. There are, though, very few studies reporting
on this subject. Weng et al. [49] studied the transient evolution of the CDD using
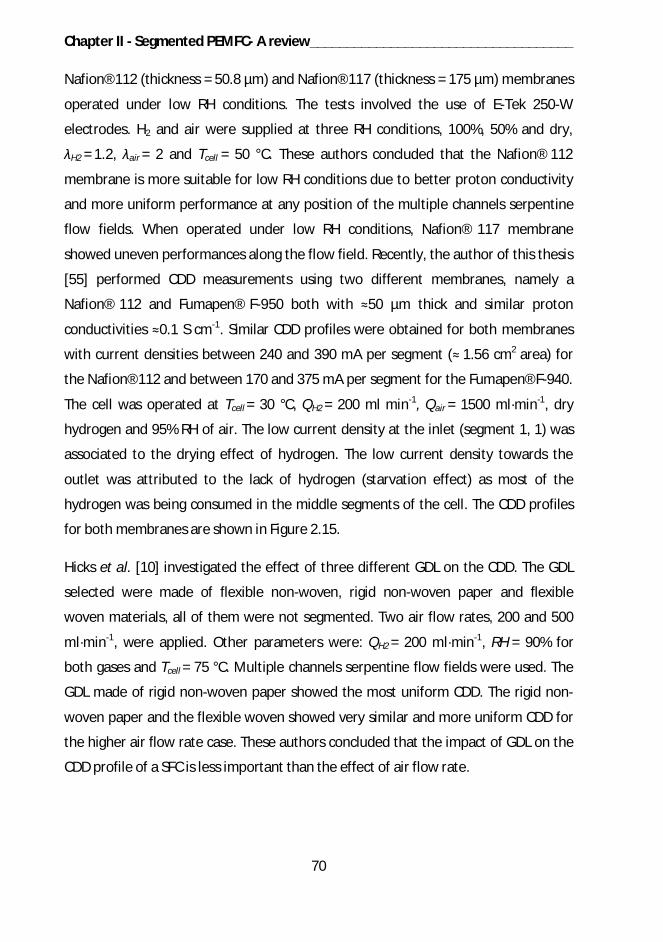
Chapter II - Segmented PEMFC- A review____________________________________
70
Nafion® 112 (thickness = 50.8 µm) and Nafion® 117 (thickness = 175 µm) membranes
operated under low RH conditions. The tests involved the use of E-Tek 250-W
electrodes. H2 and air were supplied at three RH conditions, 100%, 50% and dry,
H2 = 1.2, air = 2 and Tcell = 50 °C. These authors concluded that the Nafion® 112
membrane is more suitable for low RH conditions due to better proton conductivity
and more uniform performance at any position of the multiple channels serpentine
flow fields. When operated under low RH conditions, Nafion® 117 membrane
showed uneven performances along the flow field. Recently, the author of this thesis
[55] performed CDD measurements using two different membranes, namely a
Nafion® 112 and Fumapen® F-950 both with 50 µm thick and similar proton
conductivities 0.1 S cm-1. Similar CDD profiles were obtained for both membranes
with current densities between 240 and 390 mA per segment ( 1.56 cm2 area) for
the Nafion® 112 and between 170 and 375 mA per segment for the Fumapen® F-940.
The cell was operated at Tcell = 30 °C, QH2 = 200 ml min-1, Qair = 1500 ml·min-1, dry
hydrogen and 95% RH of air. The low current density at the inlet (segment 1, 1) was
associated to the drying effect of hydrogen. The low current density towards the
outlet was attributed to the lack of hydrogen (starvation effect) as most of the
hydrogen was being consumed in the middle segments of the cell. The CDD profiles
for both membranes are shown in Figure 2.15.
Hicks et al. [10] investigated the effect of three different GDL on the CDD. The GDL
selected were made of flexible non-woven, rigid non-woven paper and flexible
woven materials, all of them were not segmented. Two air flow rates, 200 and 500
ml·min-1, were applied. Other parameters were: QH2 = 200 ml·min-1, RH = 90% for
both gases and Tcell = 75 °C. Multiple channels serpentine flow fields were used. The
GDL made of rigid non-woven paper showed the most uniform CDD. The rigid non-
woven paper and the flexible woven showed very similar and more uniform CDD for
the higher air flow rate case. These authors concluded that the impact of GDL on the
CDD profile of a SFC is less important than the effect of air flow rate.
___________________________________Chapter II - Segmented PEMFC - A review
71
a) Nafion® 112
b) Fumapen® F-950
Figure 2.15. Current density distribution profiles for two different MEAs. GDL: ElectroChem®
0.5 mg·cm-2 (10% wt. Pt/C). Current density distribution taken at Vcell =638 mV. Counter flowfeeding with H2 inlet at coordinate (1, 1) and outlet at (4, 4). Anode: H2, Q = 200 ml·min-1,P = 1.25 bar, dry. Cathode: Air, Q = 1500 ml·min-1, P = 1 bar, RH = 95%. Tcell = 30 °C
Regarding DMFC, Saarinen et al. [91] performed CDD measurements in order to
compare two membranes with similar conductivity and different permeation rates to
methanol namely, a poly(vinylidene fluoride)-graft-poly(styrene sulfonic acid) (PVDF-
g-PSSA) and a Nafion® 117 membrane. The conductivity was 4.5 and 5 S·m-1
respectively, while the methanol permeation rate was higher (not specified) for the
former. The DMFC was free-breathing type and the MEA was assembled with
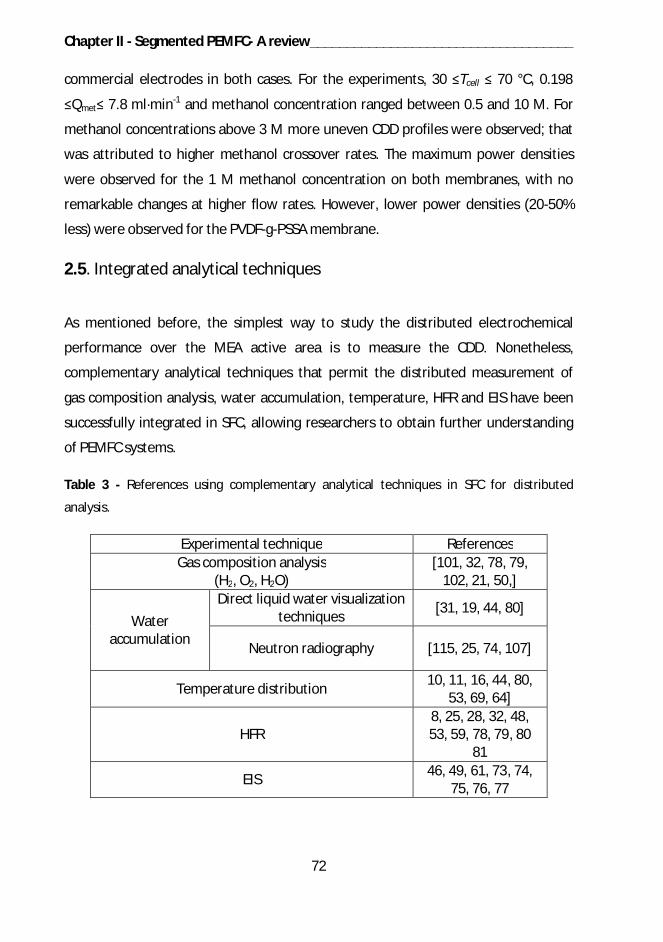
Chapter II - Segmented PEMFC- A review____________________________________
72
commercial electrodes in both cases. For the experiments, 30 Tcell 70 °C, 0.198
Qmet 7.8 ml·min-1 and methanol concentration ranged between 0.5 and 10 M. For
methanol concentrations above 3 M more uneven CDD profiles were observed; that
was attributed to higher methanol crossover rates. The maximum power densities
were observed for the 1 M methanol concentration on both membranes, with no
remarkable changes at higher flow rates. However, lower power densities (20-50%
less) were observed for the PVDF-g-PSSA membrane.
2.5. Integrated analytical techniques
As mentioned before, the simplest way to study the distributed electrochemical
performance over the MEA active area is to measure the CDD. Nonetheless,
complementary analytical techniques that permit the distributed measurement of
gas composition analysis, water accumulation, temperature, HFR and EIS have been
successfully integrated in SFC, allowing researchers to obtain further understanding
of PEMFC systems.
Table 3 - References using complementary analytical techniques in SFC for distributed
analysis.
Experimental technique ReferencesGas composition analysis
(H2, O2, H2O)[101, 32, 78, 79,
102, 21, 50,]
Wateraccumulation
Direct liquid water visualizationtechniques [31, 19, 44, 80]
Neutron radiography [115, 25, 74, 107]
Temperature distribution 10, 11, 16, 44, 80,53, 69, 64]
HFR8, 25, 28, 32, 48,53, 59, 78, 79, 80
81
EIS 46, 49, 61, 73, 74,75, 76, 77
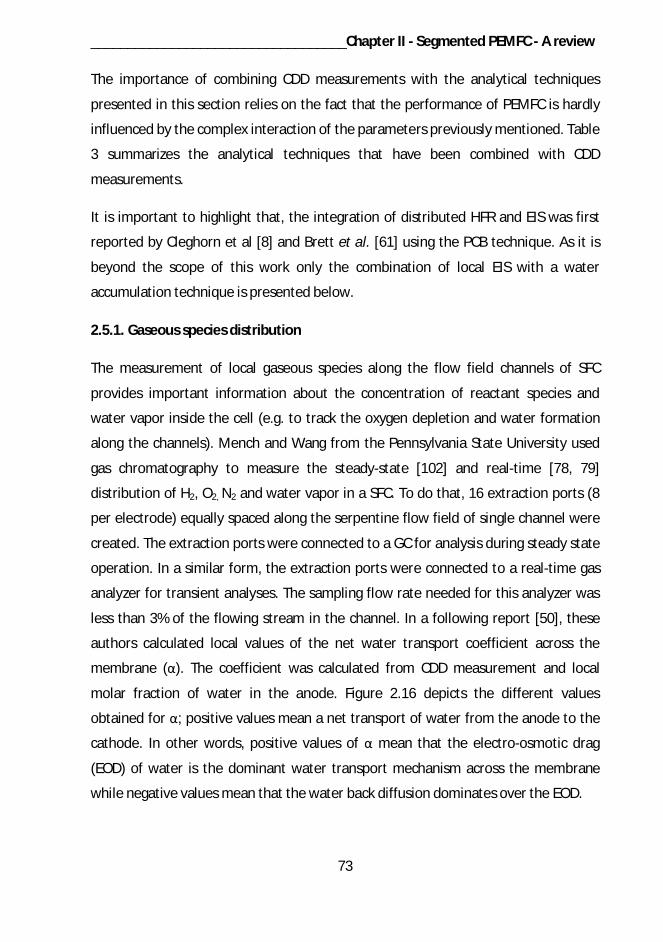
___________________________________Chapter II - Segmented PEMFC - A review
73
The importance of combining CDD measurements with the analytical techniques
presented in this section relies on the fact that the performance of PEMFC is hardly
influenced by the complex interaction of the parameters previously mentioned. Table
3 summarizes the analytical techniques that have been combined with CDD
measurements.
It is important to highlight that, the integration of distributed HFR and EIS was first
reported by Cleghorn et al [8] and Brett et al. [61] using the PCB technique. As it is
beyond the scope of this work only the combination of local EIS with a water
accumulation technique is presented below.
2.5.1. Gaseous species distribution
The measurement of local gaseous species along the flow field channels of SFC
provides important information about the concentration of reactant species and
water vapor inside the cell (e.g. to track the oxygen depletion and water formation
along the channels). Mench and Wang from the Pennsylvania State University used
gas chromatography to measure the steady-state [102] and real-time [78, 79]
distribution of H2, O2, N2 and water vapor in a SFC. To do that, 16 extraction ports (8
per electrode) equally spaced along the serpentine flow field of single channel were
created. The extraction ports were connected to a GC for analysis during steady state
operation. In a similar form, the extraction ports were connected to a real-time gas
analyzer for transient analyses. The sampling flow rate needed for this analyzer was
less than 3% of the flowing stream in the channel. In a following report [50], these
authors calculated local values of the net water transport coefficient across the
membrane ( ). The coefficient was calculated from CDD measurement and local
molar fraction of water in the anode. Figure 2.16 depicts the different values
obtained for ; positive values mean a net transport of water from the anode to the
cathode. In other words, positive values of mean that the electro-osmotic drag
(EOD) of water is the dominant water transport mechanism across the membrane
while negative values mean that the water back diffusion dominates over the EOD.
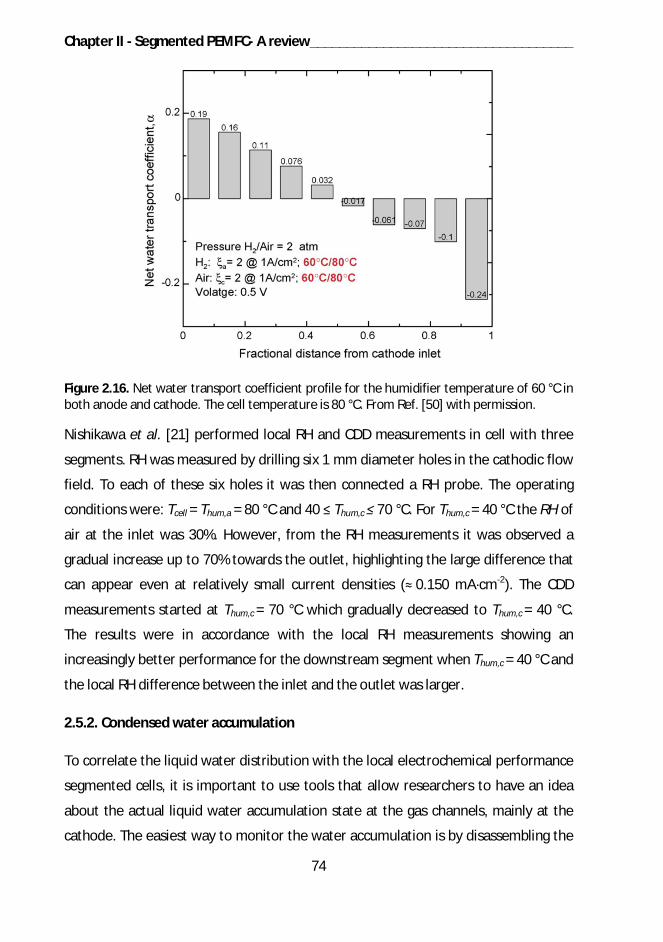
Chapter II - Segmented PEMFC- A review____________________________________
74
Figure 2.16. Net water transport coefficient profile for the humidifier temperature of 60 °C inboth anode and cathode. The cell temperature is 80 °C. From Ref. [50] with permission.
Nishikawa et al. [21] performed local RH and CDD measurements in cell with three
segments. RH was measured by drilling six 1 mm diameter holes in the cathodic flow
field. To each of these six holes it was then connected a RH probe. The operating
conditions were: Tcell = Thum,a = 80 °C and 40 Thum,c 70 °C. For Thum,c = 40 °C the RH of
air at the inlet was 30%. However, from the RH measurements it was observed a
gradual increase up to 70% towards the outlet, highlighting the large difference that
can appear even at relatively small current densities ( 0.150 mA·cm-2). The CDD
measurements started at Thum,c = 70 °C which gradually decreased to Thum,c = 40 °C.
The results were in accordance with the local RH measurements showing an
increasingly better performance for the downstream segment when Thum,c = 40 °C and
the local RH difference between the inlet and the outlet was larger.
2.5.2. Condensed water accumulation
To correlate the liquid water distribution with the local electrochemical performance
segmented cells, it is important to use tools that allow researchers to have an idea
about the actual liquid water accumulation state at the gas channels, mainly at the
cathode. The easiest way to monitor the water accumulation is by disassembling the
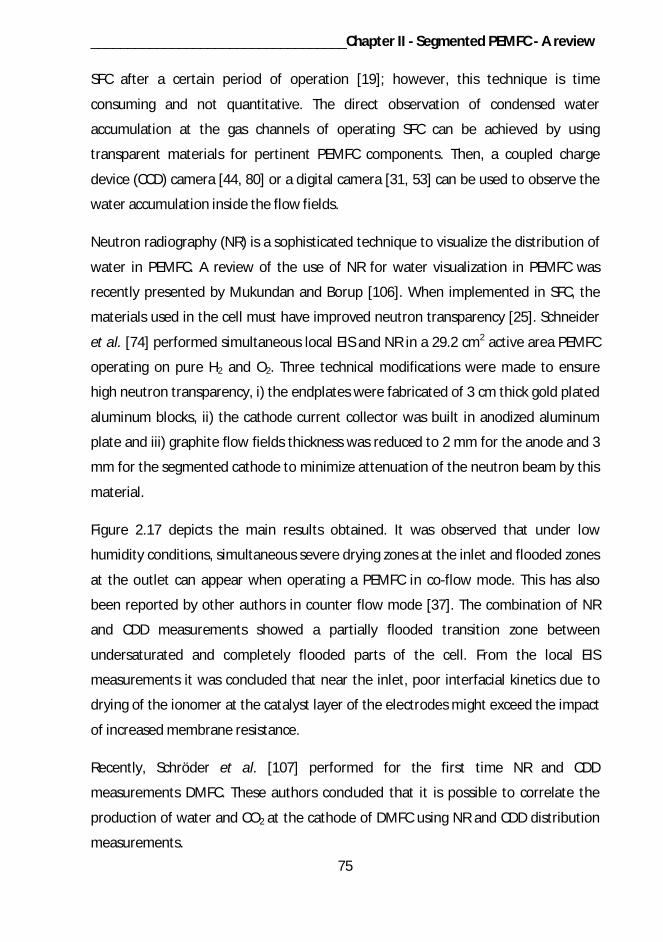
___________________________________Chapter II - Segmented PEMFC - A review
75
SFC after a certain period of operation [19]; however, this technique is time
consuming and not quantitative. The direct observation of condensed water
accumulation at the gas channels of operating SFC can be achieved by using
transparent materials for pertinent PEMFC components. Then, a coupled charge
device (CCD) camera [44, 80] or a digital camera [31, 53] can be used to observe the
water accumulation inside the flow fields.
Neutron radiography (NR) is a sophisticated technique to visualize the distribution of
water in PEMFC. A review of the use of NR for water visualization in PEMFC was
recently presented by Mukundan and Borup [106]. When implemented in SFC, the
materials used in the cell must have improved neutron transparency [25]. Schneider
et al. [74] performed simultaneous local EIS and NR in a 29.2 cm2 active area PEMFC
operating on pure H2 and O2. Three technical modifications were made to ensure
high neutron transparency, i) the endplates were fabricated of 3 cm thick gold plated
aluminum blocks, ii) the cathode current collector was built in anodized aluminum
plate and iii) graphite flow fields thickness was reduced to 2 mm for the anode and 3
mm for the segmented cathode to minimize attenuation of the neutron beam by this
material.
Figure 2.17 depicts the main results obtained. It was observed that under low
humidity conditions, simultaneous severe drying zones at the inlet and flooded zones
at the outlet can appear when operating a PEMFC in co-flow mode. This has also
been reported by other authors in counter flow mode [37]. The combination of NR
and CDD measurements showed a partially flooded transition zone between
undersaturated and completely flooded parts of the cell. From the local EIS
measurements it was concluded that near the inlet, poor interfacial kinetics due to
drying of the ionomer at the catalyst layer of the electrodes might exceed the impact
of increased membrane resistance.
Recently, Schröder et al. [107] performed for the first time NR and CDD
measurements DMFC. These authors concluded that it is possible to correlate the
production of water and CO2 at the cathode of DMFC using NR and CDD distribution
measurements.
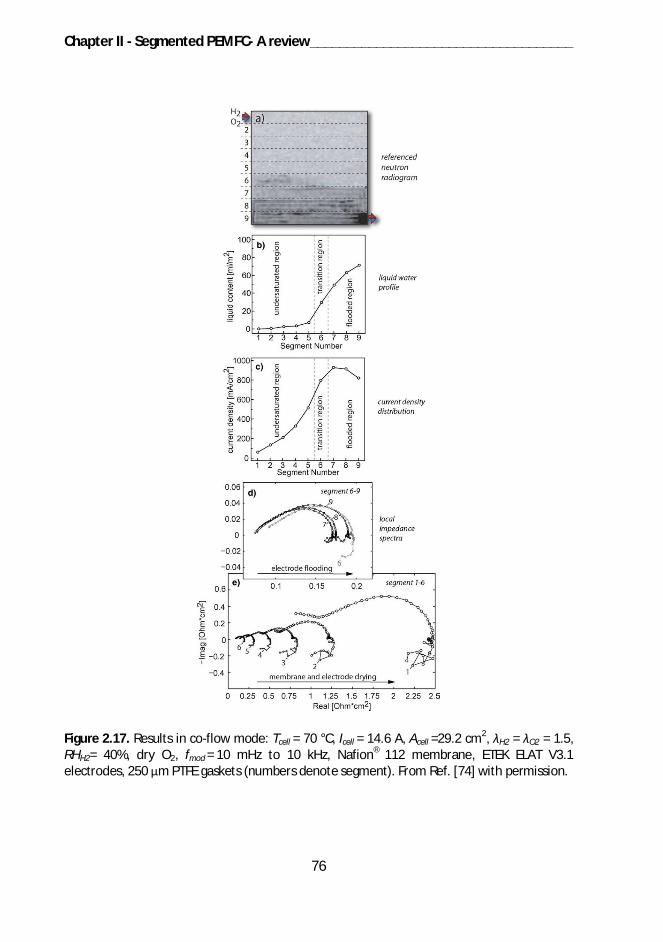
Chapter II - Segmented PEMFC- A review____________________________________
76
Figure 2.17. Results in co-flow mode: Tcell = 70 °C, Icell = 14.6 A, Acell =29.2 cm2, H2 = O2 = 1.5,RHH2= 40%, dry O2, fmod = 10 mHz to 10 kHz, Nafion® 112 membrane, ETEK ELAT V3.1electrodes, 250 m PTFE gaskets (numbers denote segment). From Ref. [74] with permission.
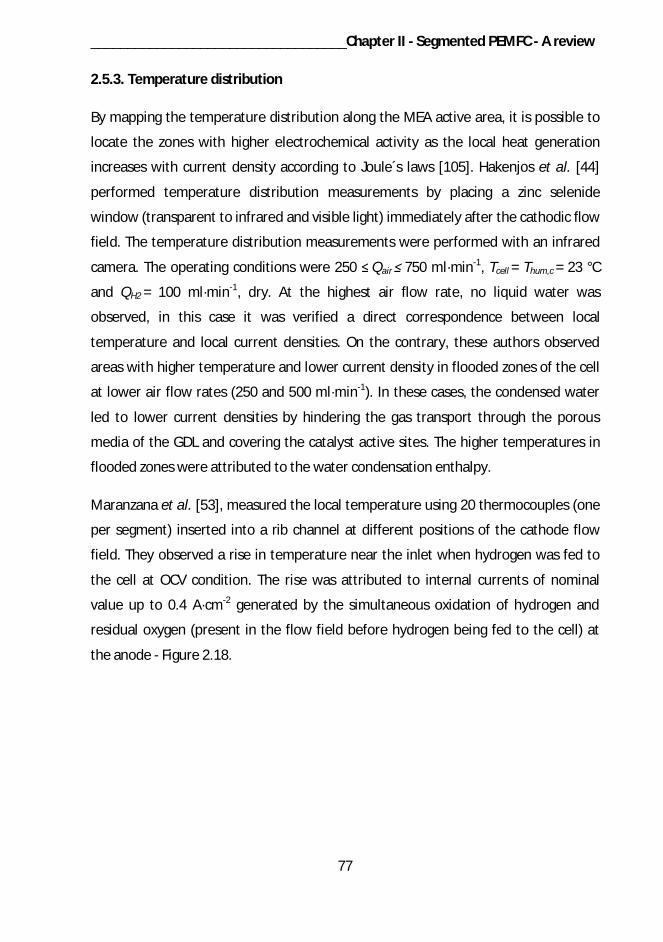
___________________________________Chapter II - Segmented PEMFC - A review
77
2.5.3. Temperature distribution
By mapping the temperature distribution along the MEA active area, it is possible to
locate the zones with higher electrochemical activity as the local heat generation
increases with current density according to Joule´s laws [105]. Hakenjos et al. [44]
performed temperature distribution measurements by placing a zinc selenide
window (transparent to infrared and visible light) immediately after the cathodic flow
field. The temperature distribution measurements were performed with an infrared
camera. The operating conditions were 250 Qair 750 ml·min-1, Tcell = Thum,c = 23 °C
and QH2 = 100 ml·min-1, dry. At the highest air flow rate, no liquid water was
observed, in this case it was verified a direct correspondence between local
temperature and local current densities. On the contrary, these authors observed
areas with higher temperature and lower current density in flooded zones of the cell
at lower air flow rates (250 and 500 ml·min-1). In these cases, the condensed water
led to lower current densities by hindering the gas transport through the porous
media of the GDL and covering the catalyst active sites. The higher temperatures in
flooded zones were attributed to the water condensation enthalpy.
Maranzana et al. [53], measured the local temperature using 20 thermocouples (one
per segment) inserted into a rib channel at different positions of the cathode flow
field. They observed a rise in temperature near the inlet when hydrogen was fed to
the cell at OCV condition. The rise was attributed to internal currents of nominal
value up to 0.4 A·cm-2 generated by the simultaneous oxidation of hydrogen and
residual oxygen (present in the flow field before hydrogen being fed to the cell) at
the anode - Figure 2.18.
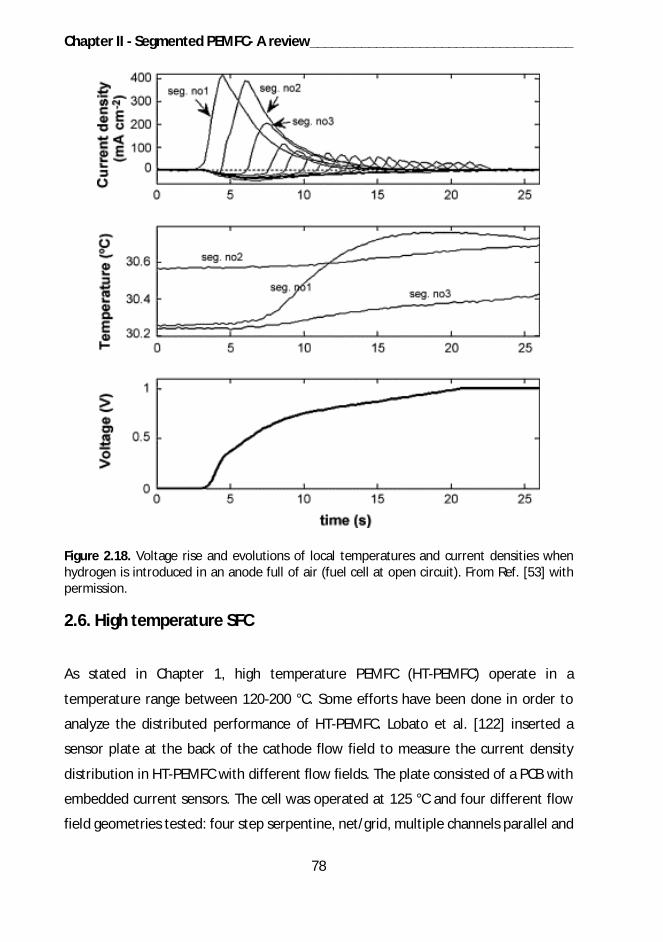
Chapter II - Segmented PEMFC- A review____________________________________
78
Figure 2.18. Voltage rise and evolutions of local temperatures and current densities whenhydrogen is introduced in an anode full of air (fuel cell at open circuit). From Ref. [53] withpermission.
2.6. High temperature SFC
As stated in Chapter 1, high temperature PEMFC (HT-PEMFC) operate in a
temperature range between 120-200 °C. Some efforts have been done in order to
analyze the distributed performance of HT-PEMFC. Lobato et al. [122] inserted a
sensor plate at the back of the cathode flow field to measure the current density
distribution in HT-PEMFC with different flow fields. The plate consisted of a PCB with
embedded current sensors. The cell was operated at 125 °C and four different flow
field geometries tested: four step serpentine, net/grid, multiple channels parallel and
___________________________________Chapter II - Segmented PEMFC - A review
79
interdigitated. Those authors suggested that that flow fields with net/grid geometries
could be used when working at high temperature without expecting lower
performance. Boaventura et al. [123] used a segmented of the resistors network
approach with a segmented anode in order to study the influence of CO (1.5% and
3%) on the current density distribution at 160 °C and 180 °C. The anode flow field has
net/grid geometry. It was found that CO causes a performance loss, which is
worsened for higher CO concentrations and current densities and for lower
temperatures. Those authors observed that introducing CO results in a
heterogeneous behavior across the MEA, which is aggravated by the increase of CO
concentration and global current density.
2.7. Conclusions
The performance of PEMFC is uneven over the MEA active area and depends on a
complex interaction of various design, assembling and operating parameters as well
as on the properties and microstructure of the materials used. To the date, SFC have
proven to be an excellent diagnostic tool that permits further understanding of the
local electrochemical performance in single cells and stacks.
SFC can be classified accordingly to common structural concepts in: printed circuit
board, resistors network and Hall effect sensors. The Hall effect sensors technique
can be considered as the most accurate for local electrochemical characterization,
due to the possibility of calibration of these current sensing devices, followed by the
resistors network and the PCB. The accuracy of the electrochemical measurements
can be improved significantly by segmenting the GDL, the BP and the CC. The PCB
technique is the most suitable for use in middle cells of PEMFC stacks as it offers the
possibility of incorporating the segmented flow fields of adjacent cells.
CDD measurements have been crucial to understand the effect of flow field
geometry, clamping pressure, reactants relative humidity and flow rate, operating
pressure, contaminant species, membrane thickness and GDL on the performance of
PEMFC. Despite its importance concerning fuel cells durability, there is a lack of
literature describing suitable strategies to homogenize the CDD in PEMFC systems.
Chapter II - Segmented PEMFC- A review____________________________________
80
Regarding DMFC, CDD measurements have been especially important to confirm the
simultaneous existence of electrolytic and galvanic operating regions showed by this
type of cell at low oxidant stoichiometric rates.
The integration of various analytical techniques that allow: i) H2, O2, N2 and H2O
distribution determination, ii) condensed water distribution evaluation, iii)
temperature distribution and iv) local high frequency resistance (HFR) and local
electrochemical impedance spectroscopy (EIS) analysis have been reported. These
techniques provide important information that complements the CDD
measurements.
PEMFC in situ diagnostic methods need to be improved and standardized as they
should play a key role in the massive commercialization of PEMFC systems. In this
way, SFC can be used to optimize PEMFC systems as they provide fast and reliable in
situ measurements that allow to evaluate how the interaction of different
parameters affect the local performance and degradation. Furthermore, SFC have
been used with HT-PEMFC components and operating conditions to study the effect
of flow field geometry and CO on the CDD of this type of cells.
Present applications of SFC include the diagnosis of PEMFC components
manufacturing defects of [120] and the study of PEMFC distributed startup at sub-
zero temperatures [121].
2.7. Acknowledgments
Luis C. Pérez is grateful to FCT for his PhD grant reference SFRH/BD/44684/2008.
Lúcia Brandão is also thankful to FCT for her post-doc grant (SFRH/BPD/41233/2007).
Financial support by FCT through the project PTDC/EQU-EQU/70574/2006 is also
acknowledged.
___________________________________Chapter II - Segmented PEMFC - A review
81
2.8. References
[1] L. Carrette, K.A. Friedrich, U. Stimming, Chemphyschem 1 (2000) 162-193.
[2] J.D. Holladay, J. Hu, D.L. King, Y. Wang, Catal. Today 139 (2009) 244-260.
[3] E. David, J. of Mater. Process. Technolog. 162-163 (2005) 169-177.
[4] P. Agnolucci, Int. J. of Hydrogen Energy 32 (2007) 3526-3544.
[5] J.-H. Wee, Renew. and Sustain. Energy Rev. 11 (2007) 1720-1738.
[6] S. G. Kandlikar, Z. Lu, J. of Fuel Cell Sci. and Technol. 6 (2009) 044001.
[7] Bruijn F., PEM Fuel Cells for Transport Applications: State of the Art and
Challenges, in: L.T. Handoko, R.T.S. Masbah (Eds.), AIP, 2009, pp. 3-12.
[8] S.J.C. Cleghorn, C.R. Derouin, M.S. Wilson, S. Gottesfeld, J. of Appl. Electrochem.
28 (1998) 663-672.
[9] N. Rajalakshmi, M. Raja, K.S. Dhathathreyan, J. of Power Sources 112 (2002) 331-
336.
[10] M. Hicks, K. Kropp, A. Schmoeckel, R. Atanasoski, ECS Trans. 1 (2006) 605-612.
[11] D.U. Sauer, T. Sanders, B. Fricke, T. Baumhöfer, K. Wippermann, A.A. Kulikovsky,
H. Schmitz, J. Mergel, J. of Power Sources 176 (2008) 477-483.
[12] G. Bender, M.S. Wilson, T.A. Zawodzinski, J. of Power Sources 123 (2003) 163-
171.
[13] X. Z. Yuan, H. J. Wang, J. C. Sun, J. J. Zhang, Int. J. of Hydrogen Energy, 32 (2007)
4365-4380.
[14] J.F. Wu, X.Z. Yuan, H.J. Wang, M. Blanco, J.J. Martin, J.J. Zhang, Int. J. of
Hydrogen Energy 33 (2008) 1747-1757.
[15] C.-Y. Wang, Chem. Rev. 104 (2004) 4727-4766.
Chapter II - Segmented PEMFC- A review____________________________________
82
[16] A.M. Abdullah, T. Okajima, A.M. Mohammad, F. Kitamura, T. Ohsaka, J. of Power
Sources 172 (2007) 209-214.
[17] S.A. Freunberger, M. Reum, A. Wokaun, F.N. Büchi, Electrochem. Commun. 8
(2006) 1435-1438.
[18] A.A. Kulikovsky, H. SchrnitZ, K. Wippermann, J. Mergel, B. Fricke, T. Sanders, D.U.
Sauer, Electrochem. Commun. 8 (2006) 754-760.
[19] S.S. Hsieh, Y.J. Huang, J. of Power Sources 183 (2008) 193-204.
[20] C. Wieser, A. Helmbold, E. Gulzow, J. of Appl. Electrochem. 30 (2000) 803-807.
[21] H. Nishikawa, R. Kurihara, S. Sukemori, T. Sugawara, H. Kobayasi, S. Abe, T. Aoki,
Y. Ogami, A. Matsunaga, J. of Power Sources 155 (2006) 213-218.
[22] H. Dohle, J. Mergel, P.C. Ghosh, Electrochimica Acta 52 (2007) 6060-6067.
[23] J. LaDou, Int. J. of Hyg. and Environ. Health 209 (2006) 211-219.
[24] M. Schulze, E. Gulzow, S. Schonbauer, T. Knori, R. Reissner, J. of Power Sources
173 (2007) 19-27.
[25] J.J. Gagliardo, J.P. Owejan, T.A. Trabold, T.W. Tighe, Nucl. Instrum. and Methods
in Phys. Res. Sect. A: Accel., Spectrom., Detect. and Assoc. Equip. 605 (2009) 115-118.
[26] D.J.L. Brett, S. Atkins, N.P. Brandon, V. Vesovic, N. Vasileiadis, A.R. Kucernak,
Electrochem. Commun. 3 (2001) 628-632.
[27] D.G. Strickland, S. Litster, J.G. Santiago, J. of Power Sources 174 (2007) 272-281.
[28] Y. Morimoto, T. Suzuki and H. Yamada, Electrochem. Soc. Proc. Volume 2002-31
248-256.
[29] M. Noponen, T. Mennola, M. Mikkola, T. Hottinen, P. Lund, J. of Power Sources
106 (2002) 304-312.
___________________________________Chapter II - Segmented PEMFC - A review
83
[30] J. Benziger, J.E. Chia, E. Kimball, I.G. Kevrekidis, J. of the Electrochem. Soc. 154
(2007) B835-B844.
[31] Y. Tabe, K. Kikuta, T. Chikahisa, M. Kozakai, J. of Power Sources 193 (2009) 416-
424.
[32] T. Araki, H. Koori, T. Taniuchi, K. Onda, J. of Power Sources 152 (2005) 60-66.
[33] Z. Liu, Z. Mao, B. Wu, L. Wang, V.M. Schmidt, J. of Power Sources 141 (2005)
205-210.
[34] P.C. Ghosh, T. Wuster, H. Dohle, N. Kimiaie, J. Mergel, D. Stolten, J. of Power
Sources 154 (2006) 184-191.
[35] F. Ay, A. Ata, H. Dohle, T. Sener, H. Gorgun, J. of Power Sources 167 (2007) 391-
397.
[36] M.M. Mench, C.Y. Wang, M. Ishikawa, J. of the Electrochem. Soc. 150 (2003)
A1052-A1059.
[37] S. Yoshioka, A. Yoshimura, H. Fukumoto, O. Hiroi, H. Yoshiyasu, J. of Power
Sources 144 (2005) 146-151.
[38] Bansal R., Fundamentals of engineering electromagnetics, Taylor & Francis
Group, Florida, 2006.
[39]
http://content.honeywell.com/sensing/prodinfo/solidstate/technical/chapter2.pdf
retrieved on February 2010.
[40] D. Liang, Q. Shen, M. Hou, Z. Shao, B. Yi, J. of Power Sources 194 (2009) 847-853.
[41] M. Santis, S.A. Freunberger, M. Papra, A. Wokaun, F.N. Büchi, J. of Power
Sources 161 (2006) 1076-1083.
[42] P.C. Rieke, N.E. Vanderborgh, J. of the Electrochem. Soc. 134 (1987) 1099-1104.
Chapter II - Segmented PEMFC- A review____________________________________
84
[43] J.J.T.T. Vermeijlen, L.J.J. Janssen, A.J. Geurts, G.C. Haastrecht, J. of Appl.
Electrochem. 25 (1995) 1122-1127.
[44] A. Hakenjos, H. Muenter, U. Wittstadt, C. Hebling, J. of Power Sources 131 (2004)
213-216.
[45] D. Natarajan, T. Van Nguyen, Aiche J. 51 (2005) 2587-2598.
[46] I.A. Schneider, H. Kuhn, A. Wokaun, G.G. Scherer, J. of the Electrochemical
Society 152 (2005) A2092-A2103.
[47] A.B. Geiger, R. Eckl, A. Wokaun, G.G. Scherer, J. of the Electrochem. Soc. 151
(2004) A394-A398.
[48] A. Hakenjos, K. Tüber, J.O. Schumacher, C. Hebling, Fuel Cells 4 (2004) 185-189.
[49] F.B. Weng, B.S. Jou, C.W. Li, A. Su, S.H. Chan, J. of Power Sources 181 (2008) 251-
258.
[50] G.Q. Lu, F.Q. Liu, C.Y. Wang, J. of Power Sources 164 (2007) 134-140.
[51] D. Natarajan, T. Van Nguyen, J. of Power Sources 135 (2004) 95-109.
[52] J.J. Hwnag, W.R. Chang, R.G. Peng, P.Y. Chen, A. Su, Int. J. of Hydrogen Energy 33
(2008) 5718-5727.
[53] G. Maranzana, O. Lottin, T. Colinart, S. Chupin, S. Didierjean, J. of Power Sources
180 (2008) 748-754.
[54] Y.G. Yoon, W.Y. Lee, T.H. Yang, G.G. Park, C.S. Kim, J. of Power Sources 118
(2003) 193-199.
[55] Martínez, L. C., Brandão, L., Sousa, J. M., Mendes, A., “PEMFC study using a
segmented fuel cell”, HYCELTEC 2009 – II Iberian Symposium on Hydrogen, Fuel Cells
and Advanced Batteries, Vila Real, Portugal, 13-17 Setembro de 2009, ref. P19-SA
[56] R. Eckl, R. Grinzinger, W. Lehnert, J. of Power Sources 154 (2006) 171-179.
___________________________________Chapter II - Segmented PEMFC - A review
85
[57] F.N. Büchi, A.B. Geiger, R.P. Neto, J. of Power Sources 145 (2005) 62-67.
[58] J. Stumper, S.A. Campbell, D.P. Wilkinson, M.C. Johnson, M. Davis,
Electrochimica Acta 43 (1998) 3773-3783.
[59] M. Noponen, J. Ihonen, A. Lundblad, G. Lindbergh, J. of Appl. Electrochem. 34
(2004) 255-262.
[60] Z. Siroma, N. Fujiwara, T. Loroi, S. Yamazaki, H. Senoh, K. Yasuda, K. Tanimoto, J.
of Power Sources 172 (2007) 155-162.
[61] D.J.L. Brett, S. Atkins, N.P. Brandon, V. Vesovic, N. Vasileiadis, A. Kucernak,
Electrochem. and Solid State Lett. 6 (2003) A63-A66.
[62] M. V. Santis, Investigations of Current Density Inhomogeneities in Polymer
Electrolyte Fuel Cells, PhD thesis, Swiss Federal Institute of Technology Zurich, 2006
[63] D. Candusso, J.P. Poirot-Crouvezier, B. Bador, E. Rullière, R. Soulier, J.Y. Voyant,
Eur. Phys. J. Appl. Phys. 25 (2004) 67-74.
[64] S. Sailler, S. Rosini, M.A. Chaib, J.Y. Voyant, Y. Bultel, F. Druart, P. Ozil, J. of Appl.
Electrochem. 37 (2007) 161-171.
[65] N.B. Felix, R. Mathias, Meas. Sci. and Technol. 19 (2008) 085702.
[66] S.A. Freunberger, M. Reum, J. Evertz, A. Wokaun, F.N. Buchi, J. of the
Electrochem. Soc. 153 (2006) A2158-A2165.
[67] L. Wang, H. Liu, J. of Power Sources 180 (2008) 365-372.
[68] H. Sun, G. Zhang, L.-J. Guo, H. Liu, J. of Power Sources 158 (2006) 326-332.
[69] M. Wilkinson, M. Blanco, E. Gu, J.J. Martin, D.P. Wilkinson, J.J. Zhang, H. Wang,
Electrochem. and Solid State Lett. 9 (2006) A507-A511.
[70] J.R. Claycomb, A. Brazdeikis, M. Le, R.A. Yarbrough, G. Gogoshin, J.H. Miller,
Appl. Superconductivity, IEEE Transactions on 13 (2003) 211-214.
Chapter II - Segmented PEMFC- A review____________________________________
86
[71] H. Yang, J. Chen, S. Wang, C. Chen, J. Jeng, J. Chen, C. Wu, S. Liao, H. Horng,
Tamkang J. of Sci. and Eng., 6 (2003) 9-18.
[72] K.H. Hauer, R. Potthast, T. Wuster, D. Stolten, J. of Power Sources 143 (2005) 67-
74.
[73] D.J.L. Brett, S. Atkins, N.P. Brandon, N. Vasileiadis, V. Vesovic, A.R. Kucernak, J. of
Power Sources 172 (2007) 2-13.
[74] I.A. Schneider, D. Kramer, A. Wokaun, G.G. Scherer, Electrochem. Commun. 7
(2005) 1393-1397.
[75] I.A. Schneider, S.A. Freunberger, D. Kramer, A. Wokaun, G.G. Scherer, J. of the
Electrochem. Soc. 154 (2007) B383-B388.
[76] I.A. Schneider, D. Kramer, A. Wokaun, G.G. Scherer, J. of the Electrochem. Soc.
154 (2007) B770-B782.
[77] S.A. Freunberger, I.A. Schneider, P.-C. Sui, A. Wokaun, N. Djilali, F.N. Buchi, J. of
the Electrochem. Soc. 155 (2008) B704-B714.
[78] Q. Dong, J. Kull, M.M. Mench, J. of Power Sources 139 (2005) 106-114.
[79] Q. Dong, M.M. Mench, S. Cleghorn, U. Beuscher, J. of the Electrochem. Soc. 152
(2005) A2114-A2122.
[80] W.H.J. Hogarth, J. Steiner, J.B. Benziger, A. Hakenjos, J. of Power Sources 164
(2007) 464-471.
[81] N. Holmstrom, J. Ihonen, A. Lundblad, G. Lindbergh, Fuel Cells 7 (2007) 306-313.
[82] M. Reum, S.A. Freunberger, A. Wokaun, F.N. Buchi, J. of the Electrochem. Soc.
156 (2009) B301-B310.
[83] J. Larmaine, A. Dicks, Fuel cell systems explained, 2nd ed., West Sussex (2003).
[84] H. Sun, G. Zhang, L.-J. Guo, S. Dehua, H. Liu, J. of Power Sources 168 (2007) 400-
407.
___________________________________Chapter II - Segmented PEMFC - A review
87
[85] H. Sun, G. Zhang, L. Guo, H. Liu, Int. J. of Hydrogen Energy 34 (2009) 5529-5536.
[86] P.C. Ghosh, T. Wuster, H. Dohle, N. Kimiaie, J. Mergel, D. Stolten, J. of Fuel Cell
Sci. and Technol. 3 (2006) 351-357.
[87] A. Taniguchi, T. Akita, K. Yasuda, Y. Miyazaki, J. of Power Sources 130 (2004) 42-
49.
[88] Z.X. Liu, L.Z. Yang, Z.Q. Mao, W.L. Zhuge, Y.J. Zhang, L.S. Wang, J. of Power
Sources 157 (2006) 166-176.
[89] Q. Ye, T.S. Zhao, H. Yang, J. Prabhuram, Electrochem. and Solid-State Lett. 8
(2005) A52-A54.
[90] Q. Ye, T.S. Zhao, J. of the Electrochem. Soc. 152 (2005) A2238-A2245.
[91] V. Saarinen, O. Himanen, T. Kallio, G. Sundholm, K. Kontturi, J. of Power Sources
163 (2007) 768-776.
[92] G. Bender, T. Zawodsinski, Electrochem. Soc. Proc. Volume 2002-31 212-218.
[93] D.J.L. Brett, S. Atkins, N.P. Brandon, V. Vesovic, N. Vasileiadis, A.R. Kucernak, J. of
Power Sources 133 (2004) 205-213.
[94] T. Tingelöf, L. Hedström, N. Holmström, P. Alvfors, G. Lindbergh, Int. J. of
Hydrogen Energy 33 (2008) 2064-2072.
[95] G. Zhang, B. Ma, D. Shang, L. Guo, H. Sun, H. Liu, ECS Trans. 11 (2007) 1545-
1552.
[96] E. Gülzow, T. Kaz, R. Reissner, H. Sander, L. Schilling, M. v.Bradke, J. of Power
Sources 105 (2002) 261-266.
[97] G.S. Zhang, L.J. Guo, B. Ma, H.T. Liu, J. of Power Sources 188 (2009) 213-219.
[98] T. Mennola, M. Noponen, T. Kallio, M. Mikkola, T. Hottinen, J. of Appl.
Electrochem. 34 (2004) 31-36.
Chapter II - Segmented PEMFC- A review____________________________________
88
[99] I. Nitta, T. Hottinen, O. Himanen, M. Mikkola, J. of Power Sources 171 (2007) 26-
36.
[100] M.M. Mench, C.Y. Wang, J. of the Electrochem. Soc. 150 (2003) A79-A85.
[101] M.M. Mench, Q.L. Dong, C.Y. Wang, J. of Power Sources 124 (2003) 90-98.
[102] X.G. Yang, N. Burke, C.Y. Wang, K. Tajiri, K. Shinohara, J. of the Electrochem.
Soc. 152 (2005) A759-A766.
[103] E. Stumper, M. Lohr, S. Hamada, J. of Power Sources 143 (2005) 150-157.
[104] B. Sompalli, B.A. Litteer, W. Gu, H.A. Gasteiger, J. of the Electrochem. Soc. 154
(2007) B1349-B1357.
[105] M.H. Wang, H. Guo, C.F. Ma, J. of Power Sources 157 (2006) 181-187.
[106] R. Mukundan, R.L. Borup, Fuel Cells 9 (2009) 499-505.
[107] A. Schröder, K. Wippermann, J. Mergel, W. Lehnert, D. Stolten, T. Sanders, T.
Baumhöfer, D.U. Sauer, I. Manke, N. Kardjilov, A. Hilger, J. Schloesser, J. Banhart, C.
Hartnig, Electrochem. Comm. 11 (2009) 1606-1609.
[108] D. Natarajan, T. Van Nguyen, Aiche J. 51 (2005) 2599-2608.
[109] P. Berg, K. Promislow, J. Stumper, B. Wetton, J. of Fuel Cell Sci. and Technol. 2
(2005) 111-120.
[110] M. Reum, A. Wokaun, F.N. Büchi, J. of the Electrochem. Soc. 156 (2009) B1225-
B1231.
[111] http://www.splusplus.com/ retrieved on February 2010
[112] J. St-Pierre, N. Jia, R. Rahmani, J. of the Electrochem. Soc. 155 (2008) B315-
B320.
[113] A.A. Kulikovsky, A. Kucemak, A.A. Kornyshev, Electrochimica Acta 50 (2005)
1323-1333.
___________________________________Chapter II - Segmented PEMFC - A review
89
[114] D.J.L. Brett, P. Aguiar, N.P. Brandon, A.R. Kucernak, Int. J. of Hydrogen Energy
32 (2007) 863-871.
[115] C. Hartnig, I. Manke, N. Kardjilov, A. Hilger, M. Grünerbel, J. Kaczerowski, J.
Banhart, W. Lehnert, J. of Power Sources 176 (2008) 452-459.
[116] M. Noponen, T. Hottinen, T. Mennola, M. Mikkola, P. Lund, J. of Appl.
Electrochem. 32 (2002) 1081-1089.
[117] T. Hottinen, M. Noponen, T. Mennola, O. Himanen, M. Mikkola, P. Lund, J. of
Appl. Electrochem. 33 (2003) 265-271.
[118] http://helmbold-messtechnik.de/ retrieved on February 2010
[119] M. Santis, S.A. Freunberger, A. Reiner, F.N. Büchi, Electrochimica Acta 51 (2006)
5383-5393.
[120] G. Bender, T.V. Reshetenko, H. Dinh, M. Ulsh, R. Rocheleau, ECS Meet. Abstr.
802 (2008) 944.
[121] T. Colinart, F.N. Buchi, ECS Meet. Abstr. 902 (2009) 1015.
[122] J. Lobato, P. Cañizares, M.A. Rodrigo, F.J. Pinar, D. Úbeda, J. Power Sources, 196(2011) 4209-4217.
[123] M. Boaventura, H. Sander, K.A. Friedrich, A. Mendes, Electrochimica Acta, 56(2011) 9467-9475.

90

91
Chapter III

92
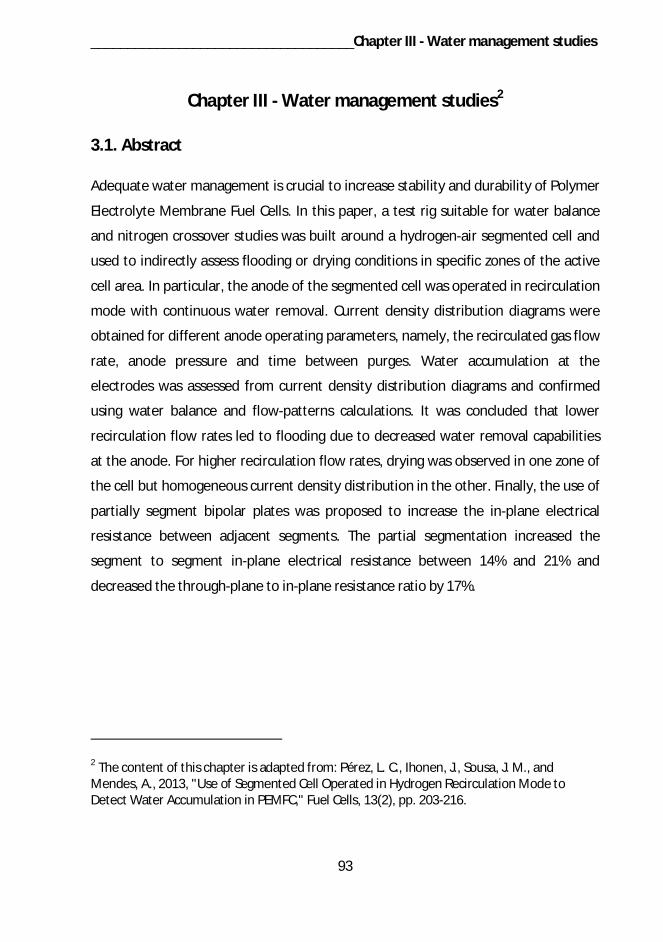
____________________________________Chapter III - Water management studies
93
Chapter III - Water management studies2
3.1. Abstract
Adequate water management is crucial to increase stability and durability of Polymer
Electrolyte Membrane Fuel Cells. In this paper, a test rig suitable for water balance
and nitrogen crossover studies was built around a hydrogen-air segmented cell and
used to indirectly assess flooding or drying conditions in specific zones of the active
cell area. In particular, the anode of the segmented cell was operated in recirculation
mode with continuous water removal. Current density distribution diagrams were
obtained for different anode operating parameters, namely, the recirculated gas flow
rate, anode pressure and time between purges. Water accumulation at the
electrodes was assessed from current density distribution diagrams and confirmed
using water balance and flow-patterns calculations. It was concluded that lower
recirculation flow rates led to flooding due to decreased water removal capabilities
at the anode. For higher recirculation flow rates, drying was observed in one zone of
the cell but homogeneous current density distribution in the other. Finally, the use of
partially segment bipolar plates was proposed to increase the in-plane electrical
resistance between adjacent segments. The partial segmentation increased the
segment to segment in-plane electrical resistance between 14% and 21% and
decreased the through-plane to in-plane resistance ratio by 17%.
2 The content of this chapter is adapted from: Pérez, L. C., Ihonen, J., Sousa, J. M., andMendes, A., 2013, "Use of Segmented Cell Operated in Hydrogen Recirculation Mode toDetect Water Accumulation in PEMFC," Fuel Cells, 13(2), pp. 203-216.
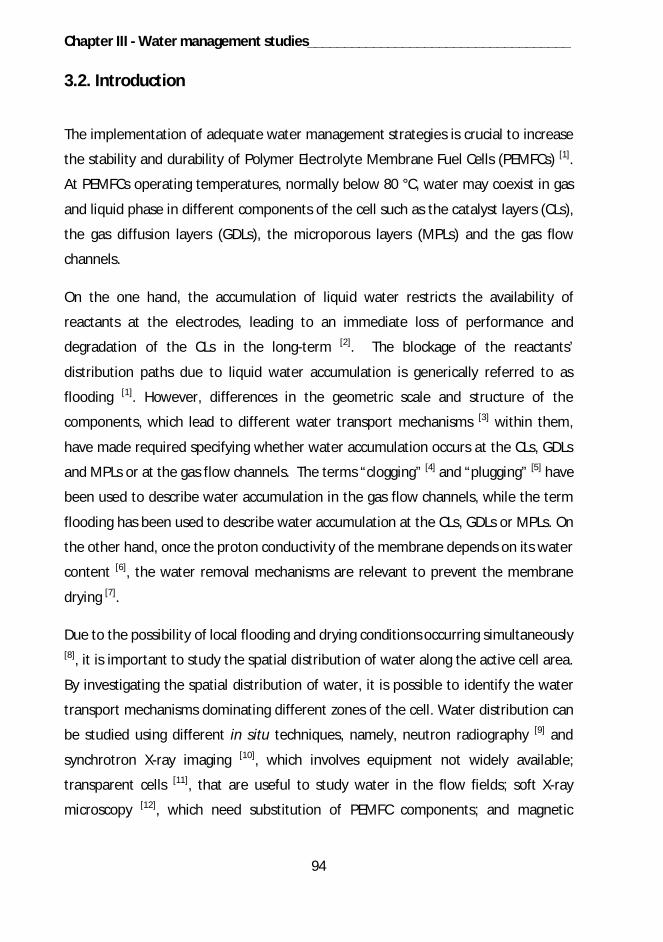
Chapter III - Water management studies____________________________________
94
3.2. Introduction
The implementation of adequate water management strategies is crucial to increase
the stability and durability of Polymer Electrolyte Membrane Fuel Cells (PEMFCs) [1].
At PEMFCs operating temperatures, normally below 80 °C, water may coexist in gas
and liquid phase in different components of the cell such as the catalyst layers (CLs),
the gas diffusion layers (GDLs), the microporous layers (MPLs) and the gas flow
channels.
On the one hand, the accumulation of liquid water restricts the availability of
reactants at the electrodes, leading to an immediate loss of performance and
degradation of the CLs in the long-term [2]. The blockage of the reactants’
distribution paths due to liquid water accumulation is generically referred to as
flooding [1]. However, differences in the geometric scale and structure of the
components, which lead to different water transport mechanisms [3] within them,
have made required specifying whether water accumulation occurs at the CLs, GDLs
and MPLs or at the gas flow channels. The terms “clogging” [4] and “plugging” [5] have
been used to describe water accumulation in the gas flow channels, while the term
flooding has been used to describe water accumulation at the CLs, GDLs or MPLs. On
the other hand, once the proton conductivity of the membrane depends on its water
content [6], the water removal mechanisms are relevant to prevent the membrane
drying [7].
Due to the possibility of local flooding and drying conditions occurring simultaneously[8], it is important to study the spatial distribution of water along the active cell area.
By investigating the spatial distribution of water, it is possible to identify the water
transport mechanisms dominating different zones of the cell. Water distribution can
be studied using different in situ techniques, namely, neutron radiography [9] and
synchrotron X-ray imaging [10], which involves equipment not widely available;
transparent cells [11], that are useful to study water in the flow fields; soft X-ray
microscopy [12], which need substitution of PEMFC components; and magnetic
____________________________________Chapter III - Water management studies
95
resonance [13], which may lead to problems controlling the PEMFC operating
conditions.
Two recent review articles reported the water transport mechanisms [3] and in situ
experimental diagnostics [14] concerning PEMFC research. Both articles suggested that
experimental capabilities have been overpassed by numerical approaches, paving the
way to refine existing experimental techniques. In recent years, segmented PEMFCs
(SFC) have been used to study the effect of different parameters on the distributed
performance of single cells and stacks. In Chapter 2 [15] a literature review article
addressing the SFC approaches, the effect of different parameters on the current
density distribution (CDD) and complementary analytical techniques coupled to
different SFC setups. That paper highlighted how local flooding or drying zones of the
membrane-electrode assembly’s (MEA) active area can be indirectly assessed from
the spatial distribution of the electrochemical activity depicted on CDD diagrams.
In the present study, a segmented PEMFC with a technically-relevant fuel delivery
configuration is used to indirectly assess flooding or drying zones of the MEA.
Particularly, the anode of the segmented PEMFC is operated in recirculation mode [16]
with continuous anode water removal, similar to actual residential [17] and
automotive [18] PEMFC systems. The segmented PEMFC is assembled with partially
segmented bipolar plates (BPs) to reduce current spreading [19] between segments.
Further, the segmented PEMFC is tested on an experimental test rig suitable for
water balance [20] and nitrogen crossover and accumulation [21] studies that is
properly described and documented.
3.3. Experimental
3.3.1. Test rig for studying water balance, nitrogen crossover and distributed
performance
Figure 3.1 shows a schematic of the test rig. The anode was fed with high purity
hydrogen (amount of impurities: H2O < 3 ppm, O2 < 2 ppm and hydrocarbons < 0.5
ppm). A pressure regulator (IR4000 series, Parker, USA) was used to keep the anode
Chapter III - Water management studies____________________________________
96
pressure at a previously defined value. The pressure regulator was always open to
keep the anode pressure constant and to allow “fresh” hydrogen to be fed from the
bottle. A pressure transducer (PMP4000 series, GE, USA) monitored the pressure at
the anode outlet.
Water was removed immediately after the anode exit to prevent condensation inside
the instruments placed downstream. The anode exhaust gas was passed through a
water trap consisting of a metal cylinder filled with a zeolite (Z10-02ND, Zeochem®,
Switzerland) that was permanently immersed in a water-ice mixture; the zeolite was
characterized by Ferreira et al. [22]. The ice was covered with raw salt, and the
temperature was monitored using a portable digital thermometer equipped with a
type K thermocouple; the temperature of the water-ice mixture was close to -1 °C. A
solenoid valve (SV) (256 Series, ASCO®, USA) was used to purge the anode loop. A
metering valve (M series, Swagelok, USA) was placed after the SV to keep constant
the amount of gas purged [5].
To measure the hydrogen concentration inside the anode loop and to be able to
perform nitrogen crossover studies, a hydrogen process sensor (HPM-100, Applied
Sensor, Sweden) was placed downstream from the water trap. The flow rate of the
recirculated gas was monitored continuously using a mass flow meter (EL-FLOW®,
Bronkhorst, The Netherlands), which was placed after the hydrogen sensor. The dew
point and temperature of the recirculated gas were measured downstream from the
mass flow meter using a suitable probe (HMP110, Vaisala, Finland).
The anode gas was recirculated using a double diaphragm pump (Model N 86, KNF,
Germany) and controlled by regulating its input voltage (0 V to 5 V). A gas filter (FW
series, Swagelok, USA) was placed at the outlet of the diaphragm pump to minimize
the flow rate oscillations.
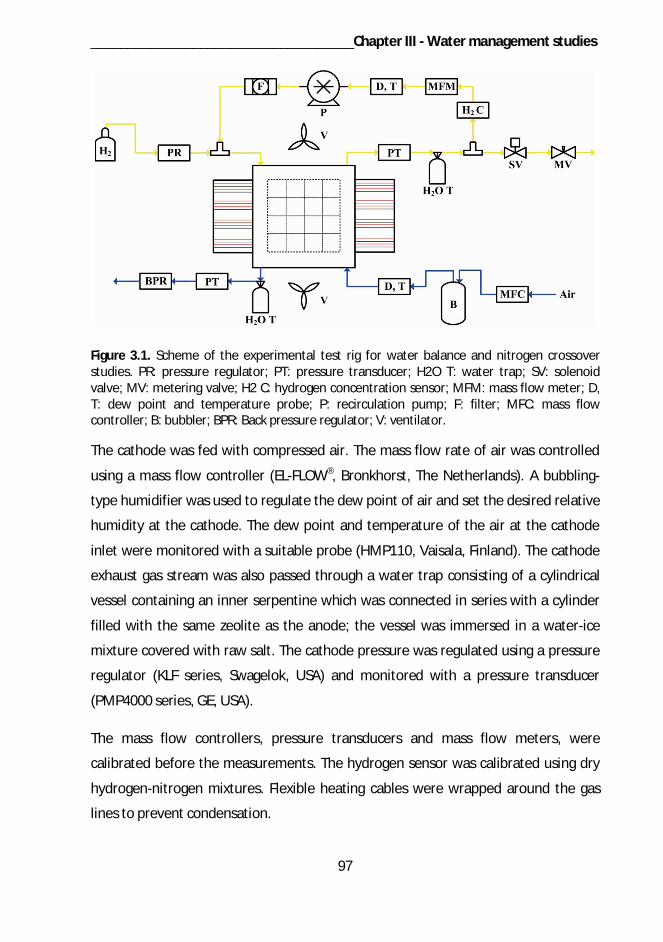
____________________________________Chapter III - Water management studies
97
Figure 3.1. Scheme of the experimental test rig for water balance and nitrogen crossoverstudies. PR: pressure regulator; PT: pressure transducer; H2O T: water trap; SV: solenoidvalve; MV: metering valve; H2 C: hydrogen concentration sensor; MFM: mass flow meter; D,T: dew point and temperature probe; P: recirculation pump; F: filter; MFC: mass flowcontroller; B: bubbler; BPR: Back pressure regulator; V: ventilator.
The cathode was fed with compressed air. The mass flow rate of air was controlled
using a mass flow controller (EL-FLOW®, Bronkhorst, The Netherlands). A bubbling-
type humidifier was used to regulate the dew point of air and set the desired relative
humidity at the cathode. The dew point and temperature of the air at the cathode
inlet were monitored with a suitable probe (HMP110, Vaisala, Finland). The cathode
exhaust gas stream was also passed through a water trap consisting of a cylindrical
vessel containing an inner serpentine which was connected in series with a cylinder
filled with the same zeolite as the anode; the vessel was immersed in a water-ice
mixture covered with raw salt. The cathode pressure was regulated using a pressure
regulator (KLF series, Swagelok, USA) and monitored with a pressure transducer
(PMP4000 series, GE, USA).
The mass flow controllers, pressure transducers and mass flow meters, were
calibrated before the measurements. The hydrogen sensor was calibrated using dry
hydrogen-nitrogen mixtures. Flexible heating cables were wrapped around the gas
lines to prevent condensation.
Chapter III - Water management studies____________________________________
98
An in-house written program implemented in Labview® was used to control the
reactants’ mass flow rates, the recirculation pump, the periodicity and duration of
purges and the temperature of the gas lines. Moreover, the program was also used
to monitor the anode and cathode pressures, the hydrogen concentration in the
anode loop and the dew point and temperature of gases in the anode loop and
cathode inlet.
3.3.2 Segmented PEMFC with partially segmented bipolar plates
The segmented cell (S++, Germany) had an active area of 25 cm2 and was designed
according to the Printed Circuit Board (PCB) concept introduced by Cleghorn et al. [23].
Nonetheless, the one reported here incorporates partially segmented anode and
cathode BPs instead of a totally segmented anode bipolar plate with one PCB and a
non-segmented cathode bipolar plate. The BPs (Graphite store, USA) were made
from two isomolded and isotropic graphite blocks with 10.16 mm length x 10.16 mm
width x 3.175 mm thickness and with a thermal conductivity of 83 W·m-1·K-1
(provided by manufacturer). Four-channel serpentine flow fields were machined on
one side of each BP using computer numerical control (Tecnogial Lda, Portugal). The
final dimensions of the BPs were 64 mm long x 64 mm wide x 2 mm thick while the
channel dimensions were ca. 370 mm long x 1 mm wide x 1 mm thick. Partial
segmentation of the BPs was achieved using computer numerical control (Tecnogial
Lda, Portugal) to machine 16 square grooves on the flat surface of each BP. The
grooves were not totally machined at the flow fields inlets and outlets to keep the
cell gas tight. The grooves were 1 mm wide and 0.25 mm thick.
To assembly the SFC, two PCBs were used: one contacting the outer part of the
anode and the other contacting the outer part of the cathode bipolar plate. Each
printed circuit board was divided into 16 equal segments, which gave an approximate
area of 1.56 cm2 per segment. Figure 3.2.a shows the inlet and outlet of the
cathode’s bipolar plate as well as the area covered by each segment. Figure 3.2.b
shows the back part of the anode’s bipolar plate, the hydrogen inlet, hydrogen outlet
and the partial segmentation. The air inlet is located at segment (4, 4) - (X, Y) and the
outlet at segment (1, 1). In turn, the hydrogen inlet is located at segment (1, 4) and
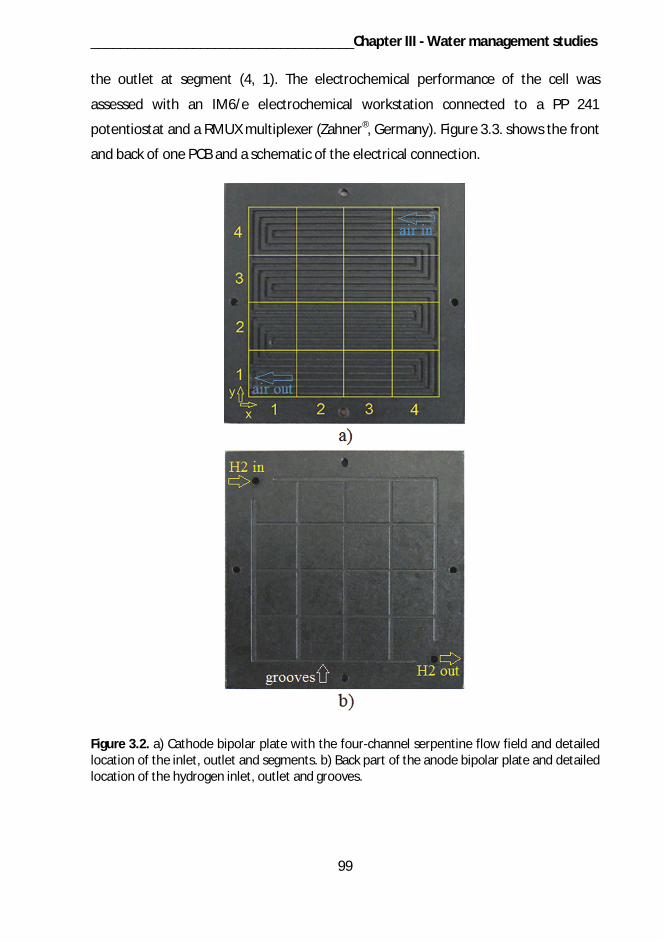
____________________________________Chapter III - Water management studies
99
the outlet at segment (4, 1). The electrochemical performance of the cell was
assessed with an IM6/e electrochemical workstation connected to a PP 241
potentiostat and a RMUX multiplexer (Zahner®, Germany). Figure 3.3. shows the front
and back of one PCB and a schematic of the electrical connection.
Figure 3.2. a) Cathode bipolar plate with the four-channel serpentine flow field and detailedlocation of the inlet, outlet and segments. b) Back part of the anode bipolar plate and detailedlocation of the hydrogen inlet, outlet and grooves.
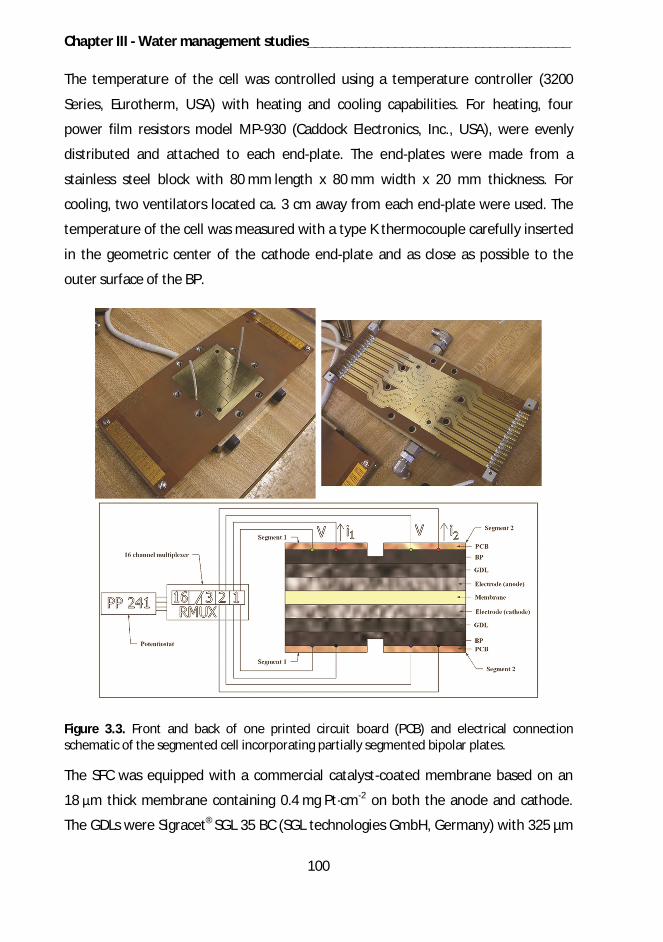
Chapter III - Water management studies____________________________________
100
The temperature of the cell was controlled using a temperature controller (3200
Series, Eurotherm, USA) with heating and cooling capabilities. For heating, four
power film resistors model MP-930 (Caddock Electronics, Inc., USA), were evenly
distributed and attached to each end-plate. The end-plates were made from a
stainless steel block with 80 mm length x 80 mm width x 20 mm thickness. For
cooling, two ventilators located ca. 3 cm away from each end-plate were used. The
temperature of the cell was measured with a type K thermocouple carefully inserted
in the geometric center of the cathode end-plate and as close as possible to the
outer surface of the BP.
Figure 3.3. Front and back of one printed circuit board (PCB) and electrical connectionschematic of the segmented cell incorporating partially segmented bipolar plates.
The SFC was equipped with a commercial catalyst-coated membrane based on an
18 m thick membrane containing 0.4 mg Pt·cm-2 on both the anode and cathode.
The GDLs were Sigracet® SGL 35 BC (SGL technologies GmbH, Germany) with 325 µm
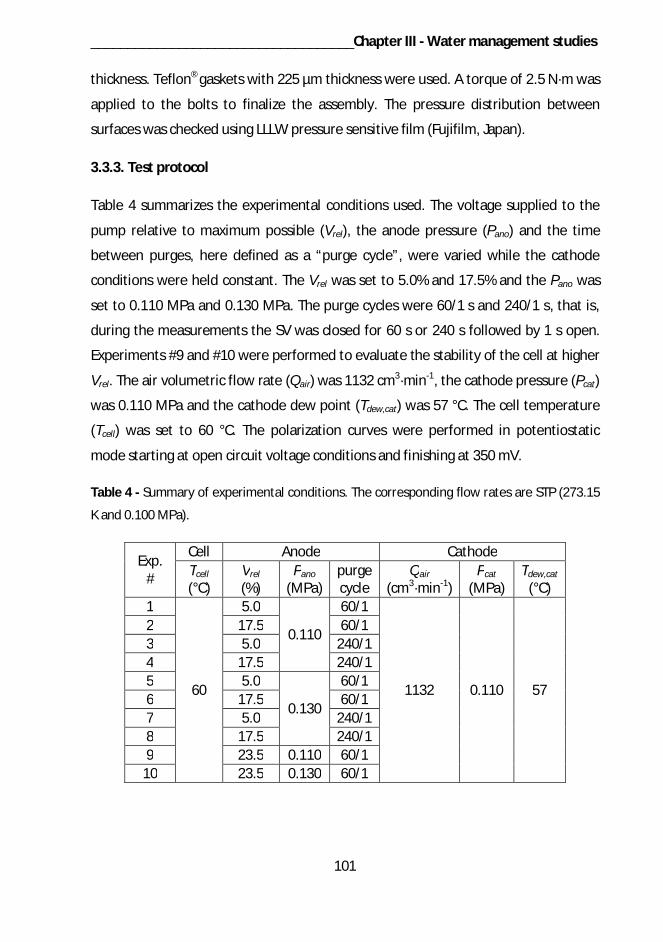
____________________________________Chapter III - Water management studies
101
thickness. Teflon® gaskets with 225 µm thickness were used. A torque of 2.5 N·m was
applied to the bolts to finalize the assembly. The pressure distribution between
surfaces was checked using LLLW pressure sensitive film (Fujifilm, Japan).
3.3.3. Test protocol
Table 4 summarizes the experimental conditions used. The voltage supplied to the
pump relative to maximum possible (Vrel), the anode pressure (Pano) and the time
between purges, here defined as a “purge cycle”, were varied while the cathode
conditions were held constant. The Vrel was set to 5.0% and 17.5% and the Pano was
set to 0.110 MPa and 0.130 MPa. The purge cycles were 60/1 s and 240/1 s, that is,
during the measurements the SV was closed for 60 s or 240 s followed by 1 s open.
Experiments #9 and #10 were performed to evaluate the stability of the cell at higher
Vrel. The air volumetric flow rate (Qair) was 1132 cm3·min-1, the cathode pressure (Pcat)
was 0.110 MPa and the cathode dew point (Tdew,cat) was 57 °C. The cell temperature
(Tcell) was set to 60 °C. The polarization curves were performed in potentiostatic
mode starting at open circuit voltage conditions and finishing at 350 mV.
Table 4 - Summary of experimental conditions. The corresponding flow rates are STP (273.15
K and 0.100 MPa).
Exp.#
Cell Anode CathodeTcell
(°C)Vrel
(%)Pano
(MPa)purgecycle
Qair
(cm3·min-1)Pcat
(MPa)Tdew,cat
(°C)1
60
5.0
0.110
60/1
1132 0.110 57
2 17.5 60/13 5.0 240/14 17.5 240/15 5.0
0.130
60/16 17.5 60/17 5.0 240/18 17.5 240/19 23.5 0.110 60/1
10 23.5 0.130 60/1
Chapter III - Water management studies____________________________________
102
Regarding the CDD experiments, the fuel cell was operated in potentiostatic mode at
600 mV with the experimental conditions of interest until the hydrogen
concentration in the anode loop and the anode dew point stabilized. Then the cell
was operated for 30 minutes with the experimental conditions of interest to
guarantee steady state conditions for the CDD measurements. After this, the current
of each segment was measured sequentially three times, with each sequential set of
measurements taking approximately 2 minutes. The current of each segment was
averaged and used to create the CDD diagrams.
3.4. Results and discussion
3.4.1. Increase of in-plane resistance using partially segmented bipolar plates
In SFC research, it may be necessary to physically modify (to segment) components of
the assembly such as the GDLs or BPs when using any of the three main invasive
approaches proposed so far [15], namely, Printed Circuit Board, Resistors Network or
Hall Effect Sensors. The objective of the segmentation is to create the necessary
through-plane paths (perpendicular to the MEA) to collect the current from each
segment of the cell. However, the anisotropic properties of materials and contact
resistance differences at the components interfaces may originate in-plane paths
(parallel to the MEA), by which the current would flow and “spread” from one
segment to the next. The efforts to estimate the uncertainties associated with in-
plane or lateral current spreading in SFC have been summarized by Eckl. et al. [19],
who estimated a maximum lateral current spreading between 5% to 11.5% for a cell
with non-segmented GDLs or BPs but incorporating one PCB at the anode and 2% to
8% for a cell with non-segmented GDLs but segmented anode BP and current
collector respectively.
As seen, in order to increase the accuracy and reliability of local electrochemical
measurements, it is important to minimize the lateral current spreading at the
components level. This can be done by electrically isolating the segments starting at
the CLs and finishing at the BPs level. Nonetheless, this complicates the design,
____________________________________Chapter III - Water management studies
103
construction and assembly of SFC. For example, one way to achieve total
segmentation (i.e., full electrical isolation) of the CL is to incorporate the catalyst in a
membrane area corresponding to one segment, then repeating this process for all
the segments leaving a constant space between them. If the catalyst is incorporated
in the GDL, it is necessary to cut the segments and use a gasket as frame to hot-press
them simultaneously on the membrane [24].
Regarding total segmentation of the BPs, two techniques are commonly used. The
first is used with graphite bipolar plates and involves five steps [25]: i) partial milling of
the segments, ii) filling the gaps with an epoxy resin, iii) once the resin is cured, the
opposite face of the plate is milled so the segments are electrically isolated, iv)
polishing and v) machining of the flow field. The second technique is based on
attaching conductive prism-shaped blocks to a non-conductive rigid frame [26]; after
this, the flow field is machined. The main disadvantages of total segmentation of the
GDLs and BPs are: i) changed electrochemical, fluid dynamics and thermal properties
of the components, meaning less compatibility with actual components used in
PEMFC stacks, ii) the possibility of membrane failure due to misalignment of
corresponding anode and cathode GDL segments [27] or due to inhomogeneous
mechanical support of the GDL to the MEA [28] and iii) gas leaks at the BPs if the resin
or other materials are not correctly selected.
Due to the stated disadvantages, it is important to explore alternative techniques to
decrease the lateral current spreading at the components level while at the same
time avoiding their total segmentation. One technique was developed by Hakenjos et
al. [29] who introduced the use of partially segmented GDL as alternative to total
segmentation of the GDL. As a result, the ohmic resistance increased 0.5 between
adjacent segments. In the same way, it would be interesting to analyze the effect of
incorporating partially segmented BPs in an SFC; however, this has not been
proposed, to the authors’ knowledge. Thus, the technique for partial segmentation of
the BPs is introduced here as an alternative to total segmentation of these
components.
Chapter III - Water management studies____________________________________
104
For the partially segmented BPs used here, the increase on the lateral resistance
between adjacent segments, Rlatn (%), was calculated according to Eq. (1):
100100n
latn
On
wAR wA
(1)
where is the resistivity of the graphite, 1.39·10-5 ·m (provided by the
manufacturer), w is the width of the groove (m), An is the cross-sectioned area of the
BP under the groove after segmentation (m2) and AOn is the cross-sectioned area of
the BP under the groove before segmentation (m2). It should be highlighted that w is
constant, which is not the case for An, once this area is affected by the relative
position of the groove in the flow field, as seen on Figure 3.2. After analyzing the flow
field geometry under the grooves for all the segments, four different values for An,
namely, A1, A2, A3 and A4, were identified. With the partial segmentation, Rlat1
(corresponding to A1), increased 14%, Rlat2 increased 15%, Rlat3 increased 16 %
and Rlat4 increased 21%. As seen, the increase in Rlatn was modest, implying that
the partial segmentation of the BPs may not be really effective for the groove depth
of 0.25 mm selected here. Further, the number of ribs and channels under the
grooves affect the relative cross sectioned area of the current path to different
extents, leading to a non-homogeneous increase in Rlatn between horizontally and
vertically adjacent segments.
To make the partial segmentation of the BPs more effective, Rlatn should be
increased. Using Eq. 1 and a groove depth of 0.60 mm, it was estimated that Rlatn
may increase between 44% and 70%, providing a representative increase in the
lateral resistance and not significantly compromising the mechanical strength of the
plate. Ultimately, the partial segmentation’s effectiveness depends on the gas flow
channel geometry, groove geometry, bipolar plate thickness and mechanical
strength.
____________________________________Chapter III - Water management studies
105
To further analyze the effect of incorporating the partially segmented BPs, the ratio
of the through-plane to the in-plane resistance, Rtp/Rip, was estimated for each
segment using different groove depths according to Eq. (2):
,
/
tp
tptp ip
ip m
wA
R R wA
(2)
where Rtp is the through-plane resistance ( ), Rip is the in-plane resistance ( ), wtp is
the thickness of the bipolar plate (m), Atp is the area of each segment (m2) and Aip,m is
the cross sectioned area of the bipolar plate under the groove area (m2) for each
groove depth analyzed (m = 0.25 mm, 0.40 mm, 0.50 mm, 0.60 mm and 0.75 mm).
For these calculations, wtp was set to 1.5 mm once the thickness of the BPs is not
even due to the gas flow channels. The results of the calculations are shown on
Figure 3.4. It is observed that when the bipolar plate is not partially segmented (i.e.
groove depth zero) the value of Rtp/Rip is already low, 0.18. The last is attributed to
the larger trough-plane area (segment area) when compared to the in-plane cross
sectioned area of the bipolar plate. When the groove depth is 0.25 mm, as in our
partially segmented bipolar plates, Rtp/Rip = 0.15. This means that the partial
segmentation led to a 17% decrease on Rtp/Rip, which is also quite low, but can be
further decreased using deeper grooves as observed on Figure 3.4.
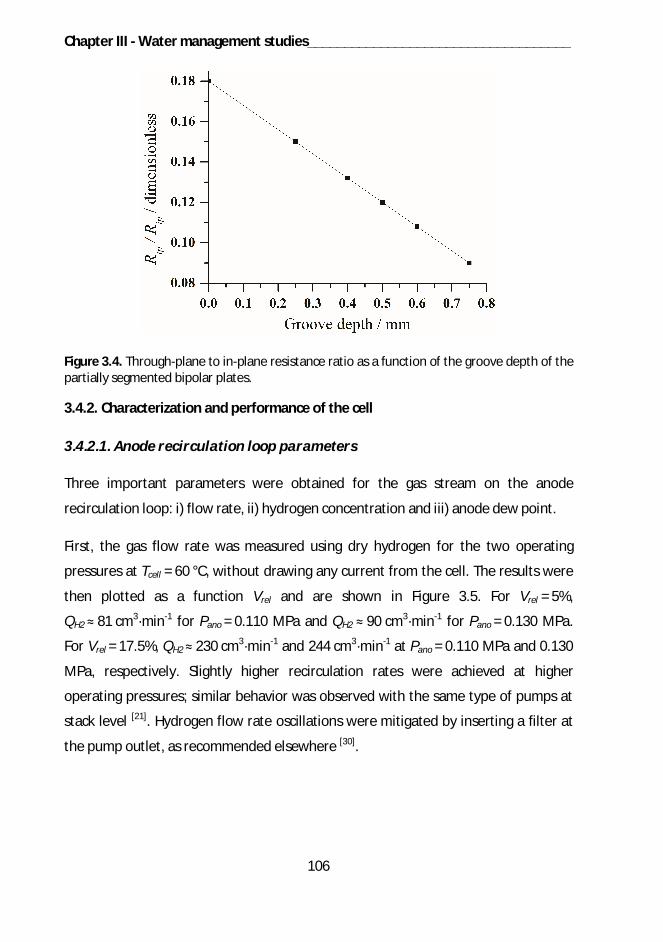
Chapter III - Water management studies____________________________________
106
Figure 3.4. Through-plane to in-plane resistance ratio as a function of the groove depth of thepartially segmented bipolar plates.
3.4.2. Characterization and performance of the cell
3.4.2.1. Anode recirculation loop parameters
Three important parameters were obtained for the gas stream on the anode
recirculation loop: i) flow rate, ii) hydrogen concentration and iii) anode dew point.
First, the gas flow rate was measured using dry hydrogen for the two operating
pressures at Tcell = 60 °C, without drawing any current from the cell. The results were
then plotted as a function Vrel and are shown in Figure 3.5. For Vrel = 5%,
QH2 81 cm3·min-1 for Pano = 0.110 MPa and QH2 90 cm3·min-1 for Pano = 0.130 MPa.
For Vrel = 17.5%, QH2 230 cm3·min-1 and 244 cm3·min-1 at Pano = 0.110 MPa and 0.130
MPa, respectively. Slightly higher recirculation rates were achieved at higher
operating pressures; similar behavior was observed with the same type of pumps at
stack level [21]. Hydrogen flow rate oscillations were mitigated by inserting a filter at
the pump outlet, as recommended elsewhere [30].
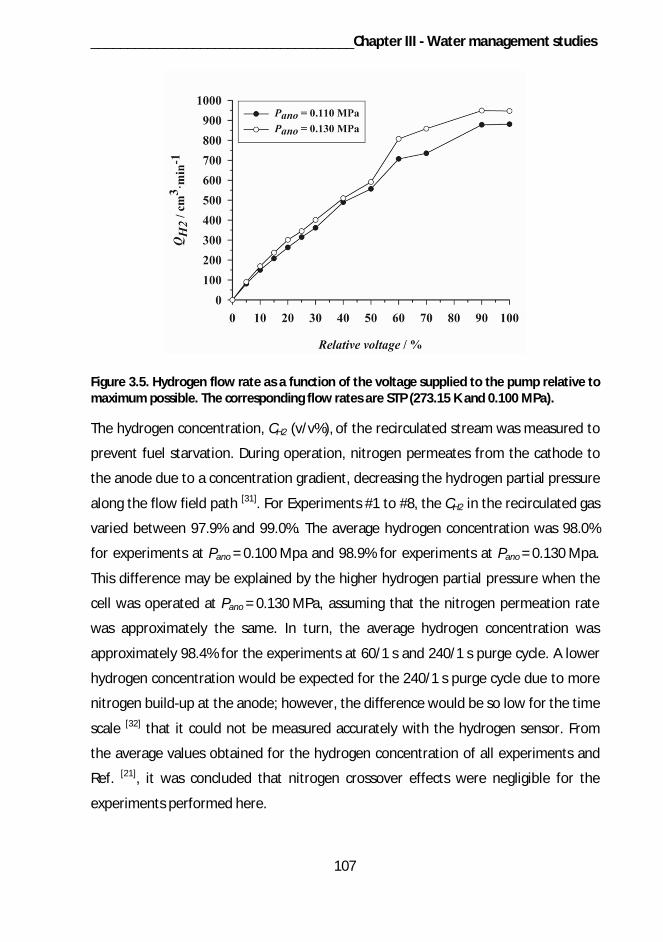
____________________________________Chapter III - Water management studies
107
Figure 3.5. Hydrogen flow rate as a function of the voltage supplied to the pump relative tomaximum possible. The corresponding flow rates are STP (273.15 K and 0.100 MPa).
The hydrogen concentration, CH2 (v/v%), of the recirculated stream was measured to
prevent fuel starvation. During operation, nitrogen permeates from the cathode to
the anode due to a concentration gradient, decreasing the hydrogen partial pressure
along the flow field path [31]. For Experiments #1 to #8, the CH2 in the recirculated gas
varied between 97.9% and 99.0%. The average hydrogen concentration was 98.0%
for experiments at Pano = 0.100 Mpa and 98.9% for experiments at Pano = 0.130 Mpa.
This difference may be explained by the higher hydrogen partial pressure when the
cell was operated at Pano = 0.130 MPa, assuming that the nitrogen permeation rate
was approximately the same. In turn, the average hydrogen concentration was
approximately 98.4% for the experiments at 60/1 s and 240/1 s purge cycle. A lower
hydrogen concentration would be expected for the 240/1 s purge cycle due to more
nitrogen build-up at the anode; however, the difference would be so low for the time
scale [32] that it could not be measured accurately with the hydrogen sensor. From
the average values obtained for the hydrogen concentration of all experiments and
Ref. [21], it was concluded that nitrogen crossover effects were negligible for the
experiments performed here.
Chapter III - Water management studies____________________________________
108
Also, the dew point of the recirculated gas was constantly measured to evaluate the
effectiveness of the anode water trap. During start-up of Experiments #1 to #8,
Tdew,ano varied between 10 °C and 0 °C; however, for the polarization curves and CDD
experiments, Tdew,ano stabilized around -10 °C at the anode inlet, corresponding to a
water vapor pressure of approximately 300 Pa. The higher relative humidity during
start-up should be related to the water that condensed at the anode flow field after
shutdown.
3.4.2.2. Polarization curves
Figure 3.6 shows the polarization curves for Experiments #1 to #10. In general, the
performance of the cell was low due to the use of dry hydrogen and a non-optimized
anode humidification approach. The equipment available for anode humidification
was a bubbling-type humidifier. This device would not provide constant
humidification to the anode gas stream because the hydrogen flow rate peaks during
the 1 s purge step. The anode humidification problem could be overpassed using a
membrane-type humidifier [33].
The polarization curves concerning Experiments #1 to #8 show almost the same
shape between the open circuit voltage and 600 mV. This may indicate that the
activation losses and ohmic losses are similar. Interestingly, between 600 mV and
550 mV a slightly steeper decrease in performance is observed for the experiments
with Vrel = 5%, indicating that this parameter may affect the transition between the
ohmic and mass transport regime of the cell. Below 550 mV, the polarization curves
show the non-linear decrease in performance associated with the mass transport
regime, where performance losses are dominated by the increased mass transfer
resistance to the electrodes.
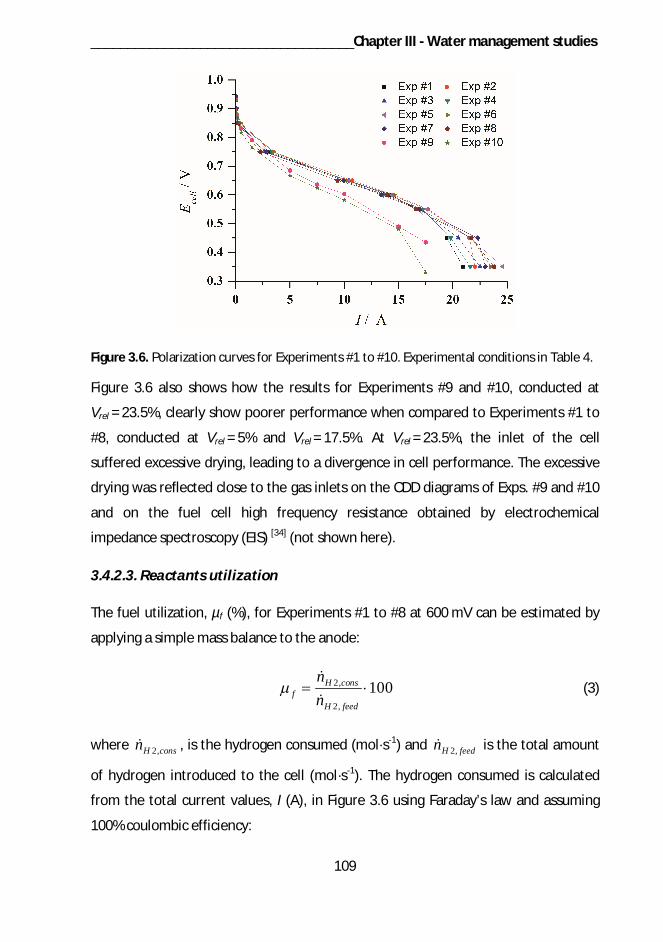
____________________________________Chapter III - Water management studies
109
Figure 3.6. Polarization curves for Experiments #1 to #10. Experimental conditions in Table 4.
Figure 3.6 also shows how the results for Experiments #9 and #10, conducted at
Vrel = 23.5%, clearly show poorer performance when compared to Experiments #1 to
#8, conducted at Vrel = 5% and Vrel = 17.5%. At Vrel = 23.5%, the inlet of the cell
suffered excessive drying, leading to a divergence in cell performance. The excessive
drying was reflected close to the gas inlets on the CDD diagrams of Exps. #9 and #10
and on the fuel cell high frequency resistance obtained by electrochemical
impedance spectroscopy (EIS) [34] (not shown here).
3.4.2.3. Reactants utilization
The fuel utilization, µf (%), for Experiments #1 to #8 at 600 mV can be estimated by
applying a simple mass balance to the anode:
2,
2,
100H consf
H feed
nn
(3)
where 2,H consn , is the hydrogen consumed (mol·s-1) and 2,H feedn is the total amount
of hydrogen introduced to the cell (mol·s-1). The hydrogen consumed is calculated
from the total current values, I (A), in Figure 3.6 using Faraday’s law and assuming
100% coulombic efficiency:
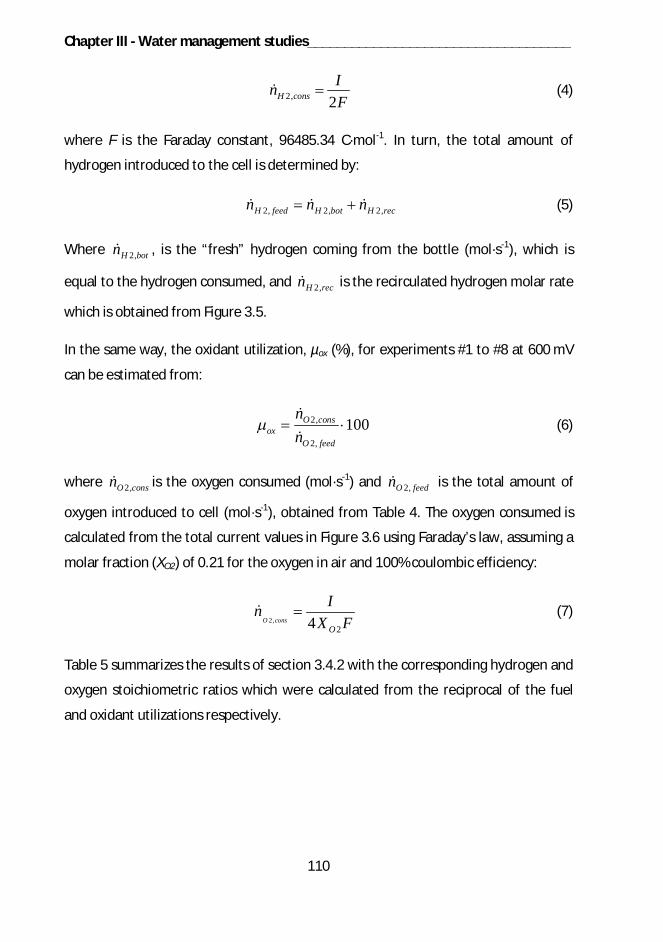
Chapter III - Water management studies____________________________________
110
2, 2H consInF
(4)
where F is the Faraday constant, 96485.34 C·mol-1. In turn, the total amount of
hydrogen introduced to the cell is determined by:
2, 2, 2,H feed H bot H recn n n (5)
Where 2,H botn , is the “fresh” hydrogen coming from the bottle (mol·s-1), which is
equal to the hydrogen consumed, and 2,H recn is the recirculated hydrogen molar rate
which is obtained from Figure 3.5.
In the same way, the oxidant utilization, µox (%), for experiments #1 to #8 at 600 mV
can be estimated from:
2,
2,
100O consox
O feed
nn
(6)
where 2,O consn is the oxygen consumed (mol·s-1) and 2,O feedn is the total amount of
oxygen introduced to cell (mol·s-1), obtained from Table 4. The oxygen consumed is
calculated from the total current values in Figure 3.6 using Faraday’s law, assuming a
molar fraction (XO2) of 0.21 for the oxygen in air and 100% coulombic efficiency:
2,24O cons
O
InX F
(7)
Table 5 summarizes the results of section 3.4.2 with the corresponding hydrogen and
oxygen stoichiometric ratios which were calculated from the reciprocal of the fuel
and oxidant utilizations respectively.
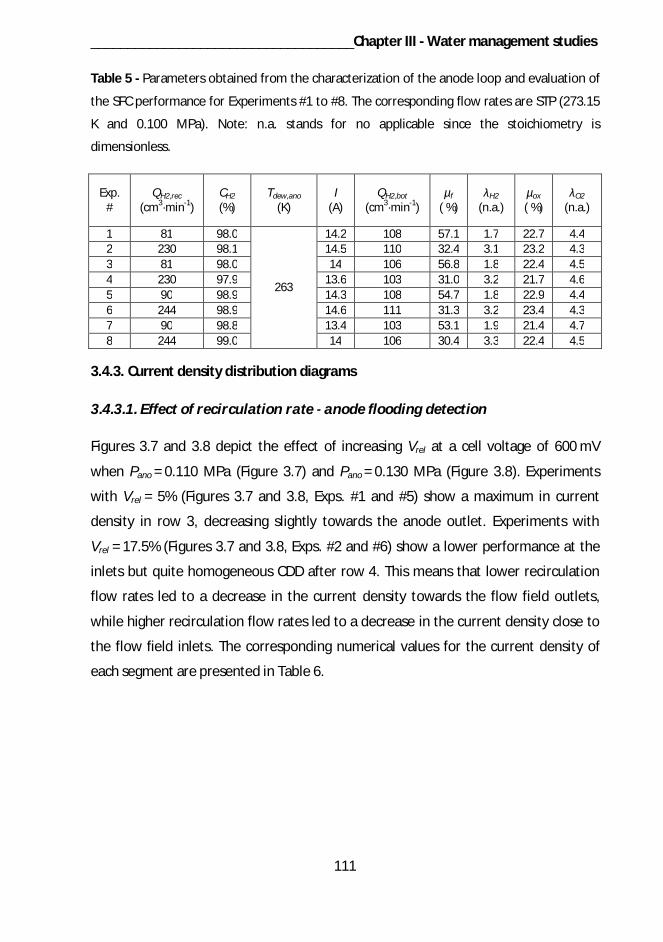
____________________________________Chapter III - Water management studies
111
Table 5 - Parameters obtained from the characterization of the anode loop and evaluation of
the SFC performance for Experiments #1 to #8. The corresponding flow rates are STP (273.15
K and 0.100 MPa). Note: n.a. stands for no applicable since the stoichiometry is
dimensionless.
Exp.#
QH2,rec
(cm3·min-1)CH2
(%)Tdew,ano
(K)I
(A)QH2,bot
(cm3·min-1)µf
( %)H2
(n.a.)µox
( %)O2
(n.a.)
1 81 98.0
263
14.2 108 57.1 1.7 22.7 4.42 230 98.1 14.5 110 32.4 3.1 23.2 4.33 81 98.0 14 106 56.8 1.8 22.4 4.54 230 97.9 13.6 103 31.0 3.2 21.7 4.65 90 98.9 14.3 108 54.7 1.8 22.9 4.46 244 98.9 14.6 111 31.3 3.2 23.4 4.37 90 98.8 13.4 103 53.1 1.9 21.4 4.78 244 99.0 14 106 30.4 3.3 22.4 4.5
3.4.3. Current density distribution diagrams
3.4.3.1. Effect of recirculation rate anode flooding detection
Figures 3.7 and 3.8 depict the effect of increasing Vrel at a cell voltage of 600 mV
when Pano = 0.110 MPa (Figure 3.7) and Pano = 0.130 MPa (Figure 3.8). Experiments
with Vrel = 5% (Figures 3.7 and 3.8, Exps. #1 and #5) show a maximum in current
density in row 3, decreasing slightly towards the anode outlet. Experiments with
Vrel = 17.5% (Figures 3.7 and 3.8, Exps. #2 and #6) show a lower performance at the
inlets but quite homogeneous CDD after row 4. This means that lower recirculation
flow rates led to a decrease in the current density towards the flow field outlets,
while higher recirculation flow rates led to a decrease in the current density close to
the flow field inlets. The corresponding numerical values for the current density of
each segment are presented in Table 6.
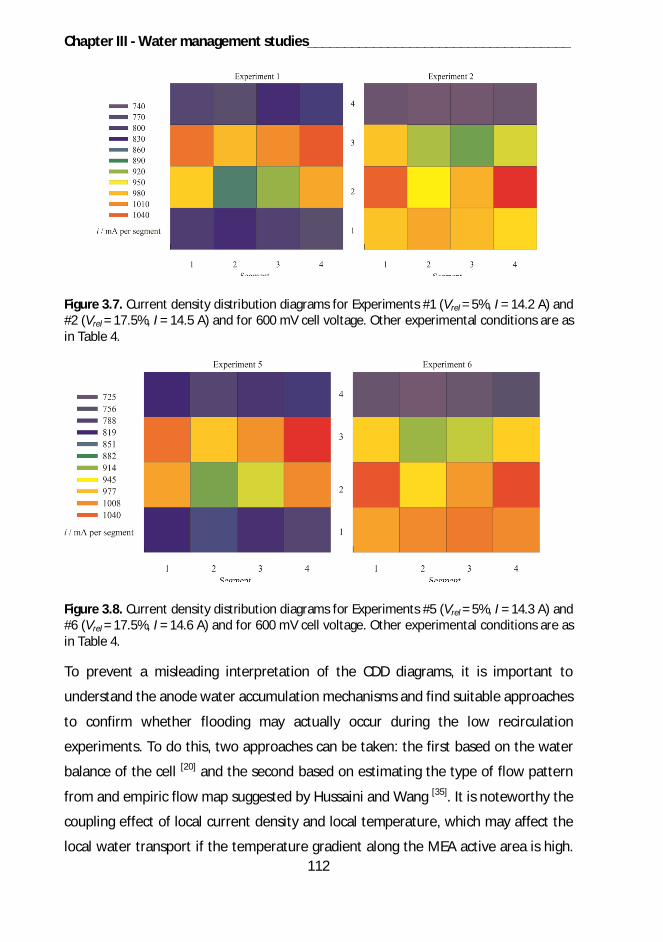
Chapter III - Water management studies____________________________________
112
Figure 3.7. Current density distribution diagrams for Experiments #1 (Vrel = 5%, I = 14.2 A) and#2 (Vrel = 17.5%, I = 14.5 A) and for 600 mV cell voltage. Other experimental conditions are asin Table 4.
Figure 3.8. Current density distribution diagrams for Experiments #5 (Vrel = 5%, I = 14.3 A) and#6 (Vrel = 17.5%, I = 14.6 A) and for 600 mV cell voltage. Other experimental conditions are asin Table 4.
To prevent a misleading interpretation of the CDD diagrams, it is important to
understand the anode water accumulation mechanisms and find suitable approaches
to confirm whether flooding may actually occur during the low recirculation
experiments. To do this, two approaches can be taken: the first based on the water
balance of the cell [20] and the second based on estimating the type of flow pattern
from and empiric flow map suggested by Hussaini and Wang [35]. It is noteworthy the
coupling effect of local current density and local temperature, which may affect the
local water transport if the temperature gradient along the MEA active area is high.
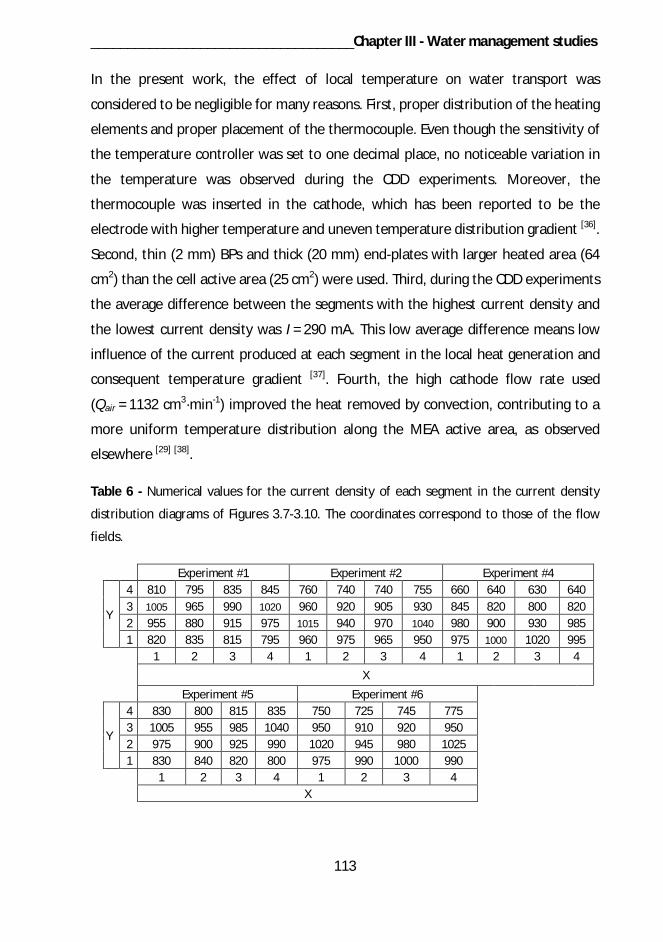
____________________________________Chapter III - Water management studies
113
In the present work, the effect of local temperature on water transport was
considered to be negligible for many reasons. First, proper distribution of the heating
elements and proper placement of the thermocouple. Even though the sensitivity of
the temperature controller was set to one decimal place, no noticeable variation in
the temperature was observed during the CDD experiments. Moreover, the
thermocouple was inserted in the cathode, which has been reported to be the
electrode with higher temperature and uneven temperature distribution gradient [36].
Second, thin (2 mm) BPs and thick (20 mm) end-plates with larger heated area (64
cm2) than the cell active area (25 cm2) were used. Third, during the CDD experiments
the average difference between the segments with the highest current density and
the lowest current density was I = 290 mA. This low average difference means low
influence of the current produced at each segment in the local heat generation and
consequent temperature gradient [37]. Fourth, the high cathode flow rate used
(Qair = 1132 cm3·min-1) improved the heat removed by convection, contributing to a
more uniform temperature distribution along the MEA active area, as observed
elsewhere [29] [38].
Table 6 - Numerical values for the current density of each segment in the current density
distribution diagrams of Figures 3.7-3.10. The coordinates correspond to those of the flow
fields.
Experiment #1 Experiment #2 Experiment #4
Y
4 810 795 835 845 760 740 740 755 660 640 630 6403 1005 965 990 1020 960 920 905 930 845 820 800 8202 955 880 915 975 1015 940 970 1040 980 900 930 9851 820 835 815 795 960 975 965 950 975 1000 1020 995
1 2 3 4 1 2 3 4 1 2 3 4X
Experiment #5 Experiment #6
Y
4 830 800 815 835 750 725 745 7753 1005 955 985 1040 950 910 920 9502 975 900 925 990 1020 945 980 10251 830 840 820 800 975 990 1000 990
1 2 3 4 1 2 3 4X
Chapter III - Water management studies____________________________________
114
The mechanisms for anode water accumulation have been described by Owejan et al.[39] and Lee and Bae [40]. In our case, because dry hydrogen is being fed to the cell, the
amount of water collected at the anode water trap (not shown here) clearly indicates
that water diffusing from the cathode to the anode is enough to saturate the anode
exhaust for the low recirculation experiments. Thus, in order to have water
condensation at the anode, first the cathode condition must enable the cathode
water vapor pressure to exceed the saturation vapor pressure, reaching the
saturation state at the cathode. Then, the amount of water diffusing from cathode to
anode must be high enough to saturate the anode exhaust.
The water balance approach can be achieved by analyzing the water mass flow rates
inside the cell. Due to the water concentration gradient arising from the use of dry
hydrogen, the water fed to the cathode and the water produced at the cathode, it is
expected that the dominant water transport mechanism across the membrane is
diffusion from the cathode to the anode [3]. To assess the net water mass flow rate
between the electrodes it is necessary to know the net water drag coefficient [41], ,
which is related to the net transport of water from the anode to the cathode and
accounts for the electro osmotic drag and diffusion of water from the cathode to the
anode. The value of depends on many factors. In our case, experimental values for
have been reported between -0.21 [42], -0.18 [43] and -0.15 [44] for cells operating in
similar conditions, i.e. dry hydrogen and humidified air, and assembled with similar
components. It is well known that the net water drag coefficient may be uneven
along the MEA active area [45] and may be influenced by the local temperature.
Nevertheless, a value of = -0.18 (this is, the average value of Refs. [42] [43] [44]) was
used here to facilitate the water balance analysis. The negative sign of indicates a
net transport of water from the cathode to the anode. It is important to highlight
that the water vapor pressure at the anode inlet is negligible, as stated in section
3.4.2.
The water mass flow rate fed by humidification of air at the cathode inlet, 2 ,H Oin catm
(kg·s-1), the maximum water mass flow rate removed by air in the form of saturated
vapor at the cathode outlet, 2 ,H Oout catm (kg·s-1), the water mass flow rate produced by
____________________________________Chapter III - Water management studies
115
the electrochemical reaction assuming 100% coulombic efficiency, 2 ,H O elem (kg·s-1),
the net water mass flow rate between the anode and cathode, 2 ,H O ano catm (kg·s-1),
and the maximum water mass flow rate that can be removed by the hydrogen in the
form of saturated vapor at the anode outlet, 2 ,H Oout anom (kg·s-1), were calculated
through Eqs. (7) - (11), adapted from [42]:
( )2 , 2
( ) 2
14
sat Tcell catH Oin cat H O
cat sat Tcell cat ox O
P RH Im MP P RH X F
(8)
( )2 , 2
( ) 2
1 14
sat Tcell catH Oout cat H O
cat sat Tcell cat ox O
P RH Im MP P RH X F
(9)
2 , 22H O ele H OIm MF
(10)
2 , 2H O ano cat H OIm MF
(11)
( )2 , 2
( )
1 12
sat TcellH Oout ano H O
ano sat Tcell f
P Im MP P F
(12)
where Psat,(Tcell) (Pa) is the saturation pressure of water vapor at the cell´s operating
temperature and pressure, RHcat (%) is the relative humidity of the cathode feed at
the inlet (%), Pcat (Pa) is the cathode pressure and M is the molecular weight of water,
0.018 kg·mol-1. The saturation pressure of water for the air-water vapor and
hydrogen-water vapor mixtures was calculated using the formula proposed by
Wagner and Pruss [49].
Table 7 summarizes the results of the water balance calculations. It can be seen that
2 ,H O ano catm is smaller than 2 ,H Oout anom in all low recirculation experiments (Vrel = 5%:
Exps. #1, #3, #5 and #7). In these cases, the negative values for
2 , 2 ,H O ano cat H Oout anom m imply that water diffusing from the cathode tends to
Chapter III - Water management studies____________________________________
116
accumulate in the cell. The CDD diagrams indicate that close to the inlets there is a
net water transport from the cathode to the anode as long as the anode has a lower
relative humidity. Going down in the flow field channels, the water concentration
gradient between the electrodes decreases and water starts condensing on both
electrodes as the saturation pressure of water vapor is reached. The latter happens
at the cathode, where water is continuously produced and the relative humidity is
high and at the anode, where hydrogen is continuously consumed and no more
water can be removed in vapor form.
Interestingly, Table 7 also shows that 2 ,H Oout anom surpasses 2 ,H O ano catm in all high
recirculation experiments (Vrel = 17.5%: Exps. #2, #4, #6 and #8). In these cases, the
positive values for 2 , 2 ,H O ano cat H Oout anom m imply that water does not tend to
accumulate in the cell. The CDD diagrams also indicate that close to the inlets there is
a net water transport of water from cathode to the anode; however, the
electrochemical activity of row 4 is lower than experiments with Vrel = 5%, which may
be attributed to drying of the membrane for the experiments with high recirculation.
Finally, when going down in the flow field channels for Vrel = 17.5%, the water
diffusing from the cathode is not enough to saturate the anode and no water
condenses.
As stated above, the second approach to gain insight into whether flooding occurs is
based on estimating the type of flow pattern from an empiric flow map. Recently,
empirical maps have been used to characterize the type of flow patterns in the
PEMFC flow fields [46]. The idea is to plot the liquid gas velocity at the outlet as a
function of the gas velocity at the inlet of the anode or cathode flow fields, creating a
flow map on which different regions correspond to different flow patterns. In order
to know the liquid gas velocity at the outlet of the anode or the cathode flow fields, it
is important to determine the net water transport in the cell first. The flow patterns
for the cathode of an operating PEMFC have been categorized in one single-phase
flow and three two-phase flows: droplet flow, film flow and slug flow [35].
Table 7 - Results of the water balance calculations.
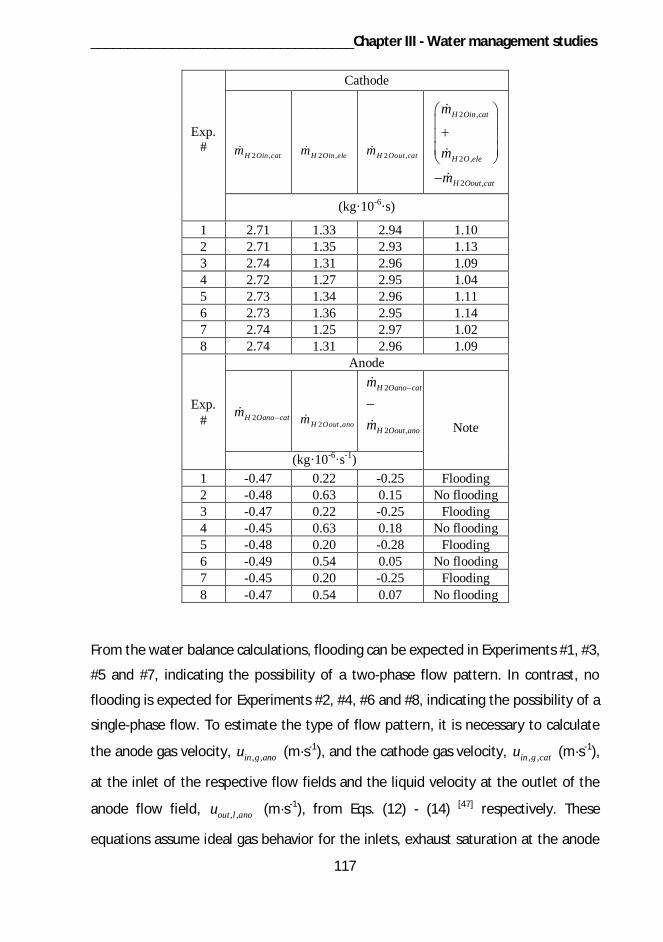
____________________________________Chapter III - Water management studies
117
Exp.#
Cathode
2 ,H Oin catm 2 ,H Oin elem 2 ,H Oout catm
2 ,
2 ,
2 ,
H Oin cat
H O ele
H Oout cat
m
m
m
(kg·10-6·s)
1 2.71 1.33 2.94 1.102 2.71 1.35 2.93 1.133 2.74 1.31 2.96 1.094 2.72 1.27 2.95 1.045 2.73 1.34 2.96 1.116 2.73 1.36 2.95 1.147 2.74 1.25 2.97 1.028 2.74 1.31 2.96 1.09
Exp.#
Anode
2H Oano catm2 ,H Oout anom
2
2 ,
H Oano cat
H Oout ano
m
m Note
(kg·10-6·s-1)1 -0.47 0.22 -0.25 Flooding2 -0.48 0.63 0.15 No flooding3 -0.47 0.22 -0.25 Flooding4 -0.45 0.63 0.18 No flooding5 -0.48 0.20 -0.28 Flooding6 -0.49 0.54 0.05 No flooding7 -0.45 0.20 -0.25 Flooding8 -0.47 0.54 0.07 No flooding
From the water balance calculations, flooding can be expected in Experiments #1, #3,
#5 and #7, indicating the possibility of a two-phase flow pattern. In contrast, no
flooding is expected for Experiments #2, #4, #6 and #8, indicating the possibility of a
single-phase flow. To estimate the type of flow pattern, it is necessary to calculate
the anode gas velocity, , ,in g anou (m·s-1), and the cathode gas velocity, , ,in g catu (m·s-1),
at the inlet of the respective flow fields and the liquid velocity at the outlet of the
anode flow field, , ,out l anou (m·s-1), from Eqs. (12) - (14) [47] respectively. These
equations assume ideal gas behavior for the inlets, exhaust saturation at the anode
Chapter III - Water management studies____________________________________
118
outlet (when applicable) and equal distribution of the fluids on the flow field
channels:
2,, ,
2
H feedin g ano
H
mu
NA(13)
,, ,
air feedin g cat
air
mu
NA(14)
2 , 2 ,, ,
2
H O ano cat H Oout anoout l ano
H O
m mu
NA(15)
where 2,H feedm (kg·s-1) is the mass flow rate of hydrogen at the inlet and is obtained
from the volumetric flow rates on Table 5, H2 (kg·m-3) is the density of hydrogen, N is
the number of channels, A (m2) is the cross sectioned area of each channel, ,air feedm
(kg·s-1) is the mass flow rate of air at the inlet and is obtained from the volumetric
flow rate on Table 4, air (kg·m-3) is the density of air and H2O (kg·m-3) is the density of
water. The liquid velocity at the anode inlet is zero for all cases, as implied from Eq.
(14).
Table 8 summarizes the results for the velocity calculations. In all cases, the
corresponding gas velocity at the inlet of the cathode flow field is located on the
single-phase region of the flow map proposed by Hussaini and Wang [35]. When
Vrel = 5%, the corresponding gas velocity at the anode inlet and the liquid velocity at
the anode outlet is located on the slug flow region of the same flow map. Lastly,
when Vrel = 17.5%, the corresponding gas velocity at the anode inlet is located on the
single-phase region of the same flow map. It is important to highlight that the flow
map proposed by Hussaini and Wang [35] is only valid for that specific experimental
set-up [46] so actual confirmation of the flow patterns may need implementation of a
transparent cell [40] in our set-up. Nevertheless, after performing the water balance
analysis, the gas velocity calculations and their interpretation from that flow map
helped to further gain insight on the type of flow patterns expected in this study.
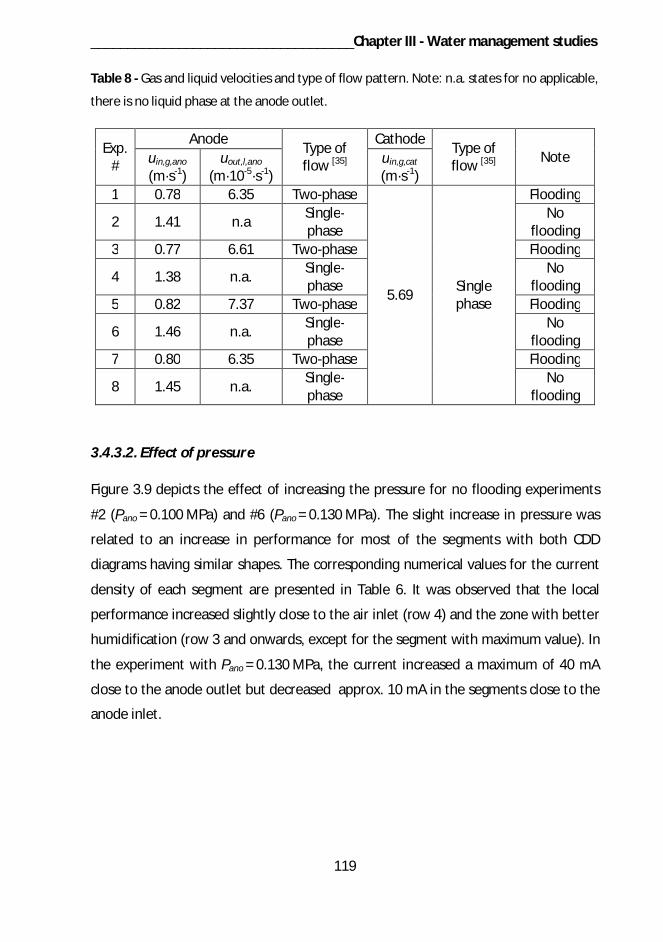
____________________________________Chapter III - Water management studies
119
Table 8 - Gas and liquid velocities and type of flow pattern. Note: n.a. states for no applicable,
there is no liquid phase at the anode outlet.
Exp.#
Anode Type offlow [35]
Cathode Type offlow [35] Noteuin,g,ano
(m·s-1)uout,l,ano
(m·10-5·s-1)uin,g,cat
(m·s-1)1 0.78 6.35 Two-phase
5.69 Singlephase
Flooding
2 1.41 n.a Single-phase
Noflooding
3 0.77 6.61 Two-phase Flooding
4 1.38 n.a. Single-phase
Noflooding
5 0.82 7.37 Two-phase Flooding
6 1.46 n.a. Single-phase
Noflooding
7 0.80 6.35 Two-phase Flooding
8 1.45 n.a. Single-phase
Noflooding
3.4.3.2. Effect of pressure
Figure 3.9 depicts the effect of increasing the pressure for no flooding experiments
#2 (Pano = 0.100 MPa) and #6 (Pano = 0.130 MPa). The slight increase in pressure was
related to an increase in performance for most of the segments with both CDD
diagrams having similar shapes. The corresponding numerical values for the current
density of each segment are presented in Table 6. It was observed that the local
performance increased slightly close to the air inlet (row 4) and the zone with better
humidification (row 3 and onwards, except for the segment with maximum value). In
the experiment with Pano = 0.130 MPa, the current increased a maximum of 40 mA
close to the anode outlet but decreased approx. 10 mA in the segments close to the
anode inlet.
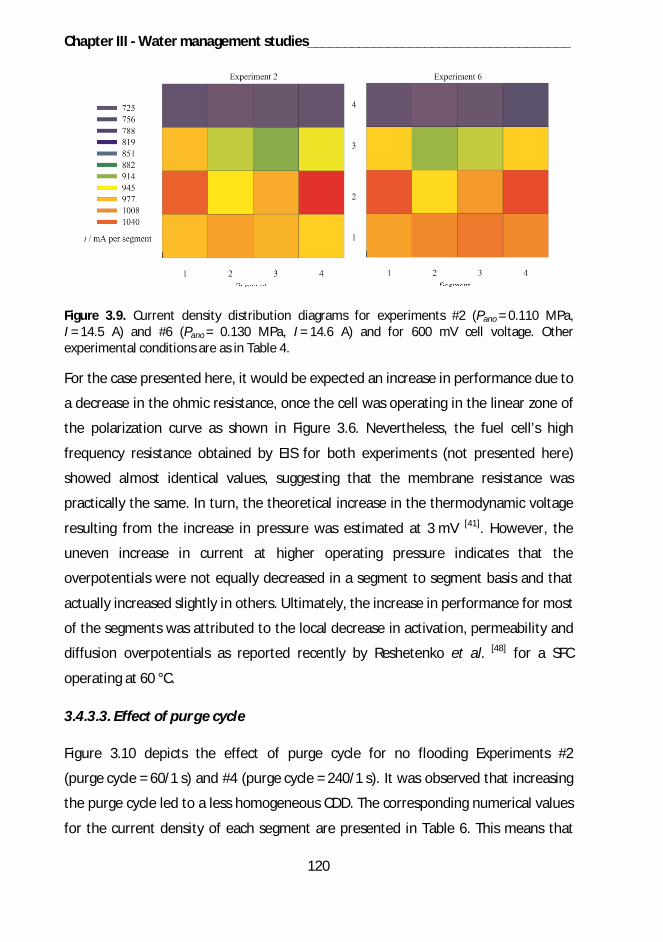
Chapter III - Water management studies____________________________________
120
Figure 3.9. Current density distribution diagrams for experiments #2 (Pano = 0.110 MPa,I = 14.5 A) and #6 (Pano = 0.130 MPa, I = 14.6 A) and for 600 mV cell voltage. Otherexperimental conditions are as in Table 4.
For the case presented here, it would be expected an increase in performance due to
a decrease in the ohmic resistance, once the cell was operating in the linear zone of
the polarization curve as shown in Figure 3.6. Nevertheless, the fuel cell’s high
frequency resistance obtained by EIS for both experiments (not presented here)
showed almost identical values, suggesting that the membrane resistance was
practically the same. In turn, the theoretical increase in the thermodynamic voltage
resulting from the increase in pressure was estimated at 3 mV [41]. However, the
uneven increase in current at higher operating pressure indicates that the
overpotentials were not equally decreased in a segment to segment basis and that
actually increased slightly in others. Ultimately, the increase in performance for most
of the segments was attributed to the local decrease in activation, permeability and
diffusion overpotentials as reported recently by Reshetenko et al. [48] for a SFC
operating at 60 °C.
3.4.3.3. Effect of purge cycle
Figure 3.10 depicts the effect of purge cycle for no flooding Experiments #2
(purge cycle = 60/1 s) and #4 (purge cycle = 240/1 s). It was observed that increasing
the purge cycle led to a less homogeneous CDD. The corresponding numerical values
for the current density of each segment are presented in Table 6. This means that
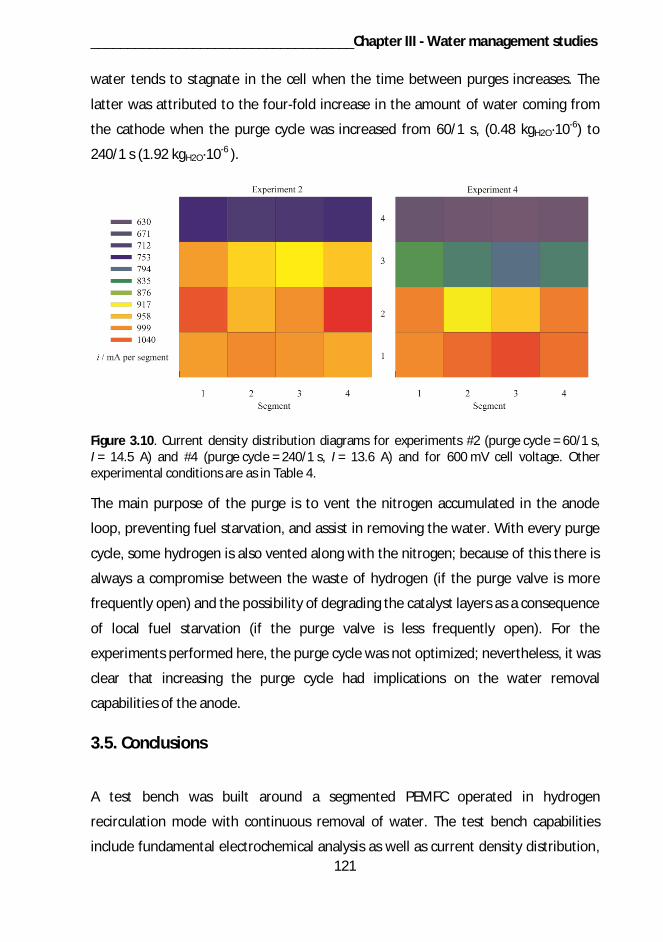
____________________________________Chapter III - Water management studies
121
water tends to stagnate in the cell when the time between purges increases. The
latter was attributed to the four-fold increase in the amount of water coming from
the cathode when the purge cycle was increased from 60/1 s, (0.48 kgH2O·10-6) to
240/1 s (1.92 kgH2O·10-6 ).
Figure 3.10. Current density distribution diagrams for experiments #2 (purge cycle = 60/1 s,I = 14.5 A) and #4 (purge cycle = 240/1 s, I = 13.6 A) and for 600 mV cell voltage. Otherexperimental conditions are as in Table 4.
The main purpose of the purge is to vent the nitrogen accumulated in the anode
loop, preventing fuel starvation, and assist in removing the water. With every purge
cycle, some hydrogen is also vented along with the nitrogen; because of this there is
always a compromise between the waste of hydrogen (if the purge valve is more
frequently open) and the possibility of degrading the catalyst layers as a consequence
of local fuel starvation (if the purge valve is less frequently open). For the
experiments performed here, the purge cycle was not optimized; nevertheless, it was
clear that increasing the purge cycle had implications on the water removal
capabilities of the anode.
3.5. Conclusions
A test bench was built around a segmented PEMFC operated in hydrogen
recirculation mode with continuous removal of water. The test bench capabilities
include fundamental electrochemical analysis as well as current density distribution,
Chapter III - Water management studies____________________________________
122
water balance and nitrogen crossover measurements at the single cell level.
Improvements of the test bench include incorporation of a humidification device to
the anode recirculation loop, refinement of the purge system regarding the amount
of gas purged and incorporation of other ways to trigger the purge (i.e., based on the
voltage-drop of the cell or pressure-drop of the anode).
The concept of partially segmented bipolar plates was introduced and applied. With
the partial segmentation, the lateral resistance between adjacent segments
increased 14% to 21%. The partial segmentation led to a 17% decrease on the
through-plane to in in-plane ratio of each segment. It was estimated that the
increase in lateral resistance may go up to 44% to 70% while the decrease on the
trough-plane to in-plane ratio may go up to 40% if deeper grooves for partial
segmentation are used The major advantage of the partially segmented bipolar
plates is a decrease in the lateral current spreading while at the same time avoiding
their total segmentation. In contrast, the major disadvantage is the decrease in
mechanical strength of the bipolar plates.
Representative anode parameters, namely, recirculated gas flow rate, pressure and
the time between purges, were varied to analyze their effect on the current density
distribution of a segmented PEMFC. Two different current density distribution
diagram shapes were observed for the two different gas recirculation flow rates
used, Vrel = 5%, and Vrel = 17.5%. When the gas recirculation rate was lower, a
maximum in the current density distribution appeared up in the flow fields,
decreasing towards the anode outlet, indicating flooding conditions towards the
outlets. When the gas recirculation rate was higher, there was a decrease in
performance close to the inlets but homogeneous current density distribution
afterwards, indicating drying conditions at the inlets. The anode pressure and time
between purges did not change to a great extent the shape of the current density
distribution diagrams; however, water and nitrogen accumulation would seriously
affect the performance of PEMFC operated in recirculation mode if the time between
purges is not optimized.
____________________________________Chapter III - Water management studies
123
Two complementary approaches were used to determine the likelihood of flooding in
the cell: one based on a water balance analysis and the other based on the empiric
flow map proposed by Hussaini and Wang [35]. It was noted that flooding conditions
resulted from the impossibility of the anode to remove water diffusing from the
cathode, leading to water condensation at the cathode and the anode. In turn, drying
conditions resulted from excessive removal of water diffusing from the cathode close
to the inlets, nonetheless, the higher flow rates provided more water removal
capabilities to the anode, avoiding flooding towards the outlets of the flow fields. The
empiric flow map predicted a single-phase flow pattern at the cathode for all
experiments. In turn, the empiric flow map predicted a two-phase flow at the anode
for the low recirculation experiments and single-phase flow pattern at the anode for
the high recirculation experiments.
3.6. Acknowledgments
Luis C. Pérez is grateful to FCT for his PhD grant reference SFRH/BD/44684/2008.
Financial support by FCT through projects PTDC/EQU-EQU/70574/2006 and
PTDC/EQU-EQU/104217/2008 is also acknowledged.
Chapter III - Water management studies____________________________________
124
3.7. References
[1] M. M. Mench, in Fuel Cell Engines, John Wiley & Sons, Inc., 2008, pp. 285-379.
[2] N. Yousfi-Steiner, P. Moçotéguy, D. Candusso, D. Hissel, Journal of Power Sources
2009, 194, 130-145.
[3] K. Jiao, X. Li, Progress in Energy and Combustion Science 2011, 37, 221-291.
[4] S. Ge, C.-Y. Wang, Journal of the Electrochemical Society 2007, 154, B998-B1005.
[5] J. B. Siegel, D. A. Mckay, A. G. Stefanopoulou, D. S. Hussey, D. L. Jacobson, Journal
of the Electrochemical Society 2008, 155, B1168-B1178.
[6] J. T. A. Zawodzinski, T. E. Springer, J. Davey, R. Jestel, C. Lopez, J. Valerio, S.
Gottesfeld, Journal of The Electrochemical Society 1993, 140, 1981-1985.
[7] S. D. Knights, K. M. Colbow, J. St-Pierre, D. P. Wilkinson, Journal of Power Sources
2004, 127, 127-134.
[8] I. A. Schneider, D. Kramer, A. Wokaun, G. G. Scherer, Electrochemistry
Communications 2005, 7, 1393-1397.
[9] R. J. Bellows, M. Y. Lin, M. Arif, A. K. Thompson, D. Jacobson, Journal of the
Electrochemical Society 1999, 146, 1099-1103.
[10] I. Manke, C. Hartnig, M. Grunerbel, W. Lehnert, N. Kardjilov, A. Haibel, A. Hilger,
J. Banhart, H. Riesemeier, Applied Physics Letters 2007, 90, 174105-174103.
[11] X. G. Yang, F. Y. Zhang, A. L. Lubawy, C. Y. Wang, Electrochemical and Solid-State
Letters 2004, 7, A408-A411.
[12] T. Sasabe, S. Tsushima, S. Hirai, K. Minami, K. Yada, ECS Transactions 2009, 25,
513-521.
[13] S. Tsushima, K. Teranishi, S. Hirai, Electrochemical and Solid-State Letters 2004,
7, A269-A272.
____________________________________Chapter III - Water management studies
125
[14] S. Tsushima, S. Hirai, Progress in Energy and Combustion Science 2011, 37, 204-
220.
[15] L. C. Pérez, L. Brandão, J. M. Sousa, A. Mendes, Renewable and Sustainable
Energy Reviews 2011, 15, 169-185.
[16] F. Barbir, in PEM Fuel Cells, Academic Press, Burlington, 2005, pp. 115-145.
[17] M. Ferraro, F. Sergi, G. Brunaccini, G. Dispenza, L. Andaloro, V. Antonucci,
Journal of Power Sources 2009, 193, 342-348.
[18] J. Marcinkoski, B. D. James, J. A. Kalinoski, W. Podolski, T. Benjamin, J. Kopasz,
Journal of Power Sources 2011, 196, 5282-5292.
[19] R. Eckl, R. Grinzinger, W. Lehnert, Journal of Power Sources 2006, 154, 171-179.
[20] W. Dai, H. Wang, X.-Z. Yuan, J. J. Martin, D. Yang, J. Qiao, J. Ma, International
Journal of Hydrogen Energy 2009, 34, 9461-9478.
[21] H. Karimäki, L. C. Pérez, K. Nikiforow, T. M. Keränen, J. Viitakangas, J. Ihonen,
International Journal of Hydrogen Energy 2011, 36, 10179-10187.
[22] D. Ferreira, R. Magalhães, P. Taveira, A. l. Mendes, Industrial & Engineering
Chemistry Research 2011, 50, 10201-10210.
[23] S. J. C. Cleghorn, C. R. Derouin, M. S. Wilson, S. Gottesfeld, Journal of Applied
Electrochemistry 1998, 28, 663-672.
[24] D. Natarajan, T. Van Nguyen, Journal of Power Sources 2004, 135, 95-109.
[25] I. A. Schneider, H. Kuhn, A. Wokaun, G. G. Scherer, Journal of the Electrochemical
Society 2005, 152, A2092-A2103.
[26] A. Hakenjos, K. Tüber, J. O. Schumacher, C. Hebling, Fuel Cells 2004, 4, 185-189.
[27] B. Sompalli, B. A. Litteer, W. Gu, H. A. Gasteiger, Journal of the Electrochemical
Society 2007, 154, B1349-B1357.
Chapter III - Water management studies____________________________________
126
[28] M. Noponen, J. Ihonen, A. Lundblad, G. Lindbergh, Journal of Applied
Electrochemistry 2004, 34, 255-262.
[29] A. Hakenjos, H. Muenter, U. Wittstadt, C. Hebling, Journal of Power Sources
2004, 131, 213-216.
[30] A. Dimensions, can be found under
www.airdimensions.com/ADISampleDesign.pdf, 2012.
[31] S. S. Kocha, J. D. L. Yang, J. S. Yi, Aiche Journal 2006, 52, 1916-1925.
[32] C. Mittelsteadt, M. Umbrell, ECS Meeting Abstracts 2006, 501, 770-770.
[33] FC™–Series Humidifiers, can be found under
www.permapure.com/products/humidifiers/fc-series-
humidifiers/?ind=fuelcell&prod=676, 2012.
[34] X. Z. Yuan, H. J. Wang, J. C. Sun, J. J. Zhang, International Journal of Hydrogen
Energy 2007, 32, 4365-4380.
[35] I. S. Hussaini, C.-Y. Wang, Journal of Power Sources 2009, 187, 444-451.
[36] H. Lin, T.-F. Cao, L. Chen, Y.-L. He, W.-Q. Tao, International Journal of Hydrogen
Energy 2012, 37, 11871-11886.
[37] F. P. Incropera, D. P. DeWitt, (Ed.: I. John Wiley & Sons), 2002, pp. 87-182.
[38] A. Nishimura, K. Shibuya, A. Morimoto, S. Tanaka, M. Hirota, Y. Nakamura, M.
Kojima, M. Narita, E. Hu, Applied Energy 2012, 90, 73-79.
[39] J. P. Owejan, J. J. Gagliardo, S. R. Falta, T. A. Trabold, Journal of the
Electrochemical Society 2009, 156, B1475-B1483.
[40] D. Lee, J. Bae, International Journal of Hydrogen Energy 2012, 37, 422-435.
[41] M. M. Mench, Fuel Cell Engines, John Wiley & Sons, Inc., New Jersey, 2008.
____________________________________Chapter III - Water management studies
127
[42] G. J. M. Janssen, M. L. J. Overvelde, Journal of Power Sources 2001, 101, 117-
125.
[43] Y. Cai, J. Hu, H. Ma, B. Yi, H. Zhang, Electrochimica Acta 2006, 51, 6361-6366.
[44] T. Kim, S. Lee, H. Park, International Journal of Hydrogen Energy 2010, 35, 8631-
8643.
[45] G. Q. Lu, F. Q. Liu, C. Y. Wang, Journal of Power Sources 2007, 164, 134-140.
[46] R. Anderson, L. Zhang, Y. Ding, M. Blanco, X. Bi, D. P. Wilkinson, Journal of Power
Sources 2010, 195, 4531-4553.
[47] M. Bruce, Y. Donald, O. Theodore, Fundamentals of fluid mechanics, John Wiley
& Sons, Danvers, Massachusetts, 2002.
[48] T. V. Reshetenko, G. Bender, K. Bethune, R. Rocheleau, Electrochimica Acta
2011, 56, 8700-8710.
[49] W. Wagner, A. Pruss, Journal of Physical and Chemical Reference Data 2002, 31,
387-535.

128

129
Chapter IV

130
__________________________________Chapter IV - Air bleed optimization studies
131
Chapter IV - Air bleed optimization studies3
4.1. Abstract
The use of hydrogen with lower quality than that specified in current regulation is an
attractive option for stationary PEMFC power production. In this paper, the effect of CO is
mitigated using air bleed levels up to 2% in an H2 PEMFC fed with CO concentrations below 20
ppm. A methodology to optimize the air bleed levels is developed using a novel arrangement
of cells coupled to a gas chromatograph. The methodology relies on evaluating the distributed
performance of the cell and on determining the CO and CO2 molar flow rates at the anode
outlet. Furthermore, the amount of CO adsorbed onto the catalyst and the fraction of
catalytic sites covered by CO are estimated. The results show that different parameters, such
as the H2 volumetric flow rate, CO concentration and air bleed level, influence both the steady
state and dynamics of PEMFCs that operate with low quality hydrogen.
3 The content of this chapter is adapted from: L.C. Pérez, T. Rajala, J. Ihonen, P. Koski, J.M.Sousa, A. Mendes, "Development of a methodology to optimize the air bleed in PEMFCsystems operating with low quality hydrogen”. International Journal of Hydrogen Energy, 38(2013) 16286-16299.
Chapter IV - Air bleed optimization studies__________________________________
132
4.2. Introduction
Nowadays, Polymer Electrolyte Membrane Fuel Cells (PEMFCs) are being introduced
successfully in many niche markets [1, 2]. The main technical problems of PEMFCs
have been solved, even if there is still room to improve their durability and reduce
costs [3-6].
One of the remaining issues for wider market introduction is the cost of high purity
hydrogen (H2). For example, meeting the H2 fuel specifications for road vehicles
outlined in current regulation (ISO 14687-2:2012 and SAE J2719) increases the costs
of purification and quality assurance since the total amount of impurities must be
below 100 ppm. The use of low quality H2 that does not fulfill current regulation
would be an attractive option to reduce the operating costs associated with the fuel
for specific applications, e.g. stationary power generation. However, this would
increase the capital cost of the PEMFC system. That is why understanding the effect
of impurities and their mitigation techniques is a key issue to reduce the total cost of
ownership [7] of PEMFCs.
Carbon monoxide (CO) has attracted most attention among various impurities such
as hydrogen sulfide (H2S), ammonia (NH3) or carbon dioxide (CO2,) for two reasons.
First, it is the compound that most often constrains the fuel purification process [8].
Second, CO decreases the performance of PEMFCs as it reduces the active area of the
membrane electrode assembly (MEA) due to its preferential adsorption onto the
catalytic sites [9]. Furthermore, since the adsorption of CO is not homogeneous along
the active area of the MEA, as reported in modeling studies [10, 11] and
experimental studies using segmented PEMFCs [12-15], it is important analyzing the
spatial distribution of CO within the cell.
Different techniques have been proposed to mitigate the effect of CO in PEMFCs,
including: i) development of Pt-based binary or ternary catalysts [16], ii) voltage
pulsing [17], iii) triode cell design [18], iv) external air bleed [19] and v) alternative
anode configurations with external air bleed [20]. Another way to mitigate the effect
__________________________________Chapter IV - Air bleed optimization studies
133
of CO is by increasing the catalyst loading [21], though this approach proportionally
increases the catalyst cost.
All the mitigation techniques have pros and cons. For example, Pt-based binary or
ternary catalysts enhance CO electrooxidation at lower anode overpotentials.
Nonetheless, the most common binary catalyst (Pt-Ru) compromises PEMFC´s
durability due to Ru dissolution and migration to the cathode [22, 23]. In turn,
ternary catalysts still exhibit problems that concern their preparation and stability
[16]. Voltage pulsing [17] and triode cell design [18] rely on alternative electrical
circuitry configurations to promote electro oxidation of CO. However, they have only
been demonstrated on a laboratory scale.
External air bleed is the most studied CO mitigation technique and relies on feeding
O2 (usually air) along with the fuel stream [19]. The external air bleed can be
enhanced by impregnating the gas diffusion layer (GDL) with transition metal oxides
that catalyze the CO oxidation [20]. Nonetheless, to date there are no commercial
GDLs available to perform the latter. Drawbacks of the external air bleed include fuel
efficiency reduction, overheating of the anode electrode and accelerated membrane
degradation [24].
In addition to external air bleed, there is always some amount of O2 that diffuses
from the cathode during PEMFC operation. The latter is called “internal air bleed”
and is enhanced with thin membranes and high cathode backpressures [25]. Apart
from the drawbacks of the external air bleed, the issues with the internal air bleed
relate to the difficulty of optimizing it for different CO concentrations and that O2
may not diffuse uniformly along the MEA active area, which may lead to severe local
poisoning of the catalyst.
Table 9 summarizes the most important findings of several external air bleed studies
that can be found in the literature [12, 22, 26-33]. In general, the scope of the
reviewed manuscripts was PEMFCs for stationary power applications operated
between 60 °C and 90 °C with Pt-Ru as the anode catalyst. Within the manuscripts,
the CCO and air bleed varied between 10 ppm and 10000 ppm and between 0.5% and
20% respectively. Most of the measurements were done using actual reformate or
Chapter IV - Air bleed optimization studies__________________________________
134
simulated reformate gas [12, 22, 28, 29, 31-33], and only few with H2-CO mixtures
[26, 27, 30].
The main problem with the results summarized in Table 9 is that they do not provide
definitive values or a guideline to estimate the amount of external air bleed needed
to mitigate the effect of CO in PEMFCs. Moreover, the advantage of using Pt-Ru (over
Pt) is not clearly observed and the CO and CO2 concentrations at the anode exit were
not measured. The latter makes it impossible to estimate the conversion of CO to CO2
due to the external air bleed and to identify other sources of CO2 (i.e., crossing over
from the cathode) at the anode.
It is important to highlight a recent review paper [34] that addresses the problem of
Ru dissolution and its possible solutions. However, external air bleed may still be
applicable in PEMFC systems with Pt-Ru as anode catalyst depending on the amount
of CO considered in the H2 fuel specification for PEMFC stationary applications
(ISO/DIS 14687-3 – enquiry stage).
In this paper, a methodology is introduced to optimize the amount of air bleed in
PEMFCs subjected to a continuous feed of CO. The methodology relies on a new
arrangement of single cells, which has similarities to a segmented PEMFC [35], and
on measuring the CO and CO2 concentrations of the anode exhaust gas with a gas
chromatograph (GC). The segmented PEMFC is based on a multisinglecell (MsC) used
previously to study novel coatings for bipolar plates [36, 37]. The CO and CO2 molar
flow rates are used to determine the amount of CO adsorbed onto the catalyst and
the fraction of catalytic sites covered by CO.
The dynamic response of the segmented PEMFC is evaluated for the following
scenarios: i) severe CO poisoning, where the CO breakthrough is highlighted, ii)
amount of air bleed level needed to recover a desired percentage of original
performance after the introduction of CO and iii) the effect of H2 volumetric flow rate
on both CO poisoning and air bleed effectiveness.
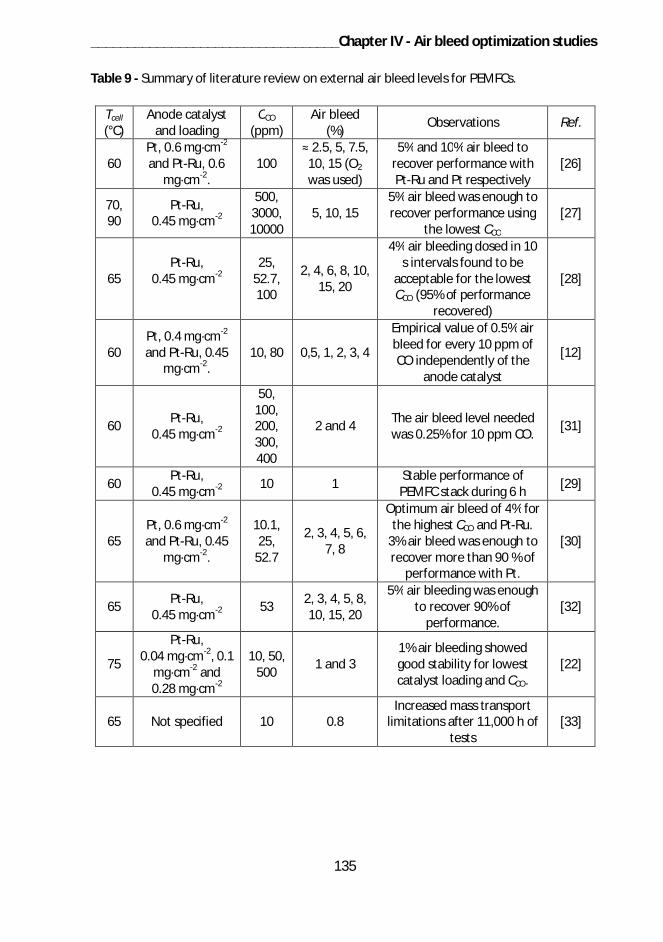
__________________________________Chapter IV - Air bleed optimization studies
135
Table 9 - Summary of literature review on external air bleed levels for PEMFCs.
Tcell
(°C)Anode catalyst
and loadingCCO
(ppm)Air bleed
(%) Observations Ref.
60Pt, 0.6 mg·cm-2
and Pt-Ru, 0.6mg·cm-2.
1002.5, 5, 7.5,
10, 15 (O2
was used)
5% and 10% air bleed torecover performance withPt-Ru and Pt respectively
[26]
70,90
Pt-Ru,0.45 mg·cm-2
500,3000,10000
5, 10, 155% air bleed was enough torecover performance using
the lowest CCO
[27]
65Pt-Ru,
0.45 mg·cm-225,
52.7,100
2, 4, 6, 8, 10,15, 20
4% air bleeding dosed in 10s intervals found to be
acceptable for the lowestCCO (95% of performance
recovered)
[28]
60Pt, 0.4 mg·cm-2
and Pt-Ru, 0.45mg·cm-2.
10, 80 0,5, 1, 2, 3, 4
Empirical value of 0.5% airbleed for every 10 ppm ofCO independently of the
anode catalyst
[12]
60 Pt-Ru,0.45 mg·cm-2
50,100,200,300,400
2 and 4 The air bleed level neededwas 0.25% for 10 ppm CO. [31]
60 Pt-Ru,0.45 mg·cm-2 10 1 Stable performance of
PEMFC stack during 6 h [29]
65Pt, 0.6 mg·cm-2
and Pt-Ru, 0.45mg·cm-2.
10.1,25,
52.7
2, 3, 4, 5, 6,7, 8
Optimum air bleed of 4% forthe highest CCO and Pt-Ru.
3% air bleed was enough torecover more than 90 % of
performance with Pt.
[30]
65 Pt-Ru,0.45 mg·cm-2 53 2, 3, 4, 5, 8,
10, 15, 20
5% air bleeding was enoughto recover 90% of
performance.[32]
75
Pt-Ru,0.04 mg·cm-2, 0.1
mg·cm-2 and0.28 mg·cm-2
10, 50,500 1 and 3
1% air bleeding showedgood stability for lowestcatalyst loading and CCO.
[22]
65 Not specified 10 0.8Increased mass transport
limitations after 11,000 h oftests
[33]
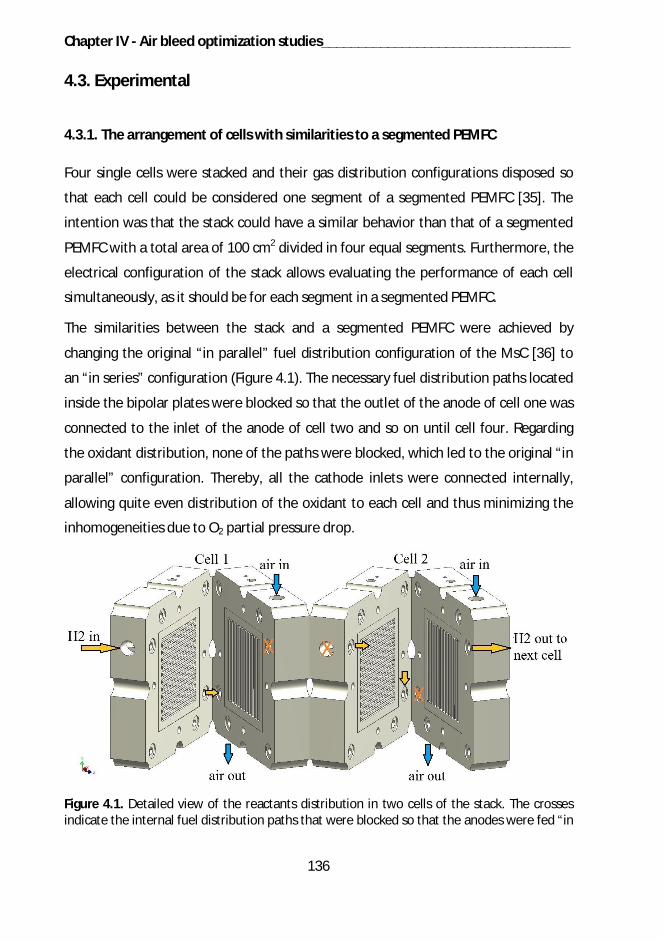
Chapter IV - Air bleed optimization studies__________________________________
136
4.3. Experimental
4.3.1. The arrangement of cells with similarities to a segmented PEMFC
Four single cells were stacked and their gas distribution configurations disposed so
that each cell could be considered one segment of a segmented PEMFC [35]. The
intention was that the stack could have a similar behavior than that of a segmented
PEMFC with a total area of 100 cm2 divided in four equal segments. Furthermore, the
electrical configuration of the stack allows evaluating the performance of each cell
simultaneously, as it should be for each segment in a segmented PEMFC.
The similarities between the stack and a segmented PEMFC were achieved by
changing the original “in parallel” fuel distribution configuration of the MsC [36] to
an “in series” configuration (Figure 4.1). The necessary fuel distribution paths located
inside the bipolar plates were blocked so that the outlet of the anode of cell one was
connected to the inlet of the anode of cell two and so on until cell four. Regarding
the oxidant distribution, none of the paths were blocked, which led to the original “in
parallel” configuration. Thereby, all the cathode inlets were connected internally,
allowing quite even distribution of the oxidant to each cell and thus minimizing the
inhomogeneities due to O2 partial pressure drop.
Figure 4.1. Detailed view of the reactants distribution in two cells of the stack. The crossesindicate the internal fuel distribution paths that were blocked so that the anodes were fed “in
__________________________________Chapter IV - Air bleed optimization studies
137
series”. Since none of the internal oxidant distribution paths were blocked, the cathodes werefed “in parallel”.
The single cells comprised commercial MEAs with 25 cm2 active area based on a 35
m thick reinforced PEM loaded with 0.4 mg Pt·cm-2 on the anode and with 0.6 mg
Pt·cm-2 on the cathode. The gas diffusion layers (Sigracet® SGL 35 BC, SGL
technologies, Germany) were 325 m thick and the gaskets (Model 35 FC-PO100,
Freudenberg, Germany) were 350 m thick. The clamping pressure was regulated
using disc springs (Belleville, UK). The bipolar plates comprised single channel
serpentine flow fields and were manufactured from graphite blocks (ISEM-3, Svenska
Tanso, Sweden) with 88 mm length x 88 mm width x 20 mm thick.
4.3.2. Test station, data logging and gas chromatograph analysis
A test station (Arbin Instruments, USA) was used to control the H2 and air volumetric
flow rates, humidify the gases, and set the temperature of the MsC. The temperature
of the MsC was measured with a K-type thermocouple inserted in the cathode of the
second cell and controlled by circulating deionized water through special channels
located at the back of the bipolar plates. The test station was also used to perform
data logging of flow rates, temperatures, pressures and electric currents. All the mass
flow controllers used for the tests were calibrated using a calibrator (Gilian®,
Sensidyne, USA).
The anode was fed with H2, a CO-N2 mixture and air as sketched in Figure 4.2. If not
otherwise indicated, the anode was fed with high purity H2 (99.999%). CO was taken
from a gas bottle (OY Aga Ab, Finland) containing a gas mixture with a concentration
of 901 ppm of CO balanced with N2 and fed using a mass flow controller (EL-FLOW®,
Bronkhorst, The Netherlands). For the air bleed, synthetic air was produced with a
zero air gas generator (Model 76-818, Whatman™, UK) and fed using a mass flow
controller (EL-FLOW®, Bronkhorst, The Netherlands). The mass flow controllers for CO
and synthetic air were connected to a digital power supply and control box (Series E-
7000, Bronkhorst, The Netherlands). Check valves (C series, Swagelok®, USA) were
inserted in the H2 and air bleed pipelines to prevent upstream contamination with
CO. The pressure drop in the cell was measured using two pressure transducers
Chapter IV - Air bleed optimization studies__________________________________
138
(CTE7000 series, Sensor Technics, Germany) one located and the inlet and the other
at the outlet of the anode.
The anode exhaust gas management is also depicted in Figure 4.2. The water
contained in the exhaust gas was condensed using a heat exchanger. The gas stream
was then splitted in two using a tee fitting, one of them was vented after passing
through a water trap and the other further dried. A needle valve (Series AS, SMC,
Japan) located downstream the tee fitting was used to regulate the flow of the
stream of interest or “sample”. Then, this sample stream was dried using a
membrane module (FC™- Series, Perma Pure LLC, USA). To dry the sample, nitrogen
(N2) was passed through a pipe at 80 °C before being fed to the membrane module in
counterflow to the sample at a volumetric flow rate of QN2 = 1 dm3·min-1 using a
rotameter (UK-040 series, Honsberg, Germany). The pressure was measured before
the membrane module using a pressure transducer (Eclipse® series, Honeywell, USA)
so it was possible to estimate the volumetric flow rate of the sample from the
pressure drop between the anode outlet and this point. The relative humidity of the
sample was measured after the membrane module using a relative humidity probe
(Humicap 110®, Vaisala, Finland).
The cathode was fed with compressed air that was passed through a set of filters
(2000 series, Parker Hannifin Corporation, USA) in order to remove particles, mist
and trace compressor oil vapor. The pressure at the cathode inlet was measured
using a pressure transducer (CTE7000 series, Sensor Technics, Germany). The
cathode exhaust gas was passed through a water trap and vented.
One power supply (EX2020R, TTi, UK), one precision resistor and four loads (LD300,
TTi, UK) were used to control the voltage of the cells. With this configuration, the
voltage of each single cell (equivalent to one segment) was controlled simultaneously
using the power supply while the current of each segment was measured
simultaneously with each load. Similar electrical configurations for distributed
performance evaluation have been reported by other authors [38, 39].
The CO and CO2 concentrations of the anode exhaust gas were measured using a GC
(6890 series, Agilent Technologies, USA) equipped with a flame ionization detector
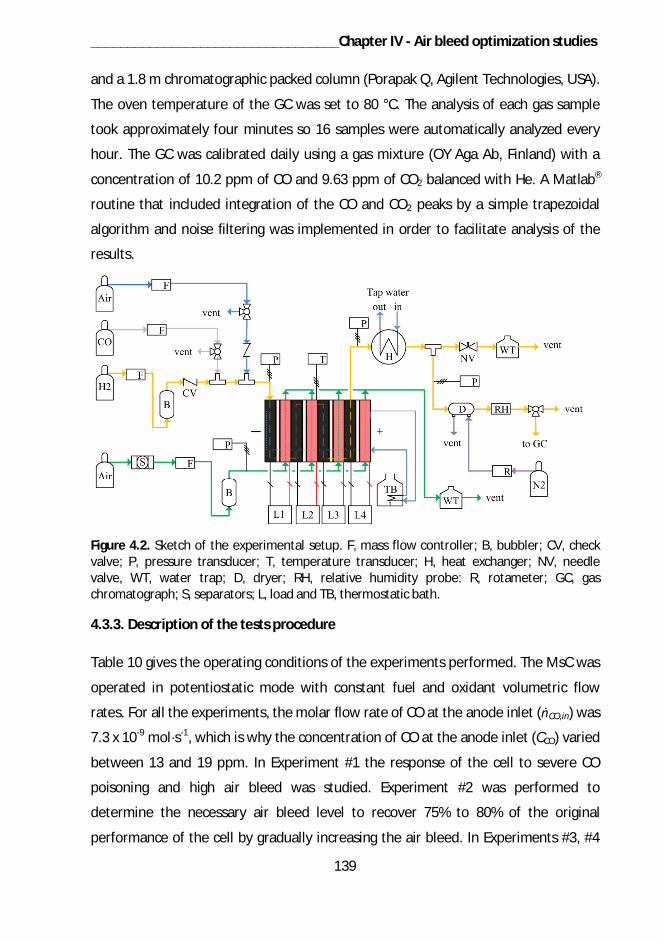
__________________________________Chapter IV - Air bleed optimization studies
139
and a 1.8 m chromatographic packed column (Porapak Q, Agilent Technologies, USA).
The oven temperature of the GC was set to 80 °C. The analysis of each gas sample
took approximately four minutes so 16 samples were automatically analyzed every
hour. The GC was calibrated daily using a gas mixture (OY Aga Ab, Finland) with a
concentration of 10.2 ppm of CO and 9.63 ppm of CO2 balanced with He. A Matlab®
routine that included integration of the CO and CO2 peaks by a simple trapezoidal
algorithm and noise filtering was implemented in order to facilitate analysis of the
results.
Figure 4.2. Sketch of the experimental setup. F, mass flow controller; B, bubbler; CV, checkvalve; P, pressure transducer; T, temperature transducer; H, heat exchanger; NV, needlevalve, WT, water trap; D, dryer; RH, relative humidity probe: R, rotameter; GC, gaschromatograph; S, separators; L, load and TB, thermostatic bath.
4.3.3. Description of the tests procedure
Table 10 gives the operating conditions of the experiments performed. The MsC was
operated in potentiostatic mode with constant fuel and oxidant volumetric flow
rates. For all the experiments, the molar flow rate of CO at the anode inlet ( CO,in) was
7.3 x 10⁻⁹ mol·s-1, which is why the concentration of CO at the anode inlet (CCO) varied
between 13 and 19 ppm. In Experiment #1 the response of the cell to severe CO
poisoning and high air bleed was studied. Experiment #2 was performed to
determine the necessary air bleed level to recover 75% to 80% of the original
performance of the cell by gradually increasing the air bleed. In Experiments #3, #4
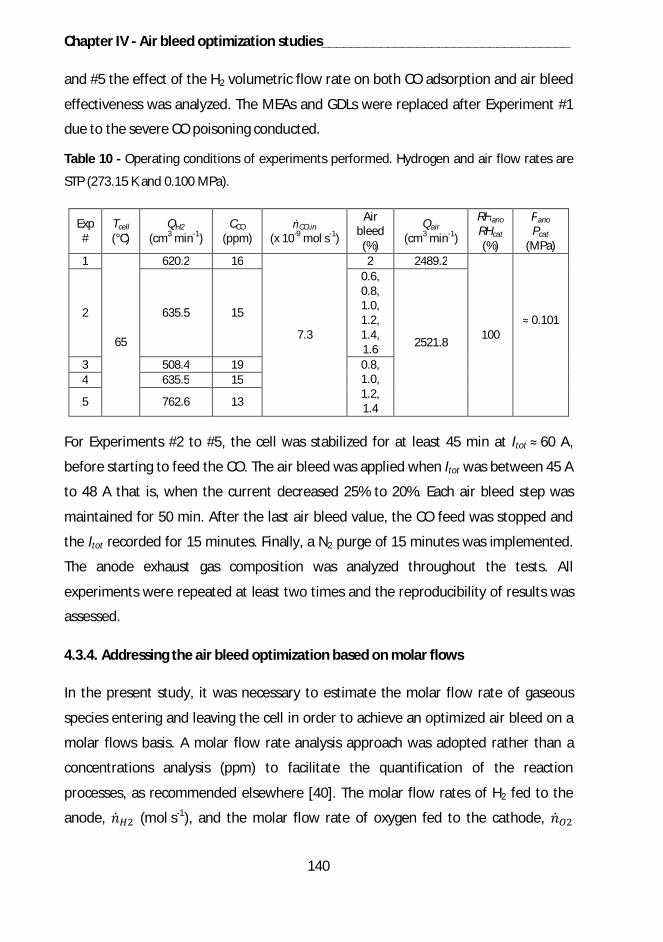
Chapter IV - Air bleed optimization studies__________________________________
140
and #5 the effect of the H2 volumetric flow rate on both CO adsorption and air bleed
effectiveness was analyzed. The MEAs and GDLs were replaced after Experiment #1
due to the severe CO poisoning conducted.
Table 10 - Operating conditions of experiments performed. Hydrogen and air flow rates are
STP (273.15 K and 0.100 MPa).
Exp#
Tcell
(°C)QH2
(cm3 min-1)CCO
(ppm)CO,in
(x 10-9 mol s-1)
Airbleed
(%)
Qair
(cm3 min-1)
RHanoRHcat
(%)
PanoPcat
(MPa)1
65
620.2 16
7.3
2 2489.2
100 0.1012 635.5 15
0.6,0.8,1.0,1.2,1.4,1.6 2521.8
3 508.4 19 0.8,1.0,1.2,1.4
4 635.5 15
5 762.6 13
For Experiments #2 to #5, the cell was stabilized for at least 45 min at Itot 60 A,
before starting to feed the CO. The air bleed was applied when Itot was between 45 A
to 48 A that is, when the current decreased 25% to 20%. Each air bleed step was
maintained for 50 min. After the last air bleed value, the CO feed was stopped and
the Itot recorded for 15 minutes. Finally, a N2 purge of 15 minutes was implemented.
The anode exhaust gas composition was analyzed throughout the tests. All
experiments were repeated at least two times and the reproducibility of results was
assessed.
4.3.4. Addressing the air bleed optimization based on molar flows
In the present study, it was necessary to estimate the molar flow rate of gaseous
species entering and leaving the cell in order to achieve an optimized air bleed on a
molar flows basis. A molar flow rate analysis approach was adopted rather than a
concentrations analysis (ppm) to facilitate the quantification of the reaction
processes, as recommended elsewhere [40]. The molar flow rates of H2 fed to the
anode, (mol s-1), and the molar flow rate of oxygen fed to the cathode,
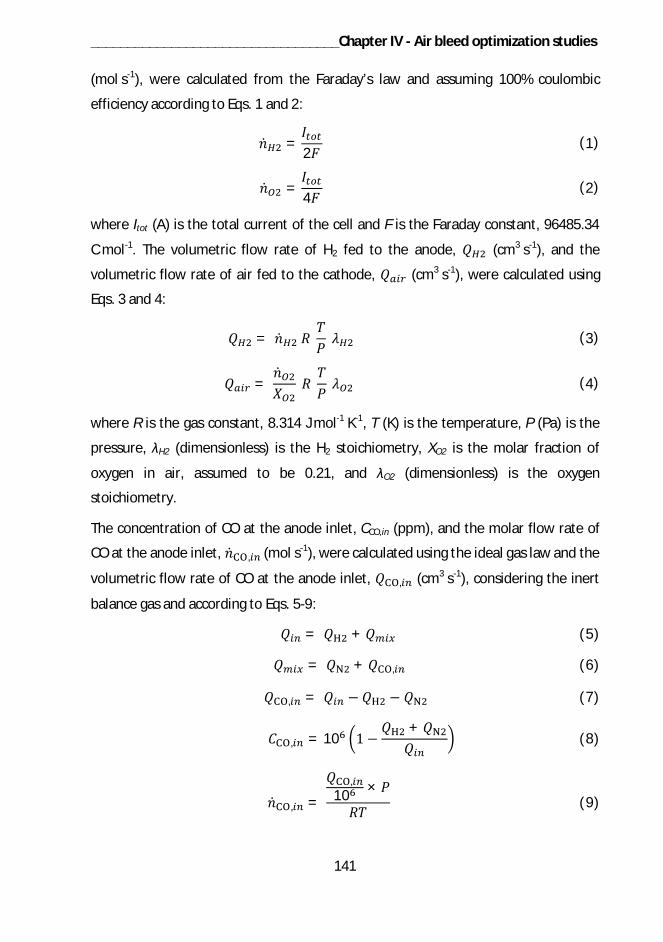
__________________________________Chapter IV - Air bleed optimization studies
141
(mol s-1), were calculated from the Faraday’s law and assuming 100% coulombic
efficiency according to Eqs. 1 and 2:
=2
(1)
=4
(2)
where Itot (A) is the total current of the cell and F is the Faraday constant, 96485.34
C mol-1. The volumetric flow rate of H2 fed to the anode, (cm3 s-1), and the
volumetric flow rate of air fed to the cathode, (cm3 s-1), were calculated using
Eqs. 3 and 4:
= (3)
= (4)
where R is the gas constant, 8.314 J mol-1 K-1, T (K) is the temperature, P (Pa) is the
pressure, H2 (dimensionless) is the H2 stoichiometry, XO2 is the molar fraction of
oxygen in air, assumed to be 0.21, and O2 (dimensionless) is the oxygen
stoichiometry.
The concentration of CO at the anode inlet, CCO,in (ppm), and the molar flow rate of
CO at the anode inlet, , (mol s-1), were calculated using the ideal gas law and the
volumetric flow rate of CO at the anode inlet, , (cm3 s-1), considering the inert
balance gas and according to Eqs. 5-9:
= + (5)
= + , (6)
, = (7)
, = 10+
(8)
, =,
10 ×(9)
Chapter IV - Air bleed optimization studies__________________________________
142
where (cm3 s-1) is the sum of the volumetric flow rate of H2 fed to the anode and
the volumetric flow rate of the gas mixture containing CO, (cm3 s-1) is
volumetric flow rate of the gas mixture containing CO balanced with N2 and
(cm3 s-1) is the volumetric flow rate of N2 in the referred gas mixture.
The volumetric flow rate of air fed to the anode to perform the air bleed, (cm3 s-
1), was calculated as a percentage of the volumetric flow rate of H2 fed to the anode
while the molar flow rate of oxygen fed to the anode to perform the air bleed,
( ) (mol s-1), was determined using the ideal gas law, Eqs. 10 and 11
respectively:
=× %100
(10)
( ) = 10 ×(11)
where AB% is the percentage of air bleed.
Finally, the molar flow rate of CO, , (mol s-1), and the molar flow rate of CO2,
, (mol s-1), at the anode outlet were calculated from the concentration of CO,
CCO,out (ppm), and the concentration of CO2, CCO2,out (ppm) at the anode outlet,
considering the H2 consumed, , (cm3 s-1), and the inert gas fed at the inlet,
Eqs. 12-15:
= , + + ( ) (12)
, =2
(13)
, =× , ×
(14)
, =× , ×
(15)
where (cm3 s-1) is the volumetric flow rate of the gas mixture leaving the
segmented cell in series and ( ) (cm3 s-1) is the volumetric flow rate of N2 from
the air bleed.
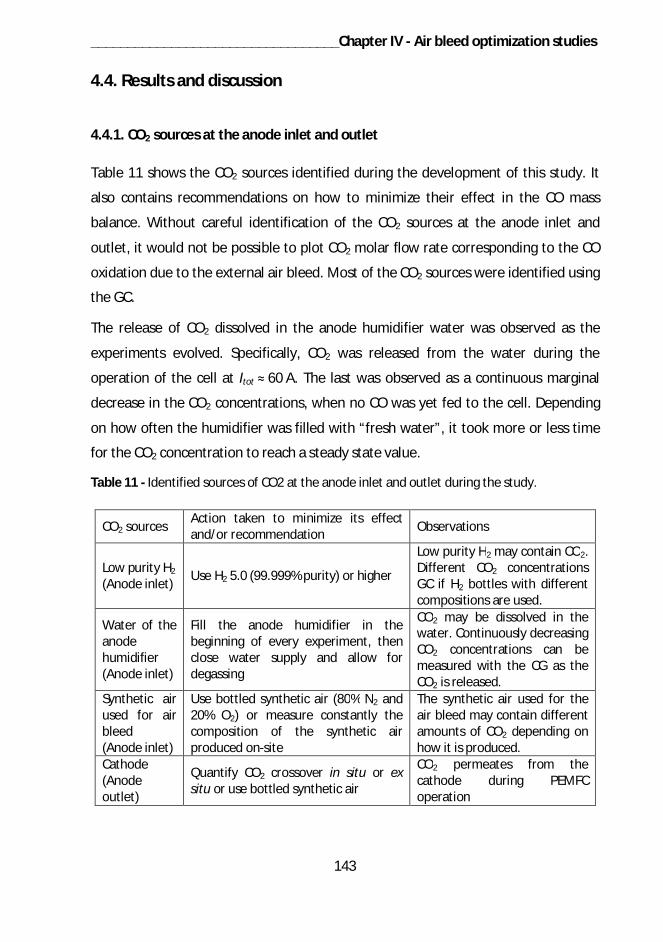
__________________________________Chapter IV - Air bleed optimization studies
143
4.4. Results and discussion
4.4.1. CO2 sources at the anode inlet and outlet
Table 11 shows the CO2 sources identified during the development of this study. It
also contains recommendations on how to minimize their effect in the CO mass
balance. Without careful identification of the CO2 sources at the anode inlet and
outlet, it would not be possible to plot CO2 molar flow rate corresponding to the CO
oxidation due to the external air bleed. Most of the CO2 sources were identified using
the GC.
The release of CO2 dissolved in the anode humidifier water was observed as the
experiments evolved. Specifically, CO2 was released from the water during the
operation of the cell at Itot 60 A. The last was observed as a continuous marginal
decrease in the CO2 concentrations, when no CO was yet fed to the cell. Depending
on how often the humidifier was filled with “fresh water”, it took more or less time
for the CO2 concentration to reach a steady state value.
Table 11 - Identified sources of CO2 at the anode inlet and outlet during the study.
CO2 sources Action taken to minimize its effectand/or recommendation Observations
Low purity H2
(Anode inlet) Use H2 5.0 (99.999% purity) or higher
Low purity H2 may contain CO2.Different CO2 concentrationsGC if H2 bottles with differentcompositions are used.
Water of theanodehumidifier(Anode inlet)
Fill the anode humidifier in thebeginning of every experiment, thenclose water supply and allow fordegassing
CO2 may be dissolved in thewater. Continuously decreasingCO2 concentrations can bemeasured with the CG as theCO2 is released.
Synthetic airused for airbleed(Anode inlet)
Use bottled synthetic air (80% N2 and20% O2) or measure constantly thecomposition of the synthetic airproduced on-site
The synthetic air used for theair bleed may contain differentamounts of CO2 depending onhow it is produced.
Cathode(Anodeoutlet)
Quantify CO2 crossover in situ or exsitu or use bottled synthetic air
CO2 permeates from thecathode during PEMFCoperation
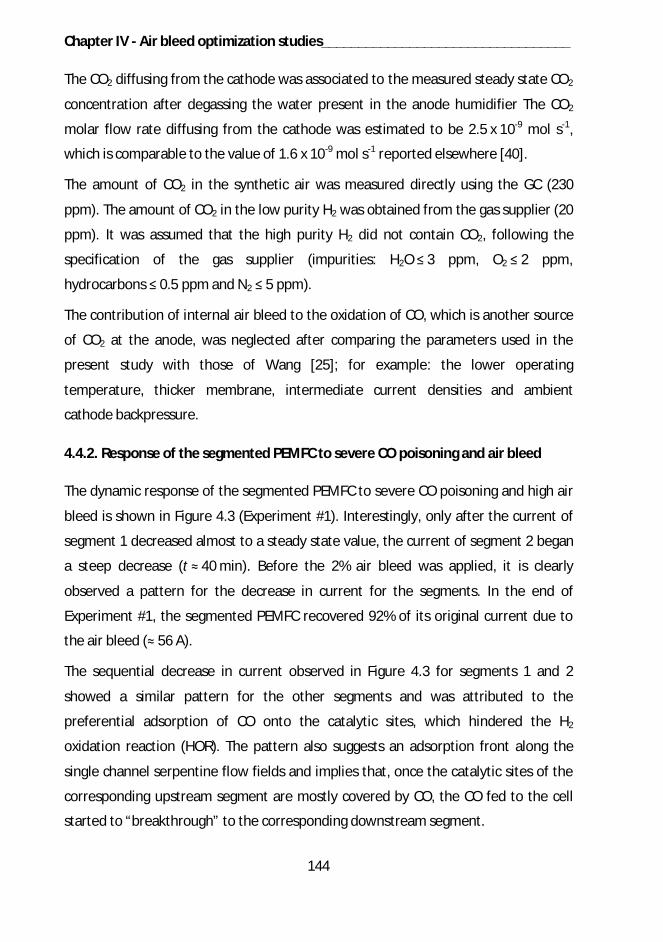
Chapter IV - Air bleed optimization studies__________________________________
144
The CO2 diffusing from the cathode was associated to the measured steady state CO2
concentration after degassing the water present in the anode humidifier The CO2
molar flow rate diffusing from the cathode was estimated to be 2.5 x 10⁻⁹ mol s-1,
which is comparable to the value of 1.6 x 10⁻⁹ mol s-1 reported elsewhere [40].
The amount of CO2 in the synthetic air was measured directly using the GC (230
ppm). The amount of CO2 in the low purity H2 was obtained from the gas supplier (20
ppm). It was assumed that the high purity H2 did not contain CO2, following the
specification of the gas supplier (impurities: H2O 3 ppm, O2 2 ppm,
hydrocarbons 0.5 ppm and N2 5 ppm).
The contribution of internal air bleed to the oxidation of CO, which is another source
of CO2 at the anode, was neglected after comparing the parameters used in the
present study with those of Wang [25]; for example: the lower operating
temperature, thicker membrane, intermediate current densities and ambient
cathode backpressure.
4.4.2. Response of the segmented PEMFC to severe CO poisoning and air bleed
The dynamic response of the segmented PEMFC to severe CO poisoning and high air
bleed is shown in Figure 4.3 (Experiment #1). Interestingly, only after the current of
segment 1 decreased almost to a steady state value, the current of segment 2 began
a steep decrease (t 40 min). Before the 2% air bleed was applied, it is clearly
observed a pattern for the decrease in current for the segments. In the end of
Experiment #1, the segmented PEMFC recovered 92% of its original current due to
the air bleed ( 56 A).
The sequential decrease in current observed in Figure 4.3 for segments 1 and 2
showed a similar pattern for the other segments and was attributed to the
preferential adsorption of CO onto the catalytic sites, which hindered the H2
oxidation reaction (HOR). The pattern also suggests an adsorption front along the
single channel serpentine flow fields and implies that, once the catalytic sites of the
corresponding upstream segment are mostly covered by CO, the CO fed to the cell
started to “breakthrough” to the corresponding downstream segment.
__________________________________Chapter IV - Air bleed optimization studies
145
The term “breakthrough” was adopted in the present study due to its similarity of
the phenomenon observed here with that occurring in fixed-bed adsorption columns
[41]. In practice, the last indicates that in PEMFCs feed with CO, the anode catalyst
layer behaves as an adsorption column (CO filter) as long as there is no significant
conversion of CO to CO2 due to the internal or external air bleeding. The CO
breakthrough is clearly observed on the molar flow rate estimations presented
below.
Figure 4.3. Response of the segmented PEMFC to severe CO poisoning and high air bleed. TheCO concentration at the anode inlet was 16 ppm. Lower quality H2 was used in this test(amount of impurities: O2 < 20 ppm, H2O < 20 ppm, CO2 < 20 ppm, N2 < 500 ppm). Otherexperimental conditions as in Table 10.
Figure 4.4 shows the CO breakthrough curve for Experiment #1. The same time scales
have been used to facilitate comparison with Figure 4.3. At t = 86.3 min, the CO
molar flow rate at the anode outlet started increasing gradually, indicating that the
CO breakthrough was reached when the current of segment 3 decreased to 51% of
its original value (7.5 A - Figure 4.3). The CO molar flow rate at the outlet reached a
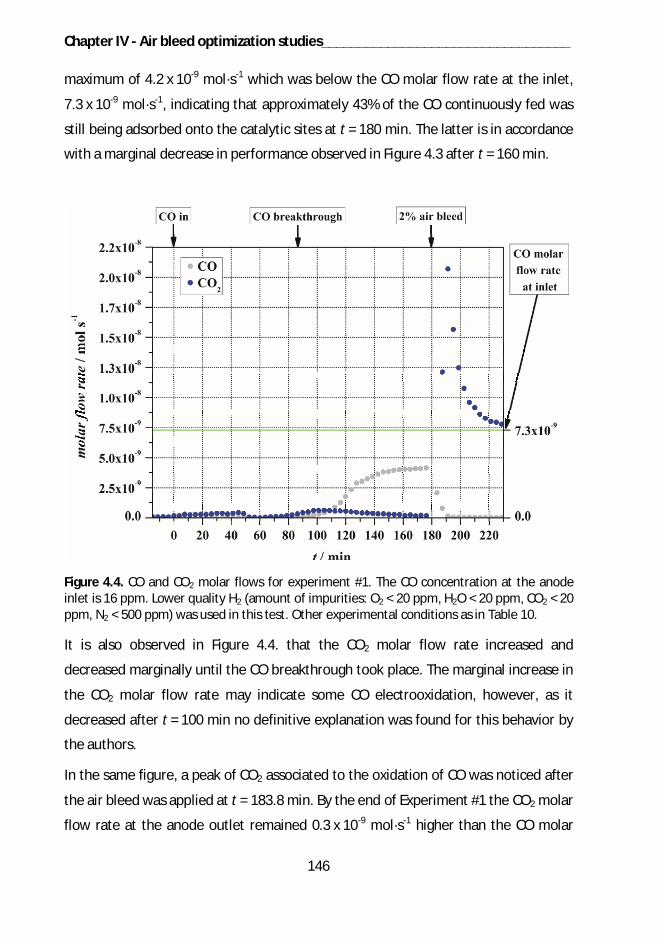
Chapter IV - Air bleed optimization studies__________________________________
146
maximum of 4.2 x 10⁻⁹ mol·s-1 which was below the CO molar flow rate at the inlet,
7.3 x 10⁻⁹ mol·s-1, indicating that approximately 43% of the CO continuously fed was
still being adsorbed onto the catalytic sites at t = 180 min. The latter is in accordance
with a marginal decrease in performance observed in Figure 4.3 after t = 160 min.
Figure 4.4. CO and CO2 molar flows for experiment #1. The CO concentration at the anodeinlet is 16 ppm. Lower quality H2 (amount of impurities: O2 < 20 ppm, H2O < 20 ppm, CO2 < 20ppm, N2 < 500 ppm) was used in this test. Other experimental conditions as in Table 10.
It is also observed in Figure 4.4. that the CO2 molar flow rate increased and
decreased marginally until the CO breakthrough took place. The marginal increase in
the CO2 molar flow rate may indicate some CO electrooxidation, however, as it
decreased after t = 100 min no definitive explanation was found for this behavior by
the authors.
In the same figure, a peak of CO2 associated to the oxidation of CO was noticed after
the air bleed was applied at t = 183.8 min. By the end of Experiment #1 the CO2 molar
flow rate at the anode outlet remained 0.3 x 10⁻⁹ mol·s-1 higher than the CO molar
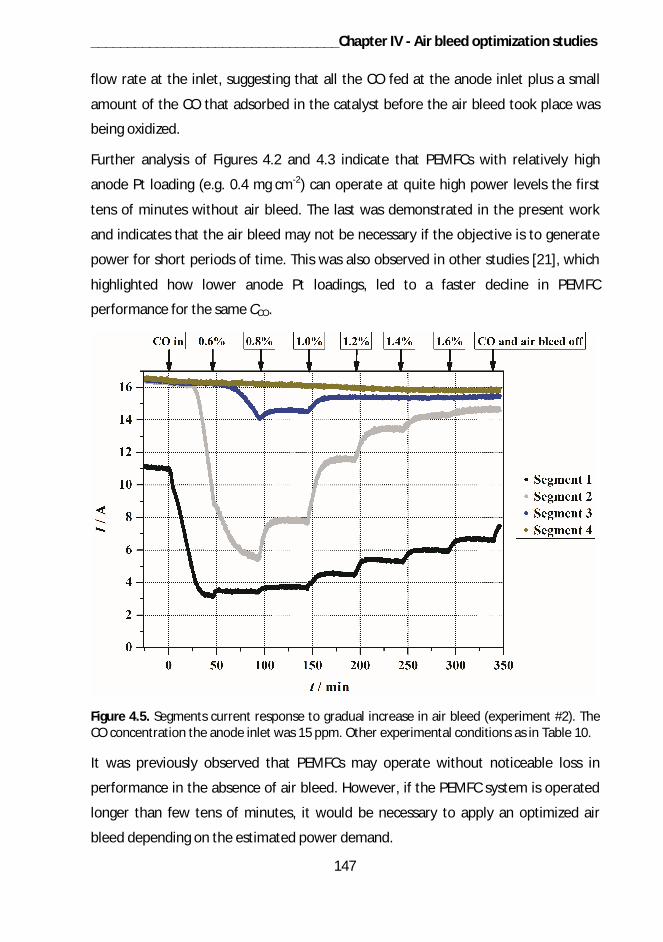
__________________________________Chapter IV - Air bleed optimization studies
147
flow rate at the inlet, suggesting that all the CO fed at the anode inlet plus a small
amount of the CO that adsorbed in the catalyst before the air bleed took place was
being oxidized.
Further analysis of Figures 4.2 and 4.3 indicate that PEMFCs with relatively high
anode Pt loading (e.g. 0.4 mg cm-2) can operate at quite high power levels the first
tens of minutes without air bleed. The last was demonstrated in the present work
and indicates that the air bleed may not be necessary if the objective is to generate
power for short periods of time. This was also observed in other studies [21], which
highlighted how lower anode Pt loadings, led to a faster decline in PEMFC
performance for the same CCO.
Figure 4.5. Segments current response to gradual increase in air bleed (experiment #2). TheCO concentration the anode inlet was 15 ppm. Other experimental conditions as in Table 10.
It was previously observed that PEMFCs may operate without noticeable loss in
performance in the absence of air bleed. However, if the PEMFC system is operated
longer than few tens of minutes, it would be necessary to apply an optimized air
bleed depending on the estimated power demand.
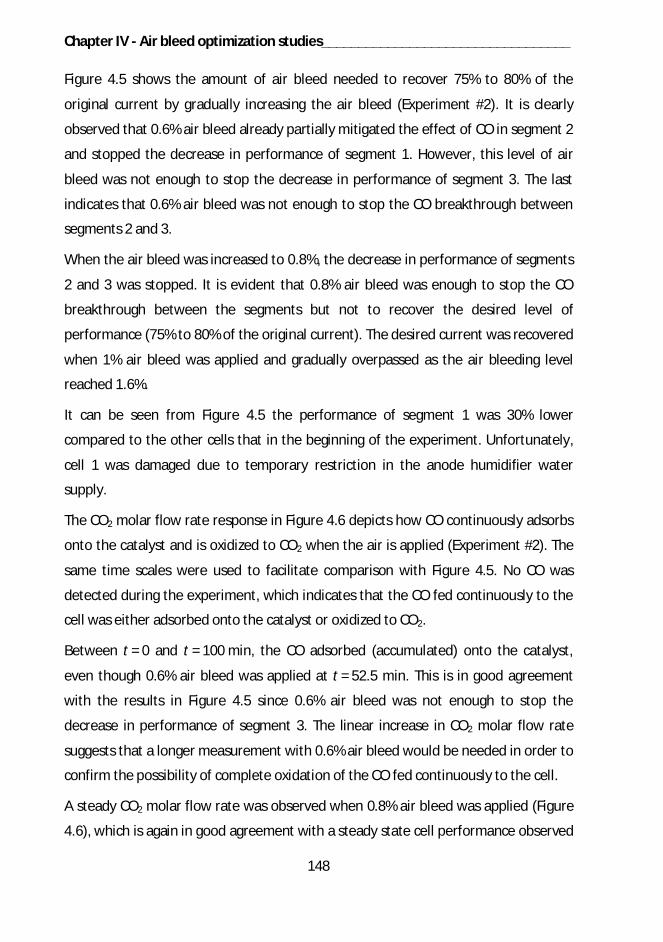
Chapter IV - Air bleed optimization studies__________________________________
148
Figure 4.5 shows the amount of air bleed needed to recover 75% to 80% of the
original current by gradually increasing the air bleed (Experiment #2). It is clearly
observed that 0.6% air bleed already partially mitigated the effect of CO in segment 2
and stopped the decrease in performance of segment 1. However, this level of air
bleed was not enough to stop the decrease in performance of segment 3. The last
indicates that 0.6% air bleed was not enough to stop the CO breakthrough between
segments 2 and 3.
When the air bleed was increased to 0.8%, the decrease in performance of segments
2 and 3 was stopped. It is evident that 0.8% air bleed was enough to stop the CO
breakthrough between the segments but not to recover the desired level of
performance (75% to 80% of the original current). The desired current was recovered
when 1% air bleed was applied and gradually overpassed as the air bleeding level
reached 1.6%.
It can be seen from Figure 4.5 the performance of segment 1 was 30% lower
compared to the other cells that in the beginning of the experiment. Unfortunately,
cell 1 was damaged due to temporary restriction in the anode humidifier water
supply.
The CO2 molar flow rate response in Figure 4.6 depicts how CO continuously adsorbs
onto the catalyst and is oxidized to CO2 when the air is applied (Experiment #2). The
same time scales were used to facilitate comparison with Figure 4.5. No CO was
detected during the experiment, which indicates that the CO fed continuously to the
cell was either adsorbed onto the catalyst or oxidized to CO2.
Between t = 0 and t = 100 min, the CO adsorbed (accumulated) onto the catalyst,
even though 0.6% air bleed was applied at t = 52.5 min. This is in good agreement
with the results in Figure 4.5 since 0.6% air bleed was not enough to stop the
decrease in performance of segment 3. The linear increase in CO2 molar flow rate
suggests that a longer measurement with 0.6% air bleed would be needed in order to
confirm the possibility of complete oxidation of the CO fed continuously to the cell.
A steady CO2 molar flow rate was observed when 0.8% air bleed was applied (Figure
4.6), which is again in good agreement with a steady state cell performance observed
__________________________________Chapter IV - Air bleed optimization studies
149
in Figure 4.5 between t = 97.5 min and t = 146.3 min. This result indicates that 0.8%
air bleed was enough to oxidize the CO fed continuously to the cell so that no net
accumulation of CO on the catalyst surface was taking place.
When higher air bleeds were applied (> 1%), a sudden increase followed by a
decrease in the CO2 molar flow rate was observed for each successive air bleed value
– Figure 4.6. Since the CO2 molar flow rates were always higher than 7.3 x 10⁻⁹ mol·s-
1, this behavior was associated to the oxidation of the CO that was adsorbed onto the
catalyst surface before t = 97.5 min.
Figure 4.6. CO2 molar flow rate responses to gradual increase in air bleed (Experiment #2).The CO concentration the anode inlet is 15 ppm. Other experimental conditions as inTable 10. No CO was detected at the anode outlet.
The analysis of Figures 4.5. and 4.6. clearly highlights three trends for CO oxidation
when air bleed is applied: accumulation – insufficient air bleed, steady state –
enough air bleed to oxidize the CO fed continuously to the cell – and removal – active
oxidation of previously adsorbed CO.
Chapter IV - Air bleed optimization studies__________________________________
150
4.4.3. Quantitative analysis of CO adsorption, breakthrough and oxidization
A more detailed quantification of the amount of CO adsorbed onto the catalyst
surface would help to estimate the fraction of catalytic sites covered by CO which can
be useful in determining the catalyst utilization factor and the catalyst effectiveness
factor [42] if desired.
The quantification of CO is a challenging task as it is necessary to consider accurately
all exogenous sources of CO2 (Section 3.1) before performing a mass balance
involving the amount of CO adsorbed, CO that slipped due to the breakthrough and
CO oxidized. Great effort has been put by other groups to assess the CO mass
balance in PEMFCs [40, 48]. Nonetheless this is the first time, to the knowledge of the
authors, that the CO oxidized due to external air bleed is included in such analysis. An
attempt to estimate the amount of CO (mol) adsorbed onto the catalyst surface and
the fraction of catalytic sites covered by CO for Experiments #1 and #2 was
performed below.
The CO mass balance was achieved using the information of Figures 4.4 and 4.6. It
was first necessary to discriminate the time periods when the CO was adsorbing,
oxidizing or slipping due to breakthrough. After this, the areas under each curve were
delimited, each of which corresponded to an amount of CO. Finally, the amount of
CO was determined following a fitting and integrating process for every single area.
Figure 4.7 highlights the areas considered to perfrom the CO mass balances for
Experiments #1 and #2. Whenever the CO molar flow rate was below 7.3 x 10⁻⁹ mol·s-
1, either the CO was adsorbed (A1 – Figure 4.7a) or the CO breakthrough occurred (A2
– Figure 4.7a). It was assumed that above this value the CO2 molar flow rate
corresponded to the CO oxidized (A3 – Figure 4.7a). The areas depicted in Figure 4.7b
were delimited using the same assumptions; nonetheless, no CO breakthrough was
observed here due to the characteristics of the experiment.
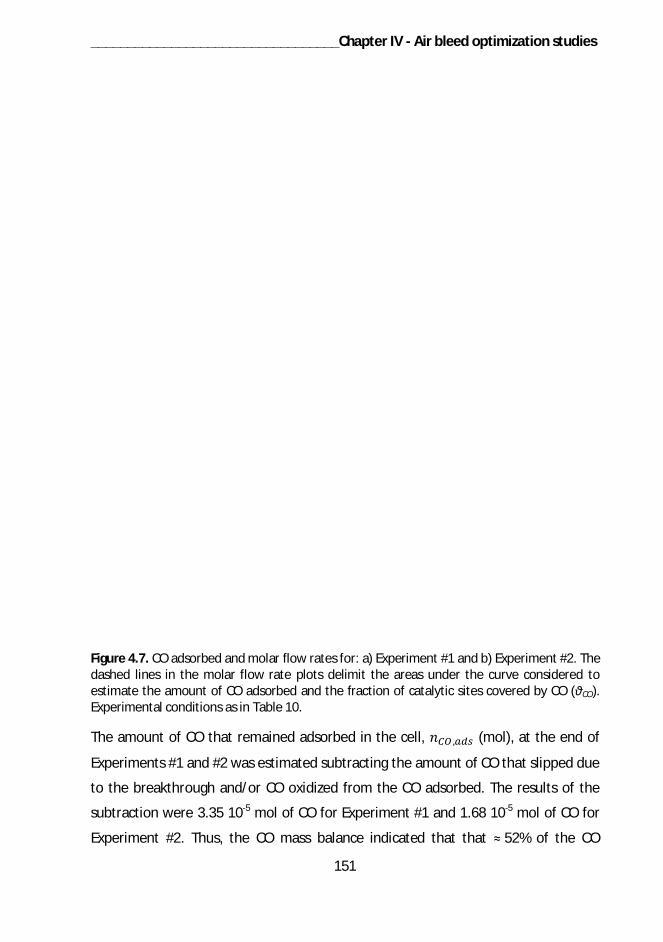
__________________________________Chapter IV - Air bleed optimization studies
151
Figure 4.7. CO adsorbed and molar flow rates for: a) Experiment #1 and b) Experiment #2. Thedashed lines in the molar flow rate plots delimit the areas under the curve considered toestimate the amount of CO adsorbed and the fraction of catalytic sites covered by CO ( CO).Experimental conditions as in Table 10.
The amount of CO that remained adsorbed in the cell, , (mol), at the end of
Experiments #1 and #2 was estimated subtracting the amount of CO that slipped due
to the breakthrough and/or CO oxidized from the CO adsorbed. The results of the
subtraction were 3.35 10-5 mol of CO for Experiment #1 and 1.68 10-5 mol of CO for
Experiment #2. Thus, the CO mass balance indicated that that 52% of the CO
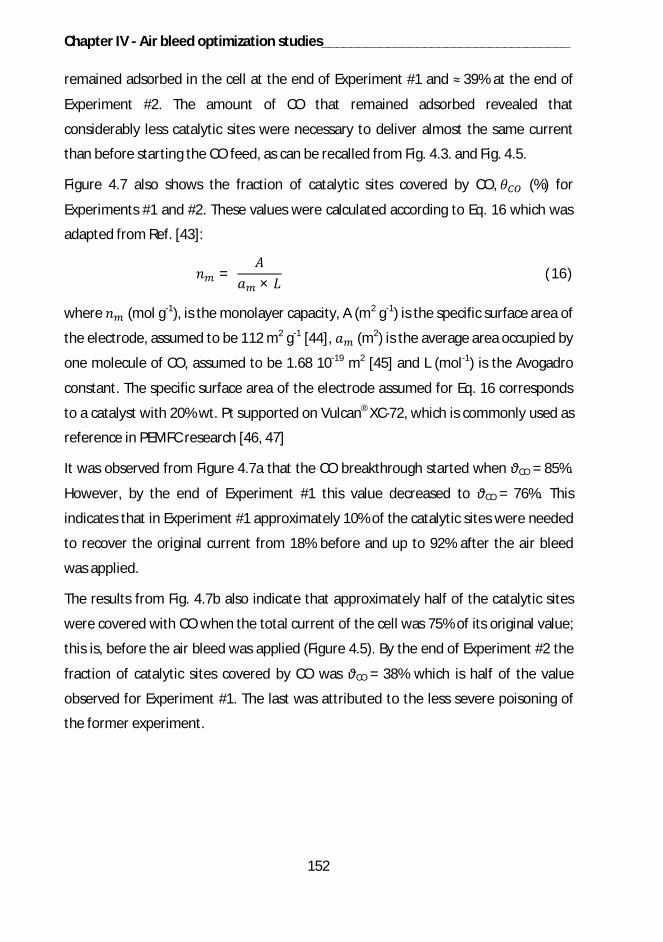
Chapter IV - Air bleed optimization studies__________________________________
152
remained adsorbed in the cell at the end of Experiment #1 and 39% at the end of
Experiment #2. The amount of CO that remained adsorbed revealed that
considerably less catalytic sites were necessary to deliver almost the same current
than before starting the CO feed, as can be recalled from Fig. 4.3. and Fig. 4.5.
Figure 4.7 also shows the fraction of catalytic sites covered by CO, (%) for
Experiments #1 and #2. These values were calculated according to Eq. 16 which was
adapted from Ref. [43]:
=×
(16)
where (mol g-1), is the monolayer capacity, A (m2 g-1) is the specific surface area of
the electrode, assumed to be 112 m2 g-1 [44], (m2) is the average area occupied by
one molecule of CO, assumed to be 1.68 10-19 m2 [45] and L (mol-1) is the Avogadro
constant. The specific surface area of the electrode assumed for Eq. 16 corresponds
to a catalyst with 20% wt. Pt supported on Vulcan® XC-72, which is commonly used as
reference in PEMFC research [46, 47]
It was observed from Figure 4.7a that the CO breakthrough started when CO = 85%.
However, by the end of Experiment #1 this value decreased to CO = 76%. This
indicates that in Experiment #1 approximately 10% of the catalytic sites were needed
to recover the original current from 18% before and up to 92% after the air bleed
was applied.
The results from Fig. 4.7b also indicate that approximately half of the catalytic sites
were covered with CO when the total current of the cell was 75% of its original value;
this is, before the air bleed was applied (Figure 4.5). By the end of Experiment #2 the
fraction of catalytic sites covered by CO was CO = 38% which is half of the value
observed for Experiment #1. The last was attributed to the less severe poisoning of
the former experiment.
__________________________________Chapter IV - Air bleed optimization studies
153
4.4.4. Air bleed applied to different hydrogen volumetric flow rates
Different H2 volumetric flow rates were tested to see how the dynamics of CO
adsorption and the recovery by air bleed changed. Figure 4.8 shows how the
distributed performance of the segmented PEMFC is affected by the CCO, the H2
volumetric flow rate influence and the amount of air bleed (Experiments #3, #4 and
#5). Only the performances of segments 1, 2 and 3 were plotted since the response
of segment 4 remained constant during all the experiments.
Figure 4.8. Normalized current ratios as a function of time for Experiments #3 (a – low H2 flowrate), #4 (b – intermediate H2 flow rate) and #5 (c – high H2 flow rate). The molar flow rate ofCO at the anode inlet was 7.3 x 10⁻⁹ mol s-1 for all experiments. Experimental conditions as inTable 10.
The normalized current ratio was adopted to facilitate comparison and because the
current of segment 1 did not reach the same value in the beginning of each
experiment. Other research groups have reported the same type of plots to highlight
the effect of CO on operating PEMFCs [15, 21].
Chapter IV - Air bleed optimization studies__________________________________
154
The response of segments 2 and 3 was different for every experiment when 0.8% air
bleed was applied. With CCO = 19 ppm (low H2 flow rate), 0.8% air bleed was not
enough to stop the decrease in performance of segment 3, highlighting the CO
breakthrough in segment 2. For CCO = 15 ppm (intermediate H2 flow rate), 0.8% air
bleed was also not enough to stop the decrease in performance of segment 3,
however, the decrease in performance was less pronounced than in the previous
case. With CCO = 13 ppm (high H2 flow rate), 0.8% air bleed was enough to stop the
decrease in performance of segment 3, indicating that the CO fed continuously to the
cell was oxidized and that the CO breakthrough was stopped.
The results in Figure 4.8 show that the H2 volumetric flow rate influences not only the
extent and severity of CO poisoning but also the extent and effectiveness of air bleed
along the active area of the MEA. It is observed that at lower H2 volumetric flow
rates, the severity of CO poisoning was more pronounced in segments 2 and 3. It is
important to highlight that the air bleed was fixed to the H2 volumetric flow rate so
proportionally more O2 from the air bleed was fed to the cell at higher H2 volumetric
flow rates. However, the molar flow rate of CO at the anode inlet was the same for
all experiments.
When looking for a reason to the results in Figure 4.8, it was found that the extent
and severity of CO poisoning has been studied numerically [10, 11]. Those authors
stated that the extent and severity of CO was influenced by two related parameters
namely: the mean gas velocity (residence time) of the gas in the flow field channels
[10] and the H2 stoichiometric flow rate (decrease in H2 partial pressure towards the
anode outlet) [11]. The experimental results presented here suggest that at higher H2
flow rates, the CO adsorption front extended further and faster downstream the
anode flow field. In the same way, it can be said that less severe implications in the
local performance were observed also for higher H2 flow rates, which implies a more
even distribution of CO inside the cell.
Figure 4.9 compares the CO2 molar flow rates at the anode outlet for the cases with
different CCO and H2 volumetric flow rates (Experiments #3, #4 and #5). When 0.8%
air bleed was applied to the cases with CCO = 19 ppm and 15 ppm (low and
intermediate H2 flow rates) the average CO2 molar flow rates at the outlet were
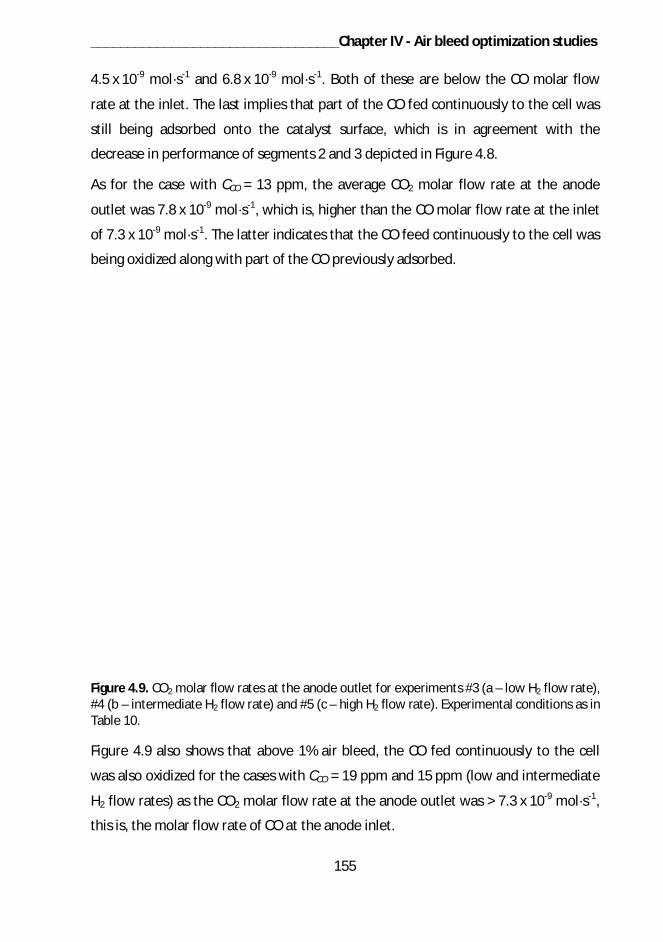
__________________________________Chapter IV - Air bleed optimization studies
155
4.5 x 10⁻⁹ mol·s-1 and 6.8 x 10⁻⁹ mol·s-1. Both of these are below the CO molar flow
rate at the inlet. The last implies that part of the CO fed continuously to the cell was
still being adsorbed onto the catalyst surface, which is in agreement with the
decrease in performance of segments 2 and 3 depicted in Figure 4.8.
As for the case with CCO = 13 ppm, the average CO2 molar flow rate at the anode
outlet was 7.8 x 10⁻⁹ mol·s-1, which is, higher than the CO molar flow rate at the inlet
of 7.3 x 10⁻⁹ mol·s-1. The latter indicates that the CO feed continuously to the cell was
being oxidized along with part of the CO previously adsorbed.
Figure 4.9. CO2 molar flow rates at the anode outlet for experiments #3 (a – low H2 flow rate),#4 (b – intermediate H2 flow rate) and #5 (c – high H2 flow rate). Experimental conditions as inTable 10.
Figure 4.9 also shows that above 1% air bleed, the CO fed continuously to the cell
was also oxidized for the cases with CCO = 19 ppm and 15 ppm (low and intermediate
H2 flow rates) as the CO2 molar flow rate at the anode outlet was > 7.3 x 10⁻⁹ mol·s-1,
this is, the molar flow rate of CO at the anode inlet.
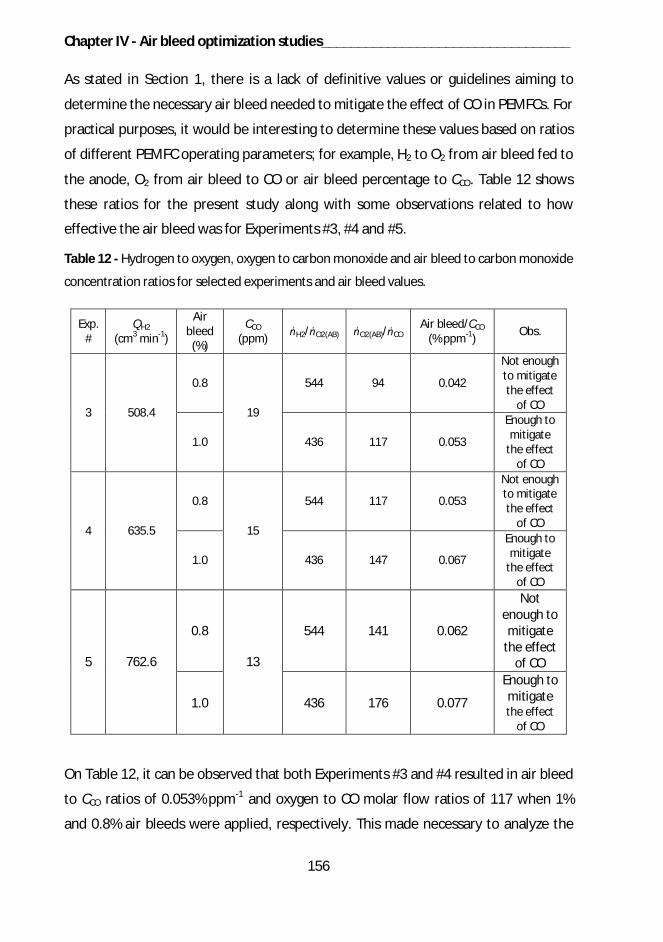
Chapter IV - Air bleed optimization studies__________________________________
156
As stated in Section 1, there is a lack of definitive values or guidelines aiming to
determine the necessary air bleed needed to mitigate the effect of CO in PEMFCs. For
practical purposes, it would be interesting to determine these values based on ratios
of different PEMFC operating parameters; for example, H2 to O2 from air bleed fed to
the anode, O2 from air bleed to CO or air bleed percentage to CCO. Table 12 shows
these ratios for the present study along with some observations related to how
effective the air bleed was for Experiments #3, #4 and #5.
Table 12 - Hydrogen to oxygen, oxygen to carbon monoxide and air bleed to carbon monoxide
concentration ratios for selected experiments and air bleed values.
Exp.#
QH2
(cm3 min-1)
Airbleed
(%)
CCO
(ppm) H2/ O2(AB) O2(AB)/ COAir bleed/CCO
(% ppm-1) Obs.
3 508.4
0.8
19
544 94 0.042
Not enoughto mitigatethe effect
of CO
1.0 436 117 0.053
Enough tomitigate
the effectof CO
4 635.5
0.8
15
544 117 0.053
Not enoughto mitigatethe effect
of CO
1.0 436 147 0.067
Enough tomitigate
the effectof CO
5 762.6
0.8
13
544 141 0.062
Notenough tomitigate
the effectof CO
1.0 436 176 0.077
Enough tomitigatethe effect
of CO
On Table 12, it can be observed that both Experiments #3 and #4 resulted in air bleed
to CCO ratios of 0.053% ppm-1 and oxygen to CO molar flow ratios of 117 when 1%
and 0.8% air bleeds were applied, respectively. This made necessary to analyze the
__________________________________Chapter IV - Air bleed optimization studies
157
distributed performance of the cell (Figure 4.8) and compare the average CO2 molar
flow rates at the anode outlet (Figure 4.9). The average CO2 molar flow rates at the
anode outlet for Experiment #3 with 1% air bleed was 7.9 x 10⁻⁹ mol·s-1 while for
Experiment #4 with 0.8% air bleed was 6.0 x 10⁻⁹ mol·s-1. So that, the effect of CO was
mitigated for Experiment #3 with 1% air bleed as expected. Finally, it is important to
note that the only differences between Experiments #3 and #4 are the CCO and QH2.
The latter highlights the importance of these two parameters when trying to mitigate
the effect of CO using an external air bleed.
4.5. Conclusions
A methodology to determine the amount of air bleed needed to mitigate the effect
of CO in PEMFCs was developed. The methodology is based on the analysis of the
distributed performance of the cell and the estimation of the CO2 molar flow rates at
the anode inlet and outlet, which was assessed using a gas chromatograph.
It was demonstrated that this methodology is suitable for studying the following
aspects: i) the amount of air bleed needed to recover a desired level of performance
of PEMFCs with continuous CO feed, ii) the amount of air bleed needed to oxidize the
CO feed on a molar flow basis for different H2 flow rates, iii) the amount of CO
adsorbed/desorbed during a certain period of time and iv) the fraction of catalytic
sites covered by CO.
Some similarities between the adsorption of CO in operating PEMFC and fixed-bed
adsorption columns were stressed. Hence, the term CO breakthrough was associated
to the point where the CO could no longer accumulate onto the catalyst surface. The
CO breakthrough determined the extent and severity of the CO adsorption onto the
catalyst along the single channel serpentine flow fields.
It was observed that the flow rate of H2 affects both the extent and severity of the CO
adsorption as well as the effectiveness of the air bleed. In order to assess the
minimum amount of air bleed needed to oxidize the CO feed, it was necessary to
estimate the CO2 molar flow rate at the anode outlet.
Chapter IV - Air bleed optimization studies__________________________________
158
It was noted that the air bleed value to CO concentration ratio (% ppm-1) or the
oxygen to CO molar flow ratio at the anode inlet could be misleading approaches to
find the minimum air bleed levels needed to oxidize the CO feed. For the cases
studied here, the decrease in performance attributed to CO was mitigated whenever
the H2 to oxygen molar flow ratio at the anode inlet was < 544, the oxygen to CO
molar flow ratio at the anode inlet was 117 and the air bleed to CO concentration
ratio was 0.053% ppm-1.
4.6. Acknowledgements
This research has been conducted under the “Fuel Cell 2007-2013” technology
program of Tekes, the Finnish Funding Agency for Technology and Innovation.
Luis C. Pérez is grateful to FCT for his PhD grant reference SFRH/BD/44684/2008.
Financial support by FCT through projects PTDC/EQU-EQU/104217/2008 and
PTDC/CTM/108454/2008 is also acknowledged. Luis C. Pérez is also grateful to
CONACyT for its support.
__________________________________Chapter IV - Air bleed optimization studies
159
4.7. References
[1] Dicks AL. PEM Fuel Cells: Applications. In: Comprehensive Renewable Energy.
Sayigh A, Cruden A, editors. Oxford: Elsevier Ltd; 2012, p. 203-245.
[2] Pollet BG, Staffell I, Shang JL. Current status of hybrid, battery and fuel cell electric
vehicles: From electrochemistry to market prospects. Electrochim Acta 2012, 84:235-
249.
[3] Yuan X-Z, Li H, Zhang S, Martin J, Wang H. A review of polymer electrolyte
membrane fuel cell durability test protocols. J Power Sources 2011, 196:9107-9116.
[4] Yu Y, Li H, Wang H, Yuan X-Z, Wang G, Pan M. A review on performance
degradation of proton exchange membrane fuel cells during startup and shutdown
processes: Causes, consequences, and mitigation strategies. J Power Sources 2012,
205:10-23.
[5] Staffell I, Green R. The cost of domestic fuel cell micro-CHP systems. Int J
Hydrogen Energy 2013, 38:1088-1102.
[6] Wang G. Advanced vehicles: Costs, energy use, and macroeconomic impacts. J
Power Sources 2011, 196:530-540.
[7] Ellram LM. Total cost of ownership: an analysis approach for purchasing. Int J Phys
Distrib Logist Manag 1995, 25:4 - 23.
[8] Besancon BM, Hasanov V, Imbault-Lastapis R, Benesch R, Barrio M, Mølnvik MJ.
Hydrogen quality from decarbonized fossil fuels to fuel cells. Int J Hydrogen Energy
2009, 34:2350-2360.
[9] Zamel N, Li X. Effect of contaminants on polymer electrolyte membrane fuel cells.
Prog Energy and Combust Sci 2011, 37:292-329.
[10] Brett DJL, Aguiar P, Brandon NP, Kucernak AR. Measurement and modelling of
carbon monoxide poisoning distribution within a polymer electrolyte fuel cell. Int J
Hydrogen Energy 2007, 32:863-871.
Chapter IV - Air bleed optimization studies__________________________________
160
[11] Bonnet C, Franck-Lacaze L, Ronasi S, Besse S, Lapicque F. PEM fuel cell Pt anode
inhibition by carbon monoxide: Non-uniform behaviour of the cell caused by the
finite hydrogen excess. Chem Eng Sci 2010, 65:3050-3058.
[12] Tingelöf T, Hedström L, Holmström N, Alvfors P, Lindbergh G. The influence of
CO2, CO and air bleed on the current distribution of a polymer electrolyte fuel cell.
Int J Hydrogen Energy 2008, 33:2064-2072.
[13] Murahashi T, Mitsumoto T, Nishiyama E: Current Distribution of a PEMFC under
CO Poisoning. ECS Transactions 2009, 25:869-879.
[14] Boaventura M, Sander H, Friedrich KA, Mendes A. The influence of CO on the
current density distribution of high temperature polymer electrolyte membrane fuel
cells. Electrochim Acta 2011, 56:9467-9475.
[15] Reshetenko TV, Bethune K, Rocheleau R. Spatial proton exchange membrane
fuel cell performance under carbon monoxide poisoning at a low concentration using
a segmented cell system. J Power Sources 2012, 218:412-423.
[16] Ehteshami SMM, Chan SH. A review of electrocatalysts with enhanced CO
tolerance and stability for polymer electrolyte membarane fuel cells. Electrochim
Acta 2013, 93:334-345.
[17] Adams WA, Blair J, Bullock KR, Gardner CL. Enhancement of the performance
and reliability of CO poisoned PEM fuel cells. J Power Sources 2005, 145:55-61.
[18] Tsampas MN, Sapountzi FM, Divane S, Papaioannou EI, Vayenas CG. Triode
operation of CO poisoned PEM fuel cells: Fixed and cyclic potential triode operation.
Solid State Ionics 2012, 225:272-276.
[19] Gottesfeld S, Pafford J. A New Approach to the Problem of Carbon Monoxide
Poisoning in Fuel Cells Operating at Low Temperatures. J Electrochem Soc 1988,
135:2651-2652.
[20] Uribe FA, Valerio JA, Garzon FH, Zawodzinski TA. PEMFC Reconfigured Anodes
for Enhancing CO Tolerance with Air Bleed. Electrochem and Solid-State Lett 2004,
7:A376-A379.
__________________________________Chapter IV - Air bleed optimization studies
161
[21] Hashimasa Y, Matsuda Y, Akai M. Effects of Platinum Loading on PEFC Power
Generation Performance Deterioration by Carbon Monoxide in Hydrogen Fuel. ECS
Transactions 2010, 26:131-142.
[22] Knights S, Bashyam R, He P, Lauritzen M, Startek C, Colbow V, Cheng T, Kolodziej
J, Wessel S. PEMFC MEA and System Design Considerations. ECS Transactions 2011,
41:39-53.
[23] Bashyam R, He P, Wessel S, Knights S. Impacts of Cathode Loading on Ru
Crossover Related PEFC Durability. ECS Transactions 2011, 41:837-844.
[24] Inaba M, Sugishita M, Wada J, Matsuzawa K, Yamada H, Tasaka A. Impacts of air
bleeding on membrane degradation in polymer electrolyte fuel cells. J Power Sources
2008, 178:699-705.
[25] Wang W. The effect of internal air bleed on CO poisoning in a proton exchange
membrane fuel cell. J Power Sources 2009, 191:400-406.
[26] Gubler L, Scherer GG, Wokaun A. Effects of cell and electrode design on the CO
tolerance of polymer electrolyte fuel cells. Phys Chem Chem Phys 2001, 3:325-329.
[27] Murthy M, Esayian M, Lee W-k, Van Zee JW. The Effect of Temperature and
Pressure on the Performance of a PEMFC Exposed to Transient CO Concentrations. J
Electrochem Soc 2003, 150:A29-A34.
[28] Chu H-S, Tsau F, Yan Y-Y, Hsueh K-L, Chen F-L. The development of a small
PEMFC combined heat and power system. J Power Sources 2008, 176:499-514.
[29] Yim S-D, Sohn Y-J, Yoon Y-G, Um S, Kim C-S, Lee W-Y. Operating characteristics of
40W-class PEMFC stacks using reformed gas under low humidifying conditions. J
Power Sources 2008, 178:711-715.
[30] Chung C-C, Chen C-H, Weng D-Z. Development of an air bleeding technique and
specific duration to improve the CO tolerance of proton-exchange membrane fuel
cells. Appl Therm Eng 2009, 29:2518-2526.
[31] Hedström L, Tingelöf T, Alvfors P, Lindbergh G. Experimental results from a 5 kW
PEM fuel cell stack operated on simulated reformate from highly diluted
Chapter IV - Air bleed optimization studies__________________________________
162
hydrocarbon fuels: Efficiency, dilution, fuel utilisation, CO poisoning and design
criteria. Int J Hydrogen Energy 2009, 34:1508-1514.
[32] Sung L-Y, Hwang B-J, Hsueh K-L, Tsau F-H. Effects of anode air bleeding on the
performance of CO-poisoned proton-exchange membrane fuel cells. J Power Sources
2010, 195:1630-1639.
[33] Scholta J, Pawlik J, Chmielewski N, Jörissen L. Longevity test results for reformate
polymer electrolyte membrane fuel cell stacks. J Power Sources 2011, 196:5264-
5271.
[34] Antolini E. The problem of Ru dissolution from Pt–Ru catalysts during fuel cell
operation: analysis and solutions. J Solid State Electrochem 2011, 15:455-472.
[35] Pérez LC, Brandão L, Sousa JM, Mendes A. Segmented polymer electrolyte
membrane fuel cells - A review. Renew Sust Energ Rev 2011, 15:169-185.
[36] Auvinen S, Tingelöf T, Ihonen JK, Siivinen J, Johansson M. Stainless Steel In-situ
Corrosion Testing in a PEFC Multisinglecell. ECS Transactions 2009, 25:1811-1821.
[37] Auvinen S, Tingelof T, Ihonen JK, Siivinen J. Cost Effective In-Situ Characterization
of Coatings for PEFC Bipolar Plates Demonstrated with PVD Deposited CrN. J
Electrochem Soc 2011, 158:B550-B556.
[38] Stumper J, Campbell SA, Wilkinson DP, Johnson MC, Davis M. In-situ methods for
the determination of current distributions in PEM fuel cells. Electrochim Acta 1998,
43:3773-3783.
[39] Weng FB, Jou BS, Li CW, Su A, Chan SH. The effect of low humidity on the
uniformity and stability of segmented PEM fuel cells. J Power Sources 2008, 181:251-
258.
[40] Bender G, Angelo M, Bethune K, Dorn S, Thampan T, Rocheleau R. Method using
gas chromatography to determine the molar flow balance for proton exchange
membrane fuel cells exposed to impurities. J Power Sources 2009, 193:713-722.
[41] Richardson JF, Harker JH, Backhurst JR. Chemical Engineering Vol. 2. 5th ed.
Oxford: Butterworth-Heinemann; 2002.
__________________________________Chapter IV - Air bleed optimization studies
163
[42] Chatenet M, Dubau L, Job N, Maillard F. The (electro)catalyst|membrane
interface in the Proton Exchange Membrane Fuel Cell: Similarities and differences
with non-electrochemical Catalytic Membrane Reactors. Catal Today 2010, 156:76-
86.
[43] Scholten JJF. The use of adsorption methods for the assessment of the surface
area and pore size distribution of heterogeneous catalysts. In: Studies in Surface
Science and Catalysis. Moulijn JA, van Leeuwen PWNM, van Santen RA, editors.
Amsterdam: Elsevier Ltd; 1993, p. 419-438.
[44] Shioyama H. Carbon Materials used for Polymer Electrolyte Fuel Cells. In:
Handbook of Advanced Ceramics. Shigeyuki S, editor. Oxford: Academic Press; 2013,
p. 199-210.
[45] Emmett PH, Brunauer S. The Use of Low Temperature van der Waals Adsorption
Isotherms in Determining the Surface Area of Iron Synthetic Ammonia Catalysts. J Am
Chem Soc 1937, 59:1553-1564.
[46] Bashyam R, Zelenay P. A class of non-precious metal composite catalysts for fuel
cells. Nature 2006, 443:63-66.
[47] Shanahan PV, Xu L, Liang C, Waje M, Dai S, Yan YS. Graphitic mesoporous carbon
as a durable fuel cell catalyst support. J Power Sources 2008, 185:423-427.
[48] Angelo M, St-Pierre J, Bethune K, Rocheleau R. Gas Chromatography Study of
Reactions of Carbon Monoxide at Different Operating Temperatures within a PEMFC.
ECS Transactions 2011, 35:167-178.

164

165
Chapter V

166
__________________________________________Chapter V – CO poisoning studies
167
Chapter V - CO poisoning studies4
5.1. Abstract
In this work, the effect of fuel utilization on the carbon monoxide (CO) poisoning
dynamics is studied under expected future Polymer Electrolyte Membrane Fuel Cell
(PEMFC) automotive conditions. Three fuel utilizations, 70%, 40% and 25%, are used.
The CO is fed in a constant concentration mode of 1 ppm and in a constant molar
flow rate mode (CO concentrations between 0.18-0.57 ppm). The anode exhaust gas
composition is analyzed using a gas chromatograph. The results indicate that the CO
poisoning dynamics is strongly dependent on the fuel utilization for both CO feed
modes. When the fuel utilization is decreased, the molar flow rate of CO at the anode
outlet is increased, leading to a slower decrease in performance of the cell. The
decrease in performance of the fuel cell becomes even slower when the CO molar
flow rate is reduced. The results suggest that the effect of impurities in PEMFC
systems with fuel recirculation is determined by the dynamics of their enrichment in
the anode loop, so the accurate quantification of impurities limits in current
regulation (ISO 14687-2:2012) should be determined using this type of fuel delivery
configuration.
4 The content of this chapter is adapted from: Luis C. Pérez, Pauli Koski, Jari Ihonen, PauliKoski, José M. Sousa, Adélio Mendes, 2013. Effect of fuel utilization on the carbon monoxidepoisoning dynamics of PEMFC. Submitted to the Journal of Power Sources.

Chapter V – CO poisoning studies__________________________________________
168
5.2. Introduction
The heavy reliance on fossil fuels and increasing environmental concerns have raised
interest in Polymer Electrolyte Membrane Fuel Cells (PEMFC) for automotive
applications [1]. The main technical problems of PEMFC have been solved [2];
however, there is room to reduce costs and improve their durability [3, 4]. One still
sensible issue is related to the presence of impurities in the fuel and/or the oxidant
since they affect the performance and accelerate the degradation of PEMFC [5].
The composition of the fuel used in PEMFC is regulated according to its final
application. Current H2 fuel specifications for road vehicles, ISO 14687-2:2012 and
SAE J2719, limit the amount of impurities such as carbon monoxide (CO) to 0.2 ppm
and sulphur species, hydrogen sulphide (H2S) and sulphur dioxide (SO2), to 4 ppb.
Comply with these specifications hinders the market growth of PEMFC vehicles due
to increased cost of the fuel. This is especially true for the H2 produced via methane
steam reforming (MSR) [6] and purified using pressure swing adsorption (PSA) [7] as
it contains trace amounts of CO. This latter process of production and purification is
considered the lowest cost option for H2 production if reasonably priced methane is
available.The increase in cost due to the use of PSA comes from the fact that, the
lower the level of impurities required, the lower the H2 yield of the PSA system. This
is well illustrated in a paper by Besancon et al. [8].
CO is considered the most challenging impurity since it is difficult to separate and to
measure in a cost effective way at a concentration of 0.2 ppm. CO affects the
performance of PEMFC as it preferentially adsorbs onto the anode catalyst, hindering
the hydrogen oxidation reaction (HOR) [5]. This problem becomes critical when the
catalyst (platinum – Pt) loading is reduced. As shown by Gasteiger et al. [9], only 0.05
mg Pt·cm-2 or less would be needed for the anode in the absence of impurities.
Despite that, current membrane electrode assemblies (MEAs) of automotive PEMFC
systems have much higher Pt loadings [10]. Hashimasa et al. have shown that for
both CO [11] and H2S [12], the Pt loading has a dramatic influence on the catalyst
poisoning dynamics. Nevertheless, many of the most relevant studies in the literature
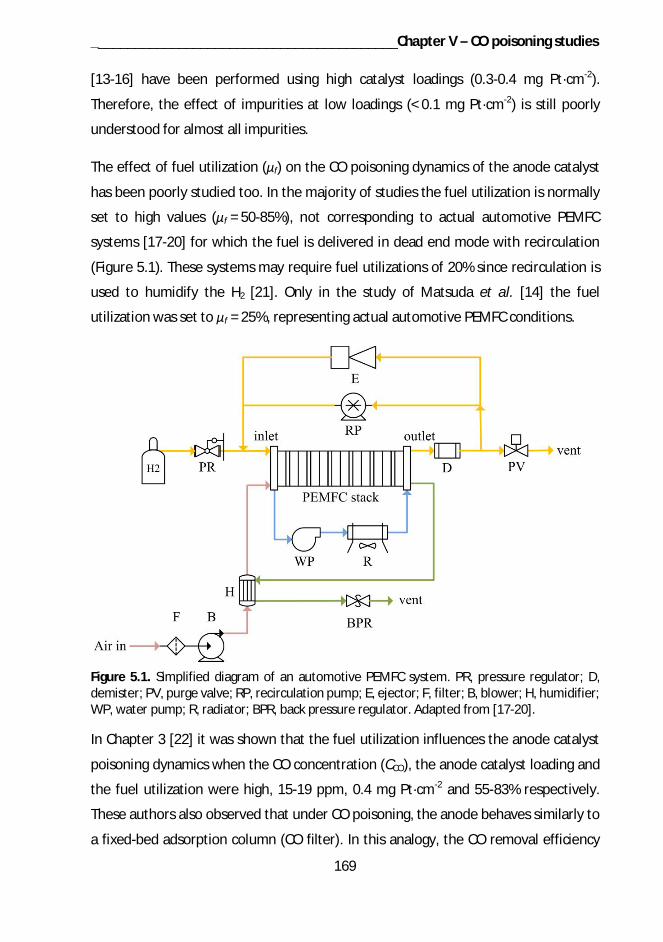
__________________________________________Chapter V – CO poisoning studies
169
[13-16] have been performed using high catalyst loadings (0.3-0.4 mg Pt·cm-2).
Therefore, the effect of impurities at low loadings (< 0.1 mg Pt·cm-2) is still poorly
understood for almost all impurities.
The effect of fuel utilization ( f) on the CO poisoning dynamics of the anode catalyst
has been poorly studied too. In the majority of studies the fuel utilization is normally
set to high values ( f = 50-85%), not corresponding to actual automotive PEMFC
systems [17-20] for which the fuel is delivered in dead end mode with recirculation
(Figure 5.1). These systems may require fuel utilizations of 20% since recirculation is
used to humidify the H2 [21]. Only in the study of Matsuda et al. [14] the fuel
utilization was set to f = 25%, representing actual automotive PEMFC conditions.
Figure 5.1. Simplified diagram of an automotive PEMFC system. PR, pressure regulator; D,demister; PV, purge valve; RP, recirculation pump; E, ejector; F, filter; B, blower; H, humidifier;WP, water pump; R, radiator; BPR, back pressure regulator. Adapted from [17-20].
In Chapter 3 [22] it was shown that the fuel utilization influences the anode catalyst
poisoning dynamics when the CO concentration (CCO), the anode catalyst loading and
the fuel utilization were high, 15-19 ppm, 0.4 mg Pt·cm-2 and 55-83% respectively.
These authors also observed that under CO poisoning, the anode behaves similarly to
a fixed-bed adsorption column (CO filter). In this analogy, the CO removal efficiency
Chapter V – CO poisoning studies__________________________________________
170
from the H2 stream depends on the catalyst loading (filter capacity) and the fuel
utilization (residence time), which ultimately determine the CO breakthrough within
the cell. In that study no significant amount of CO was detected in the anode exhaust
gas before a significant drop in the current of the cell was observed due to the CO
concentration and Pt loading. In contrast, in the studies by Hashimasa et al. [11] (1
ppm of CO and 70% fuel utilization) and by Santis [23] (50 ppm of CO and 50% fuel
utilization), CO was detected for a marginal drop in performance during galvanostatic
[11] and potentiostatic [23] operation. The study by Hashimasa indicates that less CO
may breakthrough the cell for similar potential drops when the Pt loading is higher.
It is noteworthy that the fuel delivery configuration depicted in Figure 5.1 makes
necessary to study the dynamic “enrichment” or “buildup” of impurities [24, 25] in
the recirculation loop. One possibility to gain insight on the buildup of impurities is to
analyze the anode exhaust gas composition in PEMFC without recirculation (single
pass of fuel and venting). The latter has been applied in a few studies in the literature
[11, 15, 23, 26], but again, in these studies the anode catalyst loading and/or the fuel
utilization were too high. To the knowledge of the authors, only Matsuda et al.[14]
have experimentally studied the buildup of impurities in the recirculation loop.
However, in their work the anode catalyst loading was high and the CO concentration
one order of magnitude higher than specified in current regulation.
The effect of fuel utilization on CO poisoning has been studied numerically [27-29];
however, no systematic experimental effort has been made to estimate the effect of
impurity buildup with relevant CO concentrations and anode catalyst loadings.
Ahluwalia and Wang [25] have modeled the buildup of CO and CO2 in the
recirculation loop and used this data to determine the optimum fuel quality for
PEMFCs with low Pt loading. Those authors also observed that there could be
significant buildup of CO in the recirculation loop.
The literature cited above indicates that the CO breakthrough is dependent on the
fuel utilization and the Pt loading. Information about the CO breakthrough and
buildup in the recirculation loop is of crucial importance to optimize the fuel quality
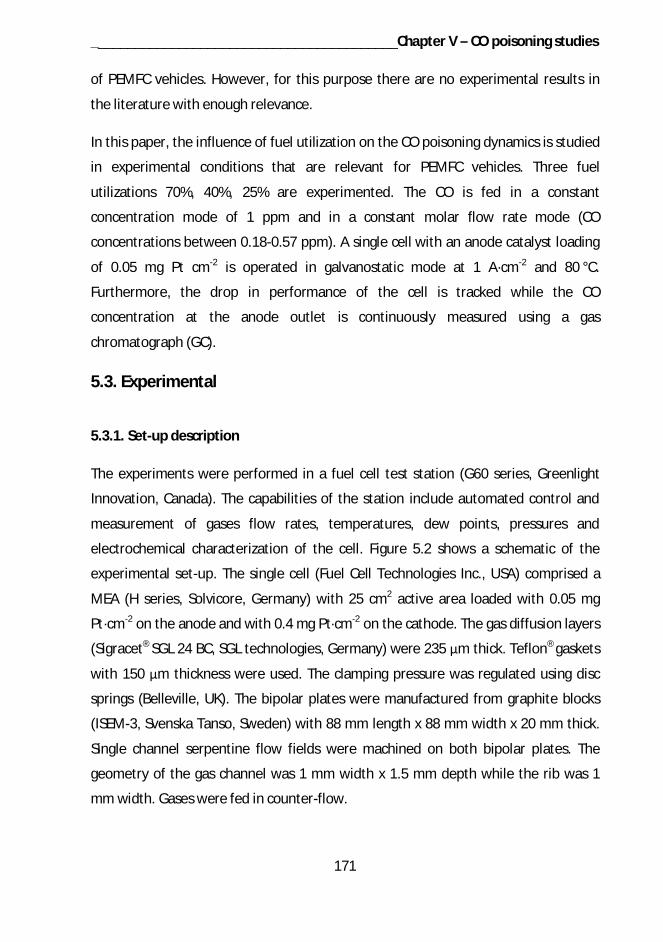
__________________________________________Chapter V – CO poisoning studies
171
of PEMFC vehicles. However, for this purpose there are no experimental results in
the literature with enough relevance.
In this paper, the influence of fuel utilization on the CO poisoning dynamics is studied
in experimental conditions that are relevant for PEMFC vehicles. Three fuel
utilizations 70%, 40%, 25% are experimented. The CO is fed in a constant
concentration mode of 1 ppm and in a constant molar flow rate mode (CO
concentrations between 0.18-0.57 ppm). A single cell with an anode catalyst loading
of 0.05 mg Pt cm-2 is operated in galvanostatic mode at 1 A·cm-2 and 80 °C.
Furthermore, the drop in performance of the cell is tracked while the CO
concentration at the anode outlet is continuously measured using a gas
chromatograph (GC).
5.3. Experimental
5.3.1. Set-up description
The experiments were performed in a fuel cell test station (G60 series, Greenlight
Innovation, Canada). The capabilities of the station include automated control and
measurement of gases flow rates, temperatures, dew points, pressures and
electrochemical characterization of the cell. Figure 5.2 shows a schematic of the
experimental set-up. The single cell (Fuel Cell Technologies Inc., USA) comprised a
MEA (H series, Solvicore, Germany) with 25 cm2 active area loaded with 0.05 mg
Pt·cm-2 on the anode and with 0.4 mg Pt·cm-2 on the cathode. The gas diffusion layers
(Sigracet® SGL 24 BC, SGL technologies, Germany) were 235 m thick. Teflon® gaskets
with 150 m thickness were used. The clamping pressure was regulated using disc
springs (Belleville, UK). The bipolar plates were manufactured from graphite blocks
(ISEM-3, Svenska Tanso, Sweden) with 88 mm length x 88 mm width x 20 mm thick.
Single channel serpentine flow fields were machined on both bipolar plates. The
geometry of the gas channel was 1 mm width x 1.5 mm depth while the rib was 1
mm width. Gases were fed in counter-flow.
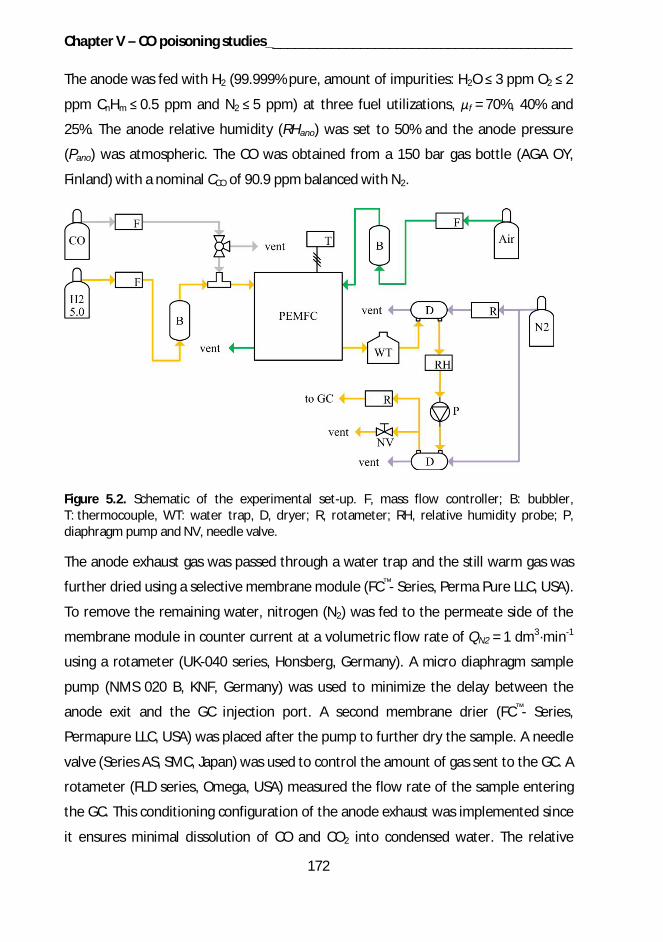
Chapter V – CO poisoning studies__________________________________________
172
The anode was fed with H2 (99.999% pure, amount of impurities: H2O 3 ppm O2 2
ppm CnHm 0.5 ppm and N2 5 ppm) at three fuel utilizations, f = 70%, 40% and
25%. The anode relative humidity (RHano) was set to 50% and the anode pressure
(Pano) was atmospheric. The CO was obtained from a 150 bar gas bottle (AGA OY,
Finland) with a nominal CCO of 90.9 ppm balanced with N2.
Figure 5.2. Schematic of the experimental set-up. F, mass flow controller; B: bubbler,T: thermocouple, WT: water trap, D, dryer; R, rotameter; RH, relative humidity probe; P,diaphragm pump and NV, needle valve.
The anode exhaust gas was passed through a water trap and the still warm gas was
further dried using a selective membrane module (FC™- Series, Perma Pure LLC, USA).
To remove the remaining water, nitrogen (N2) was fed to the permeate side of the
membrane module in counter current at a volumetric flow rate of QN2 = 1 dm3·min-1
using a rotameter (UK-040 series, Honsberg, Germany). A micro diaphragm sample
pump (NMS 020 B, KNF, Germany) was used to minimize the delay between the
anode exit and the GC injection port. A second membrane drier (FC™- Series,
Permapure LLC, USA) was placed after the pump to further dry the sample. A needle
valve (Series AS, SMC, Japan) was used to control the amount of gas sent to the GC. A
rotameter (FLD series, Omega, USA) measured the flow rate of the sample entering
the GC. This conditioning configuration of the anode exhaust was implemented since
it ensures minimal dissolution of CO and CO2 into condensed water. The relative
__________________________________________Chapter V – CO poisoning studies
173
humidity and temperature of the sample was measured after the first membrane
drier with a probe model HMP110 (Vaisala, Finland).
The cathode was fed with humidified synthetic air. The oxidant utilization ( ox) was
40% in all the experiments. The cathode relative humidity (RHcat) was set to 50% and
the cathode pressure (Pcat) was atmospheric. The cell temperature (Tcell) was 80 °C.
5.3.2. Gas chromatograph description
The gas chromatograph (model 6890N, Agilent Technologies, USA) was equipped
with a flame ionization detector (FID) for CO and CO2 detection. The equipment was
calibrated daily using a gas mixture obtained from a 150 bar gas bottle (AGA OY,
Finland) with a nominal CCO of 10.2 ppm and a nominal CO2 concentration (CCO2) of
9.63 ppm balanced with He. It was programmed to take a gas sample, plot the
corresponding chromatogram and record it in a file. This process took ca. four
minutes so 16 gas samples were automatically taken every hour.
Two actions, one concerning the GC hardware and the other the GC software, were
taken to improve the accuracy of the measurements. In the beginning, a single
column GC configuration was used; nonetheless, disturbances attributed to a
marginal contamination of the sample (N2 or H2O) made it very hard to find a clear
point to start integrating the CO peak. This was solved using a two column GC
configuration, one for detecting the CO and one for detecting the CO2. The other
action was related to the GC signal processing. Even the small inherent fluctuation of
the GC baseline may introduce noise to the measurements due to automatic
selection of the points to start and finish integrating the CO peak. The GC software
was not sensible enough, so an integration routine for the GC signals was developed
using Matlab®. Linear least squares fitting was used to minimize the inherent
fluctuation of the baseline and integration was done with trapezoid algorithm after
careful selection of the CO integration limits.
The molar flow rate of CO, , (mol s-1), was calculated using Equation 1. The
volumetric flow rate of the gas mixture leaving the cell (dry basis), (cm3 s-1), was
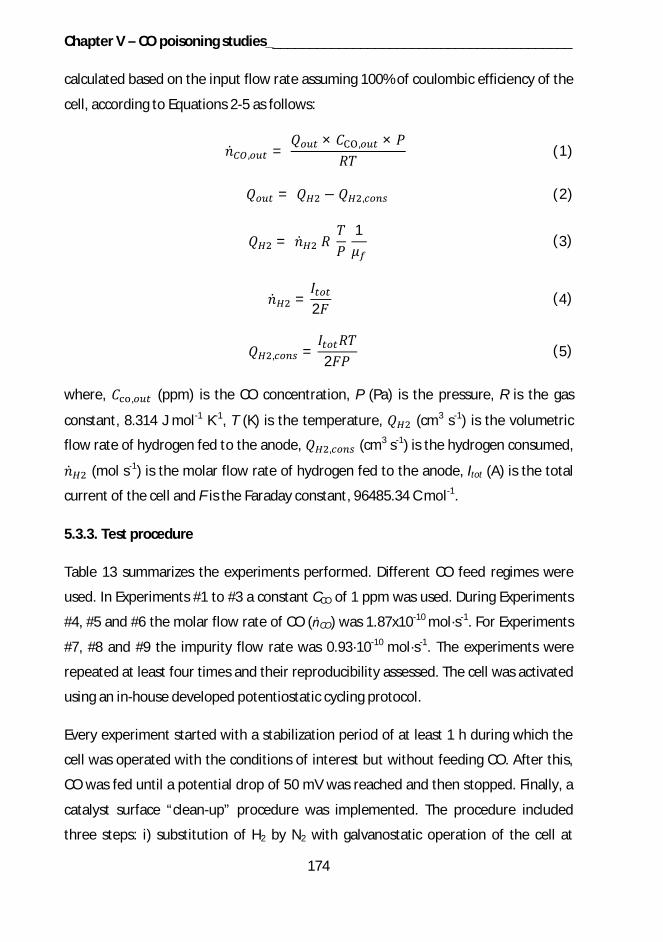
Chapter V – CO poisoning studies__________________________________________
174
calculated based on the input flow rate assuming 100% of coulombic efficiency of the
cell, according to Equations 2-5 as follows:
, =× , ×
(1)
= , (2)
=1
(3)
=2
(4)
, =2
(5)
where, , (ppm) is the CO concentration, P (Pa) is the pressure, R is the gas
constant, 8.314 J mol-1 K-1, T (K) is the temperature, (cm3 s-1) is the volumetric
flow rate of hydrogen fed to the anode, , (cm3 s-1) is the hydrogen consumed,
(mol s-1) is the molar flow rate of hydrogen fed to the anode, Itot (A) is the total
current of the cell and F is the Faraday constant, 96485.34 C mol-1.
5.3.3. Test procedure
Table 13 summarizes the experiments performed. Different CO feed regimes were
used. In Experiments #1 to #3 a constant CCO of 1 ppm was used. During Experiments
#4, #5 and #6 the molar flow rate of CO ( CO) was 1.87x10⁻¹⁰ mol·s-1. For Experiments
#7, #8 and #9 the impurity flow rate was 0.93·10-10 mol·s-1. The experiments were
repeated at least four times and their reproducibility assessed. The cell was activated
using an in-house developed potentiostatic cycling protocol.
Every experiment started with a stabilization period of at least 1 h during which the
cell was operated with the conditions of interest but without feeding CO. After this,
CO was fed until a potential drop of 50 mV was reached and then stopped. Finally, a
catalyst surface “clean-up” procedure was implemented. The procedure included
three steps: i) substitution of H2 by N2 with galvanostatic operation of the cell at
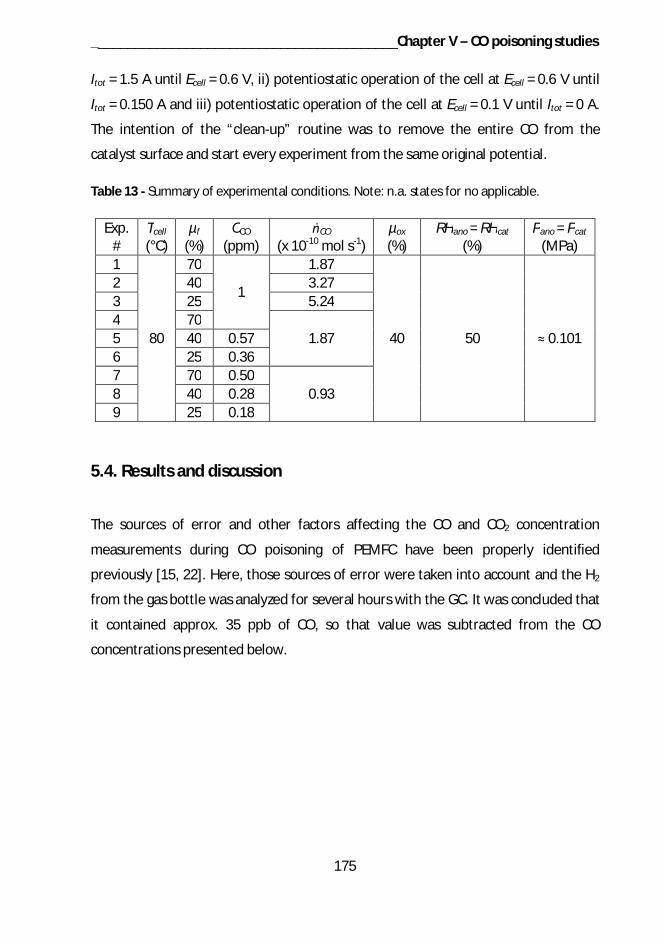
__________________________________________Chapter V – CO poisoning studies
175
Itot = 1.5 A until Ecell = 0.6 V, ii) potentiostatic operation of the cell at Ecell = 0.6 V until
Itot = 0.150 A and iii) potentiostatic operation of the cell at Ecell = 0.1 V until Itot = 0 A.
The intention of the “clean-up” routine was to remove the entire CO from the
catalyst surface and start every experiment from the same original potential.
Table 13 - Summary of experimental conditions. Note: n.a. states for no applicable.
Exp.#
Tcell
(°C)µf
(%)CCO
(ppm)CO
(x 10-10 mol s-1)µox
(%)RHano = RHcat
(%)Pano = Pcat
(MPa)1
80
70
1
1.87
40 50 0.101
2 40 3.273 25 5.244 70
1.875 40 0.576 25 0.367 70 0.50
0.938 40 0.289 25 0.18
5.4. Results and discussion
The sources of error and other factors affecting the CO and CO2 concentration
measurements during CO poisoning of PEMFC have been properly identified
previously [15, 22]. Here, those sources of error were taken into account and the H2
from the gas bottle was analyzed for several hours with the GC. It was concluded that
it contained approx. 35 ppb of CO, so that value was subtracted from the CO
concentrations presented below.
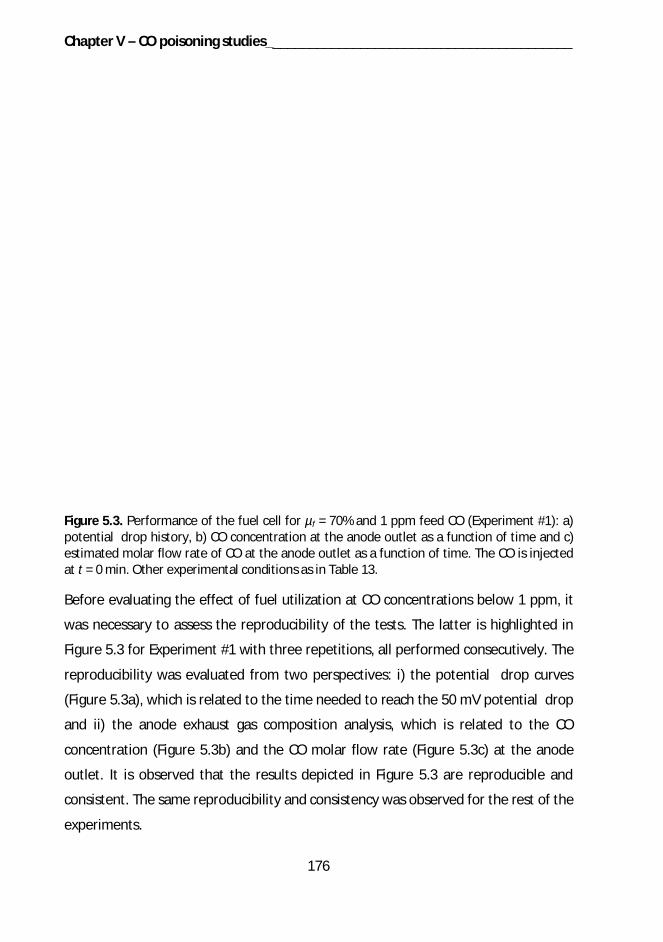
Chapter V – CO poisoning studies__________________________________________
176
Figure 5.3. Performance of the fuel cell for µf = 70% and 1 ppm feed CO (Experiment #1): a)potential drop history, b) CO concentration at the anode outlet as a function of time and c)estimated molar flow rate of CO at the anode outlet as a function of time. The CO is injectedat t = 0 min. Other experimental conditions as in Table 13.
Before evaluating the effect of fuel utilization at CO concentrations below 1 ppm, it
was necessary to assess the reproducibility of the tests. The latter is highlighted in
Figure 5.3 for Experiment #1 with three repetitions, all performed consecutively. The
reproducibility was evaluated from two perspectives: i) the potential drop curves
(Figure 5.3a), which is related to the time needed to reach the 50 mV potential drop
and ii) the anode exhaust gas composition analysis, which is related to the CO
concentration (Figure 5.3b) and the CO molar flow rate (Figure 5.3c) at the anode
outlet. It is observed that the results depicted in Figure 5.3 are reproducible and
consistent. The same reproducibility and consistency was observed for the rest of the
experiments.
__________________________________________Chapter V – CO poisoning studies
177
One key issue for achieving the excellent reproducibility and consistency of the
results shown in Figure 5.3 was the clean-up procedure. The procedure intended to
promote the electrooxidation of CO [30] and thus liberate the anode catalytic sites
covered by CO. It was noticed a positive effect of the procedure on the
reproducibility of the results until the effect of catalyst aging was noticed (last set of
experiments).
5.4.1. Effect of fuel utilization for a constant CO feed concentration of 1 ppm
Figure 5.4 shows the potential drop, CO concentrations and CO molar flow rates at
the anode outlet for a constant 1 ppm feed CO concentration. A single test with no
repetitions was plotted for each experiment. Figure 5.4a shows that it took
approximately 10 min more for the lowest fuel utilization to reach a potential drop of
50 mV, despite the molar flow rate of CO was 2.8 times higher when compared to
the highest fuel utilization (Table 13). The potential drop was attributed to the
adsorption of CO onto the anode catalytic sites; however, the results of Figure 5.4a
seem to be counterintuitive once it would be expected a faster drop in performance
for a CO molar feed almost 3 times higher.
Figure 5.4b shows that the CO concentration at the outlet exceeded 1 ppm for the
70% fuel utilization after 27.5 min but was not exceeded for 40% and 25% fuel
utilizations. The CO concentration decreases along the flow field channels if the CO is
oxidized by the O2 permeating from the cathode due to the internal air bleed [31].
However, not all the CO is oxidized by the internal air bleed nor is adsorbed onto de
catalyst, so the CO concentration increases towards the anode outlet as a function of
the consumed of H2 along the flow field channels. In fact, it is expected that the CO
concentration increases until the anode overpotential reaches a steady-state [11, 15,
16]. From a practical point of view, it is important to measure the CO concentration
at the anode outlet but only if the molar flow rate of CO at the anode outlet is
estimated afterwards. Figure 5.4b suggests that CO may start being recirculated in
the anode loop before the CO concentration at the anode inlet is overpassed.
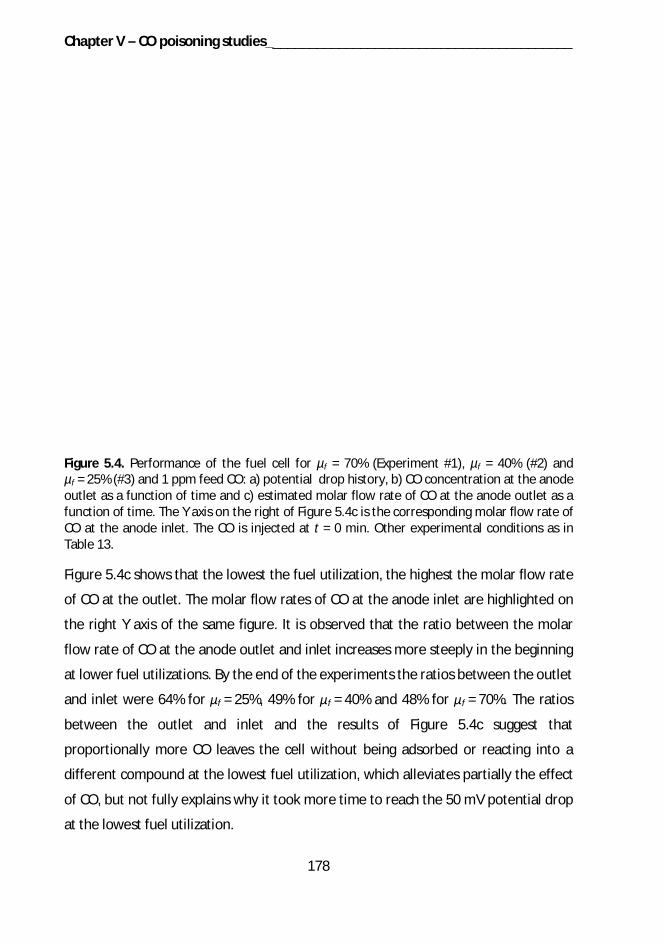
Chapter V – CO poisoning studies__________________________________________
178
Figure 5.4. Performance of the fuel cell for µf = 70% (Experiment #1), µf = 40% (#2) andµf = 25% (#3) and 1 ppm feed CO: a) potential drop history, b) CO concentration at the anodeoutlet as a function of time and c) estimated molar flow rate of CO at the anode outlet as afunction of time. The Y axis on the right of Figure 5.4c is the corresponding molar flow rate ofCO at the anode inlet. The CO is injected at t = 0 min. Other experimental conditions as inTable 13.
Figure 5.4c shows that the lowest the fuel utilization, the highest the molar flow rate
of CO at the outlet. The molar flow rates of CO at the anode inlet are highlighted on
the right Y axis of the same figure. It is observed that the ratio between the molar
flow rate of CO at the anode outlet and inlet increases more steeply in the beginning
at lower fuel utilizations. By the end of the experiments the ratios between the outlet
and inlet were 64% for f = 25%, 49% for f = 40% and 48% for f = 70%. The ratios
between the outlet and inlet and the results of Figure 5.4c suggest that
proportionally more CO leaves the cell without being adsorbed or reacting into a
different compound at the lowest fuel utilization, which alleviates partially the effect
of CO, but not fully explains why it took more time to reach the 50 mV potential drop
at the lowest fuel utilization.
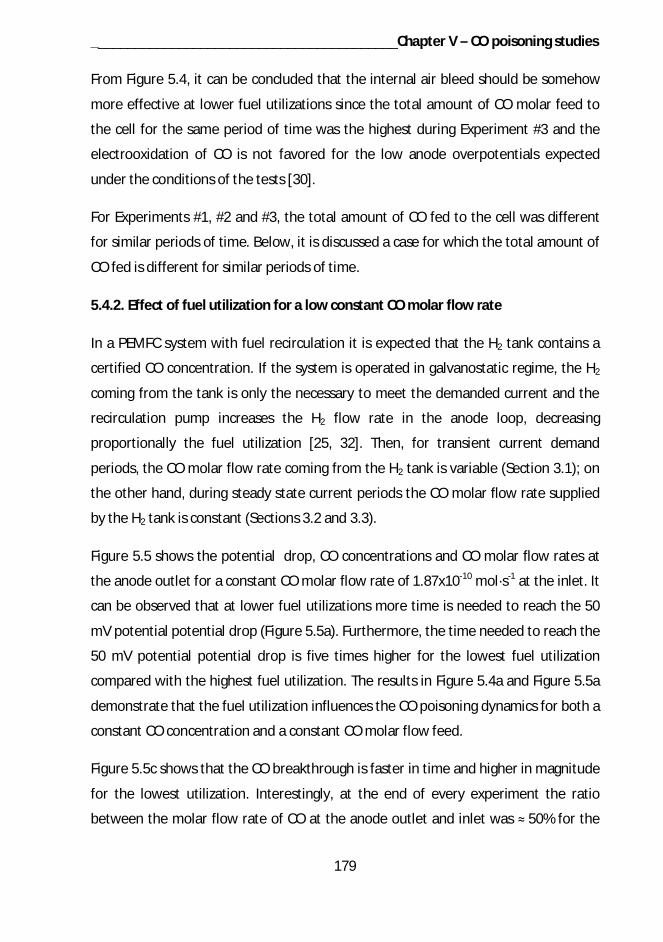
__________________________________________Chapter V – CO poisoning studies
179
From Figure 5.4, it can be concluded that the internal air bleed should be somehow
more effective at lower fuel utilizations since the total amount of CO molar feed to
the cell for the same period of time was the highest during Experiment #3 and the
electrooxidation of CO is not favored for the low anode overpotentials expected
under the conditions of the tests [30].
For Experiments #1, #2 and #3, the total amount of CO fed to the cell was different
for similar periods of time. Below, it is discussed a case for which the total amount of
CO fed is different for similar periods of time.
5.4.2. Effect of fuel utilization for a low constant CO molar flow rate
In a PEMFC system with fuel recirculation it is expected that the H2 tank contains a
certified CO concentration. If the system is operated in galvanostatic regime, the H2
coming from the tank is only the necessary to meet the demanded current and the
recirculation pump increases the H2 flow rate in the anode loop, decreasing
proportionally the fuel utilization [25, 32]. Then, for transient current demand
periods, the CO molar flow rate coming from the H2 tank is variable (Section 3.1); on
the other hand, during steady state current periods the CO molar flow rate supplied
by the H2 tank is constant (Sections 3.2 and 3.3).
Figure 5.5 shows the potential drop, CO concentrations and CO molar flow rates at
the anode outlet for a constant CO molar flow rate of 1.87x10⁻¹⁰ mol·s-1 at the inlet. It
can be observed that at lower fuel utilizations more time is needed to reach the 50
mV potential potential drop (Figure 5.5a). Furthermore, the time needed to reach the
50 mV potential potential drop is five times higher for the lowest fuel utilization
compared with the highest fuel utilization. The results in Figure 5.4a and Figure 5.5a
demonstrate that the fuel utilization influences the CO poisoning dynamics for both a
constant CO concentration and a constant CO molar flow feed.
Figure 5.5c shows that the CO breakthrough is faster in time and higher in magnitude
for the lowest utilization. Interestingly, at the end of every experiment the ratio
between the molar flow rate of CO at the anode outlet and inlet was 50% for the
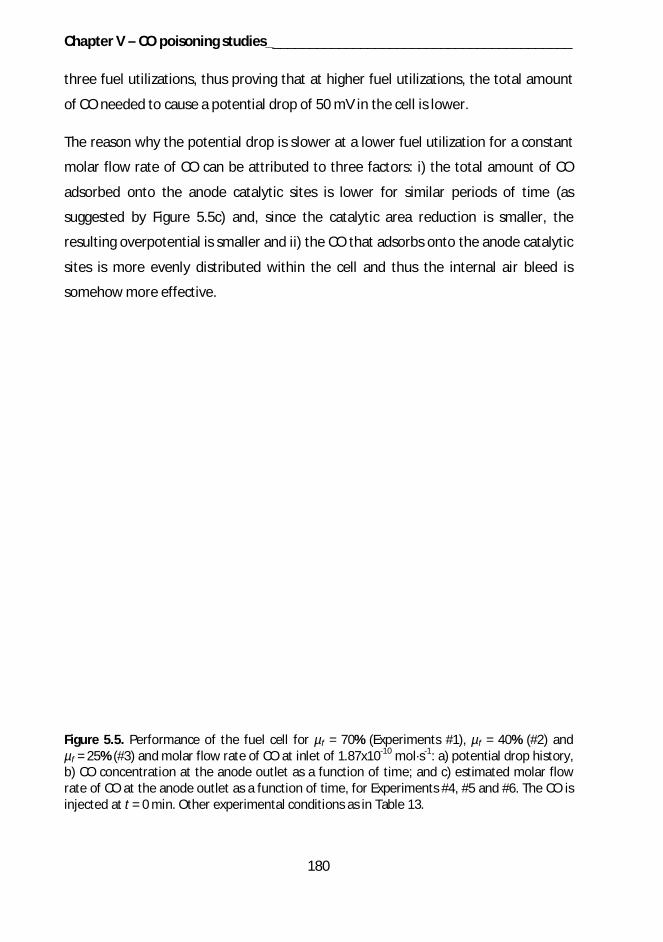
Chapter V – CO poisoning studies__________________________________________
180
three fuel utilizations, thus proving that at higher fuel utilizations, the total amount
of CO needed to cause a potential drop of 50 mV in the cell is lower.
The reason why the potential drop is slower at a lower fuel utilization for a constant
molar flow rate of CO can be attributed to three factors: i) the total amount of CO
adsorbed onto the anode catalytic sites is lower for similar periods of time (as
suggested by Figure 5.5c) and, since the catalytic area reduction is smaller, the
resulting overpotential is smaller and ii) the CO that adsorbs onto the anode catalytic
sites is more evenly distributed within the cell and thus the internal air bleed is
somehow more effective.
Figure 5.5. Performance of the fuel cell for µf = 70% (Experiments #1), µf = 40% (#2) andµf = 25% (#3) and molar flow rate of CO at inlet of 1.87x10⁻¹⁰ mol·s-1: a) potential drop history,b) CO concentration at the anode outlet as a function of time; and c) estimated molar flowrate of CO at the anode outlet as a function of time, for Experiments #4, #5 and #6. The CO isinjected at t = 0 min. Other experimental conditions as in Table 13.
__________________________________________Chapter V – CO poisoning studies
181
It is noteworthy the effort made by other authors to study distribution of CO within
the cell both experimentally [33, 34] and numerically [28, 29]. The numeric study by
Bonnet et al. [29] shows that at 25% fuel utilization the gas composition, the fraction
of catalytic sites covered by CO, the anode overpotential and the current density
distribution is quite even between the anode inlet and outlet. The model by Brett et
al [28] also predicts that the fraction of catalytic sites between the inlet and outlet is
more even at higher flow rates. Nonetheless, the results by Bonnet et al. for higher
fuel utilizations are not in accordance with the experimental results by Tingelöf et al.
[33] and Reshetenko et al. [34] which observed a lower current density close to the
anode inlet using a segmented PEMFC. More experimental work is needed in order
to analyze the effect of fuel utilization on the distribution of CO within the cell.
However, the results presented here support the hypothesis that the factor
dominating the distribution of CO within the cell is the mean gas velocity at the
anode inlet, as resulting from the simulation results by Brett et al. [28].
5.4.3. Effect of fuel utilization for a ultra-low constant CO molar flow rate
Figure 5.6 shows the potential drop, CO concentrations and CO molar flow rates at
the anode outlet for a constant CO molar flow rate of 0.93x10⁻¹⁰ mol·s-1 at the anode
inlet. The CO molar flow rate is halved compared with results of section 3.2 (CO
molar flow rate of 1.87x10⁻¹⁰ mol·s-1) and the time needed to reach the 50 mV
potential drop is 2 - 2.3 times higher for the corresponding fuel utilizations. It is
observed that the time needed to reach the 50 mV potential drop is seven times
higher for the lowest fuel utilization compared with the highest fuel utilization
(Figure 5.6a).
Figure 5.6a shows that in Experiment #8 (µf = 40%) the onset potential started
approx. 20 mV lower than for the other two Experiments (#7 and #9). This
experiment (which comprises at least three repetitions) was the last to be performed
and this difference might highlight the aging of the anode catalyst. It has been
reported a loss of electrochemically active area at the anode after consecutive CO
poisoning-recovery cycles [35]. Here, aging of the anode catalyst might have been
accelerated as a consequence of the clean-up procedure.
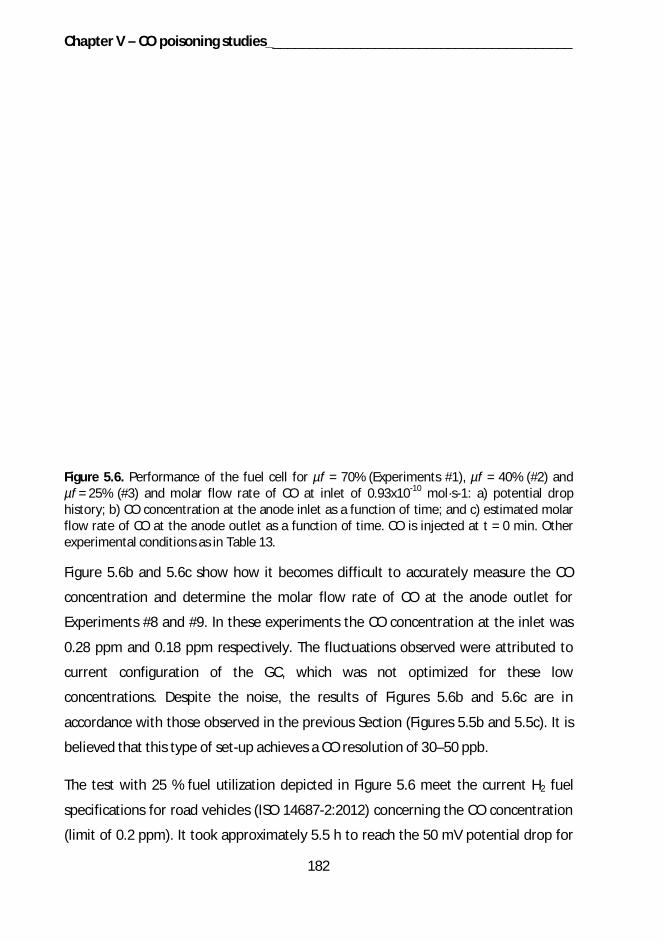
Chapter V – CO poisoning studies__________________________________________
182
Figure 5.6. Performance of the fuel cell for µf = 70% (Experiments #1), µf = 40% (#2) andµf = 25% (#3) and molar flow rate of CO at inlet of 0.93x10⁻¹⁰ mol·s-1: a) potential drophistory; b) CO concentration at the anode inlet as a function of time; and c) estimated molarflow rate of CO at the anode outlet as a function of time. CO is injected at t = 0 min. Otherexperimental conditions as in Table 13.
Figure 5.6b and 5.6c show how it becomes difficult to accurately measure the CO
concentration and determine the molar flow rate of CO at the anode outlet for
Experiments #8 and #9. In these experiments the CO concentration at the inlet was
0.28 ppm and 0.18 ppm respectively. The fluctuations observed were attributed to
current configuration of the GC, which was not optimized for these low
concentrations. Despite the noise, the results of Figures 5.6b and 5.6c are in
accordance with those observed in the previous Section (Figures 5.5b and 5.5c). It is
believed that this type of set-up achieves a CO resolution of 30–50 ppb.
The test with 25 % fuel utilization depicted in Figure 5.6 meet the current H2 fuel
specifications for road vehicles (ISO 14687-2:2012) concerning the CO concentration
(limit of 0.2 ppm). It took approximately 5.5 h to reach the 50 mV potential drop for
__________________________________________Chapter V – CO poisoning studies
183
this case. The conditions of the test, particularly the constant current density of 1 A
cm2 and the 5.5 h length, will not correspond to the conditions demanded from a
PEMFC automotive system. This suggests that the CO concentration limit of the
current H2 fuel regulation may be inherently safe for PEMFC vehicles but strongly
remarks the importance of systematically studying the effect of CO buildup in anode
loop and evaluate its possible implications on the regulation. This kind of evaluation
may ultimately lead to develop principles of safety engineering [36] aiming to reduce
the risk and uncertainty associated to the presence of impurities present in the H2
fuel.
5.5. Conclusions
The CO poisoning dynamics of the anode catalyst was studied for CO concentrations
between 0.18-1 ppm and three fuel utilizations in a single cell. CO was fed to the cell
in a constant concentration and a constant molar flow rate mode.
It was observed a gradual decrease in performance when the CO was fed to the cell
that was attributed to the adsorption of CO onto de anode catalytic sites. It was
demonstrated that the fuel utilization strongly influences the CO poisoning dynamics
in PEMFC independently of the CO feed mode used. For lower fuel utilizations the
decrease in performance of the cell was slower. The decrease in performance was
even slower when the molar flow rate of CO was reduced.
The anode exhaust gas composition was measured during the tests and the CO molar
flow rate at the anode outlet was estimated accordingly. It was found that at lower
fuel utilizations, the CO breakthrough was faster and higher in magnitude, partially
mitigating the effect of CO. Besides that, it was proposed that the increased
tolerance to CO at lower fuel utilizations should be related to: i) a smaller anode
overpotential, which is a consequence of a lower amount of CO that adsorbed onto
the anode catalytic sites for similar periods of time and ii) a more even distribution of
CO within the cell, which in turn makes more effective the internal air bleed.
Chapter V – CO poisoning studies__________________________________________
184
These results indicate that dynamics of impurity enrichment in PEMFC systems with
fuel recirculation will determine the effect of impurities at lower concentration
levels. This means that accurate determination of impurity limits for ISO 14687-
2:2012 standard requires that PEMFC catalyst poisoning measurements should be
studied using fuel recirculation systems.
5.6. Acknowledgements
This research has been conducted under the “Fuel Cell 2007-2013” technology
program of Tekes, the Finnish Funding Agency for Technology and Innovation.
L. C. Pérez is grateful to the National Foundation of Science and Technology of
Portugal (FCT) for his PhD grant reference SFRH/BD/44684/2008. L. C. Pérez also
acknowledges the support from the National Council of Science and Technology of
Mexico (CONACyT).
__________________________________________Chapter V – CO poisoning studies
185
5.7. References
[1] Mench, M. M., 2008, Fuel Cell Engines, John Wiley & Sons, Inc., New Jersey.
[2] Wang, Y., Chen, K. S., Mishler, J., Cho, S. C., and Adroher, X. C., 2011, "A review ofpolymer electrolyte membrane fuel cells: Technology, applications, and needs onfundamental research," Applied Energy, 88(4), pp. 981-1007.
[3] El-kharouf, A., Chandan, A., Hattenberger, M., and Pollet, B. G., 2012, "Protonexchange membrane fuel cell degradation and testing: review," Journal of the EnergyInstitute, 85(4), pp. 188-200.
[4] Miller, M., and Bazylak, A., 2011, "A review of polymer electrolyte membrane fuelcell stack testing," Journal of Power Sources, 196(2), pp. 601-613.
[5] Zamel, N., and Li, X., 2011, "Effect of contaminants on polymer electrolytemembrane fuel cells," Progress in Energy and Combustion Science, 37(3), pp. 292-329.
[6] Bhat, S. A., and Sadhukhan, J., 2009, "Process intensification aspects for steammethane reforming: An overview," AIChE Journal, 55(2), pp. 408-422.
[7] Adhikari, S., and Fernando, S., 2006, "Hydrogen Membrane SeparationTechniques," Industrial & Engineering Chemistry Research, 45(3), pp. 875-881.
[8] Besancon, B. M., Hasanov, V., Imbault-Lastapis, R., Benesch, R., Barrio, M., andMølnvik, M. J., 2009, "Hydrogen quality from decarbonized fossil fuels to fuel cells,"International Journal of Hydrogen Energy, 34(5), p. 2350.
[9] Gasteiger, H. A., Panels, J. E., and Yan, S. G., 2004, "Dependence of PEM fuel cellperformance on catalyst loading," Journal of Power Sources, 127(1-2), pp. 162-171.
[10] Debe, M. K., 2012, "Electrocatalyst approaches and challenges for automotivefuel cells," Nature, 486(7401), pp. 43-51.
[11] Hashimasa, Y., Matsuda, Y., and Akai, M., "Effects of platinum loading on PEFCpower generation performance deterioration by carbon monoxide in hydrogen fuel,"Proc. ECS Transactions, p. 131.
[12] Hashimasa, Y., Matsuda, Y., Imamura, D., and Akai, M., 2011, "PEFC powergeneration performance degradation by hydrogen sulfide and ammonia - Effects oflowering platinum loading," Electrochemistry, 79(5), p. 343.
[13] Imamura, D., Ebata, D., Hashimasa, Y., Akai, M., and Watanabe, S., 2007, "Impactof Hydrogen Fuel Impurities on PEMFC Performance," SAE Paper 2007-01-2010.
Chapter V – CO poisoning studies__________________________________________
186
[14] Matsuda, Y., Hashimasa, Y., Imamura, D., Akai, M., and Watanabe, S., 2009,"Accumulation behavior of impurities in fuel cell hydrogen circulation system,"Review of Automotive Engineering, 30(2), p. 167.
[15] Bender, G., Angelo, M., Bethune, K., Dorn, S., Thampan, T., and Rocheleau, R.,2009, "Method using gas chromatography to determine the molar flow balance forproton exchange membrane fuel cells exposed to impurities," Journal of PowerSources, 193(2), pp. 713-722.
[16] Bender, G., Angelo, M., Bethune, K., and Rocheleau, R., 2013, "Quantitativeanalysis of the performance impact of low-level carbon monoxide exposure in protonexchange membrane fuel cells," Journal of Power Sources, 228, p. 159.
[17] Wu, B., Matian, M., and Offer, G. J., 2012, "Hydrogen PEMFC system forautomotive applications," International Journal of Low-Carbon Technologies, 7(1),pp. 28-37.
[18] Cordner, M., Matian, M., Offer, G. J., Hanten, T., Spofforth-Jones, E., Tippetts, S.,Agrawal, A., Bannar-Martin, L., Harito, L., Johnson, A., Clague, R., Marquis, F., Heyes,A., Hardalupas, Y., and Brandon, N. P., 2010, "Designing, building, testing and racing alow-cost fuel cell range extender for a motorsport application," Journal of PowerSources, 195(23), pp. 7838-7848.
[19] Ahluwalia, R. K., and Wang, X., 2008, "Fuel cell systems for transportation: Statusand trends," Journal of Power Sources, 177(1), pp. 167-176.
[20] Zhai, S., Sun, P., Chen, F., Zhou, S., and Zhang, C., 2010, "Collaborative simulationfor dynamical PEMFC power systems," International Journal of Hydrogen Energy,35(16), pp. 8772-8782.
[21] Ahluwalia, R. K., Wang, X., Kwon, J., Rousseau, A., Kalinoski, J., James, B., andMarcinkoski, J., 2011, "Performance and cost of automotive fuel cell systems withultra-low platinum loadings," Journal of Power Sources, 196(10), pp. 4619-4630.
[22] Pérez, L. C., Rajala, T., Koski, P., Ihonen, J., Sousa, J., and Mendes, A.,"Development of a methodology to optimize the air bleed in PEMFC systemsoperating with low quality hydrogen”. International Journal of Hydrogen Energy, 38(2013) 16286-16299.
[23] Alvarez, M. V. S., 2006, "Investigations of current density inhomogeneities inpolymer electrolyte fuel cells,"PhD, ETH/PSI, Zürich.
[24] Karimäki, H., Pérez, L. C., Nikiforow, K., Keränen, T. M., Viitakangas, J., andIhonen, J., "The use of on-line hydrogen sensor for studying inert gas effects andnitrogen crossover in PEMFC system," International Journal of Hydrogen Energy2011, 36, 10179-10187.
__________________________________________Chapter V – CO poisoning studies
187
[25] Ahluwalia, R. K., and Wang, X., 2008, "Effect of CO and CO2 impurities onperformance of direct hydrogen polymer-electrolyte fuel cells," Journal of PowerSources, 180(1), pp. 122-131.
[26] Angelo, M., St-Pierre, J., Bethune, K., and Rocheleau, R., 2011, "GasChromatography Study of Reactions of Carbon Monoxide at Different OperatingTemperatures within a PEMFC," ECS Transactions, 35(32), pp. 167-178.
[27] Zhang, J. X., Thampan, T., and Datta, R., 2002, "Influence of anode flow rate andcathode oxygen pressure on CO poisoning of proton exchange membrane fuel cells,"Journal of the Electrochemical Society, 149(6), pp. A765-A772.
[28] Brett, D. J. L., Aguiar, P., Brandon, N. P., and Kucernak, A. R., 2007,"Measurement and modelling of carbon monoxide poisoning distribution within apolymer electrolyte fuel cell," International Journal of Hydrogen Energy, 32(7), pp.863-871.
[29] Bonnet, C., Franck-Lacaze, L., Ronasi, S., Besse, S., and Lapicque, F., 2010, "PEMfuel cell Pt anode inhibition by carbon monoxide: Non-uniform behaviour of the cellcaused by the finite hydrogen excess," Chemical Engineering Science, 65(10), pp.3050-3058.
[30] Iwasita, T., 2010, "Methanol and CO electrooxidation," Handbook of Fuel Cells,John Wiley & Sons, Ltd.
[31] Wang, W., 2009, "The effect of internal air bleed on CO poisoning in a protonexchange membrane fuel cell," Journal of Power Sources, 191(2), pp. 400-406.
[32] Pérez, L. C., Ihonen, J., Sousa, J. M., and Mendes, A., 2013, "Use of SegmentedCell Operated in Hydrogen Recirculation Mode to Detect Water Accumulation inPEMFC," Fuel Cells, Fuel Cells, 13(2), pp. 203-216.
[33] Tingelöf, T., Hedström, L., Holmström, N., Alvfors, P., and Lindbergh, G., 2008,"The influence of CO2, CO and air bleed on the current distribution of a polymerelectrolyte fuel cell," International Journal of Hydrogen Energy, 33(8), pp. 2064-2072.
[34] Reshetenko, T. V., Bethune, K., and Rocheleau, R., 2012, "Spatial protonexchange membrane fuel cell performance under carbon monoxide poisoning at alow concentration using a segmented cell system," Journal of Power Sources, 218(0),pp. 412-423.
[35] Angelo, M., Bethune, K., and Rocheleau, R., 2010, "The Impact of sub ppmCarbon Monoxide and ppm Level CO/Toluene and Methylcyclohexane/CO Mixtureson PEMFC Performance and Durability," ECS Transactions, 28(23), pp. 169-181.
[36] Möller, N., and Hansson, S. O., 2008, "Principles of engineering safety: Risk anduncertainty reduction," Reliability Engineering & System Safety, 93(6), pp. 798-805.

188

189
Chapter VI

190
___________________________________ Chapter VI - Conclusions and future work
191
Chapter VI - Conclusions and future work
A literature review on segmented PEMFC (SFC) was performed. The approaches to
design, construct and characterize the SFC were categorized in invasive and non-
invasive. In turn, the main invasive approaches were divided in printed circuit board,
resistors network, Hall effect sensors and resistors network. General guidelines for
the design, construction and electrochemical characterization of SFC were provided.
It was found that the current density distribution of PEMFC is inhomogeneous over
the MEA active area as a consequence of the complex interaction of design features
(i.e. flow field geometry), assembling characteristics (i.e. clamping pressure) and
operating parameters (i.e. relative humidity, flow rate, pressure or fuel composition)
as well as on the properties of the MEA and GDL. It was highlighted how the current
density distribution measurements can be complemented with other analytical
techniques that allow: i) H2, O2, N2 and water vapor distribution determination, ii)
liquid water distribution analysis, iii) temperature distribution measurements and iv)
local high frequency resistance (HFR) and local electrochemical impedance
spectroscopy (EIS) analysis.
A test bench was built around a SFC operated in hydrogen recirculation mode with
continuous removal of water. The test bench capabilities include fundamental
electrochemical analysis as well as current density distribution, water balance and
nitrogen crossover measurements at the single cell level. The concept of partially
segmented bipolar plates was introduced. The major advantage of the partially
segmented bipolar plates is a decrease in the lateral current spreading while at the
same time it avoids the total segmentation. In contrast, the major disadvantage is the
decrease in mechanical strength of the bipolar plates. Representative anode
operating conditions namely, recirculated gas flow rate, pressure and the time
between purges, were varied to analyze their effect on the current density
distribution of the SFC. Two different current density distribution diagram shapes
were observed for the two different gas recirculation flow rates used. When the gas
recirculation rate was low, the current density distribution reached a maximum value
Chapter VI - Conclusions and future work___________________________________
192
upstream the flow field close that decreased downstream, indicating flooding
conditions towards the outlet. When the gas recirculation rate was high, there was a
decrease in performance upstream the flow field but homogeneous current density
distribution afterwards, indicating drying conditions upstream. The anode pressure
and time between purges did not change to a great extent the shape of the current
density distribution diagrams. Two complementary approaches were used to
determine the likelihood of flooding in the cell: one based on a water balance
analysis and the other based on the estimating the mean gas velocity of reactants. It
was noted that flooding conditions resulted from the impossibility of the anode to
remove water diffusing from the cathode, leading to water condensation at the
cathode and the anode. In turn, drying conditions resulted from excessive water
removal of the water diffusing from the cathode upstream the flow fields.
A methodology to determine the amount of air bleed needed to mitigate the effect
of CO in PEMFC was developed. The methodology is based on the analysis of the
distributed performance of the cell and the estimation of the CO2 molar flow rates at
the anode inlet and outlet, which was assessed using a gas chromatograph. It was
demonstrated that this methodology is suitable for studying the following aspects: i)
the amount of air bleed needed to recover a desired level of performance of PEMFCs
with continuous CO feed, ii) the amount of air bleed needed to oxidize the CO feed
on a molar flow basis for different H2 flow rates, iii) the amount of CO
adsorbed/desorbed during a certain period of time and iv) the fraction of catalytic
sites covered by CO. It was observed that the flow rate of H2 affects both the extent
and severity of the CO adsorption as well as the effectiveness of the air bleed. For the
cases studied, it was found that air volumetric flow rates 1% (as a percentage of the
H2 flow rate at the anode inlet) are enough to mitigate the effect of CO at
concentrations between 13-19 ppm and a cell operating temperature of 65 °C.
The CO poisoning dynamics of the anode catalyst was studied for CO concentrations
between 0.18-1 ppm and three fuel utilizations in a single cell. CO was fed to the cell
in a constant concentration and in a constant molar flow rate mode. It was observed
a gradual decrease in performance when the CO was fed to the cell that was

___________________________________ Chapter VI - Conclusions and future work
193
attributed to the adsorption of CO onto de anode catalytic sites. It was demonstrated
that the fuel utilization strongly influences the CO poisoning dynamics in PEMFC
independently of the CO feed mode used. For lower fuel utilizations the decrease in
performance of the cell was slower. The decrease in performance was even slower
when the molar flow rate of CO was reduced. The anode exhaust gas composition
was measured during the tests and the CO molar flow rate at the anode outlet was
estimated accordingly. It was found that at lower fuel utilizations, the CO
breakthrough was faster and higher in magnitude. It was proposed that the slower
decrease in performance at lower fuel utilizations should be related to: i) a lower
amount of CO that adsorbed onto the anode catalytic sites for similar periods of
time, which led to a slower increase in the anode overpotential, and ii) a more even
distribution of CO within the cell, which made more effective the internal air bleed.
Furthermore, these results suggest that the CO poisoning dynamics of PEMFC
systems with fuel recirculation is determined by the CO buildup in the anode loop.
Taking into account the results presented in this thesis, suggestions of future work
can be made.
It was showed that evaluation of the current density distribution may contribute to
optimize the performance of PEMFC, nevertheless, there is a lack of experimental
work concerning SFC operated in hydrogen recirculation mode. The test bench
incorporating the SFC operated in hydrogen recirculation mode should be improved.
The improvements proposed include incorporation of a humidification device to the
anode recirculation loop, refinement of the purge system regarding the amount of
gas purged and incorporation of other ways to trigger the purge (i.e., based on the
voltage-drop of the cell or pressure-drop of the anode).
A wider systematic study of the effect of the anode and cathode operating
parameters on current density distribution should be performed using the SFC
operated in hydrogen recirculation mode. The impact of impurities (i.e. CO, CO2 and
sulphur species) enrichment on the current density distribution should be also
studied for impurities concentrations below 1 ppm. It is recommended to implement

Chapter VI - Conclusions and future work___________________________________
194
suitable analytical techniques such as gas chromatography or mass spectrometry to
analyze the composition of the gas recirculating in the loop.
The methodology to minimize the amount of air bleed should be applied as well
under galvanostatic operation and for a cell incorporating Pt-Ru as anode catalyst.
The differences in the amount of air bleed needed for the Pt and Pt-Ru catalysts
should be assessed and critically compared. The results of Pt-Ru catalysts may
contribute to define the hydrogen fuel specifications for stationary applications
(ISO/DIS 14687-3 in enquiry stage).