polish fmcg distributors 0308 - emperia · both retail and wholesale fmcg segments in poland are...
TRANSCRIPT

The Polish FMCG retail and wholesale market has reached a stage where consolidation looks inevitable. In our view, the winner will be the company that consolidates more successfully, therefore we prefer Emperia to Eurocash.
Sector review
Poland
26 March 2008
FMCG distributorsConsolidation play
Food & drug retailers
Emperia Bloomberg code EMP PWReuters code EDRO.WAPrice (PLN) 149.90Target price (PLN) 175.0Rating BUYMarket cap (PLNm) 2247.0Market cap (US$m) 977Daily turnover (US$m) 0.52008F PER 18.82009F PER 15.32008F EV/EBITDA 11.82009F EV/EBITDA 9.4
Note: Data diluted for 2007 SPO (1.5m shares issued); prices as at 25/03/8
No way but to consolidate. Both the wholesale and retail FMCG segments are highly fragmented (10 top companies hold 40% and 30% of their value respectively), the traditional stores need to gain purchasing power in order to compete with modern trade, and wholesalers are racing for customers and franchisees. This, combined with slow organic growth of the market, creates an environment ripe for consolidation, bringing efficiency of scale, enhanced competitiveness and earnings growth.
Emperia preferred as the consolidating party. We believe Emperia is positioned better to play the leading role in FMCG market consolidation process than Eurocash, since it has a superior record in M&A and communicates a more aggressive approach to future transactions. Moreover, it still holds half of the funds raised in 2007 for acquisitions.
Emperia’s superior business model. Eurocash is engaged only in wholesale, whereas Emperia is increasing its exposure to fastest growing and more profitable retail. As a result, it notes superior margins (net profitability of 2.0% vs. 1.2%) and grows faster (2007-10F diluted EPS CAGR of 45% vs. 28%). Moreover, the gap in profitability of both companies should continue to widen, as Emperia concentrates more on retail, and Eurocash takes over McLane which we expect to weaken margins further.
Valuations and recommendations. We rate Emperia BUY with a TP of PLN175, and Eurocash a HOLD with a TP of PLN12.6. Emperia is traded with somewhat lower multiples (2008F PER of 18.8x and 20.8x respectively), but we believe the company deserves a premium for its higher growth rates in EPS and growing differential in margins, to the advantage of Emperia.
Equity Markets
Dorota Puchlew, CFAWarsaw (4822) 820 50 26 [email protected]
research.ing.com
SEE THE DISCLOSURES APPENDIX FOR IMPORTANT DISCLOSURES AND ANALYST CERTIFICATION
Eurocash Bloomberg code EUR PWReuters code ERCS.WAPrice (PLN) 12.18Target price (PLN) 12.6Rating HOLDMarket cap (PLNm) 1567Market cap (US$m) 681Daily turnover (US$m) 0.42008F PER 20.82009F PER 17.02008F EV/EBITDA 11.52009F EV/EBITDA 9.5
Note: Data diluted for McLane acq. payment (est. 1.03m shares); prices as at 25/03/08
Relative share price performance
80100120140160180200220
12/06 8/07 3/08
Emperia Eurocash
Source: Reuters

2
FMCG distributors March 2008
Contents Summary 3
Investment case 4
Valuation 9
Market overview 15
Companies 21 Emperia ...................................................................................................................23 Eurocash .................................................................................................................35
Disclosures Appendix 47

3
FMCG distributors March 2008
Summary
Market prospects In our view, the FMCG market in Poland has reached a stage in which consolidation is inevitable, owing to high market fragmentation and slow organic growth of the sector. Moreover, small traditional stores have to gain purchasing power in order to compete with modern trade (a 40% market share), by consolidation, joining franchise chains or organising into common purchase groups.
Business model comparison There are several key differences between the business models of both companies. Eurocash deals only with lower profitability wholesale and Emperia has 25% of revenues coming from more prospective retail. As a result, we view Eurocash as a more stable and safer business with negative working capital, and Emperia as a fast growing, diversified company involving more risk.
ING forecasts vs. consensus estimates Our estimates are slightly above consensus with respect to Emperia (by 6% on 2008F and 8% on 2009F net profit), and somewhat below in case of Eurocash (by 6-7% in 2008F and 2009F). We believe the consensus will revise Emperia forecasts upward, since it does not seem yet to reflect the company’s guidance for PLN 5.8bn in 2008 revenues, and revise Eurocash forecasts downwards, when after taking over McLane and its significantly lower profitability, the margins start to fall.
Recommendations and key catalysts In our opinion, investors should focus on companies offering higher potential in terms of consolidation, and therefore prefer Emperia to Eurocash. Based on comparative valuation and DCF model, we rate Emperia a BUY with a 12-month TP of PLN175, and Eurocash a HOLD with a 12-month TP of PLN12.6. Eurocash trades a little higher than Emperia, despite its inferior growth record.
We see the newsflow connected with future acquisitions as the main share price driver for Emperia. It is scheduled to take over Lewiatan, Poland’s biggest grocery franchise chain in terms of revenues. Negotiations have been held for over six months, and we believe they will come to a positive end in 2-3 months. Price negotiations are being held, together with attempts to structure the transaction, since Lewiatan’s organisational and shareholding structure is fragmented. We do not account for this transaction in our model; it would serve as another upside factor to our target price.
Key risks With respect to Emperia, we believe the biggest risk is connected with the enormous managerial, organisational and financial effort required to consolidate over a dozen companies taken over in 2007 and due to be acquired in 2008. We appreciate the successful consolidation of BOS, but there is a difference between managing one big merger and a number of small acquisitions. With respect to Eurocash, in our view potential upside or downside in the short term could come from the announcement of the McLane acquisition price, should it be much different from our calculations of PLN40m equity fair value.

4
FMCG distributors March 2008
Investment case
Market perspectives The FMCG market has been growing under 5% pa from the beginning of the 2000s, based on Polish Statistical Office data. We forecast a slight acceleration, since Polish disposable income is growing, but we believe it will underperform other consumer goods categories, since food, the most important component of the FMCG market, is a category whose share usually drops in the total consumption basket as a society becomes richer. In the short term, however, it can grow at a similar pace to non-food consumer goods, owing to above-average food price inflation.
Both retail and wholesale FMCG segments in Poland are highly fragmented: the top 10 companies hold 30% and 40% of the market respectively. Moreover, the Polish market is unique in the retail channel structure: the modern trade (super and hypermarket chains) is unable to increase its market share from just over 40% (compared with 60-80% in the majority of western countries). The tradition of shopping in small, convenient stores combined with very small urbanisation rate (c.30%) is the main reason for this.
Slow organic growth and high fragmentation of the market drive the intensity of the consolidation process. This is the best way to grow faster than the whole market, since FMCG is a relatively mature sector and there is not enough space to grow organically as quickly as via M&A.
Over the past few years, we have witnessed several large transactions between leading multinational retailers (the splitting of Casino stores into Real and Tesco hands, taking over Hypernova and Albert brands from Ahold by Carrefour, or the acquisition of Dohle’s HIT stores by Tesco). We believe the market entered a stage in which international companies achieved their desired positions and do not expect such a major shift in their assets. Now is the time for local concerns to integrate the smaller companies in the market. Therefore, we expect a larger number of smaller acquisitions.
Another factor that will support the consolidation process will be an increasing interest in improving competitive position. Wholesalers will be willing to merge because it will give them opportunity to benefit from greater purchasing power. Their enhanced positioning will enable them to exert pricing pressure on retailers. They will be willing to consolidate to immunise themselves against the distributors’ power and to be able to compete with the modern trade. If not through capital transaction, retailers will organise into common purchase groups or join franchise chains offering access to favourable supply terms.
Eurocash and Emperia in the market context Both Eurocash and Emperia play leading roles in the FMCG wholesale market, with second and fourth rank respectively, with Makro and CEDC as the leading and third ranked companies. The market leaders do not compete directly, as Makro is concentrated on cash & carry which is open to the public and offering wide range of products, while Eurocash deals with discount cash & carry open only to grocery stores, CEDC is a spirits distributor, and Emperia is predominantly an active distributor. With respect to retail, both companies are exposed to traditional formats (Emperia directly and through franchise, Eurocash via franchise only), and do not wish to compete with
FMCG will accelerate but underperform
other consumer goods
Market’s fragmentation translates to…
… intensification of consolidation process...
… which will transform from large to many
small transactions…
… and result in enhanced competitive
power of the industry…
Eurocash and Emperia place in the market vs.
main competitors

5
FMCG distributors March 2008
the multinational retail chains, such as Tesco or Carrefour. Such an approach is in line with the general expectation that it will be difficult for the modern trade to exceed 50% market share in retail.
A more successful consolidator should be the winner. In our view, Emperia is positioned better than Eurocash, since it shows a more aggressive attitude towards acquisitions, has a more convincing record (successful both in large-scale mergers with BOS, and in acquiring small and medium wholesale and retail companies) than the latter (only two acquisitions in 2006, affecting margins, none in 2007 and another margin-deteriorating acquisition scheduled for 2008) and has still over PLN100m left from the PLN230m funds raised in 2H07. Moreover, it has a lower debt/equity ratio (1.2 projected by us for 2008F compared with Eurocash’s 2.7), meaning Eurocash would be less comfortable in incurring debt for acquisitions.
However, with respect only to the tobacco distribution market, we see Eurocash as the best positioned to be the consolidator. It is the second largest company, will be the leader after taking over McLane, and is already the most profitable one. The annual increase in excise tax raises the need for working capital, and for many smaller distributors the only opportunity to survive will be to sell to a larger company. Despite the fact that Eurocash is strong in this field, we do not believe rises in excise taxes will lead to a sudden drop in volume sales. We expect these sales to continue to grow in value terms, but still perceive the tobacco market as one of the slowest growing components of FMCG and showing one of the lowest profitability.
Business models differentiation Both Emperia’s and Eurocash’s core businesses are wholesale. Nevertheless, a quarter of Emperia’s revenues come from retail. In 2008, after the companies taken over in 2007 are consolidated, the share of retail should grow to over 30% on our estimates, since the majority of the targets were retail chains. Moreover, we expect its share to increase to 40% to 2012F, because by growing only organically, which is our assumption, it is easier to open new retail stores than to win market share in distribution.
Fig 1 Emperia - sales and EBITDA split (2007)
Fig 2 Eurocash - sales and EBITDA split (2007)
0%
10%
20%
30%
40%
50%
60%
70%
80%
90%
100%
Sales structure EBITDA structure
Wholesale Retail
0%
10%
20%
30%
40%
50%
60%
70%
80%
90%
100%
Sales structure EBITDA structure
Cash&carry Active distribution
Source: Company data Source: Company data
Differences in business model lead to different margins of the analysed companies. In 2007, Emperia posted a 14.7% gross margin on sales, 3.5% adjusted EBITDA margin (3.8% unadjusted) and 1.9% net margin (2.0%), compared with 8.6%, 2.6% and 1.2% respectively for Eurocash.
Emperia is better positioned to integrate
than Eurocash
Emperia’s exposure to retail increases…
… enlarging difference in companies’
margins…

6
FMCG distributors March 2008
Moreover, as the share of retail gains importance in the business model of Emperia and improves margins, Eurocash should grow the share of less profitable active distribution owing to the McLane takeover. Thus, the gap between the two companies profitability should continue to widen.
Working capital management However, the Eurocash business model has one advantage over Emperia. Thanks to the fact that it is more concentrated on cash & carry format sales (45% of revenues, compared with 20% of Emperia’s wholesale revenues, 15% of total sales), it is able to sustain negative working capital (-PLN60m in 2007 compared with positive PLN144m in Emperia). The cash & carry business is connected with less accounts receivable, since customers pay in cash, and furthermore it allows for more efficient stock management. That is why the difference between Emperia’s and Eurocash’s inventory turnover is lower than the difference in receivables. and in payables there is almost no difference.
Fig 3 Working capital structure (days) 05 06 07 08F 09F 10F EMP EUR diff EMP EUR diff EMP EUR diff EMP EUR diff EMP EUR diff EMP EUR diff
Inventory turnover 28.3 25.7 2.7 24.3 23.3 1.0 26.8 18.6 8.2 26.8 18.6 8.2 26.8 18.6 8.2 26.8 18.6 8.2 Trade receivables turnover 16.1 7.9 8.2 18.9 17.8 1.1 27.5 16.4 11.1 27.5 21.8 5.7 27.5 18.2 9.3 27.5 18.2 9.3 Trade payables turnover 39.0 50.5 (11.5) 39.8 41.3 (1.5) 43.0 39.6 3.4 43.0 39.6 3.4 43.0 39.6 3.4 43.0 39.6 3.4 Cash conversion cycle 5.4 (17.0) 22.4 3.5 (0.1) 3.6 11.3 (4.6) 15.8 11.3 0.8 10.4 11.3 (2.8) 14.0 11.3 (2.8) 14.0
Source: Company data, ING estimates
_
Negative working capital translates into less business risk and a lower need for external capital to finance growth. Nevertheless, we expect the working capital temporarily to fall into positive territory after taking over an active distributor, McLane, in 2008. The company should return to the red again in 2009F.
Moreover, because Eurocash has a higher ratio of trade payables compared with trade receivables and inventory, it has a significantly higher debt/equity ratio: 2.7 vs 1.2 for Emperia in 2008. Despite the fact the majority of liabilities are not burdened with interest costs (net debt/equity amounts to 0.20 compared to 0.26), the balance sheet structure looks less relaxed and the possibility of incurring debt for acquisitions financing is lower than in the case of Emperia.
As a result of different balance sheet structure, where Eurocash has a higher proportion of payables compared with inventory and receivables, and a relatively high debt/equity ratio, it generates a higher ROE compared with Emperia: 28.9% compared to 15.6% in 2008, ie, a 13.3pp difference. The difference was lower in 2007 (10.1pp) before Emperia issued shares. Since Emperia tends to improve profitability, unlike Eurocash, we expect the gap to narrow over time and to amount to 10.3pp in 2010F.
Our estimates versus consensus Our estimates are largely in line with consensus – the differences do not exceed 10%. However, it can be seen that our forecasts are slightly above consensus with respect to Emperia’s results and slightly below with respect to Eurocash. In the case of Emperia, it seems that consensus is outdated, since following the 4Q07 results the company announced its revenue will amount to PLN5.8bn in 2008, and in light of its historical guidance record (in 2007 revenues amounted to PLN4.6bn versus management’s expectations of PLN4.4bn), there is no reason to be more conservative. Once the consensus reflects the new guidance, our estimates are likely to fall in line with the average on the market.
… whereas Eurocash concentrates on less
profitable business
Eurocash competitive advantage is negative
working capital…
… but it will temporarily turn
positive
…translating to higher ROE of Eurocash
compared to Emperia
Proportionally higher payables result in
higher debt/equity…
Our estimates are higher than consensus for Emperia and lower
for Eurocash

7
FMCG distributors March 2008
For Eurocash, the situation is different. We understand that consensus assumes taking over McLane will not lead to margin deterioration. With 2007 McLane revenues constituting 21% of Eurocash sales and only 4% of pre-tax profit, we do not believe such a scenario is likely. We expect a temporary margin decline and look for consensus estimate cuts for Eurocash.
Fig 4 ING forecasts for Emperia vs consensus estimates (PLNm)
2008 2009 ING Consensus Difference (%) ING Consensus Difference (%)
Revenues 5,892 5,670 3.9 6,722 6,445 4.3 EBITDA 208 204 2.3 256 238 7.3 EBIT 164 149 10.0 196 174 12.6 Net profit 120 113 6.4 146 135 8.5
Source: Bloomberg, ING estimates _
Fig 5 ING forecasts for Eurocash vs consensus estimates (PLNm)
2008 2009 ING Consensus Difference (%) ING Consensus Difference (%)
Revenues 6,111 6,009 1.7 7,065 6,836 3.3 EBITDA 141 151 (6.5) 160 177 (9.9)EBIT 103 105 (2.0) 120 127 (5.5)Net profit 76 81 (6.3) 93 100 (7.0)
Source: Bloomberg, ING estimates
_
Investment conclusion Based on the arguments and valuation outcomes stated above, we rate Emperia BUY with a TP of PLN175 and Eurocash HOLD with a TP of PLN12.6.
Eurocash is traded at slightly higher multiples, 2008F PER of 20.8x compared with 18.8x; whereas it generates lower growth rates, 2007-2010F of 28% compared with 45%. We perceive such a situation as unjustified and expect Emperia’s multiples to grow beyond Eurocash’s.
Possible triggers In January 2007, Emperia started to consolidate BOS, which resulted in a tripling in sales and earnings YoY in each quarter. In 2008, we believe the growth in revenues and earnings driven by consolidation will be smaller, as the company is taking over larger number of smaller entities.
We believe Emperia will be the leading FMCG market consolidator in 2008. The company has adequate resources to finance acquisitions and is perfectly positioned to set the pace of market development as a whole. In our opinion, newsflow connected with M&A will be the key share price driver. In our view, the market has reached a point in which consolidation is inevitable to sustain high growth rates and not to fall behind the competition.
Moreover, we think that there is a considerable possibility that the company will not cease acquiring after it exhausts the c.PLN100m left from the funds raised in 2007. Emperia generates enough cash and has a sufficiently safe level of debt on its balance sheet.
Risks The FMCG retail and wholesale market should develop simultaneously in Poland, and we see no major threats to the industry as a whole. Even with high domestic inflation
Main share price driver: M&A news flow
Eurocash is more expensive, despite it growing more slowly

8
FMCG distributors March 2008
rates and rising global food prices, retail remains untouched, since these are goods of first need and people will still buy them no matter how much prices go up. In fact, a price increase is beneficial for the industry, since it translates into higher margins.
In the current stage of Emperia’s development, we see the substantial effort of consolidating all the acquired companies as the main risk. A year after merging with BOS, the group still has to reorganise internal practices and unify IT systems. Now, after taking over a dozen or so companies, and with further to come in 2008, the managerial and organisational push will be even harder. The risk is that the companies function in a suboptimal way, or that Emperia bears the restructuring costs, thus undermining margins.
Moreover, a temptation to overpay in future transactions may appear. To date, the company has been taking over with reasonable multiples (8-9x historical PER), but as more and more entities regard consolidation as the only way to go, it could result in a situation where the number of possible targets is diminishing, the number of potential acquirers is growing and the price expectations start to become unreasonable. And the company still has funds left from the SPO, so it has to spend it on acquisitions, even under such pressure.
Another risk connected with the current growth strategy is the possible distraction coming from the variety of different brands and chain formats. Emperia has become a large corporation with a number of different business lines, and at some point it could lose sight of its strategic scope and objectives.
Among the risks to our Hold recommendation on Eurocash is the price paid for McLane, which has not yet been revealed. Should it be too high (which would be more than PLN40m, in our view), it will hit the share price. If it turned out low, we believe the positive impact would be limited. Another negative impulse for the market price of Eurocash shares could be the possible revision of the consensus estimates, since we feel they do not reflect the influence of very low profitability of McLane on consolidated results of the group.
Emperia: risk connected with large number of
companies to consolidate…
… and brands to manage
Eurocash: uncertainty regarding price for
McLane

9
FMCG distributors March 2008
Valuation
We value both Emperia and Eurocash using a peer valuation and DCF model. Based on the outcomes of our valuations, we rate Emperia BUY with a TP of PLN175 and Eurocash HOLD with a TP of PLN12.6.
Fig 6 Emperia: target price calculation
DCF (PLN) 182.0Cost of equity (%) 11.1 12-month rolling DCF valuation (PLN) 202.2Peer valuation (PLN) 147.7Target price (PLN) 175.0 Current price (PLN) 149.9Share price return (%) 16.7Dividend (PLN) 0.90 Total return (%) 17.3
Source: ING estimates _
Fig 7 Eurocash: target price calculation
DCF (PLN) 12.6 Cost of equity (%) 11.1 12-month rolling DCF valuation (PLN) 14.0 Peer valuation (PLN) 11.3Target price (PLN) 12.6Current price (PLN) 12.2Share price return (%) 3.8Dividend (PLN) 0.23 Total return (%) 5.7
Source: ING estimates
_
DCF valuation We base our DCF valuation on financial models, whose details are described in the Financial analysis chapter of each company section. Below we present the underlying assumptions.
Fig 8 DCF model assumptions
2007 2008F 2009F 2010F 2011F
Emperia Wholesale share in revenues (%) 76.0 69.8 65.2 62.7 61.0 No. of C&C stores 65 71 79 89 97No. of distribution centres 2 9 11 11 11No. of Stokrotka stores 114 144 164 179 189No. of Stokrotka Premium stores 3 10 20 25 28No. of Groszek stores 578 678 728 758 778No. of other stores 500 1,160 1,330 1,390 1,415EBITDA margin (%) 3.8 3.5 3.8 4.1 4.6 Capex (PLNm) 175.0 105.8 79.0 68.8 52.5
Eurocash Traditional wholesale share in rev (%) 55.2 46.6 45.4 47.2 48.5 No. of C&C stores 102 110 120 130 135No. of distribution centres 6 9 9 9 9No. of Abc stores 2,494 2,694 2,944 3,194 3,319No. of Delikatesy Centrum stores 295 345 375 390 395EBITDA margin (%) 2.6 2.3 2.3 2.4 2.5 Capex (PLNm) 63.5 63.6 61.7 53.3 54.4
Source: Company data, ING estimates _
Emperia: Buy, PLN175 Eurocash: Hold,
PLN12.6

10
FMCG distributors March 2008
Our models are based on the following assumptions:
• Slight decrease in Emperia’s EBITDA margin in 2008 compared with unadjusted 2007 as a result of non-recurring gains in 2007.
• In the longer term, we expect Emperia’s profitability gradually to improve, as a result of increasing share of more profitable retail and improving efficiency of wholesale.
• For Eurocash, we foresee consecutive margins dropping in 2008, as a result of acquiring McLane.
• In consecutive years, we assume improving margins, mainly as a result of increased purchasing power in wholesale, but never to return to the level of 4.2% on EBITDA level noted in 2005, before 2006 acquisitions.
• We expect Eurocash to sustain its advantage of positive working capital, except for 2008, when we assume it will turn positive after taking over McLane.
Fig 9 EBITDA profitability
Fig 10 Cash conversion cycle (days)
2.0%
2.5%
3.0%
3.5%
4.0%
4.5%
5.0%
2005 2006 2007 2008F 2009F 2010F 2011F
Emperia Eurocash
-20
-15
-10
-5
0
5
10
15
20
2005 2006 2007 2008F 2009F 2010F 2011F
Emperia Eurocash
Source: Company data, ING estimates Source: Company data, ING estimates
_
• We do not assume Emperia will take over Lewiatan, and we account for consolidation of McLane from April 2008.
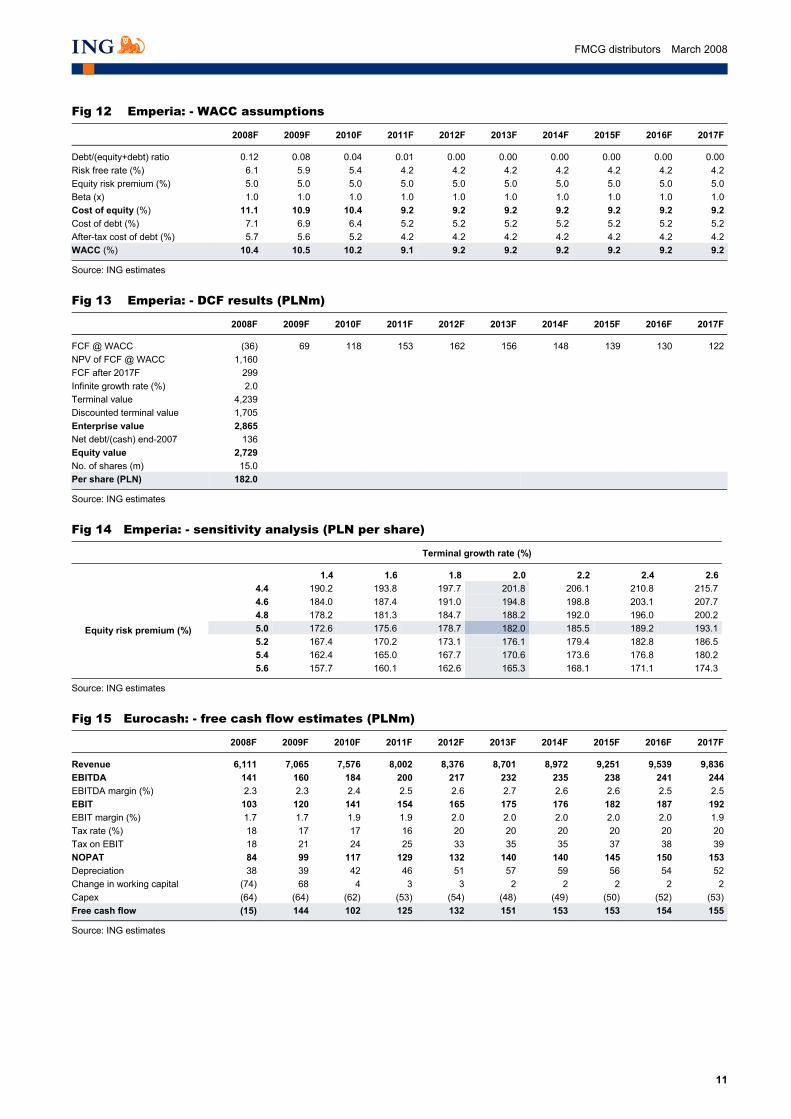
• In both models, we assume a risk-free rate of 5%, beta of 1 and growth rate after the forecast period of 2%.
Fig 11 Emperia: - free cash flow estimates (PLNm)
2008F 2009F 2010F 2011F 2012F 2013F 2014F 2015F 2016F 2017F
Revenue 5,892 6,722 7,394 7,938 8,351 8,722 9,106 9,505 9,920 10,352 EBITDA 208 256 306 368 385 398 411 424 437 450 EBITDA margin (%) 3.5 3.8 4.1 4.6 4.6 4.6 4.5 4.5 4.4 4.3 EBIT 164 196 238 293 304 317 319 347 371 390 EBIT margin (%) 2.8 2.9 3.2 3.7 3.6 3.6 3.5 3.7 3.7 3.8 Tax rate (%) 20 20 20 20 20 20 20 20 20 20 Tax on EBIT 33 39 48 59 61 63 64 69 74 78 NOPAT 131 157 190 235 243 253 255 278 297 312 Depreciation 44 59 68 75 81 81 92 76 65 60 Change in working capital (41) (26) (21) (17) (13) (12) (12) (12) (13) (13)Capex (175) (106) (79) (69) (53) (51) (52) (53) (54) (55)Free cash flow (40) 85 158 224 259 272 283 289 296 304
Source: ING estimates _
11
FMCG distributors March 2008
Fig 12 Emperia: - WACC assumptions
2008F 2009F 2010F 2011F 2012F 2013F 2014F 2015F 2016F 2017F
Debt/(equity+debt) ratio 0.12 0.08 0.04 0.01 0.00 0.00 0.00 0.00 0.00 0.00Risk free rate (%) 6.1 5.9 5.4 4.2 4.2 4.2 4.2 4.2 4.2 4.2Equity risk premium (%) 5.0 5.0 5.0 5.0 5.0 5.0 5.0 5.0 5.0 5.0Beta (x) 1.0 1.0 1.0 1.0 1.0 1.0 1.0 1.0 1.0 1.0Cost of equity (%) 11.1 10.9 10.4 9.2 9.2 9.2 9.2 9.2 9.2 9.2Cost of debt (%) 7.1 6.9 6.4 5.2 5.2 5.2 5.2 5.2 5.2 5.2After-tax cost of debt (%) 5.7 5.6 5.2 4.2 4.2 4.2 4.2 4.2 4.2 4.2WACC (%) 10.4 10.5 10.2 9.1 9.2 9.2 9.2 9.2 9.2 9.2
Source: ING estimates _
Fig 13 Emperia: - DCF results (PLNm)
2008F 2009F 2010F 2011F 2012F 2013F 2014F 2015F 2016F 2017F
FCF @ WACC (36) 69 118 153 162 156 148 139 130 122 NPV of FCF @ WACC 1,160 FCF after 2017F 299 Infinite growth rate (%) 2.0 Terminal value 4,239 Discounted terminal value 1,705 Enterprise value 2,865 Net debt/(cash) end-2007 136 Equity value 2,729 No. of shares (m) 15.0 Per share (PLN) 182.0
Source: ING estimates _
Fig 14 Emperia: - sensitivity analysis (PLN per share)
Terminal growth rate (%)
1.4 1.6 1.8 2.0 2.2 2.4 2.64.4 190.2 193.8 197.7 201.8 206.1 210.8 215.74.6 184.0 187.4 191.0 194.8 198.8 203.1 207.74.8 178.2 181.3 184.7 188.2 192.0 196.0 200.25.0 172.6 175.6 178.7 182.0 185.5 189.2 193.15.2 167.4 170.2 173.1 176.1 179.4 182.8 186.55.4 162.4 165.0 167.7 170.6 173.6 176.8 180.2
Equity risk premium (%)
5.6 157.7 160.1 162.6 165.3 168.1 171.1 174.3
Source: ING estimates __
Fig 15 Eurocash: - free cash flow estimates (PLNm)
2008F 2009F 2010F 2011F 2012F 2013F 2014F 2015F 2016F 2017F
Revenue 6,111 7,065 7,576 8,002 8,376 8,701 8,972 9,251 9,539 9,836 EBITDA 141 160 184 200 217 232 235 238 241 244 EBITDA margin (%) 2.3 2.3 2.4 2.5 2.6 2.7 2.6 2.6 2.5 2.5 EBIT 103 120 141 154 165 175 176 182 187 192 EBIT margin (%) 1.7 1.7 1.9 1.9 2.0 2.0 2.0 2.0 2.0 1.9 Tax rate (%) 18 17 17 16 20 20 20 20 20 20 Tax on EBIT 18 21 24 25 33 35 35 37 38 39 NOPAT 84 99 117 129 132 140 140 145 150 153 Depreciation 38 39 42 46 51 57 59 56 54 52 Change in working capital (74) 68 4 3 3 2 2 2 2 2 Capex (64) (64) (62) (53) (54) (48) (49) (50) (52) (53)Free cash flow (15) 144 102 125 132 151 153 153 154 155
Source: ING estimates

12
FMCG distributors March 2008
Fig 16 Eurocash: - WACC assumptions
2008F 2009F 2010F 2011F 2012F 2013F 2014F 2015F 2016F 2017F
Debt/(equity+debt) ratio 0.06 0.03 0.02 0.01 0.01 0.01 0.01 0.00 0.00 0.00Risk free rate (%) 6.1 5.9 5.4 4.2 4.2 4.2 4.2 4.2 4.2 4.2Equity risk premium % 5.0 5.0 5.0 5.0 5.0 5.0 5.0 5.0 5.0 5.0Beta (x) 1.0 1.0 1.0 1.0 1.0 1.0 1.0 1.0 1.0 1.0Cost of equity (%) 11.1 10.9 10.4 9.2 9.2 9.2 9.2 9.2 9.2 9.2Cost of debt (%) 7.1 6.9 6.4 5.2 5.2 5.2 5.2 5.2 5.2 5.2After-tax cost of debt (%) 5.7 5.6 5.2 4.2 4.2 4.2 4.2 4.2 4.2 4.2WACC (%) 10.8 10.7 10.3 9.2 9.2 9.2 9.2 9.2 9.2 9.2
Source: ING estimates _
Fig 17 Eurocash: - DCF results (PLNm)
2008F 2009F 2010F 2011F 2012F 2013F 2014F 2015F 2016F 2017F
FCF @ WACC (14) 117 75 85 82 86 79 73 67 62 NPV of FCF @ WACC 713 FCF after 2017F 155 Infinite growth rate (%) 2.0 Terminal value 2,207 Discounted terminal value 883 Enterprise value 1,596 Net debt/(cash) end-07 (32) Equity value 1,628 No. of shares (m) 129.6 Per share (PLN) 12.6
Source: ING estimates _
Fig 18 Eurocash: - sensitivity analysis (PLN per share)
Terminal growth rate (%)
1.4 1.6 1.8 2.0 2.2 2.4 2.64.4 13.1 13.3 13.5 13.8 14.0 14.3 14.64.6 12.7 12.9 13.1 13.3 13.6 13.8 14.14.8 12.3 12.5 12.7 12.9 13.2 13.4 13.75.0 12.0 12.2 12.4 12.6 12.8 13.0 13.25.2 11.7 11.8 12.0 12.2 12.4 12.6 12.85.4 11.4 11.5 11.7 11.9 12.0 12.2 12.4
Equity risk premium (%)
5.6 11.1 11.2 11.4 11.5 11.7 11.9 12.1
Source: ING estimates
The estimated current fair value of Emperia amounts to PLN182 per share and PLN12.6 per share for Eurocash.
Comparative valuation The fair value of one Emperia share amounts to PLN147.7, and one Eurocash share to PLN11.3, based on arithmetic average of 2008-2009F PER and EV/EBITDA ratios and four peer groups: Polish food retailers, Polish non-food retailers, emerging market food retailers and developed market food retailers.
Emperia and Eurocash are traded at very similar ratios: Emperia is slightly cheaper on 2008-09F PER (18.8-15.3x compared to 20.8-17.0x) but slightly more expensive on 2008-09F EV/EBITDA (11.8-9.4x compared to 11.5-9.5x).
Nevertheless, we believe there are reasons why Emperia should be traded at a premium to Eurocash. Above all, it shows higher growth: 2006-09F diluted EPS CAGR of over 50% compared with 30%, taking into account 1.5m shares issued by Emperia in 2007 and an estimated 1.03m shares that will be issued by Eurocash to pay for the McLane acquisition (equivalent of US$5m in shares and an undisclosed amount in cash).

13
FMCG distributors March 2008
Fig 19 PER comparison
Fig 20 EV/EBITDA comparison
19.1
22.924.7
14.115.5
19.3 18.4
12.6
0
5
10
15
20
25
30
Polish foodretail
Polish non-foodretail
Emergingmarkets
Developedmarkets
2008 2009
9.6
14.5
11.210.1
7.8
12.2
8.6 9.2
0
2
4
6
8
10
12
14
16
Polish foodretail
Polish non-foodretail
Emergingmarkets
Developedmarkets
2008 2009
Source: ING estimates, Bloomberg Source: ING estimates, Bloomberg
_
The least expensive in terms of PER are developed markets, since the growth of large multinational companies comprising this category is the most limited. The most expensive in terms of both multiples are emerging market food retailers as well as Polish non-food retailers. We see this as justified, since we expect non-food consumption to grow faster than spending on food.
Fig 21 Diluted 2006-2009F EPS CAGR of emerging market food retailers
0.0% 10.0% 20.0% 30.0% 40.0% 50.0% 60.0%
Alma
7 Continent
Mercator Poslovni Sistem
Bim
Eurocash
Magnit
Migros
Bomi
Emperia
Dixy
X5 Retail Group
Source: ING estimates, Bloomberg
_
The fact that emerging market companies are valued the highest is usually explained by their superior growth perspectives, but comparing particular companies’ EPS growth shows that this is true only for some of them. Of the Polish food retailers, the largest 2007-2009F growth rate in diluted EPS is shown by Emperia.

14
FMC
G distributors
March 2008
_
Fig 22 Peer valuations table
Company Bloomberg ING rec Listing Primary Price Mkt cap PER EV/EBITDA ticker currency exchange (25/03/2008) (EURm) 2007F 2008F 2009F 2007F 2008F 2009F
Polish food retail Alma ALM PW Hold PLN Poland 80.2 104 20.9 19.6 16.6 12.5 9.3 7.9 Bomi BMI PW Buy PLN Poland 25.3 140 26.7 17.2 13.3 19.2 5.8 4.5 Emperia EMP PW Buy PLN Poland 149.9 661 25.0 18.8 15.3 13.7 11.8 9.4 Eurocash EUR PW Hold PLN Poland 12.2 461 26.6 20.8 17.0 12.6 11.5 9.5 Average 24.8 19.1 15.5 14.5 9.6 7.8
Polish non-food retail Empik M&F EMF PW Hold PLN Poland 20.0 633 28.4 20.4 14.9 14.8 10.9 8.8 LPP LPP PW Buy PLN Poland 2,305 1,207 26.2 20.5 16.6 18.0 13.6 12.0 NG2 CCC PW Hold PLN Poland 43.0 507 27.1 17.1 13.2 18.9 13.3 11.4 Ruch RCH PW N/R PLN Poland 18.0 339 28.1 36.3 34.5 15.6 20.6 16.6 Vistula&Wolczanka VST PW Hold PLN Poland 9.83 242 27.5 20.4 17.1 11.9 14.2 12.1 Average 27.5 22.9 19.3 15.8 14.5 12.2
Emerging markets Bim BIMAS TI Buy TRY Turkey 109 1,528 25.4 21.2 16.9 15.5 14.0 11.4 Dixy DIXY RU N/R USD Russia 14.55 629 44.3 19.1 13.8 13.9 9.0 7.1 Magnit MGNT RU Hold USD Russia 49.0 2,048 50.4 39.2 27.2 14.0 10.6 8.1 Mercator Poslovni Sistem MELR SV N/R EUR Slovenia 324 1,164 28.9 24.8 21.1 12.1 12.8 9.2 Migros MIGRS TI Buy TRY Turkey 19.6 2,757 18.7 17.9 17.4 9.6 9.3 9.3 7 Continent SCON RU Buy USD Russia 23.2 1,673 21.3 27.9 16.9 13.3 11.5 6.9 X5 Retail Group FIVE LI Buy USD Russia 29.1 6,174 42.4 22.8 15.8 15.3 10.8 8.3 Average 33.1 24.7 18.4 13.4 11.2 8.6
Developed markets Alfa-Beta Vassilopoulos S.A. BASIK GA N/R EUR Greece 36.5 5 13.7 10.5 8.7 6.8 5.8 5.0 Carrefour SA CA FP Hold EUR France 46.0 32,447 16.7 15.3 13.9 8.1 7.4 6.8 Casino Guichard Perrachon CO FP Buy EUR France 63.4 7,095 13.6 12.2 11.3 7.6 6.3 5.9 Colruyt SA COLR BB Buy EUR Belgium 157 4,945 17.0 15.4 14.2 9.2 8.2 7.3 Delhaize Group DELB BB Buy EUR Belgium 46.4 4,604 11.1 9.2 8.0 5.2 5.0 4.4 Guyenne et Gascogne SA GG FP N/R EUR France 94.9 98 16.1 15.5 14.8 43.3 40.8 36.9 Koninklijke Ahold NV AH NA Buy EUR Netherlands 7.79 9,158 10.7 10.4 8.8 5.1 4.8 4.1 Metro AG MEO GR Hold GBP Germany 53.0 17,303 21.9 15.0 13.3 8.3 7.5 7.0 Sainsbury plc SBRY LN N/R GBP UK 342 4 20.7 18.1 15.3 7.4 7.3 6.6 Tesco plc TSCO LN N/R EUR UK 405 5 15.1 15.3 13.6 9.1 9.4 8.5 WM Morrison Supermarkets MRW LN N/R GBP UK 294.5 37 27.9 17.8 16.7 11.2 9.0 8.3 Average 16.8 14.1 12.6 11.0 10.1 9.2
Source: ING estimates, Bloomberg

15
FMCG distributors March 2008
Market overview
FMCG wholesale market Market outlook According to the Polish Statistical Office, the total wholesale market in Poland amounted to PLN632bn in 2007. With respect to food and non-alcoholic beverages, it totalled PLN83bn.
FMCG distribution market is highly fragmented. Companies of below 1% market share constitute almost two-thirds of the total market. The sector is dominated by local entities, the international groups are active only in the C&C segment (Metro AG, Otto/Rewe in Selgros). The market is undergoing consolidation processes, the number of active companies is decreasing also due to fierce competition and low margins.
Fig 23 FMCG wholesale market, 2006 (by sales)
Fig 24 Wholesale companies number
Others61.6%
McLane1.6%
Makro Cash&Carry
7.1%
CEDC5.6%
Emperia (wholesale
part)4.9%
Polski Tyton2.3%
Lekkerland3.5%
Ruch3.6%
Eurocash6.0%
Selgros Cash&Carry
3.8%
0
2,000
4,000
6,000
8,000
10,000
12,000
14,000
16,000
18,000
1997 1998 1999 2000 2001 2002 2005
Source: Company data, ING estimates Source: Company data, ING estimates
Franchise concept The second trend visible in wholesalers’ strategies is organising their customers into franchise chains. Leading wholesalers have developed several franchise concepts which offer a number of advantages for the franchisors:
• Additional portion of revenues from delivery and franchise fee.
• More stability and predictability in revenues.
• Improvement of negotiating power with respect to producers.
• Ability to offer producers the possibility of organising marketing campaigns in stores.
• Keeping both the wholesale and part of retail margin.
• Optimal utilisation of logistics infrastructure.
• Ability to influence the trends on the retail market.
Polish FMCG market on the wholesale level was
worth over PLN83bn
Main features: high fragmentation…
… and growing popularity of franchise
chains

16
FMCG distributors March 2008
Fig 25 Franchise chains market share, 2007 (by stores number)
Fig 26 Leading franchise chains sales, 2006 (PLNm)
Lewiatan Holding
13%
Zabka13%
Others6%
Emperia (Groszek,
Euro Sklep, others)10%
Nasz Sklep5%
McLane (IGA)2%
Makro C&C (ARO)22%
Eurocash (abc,
Delikatesy Centrum)
19%
Bomi (Siec34, eLDe)10%
0
500
1,000
1,500
2,000
2,500
3,000
3,500
Lewiat
an
Siec 34
(Bom
i)
abc (
Euroca
sh)
Interm
arche
ARO (Mak
ro)
Zabka
Sklepy
F.J.
eLDe (
Bomi)
IGA (M
cLan
e)
Delika
tesy C
entru
m (Euro
cash
)
Grosze
k (Empe
ria)
Nasz S
klep
Euro Skle
p (Empe
ria)
Chata
Polska
Sklepy
dla C
iebie
Nasze
Skle
py
Top M
arket
Sklep P
olski
Rabat
Piotr i
Pawel
Source: Company data, ING estimates Source: Company data, ING estimates
_
Also from the small retailers’ point of view, the franchise concept is beneficial. They need to gain scale in purchasing power in order to compete with hypermarket chains. That is why they organise into common purchase groups or use opportunities given by wholesalers in the franchise system. Thanks to those two phenomena, as well as the low urbanisation rate in Poland, the traditional format trade still controls the majority of the retail market. The estimated share of small and medium-sized grocery stores in Poland which are organised into franchise chains is 15% of the total number of c.100,000 stores.
FMCG retail market Market outlook The value of the Polish retail market in 2006 was estimated at PLN468bn, excluding the sales conducted in unorganised retail locations, mainly open-air markets. Food and non-alcoholic beverages segment represented nearly 30% or PLN130bn. Overall FMCG market on the retail level was worth over PLN170bn. According to our estimates, the 2007 figures amounted to PLN148bn and PLN193bn respectively. From the beginning of the decade, the FMCG market has been showing unimpressive growth of 4.5% pa. In the last few years, some acceleration has been visible, owing to an improvement in the Polish economy. In the coming years, we forecast spending on FMCG will continue to grow. This should be the combined effect of a further drop in unemployment, salary growth, as well as increased inflation predominantly in food (world demand growth) and tobacco (excise tax rises), but the growth will still be single-digit, because as disposable income grows, food has a diminishing share in total consumption.
Main store formats Based on our estimates and data provided by the listed companies operating in the FMCG retail and wholesale business in Poland, an estimated 40% of retail sales in the FMCG category were conducted within modern trade retail locations such as hypermarkets and supermarkets.
Over the last three years, large space hypermarkets, supermarkets, and discounts were unsuccessful in increasing their overall stake in the FMCG segment, as their share level was at just over 40%. Market participants estimate that modern trade will
Polish FMCG market on the retail level was
worth over PLN170bn
Strong traditional trade position
Modern trade having difficulties increasing
penetration

17
FMCG distributors March 2008
increase its penetration to nearly 50% by the end of 2010. As a result, in terms of the FMCG retail market structure, Poland is often compared with Spain, where the breakdown between the traditional and modern trade is 40% to 60% respectively, lower than in other mature western European markets, where modern trade represents over 70% of all sales.
Fig 27 FMCG: retail market value (PLNbn)
Fig 28 FMCG: retail sales channels
136 137 141 146160 162 164 171
193
0
50
100
150
200
250
2000 2001 2002 2003 2003 2004 2005 2006 2007F
84% 78% 74% 71% 68% 67% 59% 57% 58%50%
16% 22% 26% 29% 32% 37% 41% 43% 42%50%
0%
10%
20%
30%
40%
50%
60%
70%
80%
90%
100%
1998 1999 2000 2001 2002 2003 2004 2005 2006 2010
Traditional trade Modern trade
Source: Central Statistical Office, ING estimates Source: GfK Polonia
_
There are a number of arguments supporting the sustained high share of traditional channels in FMCG retail distribution in Poland. The most important is the high share of overall population living in rural areas and small towns (70%, compared with 12% in Germany for example), whose size makes modern trade economically unfeasible. Also, on a daily basis, the abovementioned segment of the population is characterised by low mobility, which makes the traditional trade the only accessible channel. Low average dwelling size makes the storage of large quantities of food impractical and also encourages frequent grocery purchases.
Fig 29 FMCG: retail market structure (2006)
Fig 30 FMCG: retail market, 2007 (by sales)
Supermarkets9%
Discounters9%
Small grocery stores14%
Specialty food4%
HoReCa13%
Hypermarkets 17%
Large & medium
grocery stores21%
Convenience stores/gas stations/ kiosks13%
Eurocash1.6% Musketers
Group1.1%Leclerc
1.1%
Lewiatan Holding2.1%
Auchan 2.6%
Metro Group2.6%
Carrefour3.6%
Spolem4.0%Tesco
4.3%
POLOmarket1.0%
Bomi, prev Rabat
Pomorze1.9%
Schwarz0.8%
Others68.7%
Jeronimo Martins4.7%
Source: GfK Polonia Source: Company data, ING estimates
_
The fastest growing categories of the FMCG retail market are delicatessen, supermarkets and discounts. According to GfK Polonia, PMR, AC Nielsen and PriceWaterhouseCoopers research, in the coming years the continued expansion of delicatessen and supermarkets is expected, whereas with respect to discounts the
Structural aspects supportive for the long-
term strong traditional channel position
CAGR=4.5%
+13.2%
Categories to grow fastest: delicatessen
and supermarkets

18
FMCG distributors March 2008
growing trend should level off, as together with GDP and disposable income growth, people will be less interested in saving on quality. Anticipation of this event is seen in the new approach of Jeronimo Martins, the owner of Biedronka, Poland’s leading discount chain, with 1,430 stores as at the end of 2007. Biedronka’s brand image is evolving towards higher quality, furthermore the company plans to launch a supermarket chain based on 210 Plus stores acquired last year, focusing less on discount stores development than before (the company decreased its target number of new stores from 130 annually to 70-100). Small and medium-sized traditional grocery stores’ market share should decrease slowly in the coming years. In 2007, of c.100,000 small and medium-sized grocery stores in Poland, as many as 16,000 closed their doors.
Consolidation processes Both FMCG retail and wholesale segments are undergoing intensified M&A activity. The market value has been growing at below 5% pa, and although we forecast some acceleration, it will still be single-digit in coming years. The sole possibility for growth will be to consolidate the market. Moreover, it is fragmented (the top 10 wholesalers hold c.40% of the market and top 10 retailers below 30%), so consolidation is a natural process, enabling economies of scale and improving the profitability and competitiveness of the sector.
On top of leveraging on scale in retail to retail (eg, Real taking over Geant), and wholesale to wholesale (Eurocash taking over KDWT) companies M&A, growing number of entities are looking for synergies in bringing these two segments together (eg, Bomi taking over Rabat Pomorze).
Fig 31 Largest M&A deals in the Polish FMCG market
Acquirer Target Date Transaction value(PLNm)
Retail-retail Carrefour Globi 2001 2700**Tesco HIT (Dohle) 2002 2600Ahold Jumbo (Jeronimo Martins) 2002 80Carrefour Hypernova, Albert (Ahold) 2004 1450Tesco Julius Meinl 2005 undisclosedReal Geant (Casino) 2006 860Tesco Leader Price (Casino) 2006 400POLOmarket ABC 2006 20Penta Investments Żabka 2007 500Biedronka (Jeronimo Martins) Plus 2008 1300***Bomi Rast 2008 210*Wholesale-wholesale CEDC Imperial 2005 6CEDC Classic 2006 4Eurocash KDWT 2006 61Lekkerland Milo 2006 171Emperia Sydo 2007 25CEDC PHS 2007 21Eurocash McLane 2008 40*Mixed Eurocash Delikatesy Centrum 2006 35Eldorado (now: Emperia) BOS 2006 234Bomi Rabat Pomorze 2008 280*
* ING estimate of the future transaction value ** Total price for 27 Polish stores, 133 Belgian stores and 350 franchise stores in Belgium *** Total price for 210 stores in Poland and 75 stores in Portugal Source: Company data, ING estimates
_
Intensified M&A activity in both
wholesale and retail

19
FMCG distributors March 2008
Consolidation and strengthening competition connected with growing scale of market participants will lead to a lower number of retailers. PriceWaterhouseCoopers estimates, that to 2010 the number of large retail chains will drop from 20 to five as a result of M&A, just as happened in western Europe. AC Nielsen estimates that there will be only three hypermarket, six Polish and four foreign supermarket, three delicatessen and three discount chains and small shops will be organised in 15 franchise chains/common purchase groups. Regardless of how exact these estimates are, the trend toward merging both large and small retailers is inevitable.
In our opinion, however, the phase of large mergers is over, since large entities wishing to withdraw from Poland have already done so (Ahold, Casino, Plus) and there are new international entrants (eg, Aldi and continuing press speculation regarding Wal-Mart) who will invest heavily at least in the next few years. The remaining competitors are small entities, predominantly privately held. We believe the market will enter the phase of large number of smaller transactions, both in retail and wholesale segment.
Tobacco market We decided to describe the tobacco market separately, since this is a unique segment of the FMCG market. We find some observations of developed countries’ experiences useful in analysing the market in Polish context:
• The smoking ban in public places has led to lower consumption (from 4% in Denmark, 7% in UK to 20% even in Italy).
• Cigarettes are one of very few categories where consumption in Poland is higher compared with developed countries.
• Lower consumption in the developed markets is the result of healthy lifestyle endorsement and increased interest in limiting unhealthy activities.
_
Fig 32 Tobacco market, 2006 (by sales)
Fig 33 Tobacco sales (bn units) and excise (PLN)
Others40%
Stopol2%
Eurocash12%
Frega4%
McLane3%
Lima3%
Ruch8%
Polski Tyton9%
Lekkerland14%
Kolporter5%
72.3 72.8 72.0 73.9 72.4 69.9
9181
756864
5752
0
10
20
30
40
50
60
70
80
2002 2003 2004 2005 2006 2007 20080
10
20
30
40
50
60
70
80
90
100
Volume sales Excise tax per 1000p (rhs)
Source: Company data, ING estimates Source: AC Nielsen, Ministry of Finance, ING estimates
_
As the domestic tobacco market is unique, we believe some of those characteristics will look different in Poland. In particular:
• The jury is still out on whether a ban on smoking in public places will be introduced in Poland. In March 2008, parliament was scheduled to begin working on such a bill. Nonetheless, we believe that even if a ban were implemented the impact on
Large number of smaller acquisitions
to come

20
FMCG distributors March 2008
demand for cigarettes would be lower than in countries like Italy or the UK, since far fewer people are spending time in restaurants, pubs and clubs in Poland. People tend to spend time and smoke at home or their friends’ homes rather than in public places. Poles visit restaurants 10 times a year on average, compared with 60 visits for western Europeans. However, we understand that the bill could ban smoking not only in pubs, restaurants, and cafés, but also at bus stops and in train stations, which would have far more serious impact on cigarette consumption in Poland.
• Further increases in excise tax (the European Community requires Poland to raise this to EUR64 per 1,000 cigarettes until 1 January 2009) will not necessarily lead to a large drop in cigarette volume sales. In 2007, the excise tax grew 23% and the volume change of the cigarettes sales was up 0.5% or down only 3.5% (depending on the data source), for two reasons: (1) demand for cigarettes is very price inelastic; (2) despite the fact that rises are conducted once a year (at the beginning), their impact on the market is gradual, as tobacco manufacturers produce more cigarettes at the year-end in order to sell more with lower excise tax. As a result, since volumes will most likely stay flat, the value of the market should grow, as prices grow. Assuming the ex-excise price stays flat to 2009 and so do volumes, the market value will increase by c.30% compared with 2007, according to our estimates.
• Another reason for decreasing demand for cigarettes in the developed countries is that smoking has become unfashionable. The healthy lifestyle idea is still not being adopted in Poland, and we believe smokers’ addiction will continue to overcome fashion trends.
Despite the fact that the tobacco market seems unattractive at first sight, it turns out that most threats are not severe. Moreover, a growing excise tax is good for producers and distributors, because it should lead to market value growth, but not for all distributors. In case of smaller entities, the need to increase working capital due to a higher share of excise tax on turnover will be difficult. The tobacco market is fragmented (40% of the market is held by entities of less than 1% market share) and of low profitability (KDWT, with 0.46% net profit margin, is the most profitable entity in the sector). Smaller participants will not be able to afford increasing their working capital and will be forced out of the market or taken over, in our view. We consider this as a chance for large companies like KDWT to grab market share.
Smoking ban and excise tax rises are
not severe threats

21
FMCG distributors March 2008
Companies

22
FMCG distributors March 2008
This page is left blank intentionally

23
FMCG distributors March 2008
Poland
Emperia All-conquering empire
Key ratios (%)
2008F 2009F
EBITDA margin 3.5 3.8Operating margin 2.7 2.9Net debt/equity 25.6 16.4DPS (PLN) 0.90 1.18Dividend yield 0.61 0.81
Quarterly data (PLNm)
4Q06 4Q07
Revenue 388 1,208EBITDA 10 50Net income 3 25EPS (PLN) 0.39 1.66
12-month forecast returns (%) Share price 16.7Dividend 0.612m f'cst total return 17.3
Share price performance
507090
110130150170190
12/06 8/07 3/08
Price WIG rebased
Source: Reuters
Share data No. of shares (m) 15.0Daily t/o (US$m) 0.54Free float (%) 66.4Mkt cap (US$m) 977.0Mkt cap (PLN m) 2247.0
We believe Emperia will play the leading role in the consolidation of the Polish FMCG market, and as a result will show superior growth rates. We initiate coverage with a BUY recommendation and TP of PLN 175.
Initiating Coverage
PLN149.9Price (25/03/08)
Buy
Food & drug retailers
PLN175 Target price (12 mth)
EMP PW/EDRO.WA Bloomberg/Reuters
Dorota Puchlew, CFAWarsaw (4822) 820 50 26 [email protected]
Key market consolidator. Emperia will set the pace for Polish FMCG consolidation, in our view. The company has shown both a track record (small and large acquisitions not affecting profitability) and the determination to integrate the market by selecting value-accretive opportunities.
Growing profitability. The company already has higher margins than Eurocash, thanks to a superior business model (exposure to retail and no interest in tobacco), and we believe there is potential to enhance them further, as we expect retail will gain optimal scale, increase its share in total revenues and as wholesale integrates and optimises costs.
Satisfactory growth rates sustained. Thanks to its aggressive participation in the consolidation and exposure to retail (1/4 of sales), we expect Emperia will continue to show above-average earnings growth rates.
Valuation/recommendation. Our TP of PLN175 is based on a DCF model and multiple valuation. We believe Emperia deserves a premium in valuation to Eurocash, and rate it BUY. M&A newsflow should drive the price.
Forecasts and ratios (PLN m)
Yr to Dec 2006 2007 2008F 2009F 2010F
Revenue 1,407 4,597 5,892 6,722 7,394EBITDA 51 173 208 256 306Net income 23 90 120 146 185EPS (PLN) 2.8 6.0 8.0 9.8 12.3PER (x) 53.6 25.0 18.8 15.3 12.1PEG (3y) 1.0 0.4 0.7 0.6 0.5EV/EBITDA (x) 45.7 13.7 11.8 9.4 7.4ROE (%) 10.1 17.1 16.1 17.0 18.4
Source: Company data, ING estimates

24
FMCG distributors March 2008
Summary
Recommendation We initiate coverage of Emperia with a BUY recommendation and TP of PLN175. We believe the company is well positioned to play the leading role in the consolidation process of the Polish FMCG market.
Market context Polish FMCG market has reached a stage in which consolidation is inevitable to sustain growth rates and preserve profitability. We believe Emperia is better positioned to be the leading integrator of the market than Eurocash, and shows more determination to bring value-adding M&As.
Superior profitability Emperia has considerably higher margins than Eurocash (3.5% adjusted EBITDA margin in 2007, compared with 2.6%), as a result of a different business model: Emperia is exposed to the retail market, which is not only more profitable (retail has traditionally larger share in product’s final price than wholesale), but also more dynamic: it is easier to grow not only organically by opening new stores, but also through acquisitions.
Superior growth rates Thanks to its more aggressive approach to consolidation, more value-accretive acquisitions which do not undermine profitability (as opposed to KDWT and McLane in case of Eurocash), as well as a growing involvement in the retail market, Emperia is growing faster than its rivals and we believe it will continue to do so in the future.
Peer valuation The company trades almost on a par with Eurocash, but we believe it deserves a premium due to its superior growth prospects. Our 2007-2010F diluted EPS CAGR amounts to 45%, compared with 28% for Eurocash.
DCF model Our DCF valuation renders PLN202.2 per share on a 12-month horizon. We base our forecasts on conservative assumptions of 3% like-for-like sales growth and no further acquisitions (including expected Lewiatan Holding transaction).
Share price catalysts We believe the company will continue to integrate the FMCG market, and news flow connected with consecutive transactions should support the share price.
Key risks to our recommendation The main risk we see with respect to Emperia is the large number of recently acquired companies to be consolidated. Despite the fact that the company has a satisfactory record in bringing together different entities without damaging margins, there is a possibility that some restructuring costs will emerge. Moreover, it will become more difficult to manage such an expanded and diversified company, with many brands and business lines.

25
FMCG distributors March 2008
Company overview
Emperia Holding is one of the leading FMCG wholesalers in Poland. In its wholesale segment it deals with both the active distribution and cash & carry format (under the Emperia brand). The company is also exposed to the FMCG retail segment, through proprietary and franchise chains (under brands Stokrotka, Groszek and others). On top of that, there are two auxiliary companies in the holding structure: Elpro to deal with real estate property, and Infinite to provide IT solutions, whose activity is marginal for the group (revenues of PLN10.9m and PLN12.2m respectively).
Business model Wholesale The most important segment of Emperia business is wholesale, comprising 76% of total 2007 revenues. The company uses following distribution channels:
• Active distribution: sales with transport to the customer’s premises using infrastructure of three distribution centres and an internally developed Electronic Data Interchange (EDI) system. This channel is used predominantly by large customers, such as supermarkets and large grocery stores.
• Cash & carry stores: products are sold for cash and transported by customers in exchange for a favourable price. Such an offer is used by small grocery stores that prefer to pay less and take care of transport themselves. C&C clients are grocery stores only (they are not open to the public, like Metro Group’s Makro C&C) and purchase of single units is possible (also a factor differentiating it from Makro, where only wholesale packaging products are available).
• HoReCa (hotels, restaurants and catering) servicing: deliveries to hotels and restaurants using specialist vehicles and non-standard packages.
• Van selling: direct cash sales of selected products by salesmen driving from customer to customer.
• Sub-wholesale: sales to smaller wholesalers.
Fig 34 Wholesale revenues structure, 2007
Fig 35 Wholesale infrastructure, year-end
Active distribution
65%
Cash&carry19%
HoReCa8%
Vanselling2%
Sub-wholesale
6%
16 16 16
6571
79
89
111
111111
9
0
10
20
30
40
50
60
70
80
90
100
2004 2005 2006 2007 2008F 2009F 2010F0
2
4
6
8
10
12
Cash&carry outlets Distribution centres (rhs)
Source: Company data, ING estimates Source: Company data, ING estimates
_
Emperia deals with FMCG wholesale
(76% of sales) and retail

26
FMCG distributors March 2008
Emperia Holding acts as a wholesaler in almost the whole country, but it has weaker infrastructure in western Poland. The country is divided into five macro-regions managed locally. At present, Emperia has three distribution centres, of which two are rented (Blonie near Warsaw, and Gdansk) and one owned by the company (Lublin). Transport is organised internally: the company’s fleet comprises 700 vehicles at present, from which the majority is leased. There are 65 cash & carry outlets, offering 6,000-7,000 stock-keeping units (SKUs) depending on space, which ranges from 1,500m2 to 5,000m2 and averages 3,000m2. Total number of SKUs offered by Emperia wholesale part amounts to 12,000.
Retail With respect to retail business, three store models are used:
• Proprietary chains: Stokrotka, Stokrotka Premium (brand name subject to change) and other brands taken over in 2007 and 2008 (eg, Euro Sklep).
• Franchise chains: Groszek and other brands taken over in 2007 and 2008 (eg, Lewiatan).
• Partnership stores: Jaskolka, Milea and other brands which could be possibly taken over in 2008.
Fig 36 Revenue split (PLNm)
Fig 37 Number of retail stores, year-end
0
500
1,000
1,500
2,000
2,500
3,000
3,500
4,000
4,500
5,000
2004 2005 2006 2007 2008F 2009F 2010F
Wholesale Retail & franchise
43 55 64
364451 510
578
1,160
1,3301,390
204184154117
758728678
500
0
200
400
600
800
1,000
1,200
1,400
1,600
2004 2005 2006 2007 2008F 2009F 2010F
Stokrotka Groszek Other stores
Source: Company data, ING estimates Source: Company data, ING estimates
_
Stokrotka comprises 114 stores with space ranging between 300m2 and 1,400m2. Stores are located in large, medium and small cities, predominantly near to housing districts. Stokrotka stores are present across the whole country, with the largest concentration in central and eastern Poland. Depending on space, they offer from 4,000 to 10,000 products, including grocery, tobacco, alcohol, press and cosmetics. Perishables amount to as much as 35% of total Stokrotka sales. Approximately 65% of supplies are delivered by Emperia, the rest (perishables, bread, frozen products, press, etc) is purchased externally.
Stokrotka Premium is a new chain to be developed by Emperia, based on the premium supermarket or delicatessen format. There are three such stores, located in Lublin, Sosnowiec and Rybnik. Stores are supposed to have up to 2,000 m2 in space and to offer 10,000-20,000 SKUs. Emperia will cover a lower percentage of supplies than in the case of Stokrotka, since at least for now the company has no real competence in the premium products field.
Active in whole country, 12,000 SKUs
offered
Stokrotka supermarket: 300-1,400m2 space;
4,000-6,000 SKUs
Stokrotka Premium: delicatessen with up to
2,000m2 of space and 20,000 SKUs

27
FMCG distributors March 2008
Franchise chains are based on the soft franchise model, in which the franchisee is obliged to purchase a minimum amount monthly from the franchisor and pays a franchise fee. The flagship franchise brand for Emperia is Groszek.
The Groszek chain consists of 654 stores, where space in each branch amounts to 80-400m2. The stores are situated in small and medium-sized cities, near housing districts. Their format is close to that of the convenience store, and has a carefully selected offer. Depending on location and space, Groszek stores offer from 4,000 to 6,000 products, including groceries, tobacco, alcohol, press and cosmetics. The Emperia wholesale division covers approximately 35% of Groszek’s supplies.
In the partnership business model (Milea and Jaskolka brands) the store owner has a closer relationship with the wholesaler than in the soft franchise model. Emperia organises the whole supply to the partner, who has no responsibility for delivery conditions, product mix, ordering or stock management. This model could be seen as strict franchise, but Emperia wishes to be flexible with respect to shop owners and offer them solutions suited to their individual needs.
Fig 38 Emperia business model
Source: ING estimates
_
Groszek: main soft franchise chain
Partnership stores: similar to strict
franchise

28
FMCG distributors March 2008
Growth strategy
Emperia has shown its capability to develop both organically and through acquisitions. The strategy of the company assumes a continuation of this general approach.
Organic growth The company is conducting a process of reorganising and optimising its activities. Planned accomplishments are divided into the following fields:
• Distribution infrastructure improving. The country will be divided into five macroregions, for which managing separate local teams will be dedicated. Moreover, the warehouse and distribution centre infrastructure will be strengthened: from two as at end-2007 to 11 distribution centres to the end of 2008. The number of cash & carry stores will also grow, possibly to a total of 100 over a three to four-year horizon, compared with 65 at the end of 2007. Extension of the distribution infrastructure will result in enhancement of the assortment of the products in company’s offer, thereby increasing revenues as well as optimisation of stock-keeping management, thereby improving margins. According to the management, this will cost PLN80-100m in 2007-08 (c.PLN40m already utilised in 2007).
• Retail: further development of proprietary supermarkets and creating delicatessen chain. The leading Emperia brand, Stokrotka, will be expanded; the chain is due to reach 140-190 stores at the end of 2008. In addition, the Stokrotka Premium delicatessen chain will be created to reach 10 stores with a total space of c.15,000m2 until then. Those goals are estimated to consume PLN70-80m in 2007-2008 (c.PLN50m has been used already, according to our estimates).
• Retail: further development of franchise and partnership chains. Both franchise chains (mainly under Groszek brand) and partnership chains (under Jaskolka, Milea and other brands) will be expanded and new locations will be added to corresponding formats. The development of franchise and partnership chains will take PLN10-20m in 2007-08 each (c.PLN5m already utilised, according to our estimates), predominantly on establishing regional offices and furnishing model stores.
• Organisational structure simplification and IT system unification. After taking over BOS, the group’s structure has become complicated, with a number of companies dealing with the same activities and with competences overlapping. All administrative responsibilities (bookkeeping, workforce managing, IT, supplies, logistics, operating and strategic management) will be set in proper order and transferred to the holding company, and there will be only one company to deal with the distribution segment. Moreover, there were different IT systems within companies of the same group. The system is still not entirely unified, despite the fact that the software is being delivered and implemented by an internal source, Infinite, part of Emperia Holding. Those activities are scheduled to consume c.PLN10m in 2007-08 (c.PLN5m already used, according to our estimates).
Distribution centres number from two to
11
Stokrotka stores number from 117 to 150-
200
Groszek, Milea, Jaskolka chains: further
development
Organisational and administrative
optimisation

29
FMCG distributors March 2008
Fig 39 Emperia - organic growth targets for 2008
Segment/brand Number now Number planned Investment (PLNm)
Distribution centres 3 11 80-100Stokrotka 114 140-190Stokrotka Premium 3 10
}70-80
Franchise & partnership stores 1,463 20-40Organisational structure & IT system 10
Source: Company data
_
M&A activity Emperia has expressed its interest in acquiring companies that are active in both the wholesale and the retail segments. With respect to the wholesale segment, it targets primarily those whose infrastructure is complementary to Emperia’s and would lead to strengthening its position in poorly covered regions, such as western Poland. As far as retail market consolidation is concerned, Emperia seeks medium-sized stores chains, with strong local positions based on proprietary, franchise or partnership models.
Moreover, Emperia does not rule out the possibility of entering foreign markets through M&A. Possible target markets are Ukraine, Romania, Slovakia and Bulgaria. The company began researching the potential expansion markets in 2007.
In 4Q07 the company issued 1.5m shares with an issue price of PLN155. The net proceeds from the issuance of the shares amounted to PLN227m and will be allocated to M&A. To date, Emperia has informed about purchasing/preliminary agreements totalling PLN108.2m.
Consolidation record In December 2006, Eldorado closed the purchase of BOS, a FMCG wholesaler and retailer with total revenues of PLN2.53m and net profit of PLN30.6m in 2005. Eldorado paid with 6.6m shares and PLN10m in cash, which corresponds with total transaction value of PLN269m. After the merger the group changed firm to Emperia.
In 2007, Emperia disclosed the finalisation or preliminary agreements regarding nine companies (seven retail and two wholesale), with total revenues estimated at PLN800m. The disclosed agreed prices totalled PLN97.2m. Based on the transactions of disclosed price and results as well as our estimates, the company is paying an average historical PER of 8-9x and P/S of 0.2x, which seems reasonable to us.
In January 2008 the company disclosed it had purchased 98.8% of Lewiatan Dolny Slask and on February 100% of Lewiatan Zachod. It paid PLN0.9m for franchise chain of 100 stores and PLN1.5m for 180 stores respectively. Both companies form part of the Lewiatan Holding, which itself is a target of Emperia consolidation plans.
Lewiatan planned acquisition Lewiatan Holding is a soft franchise chain of over 2,000 stores with total retail space of more than 300,000m2. Total revenues of the chain for 2007 are estimated at PLN3.5bn. Financial results of the holding, whose revenues are mainly the franchise fees paid by stores, have not been made public.
Emperia has been holding talks with Lewiatan’s owners for over six months now. The shareholding structure of the group is fragmented, as is the organisational structure, which has made negotiations complicated and time-consuming. According to management, the transaction should be finalised in 2-3 months, and it seems the
M&A in wholesale: filling gaps in
geographic coverage; retail: scale achieving
To date transactions made with PER of 8-9x
and P/S of 0.2x
Lewiatan chain acquired gradually by small
parts…
… involving complicated multi-party
negotiations

30
FMCG distributors March 2008
negotiations have reached a stage of mutual understanding, so we believe the transaction will become effective eventually. Nevertheless, we cannot estimate with any certainty when and for what price. Therefore, we do not take into account the possibility of Emperia taking over the whole Lewiatan group in our estimates.
Lewiatan investment’s NPV The influence of taking over Lewiatan on the whole group is hard to estimate. By definition, loose franchisees are not obliged to purchase from the franchisor, their orders value is discretionary. Emperia already sells to Lewiatan stores and satisfies roughly 25% of their needs. With respect to Groszek’s internally developed soft franchise chain, Emperia takes care of 35% of the chain’s supply needs. Therefore, we do not believe taking over Lewiatan group would lead to a significant increase in Emperia’s sales value. Moreover, the company does not have full coverage of the whole country, whereas Lewiatan stores are spread across Poland, so unless the Emperia’s infrastructure is extended, even reaching the 35% level will be difficult.
This is why evaluating the fair value of Lewiatan group for Emperia is complicated. Taking over a soft franchise chain is problematic, since theoretically it could have no effect on results, if franchisees continue to purchase from exactly the same source and if franchisee fees are insignificant. Assuming Emperia will pay approximately the same amount per store for the remaining companies from the Lewiatan group as it did for Lewiatan Dolny Slask and Lewiatan Zachod, the value of the whole transaction should not exceed PLN20m, in our opinion.
In our model, we do not assume a takeover of Lewiatan Holding, because the timing and price of the transaction are unknown. However, we run a NPV of the investment, based on the assumptions listed in Figure 7, to show the potential impact on Emperia’s valuation. It amounts to PLN6.0 per share, according to our calculations.
Fig 40 Lewiatan: NPV (PLNm)
2008F 2009F 2010F 2011F 2012F 2013F 2014F 2015F 2016F 2017F
Revenues 3,605 3,713 3,825 3,939 4,057 4,179 4,305 4,434 4,567 4,704 Change (%) 3 3 3 3 3 3 3 3 3 3Gross margin (%) 23 23 23 23 23 23 23 23 23 23COGS 2,776 2,859 2,945 3,033 3,124 3,218 3,315 3,414 3,516 3,622 % supplied without acquisition 25 25 25 25 25 25 25 25 25 25Turnover without acquisition 694 715 736 758 781 804 829 853 879 905% supplied after acquisition 26 28 30 33 35 35 35 35 35 35Turnover after acquisition 722 801 883 1,001 1,093 1,126 1,160 1,195 1,231 1,268 Additional % supplied 1 3 5 8 10 10 10 10 10 10Additional turnover for Emperia 28 86 147 243 312 322 331 341 352 362Franchise fees 7 7 8 8 8 8 9 9 9 9Total revenue for Emperia 35 93 155 251 321 330 340 350 361 372EBITDA margin on wholesale (%) 3.5 3.5 3.5 3.5 3.5 3.5 3.5 3.5 3.5 3.5Total EBITDA 8 10 13 16 19 20 20 21 21 22Cost of equity (%) 11.1 10.9 10.4 9.2 9.2 9.2 9.2 9.2 9.2 9.2FCF 8 9 10 12 13 12 12 11 10 11PV 109Price paid 20NPV 89Per Emperia share (PLN) 6.0
Source: ING estimates
_
• We assume Lewiatan’s revenues will grow 3% annually (ie, no new stores will be added to the chain, compared with 140 stores added in 2007 alone).
Acquiring Lewiatan would lead to closer
relationships with current customers
NPV of the transaction amounts to PLN6.0 per
Emperia share
Based on announced transactions, the price
for Lewiatan should not exceed PLN20m

31
FMCG distributors March 2008
• We assume The gross margin in Lewiatan amounts to 23% (industry average) and will stay flat at that level (however, provided Emperia takes over the group, margins should go up, on the back of improved purchasing conditions).
• We assume Emperia will increase its share in supplying the Lewiatan’s stores from approximately 25% now to 35% (in line with Groszek) in five years and stay flat afterwards.
• We assume Emperia will receive a franchise fee equal to 0.2% of Lewiatan’s revenues (we assume it will stay below the 2-3% market average, since the stores pay a little now and it will be difficult to convince them to start paying more, even for a better service).
• Lastly, we assume EBTIDA margin on sales to Lewiatan’s stores will amount to 3.5% and stay flat at that level, whereas franchise fees will not be burdened by any costs
Our conclusion is that even under very conservative assumptions, the acquisition should be profitable and bring value added for shareholders. We believe the possibility of increasing sales to Lewiatan stores by introducing more attractive conditions is worth PLN20m or even more, depending on the difference between our estimates and the true outcome.
Any price near PLN20m would be
value-accretive

32
FMCG distributors March 2008
Financial analysis
Revenues and stores base Together with the results for 4Q07, the company announced its guidance for 2008. It expects revenues to grow 26% to PLN5.8bn. We assume 28% growth, but in the past the company’s guidance has turned out to be conservative: in 2007, revenues were guided to amount to PLN4.4bn, whereas they reached PLN4.6bn.
In 2007, wholesale comprised 76% of total revenues. We expect wholesale to develop more slowly than retail because we assume no further acquisitions, and to reach 61% in 2011F. The wholesale part will grow together with the C&C and distribution centres base development. Like-for-like sales in C&C will not exceed 3% on our assumptions.
Fig 41 Top-line assumptions (PLNm, no. of stores as of year-end)
2007 2008F 2009F 2010F 2011F
Wholesale revenues 3,495 4,114 4,384 4,633 4,868 Share of total revenues (%) 76 70 65 63 61 Cash & carry stores 65 71 79 89 97 Distribution centres 2 9 11 11 11 Retail revenues 1,101 1,778 2,339 2,761 3,070 Stokrotka no. of stores 114 144 164 179 189 Stokrotka Premium no. of stores 3 10 20 25 28 Groszek stores no. of stores 578 678 728 758 778 Other stores 500 1,160 1,330 1,390 1,415
Source: Company data, ING estimates
_
Retail sales will grow together with the number of Stokrotka and Stokrotka Premium stores, together with the franchise and partnership stores base. We assume Stokrotka Premium will achieve 50% higher sales per store than Stokrotka (PLN15m annually vs. PLN10m, compared with PLN32m in Alma and PLN28m in Bomi), as the stores will be larger and will offer premium products. We assume the company will increase the number of Stokrotka stores by 30 to 144 at the end of 2008, and fulfil its target (140-190), Stokrotka Premium will grow to seven at the year-end, compared with its target of 10, and the number of other stores (other proprietary, franchise and partnership) will increase to 1,638 compared with 1,078 as of end-2007, and 1,463 now plus 343 from undergoing acquisitions.
Margins The company reported 3.5% EBITDA margin on wholesale segment and 3.6% on retail segment (adjusted from one-off sales of real estate property for PLN10.5m) in 2007. We believe there is potential for improving those margins:
• In wholesale, the company is undergoing the process of transferring competences from eight companies into one, which will result in lower SG&A expense, as well as implementing new IT system, which will serve more cost-efficient inventory management.
• In retail, the company is gaining in scale, helping it to benefit from economies of joint purchases. Moreover, the company is only starting to develop partnership chains, which are more profitable than a loose franchise like Groszek. In addition,
Company guidance for 2008: sales up 26% to PLN5.8bn
We assume a wholesale share drop from 76% to
61% of revenues in 2011F
Stokrotka chain to reach lower range of the
company’s target

33
FMCG distributors March 2008
entering the delicatessen segment (Stokrotka Premium) should translate into further margin improvement.
The company’s goal is to generate 3.0% net profitability in 3-4 years. In 2007 it posted 2.0% (1.9% adjusted for PLN10.5 m gain on real estate sales and PLN9m loss on FX) which was 2bp above our expectations. We expect a slight improvement in 2008F to 2.0% on an adjusted basis, and achieving 3.0% no sooner than 2012F. We assume sustaining the 20% effective tax rate noted in 2007 (adjusted for the above-mentioned one-offs).
Capex The company spent PLN120m on capex in 2007 and announced it will invest a further PLN175m in 2008. We expect the share of investment in wholesale segment will increase from 32% to 48% of total capex, since the company will build and/or furnish seven distribution centres. We assume the company will spend PLN1.5m on each C&C store, PLN1m per Stokrotka store and PLN1.5m per Stokrotka Premium store (proportionally to sales per store differential). Moreover, it will spend c.PLN40m annually for modernisation and maintenance.
Fig 42 Consolidated income statement (PLNm)
Yr to Dec 2006 2007 2008F 2009F 2010F
Sales 1,407 4,597 5,892 6,722 7,394 COGS 1,190 3,890 5,008 5,701 6,248 Gross profit 216.9 706.3 883.8 1021.8 1146.1Margin (%) 15.4 15.4 15.0 15.2 15.5 SG&A 187.9 588.7 737.9 846.1 930.8Other operating income (costs) (3.9) (16.7) (18.1) (20.6) (22.7)EBITDA 51.2 173.4 208.4 255.5 306.1Margin (%) 3.6 3.8 3.5 3.8 4.1 Depreciation/amortisation 18.3 39.1 44.4 59.2 68.1EBIT 33.0 134.3 164.0 196.3 238.0Margin (%) 2.3 2.9 2.8 2.9 3.2 Net financial income/(loss) (3.1) (14.1) (14.4) (13.3) (6.8)Pre-tax profit 29.8 111.2 149.6 183.0 231.2Tax 6.5 21.5 29.9 36.6 46.2Net profit 23.4 89.7 119.7 146.4 185.0Margin (%) 1.7 2.0 2.0 2.2 2.5
Source: Company data, ING estimates
_
Targeted 3.0% net margin to be achieved
in 2012
Company guidance: PLN175m capex in 2008

34
FMCG distributors March 2008
Fig 43 Consolidated balance sheet (PLNm)
2006 2007 2008F 2009F 2010F
Inventory 94.9 341.9 438.3 500.1 550.0 Trade debtors 74.0 350.7 449.6 513.0 564.2 Cash and liquids 12.7 93.0 28.0 33.6 84.2 Other 5.5 9.9 9.9 9.9 9.9 Current assets 187.1 795.5 925.8 1,056.5 1,208.4 Fixed assets 177.5 436.5 567.1 613.7 624.7 Intangibles 0.5 3.4 3.4 3.4 3.4 Goodwill - 184.7 184.7 184.7 184.7 Financial assets 256.0 35.2 35.2 35.2 35.2 Other 264.7 70.4 70.4 70.4 70.4 Non-current assets 442.6 695.0 825.6 872.2 883.2 Total assets 629.8 1,490.6 1,751.5 1,928.7 2,091.5 Trade creditors 155.5 549.0 703.7 802.9 883.1 Short term debt 29.5 79.4 79.4 79.4 49.4 Other 12.0 22.0 22.0 22.0 22.0 Current liabilities 197.0 650.4 805.1 904.3 954.5 Long term debt 72.2 129.3 129.3 79.3 29.3 Other 3.4 20.4 20.4 20.4 20.4 Total liabilities 75.6 149.7 149.7 99.7 49.7 Share capital 12.9 15.0 15.0 15.0 15.0 Reserve capital 52.2 69.2 69.2 69.2 69.2 Retained earnings 18.7 67.8 173.9 302.0 464.6 Other 273.3 535.9 535.9 535.9 535.9 Minorities - 2.6 2.6 2.6 2.6 Total equity 357.1 690.5 796.7 924.8 1,087.4 Total funding 629.8 1,490.6 1,751.5 1,928.7 2,091.5
Source: Company data, ING estimates
Fig 44 Consolidated cash flow statement (PLNm)
Yr to Dec 2006 2007 2008F 2009F 2010F
Profit after tax 23.4 111.2 119.7 146.4 185.0 Depreciation/amortisation 18.3 39.1 44.4 59.2 68.1 Change in receivables (44.5) (46.8) (98.9) (63.4) (51.2)Change in inventories 5.8 (50.4) (96.4) (61.8) (50.0)Change in trade payables 44.4 59.8 154.7 99.2 80.2 Other 7.5 (18.5) - - -Cash flow from operating activities 54.9 94.4 123.6 179.7 232.1 Acquisition of investments (13.6) (68.6) - - -Disposal of investments 0.1 8.1 - - -Acquisition of fixed assets (43.7) (119.8) (175.0) (105.8) (79.0)Disposal of fixed assets 1.4 27.7 - - -Other 0.3 34.9 - - -Cash flow from investing activities (55.5) (117.8) (175.0) (105.8) (79.0)Cash from shares issue - 227.1 - - -Dividends paid (18.0) (23.4) (13.5) (18.3) (22.4)Proceeds from borrowings 69.2 243.8 - - -Repayment of borrowings (41.7) (330.0) - (50.0) (80.0)Cash flow from financing activities 6.1 103.7 (13.5) (68.3) (102.4)Net change in cash 5.5 80.3 (64.9) 5.6 50.6 Cash beg. of period 7.1 12.7 93.0 28.0 33.6 Cash end of period 12.7 93.0 28.0 33.6 84.2
Source: Company data, ING estimates
_
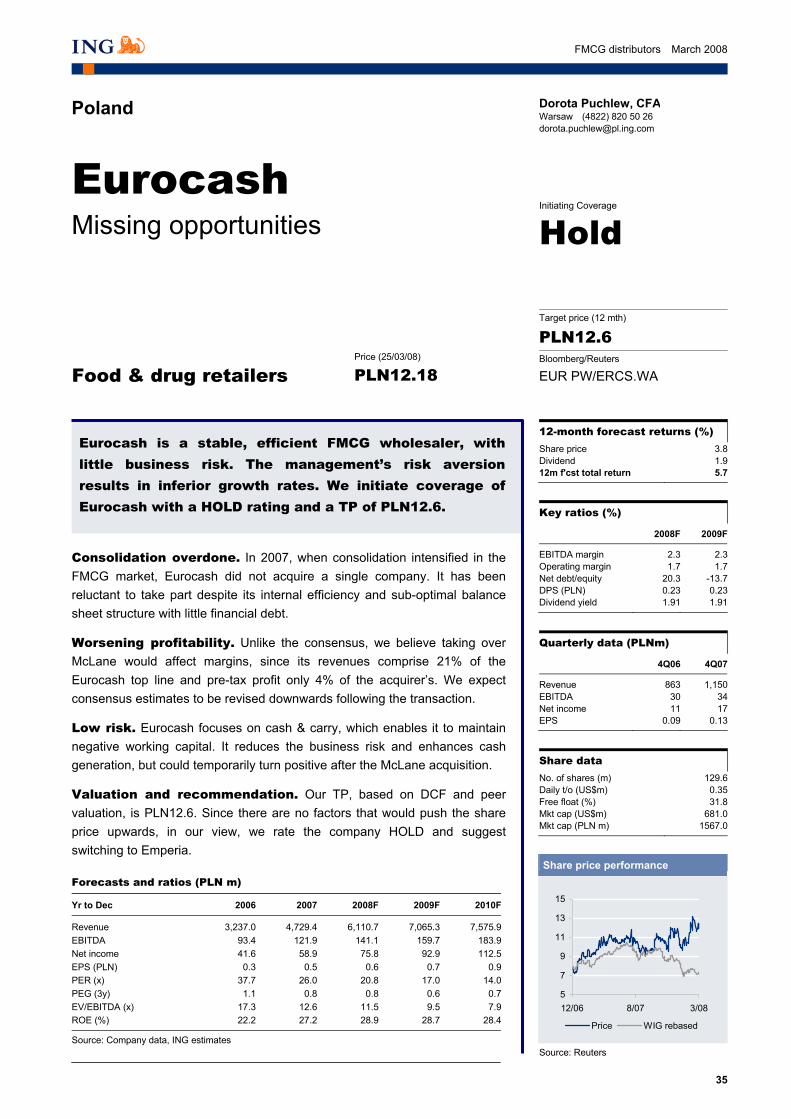
35
FMCG distributors March 2008
Poland
Eurocash Missing opportunities
Key ratios (%)
2008F 2009F
EBITDA margin 2.3 2.3Operating margin 1.7 1.7Net debt/equity 20.3 -13.7DPS (PLN) 0.23 0.23Dividend yield 1.91 1.91
Quarterly data (PLNm)
4Q06 4Q07
Revenue 863 1,150EBITDA 30 34Net income 11 17EPS 0.09 0.13
12-month forecast returns (%) Share price 3.8Dividend 1.912m f'cst total return 5.7
Share price performance
5
7
9
11
13
15
12/06 8/07 3/08
Price WIG rebased
Source: Reuters
Share data No. of shares (m) 129.6Daily t/o (US$m) 0.35Free float (%) 31.8Mkt cap (US$m) 681.0Mkt cap (PLN m) 1567.0
Eurocash is a stable, efficient FMCG wholesaler, with little business risk. The management’s risk aversion results in inferior growth rates. We initiate coverage of Eurocash with a HOLD rating and a TP of PLN12.6.
Initiating Coverage
PLN12.18Price (25/03/08)
Hold
Food & drug retailers
PLN12.6 Target price (12 mth)
EUR PW/ERCS.WA Bloomberg/Reuters
Dorota Puchlew, CFAWarsaw (4822) 820 50 26 [email protected]
Consolidation overdone. In 2007, when consolidation intensified in the FMCG market, Eurocash did not acquire a single company. It has been reluctant to take part despite its internal efficiency and sub-optimal balance sheet structure with little financial debt.
Worsening profitability. Unlike the consensus, we believe taking over McLane would affect margins, since its revenues comprise 21% of the Eurocash top line and pre-tax profit only 4% of the acquirer’s. We expect consensus estimates to be revised downwards following the transaction.
Low risk. Eurocash focuses on cash & carry, which enables it to maintain negative working capital. It reduces the business risk and enhances cash generation, but could temporarily turn positive after the McLane acquisition.
Valuation and recommendation. Our TP, based on DCF and peer valuation, is PLN12.6. Since there are no factors that would push the share price upwards, in our view, we rate the company HOLD and suggest switching to Emperia.
Forecasts and ratios (PLN m)
Yr to Dec 2006 2007 2008F 2009F 2010F
Revenue 3,237.0 4,729.4 6,110.7 7,065.3 7,575.9EBITDA 93.4 121.9 141.1 159.7 183.9Net income 41.6 58.9 75.8 92.9 112.5EPS (PLN) 0.3 0.5 0.6 0.7 0.9PER (x) 37.7 26.0 20.8 17.0 14.0PEG (3y) 1.1 0.8 0.8 0.6 0.7EV/EBITDA (x) 17.3 12.6 11.5 9.5 7.9ROE (%) 22.2 27.2 28.9 28.7 28.4
Source: Company data, ING estimates

36
FMCG distributors March 2008
Summary
Recommendation We initiate coverage of Eurocash with a HOLD recommendation and a TP of PLN12.6. We believe the company is very well managed, its business is stable and risks are low, but see no further upside in the share price.
Profitability to fall after taking over McLane From April 2008, the company will consolidate McLane, a distributor with annual revenue of PLN1bn and net profit of PLN3m. The business model of the acquired entity is less profitable, since it deals with active distribution (Eurocash’s core business is cash & carry), so it will most likely lead to margins deterioration, even incorporating economies of scale. We would like to remind investors that after taking over KDWT, Eurocash’s EBITDA margin dropped from 4.2% to 2.9% and McLane is even less profitable than KDWT.
Consensus estimates are too high Consensus estimates seem to take no account of McLane’s inferior profitability. In our opinion, it is impossible to increase the revenue base through McLane sales simultaneously sustaining the profitability of 2007 results. We expect the consensus estimates to be revised downwards on the operating and bottom line.
Negative working capital advantage Eurocash operates on negative working capital, because C&C is its main revenue source. However, after taking over McLane, there is a risk that this advantage could disappear for some time, because active distribution deals with more trade receivables. It could lead to a temporary weakening of the cash-generative ability of the company.
Dividend payout to decrease The company’s dividend policy assumes sustaining the amount per share at c.PLN0.23-0.25. Since there is no reason for the net profit not to grow, it will mean decreasing the payout ratio. The company is not investing heavily in capex or in M&A, and so such approach is not explained by capital needs.
Peer valuation The company trades on par with Emperia, but we believe it deserves a discount due to its inferior business model (lower profitability as a result of no direct exposure to retail) and growth rates (28% 2007-2010F diluted CAGR compared with 45%).
DCF model Our DCF valuation renders PLN14 per share on a 12-month horizon. We base our forecasts on conservative assumptions of 3% like-for-like sales growth and no further acquisitions except McLane (consolidated from April 2008).
Key risks to our recommendation In the short term, we believe the major factor influencing the Eurocash share price will be the final price to be paid for McLane. Our calculation of fair value based on the multiples used in the KDWT transaction amounts to PLN40m for equity.

37
FMCG distributors March 2008
Company overview
Eurocash is one of the leading FMCG wholesalers in Poland. Its wholesale arm is split into two segments: cash & carry (55% of sales) and active distribution, both functioning under Eurocash brand. Moreover the company realises revenues on franchise retail chains.
Business model Wholesale The core of Eurocash business is the cash & carry segment. The chain consists of 102 stores with average space of 2,000m2, which makes it the largest C&C chain in Poland in terms of number of stores. Eurocash’s largest competitor is Makro Cash & Carry, owned by Metro Group AG. It has 24 stores in Poland with space between 1,000 and 2,000m2 and we estimate its revenues at PLN7.4bn (compared with PLN2.2bn of Eurocash C&C). The Eurocash wholesale stores chain could be characterised as discount C&C stores, since they offer a significantly lower range of products (3,500 SKUs) than the market leader, Makro Cash & Carry (20,000 SKUs) and at a relatively attractive price. Another difference between the two chains is the fact that Eurocash sells products both in multi-packs and in separate units, whereas in Makro only the multi-packs are available. This makes the Eurocash offer more suitable for the smallest grocery stores.
Fig 45 Eurocash - revenue split (PLNm)
Fig 46 Number of C&C stores
0
500
1,000
1,500
2,000
2,500
3,000
3,500
4,000
2004 2005 2006 2007 2008F 2009F 2010F
Traditional wholesale (cash&carry) Active distribution
8394 96
102110
120130
0
20
40
60
80
100
120
140
2004 2005 2006 2007 2008F 2009F 2010F
Source: Company data, ING estimates Source: Company data, ING estimates
Franchise As a better utilisation of this asset, the company develops the abc franchise chain, which comprises approximately 2,500 stores. It is based on soft franchise, in which the franchisee is obliged to realise only some minimum amount monthly purchases from Eurocash (PLN15,000-20,000). In fact, they purchase goods for c.PLN 30,000 on average, which corresponds with Eurocash supplying as much as 50% of the abc chain’s needs. Moreover, the franchisees pay a PLN 200 monthly marketing charge to Eurocash. The most important factor differentiating abc from the typical franchise chain is that delivery is a concern of the franchiser: they pick up goods in a Eurocash C&C store which enables them to achieve more attractive conditions than in a traditional
Eurocash is a FMCG wholesaler, with 55%
sales in C&C
C&C segment: 102 stores, 3,500 SKUs
abc franchise chain: 2,500 stores of 50-
150m2space

38
FMCG distributors March 2008
distribution system, as well as enabling Eurocash to achieve superior margins on wholesale.
Fig 47 Number of abc stores
Fig 48 Number of Delikatesy Centrum stores
1,8922,164
2,416 2,4942,694
2,9443,194
0
500
1,000
1,500
2,000
2,500
3,000
3,500
2004 2005 2006 2007 2008F 2009F 2010F
235
295
345375
390
0
50
100
150
200
250
300
350
400
450
2006 2007 2008F 2009F 2010F
Source: Company data, ING estimates Source: Company data, ING estimates
_
Another franchise store chain organised by Eurocash is Delikatesy Centrum (DC), purchased in 2006. There are several major differences between abc and DC stores:
• The DC chain is based on strict franchise, in which the whole supply is organised by Eurocash (partially with its own resources, partially from external sources with which conditions are negotiated by Eurocash).
• Stores are larger than in the case of abc (250m2 compared with 50-100m2) and offer more products (8,000 SKUs compared with 3,500).
• DC uses separate distribution centres dedicated to the chain and delivery is fully organised by Eurocash, using its logistics base, its supply base and centralised negotiations with respect to goods out of the Eurocash wholesale offer (such as newspapers, bakery, fresh meat, fresh fruit and vegetables)
Tobacco distribution In 2006, Eurocash took over KDWT, tobacco and impulse products (pre-paid cards, chewing gum, condoms, etc, usually displayed near cashiers in super-/hypermarkets) wholesaler, entering new segment of wholesale: active distribution. KDWT is the second largest tobacco company in Poland, with a market share of 11.5%. Sales in KDWT are realised in two main channels: van sellers driving to their retail clients (there are 160 salesmen, visiting c.25 clients a day, which translates into approximately two visits a week to each client) and tobacco outlets stores (79 outlets at present). Thanks to their access to the KDWT supply base, Eurocash C&C stores offer over 100 brands of cigarettes, compared with a dozen or so before the acquisition. Another synergy effect came from the joint purchase of impulse products for KDWT’s active distribution channel and for C&C stores, as well as for the Delikatesy Centrum chain.
Delikatesy Centrum: strict franchise chain
with 300 stores
Active distribution: tobacco and impulse
products

39
FMCG distributors March 2008
Fig 49 The Eurocash business model
Source: ING estimates
_

40
FMCG distributors March 2008
Growth strategy
Eurocash is building its presence in the FMCG wholesale market, both organically and through M&A. Its main goal is to achieve a revenue scale comparable with the largest retailers operating on the Polish market, ie, approximately PLN8-9bn.
Organic growth Cash & Carry segment Eurocash owns 102 C&C stores. It added six to its base in 2007 and plans to continue to grow by 6-8 annually. This means the company will need to launch additional distribution centres for C&C stores. Eurocash has two distribution centres dedicated to its C&C division, near Poznan with 20,000m2 space and near Kielce with 10,000m2.
Whereas the company rents distribution centres, it has a different approach with respect to C&C stores. They are constructed by Eurocash, and sold on to real estate investors with little or no profit but with favourable lease conditions for the company. This leads to a situation in which the company spends c.PLN4-5.5m in capex per store and sells it for PLN3-4m. The difference (c.PLN1-1.5m) is spent on installations and furnishing which are not part of the transaction. It affects the cash flow statement, and makes the true capex hard to estimate.
Active distribution segment As far as KDWT is concerned, there are three means of development: (1) growing the infrastructure; (2) improving the product mix; (3) market consolidation.
The company has 79 outlets, of which 45 are located in C&C stores and 34 are separate. It means only 44% of C&C stores have their own outlet. This is because separate outlets are located close by, so launching another wholesale store would be ineffective. This structure is optimal, but the company plans to create KDWT outlets in each new C&C store, whereas the number of separate outlets will not be increased. Simultaneously, the number of van sellers will be increased, since new locations will require new active distribution forces.
Tobacco sales is characterised by very low margin (c.3-3.5% gross margin on sales, taking bonuses from producers into account), because its final price is made up by as much as 50% in excise tax. The company realises higher margins (c.10-13%) on impulse products sold together with cigarettes. At present, the share of impulse products at KDWT amounts to almost 20%. The company plans to increase the share of impulse products in total revenues, but simultaneously the cigarettes value will grow faster than volumes due to excise tax rises. The company estimates the share of non-tobacco products in KDWT revenues can grow to 25-30%.
Moreover, the management expects the tobacco market to continue to consolidate. Very low margins combined with growing working capital requirements (due to excise tax rises) will push smaller competitors out of the market. They will either go bankrupt or sell to larger companies, like KDWT. The company enjoys the highest profitability and best financial stability of its peers at the moment. This is due to economies of scale (wholesale/retail distribution channels, C&C outlets, joint purchase of impulse products, larger working capital capacity) and corresponds to its position as a potential leading market consolidator. Thus, we believe that despite the fact that the tobacco
6-8 new C&C stores annually
KDWT infrastructure expansion together with
cash & carry network development
More profitable impulse products share
increasing
Consolidation of tobacco wholesale
market

41
FMCG distributors March 2008
market as a whole has weak growth perspectives, Eurocash will show satisfactory dynamics in this field.
Franchise segment Delikatesy Centrum is one of the most successful and well organised franchise chains in Poland. Following Musketer’s Intermarché concept, it is Poland’s first strict franchise chain. It achieves above-average sales per m2: PLN 22,000 compared with c.PLN 10,000 in hypermarkets and PLN 15,000 in delicatessen chains. Eurocash wants to expand the chain, focusing on quality rather than quantity, keeping high requirements for new entrants.
The development of the abc stores chain will be conducted concurrently with the launch of new C&Cs. For each C&C store there are c.25 abc stores. This results from the fact that for small grocery stores it pays to be part of the abc franchise, since they receive discounts for goods purchased at a C&C. Whenever a new Eurocash store is launched, part of such stores agrees to become an abc franchisee and this is usually around 25 stores.
New formats and ideas The company co-operates with the Dutch company PayUp Holding in enabling the recharging of electronic mobile pre-paid cards, bill payments and other pre-paid products via terminals in grocery stores. To date, KDWT’s van sellers have been offering installation of terminals at their customers’ premises, but this was only an addition to their main field of interest, ie, sales of tobacco and impulse products. In order to develop the electronic services more efficiently and dynamically, Eurocash and PayUp Holding decided to establish a separate entity responsible for this area. This should be seen as a way to supplement the offer range of Eurocash, rather than a means of boosting revenues or earnings.
Among its long-term targets, the company mentions creating a new chain, most likely also based on franchise, in the convenience store format. This is merely an idea for now, and we do not know if or when it will materialise.
M&A activity Eurocash conducted two major acquisitions in 2006: KDWT and Carment (owner of the Delikatesy Centrum franchise chain), priced at PLN61m and PLN36m respectively. In December 2007, Eurocash signed a preliminary agreement with McLane, a wholesaler active in the HoReCa and gas stations segment, as well as a franchisor of the IGA grocery stores chain.
McLane overview McLane specialises in servicing restaurant chains, above all AmRest and also Coffee Heaven, as well as gas stations such as PKN Orlen, BP, Statoil, Jet/Lukoil and Lotos, from which it has exclusive arrangements for many product groups. HoReCa accounts for 12% of total sales and gas stations for 42%.
IGA is a franchise chain, comprising over 300 stores. The chain is more similar to DC than to abc: stores offer 7,000-12,000 SKUs compared with 8,000 in DCs and over 3,500 in abc, and average space is comparable with DC. McLane is also organising delivery to IGA stores, much as Eurocash takes care of DC’s supplies, whereas abc franchisees pick up selected products at Eurocash C&C stores. The chain is based on the soft franchise system: IGA franchisees have a minimum amount of monthly orders
Delikatesy Centrum: balanced growth…
… and abc stores expansion together with
cash & carry network
First transaction since 2006: FMCG wholesaler
with PLN1bn sales

42
FMCG distributors March 2008
from McLane to fulfil as well as paying the marketing fee. Both figures are higher than in the case of abc, since the average store space is higher.
McLane transaction details Eurocash has not disclosed the price that will be paid for McLane. We only know that part of the price will be paid in Eurocash shares worth the equivalent of US$5m (with the current share price this corresponds to 1.03m shares), but the other part will be paid in cash.
In the case of another wholesaler acquisition that KDWT conducted in 2Q06, the company paid PLN61m. KDWT had PLN1.4bn in sales, PLN17.2m in EBITDA and PLN7.5m in net income, which is 1.4x, 2.6x and 2.6x more than McLane respectively. Therefore, we would take it as bad news if it turned out that Eurocash had paid more than PLN60m for McLane.
Fig 50 KDWT multiples implied in McLane acquisition price (PLNm)
Results before acquisition KDWT McLane KDWT multiples (x) Implied McLane valuation
Revenues 1400 978 EV/sales 0.07 57.8EBITDA 17.2 6.5 EV/EBITDA 5.6 26.7Net profit 7.5 3 PER 8.1 23.1Net debt 36 10 Average 35.9
Source: Company data, ING estimates
_
We analysed the price paid for KDWT in terms of EV/sales, EV/EBITDA and PER to compare with McLane’s implied valuation. Average of used multiples comes to a value of PLN36m. The highest result comes from the EV/sales multiple, since McLane has very low profitability, even compared with KDWT (despite the fact that the tobacco distribution should be less profitable). It amounts to PLN58m, which, again, sustains our argument that paying more than PLN60m would certainly be too much. In our model, we assume the price of PLN 40m for equity (PLN 50m total enterprise value).
Consolidation strategy and synergy effects Taking over McLane would result in Eurocash achieving the first position on both FMCG wholesale and tobacco wholesale markets. With joint 7.6% market share in the former and 15% in the latter, Eurocash will be able to benefit from significant economies connected not only with purchasing power, but with improved bargaining power with respect to customers as well.
The transaction will enable Eurocash to enter three new segments: active food distribution (only tobacco and impulse to date), HoReCa and gas station servicing. The most obvious synergy effects will come from: (1) joint purchasing power with respect to both FMCG and tobacco; (2) the ease of meeting working capital requirements; (3) capex requirements. Until now, McLane had shown virtually no growth in revenues in the last three years (2004-2007 CAGR of 2.1%, ie, below inflation of 2.3% average in this period), because it was lacking cash for development and for achieving suitable scale.
HoReCa is a relatively small segment of the food wholesale market, but a fast growing one. In addition, this channel requires specialist equipment such as vehicles for transporting frozen and chilled products as well as suitable warehouses with cold rooms. Taking over McLane grants access to this segment without having to build a logistics base from scratch and develop relationships. With cash back-up from Eurocash and increased purchasing power, it will be possible to extend the HoReCa
Eurocash has not disclosed the price…
… which we estimate at PLN40m, based on
previous wholesaler purchase multiples
Transaction will make Eurocash the No.1
wholesaler…
…enabling it to enter three new market
segments…

43
FMCG distributors March 2008
segment and win new customers (at present, AmRest has an over 90% share in the HoReCa segment of the company’s revenues, which makes McLane dependent on this entity).
Fig 51 FMCG wholesale market after merger
Fig 52 Tobacco wholesale market after merger
Others61.6%
Selgros Cash&Carry
3.8%
Makro Cash&Carry
7.1%
Ruch3.6%
Lekkerland3.5%Polski Tyton
2.3%
Emperia (wholesale
part)4.9%
CEDC5.6%
Eurocash (pro-forma with McLane)
7.6%
Others40%
Kolporter5%
Eurocash (pro-forma with McLane)
15%
Polski Tyton9%
Ruch8%
Stopol2%
Lima3% Frega
4%
Lekkerland14%
Source: Company data Source: Company data
_
Gas stations comprise another attractive sector, fuelled both by food consumption growth and by increasing demand for gasoline, translating into the development of the stations network. This distribution channel is also complicated logistically, so taking over McLane is far more sensible than creating its own infrastructure. Also, KDWT’s joint food purchases and impulse products competence will serve up further economies of scale.
With respect to IGA stores, we think it would be best to switch as many as possible to the Delikatesy Centrum model, which is the most profitable and predictable. Not all IGA stores are suitable for the DC format (good locations and of c.250m2 in space required). Eurocash will encourage the selected franchisees to join the DC concept by offering attractive price conditions as well as know-how, good quality logistical service and marketing support. In our opinion, only a few of the over 300IGA stores will be transformed to DC, since the store owners have enough skills and know-how (or at least they believe they do) and they tend to be reluctant to give up their independence, take risks or implement changes to the status quo in general.
There are some synergies possible in the logistics field. Growing the cash & carry base, Eurocash will need new distribution centres, which can be provided by McLane. In terms of distribution centres dedicated to retail chains, even if both franchise chains survive separately, the logistics base owned by McLane will also serve the DC chain, which is now concentrated in Silesia. Eurocash has two distribution centres for its strict franchise chain (in Krosno and near Nowy Sacz, both in southern Poland), whereas McLane has distribution centres covering the majority of Poland: near Warsaw, Gdynia and Ruda Slaska (Silesia) and 11 cross-docks. Perhaps one of the overlapping Silesian distribution centres could be cancelled or moved to a more suitable area.
… and create synergies in logistic
base

44
FMCG distributors March 2008
Financial analysis
Revenues and stores base The company’s strategic goal is to achieve revenues comparable with the sales of Poland’s largest retailers. It corresponds to a value of PLN8-9bn, but the company is not specific regarding the possible timeframe of this achievement. We expect it to reach the PLN8bn level in 2011, but assume no further acquisitions apart from McLane (we assume the final price will amount to PLN40m, PLN11.5m in shares and PLN28.5m in cash). However, we believe the company will have to take part in the M&A process on the market, not to fall behind the competition.
Fig 53 Top-line assumptions (PLNm)
2007 2008F 2009F 2010F 2011F
Traditional wholesale 2,609 2,850 3,208 3,578 3,885 Share in sales (%) 55 47 45 47 49 C&C 2,117 2,321 2,595 2,908 3,176 No. of C&C stores 102 110 120 130 135 Sales to abc stores 921 1,002 1,122 1,258 1,375 No. of Abc stores 2,494 2,694 2,944 3,194 3,319 Sales to others 1,196 1,319 1,474 1,650 1,801 Delikatesy Centrum 493 529 613 671 709 No. of Delikatesy Centrum stores 295 345 375 390 395 Active distribution 2,120 3,261 3,857 3,998 4,118 KDWT 2,120 2,544 2,620 2,699 2,780 McLane - 717 1,237 1,299 1,338 Share of tobacco in sales (%) 36 37 35 34 33
Source: Company data, ING estimates
_
Until 2007, the majority of revenues (55%) were brought by traditional wholesale, driven by the number of C&C stores, as well as the abc stores base. After the finalisation of the McLane acquisition (we assume it will be consolidated commencing 1 April), the share of traditional wholesale will drop to 47%, according to our estimates, because McLane deals with active distribution.
We would like to stress that taking over McLane will increase Eurocash’s exposure to the tobacco market, since as much as a third of the company’s revenue comes from cigarettes sales. We see this as limited source of risk, because although we do not share the popular opinion that growing excise tax is jeopardising market value, we perceive tobacco as one of the least promising segments of the FMCG sector.
Margins Taking over McLane will apply pressure on consolidated margins, for the following reasons:
• Active distribution is less profitable than the cash & carry model since it is connected with logistics costs and is more labour force-intensive.
• Low profitability tobacco sales’ share in overall revenues will increase.
• The company will have to bear restructuring costs.
• We foresee temporary slip of working capital into positive territory, as active distribution is connected with higher trade receivables than C&C business.
We assume no further acquisitions except
McLane…
… which will lead to growing active distribution…
… and tobacco share in revenues…
… as well as operating profitability
deterioration…

45
FMCG distributors March 2008
The examples of the KDWT and Carment consolidations show a drop in margins from 4.2% to 2.9% on the EBITDA line, and it should be kept in mind that KDWT had higher profitability before the acquisition than McLane has now (1.2% vs. 0.7% EBITDA).
Therefore, we expect the EBITDA margin to drop from 2.6% in 2007 to 2.3% in 2008. However, we forecast flat net profitability at 1.2%, due to a lower effective tax rate from the PLN15m tax loss carry-forward from McLane (to be utilised in four years’ time, on our assumptions).
In consecutive years, we expect improvement in margins as a result of:
• Improving negotiating power together with expanding the wholesale scale.
• Higher prices of cigarettes leading to higher margins for wholesalers.
• Increasing share of impulse products in KDWT sales.
• Implementing cost optimising and economies of scale at McLane.
The management expects the margins in traditional wholesale to improve slowly to reach 4.5% in 3-4 years, whereas in active distribution they should decrease temporarily (the McLane effect) and to grow above historical levels afterwards. Based on this guidance and our estimates with respect to sales levels in both segments, we arrive at management’s target EBITDA of PLN220m in 2011, compared with our estimate of PLN200m at that time.
Capex Historically, the company has spent relatively small sums on investments. The reason behind this is the C&C store building model (constructing the premises and selling on to a real estate company), which translates into capex of only PLN1-1.5m per store (unsold fixtures). We do not account for actual investment expenditure and cash inflow from sales in the cash flow statement, we only show the netted result. Moreover, the company invests in the Delikatesy Centrum franchise concept in the form of capital expenditure. Eurocash needs to pay PLN 0.1-0.2m per DC store to the expansion centre owned by the former DC owners (result of the acquisition agreement). Moreover, we assumed PLN15m annual modernisation expense.
Fig 54 Consolidated income statement (PLNm)
Yr to Dec 2006 2007 2008F 2009F 2010F
Sales 3,237.0 4,729.4 6,110.7 7,065.3 7,575.9 COGS 2,930.8 4,306.2 5,591.3 6,471.8 6,924.4 Gross profit 306.2 423.3 519.4 593.5 651.5 Margin (%) 9.5 8.9 8.5 8.4 8.6SG&A 246.3 332.0 409.7 464.9 501.3Other operating income (costs) (4.6) (5.5) (7.1) (8.2) (8.8)EBITDA 93.4 121.9 141.1 159.7 183.9Margin (%) 2.9 2.6 2.3 2.3 2.4Depreciation/amortisation 38.1 36.1 38.4 39.3 42.5EBIT 55.2 85.8 102.7 120.4 141.4Margin (%) 1.7 1.8 1.7 1.7 1.9Net financial income/(loss) (1.1) (12.1) (10.3) (7.9) (5.6)Pre-tax profit 54.1 73.7 92.4 112.5 135.8Tax 12.6 14.8 16.6 19.6 23.3Net profit 41.6 58.9 75.8 92.9 112.5Margin (%) 1.3 1.2 1.2 1.3 1.5
Source: Company data, ING estimates
… but support net margin due to tax loss
carry-forward
Our estimates on EBITDA line in 3-4 years
differ by 9% from the management’s
No exposure to retail results in relatively low
capex

46
FMCG distributors March 2008
Fig 55 Consolidated balance sheet (PLNm)
2006 2007 2008F 2009F 2010F
Inventory 209.5 244.5 315.9 365.2 391.6 Trade debtors 160.4 215.5 370.0 357.2 383.0 Cash and liquids 41.2 128.5 27.2 114.8 162.6 Other 25.0 17.9 17.9 17.9 17.9 Current assets 436.1 606.4 731.0 855.1 955.2 Fixed assets 109.0 125.7 150.8 175.1 194.3 Intangibles 117.2 121.5 121.5 121.5 121.5 Other 35.8 35.7 85.7 85.7 85.7 Non-current assets 262.0 282.9 358.0 382.3 401.5 Total assets 698.1 889.3 1,089.1 1,237.5 1,356.7 Trade creditors 371.2 519.7 671.5 776.4 832.5 Short term debt 73.5 73.1 63.1 43.1 23.1 Other 35.2 40.0 40.0 40.0 40.0 Current liabilities 479.9 632.9 774.7 859.6 895.7 Long term debt - - - - -Other 19.2 23.0 23.0 23.0 23.0 Total liabilities 19.2 23.0 23.0 23.0 23.0 Share capital 127.7 127.7 139.2 139.2 139.2 Reserve capital 29.1 47.1 47.1 47.1 47.1 Retained deficit 42.2 58.5 105.0 168.5 251.6 Total equity 199.0 233.4 291.3 354.8 438.0 Total funding 698.1 889.3 1,089.1 1,237.5 1,356.7
Source: Company data, ING estimates __
Fig 56 Consolidated cash flow statement (PLNm)
Yr to Dec 2006 2007 2008F 2009F 2010F
Profit before tax 54.1 73.7 92.4 112.5 135.8 Depreciation/amortisation 38.1 36.1 38.4 39.3 42.5 Change in receivables (49.8) (43.1) (154.6) 12.8 (25.8)Change in inventories (15.9) (35.0) (71.4) (49.3) (26.4)Change in trade payables 21.9 147.9 151.8 104.9 56.1 Tax paid (11.0) (15.1) (16.6) (19.6) (23.3)Other (2.5) 17.9 - - -Cash flow from operating activities 35.0 182.5 40.0 200.6 158.9Acquisition of fixed assets (29.7) (48.9) (63.5) (63.6) (61.7)Disposal of fixed assets 14.6 12.4 - - -Purchase of investment properties (55.7) (10.0) (28.5) - -Other 2.4 (15.2) - - -Cash flow from investing activities (68.5) (61.7) (92.0) (63.6) (61.7)Proceeds from borrowings 6.5 14.4 - - -Repayment of borrowings (8.4) (14.8) (20.0) (20.0) (20.0)Dividends paid (20.4) (29.4) (29.4) (29.4) (29.4)Other (2.0) (3.8) - - -Cash flow from financing activities (24.3) (33.6) (49.4) (49.4) (49.4)Net change in cash (57.8) 87.3 (101.4) 87.6 47.9 Cash beginning of period 99.0 41.2 128.5 27.2 114.8 Cash end of period 41.2 128.5 27.2 114.8 162.6
Source: Company data, ING estimates
_

47
FMCG distributors March 2008
Disclosures Appendix ANALYST CERTIFICATION The analyst(s) who prepared this report hereby certifies that the views expressed in this report accurately reflect his/her personal views about the subject securities or issuers and no part of his/her compensation was, is, or will be directly or indirectly related to the inclusion of specific recommendations or views in this report.
IMPORTANT DISCLOSURES For disclosures on companies other than the subject companies of this report visit our disclosures page at http://research.ing.com or write to The Compliance Department, ING Financial Markets LLC, 1325 Avenue of the Americas, New York, USA, 10019.
US regulatory disclosures Valuation & risks: For details of the methodologies used to determine our price targets and risks related to the achieve-ment of these targets refer to main body of report and/or the most recent company report at http://research.ing.com.
European regulatory disclosures The remuneration of research analysts is not tied to specific investment banking transactions performed by ING Group although it is based in part on overall revenues, to which investment banking contribute. Financial interests: One of more members of ING Group may hold financial interests in the companies covered in this report other than those disclosed above. Securities prices: Prices are taken as of the previous day’s close on the home market unless otherwise stated. Job titles. The functional job title of the person/s responsible for the recommendations contained in this report is equity research analyst unless otherwise stated. Corporate titles may differ from functional job titles. Conflicts of interest policy. ING manages conflicts of interest arising as a result of the preparation and publication of research through its use of internal databases, notifications by the relevant employees and Chinese walls as monitored by ING Compliance. For further details see our research policies page at http://research.ing.com.
FOREIGN AFFILIATES DISCLOSURES Each ING legal entity which produces research is a subsidiary, branch or affiliate of ING Bank N.V. See back page for the addresses and primary securities regulator for each of these entities.
RATING DISTRIBUTION (as of end 4Q07) RATING DEFINITIONS
Equity coverage Investment Banking clients*
Buy 51% 31%
Hold 43% 26%
Sell 6% 27%
100%
* Percentage of companies in each rating category that are Investment Banking clients of ING Financial Markets LLC or an affiliate.
Buy: Forecast 12-mth absolute total return greater than +15%
Hold: Forecast 12-mth absolute total return of +15% to -5%
Sell: Forecast 12-mth absolute total return less than -5%
Total return: forecast share price appreciation to target price plus forecast annual dividend. Price volatility and our preference for not changing recommendations too frequently means forecast returns may fall outside of the above ranges at times.
Research published prior to 15/12/05: EMEA equities’ ratings were based on US dollar total returns; Western Europe’s were based on: absolute return +25%, Strong Buy; greater than +10%, Buy; +10% to -10%, HOLD; lower than -10%, Sell.
_

48
FMCG distributors March 2008
AMSTERDAM BRUSSELS LONDON NEW YORK SINGAPORETel: 31 20 563 84 17 Tel: 32 2 547 75 34 Tel: 44 20 7767 1000 Tel: 1 646 424 6000 Tel: 65 6535 3688
Bratislava Tel: 421 2 5934 61 11 Bucharest Tel: 40 21 222 1600 Budapest Tel: 36 1 268 0140 Buenos Aires Tel: 54 11 4310 4700 Dubai Tel: 971 4 365 3430
Edinburgh Tel: 44 131 527 3000 Geneva Tel: 41 22 593 8050 Hong Kong Tel: 852 2848 8488 Istanbul Tel: 90 212 258 8770 Kiev Tel: 380 44 230 3030
Madrid Tel: 34 91 789 8880 Manila Tel: 632 479 8888 Mexico City Tel: 52 55 5258 2000 Milan Tel: 39 02 89629 3660 Moscow Tel: 7495 755 5400
Paris Tel: 33 1 56 39 31 41 Prague Tel: 420 2 5747 1111 Santiago Tel: 562 452 2700 Sao Paulo Tel: 55 11 4504 6000 Seoul Tel: 822 317 1800
Shanghai Tel: 86 21 6841 3355 Sofia Tel: 359 2 917 6400 Taipei Tel: 886 2 2734 7600 Tokyo Tel: 813 5210 0100 Warsaw Tel: 48 22 820 5018
Research offices: legal entity/address/primary securities regulator Almaty Representative office, ING Bank N.V. in Kazakhstan, 85a, Dostyk Avenue, Office 510, 050010, Almaty, Kazakhstan.
Agency of the Republic of Kazakhstan on Regulation and Supervision of Financial Market & Financial Organizations
Amsterdam ING Bank N.V., Foppingadreef 7, Amsterdam, Netherlands, 1102BD. Netherlands Authority for the Financial Markets
Bratislava ING Bank N.V., pobocka zahranicnej banky, Jesenskeho 4/C, 811 02 Bratislava, Slovak Republic. National Bank of Slovakia
Brussels ING Belgium S.A./N.V., Avenue Marnix 24, Brussels, Belgium, B-1000. Banking Finance and Insurance Commission
Bucharest ING Bank N.V. Bucharest Branch, 11-13 Kiseleff Avenue, PO Box 2-208, 011342, Bucharest 1, Romania Romanian National Securities and Exchange Commission
Budapest ING Bank Zrt, Dozsa Gyorgy ut 84\B, H - 1068 Budapest, Hungary. Hungarian Financial Supervisory Authority
Dubai ING Bank N.V. Dubai Branch, Level 2, Gate Village 05, Dubai International Financial Center (DIFC), PO Box 506641 Dubai Financial Services Authority
Edinburgh ING Bank N.V. London Branch (Edinburgh office), 2 Canning Street Lane, Edinburgh, United Kingdom, EH3 8ER. Financial Services Authority
Hong Kong ING Bank N.V. Hong Kong Branch, 39/F, One International Finance Centre, Central Hong Kong. Hong Kong Monetary Authority
Istanbul ING Bank N.V. Istanbul Representative Office, Suleyman Seba Cadessi No. 48 BJK Plaza, Blok B Floor 8, 34357 Akaretler-Besiktas, Istanbul, Turkey. Capital Markets Board
Kiev ING Bank Ukraine JSC, 30-a, Spaska Street, Kiev, Ukraine, 04070 Ukrainian Securities and Stock Commission
London ING Bank N.V. London Branch, 60 London Wall, London EC2M 5TQ, United Kingdom. Financial Services Authority
Madrid ING Bank NV, Sucursal en Espana, C/Genova, 27. 4th Floor, Madrid, Spain, 28004. Comisión Nacional del Mercado de Valores
Manila ING Bank N.V. Manila Branch, 21/F Tower I, Ayala Avenue, 1226 Makati City, Philippines. Philippine Securities and Exchange Commission
Mexico City ING Grupo Financiero (Mexico) S.A. de C.V., Bosques de Alisos 45-B, Piso 4, Bosques de Las Lomas, 05120, Mexico City, Mexico. Comisión Nacional Bancaria y de Valores
Milan ING Bank N.V. Milano, Via Paleocapa, 5, Milano, Italy, 20121. Commissione Nazionale per le Società e la Borsa
Moscow ING Bank (Eurasia) ZAO, 36, Krasnoproletarskaya ulitsa, 127473 Moscow, Russia. Federal Financial Markets Service
Mumbai ING Vysya Bank Limited, A Wing, Shivsagar Estate, 2nd Floor, South Wing, Dr. Annie Besant Road, Worli, Mumbai, 400 018. India Securities and Exchange Board of India
New York ING Financial Markets LLC, 1325 Avenue of the Americas, New York, United States, 10019. Securities and Exchange Commission
Paris ING Belgium S.A., Succursale en France, Coeur Défense, Tour A, La Défense 4, 110 Esplanade du Général de Gaulle, Paris La Défense Cedex, 92931. l’Autorité des Marchés Financiers
Prague ING Bank N.V. Prague Branch, Nadrazni 25, 150 00 Prague 5, Czech Republic. Czech National Bank
Sao Paulo ING Bank N.V. Sao Paulo, Av. Brigadeiro Faria Lima n. 3.400, 11th Floor, Sao Paulo, Brazil 04538-132. Securities and Exchange Commission of Brazil
Singapore ING Bank N.V. Singapore Branch, 19/F Republic Plaza, 9 Raffles Place, #19-02, Singapore, 048619. Monetary Authority of Singapore
Sofia ING Bank N.V. Sofia Branch, 12 Emil Bersinski Str, Ivan Vazov Region, 1408 Sofia, Bulgaria. Bulgarian Central Bank and Financial Supervision Commission
Warsaw ING Securities S.A., Plac Trzech Krzyzy, 10/14, Warsaw, Poland, 00-499. Polish Financial Supervision Authority
Disclaimer This report has been prepared on behalf of ING (being for this purpose the wholesale and investment banking business of ING Bank NV and certain of its subsidiary companies) solely for the information of its clients. ING forms part of ING Group (being for this purpose ING Groep NV and its subsidiary and affiliated companies). Itis not investment advice or an offer or solicitation for the purchase or sale of any financial instrument. While reasonable care has been taken to ensure that theinformation contained herein is not untrue or misleading at the time of publication, ING makes no representation that it is accurate or complete. The information contained herein is subject to change without notice. ING Group and any of its officers, employees, related and discretionary accounts may, to the extent notdisclosed above and to the extent permitted by law, have long or short positions or may otherwise be interested in any transactions or investments (including derivatives) referred to in this report. In addition, ING Group may provide banking, insurance or asset management services for, or solicit such business from, anycompany referred to in this report. Neither ING Group nor any of its officers or employees accepts any liability for any direct or consequential loss arising from anyuse of this report or its contents. Copyright and database rights protection exists in this report and it may not be reproduced, distributed or published by any person for any purpose without the prior express consent of ING. All rights are reserved. Any investments referred to herein may involve significant risk, are not necessarilyavailable in all jurisdictions, may be illiquid and may not be suitable for all investors. The value of, or income from, any investments referred to herein may fluctuateand/or be affected by changes in exchange rates. Past performance is not indicative of future results. Investors should make their own investigations and investment decisions without relying on this report. Only investors with sufficient knowledge and experience in financial matters to evaluate the merits and risks should consideran investment in any issuer or market discussed herein and other persons should not take any action on the basis of this report. This report is issued: 1) in the UnitedKingdom only to persons described in Articles 19, 47 and 49 of the Financial Services and Markets Act 2000 (Financial Promotion) Order 2005 and is not intended to be distributed, directly or indirectly, to any other class of persons (including private investors); 2) in Italy only to persons described in Article No. 31 of ConsobRegulation No. 11522/98. Clients should contact analysts at, and execute transactions through, an ING entity in their home jurisdiction unless governing law permitsotherwise. ING Bank N.V., London branch is authorised by the Dutch Central Bank and regulated by the Financial Services Authority for the conduct of UK business. It is incorporated in the Netherlands and its London branch is registered in the UK (number BR000341) at 60 London Wall, London EC2M 5TQ. ING FinancialMarkets LLC, which is a member of the NYSE, NASD and SIPC and part of ING, has accepted responsibility for the distribution of this report in the United States under applicable requirements. ING Vysya Bank Ltd is responsible for the distribution of this report in India. EQ Additional information is available on request