polarographic analysis of normal and pathological sera
TRANSCRIPT

36()
POLAROGRAPHIC ANALYSIS OF NORMALi ANDPATHOLOGICAL SERA.
ALICE M. ROBINSON.From the Pathology Department, St. Bartholomew's Hospital, London, E.C(.I.
Received for publieation November 23, 1948.
BRDICKA (1933) discovered that sulphur-containing proteins gave charac-teristic polarographic waves when examined in ammonia buffer solutions con-taining traces of cobalt salts. Application of this method of analysis to normaland carcinomatous sera showed that the latter had smaller quantities of sulphur-containing proteins. An important advance in technique occurred whenBrdicka (1938; 1939) demonstrated that filtrates prepared from alkali-treatedsera after precipitation with sulphosalicylic acid showed much greater differencesbetween normal sera and sera from cancer patients. With the filtrates thedifference between the two types of sera was reversed, that is, the sera fromcancer patients showed higher waves, indicating the presence of more sulphidicsubstance in their filtrates.
Further work showed that the presence of a high filtrate wave was not speci-fically characteristic of cancer sera (Brdicka, 1947). A valuable observationwas, however, that in sera from patients undergoing successful treatment (e.g.surgical or irradiation therapy) the abnormally high serum filtrate waves revertedto normal size.
Recent increasing use of chemotherapeutic nmeasures, at least in soimie formsof malignancy, suggested that the polarographic method might have some valueas an objective, albeit purely empirical, measure of the efficacy of such therapy.
With this object in view some preliminary investigations were carried outwhich have already been briefly reported (Robinson and Warren, 1948). Alarger series of sera from normal subjects, from patients with malignant andnon-malignant diseases and sera from patients with malignant disease under-going therapy, has now been studied in an attempt to assess the value of themethod and its limitations. The results reported in the present paper are basedon the polarographic examination of approximately 300 sera.
EXPERIMENTAL.
The technique was standardized for use with a Tinsley ink-recording polaro-graph. The cell was of a simple cylindrical type, open to air. The anode con-sisted of a pool of mercury of 1-2 cm. diameter. The capillary had the followingcharacteristics: At a pressure of mercury of 71-5 Cnm. the drop-time was 3-57seconds (oyen circuit), and the weight of mercury dropping Per second was1-63 mg. All polarograms were measured at room temperature (15-20° C.)since preliminary observations indicated that the temperature coefficient of thediffusion current was very small.
POLAROGRAPHIC ANALYSIS OF SERA
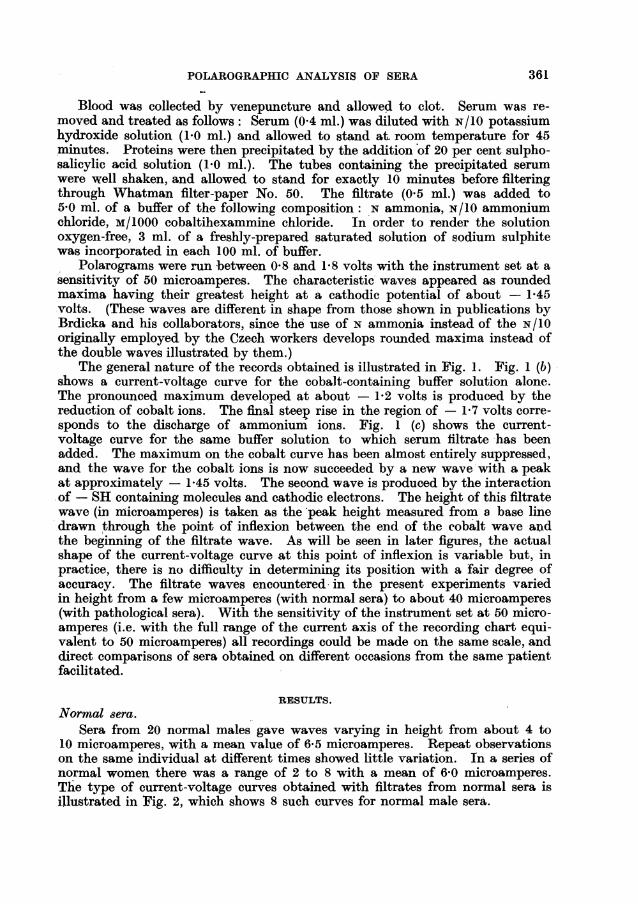
Blood was collected by venepuncture and allowed to clot. Serum was re-moved and treated as follows: Serum (0-4 ml.) was diluted with N/Ib potassiumhydroxide solution (1.0 ml.) and allowed to stand at room temperature for 45minutes. Proteins were then precipitated by the addition'of 20 per cent sulpho-salicylic acid solution (10 ml.). The tubes containing the precipitated serumwere well shaken, and allowed to stand for exactly 10 minutes before filteringthrough Whatman filter-paper No. 50. The filtrate (0 5 ml.) was added to5 0 ml. of a buffer of the following composition: N ammonia, N/10 ammoniumchloride, M/1000 cobaltihexammine chloride. In order to render the solutionoxygen-free, 3 ml. of a freshly-prepared saturated solution of sodium sulphitewas incorporated in each 100 ml. of buffer.
Polarograms were run between 0-8 and 1-8 volts with the instrument set at asensitivity of 50 microamperes. The characteristic' waves appeared as roundedmaxima having their greatest height at a cathodic potential of about - 1-45volts. (These waves are different in shape from those shown in publications byBrdicka and his collaborators, since the use of N ammonia instead of the N/I0originally employed by the Czech workers develops rounded maxima instead ofthe double waves illustrated by them.)
The general nature of the records obtained is illustrated in Fig. 1. Fig. 1 (b)shows a current-voltage curve for the cobalt-containing buffer solution alone.The pronounced maximum developed at about - 1-2 volts is produced by thereduction of cobalt ions. The final steep rise in the region of - 1-7 volts corre-sponds to the discharge of ammonium ions. Fig. 1 (c) shows the current-voltage curve for the same buffer solution to which serum filtrate -has beenadded. The maximum on the cobalt curve has been almost entirely suppressed,and the wave for the cobalt ions is now succeeded by a new wave with a peakat approximately - 1-45 volts. The second wave is produced by the interactionof - SH containing molecules and cathodic electrons. The height of this filtratewave (in microamperes) is taken as the'peak height measured from a base linedrawn through the point of inflexion between the end of the cobalt wave audthe beginning of the filtrate wave. As will be seen in later figures, the actualshape of the current-voltage curve at this point of inflexion is variable but, inpractice, there is no difficulty in determining its position with a fair degree ofaccuracy. The filtrate waves encountered in the present experiments variedin height from a few microamperes (with normal sera) to about 40 microamperes(with pathological sera). With the sensitivity of the instrument set at 50 micro-amperes (i.e. with the full range of the current axis of the recording chart equi-valent to 50 microamperes) all recordings could be made on the same scale, anddirect comparisons of sera obtained on different occasions from the same patientfacilitated.
RESULTS.Normal sera.
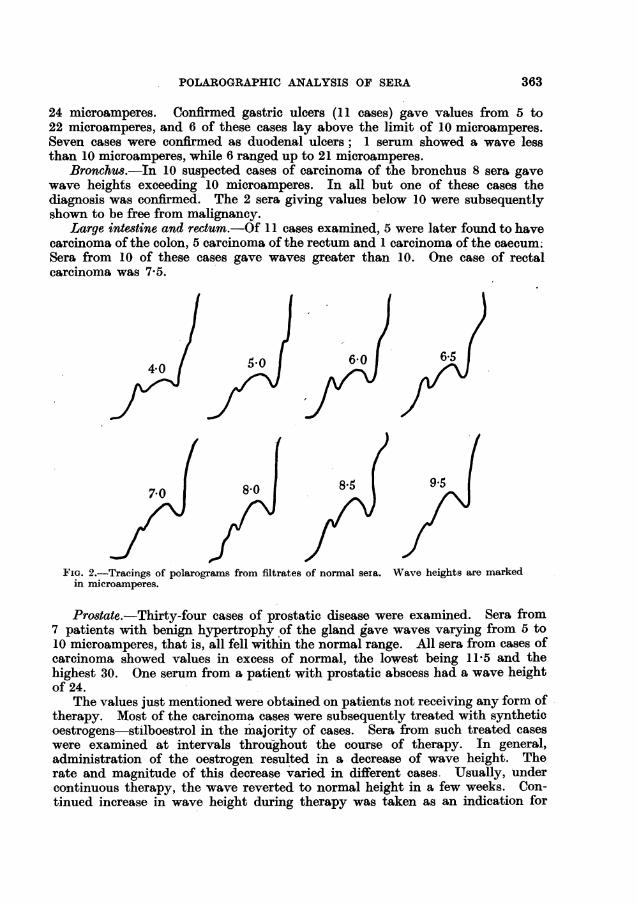
Sera from 20 normal males gave waves varying in height from about 4 to10 microamperes, with a mean value of 6-5 microamperes. Repeat observationson the same individual at different times showed little variation. In a series ofnormal women there was a range of 2 to 8 with a mean of 6-0 microamperes.The type of current-voltage curves obtained with filtrates from normal sera isillustrated in Fig. 2, which shows 8 such curves for normal male sera.
361

ALICE M. ROBINSON
Pathological 8era.Most of the sera examined were from patients suspected of cancer. A smaller
number of cases on confirmed non-malignant conditions were also investigatedfor comparison. In the interpretation of polarograms from pathological sera avalue of 10 microamperes was taken as representing the upper limit of normalityso far encountered in this work. This arbitrary limit was taken for want of a
FIG. 1.-Polarographic tracings.(a) Ammonia-ammonium chloride buffer.(b) Buffer plus cobaltihexammine chloride.(c) Cobaltic buffer plus blood filtrate.
better but, since the wave height for a normal ,erum can be as low as 2 micro-amperes in some individuals, values less than 10 microamperes might representdeviations from normality in some cases. However, for the present purpose,all values under 10 are considered as within normal limits.
Stomach and duodenum.-Twenty-five cases were examined in which theprovisional diagnosis lay between neoplasia or gastric or duodeyal ulcer. Sevenconfirmed cases of carcinoma of the stomach gave waves ranging from 12 to
362
POLAROGRAPHIC ANALYSIS OF SERA
24 microamperes. Confirmed gastric ulcers (11 cases) gave values from 5 to22 microamperes, and 6 of these cases lay above the limit of 10 microamperes.Seven cases were confirmed as duodenal ulcers; 1 serum showed a wave -lessthan 10 microamperes, while 6 ranged up to 21 microamperes.
Bronchus.-In 10 suspected cases of carcinoma of the bronchus 8 sera gavewave heights exceeding 10 microamperes. In all but one of these cases thediagnosis was confirmed. The 2 sera giving values below 10 were subsequentlyshown to be free from malignancy.
Large intestine and rectum.-Of 11 cases examined, 5 were later found to havecarcinoma of the colon, 5 carcinoma of the rectum and 1 carcinoma of the caecum;Sera from 10 of these cases gave waves greater than 10. One case of rectalcarcinoma was 7-5.
4-0 s.o 6.065
7-0 8-0 859.5
FiG. 2.-Tracings of polarograms from filtrates of normal sera. Wave heights are markedin microamperes.
Prostate.-Thirty-four cases of prostatic disease were examined. Sera from7 patients with benign hypertrophy of the gland gave waves varying from 5 to10 microamperes, that is, all fell within the normal range. All sera from cases ofcarcinoma showed values in excess of normal, the lowest being 11-5 and thehighest 30. One serum from a patient with prostatic abscess had a wave heightof 24.
The values just mentioned were obtained on patients not receiving any form oftherapy. Most of the carcinoma cases were subsequently treated with syntheticoestrogens-stilboestrol in the majority of cases. Sera from such treated caseswere examined at intervals throughout the course of therapy. In general,administration of the oestrogen resulted in a decrease of wave height. Therate and magnitude of this decrease varied in different cases. Usually, undercontinuous therapy, the wave reverted to normal height in a few weeks. Con-tinued increase in wave height during therapy was taken as an indication for
363

364 ALICE M. ROBINSON
increased dosage of oestrogen. Individual data for these cases, together withsome values for serum acid phosphatase determined on the same specimens, areshown in Table I. Tracings of polarograms obtained during therapy of Case 8are shown in Fig. 3.
TABLE I.-Wave Heights and Acid Phosphatase Values of Sera from Casesof Prostatic Carcinoma.
Oestrogen therapy.
None
2 weeks'
5 ,,
,,
9ff15,171,,21j34
None3 weeks45612
None4 days9
126 weeks4 months56
10None
5 days95 weeks5 months67
10
'ATavcheight.10958
10961524*59.5657.5559.5
24141316149
2224151398786
3018149
20*5161015
Acidphosphatase.
>100>100
179.5
* 6*3
1*8
* 1*3
21
* 1*2.
* *831*51*6
* *1-
6-4
127.51*62*5316
Case'No.12345678
Diagnosis.
Benign
Carcinoma
9
10
11
12
13

POLAROGRAPHIC ANALYSIS OF SERA
TABLE I--(cont.).
Diagnosis.
Carcinoma
Oestrogen therapy.
None
1 weekNone
6 weeksNone
577191
11
..
,,)Abscess
+
+
daysweeksmonths
weekmonths
Waveheight.
12171025*51211.51916-5121617-511.524157
1010258
12345
24
Acidphosphatase.
* * 8
* * *
* * *
* * @
* * @
* * @
* * @
* * @
* * @
* * .
* * @
* * *
* * *
* *
* * v
* * v
* * -
1 v5* * v
* * s
* * -
* * -
* * .
* * -
(A plus sign in the oestrogen therapy column indicates that the patient was undergoing therapybut that the date of commencement was uncertain.)
AMiscellaneous carcinomata.-In this group are included sera from patientswith carcinoma of bladder, gall bladder, kidney, pancreas, parotid, thyroid,tongue, oesophagus and ovary. In all these cases, with the exception of theserum from the patient with the parotid tumour, waves exceeding 10 micro-amperes were recorded.
Generalized malignant conditious.-Hodgkin's disease showed extremely highwaves. Two cases gave values of 32 and 39 microamperes. Of 4 cases ofmyelomatosis, 2 exceeded 10 and 2 fell within the normal range. A case ofreticulosarcoma showed a wave of 12, one of lymphadenoma 27 and one oflymphatic leukaemia also 27. Two cases of generalized carcinomatosis hadwave heights of 17 and 27.
Non-malignant conditions.-In all cases investigated which were free frominfection or inflammation waves were recorded which fell within normal limits.In pulmonary tuberculosis, on the other hand, high waves were obtained-some-times extremely high, e.g. 35 microamperes.
In Fig. 4 the wave heights recorded with sera from some typical conditionsare illustrated diagrammatically.
CaseNo.
14
15
1(171819202122232425262728293031323334
i"I65

ALICE M. ROBINSON
0 2 5 9Y2 15i/2 17'/2 211/2 34 Weeks oftherapy103 13 9 5 6 3 Acid phosphatase
FIG. 3.-Tracings of polarograms from a case of carcinoma of the prostate undergoing treat-ment with stilboestrol. Wave heights in microamperes. Acid phosphatase in King-Armstrong units per 100 ml. blood.
in.a.30r
201-
10
NormalM.a.30F
20F
10
Cabronchus
FIG. 4.-WVEave heightsmalignant conditions.
_i1_
I - -I-I I II- s I I* - . - . ..
Gastric Duodenalulcer ulcer
iitrCa Ca
colon rectumin microamperes
lHr
Castomach
I- I'Ca Benign
prostate prostatic hypertrophyof polarogramns in some typical benign and
L.1kw6.&W.w66..a.....-.16d
I
mSL:I
366
----------------

POLAROGRAPHIC ANALYSIS OF SERA
DISCUSSION.
As Brdicka has repeatedly emphasized, a single polarographic examinationof a serum cannot give definite proof of malignancy, since abnormally high wavesare frequently encountered in non-malignant diseases. However, if infection orinflammation can be excluded, wave heights in excess of normal indicate thatmalignancy may be present, and suggest the advisability of exhaustive searchfor the neoplasm. The results obtained in the present work bear out this con-tention. In one group of patients that was investigated, the presenting symptomswere anaemia of unknown origin and loss of weight. Three such cases gavewaves of 215, 17 and 14 on first examination. Further investigation revealedthe presence of a carcinoma of the ovary in the first and of carcinoma of thecolon in the second and third respectively.
As an aid to diagnosis the most useful method is undoubtedly serial examina-tion of sera. Repeated examination at intervals of a week to a month may givevaluable information, and permit differentiation between a benign and a malignantcondition. For example, one case of gastric ulcer was given routine medicaltreatment. At the beginning of treatment the wave height was 22, after 24days of treatment it was 13, and after 38 days, 8.5, that is, within normal limits.Sera from unoperated cases of carcinoma of the stomach show an increase ofwave height with time.
The polarographic method appears to be particularly suitable for investiga-tion of prostatic disease. In cases so far examined the presence of malignancyhas invariably led to high waves, while benign enlargement of the gland has not.Moreover, the height of the wave is decreased by the administration of oestrogens.A larger series than the one reported in the present paper is clearly necessarybefore definite conclusions can be drawn, but if further investigation shows thatthe wave height is correlated with the clinical condition of the patient, then suchmeasurements may prove to be the most sensitive indications available of theefficacy of oestrogen therapy in individual cases.
Figures for serum acid phosphatase determinations in some cases are includedin Table 1. From the data for Case 8 it can be seen that the general trend ofwave heights and acid rhosphatase values during therapy is simnilar. However,low values of serum acid phosphatase do not preclude high waves (e.g. Cases 9,12, 13 and 28). Correlation between the po]arographic and enzyme measure-ments is not absolute, and further work is required to determine which methodgives a more accurate reflection of the clinical condition of the patient. Inparticular, infoimation is required as to whether cases in which the decline inwave height with continued therapy is slight, or slow (e.g. Case 13), are charac-terized by resistance to oestrogen, and have a worse prognosis than those (e.g.Case 10) in which the decline is marked or rapid.
Very high waves are encountered in Hodgkin's disease. One such case wasexamined during therapy with nitrogen mustard. The initial wave of 32 declinedto 26 after one week of treatment, but had reverted to the original value of 32when death occurred 6 weeks later.
A number of cases of breast carcinoma and mastitis was also examined, butthe series is not yet large enough for detailed report. The preliminary resultswere in agreement with those reported by Fort, Brdicka, Ott and Voriskova
367

368 ALICE M. ROBINSON
(1942), namely, that the benign conditions were usually characterized by normalwaves, but that a proportion of malignant cases also had waves within normallimits. In general, however, the higher grades of malignancy were associatedwith higher waves.
The preliminary survey recorded in the present paper indicates that theexamination of sera by polarographic means in suitably selected cases may be auseful aid to diagnosis, and that the use of this method in the assessment of theresults of therapy merits further study.
SUMMARY.
1. Brdicka's method of polarographic examination of pathological sera isdescribed.
2. Results of the application of this method to t,e examination of a numberof malignant and non-malignant conditions are recorded.
3. The method is particularly suited to the examination of sera from patientswith prostatic disease. Repeated examination of such sera gives a valuableindication of the effectiveness of therapy with synthetic oestrogens in cases ofcarcinoma of the prostate.
4. It is suggested that the method may have wider uses as an objective measureof the results of chemotherapy in other forms of cancer.
This work has been supported by generous grants to this Hospital by theBritish Empire Cancer Campaign. I am grateful for much helpful co-operationand advice from the Medical Staff of St. Bartholomew's Hospital. I am particu-larly indebted to Dr. W. G. Dangerfield for obtaining many of the blood speci-mens, to Mr. R. Hudson for determinations of acid phosphatase, and to Dr. F. L.Warren for the use of his polarograph in the initial stages of this work.
REFERENCES.BRDICKA, R.-(1933) Coll. Trav. chim. Tch0co8l., 5, 112, 148, 238.-(1938) Acta Unionis
Internationali8 contra Cancrum, 3, 13.-(1939) Acta Radiol. Cancerol. BohemiaeMoraviae, 2, 7.-(1947) Research, 1, 25.
FORT, M., BRDICKA, R., OTT, K., AND VORISKOVA, M.-(1942) Zvlastni otisk z Casopi8uekkaru ceskych, 81, 1181.
ROBINSON, A. M., AND WARREN, F. L.-(1948) J. Path. Bact., 60, 152.