poland - oecdgpseducation.oecd.org/content/eagcountrynotes/pol.pdf · poland participation in early...
TRANSCRIPT
Education at a Glance: OECD Indicators is the authoritative source for information on the state of education around
the world. It provides data on the structure, finances and performance of education systems in the OECD and partner
countries.
Poland
Participation in early childhood education and care (ECEC) in Poland has grown significantly in the last decade
with an average increase for 3-5 year-olds of 47 percentage points. A new legal entitlement set in 2017 is
expected to address socio-economic and regional disparities in enrolment.
The share of 25-34 year-olds with below upper secondary education in Poland is 5%, the lowest across OECD
countries after Korea (2%).
Poland’s public expenditure on training programmes within active labour market programmes (ALMPs) that aim
to support employability through targeted services and training programmes is only 0.01% of gross domestic
product (GDP), among the lowest across OECD countries.
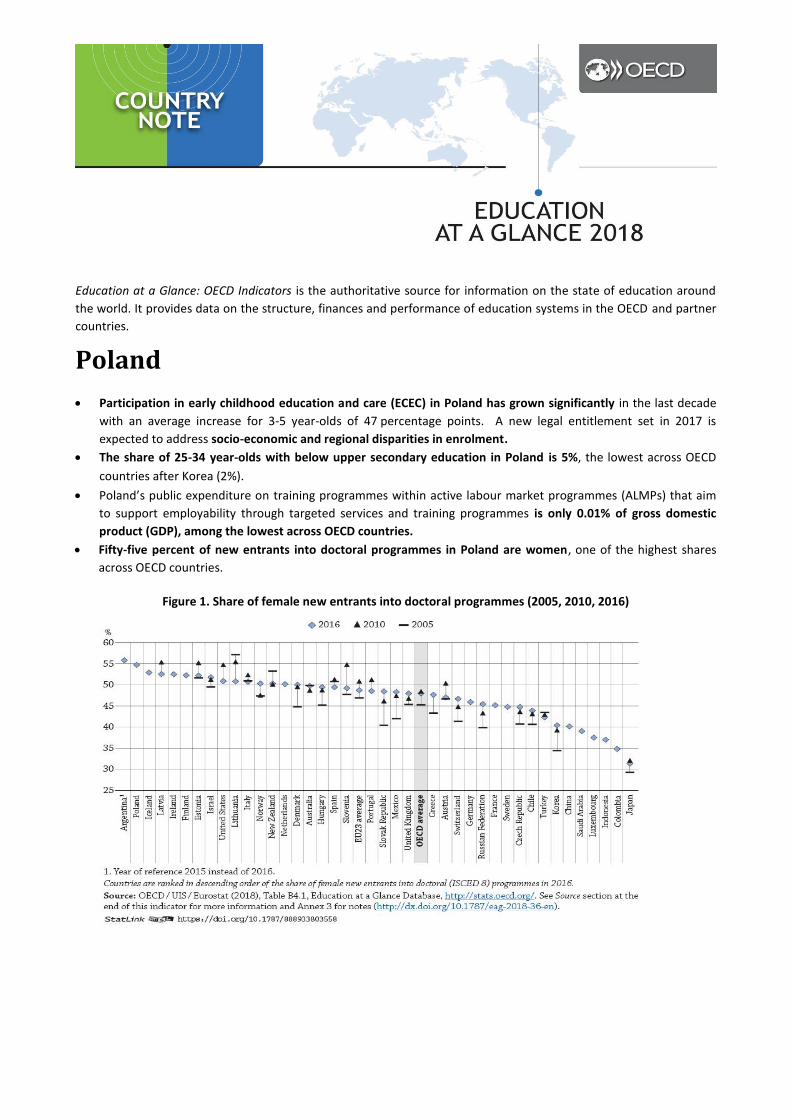
Fifty-five percent of new entrants into doctoral programmes in Poland are women, one of the highest shares
across OECD countries.
Figure 1. Share of female new entrants into doctoral programmes (2005, 2010, 2016)
Poland - Country Note - Education at a Glance 2018: OECD Indicators
2 © OECD 2018
Poland faces gender, socio-economic and geographical equity gaps across
educational levels
In Poland, the enrolment rate in early childhood education and care (ECEC) programmes for children under 3 in
2016 was 12%, much lower than the OECD average of 34%. Children are more likely to be enrolled if they come
from relatively advantaged socio-economic backgrounds: the enrolment rate among children from the families
with the lowest income tertile1 is 5%, compared to 18% for the most advantaged. Mothers’ educational
attainment also affects enrolment: the enrolment rate in early childhood education is 21% for children under 3
with tertiary-educated mothers, but only 3% among those with less well-educated mothers, the lowest among
OECD countries with available data.
Employment opportunities also vary considerably across subnational regions: In 2017, the share of 15-29 year-
olds who are neither employed nor in education or training (NEET) varies from 9.4% to 20%, with the more rural
and remote regions of Poland faring worse.
Female graduates outnumber male graduates in general upper secondary schools in Poland – they make up 59%
of graduates from these schools. On the other hand, 39% of graduates in vocational education and training (VET)
are female, compared to the OECD average of 46%.
Women make up 55% of new entrants into doctoral programmes in Poland, the highest share across OECD
countries, compared with the average of 48% (Figure 1). While more women than men enter doctoral
programmes in natural sciences, mathematics and statistics, fewer enter the fields of information and
communication technologies (ICT) and engineering, construction and manufacturing.
Gaps in educational attainment can lead to significant inequalities in the labour market in Poland where the
employment rate of tertiary-educated adults is 19 percentage points higher than the employment rate of those
with upper secondary education only (88% and 69% respectively). By measure of comparison, the employment
advantage of tertiary-educated adults over those with upper secondary education only is 10 percentage points on
average across OECD countries.
Enrolment in early childhood education and care (ECEC) programmes has
increased significantly for 3-5 year-olds
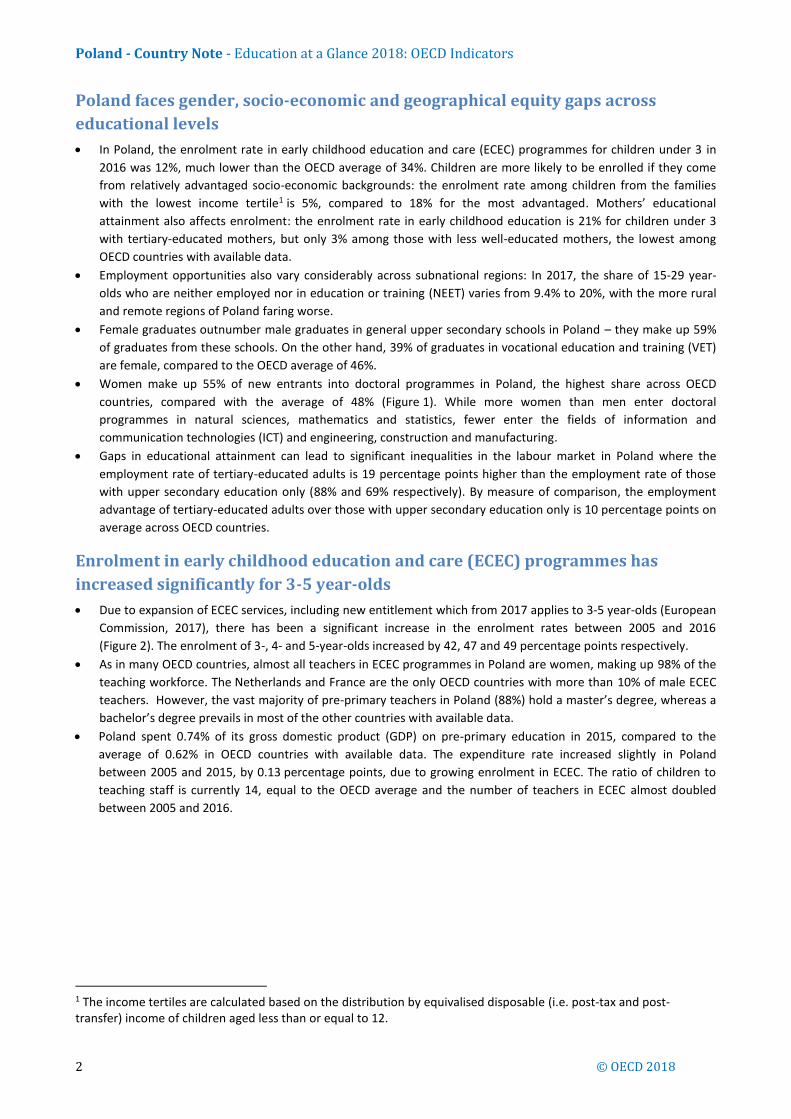
Due to expansion of ECEC services, including new entitlement which from 2017 applies to 3-5 year-olds (European
Commission, 2017), there has been a significant increase in the enrolment rates between 2005 and 2016
(Figure 2). The enrolment of 3-, 4- and 5-year-olds increased by 42, 47 and 49 percentage points respectively.
As in many OECD countries, almost all teachers in ECEC programmes in Poland are women, making up 98% of the
teaching workforce. The Netherlands and France are the only OECD countries with more than 10% of male ECEC
teachers. However, the vast majority of pre-primary teachers in Poland (88%) hold a master’s degree, whereas a
bachelor’s degree prevails in most of the other countries with available data.
Poland spent 0.74% of its gross domestic product (GDP) on pre-primary education in 2015, compared to the
average of 0.62% in OECD countries with available data. The expenditure rate increased slightly in Poland
between 2005 and 2015, by 0.13 percentage points, due to growing enrolment in ECEC. The ratio of children to
teaching staff is currently 14, equal to the OECD average and the number of teachers in ECEC almost doubled
between 2005 and 2016.
1 The income tertiles are calculated based on the distribution by equivalised disposable (i.e. post-tax and post-transfer) income of children aged less than or equal to 12.
Poland - Country Note - Education at a Glance 2018: OECD Indicators
Figure 2. Change in enrolment rates of children aged 3 to 5 years (2005, 2010 and 2016)
Early childhood education and primary education
The majority of 25-64 year-olds have at least upper secondary education, but
participation in lifelong learning is lower than the OECD average
Poland has ongoing educational reforms planned for 2017-2022/23. These include merging primary and lower
secondary levels into an 8-year primary level, as well as reintroducing a 4-year general secondary school level, a 5-
year technical secondary school level and a two-stage sectoral vocational education and training (VET) level of 3
and 2 years. Its aims to increase the attractiveness of VET and strengthen the links between VET and the labour
market (European Commission, 2017).
The share of 25-34 year-olds with less than upper secondary education has fallen between 2007 and 2017 and is
currently just 5%, the lowest across OECD countries after Korea (2%). At this rate, 84% of individuals in Poland are
expected to graduate from upper secondary education for the first time before the age of 25 (45% from general
programmes and 39% from vocational programmes), a similar rate to the OECD average of 81%.
However, upper secondary vocational programmes are by far the most common path for upward educational
mobility among adults whose parents did not achieve upper secondary education: 66% of this group attained a
vocational upper secondary education compared to 4% who attained general upper secondary education.
Women are less represented in VET programmes than on average across OECD countries, although these
imbalances vary across fields of study. Only 12% of those graduating from VET programmes in engineering,
manufacturing and construction in Poland are women, similar to the OECD average for these fields. On the other
hand, while women are over-represented in health and welfare programmes, making up 68% of all graduates, this
is below the OECD average of 77%.
Poland faces a critical long-term challenge in establishing a lifelong learning culture. Participation in formal and
non-formal adult education increases with higher educational attainment, but according to the recent Adult
Learning Survey, participation of adults in education and training in Poland is still low, especially among older and
low-skilled people (European Commission, 2017). Among 25-64 year-olds with below upper secondary education
in Poland, participation in formal and/or non-formal education is 14% compared to the OECD average of 25%,
although the share of adults with below upper secondary attainment is among the lowest across OECD countries.
However, the gap in participation in non-formal learning is much larger than that in formal learning (Eurostat,
2016). Poland also spends only 0.01% of its GDP on training programmes within active labour market
programmes (ALMPs) that aim to support employability through targeted services and training programmes, one
of the lowest amounts across OECD countries. In contrast Austria, Denmark and Finland spend more than 0.45%
of GDP on such programmes.
Poland - Country Note - Education at a Glance 2018: OECD Indicators
4 © OECD 2018
Tertiary education is gaining more popularity although funding remains low
The government has launched a new reform on higher education and science that will come into force during last
quarter of 2018. The reform aims to improve the quality and performance of higher education institutions
through structural changes to governance, funding, and evaluation. The reform also aims to improve the
performance of science programmes within higher education including new programmes for doctorates
(European Commission, 2017).
In 2017, 30% of 25-64 year-olds in Poland held a tertiary qualification, compared to the OECD average of 38%.
Entry rates into tertiary education in Poland have been increasing and currently 77% of women and 61% of men
are expected to enter tertiary education for the first time before the age of 25. Moreover, 73% of Polish 25-
64 year-olds who have at least one tertiary-educated parent (12% of the population) have attained a tertiary
education.
Between 2013 and 2016, the number of international students studying in Poland nearly doubled. In contrast, the
share of Polish students enrolled in other OECD and partner countries has remained stable since 2013.
There are significant differences in the preferred field of study by gender. In Poland, similarly to the OECD
average, women graduate mostly from business, administration and law (around 25% of all female graduates);
education (around 18%); and health and welfare studies (around 14%), while men graduate more from
engineering, manufacturing and construction (around 26% of all male graduates), as well as the fields of business,
administration and law (around 22%).
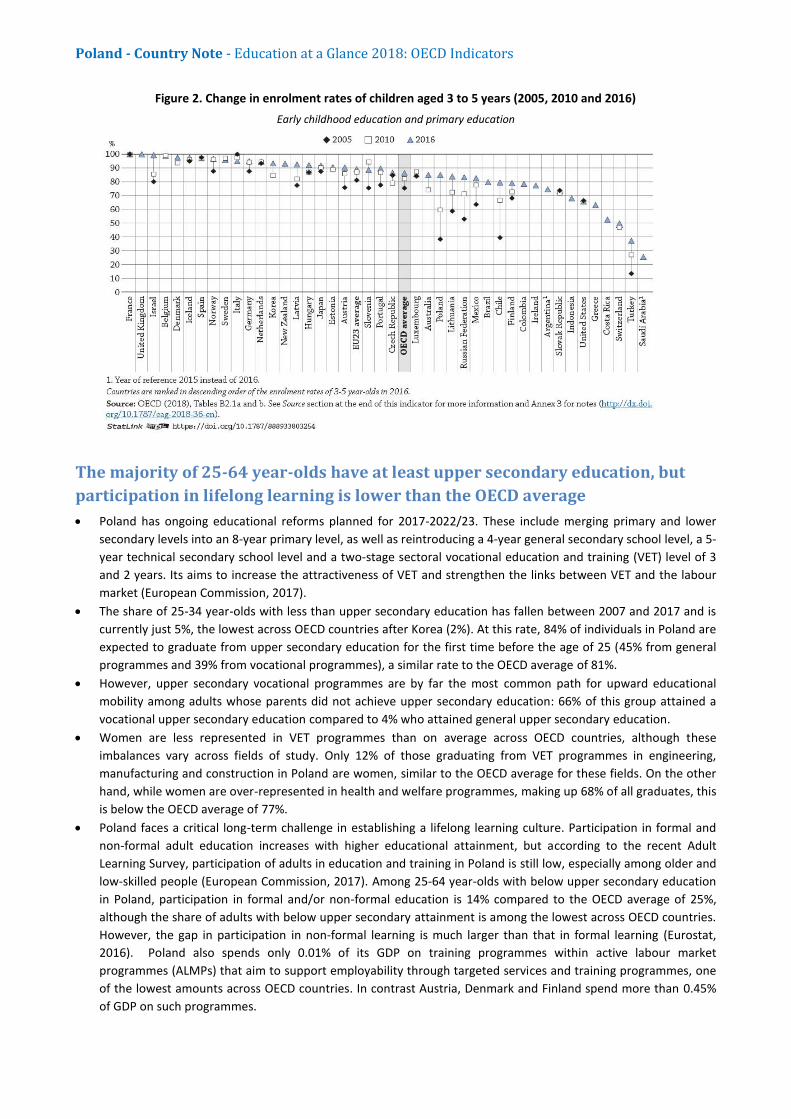
A higher share of Polish tertiary students study part time (31%) than the OECD average (20%). Part-time study is
more attractive to older students who are already active in the labour market: 49% of students above the age of
30 study part time, compared to the OECD average of 45% (Figure 3).
There has been a 25% increase in the total expenditure per full-time student in tertiary institutions in Poland
between 2010 and 2015. Yet this expenditure was still just USD 9 6872 in 2015, still significantly below the OECD
average of USD 15 474.
Figure 3. Part-time enrolment in tertiary education, by age group (2016)
2 Values reported in equivalent US dollars (USD) have been converted using purchasing power parities (PPPs) for GDP.
Poland - Country Note - Education at a Glance 2018: OECD Indicators
This work is published under the responsibility of the Secretary-General of the OECD. The opinions expressed and arguments
employed herein do not necessarily reflect the official views of OECD member countries.
This document and any map included herein are without prejudice to the status of or sovereignty over any territory, to the
delimitation of international frontiers and boundaries and to the name of any territory, city or area.
Note regarding data from Israel
The statistical data for Israel are supplied by and are under the responsibility of the relevant Israeli authorities. The use of
such data by the OECD is without prejudice to the status of the Golan Heights, East Jerusalem and Israeli settlements in the
West Bank under the terms of international law.
Lithuania was not an OECD member at the time of preparation of Education at a Glance and is therefore not included in the
zone aggregates mentioned in the publication. However this country note, produced at a later stage, includes updated figures
for the OECD and EU averages including Lithuania and therefore may differ from the figures mentioned in Education at a
Glance.
References
European Commission (2017), Education and Training Monitor 2017: Poland, Publications Office of the European Union,
Luxemburg, https://ec.europa.eu/education/sites/education/files/monitor2017-pl_en.pdf.
Eurostat (2016), Participation rate in education and training by sex [trng_aes_100] (database),
http://appsso.eurostat.ec.europa.eu/nui/show.do?dataset=trng_aes_100&lang=en (accessed on 22 August, 2018).
OECD (2018), Education at a Glance 2018: OECD Indicators, OECD Publishing, Paris, http://dx.doi.org/10.1787/eag-2018-en.
For more information on Education at a Glance 2018 and to access the full set of Indicators, visit
www.oecd.org/education/education-at-a-glance-19991487.htm.
Updated data can be found on line at http://dx.doi.org/10.1787/eag-data-en and by following the
under the tables and charts in the publication.
Explore, compare and visualise more data and analysis using:
http://gpseducation.oecd.org/CountryProfile?primaryCountry=POL&treshold=10&topic=EO.
Questions can be directed to:
Marie-Helene Doumet
Directorate for Education and Skills
Country note author:
Anna Katarzyna Wozniczka
Directorate for Education and Skills
Poland - Country Note - Education at a Glance 2018: OECD Indicators
6 © OECD 2018
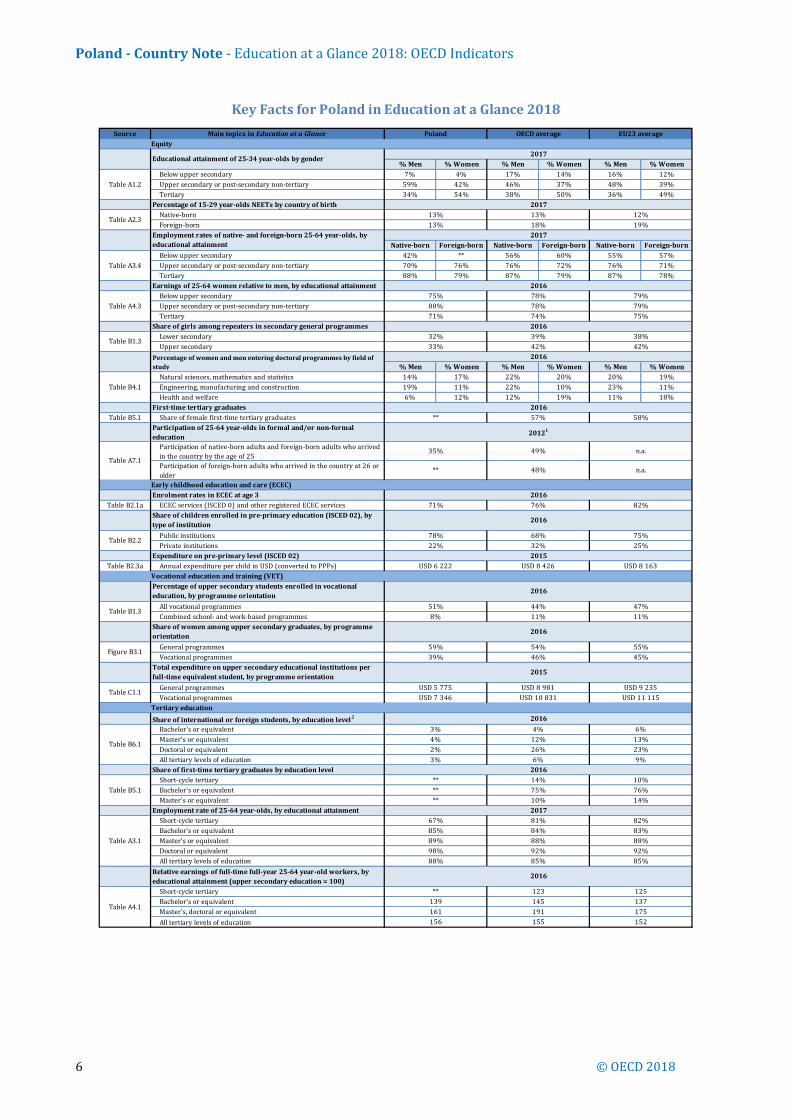
Source Main topics in Education at a Glance
% Men % Women % Men % Women % Men % Women
Below upper secondary 7% 4% 17% 14% 16% 12%
Upper secondary or post-secondary non-tertiary 59% 42% 46% 37% 48% 39%
Tertiary 34% 54% 38% 50% 36% 49%
Percentage of 15-29 year-olds NEETs by country of birth
Native-born
Foreign-born
Native-born Foreign-born Native-born Foreign-born Native-born Foreign-born
Below upper secondary 42% ** 56% 60% 55% 57%
Upper secondary or post-secondary non-tertiary 70% 76% 76% 72% 76% 71%
Tertiary 88% 79% 87% 79% 87% 78%
Earnings of 25-64 women relative to men, by educational attainment
Below upper secondary
Upper secondary or post-secondary non-tertiary
Tertiary
Share of girls among repeaters in secondary general programmes
Lower secondary
Upper secondary
% Men % Women % Men % Women % Men % Women
Natural sciences, mathematics and statistics 14% 17% 22% 20% 20% 19%
Engineering, manufacturing and construction 19% 11% 22% 10% 23% 11%
Health and welfare 6% 12% 12% 19% 11% 18%
First-time tertiary graduates
Table B5.1 Share of female first-time tertiary graduates
Participation of 25-64 year-olds in formal and/or non-formal
education
Participation of native-born adults and foreign-born adults who arrived
in the country by the age of 25
Participation of foreign-born adults who arrived in the country at 26 or
older
Enrolment rates in ECEC at age 3
Table B2.1a ECEC services (ISCED 0) and other registered ECEC services
Public institutions
Private institutions
Expenditure on pre-primary level (ISCED 02)
Table B2.3a Annual expenditure per child in USD (converted to PPPs)
All vocational programmes
Combined school- and work-based programmes
General programmes
Vocational programmes
General programmes
Vocational programmes
Share of international or foreign students, by education level2
Bachelor's or equivalent
Master's or equivalent
Doctoral or equivalent
All tertiary levels of education
Share of first-time tertiary graduates by education level
Short-cycle tertiary
Bachelor's or equivalent
Master's or equivalent
Employment rate of 25-64 year-olds, by educational attainment
Short-cycle tertiary
Bachelor's or equivalent
Master's or equivalent
Doctoral or equivalent
All tertiary levels of education
Relative earnings of full-time full-year 25-64 year-old workers, by
educational attainment (upper secondary education = 100)
Short-cycle tertiary
Bachelor's or equivalent
Master's, doctoral or equivalent
All tertiary levels of education
Figure B3.1
2016
59%
39%
54%
46%
55%
45%
2015
USD 5 775
USD 7 346
USD 8 981
USD 10 831
USD 9 235
2016
85%
92%
10%
85%
76%
14%
2017
Table B2.2
2016
78%
22%
68%
32% 25%
75%
84%
**
4%
9%
12% 13%
2%
Table C1.1USD 11 115
Table B1.3
2016
51%
Table B6.1
3%
Tertiary education
67%
75%
10%
82%
Percentage of upper secondary students enrolled in vocational
education, by programme orientation
Table A7.1
35% 49% n.a.
n.a.
Share of women among upper secondary graduates, by programme
orientation
2016
Early childhood education and care (ECEC)
Share of children enrolled in pre-primary education (ISCED 02), by
type of institution
2015
Vocational education and training (VET)
USD 6 222 USD 8 426 USD 8 163
Total expenditure on upper secondary educational institutions per
full-time equivalent student, by programme orientation
Table A3.1
85%
89%
98%
88%
81%
Table B5.1
92%
2016
26% 23%
3% 6%
4% 6%
83%
75%
88% 88%
139Table A4.1
145 137
152
191
20121
161
48%
71% 76% 82%
**
**
14%
**
2016
175
156 155
** 123 125
44% 47%
11%11%8%
Table B4.1
2016
57%
Table B1.332% 39%
Table A4.3
58%
42% 42%
38%
33%
2016
2016
**
2016
75%
80%
71%
78%
78%
74%
79%
79%
Key Facts for Poland in Education at a Glance 2018
Poland OECD average EU23 average
Equity
Table A1.2
Table A3.4
2017
Educational attainment of 25-34 year-olds by gender2017
Employment rates of native- and foreign-born 25-64 year-olds, by
educational attainment
Table A2.313% 13% 12%
13% 18% 19%
2017
Percentage of women and men entering docatoral programmes by
field of studyPercentage of women and men entering doctoral programmes by field of
study
Poland - Country Note - Education at a Glance 2018: OECD Indicators
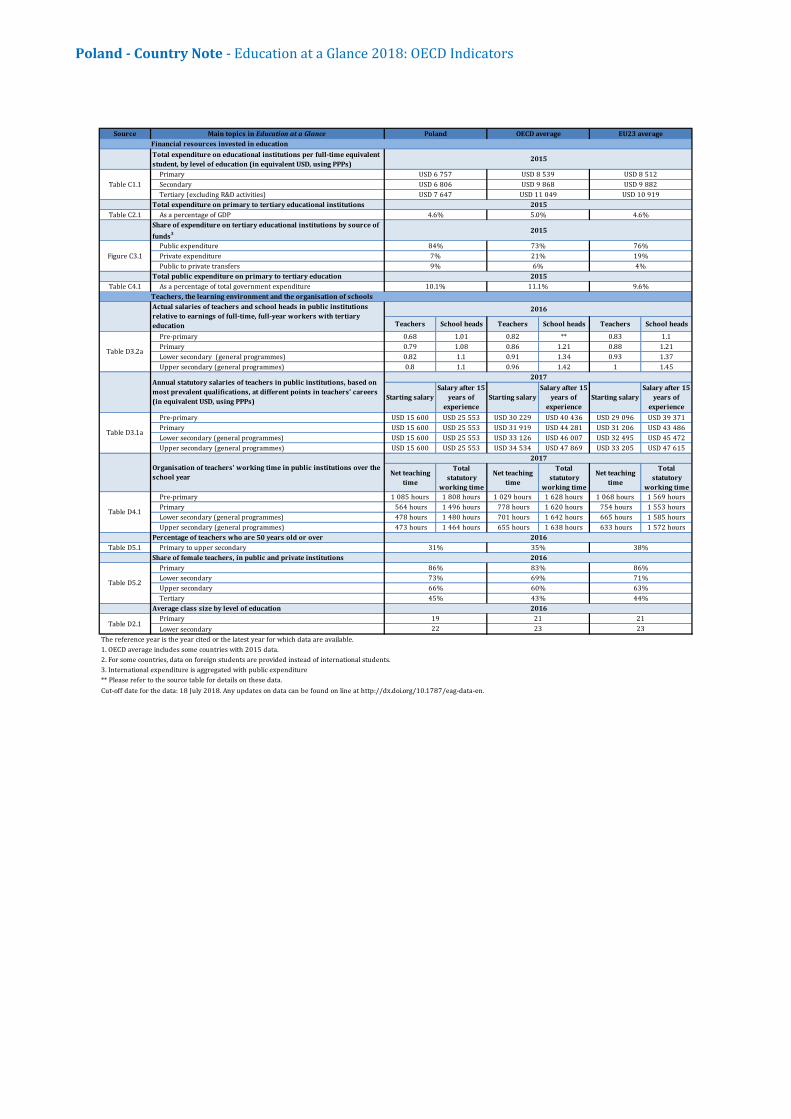
Source Main topics in Education at a Glance
Total expenditure on educational institutions per full-time equivalent
student, by level of education (in equivalent USD, using PPPs)
Primary
Secondary
Tertiary (excluding R&D activities)
Total expenditure on primary to tertiary educational institutions
Table C2.1 As a percentage of GDP
Share of expenditure on tertiary educational institutions by source of
funds3
Public expenditure
Private expenditure
Public to private transfers
Total public expenditure on primary to tertiary education
Table C4.1 As a percentage of total government expenditure
Teachers School heads Teachers School heads Teachers School heads
Pre-primary 0.68 1.01 0.82 ** 0.83 1.1
Primary 0.79 1.08 0.86 1.21 0.88 1.21
Lower secondary (general programmes) 0.82 1.1 0.91 1.34 0.93 1.37
Upper secondary (general programmes) 0.8 1.1 0.96 1.42 1 1.45
Starting salary
Salary after 15
years of
experience
Starting salary
Salary after 15
years of
experience
Starting salary
Salary after 15
years of
experience
Pre-primary USD 15 600 USD 25 553 USD 30 229 USD 40 436 USD 29 096 USD 39 371
Primary USD 15 600 USD 25 553 USD 31 919 USD 44 281 USD 31 206 USD 43 486
Lower secondary (general programmes) USD 15 600 USD 25 553 USD 33 126 USD 46 007 USD 32 495 USD 45 472
Upper secondary (general programmes) USD 15 600 USD 25 553 USD 34 534 USD 47 869 USD 33 205 USD 47 615
Net teaching
time
Total
statutory
working time
Net teaching
time
Total
statutory
working time
Net teaching
time
Total
statutory
working time
Pre-primary 1 085 hours 1 808 hours 1 029 hours 1 628 hours 1 068 hours 1 569 hours
Primary 564 hours 1 496 hours 778 hours 1 620 hours 754 hours 1 553 hours
Lower secondary (general programmes) 478 hours 1 480 hours 701 hours 1 642 hours 665 hours 1 585 hours
Upper secondary (general programmes) 473 hours 1 464 hours 655 hours 1 638 hours 633 hours 1 572 hours
Percentage of teachers who are 50 years old or over
Table D5.1 Primary to upper secondary
Share of female teachers, in public and private institutions
Primary
Lower secondary
Upper secondary
Tertiary
Average class size by level of education
Primary
Lower secondary
1. OECD average includes some countries with 2015 data.
2. For some countries, data on foreign students are provided instead of international students.
3. International expenditure is aggregated with public expenditure
Cut-off date for the data: 18 July 2018. Any updates on data can be found on line at http://dx.doi.org/10.1787/eag-data-en.
Table D4.1
Table D2.1
2016
23
45%
66% 60% 63%
22 23
43%
31% 35% 38%
44%
2016
2015
10.1%
7% 21% 19%
19 21 21
86% 83% 86%
73% 69% 71%
76%
OECD average EU23 average
2016
Table D5.2
9% 6%
USD 7 647 USD 11 049
Organisation of teachers' working time in public institutions over the
school year
4.6%
2017
Annual statutory salaries of teachers in public institutions, based on
most prevalent qualifications, at different points in teachers' careers
(in equivalent USD, using PPPs)
2017
Table D3.1a
Teachers, the learning environment and the organisation of schools
2016
Table D3.2a
2015
84% 73%
11.1% 9.6%
Actual salaries of teachers and school heads in public institutions
relative to earnings of full-time, full-year workers with tertiary
education
Figure C3.1
USD 8 512
Financial resources invested in education
Table C1.1
2015
USD 6 757
4%
USD 10 919
USD 9 882
5.0% 4.6%
2015
USD 8 539
USD 9 868USD 6 806
Poland
** Please refer to the source table for details on these data.
The reference year is the year cited or the latest year for which data are available.