point spread function engineering for iris recognition ...ashoka/papers/irispaper.pdfpoint spread...
TRANSCRIPT

Point spread function engineering for irisrecognition system design
Amit Ashok1,* and Mark A. Neifeld1,2
1Department of Electrical and Computer Engineering, University of Arizona, Tucson, Arizona, 85721 USA2College of Optical Sciences, University of Arizona, Tucson, Arizona, 85721 USA
*Corresponding author: [email protected]
Received 3 September 2009; revised 15 January 2010; accepted 22 January 2010;posted 26 January 2010 (Doc. ID 116358); published 19 February 2010
Undersampling in the detector array degrades the performance of iris-recognition imaging systems.We find that an undersampling of 8 × 8 reduces the iris-recognition performance by nearly a factor of4 (on CASIA iris database), as measured by the false rejection ratio (FRR) metric. We employ opticalpoint spread function (PSF) engineering via a Zernike phase mask in conjunction with multiple sub-pixel shifted image measurements (frames) to mitigate the effect of undersampling. A task-specificoptimization framework is used to engineer the optical PSFand optimize the postprocessing parametersto minimize the FRR. The optimized Zernike phase enhanced lens (ZPEL) imager design with oneframe yields an improvement of nearly 33% relative to a thin observation module by bounded optics(TOMBO) imager with one frame. With four frames the optimized ZPEL imager achieves a FRR equalto that of the conventional imager without undersampling. Further, the ZPEL imager design using16 frames yields a FRR that is actually 15% lower than that obtained with the conventional imager with-out undersampling. © 2010 Optical Society of America
OCIS codes: 110.1758, 100.3008, 070.5010, 100.4995.
1. Introduction
Many modern defense and security applications re-quire automatic recognition and verification servicesthat employ a variety of biometrics such as facial fea-tures, hand shape, voice, fingerprints, and iris. Theiris is the annular region between the pupil and outerwhite sclera of the eye. Iris-based recognition hasbeen gaining popularity in recent years, and it hasseveral advantages compared to other traditionalbiometrics such as fingerprints and facial features.The iris-texture pattern represents a high densityof information, and the resulting statistical unique-ness can yield false recognition rates as low as 1 in1010 [1–3]. Further, it has been found that the humaniris is stable over the lifetime of an individual and istherefore considered to be a reliable biometric [4].Iris-based recognition systems rely on capturing
the iris-texture pattern with a high-resolution imag-ing system. This places stringent demands onimaging optics and sensor design. Traditional high-resolution optical designs with small F=# result in asmall depth-of-field, which limits the usable volumewithin which a successful image capture is possible.Several researchers have explored phase-maskbased approaches to extend the depth-of-field of thehigh-resolution imaging systems employed for irisrecognition [5–8]. Another design challenge withsuch imaging systems is that the overall imaging re-solution can be limited by the undersampling in thedetector array, and the resulting distortion can se-verely degrade the iris-recognition performance.Therefore, overcoming the detector-induced under-sampling becomes a critical issue in design of aniris-recognition imaging system. In this paper, wewill focus on addressing the detector-limited resolu-tion in an iris-recognition imaging system design.
A natural approach to improve the imagingresolution beyond the detector limit, inspired by
0003-6935/10/100B26-14$15.00/0© 2010 Optical Society of America
B26 APPLIED OPTICS / Vol. 49, No. 10 / 1 April 2010
the Papoulis’s generalized sampling theorem [9], isto employ multiple subpixel shifted measure-ments within a TOMBO (thin observation moduleby bounded optics) imaging system architecture[10,11]. However, this approach does not exploitthe optical degrees of freedom available to the de-signer, and more importantly, it does not addressthe specific nature of the iris-recognition task. Re-searchers have exploited the optical degrees of free-dom to extend the depth-of-field of iris-recognitionsystems [5–8] as mentioned earlier, but we are notaware of any previous work that has examined un-dersampling in iris-recognition imaging systems spe-cifically from this point of view. In this paper, wepropose an approach that involves engineering theoptical point spread function (PSF) of the imagingsystem in conjunction with use of multiple subpixelshifted measurements. It is important to note thatthe goal of our approach is to maximize the iris-recognition performance and not to increase theoverall resolution of the imaging system directly. Toaccomplish this goal, we employ an optimizationframework to engineer the optical PSF and optimizethe postprocessing system parameters. The perfor-mance metric used within our optimization frame-work is false rejection ratio (FRR) for a given fixedfalse acceptance ratio (FAR) [12]. This task-specificmetric is key to our design method and representsthe design goal of maximizing the iris-recognitionperformance directly. The mechanism of modifyingthe optical PSF employs a phase mask in the aper-ture stop of the imaging system. This phase mask isdefined with Zernike polynomials, and the coeffi-cients of these polynomials serve as the optical de-sign parameters. The aforementioned optimizationframework is used to design imaging systems forvarious numbers of subpixel shifted measurements.The CASIA iris database [13] is used in the optimi-zation framework and also serves to quantify theperformance of the resulting optimized imaging sys-tem designs.
2. Imaging System Model
In this study, an iris-recognition imaging system iscomposed of three components: (1) the optical imag-ing system, (2) the reconstruction algorithm, and(3) the recognition algorithm. The optical imaging
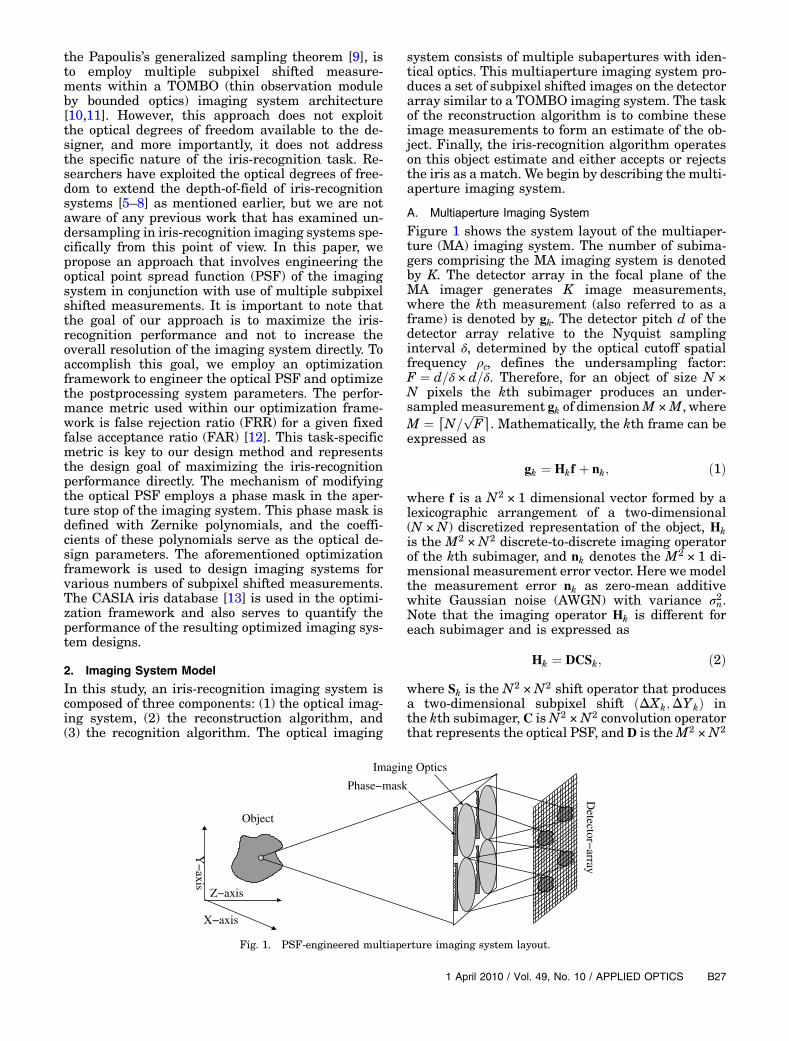
system consists of multiple subapertures with iden-tical optics. This multiaperture imaging system pro-duces a set of subpixel shifted images on the detectorarray similar to a TOMBO imaging system. The taskof the reconstruction algorithm is to combine theseimage measurements to form an estimate of the ob-ject. Finally, the iris-recognition algorithm operateson this object estimate and either accepts or rejectsthe iris as a match. We begin by describing the multi-aperture imaging system.
A. Multiaperture Imaging System
Figure 1 shows the system layout of the multiaper-ture (MA) imaging system. The number of subima-gers comprising the MA imaging system is denotedby K. The detector array in the focal plane of theMA imager generates K image measurements,where the kth measurement (also referred to as aframe) is denoted by gk. The detector pitch d of thedetector array relative to the Nyquist samplinginterval δ, determined by the optical cutoff spatialfrequency ρc, defines the undersampling factor:F ¼ d=δ × d=δ. Therefore, for an object of size N ×N pixels the kth subimager produces an under-sampledmeasurement gk of dimensionM ×M, whereM ¼ ⌈N=
ffiffiffiffiF
p⌉. Mathematically, the kth frame can be
expressed as
gk ¼ Hkf þ nk; ð1Þ
where f is a N2 × 1 dimensional vector formed by alexicographic arrangement of a two-dimensional(N ×N) discretized representation of the object, Hkis the M2 ×N2 discrete-to-discrete imaging operatorof the kth subimager, and nk denotes the M2 × 1 di-mensional measurement error vector. Here we modelthe measurement error nk as zero-mean additivewhite Gaussian noise (AWGN) with variance σ2n.Note that the imaging operator Hk is different foreach subimager and is expressed as
Hk ¼ DCSk; ð2Þ
where Sk is the N2 ×N2 shift operator that producesa two-dimensional subpixel shift ðΔXk;ΔYkÞ inthe kth subimager, C isN2 ×N2 convolution operatorthat represents the optical PSF, and D is theM2 ×N2
X−axis
Y−
axis
Z−axis
Object
Phase−mask
Imaging Optics
Detector−
array
Fig. 1. PSF-engineered multiaperture imaging system layout.
1 April 2010 / Vol. 49, No. 10 / APPLIED OPTICS B27

downsampling operator, which includes the effect ofspatial integration over the detector and the under-sampling caused by the detector array. Note that theconvolution operator C does not vary with kbecause the optics are assumed to be identical inall subimagers. By combining the K measure-ments we can form a composite measurement g ¼fg1g2…gKg that can be expressed in terms of the ob-ject vector f as follows:
g ¼ Hcf þ n; ð3Þwhere Hc ¼ fH1H2 � � �HKg is the composite imagingoperator of size KM2 ×N2 obtained by stacking theK imaging operators corresponding to each of theK subimagers and n is the composite noise vector de-fined as n ¼ fn1n2…nKg.As mentioned earlier, the optical PSF is engi-
neered by placing a phase mask in the aperture stopof each subimager. The pupil function tpupilðρ; θÞ ofeach subimager is expressed as [14]
tpupilðρ; θÞ ¼ tampðρÞ exp�j2πðnr − 1Þtphaseðρ; θÞ
λ
�; ð4Þ
where ρ and θ are the polar coordinates, nr is therefractive index of the phase mask, tampðρÞ ¼circ
�ρ=Dap
�is the circular pupil-amplitude function
(Dap denotes the aperture diameter), tphaseðρ; θÞ re-presents the pupil-phase function (i.e. phase-maskprofile), and λ is the wavelength. A Zernike polyno-mial of order P is used to define the pupil-phase func-tion as follows:
tphaseðρ; θÞ ¼XPi¼1
ai · Ziðρ; θÞ; ð5Þ
where ai is the coefficient of the ith Zernike polyno-mial denoted by Ziðρ; θÞ [15]. In this paper, we willuse Zernike polynomials with terms up to P ¼ 24.The resulting optical PSF hðρ; θÞ is expressed as [16]
hðρ; θÞ ¼ Ac
ðλf lÞ4����Tpupil
�−
ρλf l
; ����
2; ð6Þ
TpupilðωÞ ¼ F 2ftpupilðρ; θÞg; ð7Þ
where ω is the two-dimensional spatial frequencyvector, Ac is a normalization constant with unitsof area, f l is the back focal length, and F 2 de-notes the two-dimensional forward Fourier trans-form operator.A discrete representation of the optical PSF
hdðl;mÞ, required for defining the C operator, is ob-tained as follows:
hdðl;mÞ ¼Zd2
−d2
Zd2
−d2
hðx − ld; y −mdÞdxdyfðl;mÞ∶l
¼ −L…L;m ¼ −L…Lg; ð8Þ
where ð2Lþ 1Þ2 is the number of samples used torepresent the optical PSF. Note that a lexicographicordering of the hdðl;mÞ yields one row of C and allother rows are obtained by lexicographically order-ing the appropriately shifted version of this discreteoptical PSF.
B. Reconstruction Algorithm
The measurements from the K subimagers compris-ing the MA imaging system form the input to thereconstruction algorithm. We employ a reconstruc-tion algorithm based on the linear minimum meansquare error (LMMSE) criteria. The LMMSEmethodis essentially a generalized form of the Wiener filter,and it operates on the measurement in the spatialdomain without the assumption of shift invariance.Given the imaging model specified in Eq. (3) theLMMSE spatial operator W can be written as [17]
W ¼ RffHTc ðHcRffHT
c þ RnnÞ−1; ð9Þ
where Rff is the object autocorrelation matrix andRnn is the noise autocorrelation matrix. Here we as-sume that noise is zero-mean AWGN with varianceσ2n and therefore Rnn ¼ σ2nI. Note that for an object ofsizeN2 and measurement of size KM2, the size of theW matrix is N2 × KM2. For even a modest object sizeof 280 × 280, as is the case for the work reported here-in, computing the W matrix becomes intractable.Therefore, we adopt an alternate approach that doesnot rely on directly computing matrix inverses butinstead uses a conjugate-gradient method to com-pute the LMMSE solution iteratively. Before we de-scribe the iterative algorithm, we first need amethodto estimate the object autocorrelation matrix Rff .Note that the object of interest in the iris-recognitiontask is the iris itself. This suggests that the objectautocorrelation should only include the iris statis-tics; however, it is important to note that the iriscan only be located in the context of other local fea-tures such as outer sclera, eyelashes, and eyebrow.Therefore, we include all regions in the iris sampleimages for estimating the object autocorrelation ma-trix. A training set of 40 subjects with 4 iris samplesfor each subject, randomly selected from the CASIAiris database, yields a total of 160 iris object samples.Figure 2 shows example iris objects from the trainingdataset. The kth iris object yields the sample autocor-relation function rkff , which is used to estimate the ac-tual autocorrelation function as follows:
Rff ¼1
160
X160k¼1
rkff : ð10Þ
The corresponding estimated power spectral densitySff can be written as [18]
SffðρÞ ¼ F 2ðRffÞ: ð11Þ
B28 APPLIED OPTICS / Vol. 49, No. 10 / 1 April 2010

To obtain a smooth approximation, we use the follow-ing parametric function Sff to fit to the estimatedpower spectral density Sff [19,20]:
SffðρÞ ¼σ2f
ð1þ 2πμdρ2Þ32: ð12Þ
Note that because the iris is circular, we assume aradially symmetric power function Sff . A least squarefit to SffðρÞ yields a σf ¼ 43589 and μd ¼ 0:489. A ra-dial profile of the object power spectral density esti-mated from the training set along with parametric fitdefined in Eq. (12) are shown in Fig. 3.In general, a conjugate-gradient algorithm mini-
mizes the following form of quadratic objective func-tion Q [16]:
QðfÞ ¼ 12f tAf − btf: ð13Þ
For the LMMSE criteria, A ¼ HTc Hc þ σ2R−1
ff andb ¼ HT
c g. Within our iterative conjugate gradient-based algorithm we use a conjugate vector pj insteadof the gradient of the objective QðfÞ to achieve a fas-ter convergence to the LMMSE solution [21]. The(kþ 1)th update rule can be expressed as [16]
fkþ1 ¼ fk þ αkpk; ð14Þ
αk ¼ −ptk∇Qk
dk; ð15Þ
where ∇Qk denotes the gradient of objective func-tion Qk evaluated at the kth step and pk is conjugateto all previous pj, j < k (i.e., ptjApk ¼ djδjk), δjk is theKronecker-delta function, and dk is the ∥ · ∥2 norm ofthe pk vector. The stopping criteria is specified to be
when the residual vector rk ¼ ∇Qk ¼ Afk − b changesless than β% over the last iteration(i.e., ðrk−1 − rkÞ=rk−1 ≤ β=100).C. Iris-Recognition Algorithm
The object estimate obtained with the reconstructionalgorithm is processed by the iris-recognition algo-rithm to make the final decision. There are threemain processing steps that form the basis of theiris-recognition algorithm. The first step involves asegmentation algorithm that extracts the iris, pupil,and eyelid regions from the reconstructed object.The segmentation algorithm used in this paper isadapted from Ref. [22] with the addition of eyelidboundary detection. The output of the segmentationalgorithm yields an estimate of the center and radiusof the circular pupil and iris regions and also theboundaries of the upper and lower eyelids in theobject. Figure 4(a) shows an example iris image thatwas processed with the segmentation algorithm. Thepupil and iris regions are outlined by circularboundaries, and the upper/lower eyelid edges are re-presented by the elliptical boundaries. This informa-tion is used to generate a mask Mðx; yÞ that extractsthe annular region between iris and pupil boundariesthat contains only the unobscured iris-texture re-gion. An example of the masked iris region is shownin Fig. 4(b). The extracted iris-texture region is theinput to the next processing step. Given the centerand radius of the pupil and the iris regions, theannular iris-texture region is unwrapped into a rec-tangular area aðρ; θÞ using Daugman’s homogenousrubber sheet model [23]. The size of the rectangularregion is specified as Lρ × Lθ with Lρ rows along theradial direction and Lθ columns along the angulardirection. Figure 4(c) shows an example of an un-wrapped rectangular region with Lρ ¼ 36 and Lθ ¼224. In the next step, a complex log-scale Gabor filteris applied to each row to extract the phase of the un-derlying iris-texture pattern. The complex log-scaleGabor filter spectrum GlogðρÞ is defined as [24]
Fig. 2. Iris examples from the training dataset.
0 0.1 0.2 0.3 0.4 0.5 0.6 0.7 0.8 0.9 13
4
5
6
7
8
9
10
Normalized radial spatial frequency
Log
pow
er s
pect
ral d
ensi
ty [d
B]
Training data estimateModel least−square fit
Fig. 3. (Color online) Model fit and training estimate of the objectpower spectral density: a radial profile.
1 April 2010 / Vol. 49, No. 10 / APPLIED OPTICS B29

GlogðρÞ ¼ exp
0@−
log�
ρρo
�
2 log�σgρo
�1CA; ð16Þ
where ρo is the center frequency of the filter and σgspecifies its bandwidth. Note that this filter is onlyapplied along the angular direction, which corre-sponds to pixels along the circumference of a circlein the original object. The angular direction is chosenover the radial direction because the maximumtexture variation occurs along this direction [22].The phase of the complex output of each Gabor filteris then quantized into four quadrants using two bits.The four-level quantized phase is coded using a Greycode so that the difference between any two adjacentquadrants is one bit. This Grey coding scheme en-sures that any misalignment between two similariris codes results in a minimum of errors. The quan-
tized phase results in a binary pattern, shown inFig. 4(d), which is referred to as an “iris code.”
In the final step, the iris-recognition task is per-formed based on the iris code obtained from the testobject. To determine whether the given iris code de-noted by tcode matches any iris code in the database ascore is computed. The score denoted by sðtcodeÞ is de-fined as
sðtcodeÞ ¼mink;i dhdðtcodeckmask;RiðrkcodeÞckmaskÞ; ð17Þ
where rkcode is the kth reference iris code in the data-base, ckmask is a mask that represents the unobscuredbits common among the test and the reference iriscodes, Ri is a shift operator which performs an i-pixelcircular shift along the angular direction, and dhd isthe Hamming distance operator. All shifts in therange fi∶ −O…þOg are considered, where O de-notes the maximum shift. The dhd operator is definedas follows:
Fig. 4. Examples of (a) iris segmentation, (b) masked iris texture region, (c) unwrapped iris, and (d) iris code.
B30 APPLIED OPTICS / Vol. 49, No. 10 / 1 April 2010

dhdðtcodecmask; rcodecmaskÞ ¼Pðtcodecmask⊕rcodecmaskÞ
W;
ð18Þwhere W is the weight (i.e., number of all 1’s) of themask cmask, and the ⊕ symbol denotes the XOR op-eration. The normalized Hamming distance score de-fined in Eq. (18) is computed over all iris codes in thedatabase. The iris code is shifted to account for anyrotation of the iris in the object. Finally, the followingdecision rule is applied to the minimum iris scoresðtcodeÞ:
sðtcodeÞ ≶H0
H1
THD; ð19Þ
which translates to: accept the null hypothesis H0 ifthe score is less than threshold THD; otherwise ac-cept the alternative hypothesis H1. The null hypoth-esis H0 is that the test iris code is a match, and thealternate hypothesis H1 indicates that no matchwas found. The threshold THD determines the perfor-mance of the iris-recognition system as summarizedby the FRR and FAR statistics. Note that for a fixedFAR the THD value is chosen so as to minimize theFRR statistics, and therefore THD cannot be con-sidered a free parameter in the iris-recognitionalgorithm.
3. Optimization Framework
The goal of our optimization framework is to enablethe design of an iris-recognition system that mini-mizes FRR for a fixed FAR in the presence of under-sampling. Figure 5 illustrates the definitions of FRRand FAR in the context of intraclass distance andinterclass distance probability densities. The intra-class distance refers to the set of distances betweeniris codes of the same subject, whereas the interclass
distance refers to the set of distances between iriscodes of different subjects. The rationale behind thischoice of performance metric is that the cost/risk ofnot recognizing an iris that is actually enrolled (de-fined as false rejection error, which is a type II error)in the database is far greater than the cost/risk of re-cognizing an iris as a match when it is not enrolled inthe database (defined as false acceptance error, atype I error) in a “search” type security application.In these applications the main task is to identifycertain subject(s) in a general population. Note thatthe FRR and FAR errors cannot be reduced simulta-neously. In this study we set FAR to 0.001. We recog-nize that this specific FAR value may not representan optimal choice for an actual system implementa-tion, however; here it only serves as a representativevalue in our optimization framework.
In the MA imaging system the coefficients of theZernike polynomials, which describe the pupil-phasefunction, represent the optical design parameters.The parameters of the reconstruction algorithm (β)and the iris-recognition algorithm ðρo; σg;Lρ;Lθ;OÞcomprise the degrees of freedom available in the com-putational domain. Ideally, a joint optimization ofthe optical and the postprocessing parameters wouldyield the maximum iris-recognition performance.However, the resulting optimization process becomescomputationally intractable due to the high com-putational complexity of evaluating the objectivefunction coupled with the large number of designvariables. To understand the computational com-plexity of the objective function itself, consider thatits computation involves the estimation of the intra-class and interclass iris distance probability den-sities. This requires computing iris codes from a largeset of reconstructed iris objects and comparing themto the reference iris database. In this paper, we usea training dataset with 160 iris object samples,
0.05 0.10 0.15 0.20 0.25 0.30 0.35 0.40 0.45 0.50 0.550
0.05
0.10
0.15
0.20
0.25
0.30
0.35
0.40
Normalized Hamming Distance (HD)
Pro
babi
lity
dens
ity
Inter−class probability density
Intra−class probability density
FARFRR
THD
Fig. 5. (Color online) Illustration of FRR and FAR definitions in the context of intraclass and interclass probability densities.
1 April 2010 / Vol. 49, No. 10 / APPLIED OPTICS B31

described in Subsection 2.B. In order to generate astatistically reliable estimate of the interclass andintraclass distance probability densities, we needto generate a large set of iris-code samples. This isachieved by simulating an iris object for 10 randomnoise realizations yielding as many iris codes foreach iris object. Thus, a single evaluation of the ob-jective function effectively results in simulation of1600 iris objects through the imaging system.In our optimization framework, we adopt an alter-
native approach that reduces the computationalcomplexity by splitting the optimization into two se-parate steps. Note that the iris-recognition algorithmparameters are inherently a function of the iris-texture statistics and are not strongly dependenton the optics. For example, the center frequency andthe bandwidth of the log Gabor filter are tuned tothe spatial frequency distribution of the iris-texturethat contains the most discriminating information.Further, the parameters Lρ and Lθ are dependenton the correlation length of the iris texture along ra-dial and angular directions respectively. This obser-vation allows us to separate the optimization ofthe iris-recognition algorithm parameters from theoptimization of the optics and the reconstructionalgorithm. Therefore, the first optimization step in-volves optimizing the iris-recognition algorithmparameters to minimize the FRR. For this step, thedetector pitch is chosen such that there is no under-sampling and there is no phase mask within theimaging optics. The optimization is performed witha coarse-to-fine search method using the iris objectsfrom the training dataset. It is found that Lρ ¼ 36,Lθ ¼ 224, ρo ¼ 1=18, and σg ¼ 0:4 yield the optimalperformance. The number of left and right shifts re-quired to achieve optimal performance is found to beO ¼ 8 in each direction. The second optimization stepinvolves the optimization of optical and reconstruc-tion algorithm parameters, which has significantlyreduced computational complexity as a result of few-er number of design variables involved. The opticalsystem parameters include the P coefficients of theZernike polynomials. The reconstruction algorithmparameter β, associated with the stopping con-dition in the iterative conjugate-gradient algorithm,is the only postprocessing design variable used inthis optimization step. Note that the value of iris-recognition algorithm parameters remain fixed dur-ing this optimization step.Our optimization framework employs a simulated
tunneling algorithm, a global optimization tech-nique [25], to perform the second optimization step.
Table 1. Imaging System Performance (FRR) for K ¼ 1, K ¼ 4, K ¼ 9, and K ¼ 16 on Training Dataset
Undersampling Frames TOMBO Defocus TOMBO ZPEL
F ¼ 1 × 1 Conventional imager 0.133F ¼ 8 × 8 K ¼ 1 0.458 0.360 (21.4%) 0.295 (35.6%)F ¼ 8 × 8 K ¼ 4 0.153 0.139 (9.2%) 0.128 (16.3%)F ¼ 8 × 8 K ¼ 9 0.140 0.136 (2.9%) 0.117 (16.4%)F ¼ 8 × 8 K ¼ 16 0.135 0.142 (−5:2%) 0.113 (16.3%)
Fig. 6. (Color online) OptimizedZPELimagerwithK ¼ 1 (a) pupilphase, (b) optical PSF, and (c) optical PSF of the TOMBO imager.
B32 APPLIED OPTICS / Vol. 49, No. 10 / 1 April 2010

Simulated tunneling optimization, based on the wellknown simulated annealing global optimizationtechnique, modifies the local energy surface to allow“tunneling” through local objective function extremaakin to physical phenomenon of quantum tunneling,thereby accelerating the optimization process. Theglobal optimization algorithm is implemented in amessage passing interface (MPI) based environment[26] that allows it to run on multiple processors inparallel, thereby significantly decreasing the com-putation time required for each iteration. Thesimulated tunneling algorithm is run for suffi-cient iterations until a convergence is achieved (weobserve that empirically 4000 to 5000 iterationsare usually sufficient to achieve convergence). Multi-ple runs of the optimization algorithm with randominitialization yielded similar results, giving us confi-dence that the optimization results are global.This optimization framework is used to design
imaging systems with an undersampling factor ofF ¼ 8 × 8, employing K ¼ 1, K ¼ 4, K ¼ 9, and K ¼16 frames. The subpixel shifts for K frames is
chosen as multiples of Δ ¼ d=ffiffiffiffiK
palong each direc-
tion, where d is the detector pitch/size [27,28].For example, for K ¼ 4 the subpixel shifts are�ðΔX ;ΔYÞ∶ð0; 0Þ;
�d=2; 0
�;�0;d=2
�;�d=2;d=2
��.
The noise variance σ2n is set so that the measurementsignal to noise ratio (SNR) is equal to 56dB for theundersampled imager with K ¼ 1. Henceforth, anoptimized PSFengineered imaging system will be re-ferred to as the Zernike phase-enhanced lens (ZPEL)imaging system. In Section 4, we discuss theperformance of the optimized ZPEL imager and com-pare it the corresponding TOMBO imaging systememploying the same number of frames. Note thatwhile the TOMBO imaging system does not usePSF engineering (instead it uses conventional imag-ing optics), the reconstruction algorithm parameter βis still optimized to achieve the minimum FRR.
4. Results and Discussion
As mentioned earlier, undersampling in the de-tector array degrades the performance of the iris-recognition imaging system. Specifically we find thatan undersampling factor of F ¼ 8 × 8 yields a FRR ¼0:458 as compared to FRR ¼ 0:133 without under-sampling in the conventional imaging system. Thisrepresents a significant reduction in performanceand highlights the need to mitigate the effect ofundersampling. Increasing the number of subpixelshifted frames from K ¼ 1 to K ¼ 16 improves theperformance of the TOMBO imaging system, as evi-dent from the FRR data shown in Table 1. To ensurea fair comparison among imaging systems with vari-ous numbers of frames, we enforce a total photonconstraint. This constraint implies that the totalnumber of photons available to each imager (i.e.,summed over all frames) is fixed. Therefore, for an
−1 −0.9 −0.8 −0.7 −0.6 −0.5 −0.4 −0.3 −0.2 −0.1 0 0.1 0.2 0.3 0.4 0.5 0.6 0.7 0.8 0.9 1
0.1
0.2
0.3
0.4
0.5
0.6
0.7
0.8
0.9
1
Spatial frequency
Mod
ulat
ion
ZPEL: X−directionZPEL: Y−direction
ZPEL: θ=135o direction
ZPEL: θ=45o directionTOMBO Defocus TOMBO
Fig. 7. (Color online) Cross-section MTF profiles of optimized ZPEL imager with K ¼ 1.
Table 2. TOMBO Imaging SystemPerformance (FRR) with Defocus and K ¼ 1
on Training Dataset
Defocus FRR
Wd ¼ 1 0.446Wd ¼ 2 0.437Wd ¼ 3 0.432Wd ¼ 4 0.401Wd ¼ 5 0.396Wd ¼ 6 0.382Wd ¼ 7 0.360Wd ¼ 8 0.363Wd ¼ 9 0.492
1 April 2010 / Vol. 49, No. 10 / APPLIED OPTICS B33

imaging system using K frames the measurementnoise variance must be scaled by a factor of K. Forexample, the measurement noise variance in an ima-ging system with K ¼ 4 frames is set to σ2K ¼ 4σ2n,where σ2n is the measurement noise variance ofthe imaging system with K ¼ 1. Subject to thisconstraint, we expect that a ZPEL imaging systemdesigned within the proposed optimization frame-work would improve upon the performance of theTOMBO imaging system.We begin by examining the result of optimizing the
ZPEL imaging system with K ¼ 1. Figure 6(a) showsthe optimized Zernike phase mask, and Fig. 6(b)shows the corresponding optical PSF of the ZPEL im-ager. For the purpose of comparison, Fig. 6(c) showsthe optical PSF of the TOMBO imager. The phasemask spans over the extent of the aperture stop,where 0.5 corresponds to the radius
�Dap=2
�of the
aperture. The optical PSF is plotted on a normalizedscale of ½−1; 1�, where 1 corresponds to the detectorsize d that results in the F ¼ 8 × 8 undersampling.Note that the large spatial extent of the PSF relativeto that of a TOMBO imaging system suggests thathigh spatial frequencies in the corresponding modu-lation transfer function (MTF) would be suppressed.Figure 7 shows plots of various cross sections of thetwo-dimensional MTF for the ZPEL and TOMBO im-agers. Here the spatial frequency is plotted on thenormalized scale of ½0; 1�, where 1 corresponds tothe optical cutoff frequency ρc. Observe that theZPEL MTF reduces rapidly with increasing spatialfrequency. This can be understood as the optimiza-tion process suppressing the MTFat the high spatialfrequencies to reduce the effect of aliasing. However,notice that the nonzero MTF at midspatial fre-quencies still allows the reconstruction algorithmto potentially recover some information in this regionthat is relevant to the iris-recognition task. Giventhese observations, it is compelling to consider thepossibility that by simply defocusing the imaging
optics of a TOMBO imager by the correct amount,a similar MTF and therefore a similar performancemight be obtained. This is indeed the case, althoughonly to a limited extent, as evident from the FRRdata shown in Table 2. These data are obtained bycomputing the TOMBO imager performance atvarious values of defocus, denoted by the defocusparameter Wd (this defocus parameter is directlyproportional to the coefficient of the third elementof the Zernike polynomial expansion [15]). The opti-mal value of defocus parameter gives the minimumFRR value. In this case, the optimal defocus para-meter value of Wd ¼ 7:0 yields a FRR ¼ 0:360. Thisrepresents an improvement of 21.4% over the TOM-BO imager performance. However, the ZPEL ima-ging system with a FRR ¼ 0:295 represents anadditional improvement of 18% over the optimal de-focus TOMBO imaging system’s performance and animprovement of 35.6% relative to the TOMBO ima-ging system. This performance difference betweenthe optimal defocus TOMBO imager and the ZPELimager can be understood by closely examining theirMTFs as shown in Fig. 7. Note that unlike theMTFofthe ZPEL imaging system, the defocus TOMBO ima-ging system’s MTF has several nulls and near zeromodulation at high-spatial frequencies. From thisobservation we may infer that, while it is importantto selectively lower the MTF at high-spatial frequen-cies to minimize the effect of aliasing, it is also impor-tant to minimize the nulls in the optimized MTF thatlead to information loss.
For the imaging system utilizing K ¼ 4 frames, theoptimized ZPEL imager yields a FRR ¼ 0:128 that is16.3% lower than FRR ¼ 0:153 of the TOMBO imag-ing system. Figures 8(a) and 8(b) show the phasemask and the optical PSF of this optimized ZPELimager, respectively. Note that the optical PSF hasa smaller extent compared to that for K ¼ 1. Theuse of four frames as opposed to one frame reducesthe effective undersampling by a factor of 2 in each
Fig. 8. (Color online) Optimized ZPEL imager with K ¼ 4: (a) pupil phase and (b) optical PSF.
B34 APPLIED OPTICS / Vol. 49, No. 10 / 1 April 2010

direction. Thus we expect as a result, the MTF in thiscase is higher especially in the midspatial frequen-cies compared to the MTF of the ZPEL imager withK ¼ 1. This is confirmed by the plot of the ZPELMTFin Fig. 9. It is also interesting to note that while theoptimal defocus TOMBO imager design (Wd ¼ 4) isable to achieve a FRR ¼ 0:139, an improvement of9.1% over the FRR of a TOMBO imager, it still sig-nificantly worse (the FRR improvement is lower bynearly a factor of 2) than the optimized ZPEL imagerdesign. Another important observation is that theFRR ¼ 0:128 achieved by the optimized ZPEL ima-ger is actually lower than FRR ¼ 0:133 of the conven-tional imaging system without any undersampling.This clearly highlights the effectiveness of the opti-mization framework used for ZPEL imager designs,
which not only overcomes the performance degrada-tions introduced by detector undersampling but alsosuccessfully incorporates the object statistics rele-vant to the iris-recognition task to enhance the per-formance beyond that of the conventional imager.
Figures 10(a) and 10(b) show the Zernike phasemask and the optical PSF of the optimized ZPEL im-ager withK ¼ 9. The ZPEL imager achieves a FRR ¼0:117 compared to FRR ¼ 0:140 for the TOMBO ima-ging system, an improvement of 16.4%. The MTF ofthis imaging system is shown in Fig. 11. The optimaldefocus TOMBO imager design (Wd ¼ 0:75) is onlyable to achieve a marginal improvement of 2.9% withan FRR ¼ 0:136 relative to the TOMBO imagingsystem design. The optimized ZPEL imager withK ¼ 16 frames reduces it further to FRR ¼ 0:113,
−1 −0.9 −0.8 −0.7 −0.6 −0.5 −0.4 −0.3 −0.2 −0.1 0 0.1 0.2 0.3 0.4 0.5 0.6 0.7 0.8 0.9 10
0.1
0.2
0.3
0.4
0.5
0.6
0.7
0.8
0.9
1.0
Spatial frequency
Mod
ulat
ion
ZPEL: X−directionZPEL: Y−direction
ZPEL: θ=45o direction
ZPEL: θ=135o directionTOMBODefocus TOMBO
Fig. 9. (Color online) Cross-section MTF profiles of optimized ZPEL imager with K ¼ 4.
Fig. 10. (Color online) Optimized ZPEL imager with K ¼ 9: (a) pupil phase and (b) optical PSF.
1 April 2010 / Vol. 49, No. 10 / APPLIED OPTICS B35

an improvement of 16.3% over FRR ¼ 0:135 of theTOMBO imaging system with the same number offrames. The Zernike phase mask, the optical PSF,and the MTF of this ZPEL imager are shown inFigs. 12(a), 12(b), and 13, respectively. In this casethe optimal defocus TOMBO imager has a FRR ¼0:142, which is actually slightly worse than theTOMBO imager with FRR ¼ 0:138. This shows thatthe MTFs obtained by defocusing (i.e., quadraticphase masks), do not always improve the iris-recog-nition performance in undersampled imagers. This ismainly due to the reduced optical degrees of freedomoffered by defocusing (only one degree of freedom isavailable: WD).It is interesting to consider that compared to the
optimized ZPEL imager design with K ¼ 9, the de-sign with K ¼ 16 yields a small improvement of only
3.4%. The same is true for the TOMBO imaging sys-tem where the performance improves by only 3.6%from K ¼ 9 to K ¼ 16. In fact, the iris-recognitionperformance achieved by the TOMBO imaging sys-tem with K ¼ 16 nearly equals that of the conven-tional imaging system without undersampling, i.e.,F ¼ 1. This suggests that adding more frames be-yond K ¼ 16 would not significantly improve theiris-recognition performance, which may first seemcounterintuitive. However, recall that increasingthe number of frames K also increases the measure-ment noise variance σ2K as a result of the fixed totalphoton count constraint, while reducing the effect ofaliasing at the same time. Therefore, the resultingtrade-off between these two competing processesleads to diminishing improvement in iris-recognitionperformance with increasing number of frames. As a
−1 −0.9 −0.8 −0.7 −0.6 −0.5 −0.4 −0.3 −0.2 −0.1 0 0.1 0.2 0.3 0.4 0.5 0.6 0.7 0.8 0.9 10
0.1
0.2
0.3
0.4
0.5
0.6
0.7
0.8
0.9
1.0
Spatial frequency
Mod
ulat
ion
ZPEL: X−directionZPEL: Y−direction
ZPEL: θ=45o direction
ZPEL: θ=135o directionTOMBODefocus TOMBO
Fig. 11. (Color online) Cross-section MTF profiles of optimized ZPEL imager with K ¼ 9.
Fig. 12. (Color online) Optimized ZPEL imager with K ¼ 16: (a) pupil phase and (b) optical PSF.
B36 APPLIED OPTICS / Vol. 49, No. 10 / 1 April 2010

result, at K ¼ 16 the effect of increasing measure-ment noise nearly counters the reduction in aliasingfrom the multiple frames, resulting in only a smallimprovement in FRR for both the ZPEL and theTOMBO imaging systems.So far we have observed that the optimized ZPEL
imager offers a substantial improvement in iris-recognition performance over a TOMBO imaging sys-tem with an undersampling detector array. However,these results were obtained using the trainingdataset, the same dataset that was used in the opti-mization process. In order to estimate the actual per-formance of the optimized ZPEL imaging systemindependent of the training dataset, we need touse a validation dataset. Here we construct a valida-tion dataset consisting of 44 distinct iris subjectswith seven samples of each iris, randomly selectedfrom the CASIA database, resulting in a total of308 iris samples. Figure 14 shows example iris ob-jects from this validation dataset. Note that noneof the iris samples in the validation dataset appearin the training dataset. We use a total of 30 noise rea-lizations for each iris object to estimate the FRR fromthe intraclass and interclass densities. The FRR datafor the validation dataset is shown in Table 3. Theoptimized ZPEL imager with K ¼ 1 yields a FRR ¼0:138 on the validation dataset as compared toFRR ¼ 0:164 for the TOMBO imaging system. Thisrepresents a performance improvement of 15.9%over the TOMBO imaging system, which is nearlyhalf of the 32.7% improvement that was obtainedwith the training dataset. This difference in perfor-mance can be explained by considering the fact thatthe optimization process does not distinguish be-tween the effect of undersampling and the statisticsof the particular iris samples comprising the trainingdataset. As a result, the imaging system is opti-
mized jointly toward mitigating the effect of under-sampling and adapting to the statistics of the irissamples in the training dataset so as to minimizethe FRR metric. Note that the difference betweenthe performance on training and validation datasetwill reduce as the size of the training dataset is in-creased, and it becomes more representative of trueiris statistics of the underlying dataset.
In case of K ¼ 4, the ZPEL imager achieves aFRR ¼ 0:0513, which is an improvement of 19.4%over FRR ¼ 0:0637 of the TOMBO imaging system.Note in this case, the improvement obtained withthe validation dataset exceeds that obtained with
−1 −0.9 −0.8 −0.7 −0.6 −0.5 −0.4 −0.3 −0.2 −0.1 0 0.1 0.2 0.3 0.4 0.5 0.6 0.7 0.8 0.9 10
0.1
0.2
0.3
0.4
0.5
0.6
0.7
0.8
0.9
1.0
Spatial frequency
Mod
ulat
ion
ZPEL: X−directionZPEL: Y−direction
ZPEL: θ=45o direction
ZPEL: θ=135o directionTOMBODefocus TOMBO
Fig. 13. (Color online) Cross-section MTF profiles of optimized ZPEL imager with K ¼ 16.
Fig. 14. Iris examples from the validation dataset.
1 April 2010 / Vol. 49, No. 10 / APPLIED OPTICS B37

the training dataset. With K ¼ 9 the optimizedZPEL imager yields a FRR ¼ 0:0444 compared toFRR ¼ 0:0558 of the TOMBO imaging system. Thisrepresents an improvement of 21.6%, which is bet-ter than 16.4% improvement obtained on the trainingdataset. For K ¼ 16 frames the optimized ZPEL im-ager results in FRR ¼ 0:0534, a 21.0% reduction fromFRR ¼ 0:0440 of the TOMBO imaging system withthe same number of frames. Note that the FRR ofboth the optimized ZPEL imager and the TOMBO im-aging system do not reduce significantly from K ¼ 9frames to K ¼ 16 frames. This is due to the same un-derlying trade-off between increasing measurementdata and increasing measurement noise, which wasobserved in the case of the training dataset.
5. Conclusions
We have studied the degradation in iris-recognitionperformance resulting from an undersampling factorof F ¼ 8 × 8 (for the CASIA iris database) and foundthat in a conventional imager, it yields a FRR ¼0:458 compared to a FRR ¼ 0:133 when there is noundersampling. We describe an optimization frame-work that exploits the optical and postprocessing de-grees of freedom to maximize the iris-recognitionperformance in such undersampled imagers. The re-sulting ZPEL imager design uses an engineered op-tical PSF together with multiple subpixel shiftedmeasurements to achieve the performance improve-ment. The ZPEL imager is designed forK ¼ 1, K ¼ 4,K ¼ 9, andK ¼ 16 number of frames. On the trainingdataset, the optimized ZPEL imager achieved perfor-mance improvement of nearly 33% for K ¼ 1 com-pared to the TOMBO imaging system with the samenumber of frames. With K ¼ 4 frames the ZPEL im-ager design achieved a FRR that is nearly equal tothat of a conventional imager without any undersam-pling. The effectiveness of the optimization frame-work was also highlighted by the ZPEL imagerdesign with K ¼ 16 that achieved a FRR ¼ 0:113,which is actually 15% better than FRR ¼ 0:133 of theconventional imager without any undersampling.The comparison of the ZPEL imager and the TOMBOimaging system performance using a validation da-taset provided further support for the performanceimprovements obtained on the training dataset. Onthe validation dataset, the ZPEL imager design re-quired only K ¼ 4 frames as opposed to K ¼ 16frames needed by the TOMBO imaging system toequal the performance without undersampling. Si-milarly, with K ¼ 16 frames the optimized ZPELimager obtained a 21.0% performance improve-
ment over the conventional imaging system withoutany undersampling. These results demonstrate thepower of the task-specific design approach for max-imizing the performance of iris-recognition imagingsystems in presence of severe detector undersam-pling. We expect that a good implementation of theZPEL imager designs would yield an iris-recognitionperformance close to that predicted by our simula-tion study. However, as with any physical system im-plementation, the as fabricated system parameterstend to deviate from their ideal design values. For ex-ample, in simulation we assumed ideal uniform sub-pixel shifts for each frame; however, in a systemimplementation the actual subpixel shifts achievedwould deviate from these ideal values, leading tosome degradation in system performance. This issuecan be addressed to an extent by carefully estimatingthe subpixel shifts by using calibration targets andemploying these estimate in the iris reconstructionalgorithm. In fact, given the various optomechanicalfabrication tolerances, a sensitivity and toleranceanalysis of the ZPEL imager design can indicatethe expected performance of a fabricated system.However, we consider such an detailed analysis asbeyond the scope of this study.
Here we considered a security application that op-erates in “search mode”; however, most security ap-plications operate in “verification” mode and requireminimizing FAR while keeping FRR fixed. The opti-mization framework used in our study can be easilyapplied for designing iris-recognition systems forsuch traditional security applications that minimizeFAR metric instead. Recall that the segmented opti-mization approach used in our study does not jointlyoptimize the optical and postprocessing degrees offreedom, and therefore we expect that there is poten-tial for further performance improvement via a joint-optimization approach [29]. This is a direction offuture research that we would like to pursue. Also,the optical parametrization used here assumed thatall the subapertures had identical optics; by relaxingthis constraint, additional optical diversity can beused to further improve the iris-recognition perfor-mance.Wewould like to quantify such improvementsvia optical diversity in a future study.
We gratefully acknowledge the financial supportof the Defense Advanced Research Projects Agency(DARPA) MONTAGE program. We would also liketo thank Dr. Joe van der Gracht for engaging dis-cussions on the subject of undersampling in iris-recognition systems.
References1. J. G. Daugman, “High confidence visual recognition of persons
by a test of statistical independence,” IEEE Trans. PatternAnal. Mach. Intell. 15, 1148–1161 (1993).
2. J. G. Daugman, “The importance of being random: statisticalprinciples of iris recognition,” Pattern Recogn. 36, 279–291(2003).
3. J. G. Daugman, “How iris recognition works,” IEEE Trans.Circ. Syst. Video Tech. 14, 21–30 (2004).
Table 3. Imaging System Performance (FRR) for K ¼ 1, K ¼ 4, K ¼ 9,and K ¼ 16 on Validation Dataset
Undersampling Frames TOMBO ZPEL
F ¼ 1 × 1 Conventional imager 0.0543F ¼ 8 × 8 K ¼ 1 0.1642 0.1383 (15.8%)F ¼ 8 × 8 K ¼ 4 0.0637 0.0513 (19.5%)F ¼ 8 × 8 K ¼ 9 0.0558 0.0444 (20.4%)F ¼ 8 × 8 K ¼ 16 0.0534 0.0440 (17.6%)
B38 APPLIED OPTICS / Vol. 49, No. 10 / 1 April 2010

4. R. Barnard, V. P. Pauca, T. C. Torgersen, R. J. Plemmons,S. Prasad, J. van der Gracht, J. Nagy, J. Chung, G. Behrmann,S. Mathews, andM. Mirotznik, “High-resolution iris image re-construction from low-resolution imagery,” Proc. SPIE 6313,63130D (2006).
5. R. Narayanswamy, P. E. X. Silveira, H. Setty, V. P. Pauca, andJ. van der Gracht, “Extended depth-of-field iris recognitionsystem for a workstation environment,” Proc. SPIE 5779,41–50 (2005).
6. R. Narayanswamy, G. E. Johnson, P. E. X. Silveira, andH. B. Wach, “Extending the imaging volume for biometric irisrecognition,” Appl. Opt. 44, 701–712 (2005).
7. D. S. Barwick, “Increasing the information acquisitionvolume in iris recognition systems,” Appl. Opt. 47, 4684–4691(2008).
8. V. P. Pauca, D. Chen, J. van der Gracht, R. J. Plemmons,S. Prasad, and T. C. Torgersen, “Pupil phase encoding formulti-aperture imaging,” Proc. SPIE 7074, 70740D (2008).
9. A. Papoulis, “Generalized sampling expansion,” IEEE Trans.Circuits Syst. 24, 652–654 (1977).
10. J. Tanida, T. Kumagai, K. Yamada, S. Miyatake, K. Ishida,T. Morimoto, N. Kondou, D. Miyazaki, and Y. Ichioka, “Thinobservation module by bound optics (TOMBO): concept andexperimental verification,” Appl. Opt. 40, 1806–1813 (2001).
11. Y. Kitamura, R. Shogenji, K. Yamada, S. Miyatake,M. Miyamoto, T. Morimoto, Y. Masaki, N. Kondou,D. Miyazaki, J. Tanida, and Y. Ichioka, “Reconstruction of ahigh-resolution image on a compound-eye image-capturingsystem,” Appl. Opt. 43, 1719–1727 (2004).
12. S. Kay, Fundamentals of Statistical Signal Processing:Detection Theory (Prentice-Hall, 1993).
13. CASIA-IrisV1 database, http://www.cbsr.ia.ac.cn/IrisDatabase.htm.
14. J. W. Goodman, Introduction to Fourier Optics (McGraw-Hill,1996), Chap. 7.
15. M. Born and E. Wolf, Principles of Optics (Pergamon,1989), Chap. 9.
16. H. H. Barrett and K. J. Myers, Foundations of Image Science(Wiley-Interscience, 2004), Chaps. 7 and 15.
17. H. C. Andrews and B. R. Hunt, Digital Image Restoration(Prentice-Hall, 1977).
18. A. Papoulis and S. U. Pillai, Probability, Random Variablesand Stochastic Processes (McGraw-Hill, 2001).
19. C. L. Fales, F. O. Huck, and R. W. Samms, “Imaging systemdesign for improved information capacity,” Appl. Opt. 23,872–888 (1984).
20. Y. Itakura, S. Tsutsumi, and T. Takagi, “Statistical propertiesof the background noise for the atmospheric windows in theintermediate infrared region,” Infrared Phys. 14, 17–29(1974).
21. N. X. Nguyen, “Numerical algorithms for image superresolu-tion,” Ph. D. dissertation (Stanford University, 2000).
22. L. Masek, “Recognition of human iris patterns for biometricidentification,” Technical report (University of WesternAustralia, 2003).
23. S. Sanderson and J. Erbetta, “Authentication for secure en-vironments based on iris scanning technology,” in IEE Collo-quium on Visual Biometrics (IEEE, 2000), pp. 8/1–8/7.
24. D. J. Field, “Relations between the statistics of natural imagesand the response properties of cortical cells,” J. Opt. Soc. Am.4, 2379–2394 (1987).
25. W.Wenzel and K. Hamacher, “A stochastic tunneling approachfor global minimization,” Phys. Rev. Lett. 82, 3003–3007(1999).
26. MPI1.1 standard,http://www.mpi‑forum.org/docs/mpi‑11‑html/mpi‑report.html.
27. S. Prasad, “Digital superresolution and the generalizedsampling theorem,” J. Opt. Soc. Am. A 24, 311–325(2007).
28. E. Y. Lam, “Noise in superresolution reconstruction,” Opt.Lett. 28, 2234–2236 (2003).
29. M. D. Robinson and D. G. Stork, “Joint digital-optical design ofsuperresolution multiframe imaging systems,” Appl. Opt. 47,B11–B20 (2008).
1 April 2010 / Vol. 49, No. 10 / APPLIED OPTICS B39