pm2.5 and pm10 natural event document - … wildfire n… · · 2009-07-20pm2.5 and pm10 natural...
TRANSCRIPT
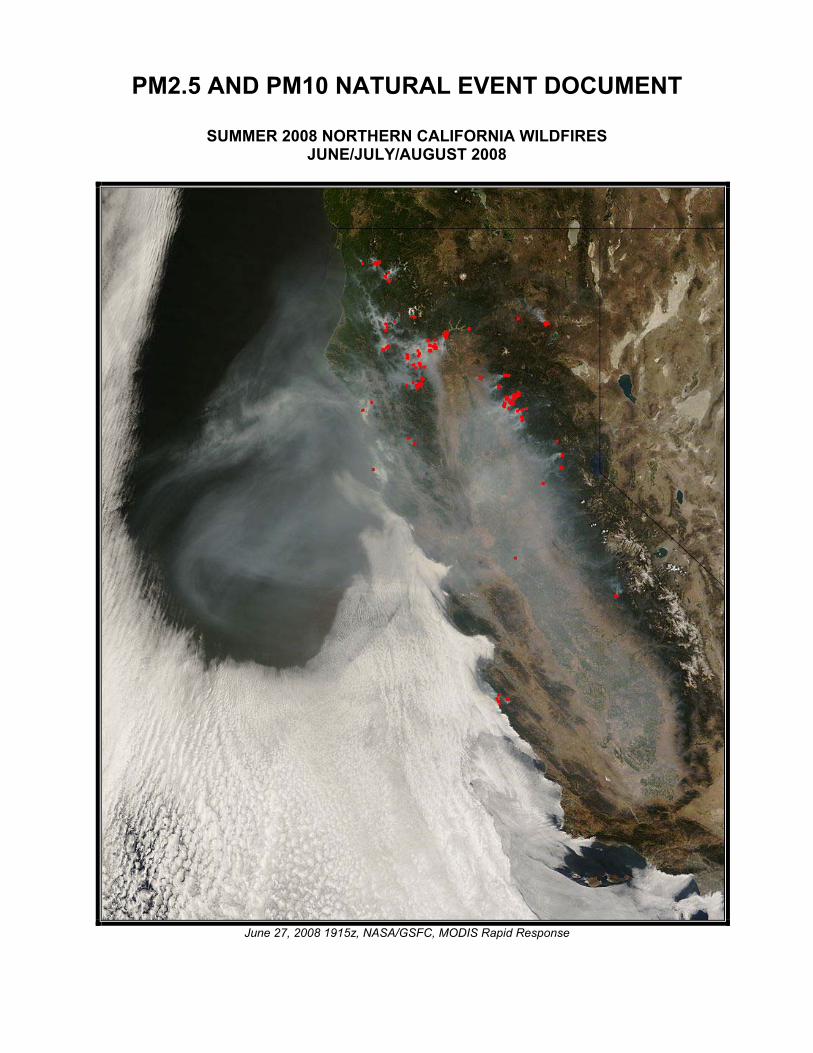
PM2.5 AND PM10 NATURAL EVENT DOCUMENT
SUMMER 2008 NORTHERN CALIFORNIA WILDFIRES JUNE/JULY/AUGUST 2008
June 27, 2008 1915z, NASA/GSFC, MODIS Rapid Response
7/20/2009
i
Table of Contents Page Exceptional Event Affected Air Quality 1 Regulatory Background 3 Analysis 3 Overview of Event 5 Clear Causal Connection 9 Event Analysis 16 June 1 to June 19 17 June 20 to July 31 19 Episode 1: June 20 to June 30 20 Episode 2: July 1 to July 15 31 Episode 3: July 16 to July 31 44 August 1 to August 31 56 August 10 57 August 16 59 Historical Background 64 Climatology/Meteorology 64 California Wildfires 64 PM Concentrations 65 But-For 68 Local Emissions 73 Mitigation Requirements 73 Provide for Prompt Policy Notification of Exceptional Events 73 Provide for Public Education on How to Minimize Exposure 74 Summary 74 List of Appendices 75 List of Attachments 75 References 76 Resources 77
7/20/2009
1
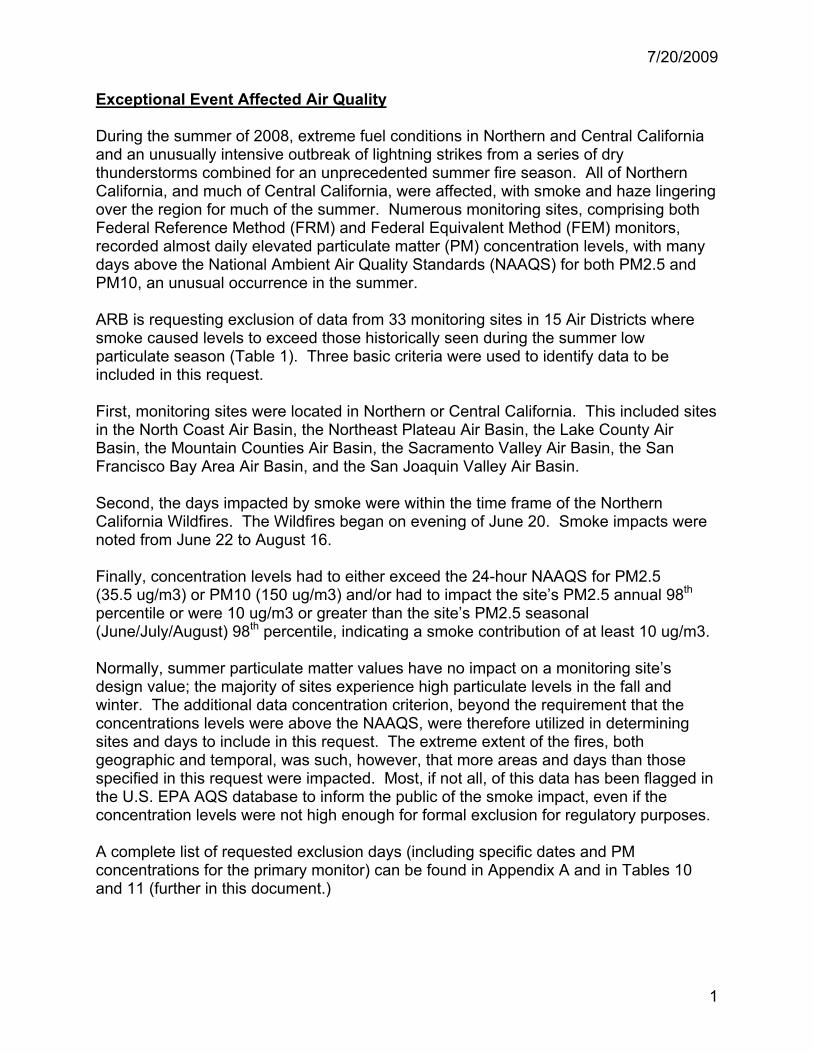
Exceptional Event Affected Air Quality During the summer of 2008, extreme fuel conditions in Northern and Central California and an unusually intensive outbreak of lightning strikes from a series of dry thunderstorms combined for an unprecedented summer fire season. All of Northern California, and much of Central California, were affected, with smoke and haze lingering over the region for much of the summer. Numerous monitoring sites, comprising both Federal Reference Method (FRM) and Federal Equivalent Method (FEM) monitors, recorded almost daily elevated particulate matter (PM) concentration levels, with many days above the National Ambient Air Quality Standards (NAAQS) for both PM2.5 and PM10, an unusual occurrence in the summer. ARB is requesting exclusion of data from 33 monitoring sites in 15 Air Districts where smoke caused levels to exceed those historically seen during the summer low particulate season (Table 1). Three basic criteria were used to identify data to be included in this request. First, monitoring sites were located in Northern or Central California. This included sites in the North Coast Air Basin, the Northeast Plateau Air Basin, the Lake County Air Basin, the Mountain Counties Air Basin, the Sacramento Valley Air Basin, the San Francisco Bay Area Air Basin, and the San Joaquin Valley Air Basin. Second, the days impacted by smoke were within the time frame of the Northern California Wildfires. The Wildfires began on evening of June 20. Smoke impacts were noted from June 22 to August 16. Finally, concentration levels had to either exceed the 24-hour NAAQS for PM2.5 (35.5 ug/m3) or PM10 (150 ug/m3) and/or had to impact the site’s PM2.5 annual 98th percentile or were 10 ug/m3 or greater than the site’s PM2.5 seasonal (June/July/August) 98th percentile, indicating a smoke contribution of at least 10 ug/m3. Normally, summer particulate matter values have no impact on a monitoring site’s design value; the majority of sites experience high particulate levels in the fall and winter. The additional data concentration criterion, beyond the requirement that the concentrations levels were above the NAAQS, were therefore utilized in determining sites and days to include in this request. The extreme extent of the fires, both geographic and temporal, was such, however, that more areas and days than those specified in this request were impacted. Most, if not all, of this data has been flagged in the U.S. EPA AQS database to inform the public of the smoke impact, even if the concentration levels were not high enough for formal exclusion for regulatory purposes. A complete list of requested exclusion days (including specific dates and PM concentrations for the primary monitor) can be found in Appendix A and in Tables 10 and 11 (further in this document.)
7/20/2009
2
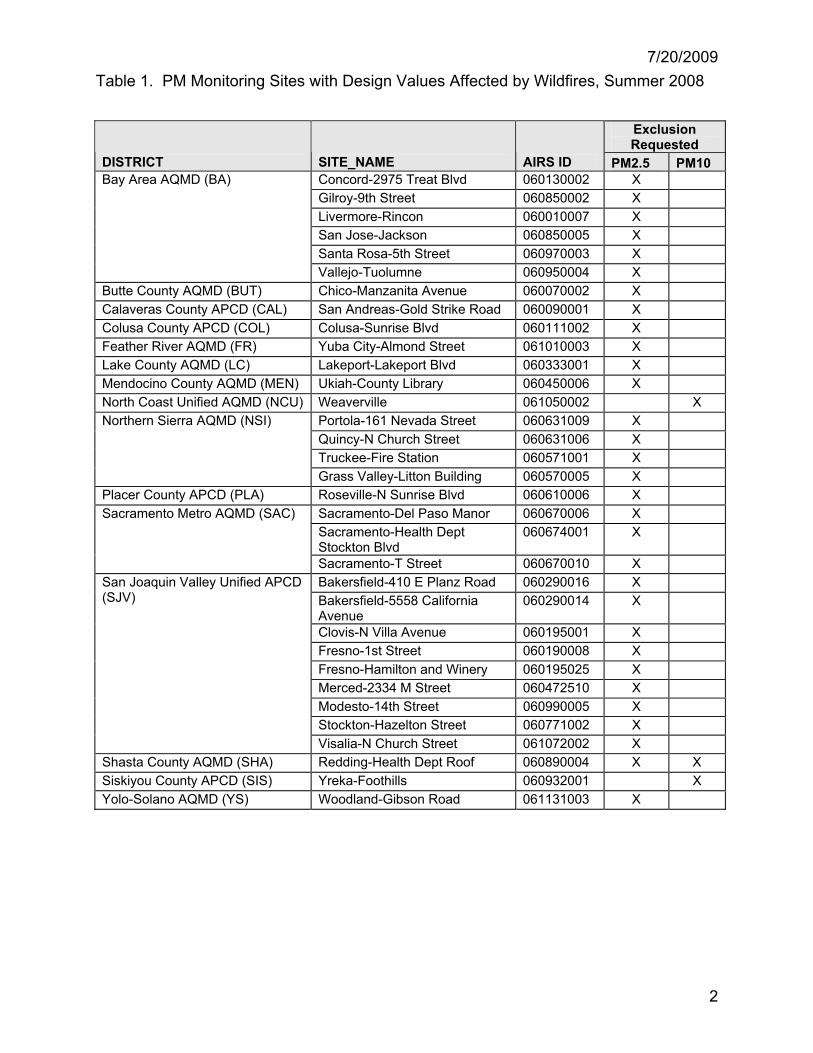
Table 1. PM Monitoring Sites with Design Values Affected by Wildfires, Summer 2008
Exclusion Requested
DISTRICT SITE_NAME AIRS ID PM2.5 PM10 Concord-2975 Treat Blvd 060130002 X Gilroy-9th Street 060850002 X Livermore-Rincon 060010007 X San Jose-Jackson 060850005 X Santa Rosa-5th Street 060970003 X
Bay Area AQMD (BA)
Vallejo-Tuolumne 060950004 X Butte County AQMD (BUT) Chico-Manzanita Avenue 060070002 X Calaveras County APCD (CAL) San Andreas-Gold Strike Road 060090001 X Colusa County APCD (COL) Colusa-Sunrise Blvd 060111002 X Feather River AQMD (FR) Yuba City-Almond Street 061010003 X Lake County AQMD (LC) Lakeport-Lakeport Blvd 060333001 X Mendocino County AQMD (MEN) Ukiah-County Library 060450006 X North Coast Unified AQMD (NCU) Weaverville 061050002 X
Portola-161 Nevada Street 060631009 X Quincy-N Church Street 060631006 X Truckee-Fire Station 060571001 X
Northern Sierra AQMD (NSI)
Grass Valley-Litton Building 060570005 X Placer County APCD (PLA) Roseville-N Sunrise Blvd 060610006 X
Sacramento-Del Paso Manor 060670006 X Sacramento-Health Dept Stockton Blvd
060674001 X Sacramento Metro AQMD (SAC)
Sacramento-T Street 060670010 X Bakersfield-410 E Planz Road 060290016 X Bakersfield-5558 California Avenue
060290014 X
Clovis-N Villa Avenue 060195001 X Fresno-1st Street 060190008 X Fresno-Hamilton and Winery 060195025 X Merced-2334 M Street 060472510 X Modesto-14th Street 060990005 X Stockton-Hazelton Street 060771002 X
San Joaquin Valley Unified APCD (SJV)
Visalia-N Church Street 061072002 X Shasta County AQMD (SHA) Redding-Health Dept Roof 060890004 X X Siskiyou County APCD (SIS) Yreka-Foothills 060932001 X Yolo-Solano AQMD (YS) Woodland-Gibson Road 061131003 X
7/20/2009
3
Regulatory Background The Code of Federal Regulations (CFR) provides the definition and criteria for determining whether air quality data is impacted by an exceptional event. The 40 CFR 50.1 (j)1 definition states that “exceptional event means an event that affects air quality, is not reasonably controllable or preventable, is an event caused by human activity that is unlikely to recur at a particular location or a natural event, and is determined by the Administrator in accordance with 40 CFR 50.14 to be an exceptional event.” The demonstration to justify data exclusion as outlined in 40 CFR 50.14 specifies that evidence must be provided that:
1. The event meets the definition of an exceptional event; 2. There is a clear causal relationship between the measurement under consideration and the event that is claimed to have affected air quality in the area; 3. The event is associated with a measured concentration in excess of normal historical fluctuations, including background; and, 4. There would have been no exceedance or violation but for the event.
This report documents that the event meets the above criteria and provides analysis to demonstrate that:
I. The events were not reasonably controllable or preventable because the smoke originated from a non-anthropogenic source; II. There is a clear-causal connection between the smoke from the wildfires and the exceedances at numerous sites throughout California; III. The measured concentrations were beyond normal historical levels; and IV. The exceedances would not have occurred “but for” the smoke from the wildfires.
Analysis Methods The following document demonstrates that a clear causal relationship existed between the smoke from wildfires seen over California in June, July, and August 2008, and the exceedances measured at the monitors. This analysis utilized monitoring and meteorological data, satellite images and smoke and fire detection analysis, parcel trajectories, emissions information, and historical data. ARB staff concludes that, but-for the smoke from the wildfires, the measured concentrations at the monitors would not have exceeded the NAAQS. Monitoring Network and Data. The State of California’s particulate matter monitoring network consists of both PM10 and PM2.5 FRM (filter-based) and PM10 FEM (Tapered-Element Oscillating Microbalance (TEOM) or Beta Attenuation Method (BAM)) monitors operating on continuous, daily, and every third day (1-in-3 or 1/3 day), every sixth day (1-in-6 or 1/6 day), and every twelfth day (1-in-12 or 1/12 day) schedules. During the summer of 2008, several PM2.5 BAM monitors were in operation in the affected areas. Although none of these were considered FEM monitors, they were heavily utilized for forecasting purposes. The chronology followed in this analysis focuses primarily on the
7/20/2009
4
1/3-day and 1/6-day sampling days, when most of the FRM/FEM sites were operating. A few sites, those that operated on a daily basis, experienced above normal concentrations on intervening the days. Smoke was present throughout the summer, occurring on days between the scheduled sampling days and extending beyond the last sampling day (August 16) in this chronology. In June, July, and August of 2008, the FRM and FEM monitors shown in Table 1, recorded PM concentrations above the NAAQS (exact dates and concentrations are listed in Tables 10 and 11 and Appendix A). All areas of Northern California and parts of Central and Southern California as well, were affected by the wildfires. Numerous Air Districts reported exceedances of the PM NAAQS high enough to adversely affect the 24-hour and annual average design values. Satellite Data. Satellite data was utilized for visual confirmation of smoke in the atmosphere. Direct images showing the layers of smoke over California, as well as those layers constructed from analyst observations (Appendix E), correlate reasonably well with PM2.5 data obtained from monitoring sites throughout the region. Day-by-day smoke analysis by National Oceanic and Atmospheric Administration (NOAA) Hazard Mapping System (HMS) Fire and Smoke Product during the summer of 2008, details the extreme combined smoke impacts of these fires (Appendix E). As noted by the NOAA Satellite and Information Service, the HMS is an interactive processing system where the trained satellite analysts in the Satellite Analysis Branch (SAB), within the Satellite Services Division (SSD), manually integrate data from various automated fire detection algorithms with GOES and polar (Advanced Very High Resolution Radiometer (AVHRR), Moderate Resolution Imaging Spectroradiometer Fire Algorithm (MODIS) and Defense Meteorological Satellite Program/Operational Linescan System (DMSP/OLS)) images. These products display both fire locations and significant smoke plumes. Smoke layers that can be used with geographic information system (GIS) programs are then generated. Layer construction is restricted to discrete time periods (passage of overhead satellites) and geometric areas and does not always reflect complete smoke plume boundaries or even all areas visible in satellite images2. Additionally, the presence of cloud cover can restrict the detection of fires and smoke plumes. Therefore, there are days that increased PM2.5 concentrations due to smoke are not reflected in the constructed smoke layers. Particle trajectories. Air parcel trajectories, used to determine the source of impacts on a monitoring site, were modeled using the NOAA Hybrid Single Particle Lagrangian Integrated Trajectory (HYSPLIT) Model. This model has been used by the U.S. EPA to help evaluate causal connections between suspected source regions (e.g., a wildfire’s smoke plume) and event receptors (e.g., a monitoring site). Emissions and Control Measures. Anthropogenic sources near the monitors played only a small role in the particulate matter levels seen at the affected sites. Reasonable and appropriate controls were in place in all affected Districts to reduce PM from anthropogenic sources, but conditions were such to overwhelm any control measures. Therefore, this natural event and the associated exceedances were not reasonably controllable or preventable.
7/20/2009
5
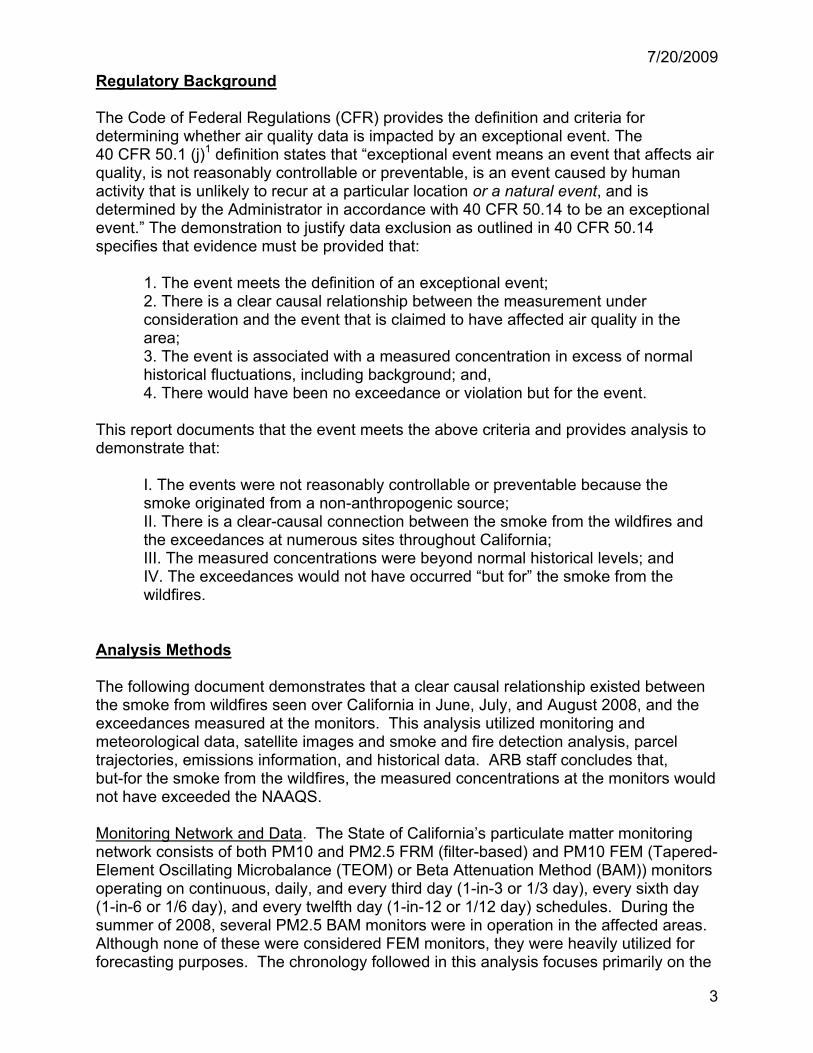
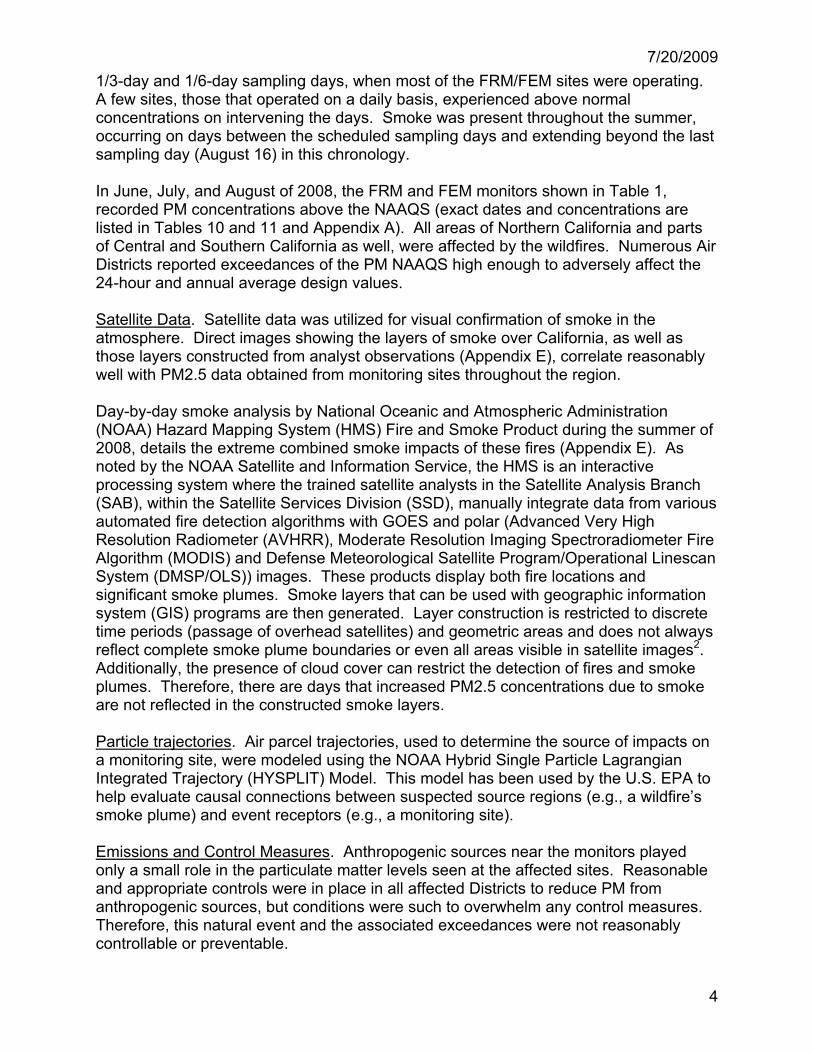
Overview of Event From June 20 to June 22, 2008, over 6000 lightning strikes from a series of thunderstorms ignited numerous wildfires throughout Northern and Central California. At its peak, what became known as the Northern California Lightning Siege (or the Lightning Complex Fires) comprised thousands of wildfires in 26 counties, sending smoke throughout the western United States (U.S.)3,4,5,6. California firefighters were assisted in their efforts to control these blazes by units from throughout the U.S. as well as Australia, Canada, Greece, Mexico, and New Zealand5. By the time the last fire had been contained on July 29, over one million acres had burned, and ten counties had been declared disaster areas7. Fires smoldered for weeks after containment, with continuing smoke impacts in nearby areas. PM monitoring sites, many in close proximity to the wildfires (Figure 1), were severely impacted by smoke throughout the summer of 2008. The smoke impacts (illustrated in the satellite image in Figure 2) extended throughout California and into other states. PM monitors primarily collect data every third day (1/3-day), every sixth day (1/6-day), or daily. During the summer, when PM is at its lowest, most monitors run on a 1/3-day or 1/6-day schedule. Only Yuba City in the Sacramento Valley, and Bakersfield-California and Fresno-First, in the San Joaquin Valley, operated daily filter monitoring. The impact of the smoke from the fires, however, was felt every day for weeks, with only brief periods of respite when meteorological conditions allowed smoke to move out of a region. An SFD product from June 25, the same day as the satellite image in Figure 2, shows smoke covering California, extending into Oregon and Nevada, and reaching even further into the Continental U.S. (Figure 3).

7/20/2009
6
Figure 1. California Particulate Matter Monitoring Sites and Fire Perimeters During Summer 2008
7/20/2009
7
Figure 2. MODIS Satellite Image - June 25, 2008. Smoke covers Northern California.
[http://activefiremaps.fs.fed.us/imagery.php]
Figure 3. NOAA Satellite Fire Detection Smoke Analysis Product – June 25, 2008
7/20/2009
8
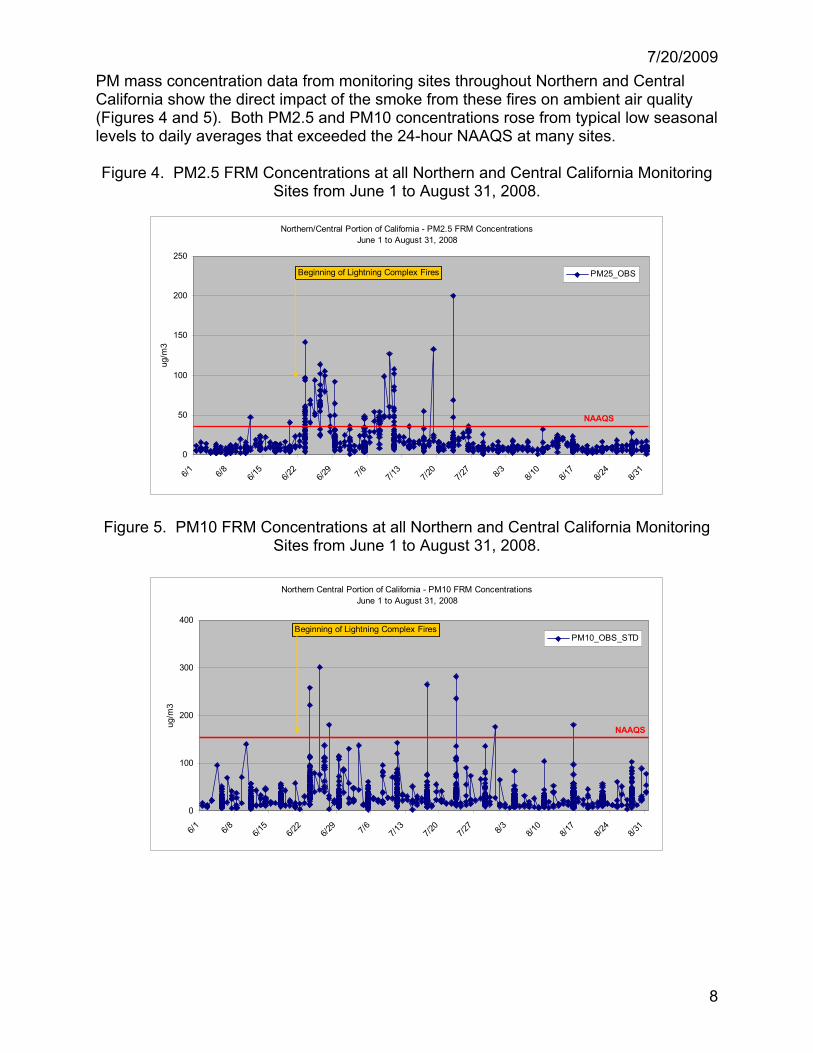
PM mass concentration data from monitoring sites throughout Northern and Central California show the direct impact of the smoke from these fires on ambient air quality (Figures 4 and 5). Both PM2.5 and PM10 concentrations rose from typical low seasonal levels to daily averages that exceeded the 24-hour NAAQS at many sites. Figure 4. PM2.5 FRM Concentrations at all Northern and Central California Monitoring
Sites from June 1 to August 31, 2008.
Northern/Central Portion of California - PM2.5 FRM ConcentrationsJune 1 to August 31, 2008
0
50
100
150
200
250
6/1 6/8 6/15
6/22
6/29 7/6 7/1
37/2
07/2
7 8/3 8/10
8/17
8/24
8/31
ug/m
3
PM25_OBSBeginning of Lightning Complex Fires
NAAQS
Figure 5. PM10 FRM Concentrations at all Northern and Central California Monitoring Sites from June 1 to August 31, 2008.
Northern Central Portion of California - PM10 FRM Concentrations
June 1 to August 31, 2008
0
100
200
300
400
6/1 6/8 6/15
6/22
6/29 7/6 7/1
37/2
07/2
7 8/3 8/10
8/17
8/24
8/31
ug/m
3
PM10_OBS_STDBeginning of Lightning Complex Fires
NAAQS

7/20/2009
9
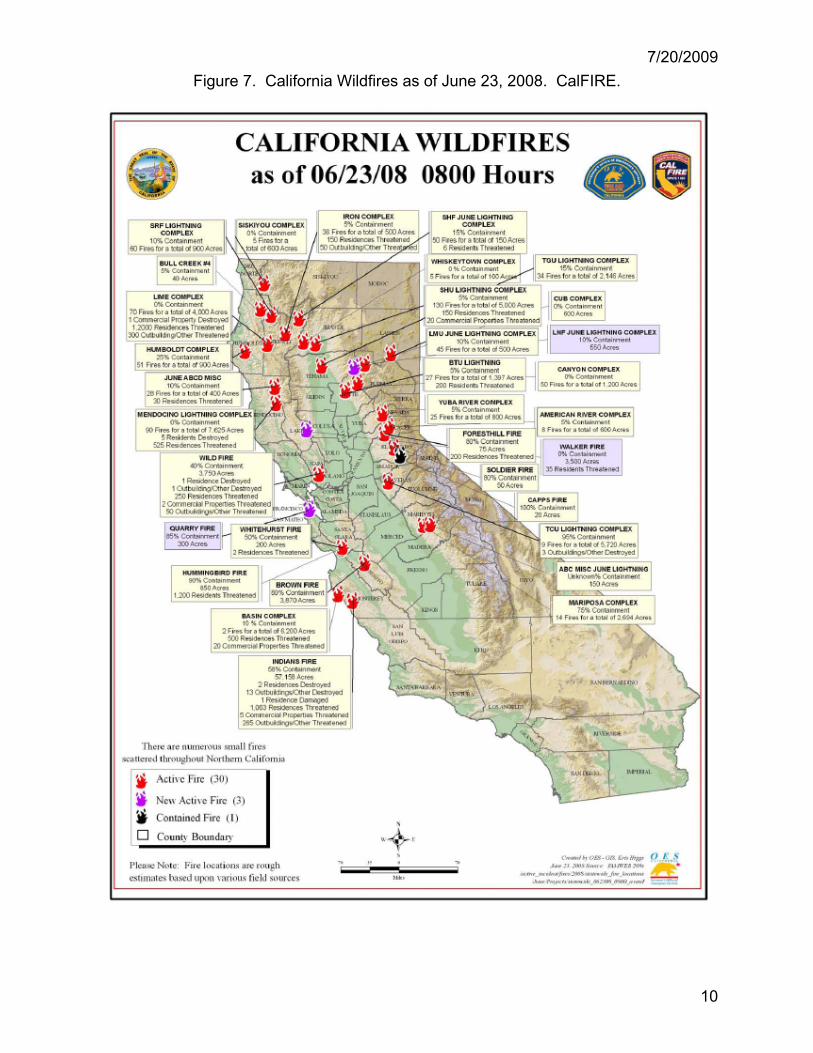
Clear Causal Connection On June 20, 2008, a series of dry thunderstorms moved into Northern and Central California. Combined with an already unstable atmosphere, extreme fuel conditions due to several years of drought conditions, and gusty winds, the lightning outbreak ignited an historically high number of wildfires. Over 6000 lightning strikes were recorded from the June 20 to 22 (Figure 6), initially igniting almost 1000 fires (subsequent days saw the ignition of hundreds more fires). Figures 7 and 8 show the primary individual and complex fires; not all fires are shown on these maps.
Figure 6. Geographic Location of Lightning Strikes as of June 30, 2008.
7/20/2009
10
Figure 7. California Wildfires as of June 23, 2008. CalFIRE.
7/20/2009
11
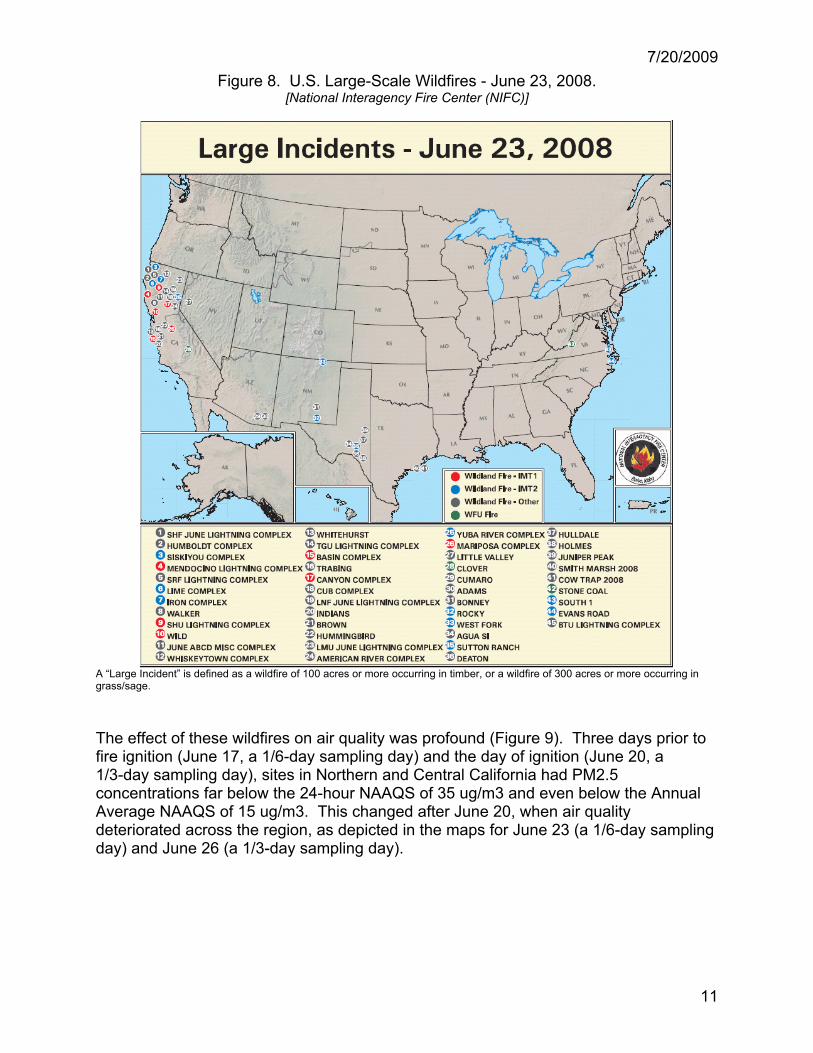
Figure 8. U.S. Large-Scale Wildfires - June 23, 2008. [National Interagency Fire Center (NIFC)]
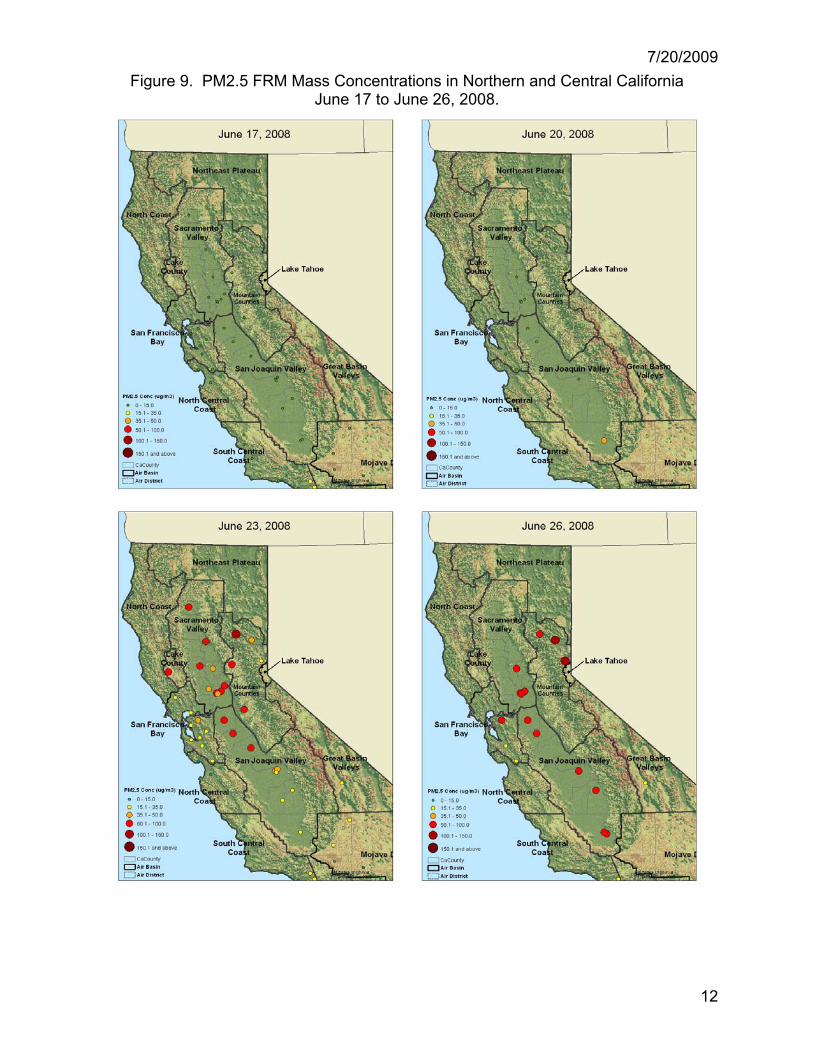
A “Large Incident” is defined as a wildfire of 100 acres or more occurring in timber, or a wildfire of 300 acres or more occurring in grass/sage. The effect of these wildfires on air quality was profound (Figure 9). Three days prior to fire ignition (June 17, a 1/6-day sampling day) and the day of ignition (June 20, a 1/3-day sampling day), sites in Northern and Central California had PM2.5 concentrations far below the 24-hour NAAQS of 35 ug/m3 and even below the Annual Average NAAQS of 15 ug/m3. This changed after June 20, when air quality deteriorated across the region, as depicted in the maps for June 23 (a 1/6-day sampling day) and June 26 (a 1/3-day sampling day).
7/20/2009
12
Figure 9. PM2.5 FRM Mass Concentrations in Northern and Central California June 17 to June 26, 2008.
7/20/2009
13
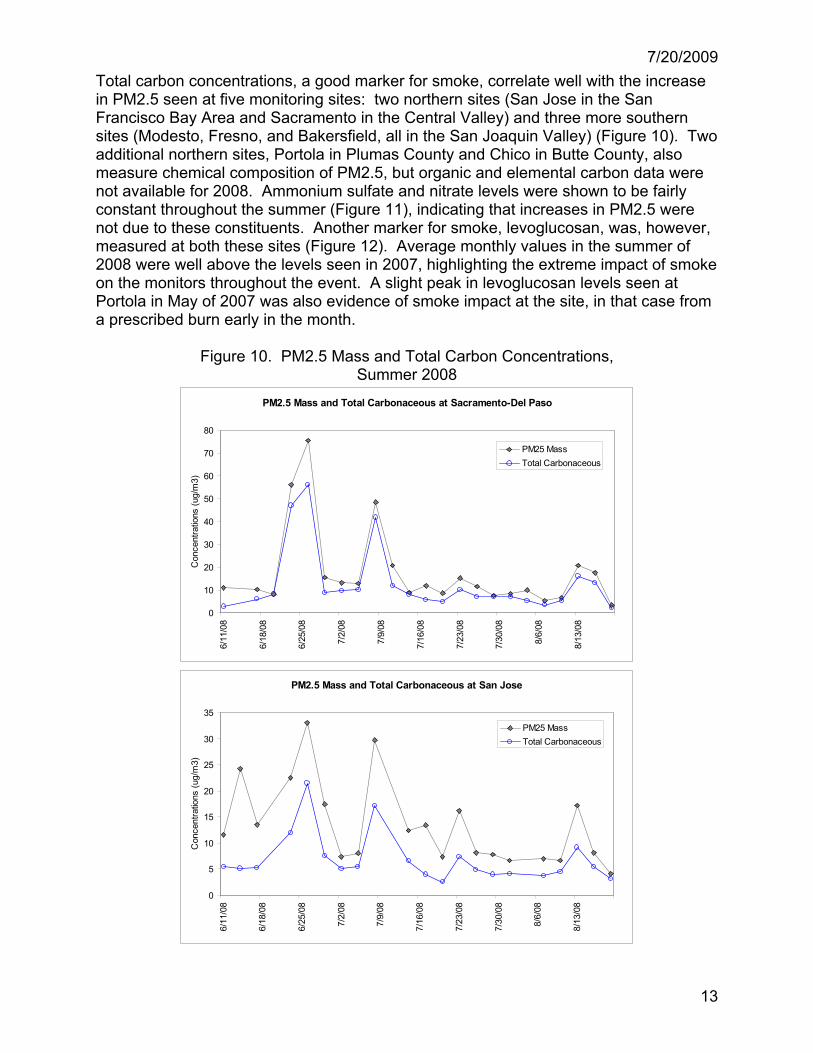
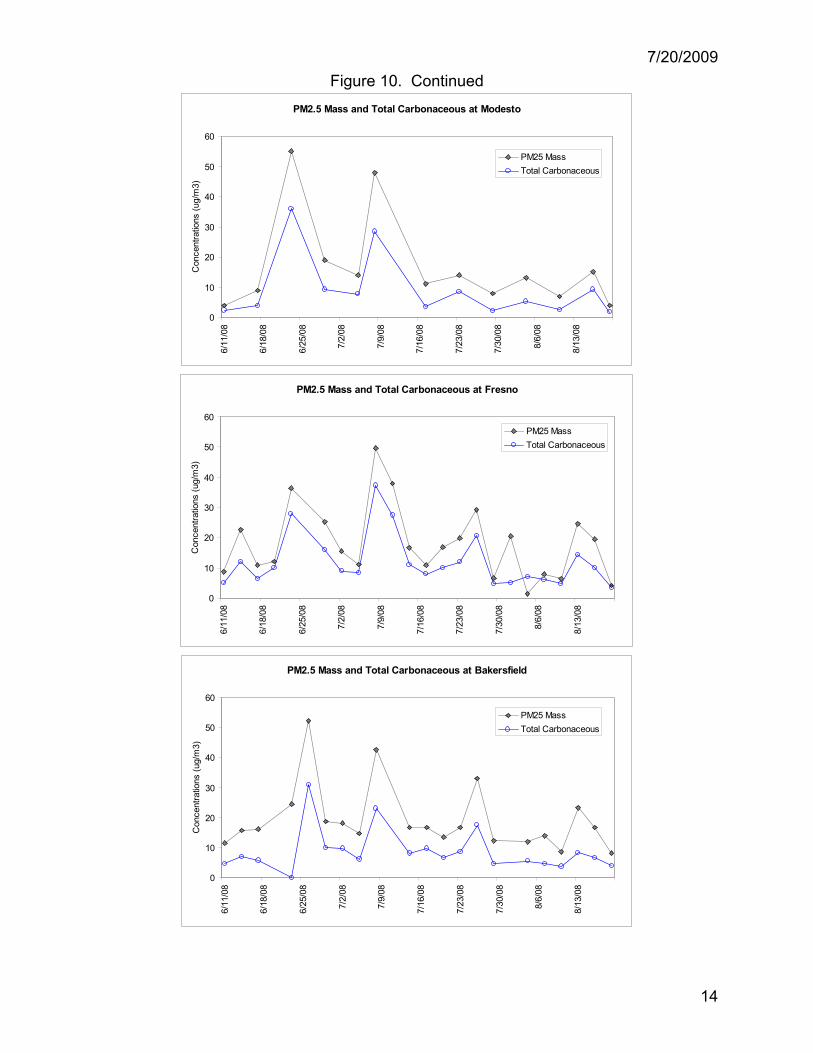
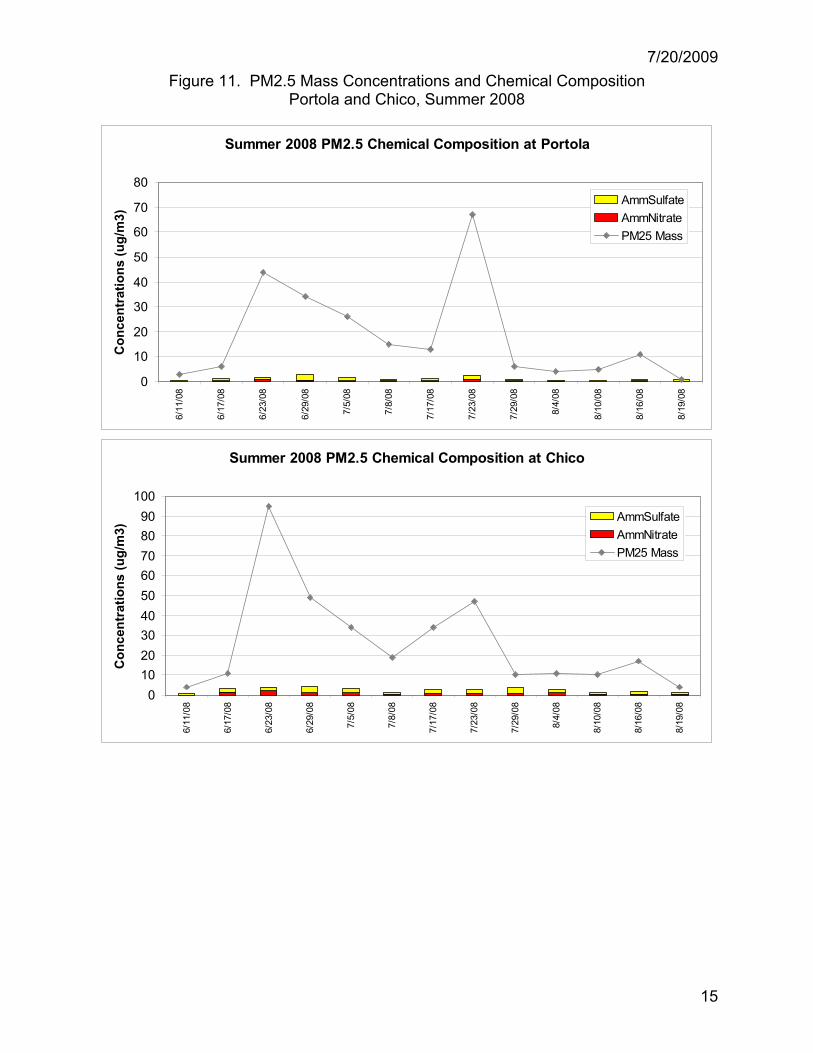
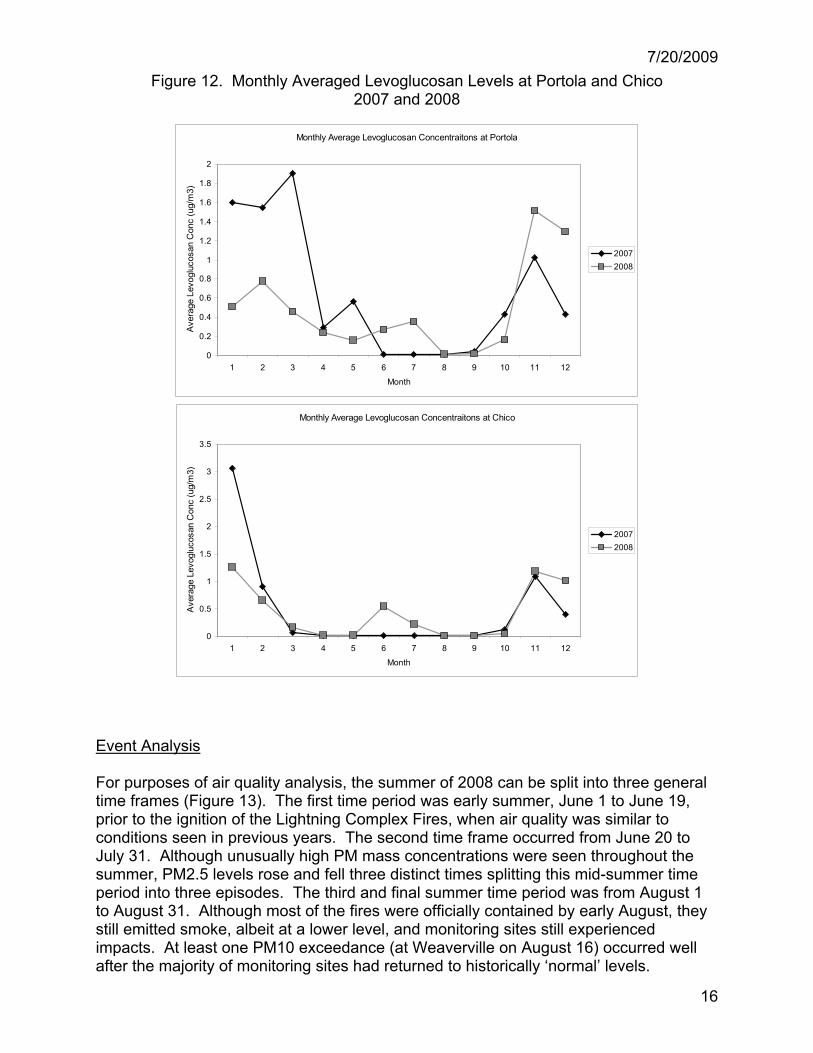
Total carbon concentrations, a good marker for smoke, correlate well with the increase in PM2.5 seen at five monitoring sites: two northern sites (San Jose in the San Francisco Bay Area and Sacramento in the Central Valley) and three more southern sites (Modesto, Fresno, and Bakersfield, all in the San Joaquin Valley) (Figure 10). Two additional northern sites, Portola in Plumas County and Chico in Butte County, also measure chemical composition of PM2.5, but organic and elemental carbon data were not available for 2008. Ammonium sulfate and nitrate levels were shown to be fairly constant throughout the summer (Figure 11), indicating that increases in PM2.5 were not due to these constituents. Another marker for smoke, levoglucosan, was, however, measured at both these sites (Figure 12). Average monthly values in the summer of 2008 were well above the levels seen in 2007, highlighting the extreme impact of smoke on the monitors throughout the event. A slight peak in levoglucosan levels seen at Portola in May of 2007 was also evidence of smoke impact at the site, in that case from a prescribed burn early in the month.
Figure 10. PM2.5 Mass and Total Carbon Concentrations, Summer 2008
PM2.5 Mass and Total Carbonaceous at Sacramento-Del Paso
0
10
20
30
40
50
60
70
80
6/11
/08
6/18
/08
6/25
/08
7/2/
08
7/9/
08
7/16
/08
7/23
/08
7/30
/08
8/6/
08
8/13
/08
Con
cent
ratio
ns (u
g/m
3)
PM25 MassTotal Carbonaceous
PM2.5 Mass and Total Carbonaceous at San Jose
0
5
10
15
20
25
30
35
6/11
/08
6/18
/08
6/25
/08
7/2/
08
7/9/
08
7/16
/08
7/23
/08
7/30
/08
8/6/
08
8/13
/08
Con
cent
ratio
ns (u
g/m
3)
PM25 MassTotal Carbonaceous
7/20/2009
14
Figure 10. Continued PM2.5 Mass and Total Carbonaceous at Modesto
0
10
20
30
40
50
60
6/11
/08
6/18
/08
6/25
/08
7/2/
08
7/9/
08
7/16
/08
7/23
/08
7/30
/08
8/6/
08
8/13
/08
Con
cent
ratio
ns (u
g/m
3)
PM25 MassTotal Carbonaceous
PM2.5 Mass and Total Carbonaceous at Fresno
0
10
20
30
40
50
60
6/11
/08
6/18
/08
6/25
/08
7/2/
08
7/9/
08
7/16
/08
7/23
/08
7/30
/08
8/6/
08
8/13
/08
Con
cent
ratio
ns (u
g/m
3)
PM25 MassTotal Carbonaceous
PM2.5 Mass and Total Carbonaceous at Bakersfield
0
10
20
30
40
50
60
6/11
/08
6/18
/08
6/25
/08
7/2/
08
7/9/
08
7/16
/08
7/23
/08
7/30
/08
8/6/
08
8/13
/08
Con
cent
ratio
ns (u
g/m
3)
PM25 MassTotal Carbonaceous
7/20/2009
15
Figure 11. PM2.5 Mass Concentrations and Chemical Composition Portola and Chico, Summer 2008
Summer 2008 PM2.5 Chemical Composition at Portola
0
10
20
30
40
50
60
70
806/
11/0
8
6/17
/08
6/23
/08
6/29
/08
7/5/
08
7/8/
08
7/17
/08
7/23
/08
7/29
/08
8/4/
08
8/10
/08
8/16
/08
8/19
/08
Con
cent
ratio
ns (u
g/m
3)
AmmSulfateAmmNitratePM25 Mass
Summer 2008 PM2.5 Chemical Composition at Chico
0102030405060708090
100
6/11
/08
6/17
/08
6/23
/08
6/29
/08
7/5/
08
7/8/
08
7/17
/08
7/23
/08
7/29
/08
8/4/
08
8/10
/08
8/16
/08
8/19
/08
Con
cent
ratio
ns (u
g/m
3)
AmmSulfateAmmNitratePM25 Mass
7/20/2009
16
Figure 12. Monthly Averaged Levoglucosan Levels at Portola and Chico 2007 and 2008
Monthly Average Levoglucosan Concentraitons at Portola
0
0.2
0.4
0.6
0.8
1
1.2
1.4
1.6
1.8
2
1 2 3 4 5 6 7 8 9 10 11 12
Month
Aver
age
Levo
gluc
osan
Con
c (u
g/m
3)
20072008
Monthly Average Levoglucosan Concentraitons at Chico
0
0.5
1
1.5
2
2.5
3
3.5
1 2 3 4 5 6 7 8 9 10 11 12
Month
Ave
rage
Lev
oglu
cosa
n C
onc
(ug/
m3)
20072008
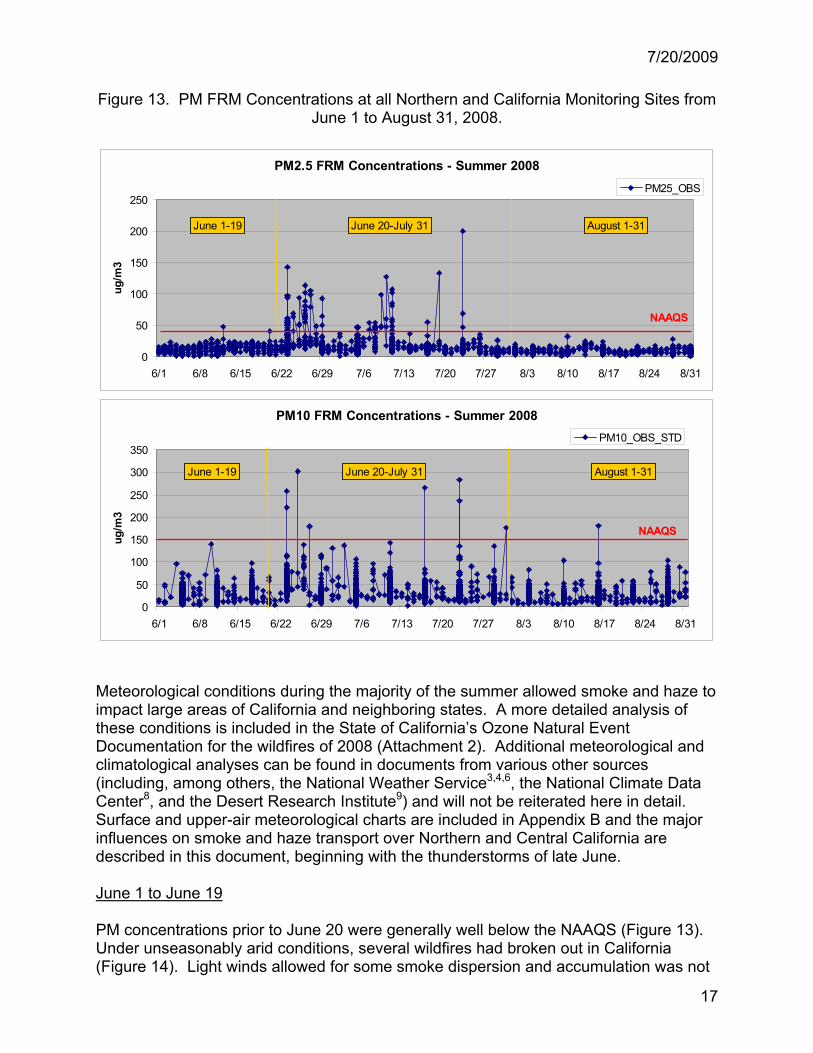
Event Analysis For purposes of air quality analysis, the summer of 2008 can be split into three general time frames (Figure 13). The first time period was early summer, June 1 to June 19, prior to the ignition of the Lightning Complex Fires, when air quality was similar to conditions seen in previous years. The second time frame occurred from June 20 to July 31. Although unusually high PM mass concentrations were seen throughout the summer, PM2.5 levels rose and fell three distinct times splitting this mid-summer time period into three episodes. The third and final summer time period was from August 1 to August 31. Although most of the fires were officially contained by early August, they still emitted smoke, albeit at a lower level, and monitoring sites still experienced impacts. At least one PM10 exceedance (at Weaverville on August 16) occurred well after the majority of monitoring sites had returned to historically ‘normal’ levels.
7/20/2009
17
Figure 13. PM FRM Concentrations at all Northern and California Monitoring Sites from
June 1 to August 31, 2008.
PM2.5 FRM Concentrations - Summer 2008
0
50
100
150
200
250
6/1 6/8 6/15 6/22 6/29 7/6 7/13 7/20 7/27 8/3 8/10 8/17 8/24 8/31
ug/m
3
PM25_OBS
June 1-19 June 20-July 31 August 1-31
NAAQS
PM10 FRM Concentrations - Summer 2008
0
50
100
150
200
250
300
350
6/1 6/8 6/15 6/22 6/29 7/6 7/13 7/20 7/27 8/3 8/10 8/17 8/24 8/31
ug/m
3
PM10_OBS_STD
June 1-19 June 20-July 31 August 1-31
NAAQS
Meteorological conditions during the majority of the summer allowed smoke and haze to impact large areas of California and neighboring states. A more detailed analysis of these conditions is included in the State of California’s Ozone Natural Event Documentation for the wildfires of 2008 (Attachment 2). Additional meteorological and climatological analyses can be found in documents from various other sources (including, among others, the National Weather Service3,4,6, the National Climate Data Center8, and the Desert Research Institute9) and will not be reiterated here in detail. Surface and upper-air meteorological charts are included in Appendix B and the major influences on smoke and haze transport over Northern and Central California are described in this document, beginning with the thunderstorms of late June. June 1 to June 19 PM concentrations prior to June 20 were generally well below the NAAQS (Figure 13). Under unseasonably arid conditions, several wildfires had broken out in California (Figure 14). Light winds allowed for some smoke dispersion and accumulation was not

7/20/2009
18
enough to severely impact most monitoring sites. The Yuba City monitor, a daily PM FRM monitor, recorded increased concentrations beginning in mid-June, but although high for the season, these were still well below the standard (Figure 15). This early start to the fire season prompted Governor Schwarzenegger to declare a State of Emergency in Butte County (Appendix F).
Figure 14. California Wildfires – June 10 and 17, 2008
Figure 15. Yuba City PM2.5 Concentrations – early June, 2008
Yuba CityPM2.5 FRM Mass Concentrations - June 1 to 19, 2008
0
20
40
60
80
100
120
140
6/1 6/2 6/3 6/4 6/5 6/6 6/7 6/8 6/9 6/10 6/11 6/12 6/13 6/14 6/15 6/16 6/17 6/18 6/19
2008 Daily PM2.5 2000-2007 June Average NAAQS
Although not a definitive marker, the ratio of PM2.5 to PM10 can be a good indicator of smoke impact. PM2.5/PM10 ratios before the lightning strikes show that the majority of PM10 was in coarse range (between 2.5 and 10 microns in diameter), which is typical for the summer months. Figure 16 shows that most areas in California had less than 40% of PM in the fine range (0 to 2.5 microns). The only areas with higher ratios were still well below the 24-hour NAAQS for both PM2.5 and PM10. The higher PM2.5/PM10 ratio seen in Sacramento and in the San Joaquin Valley at the Clovis site may be due to

7/20/2009
19
the nearby fire as noted in Figure 14 above. (see also smoke text discussions in Appendix E).
Figure 16. Percent of PM2.5 portion of PM10 in California – June 17, 2008
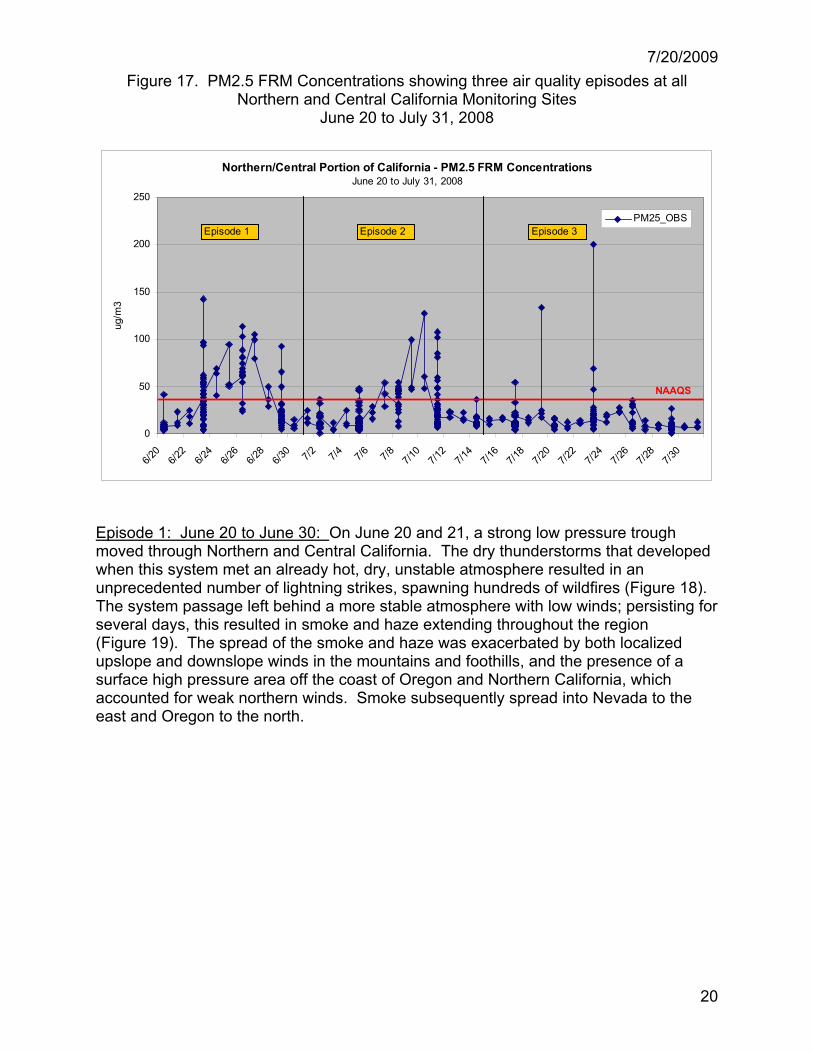
June 20 to July 31 As previously noted in the State of California’s Ozone Natural Event Documentation for the wildfires of Summer 2008, the majority of the summer can be split into three general air quality episodes. Although unusually high PM mass concentrations were seen throughout the summer, PM2.5 levels rose and fell three distinct times between June 20, the beginning of the Lightning Complex Fires, and July 31 (Figure 17)
7/20/2009
20
Figure 17. PM2.5 FRM Concentrations showing three air quality episodes at all Northern and Central California Monitoring Sites
June 20 to July 31, 2008
Northern/Central Portion of California - PM2.5 FRM ConcentrationsJune 20 to July 31, 2008
0
50
100
150
200
250
6/20
6/22
6/24
6/26
6/28
6/30 7/2 7/4 7/6 7/8 7/1
07/1
27/1
47/1
67/1
87/2
07/2
27/2
47/2
67/2
87/3
0
ug/m
3
PM25_OBS
NAAQS
Episode 1 Episode 2 Episode 3
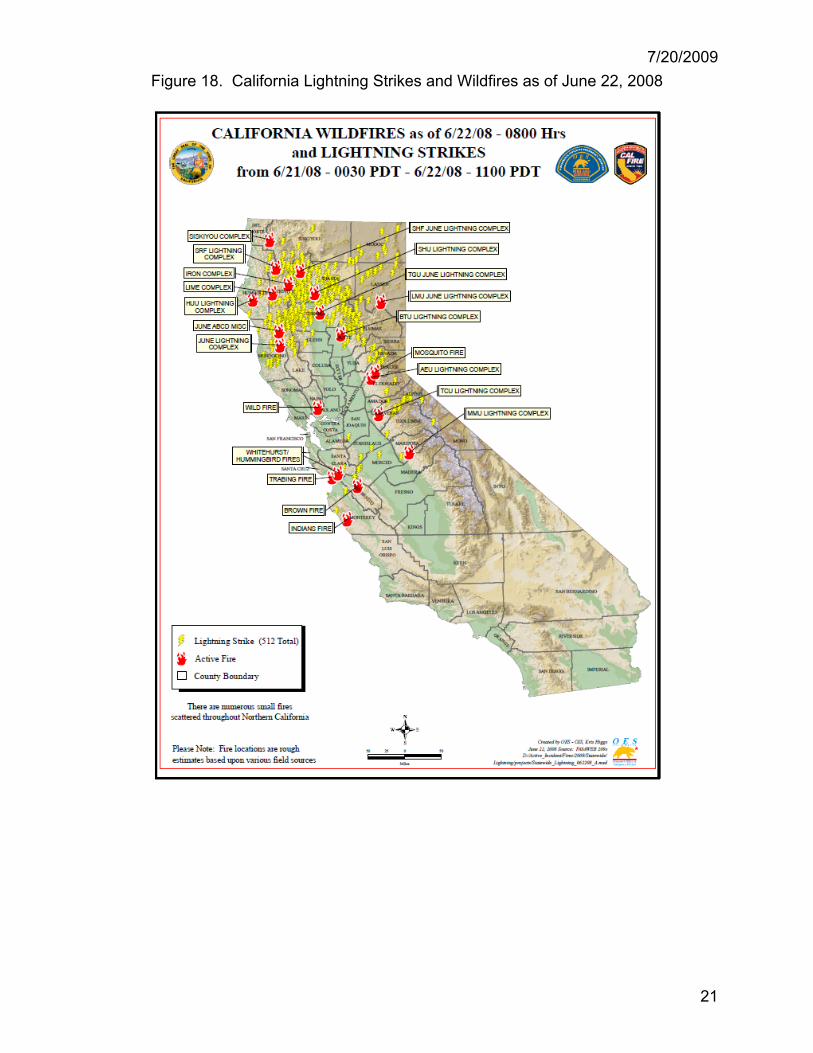
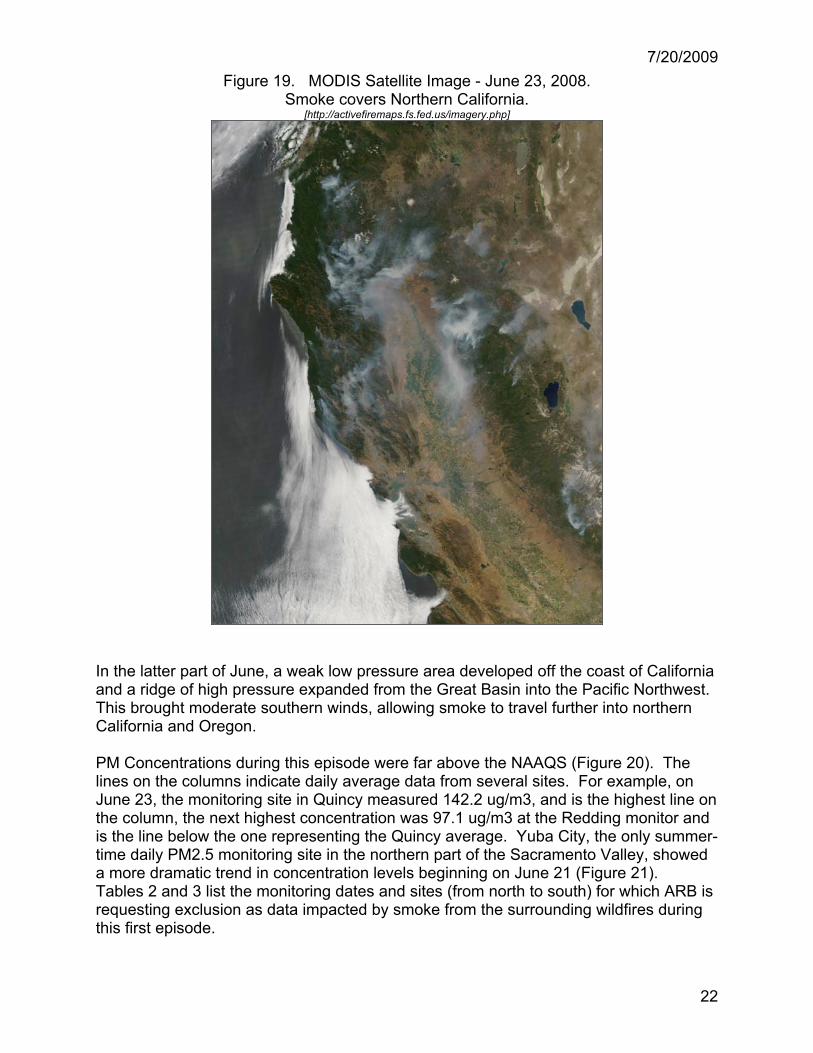
Episode 1: June 20 to June 30: On June 20 and 21, a strong low pressure trough moved through Northern and Central California. The dry thunderstorms that developed when this system met an already hot, dry, unstable atmosphere resulted in an unprecedented number of lightning strikes, spawning hundreds of wildfires (Figure 18). The system passage left behind a more stable atmosphere with low winds; persisting for several days, this resulted in smoke and haze extending throughout the region (Figure 19). The spread of the smoke and haze was exacerbated by both localized upslope and downslope winds in the mountains and foothills, and the presence of a surface high pressure area off the coast of Oregon and Northern California, which accounted for weak northern winds. Smoke subsequently spread into Nevada to the east and Oregon to the north.
7/20/2009
21
Figure 18. California Lightning Strikes and Wildfires as of June 22, 2008
7/20/2009
22
Figure 19. MODIS Satellite Image - June 23, 2008. Smoke covers Northern California.
[http://activefiremaps.fs.fed.us/imagery.php]
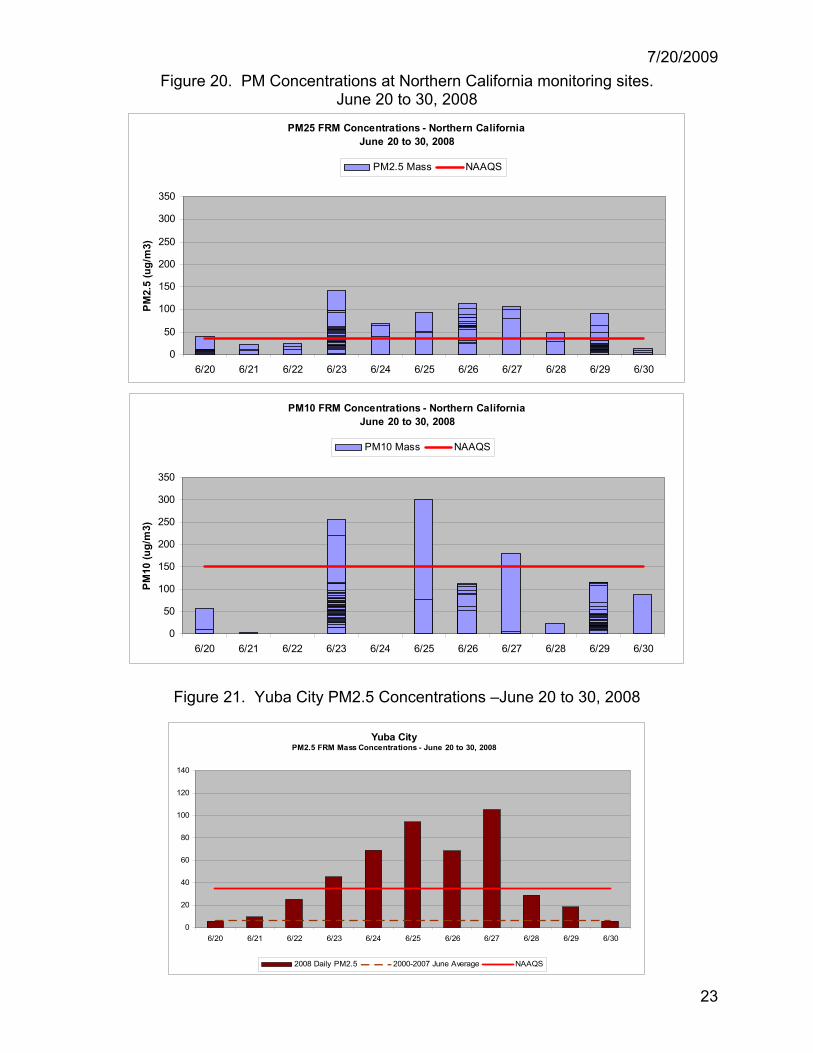
In the latter part of June, a weak low pressure area developed off the coast of California and a ridge of high pressure expanded from the Great Basin into the Pacific Northwest. This brought moderate southern winds, allowing smoke to travel further into northern California and Oregon. PM Concentrations during this episode were far above the NAAQS (Figure 20). The lines on the columns indicate daily average data from several sites. For example, on June 23, the monitoring site in Quincy measured 142.2 ug/m3, and is the highest line on the column, the next highest concentration was 97.1 ug/m3 at the Redding monitor and is the line below the one representing the Quincy average. Yuba City, the only summer-time daily PM2.5 monitoring site in the northern part of the Sacramento Valley, showed a more dramatic trend in concentration levels beginning on June 21 (Figure 21). Tables 2 and 3 list the monitoring dates and sites (from north to south) for which ARB is requesting exclusion as data impacted by smoke from the surrounding wildfires during this first episode.
7/20/2009
23
Figure 20. PM Concentrations at Northern California monitoring sites. June 20 to 30, 2008
PM25 FRM Concentrations - Northern CaliforniaJune 20 to 30, 2008
0
50
100
150
200
250
300
350
6/20 6/21 6/22 6/23 6/24 6/25 6/26 6/27 6/28 6/29 6/30
PM2.
5 (u
g/m
3)
PM2.5 Mass NAAQS
PM10 FRM Concentrations - Northern California
June 20 to 30, 2008
0
50
100
150
200
250
300
350
6/20 6/21 6/22 6/23 6/24 6/25 6/26 6/27 6/28 6/29 6/30
PM10
(ug/
m3)
PM10 Mass NAAQS
Figure 21. Yuba City PM2.5 Concentrations –June 20 to 30, 2008
Yuba CityPM2.5 FRM Mass Concentrations - June 20 to 30, 2008
0
20
40
60
80
100
120
140
6/20 6/21 6/22 6/23 6/24 6/25 6/26 6/27 6/28 6/29 6/30
2008 Daily PM2.5 2000-2007 June Average NAAQS
7/20/2009
24
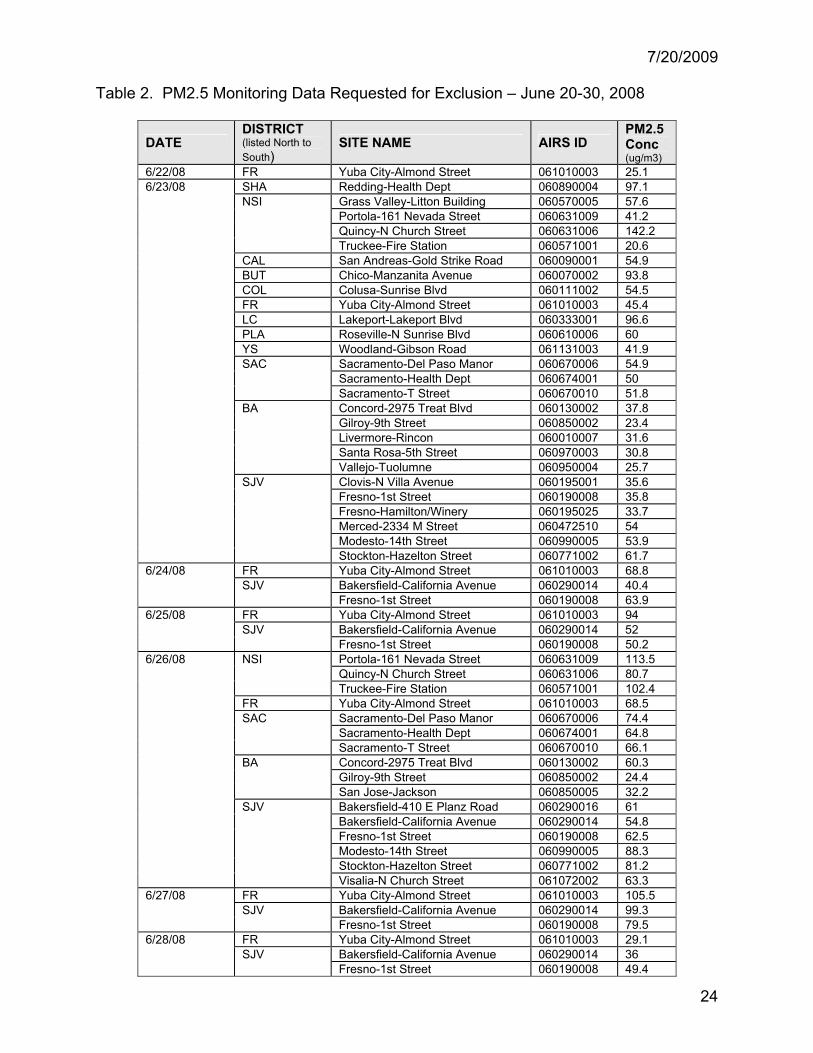
Table 2. PM2.5 Monitoring Data Requested for Exclusion – June 20-30, 2008
DATE DISTRICT (listed North to South)
SITE NAME AIRS ID PM2.5 Conc (ug/m3)
6/22/08 FR Yuba City-Almond Street 061010003 25.1 SHA Redding-Health Dept 060890004 97.1
Grass Valley-Litton Building 060570005 57.6 Portola-161 Nevada Street 060631009 41.2 Quincy-N Church Street 060631006 142.2
NSI
Truckee-Fire Station 060571001 20.6 CAL San Andreas-Gold Strike Road 060090001 54.9 BUT Chico-Manzanita Avenue 060070002 93.8 COL Colusa-Sunrise Blvd 060111002 54.5 FR Yuba City-Almond Street 061010003 45.4 LC Lakeport-Lakeport Blvd 060333001 96.6 PLA Roseville-N Sunrise Blvd 060610006 60 YS Woodland-Gibson Road 061131003 41.9
Sacramento-Del Paso Manor 060670006 54.9 Sacramento-Health Dept 060674001 50
SAC
Sacramento-T Street 060670010 51.8 Concord-2975 Treat Blvd 060130002 37.8 Gilroy-9th Street 060850002 23.4 Livermore-Rincon 060010007 31.6 Santa Rosa-5th Street 060970003 30.8
BA
Vallejo-Tuolumne 060950004 25.7 Clovis-N Villa Avenue 060195001 35.6 Fresno-1st Street 060190008 35.8 Fresno-Hamilton/Winery 060195025 33.7 Merced-2334 M Street 060472510 54 Modesto-14th Street 060990005 53.9
6/23/08
SJV
Stockton-Hazelton Street 060771002 61.7 FR Yuba City-Almond Street 061010003 68.8
Bakersfield-California Avenue 060290014 40.4 6/24/08
SJV Fresno-1st Street 060190008 63.9
FR Yuba City-Almond Street 061010003 94 Bakersfield-California Avenue 060290014 52
6/25/08 SJV
Fresno-1st Street 060190008 50.2 Portola-161 Nevada Street 060631009 113.5 Quincy-N Church Street 060631006 80.7
NSI
Truckee-Fire Station 060571001 102.4 FR Yuba City-Almond Street 061010003 68.5
Sacramento-Del Paso Manor 060670006 74.4 Sacramento-Health Dept 060674001 64.8
SAC
Sacramento-T Street 060670010 66.1 Concord-2975 Treat Blvd 060130002 60.3 Gilroy-9th Street 060850002 24.4
BA
San Jose-Jackson 060850005 32.2 Bakersfield-410 E Planz Road 060290016 61 Bakersfield-California Avenue 060290014 54.8 Fresno-1st Street 060190008 62.5 Modesto-14th Street 060990005 88.3 Stockton-Hazelton Street 060771002 81.2
6/26/08
SJV
Visalia-N Church Street 061072002 63.3 FR Yuba City-Almond Street 061010003 105.5
Bakersfield-California Avenue 060290014 99.3 6/27/08
SJV Fresno-1st Street 060190008 79.5
FR Yuba City-Almond Street 061010003 29.1 Bakersfield-California Avenue 060290014 36
6/28/08 SJV
Fresno-1st Street 060190008 49.4
7/20/2009
25
DATE DISTRICT (listed North to South)
SITE NAME AIRS ID PM2.5 Conc (ug/m3)
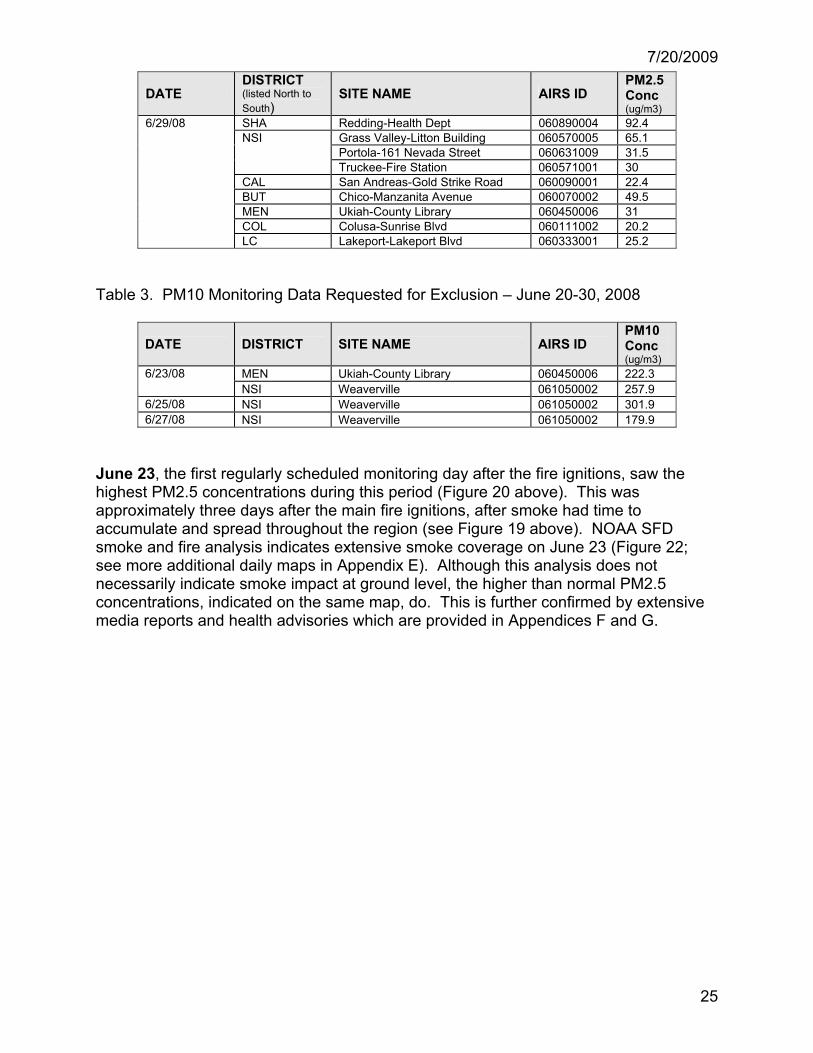
SHA Redding-Health Dept 060890004 92.4 Grass Valley-Litton Building 060570005 65.1 Portola-161 Nevada Street 060631009 31.5
NSI
Truckee-Fire Station 060571001 30 CAL San Andreas-Gold Strike Road 060090001 22.4 BUT Chico-Manzanita Avenue 060070002 49.5 MEN Ukiah-County Library 060450006 31 COL Colusa-Sunrise Blvd 060111002 20.2
6/29/08
LC Lakeport-Lakeport Blvd 060333001 25.2 Table 3. PM10 Monitoring Data Requested for Exclusion – June 20-30, 2008
DATE DISTRICT SITE NAME AIRS ID PM10 Conc (ug/m3)
MEN Ukiah-County Library 060450006 222.3 6/23/08 NSI Weaverville 061050002 257.9
6/25/08 NSI Weaverville 061050002 301.9 6/27/08 NSI Weaverville 061050002 179.9
June 23, the first regularly scheduled monitoring day after the fire ignitions, saw the highest PM2.5 concentrations during this period (Figure 20 above). This was approximately three days after the main fire ignitions, after smoke had time to accumulate and spread throughout the region (see Figure 19 above). NOAA SFD smoke and fire analysis indicates extensive smoke coverage on June 23 (Figure 22; see more additional daily maps in Appendix E). Although this analysis does not necessarily indicate smoke impact at ground level, the higher than normal PM2.5 concentrations, indicated on the same map, do. This is further confirmed by extensive media reports and health advisories which are provided in Appendices F and G.

7/20/2009
26
Figure 22. PM2.5 Mass Concentrations and Smoke – June 23, 2008
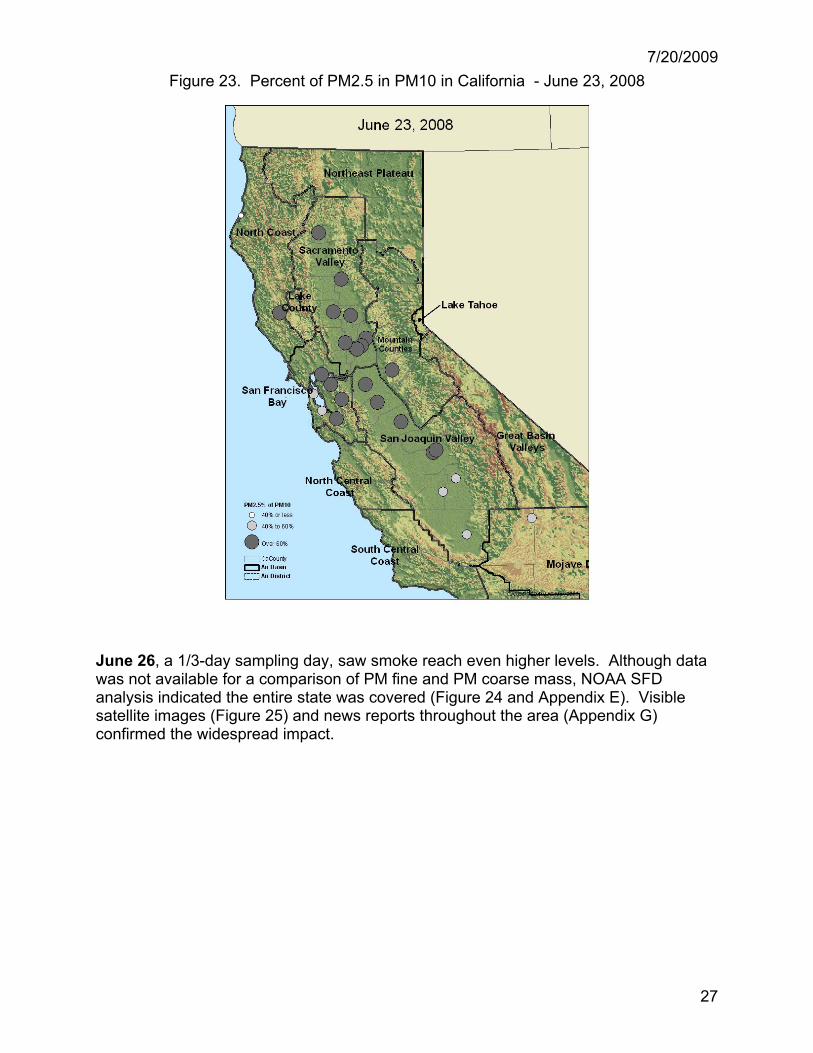
The high PM10 concentrations seen at some of the sites were also indicative of these extreme smoke impacts; with the majority of the PM10 in the fine (0 to 2.5 micron) range. The higher proportion of fine PM to coarse can be readily seen in Figure 23 where the majority of sites reported over half of PM mass in the fine fraction. The highest PM fine/coarse ratios were seen at sites in the northern part of the state, particularly Chico (84%), Redding (86%), Roseville (81%), and Ukiah (95%).
7/20/2009
27
Figure 23. Percent of PM2.5 in PM10 in California - June 23, 2008
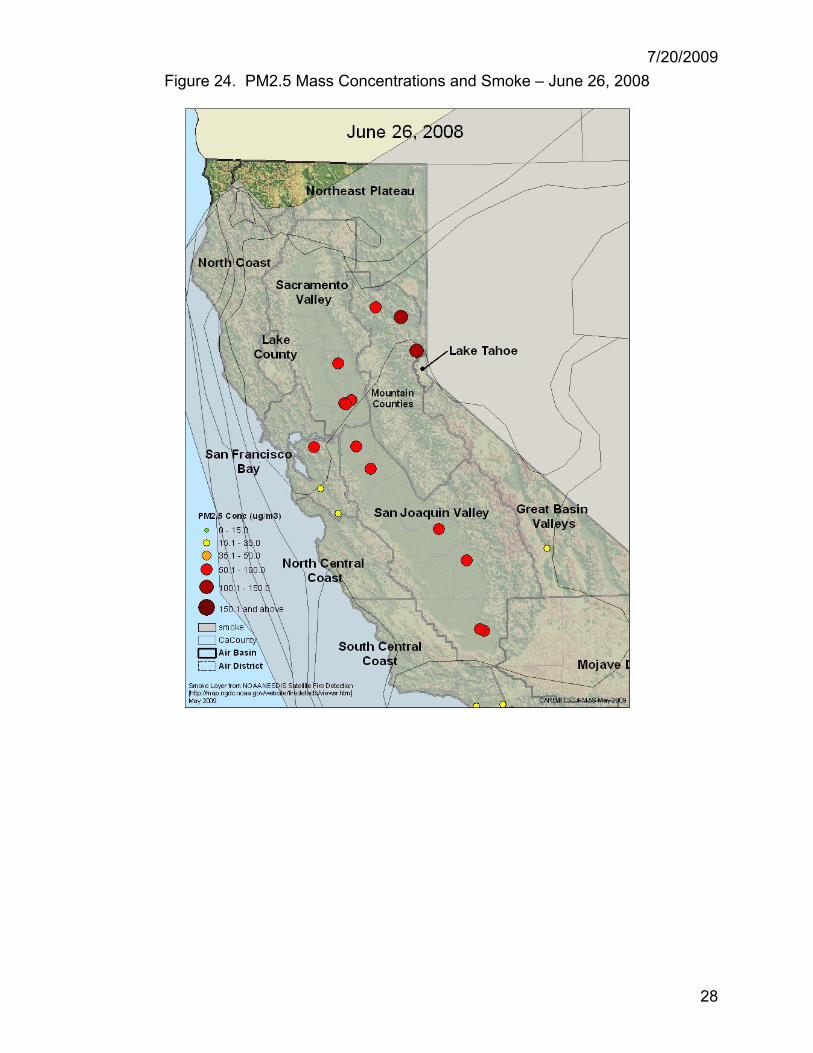
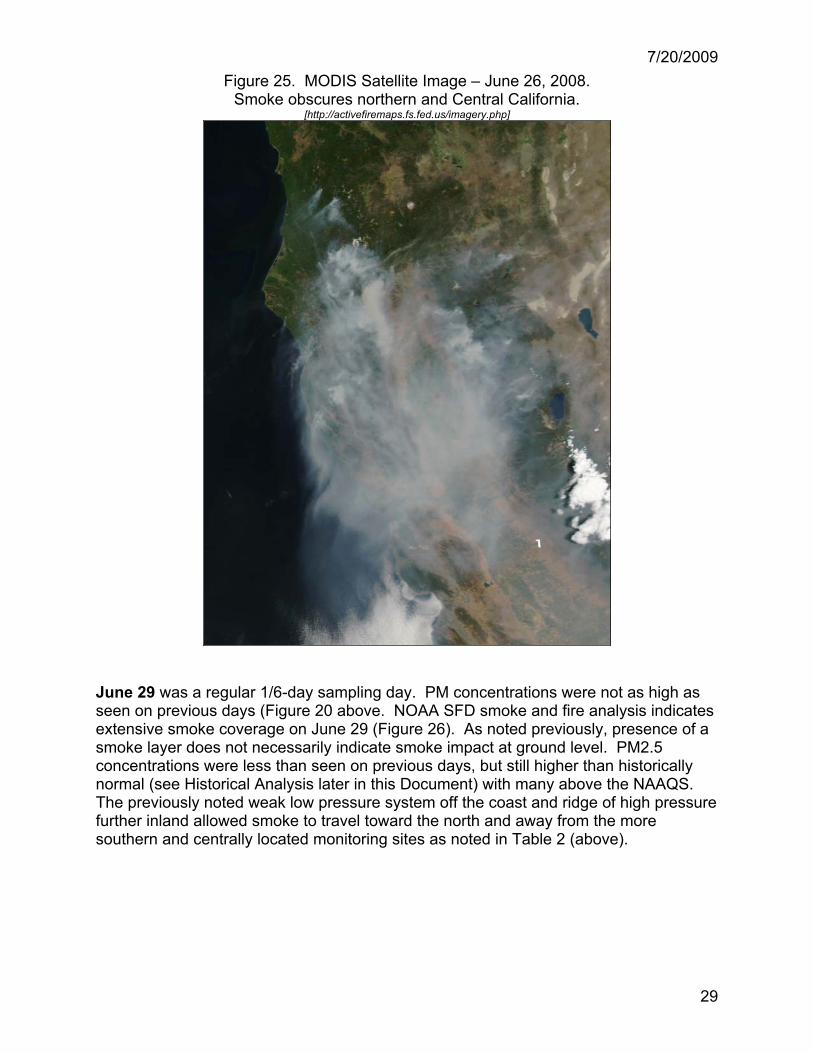
June 26, a 1/3-day sampling day, saw smoke reach even higher levels. Although data was not available for a comparison of PM fine and PM coarse mass, NOAA SFD analysis indicated the entire state was covered (Figure 24 and Appendix E). Visible satellite images (Figure 25) and news reports throughout the area (Appendix G) confirmed the widespread impact.
7/20/2009
28
Figure 24. PM2.5 Mass Concentrations and Smoke – June 26, 2008
7/20/2009
29
Figure 25. MODIS Satellite Image – June 26, 2008. Smoke obscures northern and Central California.
[http://activefiremaps.fs.fed.us/imagery.php]
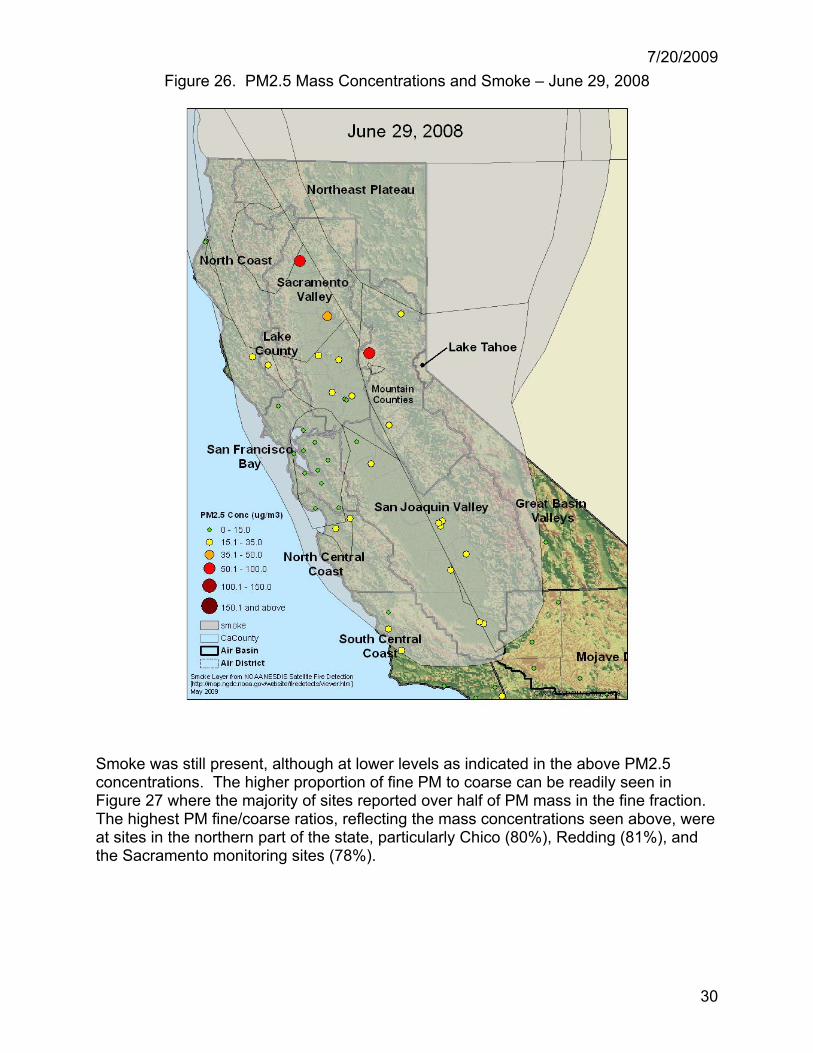
June 29 was a regular 1/6-day sampling day. PM concentrations were not as high as seen on previous days (Figure 20 above. NOAA SFD smoke and fire analysis indicates extensive smoke coverage on June 29 (Figure 26). As noted previously, presence of a smoke layer does not necessarily indicate smoke impact at ground level. PM2.5 concentrations were less than seen on previous days, but still higher than historically normal (see Historical Analysis later in this Document) with many above the NAAQS. The previously noted weak low pressure system off the coast and ridge of high pressure further inland allowed smoke to travel toward the north and away from the more southern and centrally located monitoring sites as noted in Table 2 (above).
7/20/2009
30
Figure 26. PM2.5 Mass Concentrations and Smoke – June 29, 2008
Smoke was still present, although at lower levels as indicated in the above PM2.5 concentrations. The higher proportion of fine PM to coarse can be readily seen in Figure 27 where the majority of sites reported over half of PM mass in the fine fraction. The highest PM fine/coarse ratios, reflecting the mass concentrations seen above, were at sites in the northern part of the state, particularly Chico (80%), Redding (81%), and the Sacramento monitoring sites (78%).

7/20/2009
31
Figure 27. Percent of PM2.5 in PM10 in California - June 29, 2008
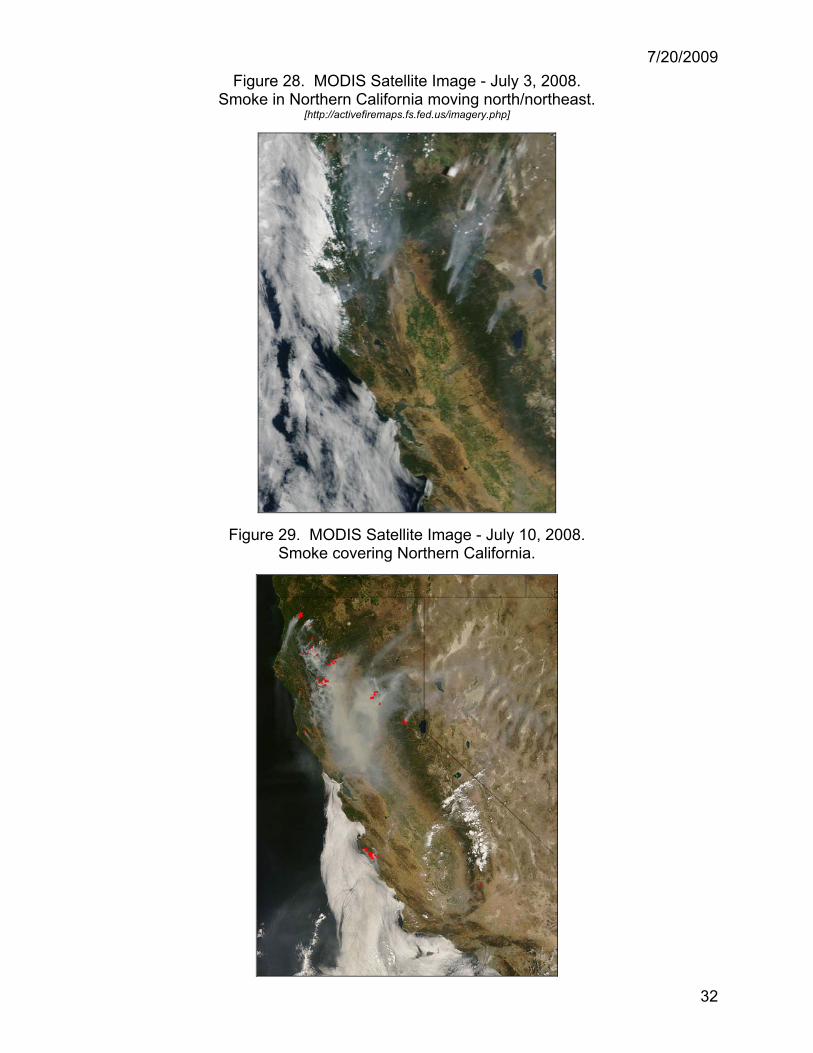
Episode 2: July 1 to July 15: An upper level low pressure system out of the Gulf of Alaska brought southwestern winds over Northern California. This allowed for smoke movement toward the north/northeast (Figure 28). Smoke transport increased with the strengthening of this system over the early part of July (Appendices B and C). By the end of the first week in July, the Alaskan low pressure system had given way to a developing surface high that resulted in decreased winds and a more stable atmosphere in Northern California. Smoke increased significantly in the Sacramento and San Joaquin Valleys as noted in the satellite image from July 10 (Figure 29) and in Appendices C and E. The upper level high that developed over Central California allowed winds to shift towards the west, evident in diminishing air quality in Reno, Nevada, where the National Weather Service issued an “air stagnation alert” (Appendix F). In general, this pattern of western winds remained until mid-July, when the upper level conditions were conducive to shifting surface winds to the south/southwest, alleviating some of the smoky and hazy conditions at some, but not all, of the monitoring sites.
7/20/2009
32
Figure 28. MODIS Satellite Image - July 3, 2008. Smoke in Northern California moving north/northeast.
[http://activefiremaps.fs.fed.us/imagery.php]
Figure 29. MODIS Satellite Image - July 10, 2008. Smoke covering Northern California.
7/20/2009
33
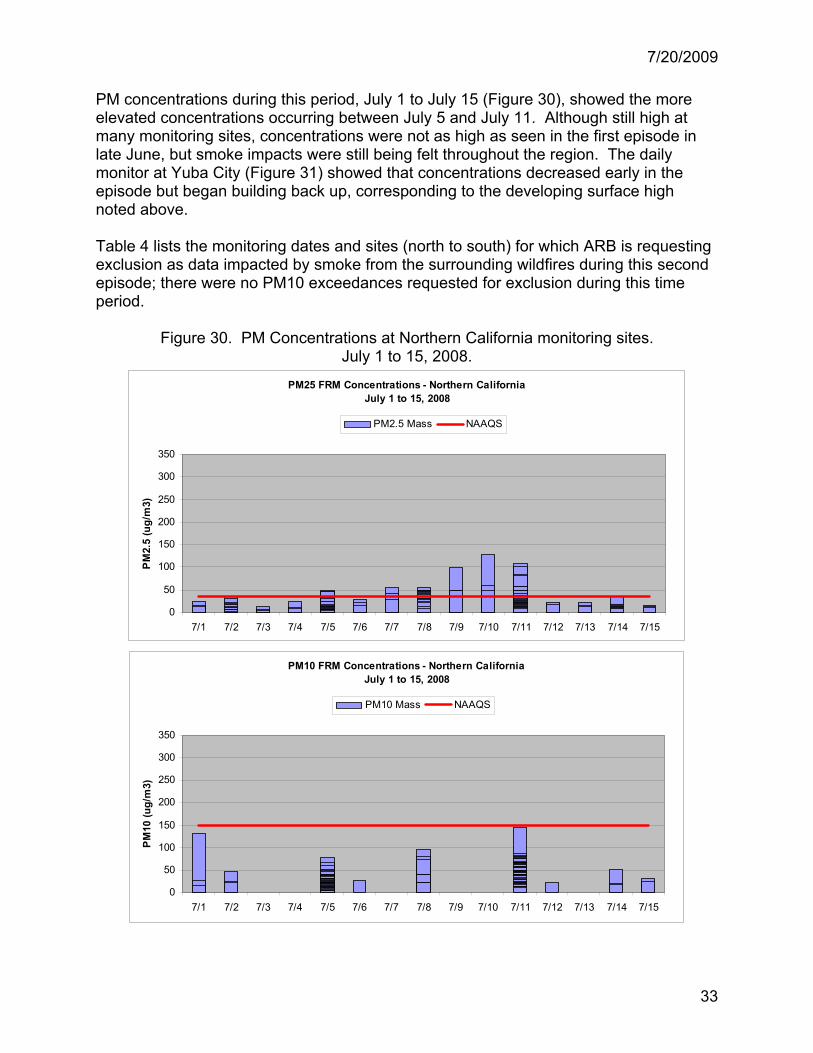
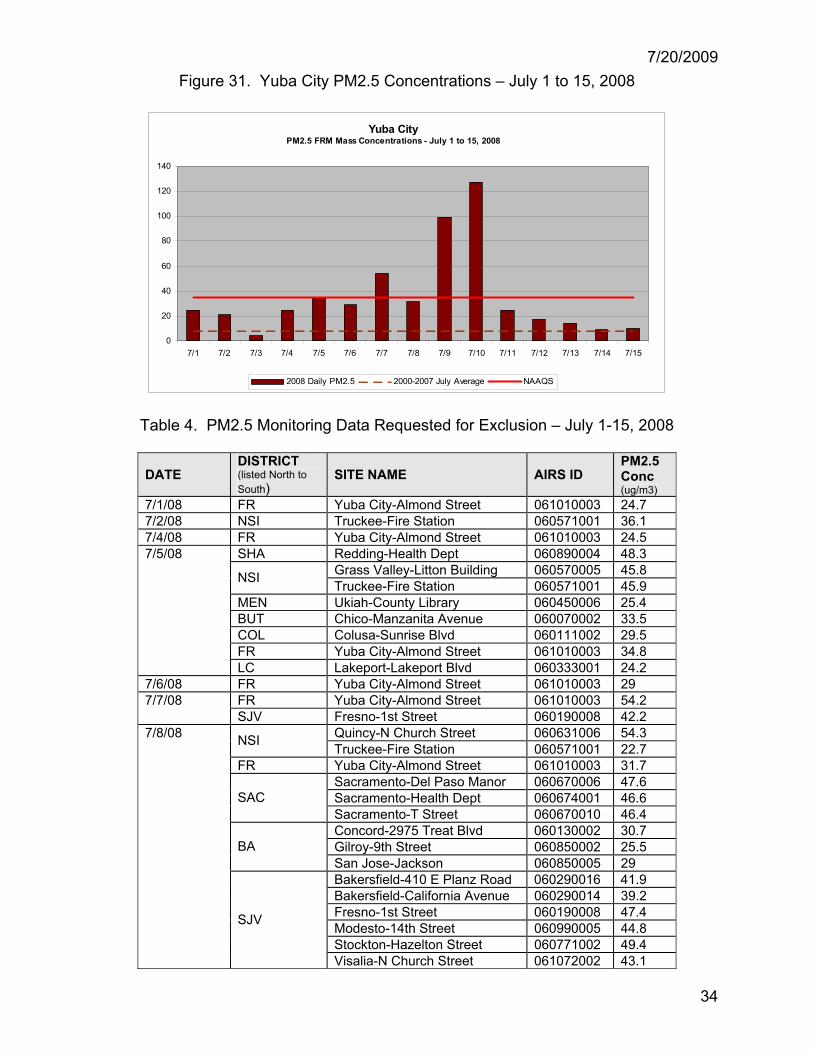
PM concentrations during this period, July 1 to July 15 (Figure 30), showed the more elevated concentrations occurring between July 5 and July 11. Although still high at many monitoring sites, concentrations were not as high as seen in the first episode in late June, but smoke impacts were still being felt throughout the region. The daily monitor at Yuba City (Figure 31) showed that concentrations decreased early in the episode but began building back up, corresponding to the developing surface high noted above. Table 4 lists the monitoring dates and sites (north to south) for which ARB is requesting exclusion as data impacted by smoke from the surrounding wildfires during this second episode; there were no PM10 exceedances requested for exclusion during this time period.
Figure 30. PM Concentrations at Northern California monitoring sites. July 1 to 15, 2008.
PM25 FRM Concentrations - Northern CaliforniaJuly 1 to 15, 2008
0
50
100
150
200
250
300
350
7/1 7/2 7/3 7/4 7/5 7/6 7/7 7/8 7/9 7/10 7/11 7/12 7/13 7/14 7/15
PM2.
5 (u
g/m
3)
PM2.5 Mass NAAQS
PM10 FRM Concentrations - Northern California
July 1 to 15, 2008
0
50
100
150
200
250
300
350
7/1 7/2 7/3 7/4 7/5 7/6 7/7 7/8 7/9 7/10 7/11 7/12 7/13 7/14 7/15
PM10
(ug/
m3)
PM10 Mass NAAQS
7/20/2009
34
Figure 31. Yuba City PM2.5 Concentrations – July 1 to 15, 2008
Yuba CityPM2.5 FRM Mass Concentrations - July 1 to 15, 2008
0
20
40
60
80
100
120
140
7/1 7/2 7/3 7/4 7/5 7/6 7/7 7/8 7/9 7/10 7/11 7/12 7/13 7/14 7/15
2008 Daily PM2.5 2000-2007 July Average NAAQS
Table 4. PM2.5 Monitoring Data Requested for Exclusion – July 1-15, 2008
DATE DISTRICT (listed North to South)
SITE NAME AIRS ID PM2.5 Conc (ug/m3)
7/1/08 FR Yuba City-Almond Street 061010003 24.7 7/2/08 NSI Truckee-Fire Station 060571001 36.1 7/4/08 FR Yuba City-Almond Street 061010003 24.5
SHA Redding-Health Dept 060890004 48.3 Grass Valley-Litton Building 060570005 45.8 NSI Truckee-Fire Station 060571001 45.9
MEN Ukiah-County Library 060450006 25.4 BUT Chico-Manzanita Avenue 060070002 33.5 COL Colusa-Sunrise Blvd 060111002 29.5 FR Yuba City-Almond Street 061010003 34.8
7/5/08
LC Lakeport-Lakeport Blvd 060333001 24.2 7/6/08 FR Yuba City-Almond Street 061010003 29
FR Yuba City-Almond Street 061010003 54.2 7/7/08 SJV Fresno-1st Street 060190008 42.2
Quincy-N Church Street 060631006 54.3 NSI Truckee-Fire Station 060571001 22.7 FR Yuba City-Almond Street 061010003 31.7
Sacramento-Del Paso Manor 060670006 47.6 Sacramento-Health Dept 060674001 46.6 SAC Sacramento-T Street 060670010 46.4 Concord-2975 Treat Blvd 060130002 30.7 Gilroy-9th Street 060850002 25.5 BA San Jose-Jackson 060850005 29 Bakersfield-410 E Planz Road 060290016 41.9 Bakersfield-California Avenue 060290014 39.2 Fresno-1st Street 060190008 47.4 Modesto-14th Street 060990005 44.8 Stockton-Hazelton Street 060771002 49.4
7/8/08
SJV
Visalia-N Church Street 061072002 43.1
7/20/2009
35
DATE DISTRICT (listed North to South)
SITE NAME AIRS ID PM2.5 Conc (ug/m3)
FR Yuba City-Almond Street 061010003 99 Bakersfield-California Avenue 060290014 47
7/9/08
SJV Fresno-1st Street 060190008 48.8 FR Yuba City-Almond Street 061010003 127.3
Bakersfield-California Avenue 060290014 48.4 7/10/08
SJV Fresno-1st Street 060190008 60.8 SHA Redding-Health Dept 060890004 18
Grass Valley-Litton Building 060570005 102.2 Portola-161 Nevada Street 060631009 56 Quincy-N Church Street 060631006 85.5 NSI
Truckee-Fire Station 060571001 81.2
CAL San Andreas-Gold Strike Road 060090001 48.8
BUT Chico-Manzanita Avenue 060070002 107.6 MEN Ukiah-County Library 060450006 31.6 COL Colusa-Sunrise Blvd 060111002 24.8 FR Yuba City-Almond Street 061010003 24.5 LC Lakeport-Lakeport Blvd 060333001 59.2
Clovis-N Villa Avenue 060195001 47.5 Fresno-1st Street 060190008 36.5
7/11/08
SJV Fresno-Hamilton and Winery 060195025 41.5
7/14/08 NSI Truckee-Fire Station 060571001 36.1 July 2, the first regular monitoring day (a 1/3-day monitoring day) in this episode, saw much lower concentrations (Figure 32) with a decrease in the smoke layer covering the region. Only one site, Truckee in the Northern Sierra AQMD, experienced concentrations above the NAAQS (see Table 4 above). Although SFD smoke layers are not shown above Truckee, a slight wind shift brought smoke into the area, increasing particulate levels and prompting the local Air District to issue an Air Quality Alert (Appendix F). No prescribed burning was allowed for this area, and had not been allowed since June 24 (Appendix H).

7/20/2009
36
Figure 32. PM2.5 Mass Concentrations and Smoke – July 2, 2008
7/20/2009
37
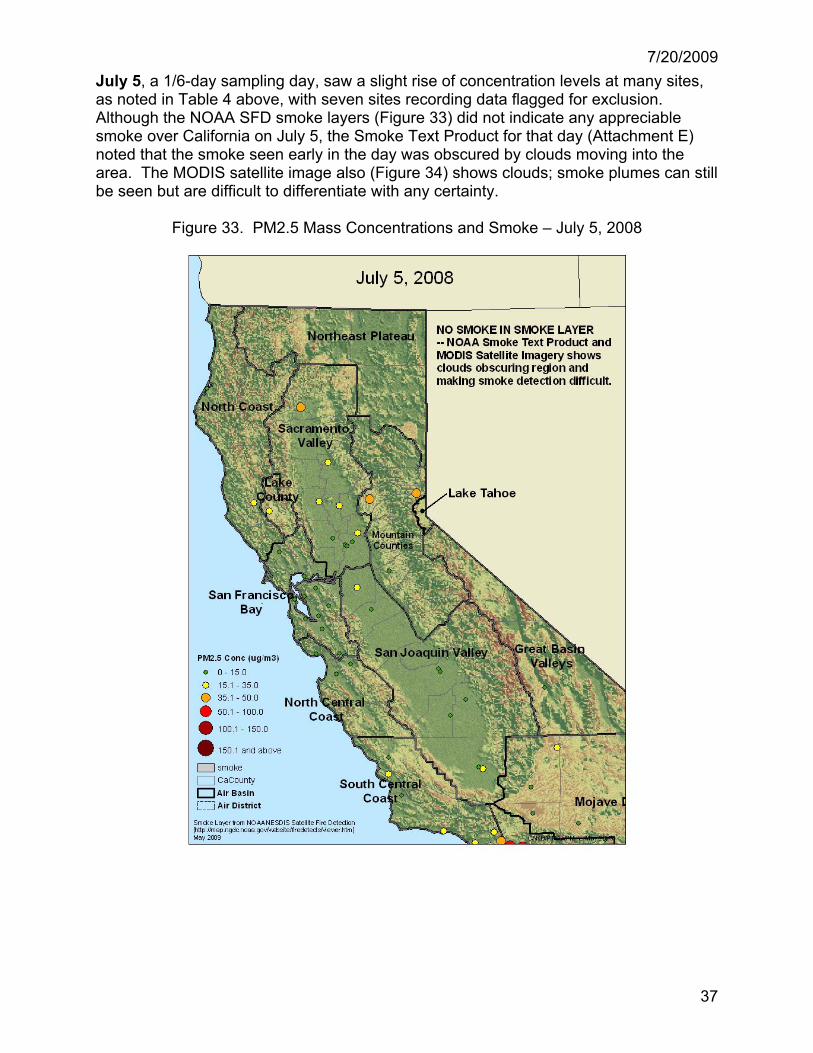
July 5, a 1/6-day sampling day, saw a slight rise of concentration levels at many sites, as noted in Table 4 above, with seven sites recording data flagged for exclusion. Although the NOAA SFD smoke layers (Figure 33) did not indicate any appreciable smoke over California on July 5, the Smoke Text Product for that day (Attachment E) noted that the smoke seen early in the day was obscured by clouds moving into the area. The MODIS satellite image also (Figure 34) shows clouds; smoke plumes can still be seen but are difficult to differentiate with any certainty.
Figure 33. PM2.5 Mass Concentrations and Smoke – July 5, 2008
7/20/2009
38
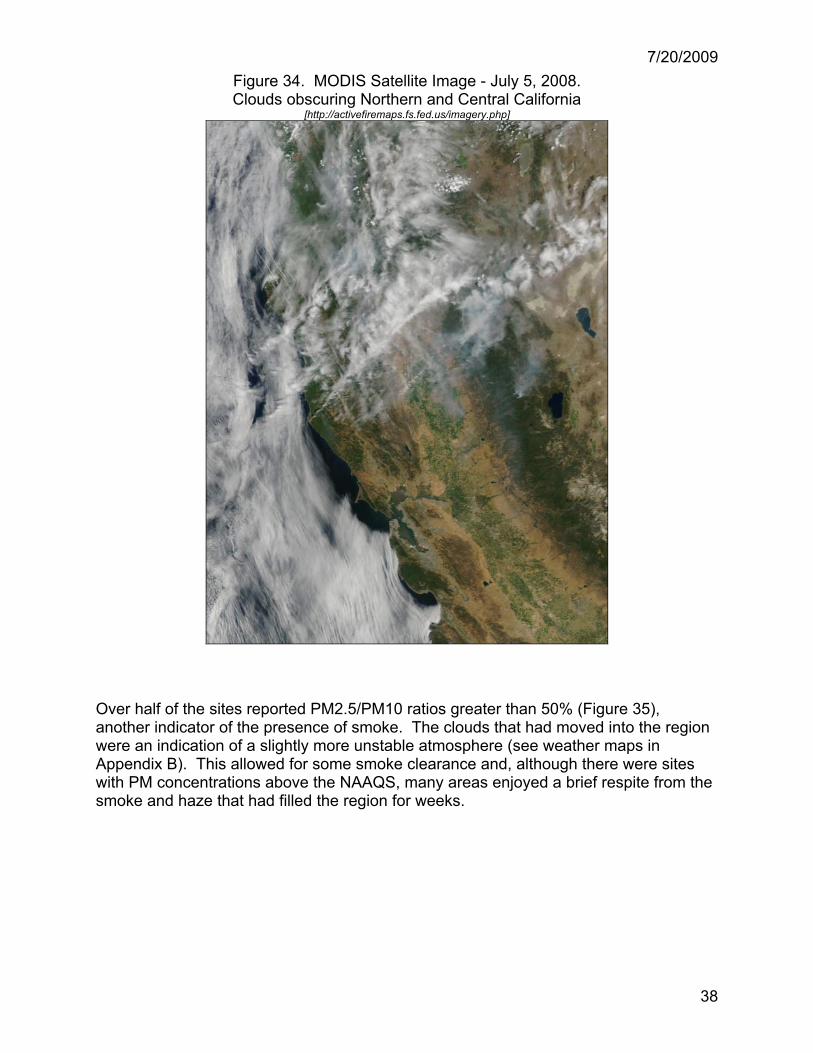
Figure 34. MODIS Satellite Image - July 5, 2008. Clouds obscuring Northern and Central California
[http://activefiremaps.fs.fed.us/imagery.php]
Over half of the sites reported PM2.5/PM10 ratios greater than 50% (Figure 35), another indicator of the presence of smoke. The clouds that had moved into the region were an indication of a slightly more unstable atmosphere (see weather maps in Appendix B). This allowed for some smoke clearance and, although there were sites with PM concentrations above the NAAQS, many areas enjoyed a brief respite from the smoke and haze that had filled the region for weeks.
7/20/2009
39
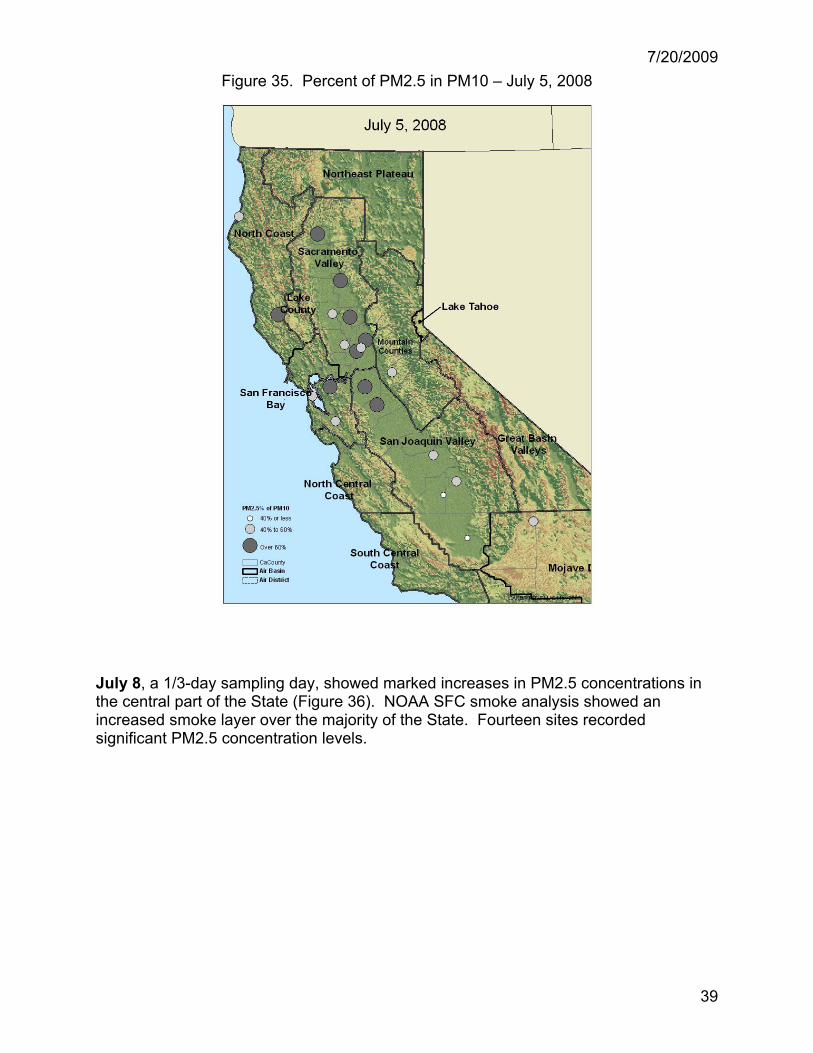
Figure 35. Percent of PM2.5 in PM10 – July 5, 2008
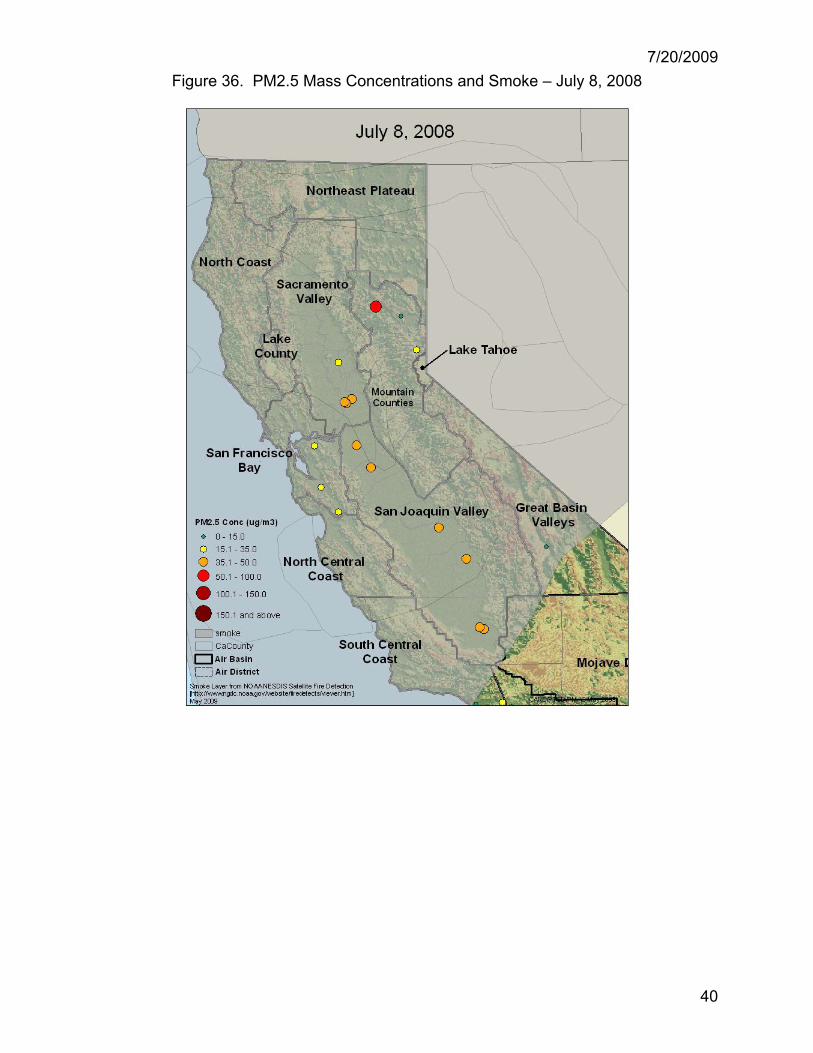
July 8, a 1/3-day sampling day, showed marked increases in PM2.5 concentrations in the central part of the State (Figure 36). NOAA SFC smoke analysis showed an increased smoke layer over the majority of the State. Fourteen sites recorded significant PM2.5 concentration levels.
7/20/2009
40
Figure 36. PM2.5 Mass Concentrations and Smoke – July 8, 2008
7/20/2009
41
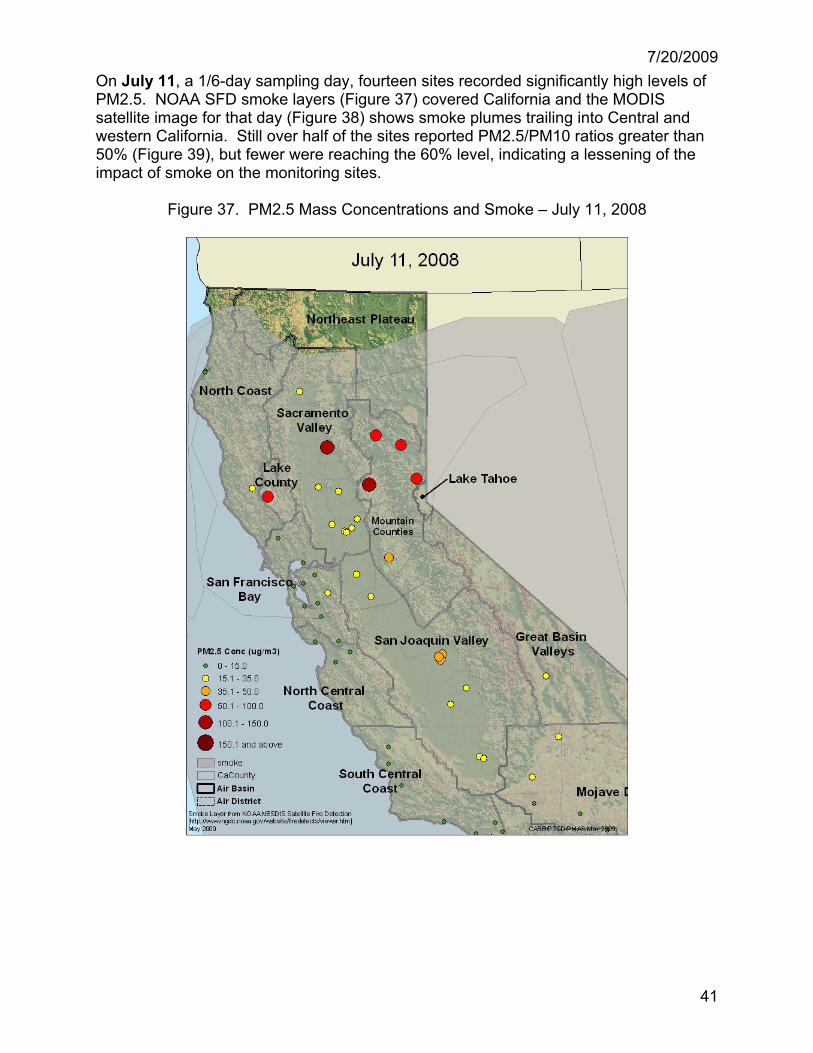
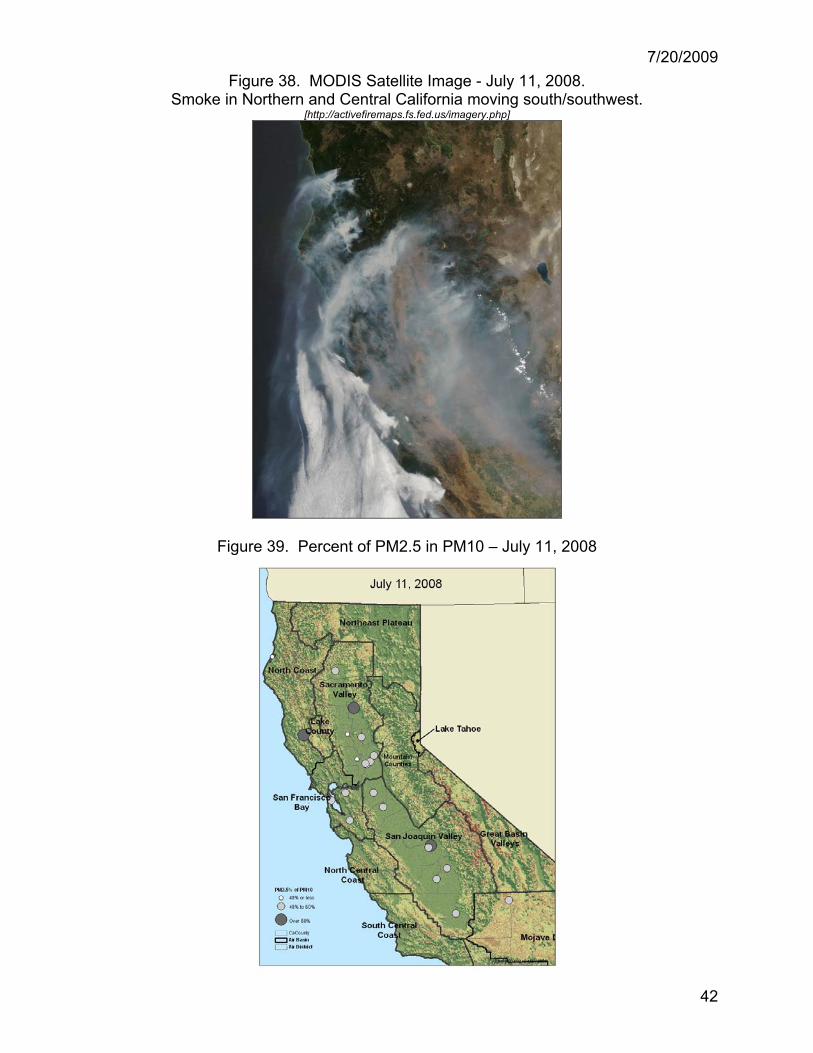
On July 11, a 1/6-day sampling day, fourteen sites recorded significantly high levels of PM2.5. NOAA SFD smoke layers (Figure 37) covered California and the MODIS satellite image for that day (Figure 38) shows smoke plumes trailing into Central and western California. Still over half of the sites reported PM2.5/PM10 ratios greater than 50% (Figure 39), but fewer were reaching the 60% level, indicating a lessening of the impact of smoke on the monitoring sites.
Figure 37. PM2.5 Mass Concentrations and Smoke – July 11, 2008
7/20/2009
42
Figure 38. MODIS Satellite Image - July 11, 2008. Smoke in Northern and Central California moving south/southwest.
[http://activefiremaps.fs.fed.us/imagery.php]
Figure 39. Percent of PM2.5 in PM10 – July 11, 2008
7/20/2009
43
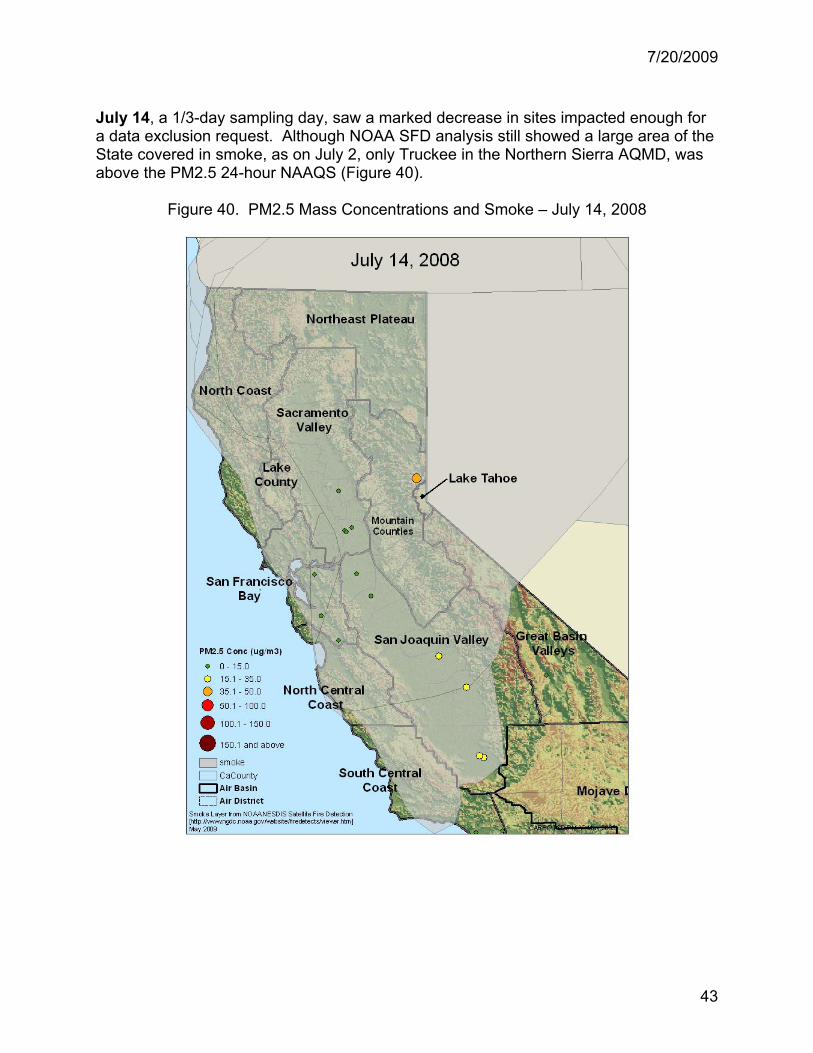
July 14, a 1/3-day sampling day, saw a marked decrease in sites impacted enough for a data exclusion request. Although NOAA SFD analysis still showed a large area of the State covered in smoke, as on July 2, only Truckee in the Northern Sierra AQMD, was above the PM2.5 24-hour NAAQS (Figure 40).
Figure 40. PM2.5 Mass Concentrations and Smoke – July 14, 2008
7/20/2009
44
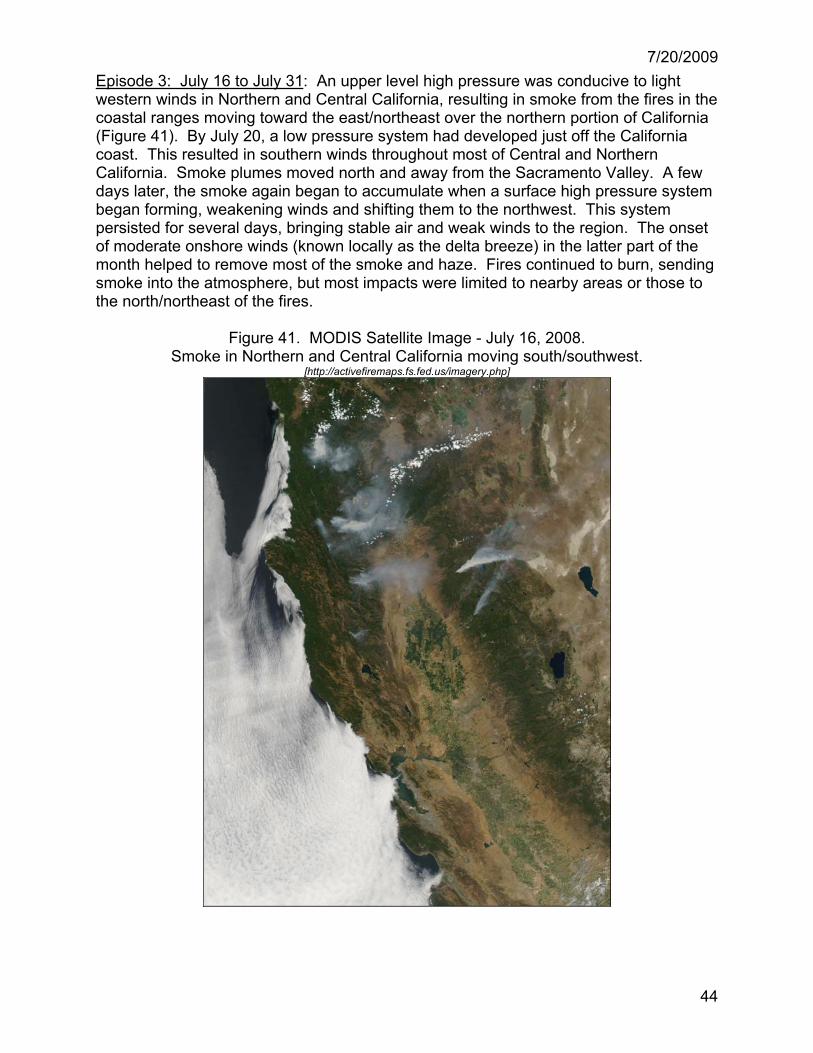
Episode 3: July 16 to July 31: An upper level high pressure was conducive to light western winds in Northern and Central California, resulting in smoke from the fires in the coastal ranges moving toward the east/northeast over the northern portion of California (Figure 41). By July 20, a low pressure system had developed just off the California coast. This resulted in southern winds throughout most of Central and Northern California. Smoke plumes moved north and away from the Sacramento Valley. A few days later, the smoke again began to accumulate when a surface high pressure system began forming, weakening winds and shifting them to the northwest. This system persisted for several days, bringing stable air and weak winds to the region. The onset of moderate onshore winds (known locally as the delta breeze) in the latter part of the month helped to remove most of the smoke and haze. Fires continued to burn, sending smoke into the atmosphere, but most impacts were limited to nearby areas or those to the north/northeast of the fires.
Figure 41. MODIS Satellite Image - July 16, 2008. Smoke in Northern and Central California moving south/southwest.
[http://activefiremaps.fs.fed.us/imagery.php]
7/20/2009
45
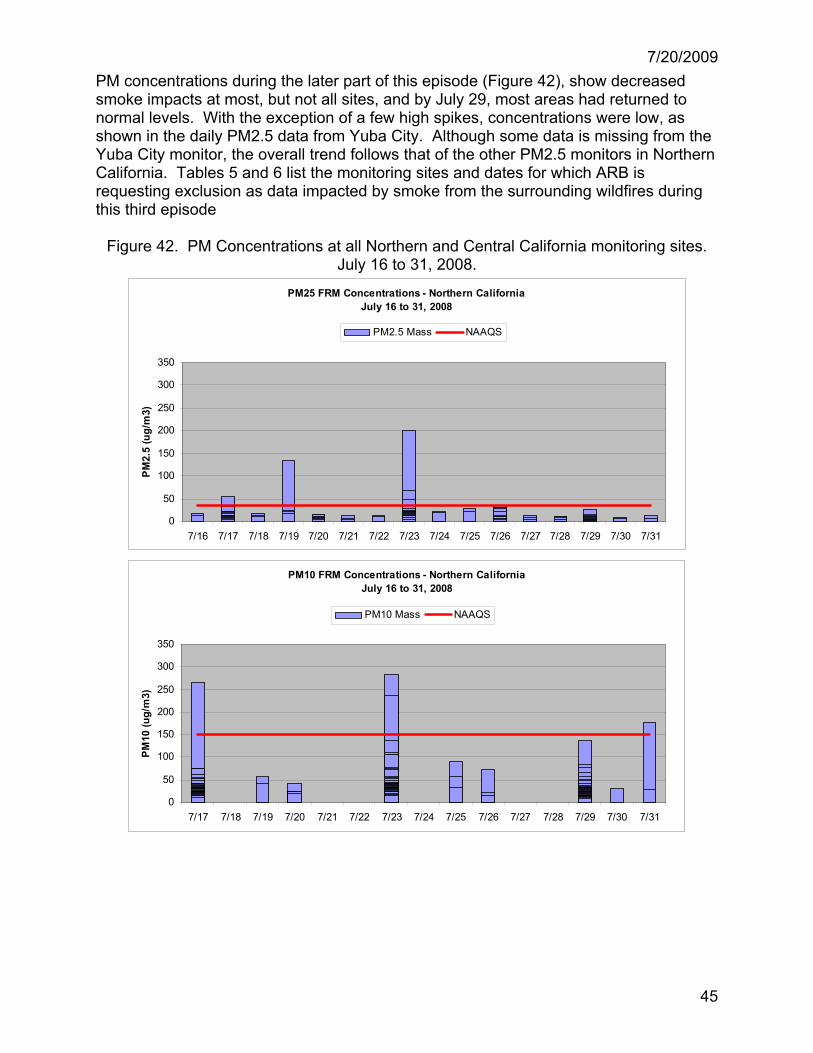
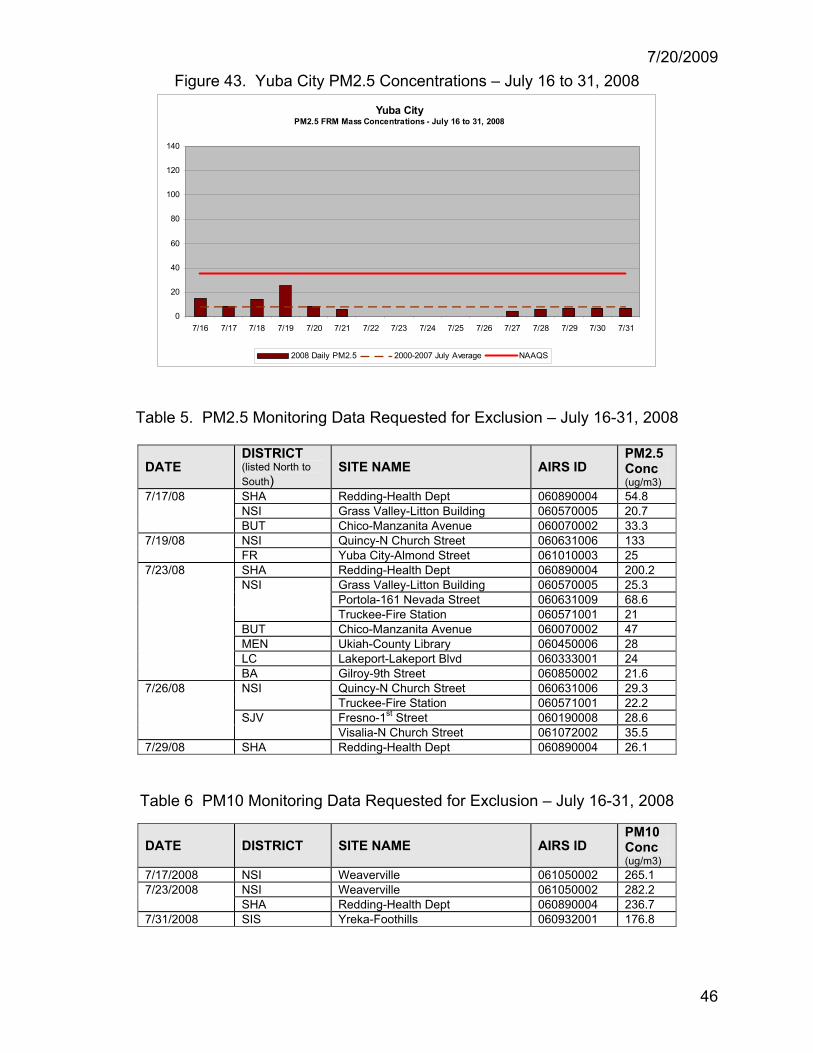
PM concentrations during the later part of this episode (Figure 42), show decreased smoke impacts at most, but not all sites, and by July 29, most areas had returned to normal levels. With the exception of a few high spikes, concentrations were low, as shown in the daily PM2.5 data from Yuba City. Although some data is missing from the Yuba City monitor, the overall trend follows that of the other PM2.5 monitors in Northern California. Tables 5 and 6 list the monitoring sites and dates for which ARB is requesting exclusion as data impacted by smoke from the surrounding wildfires during this third episode
Figure 42. PM Concentrations at all Northern and Central California monitoring sites. July 16 to 31, 2008.
PM25 FRM Concentrations - Northern CaliforniaJuly 16 to 31, 2008
0
50
100
150
200
250
300
350
7/16 7/17 7/18 7/19 7/20 7/21 7/22 7/23 7/24 7/25 7/26 7/27 7/28 7/29 7/30 7/31
PM2.
5 (u
g/m
3)
PM2.5 Mass NAAQS
PM10 FRM Concentrations - Northern California
July 16 to 31, 2008
0
50
100
150
200
250
300
350
7/17 7/18 7/19 7/20 7/21 7/22 7/23 7/24 7/25 7/26 7/27 7/28 7/29 7/30 7/31
PM10
(ug/
m3)
PM10 Mass NAAQS
7/20/2009
46
Figure 43. Yuba City PM2.5 Concentrations – July 16 to 31, 2008
Yuba CityPM2.5 FRM Mass Concentrations - July 16 to 31, 2008
0
20
40
60
80
100
120
140
7/16 7/17 7/18 7/19 7/20 7/21 7/22 7/23 7/24 7/25 7/26 7/27 7/28 7/29 7/30 7/31
2008 Daily PM2.5 2000-2007 July Average NAAQS
Table 5. PM2.5 Monitoring Data Requested for Exclusion – July 16-31, 2008
DATE DISTRICT (listed North to South)
SITE NAME AIRS ID PM2.5 Conc (ug/m3)
SHA Redding-Health Dept 060890004 54.8 NSI Grass Valley-Litton Building 060570005 20.7
7/17/08
BUT Chico-Manzanita Avenue 060070002 33.3 NSI Quincy-N Church Street 060631006 133 7/19/08 FR Yuba City-Almond Street 061010003 25 SHA Redding-Health Dept 060890004 200.2
Grass Valley-Litton Building 060570005 25.3 Portola-161 Nevada Street 060631009 68.6
NSI
Truckee-Fire Station 060571001 21 BUT Chico-Manzanita Avenue 060070002 47 MEN Ukiah-County Library 060450006 28 LC Lakeport-Lakeport Blvd 060333001 24
7/23/08
BA Gilroy-9th Street 060850002 21.6 Quincy-N Church Street 060631006 29.3 NSI Truckee-Fire Station 060571001 22.2 Fresno-1st Street 060190008 28.6
7/26/08
SJV Visalia-N Church Street 061072002 35.5
7/29/08 SHA Redding-Health Dept 060890004 26.1
Table 6 PM10 Monitoring Data Requested for Exclusion – July 16-31, 2008
DATE DISTRICT SITE NAME AIRS ID PM10 Conc (ug/m3)
7/17/2008 NSI Weaverville 061050002 265.1 NSI Weaverville 061050002 282.2 7/23/2008 SHA Redding-Health Dept 060890004 236.7
7/31/2008 SIS Yreka-Foothills 060932001 176.8
7/20/2009
47
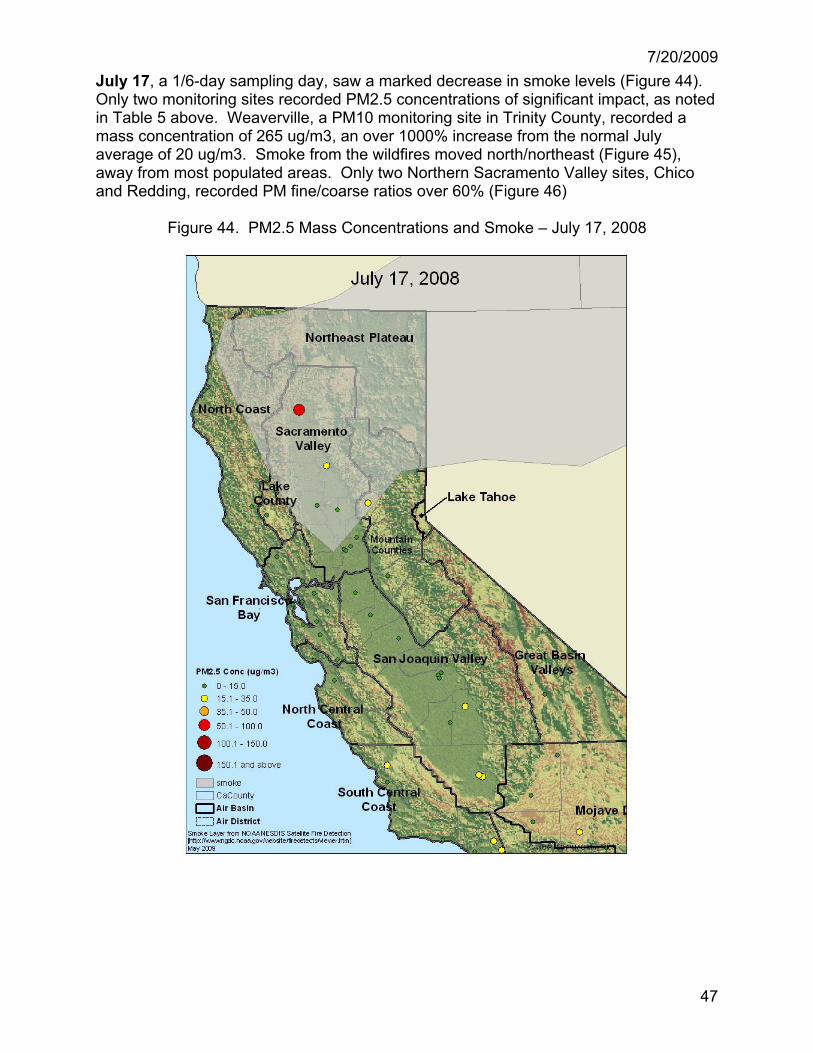
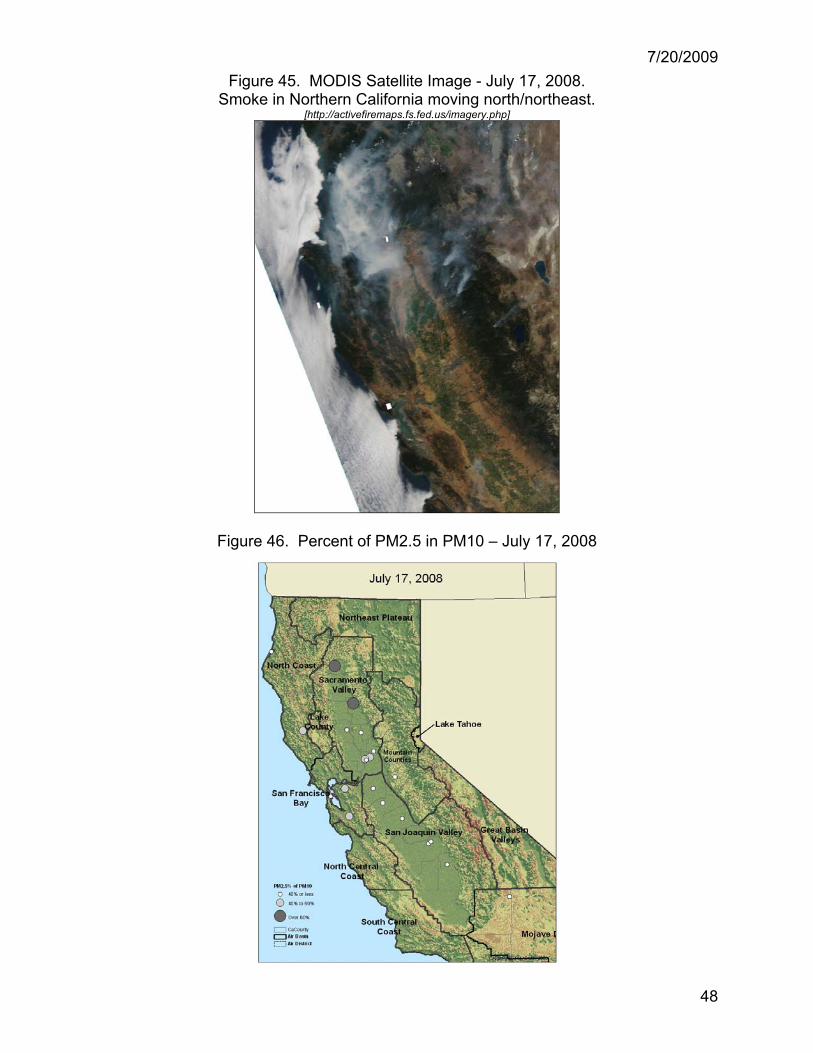
July 17, a 1/6-day sampling day, saw a marked decrease in smoke levels (Figure 44). Only two monitoring sites recorded PM2.5 concentrations of significant impact, as noted in Table 5 above. Weaverville, a PM10 monitoring site in Trinity County, recorded a mass concentration of 265 ug/m3, an over 1000% increase from the normal July average of 20 ug/m3. Smoke from the wildfires moved north/northeast (Figure 45), away from most populated areas. Only two Northern Sacramento Valley sites, Chico and Redding, recorded PM fine/coarse ratios over 60% (Figure 46)
Figure 44. PM2.5 Mass Concentrations and Smoke – July 17, 2008
7/20/2009
48
Figure 45. MODIS Satellite Image - July 17, 2008. Smoke in Northern California moving north/northeast.
[http://activefiremaps.fs.fed.us/imagery.php]
Figure 46. Percent of PM2.5 in PM10 – July 17, 2008
7/20/2009
49
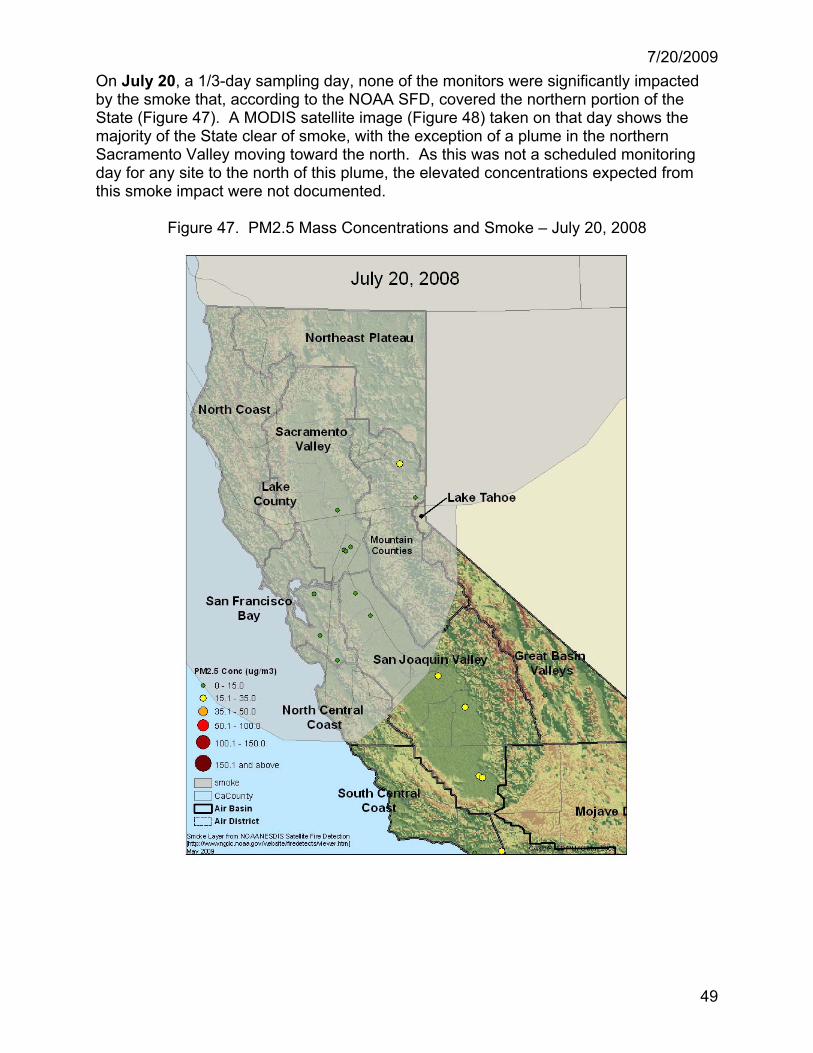
On July 20, a 1/3-day sampling day, none of the monitors were significantly impacted by the smoke that, according to the NOAA SFD, covered the northern portion of the State (Figure 47). A MODIS satellite image (Figure 48) taken on that day shows the majority of the State clear of smoke, with the exception of a plume in the northern Sacramento Valley moving toward the north. As this was not a scheduled monitoring day for any site to the north of this plume, the elevated concentrations expected from this smoke impact were not documented.
Figure 47. PM2.5 Mass Concentrations and Smoke – July 20, 2008
7/20/2009
50
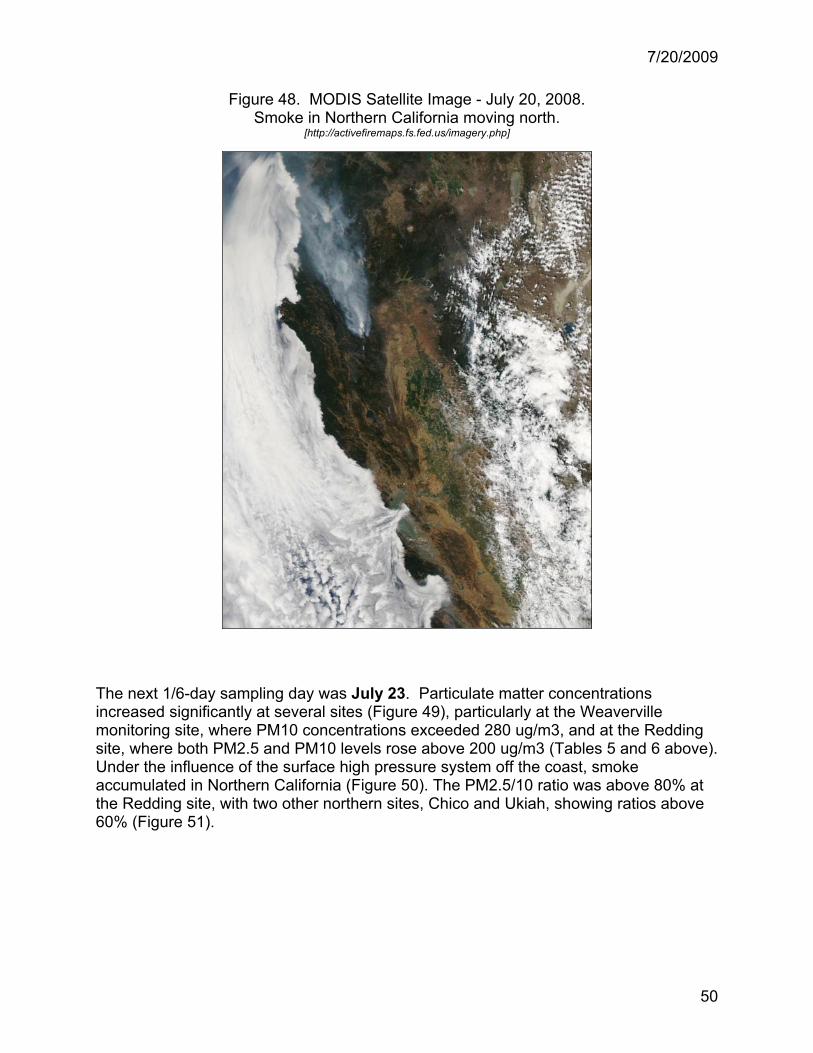
Figure 48. MODIS Satellite Image - July 20, 2008.
Smoke in Northern California moving north. [http://activefiremaps.fs.fed.us/imagery.php]
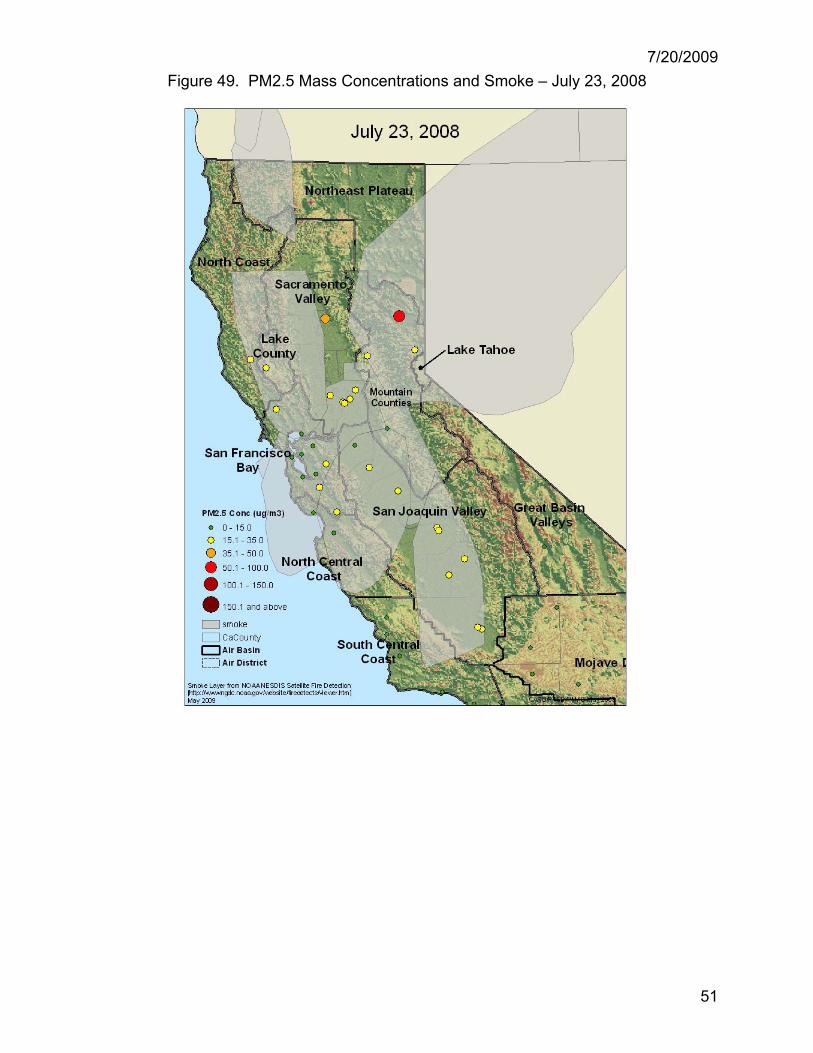
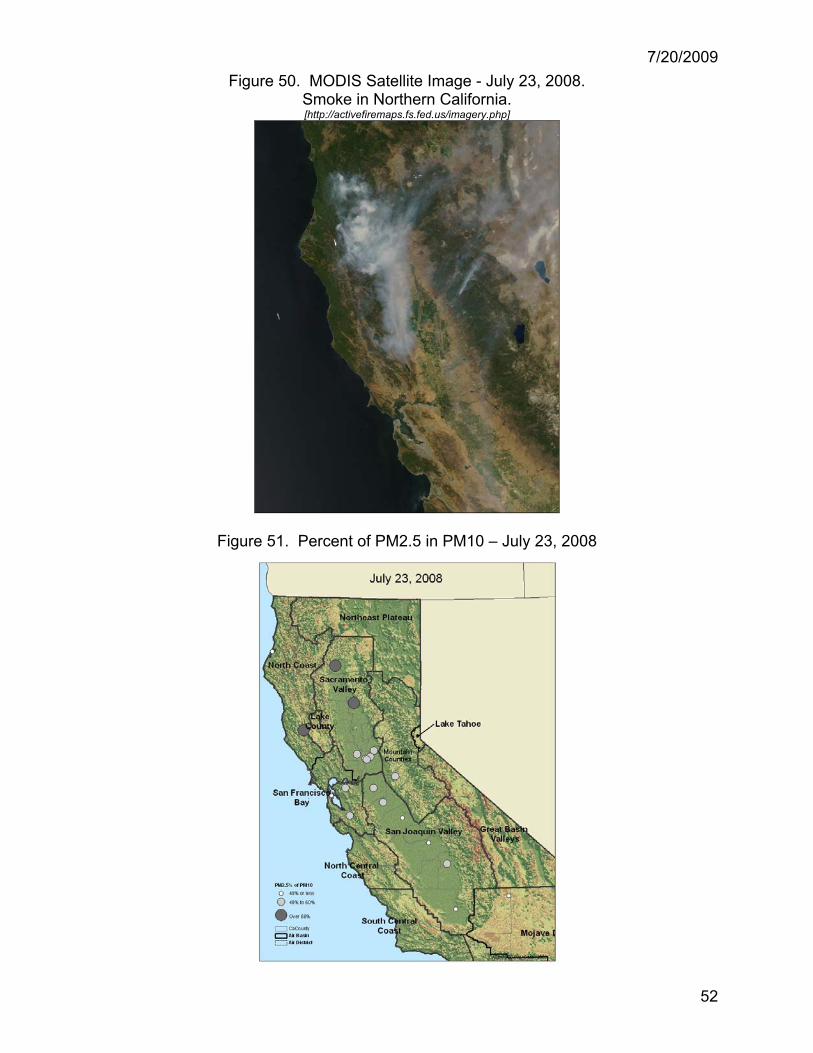
The next 1/6-day sampling day was July 23. Particulate matter concentrations increased significantly at several sites (Figure 49), particularly at the Weaverville monitoring site, where PM10 concentrations exceeded 280 ug/m3, and at the Redding site, where both PM2.5 and PM10 levels rose above 200 ug/m3 (Tables 5 and 6 above). Under the influence of the surface high pressure system off the coast, smoke accumulated in Northern California (Figure 50). The PM2.5/10 ratio was above 80% at the Redding site, with two other northern sites, Chico and Ukiah, showing ratios above 60% (Figure 51).
7/20/2009
51
Figure 49. PM2.5 Mass Concentrations and Smoke – July 23, 2008
7/20/2009
52
Figure 50. MODIS Satellite Image - July 23, 2008. Smoke in Northern California. [http://activefiremaps.fs.fed.us/imagery.php]
Figure 51. Percent of PM2.5 in PM10 – July 23, 2008
7/20/2009
53
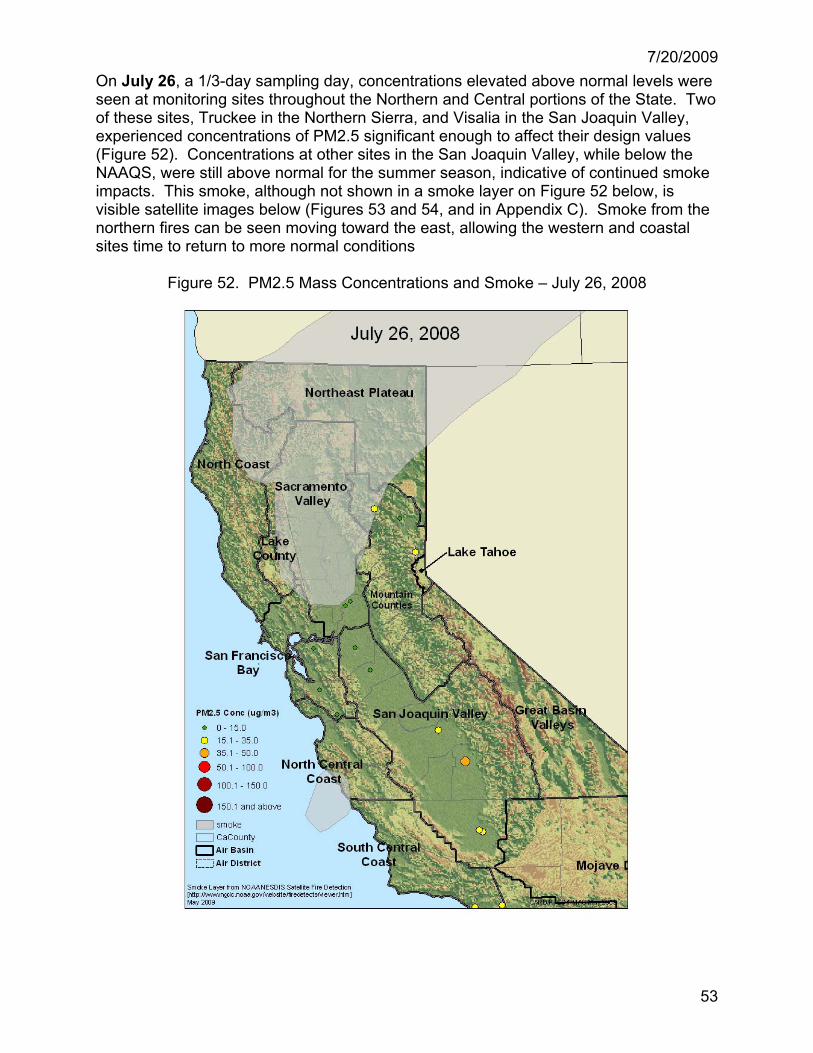
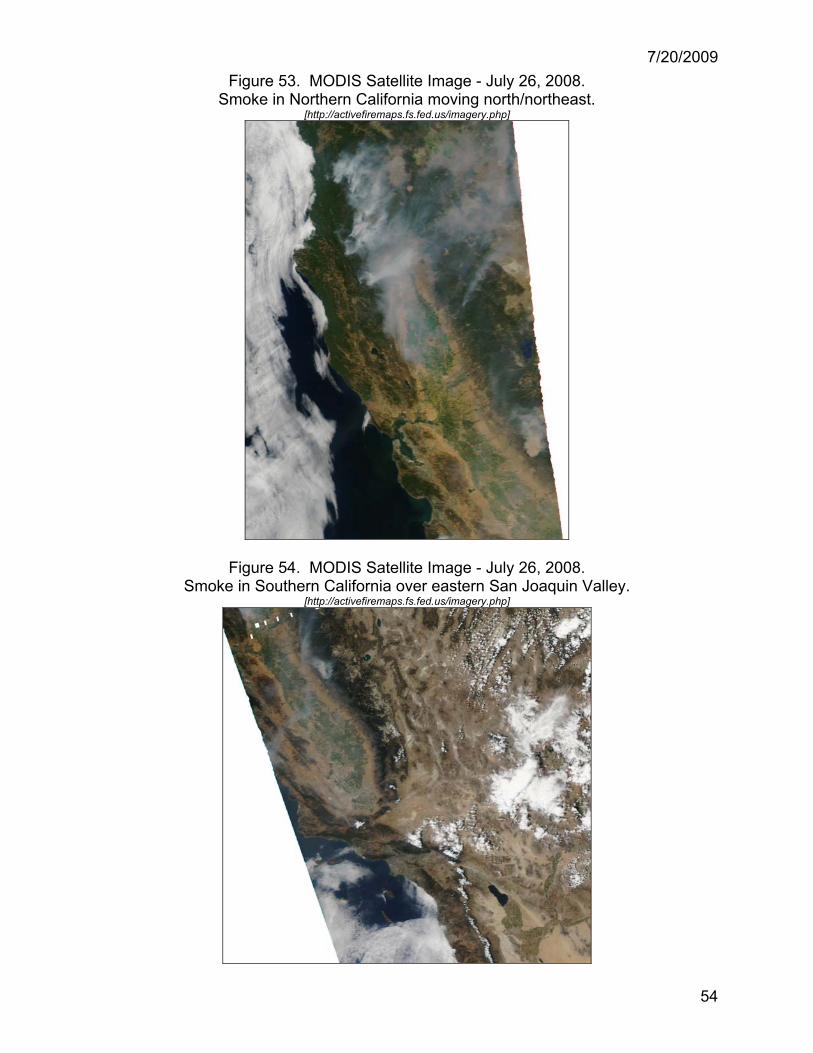
On July 26, a 1/3-day sampling day, concentrations elevated above normal levels were seen at monitoring sites throughout the Northern and Central portions of the State. Two of these sites, Truckee in the Northern Sierra, and Visalia in the San Joaquin Valley, experienced concentrations of PM2.5 significant enough to affect their design values (Figure 52). Concentrations at other sites in the San Joaquin Valley, while below the NAAQS, were still above normal for the summer season, indicative of continued smoke impacts. This smoke, although not shown in a smoke layer on Figure 52 below, is visible satellite images below (Figures 53 and 54, and in Appendix C). Smoke from the northern fires can be seen moving toward the east, allowing the western and coastal sites time to return to more normal conditions
Figure 52. PM2.5 Mass Concentrations and Smoke – July 26, 2008
7/20/2009
54
Figure 53. MODIS Satellite Image - July 26, 2008. Smoke in Northern California moving north/northeast.
[http://activefiremaps.fs.fed.us/imagery.php]
Figure 54. MODIS Satellite Image - July 26, 2008. Smoke in Southern California over eastern San Joaquin Valley.
[http://activefiremaps.fs.fed.us/imagery.php]

7/20/2009
55
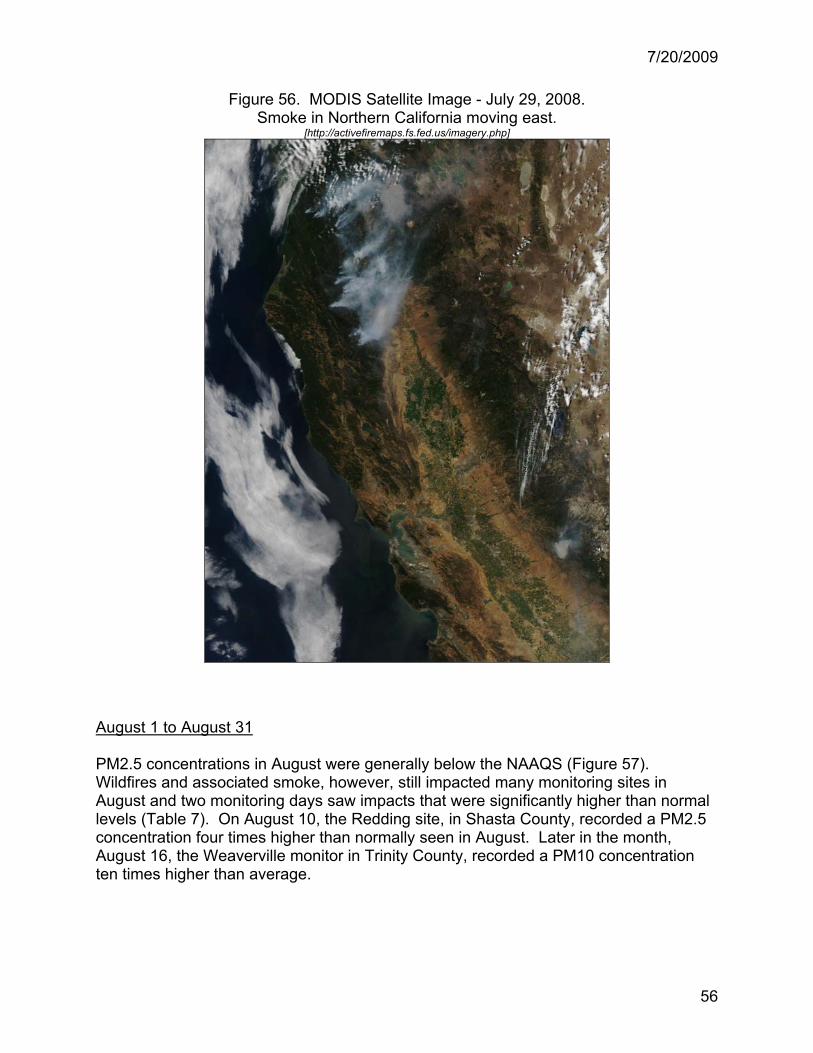
The last scheduled 1/6-day sampling day in this affected time period, July 29, showed that most monitoring sites had returned to close to normal conditions, below 15 ug/m3. Only Redding, in the far north of the Sacramento Valley, experienced significantly elevated concentrations of PM2.5 (Figure 55). Fires continued burning, sending smoke into the atmosphere and impacting some monitors (Figure 56), but not to the extent it had in late June and early July.
Figure 55. PM2.5 Mass Concentrations and Smoke – July 29, 2008
7/20/2009
56
Figure 56. MODIS Satellite Image - July 29, 2008.
Smoke in Northern California moving east. [http://activefiremaps.fs.fed.us/imagery.php]
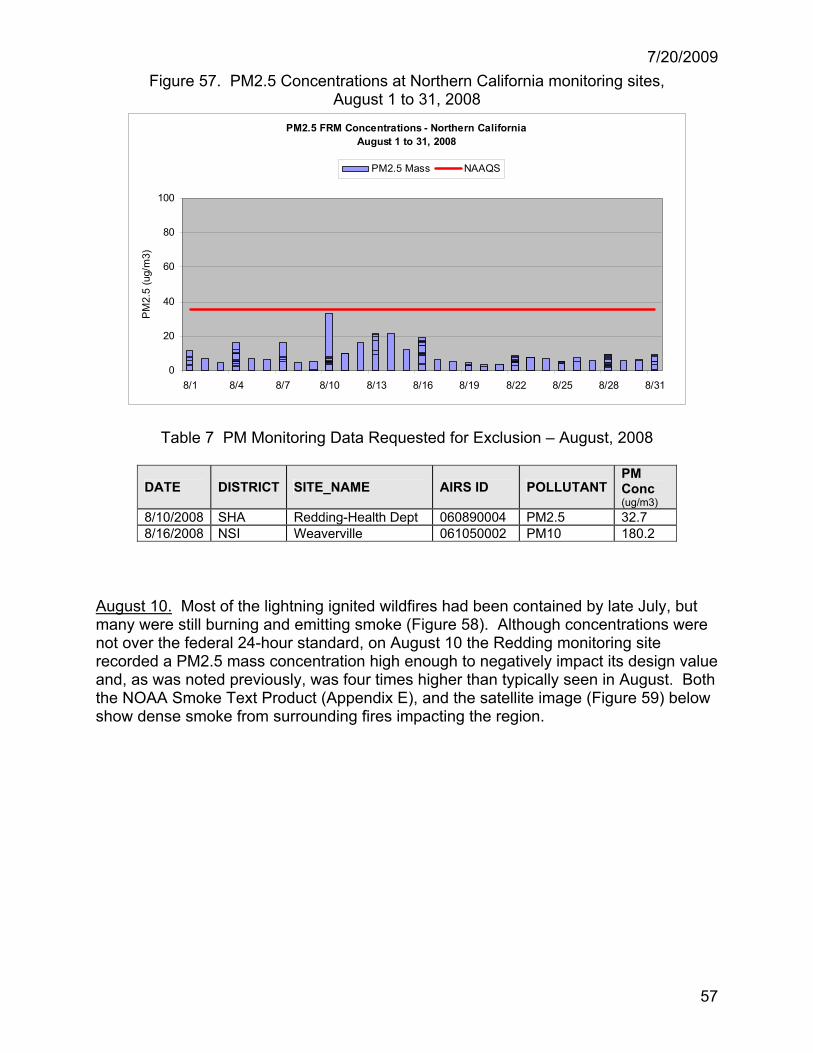
August 1 to August 31 PM2.5 concentrations in August were generally below the NAAQS (Figure 57). Wildfires and associated smoke, however, still impacted many monitoring sites in August and two monitoring days saw impacts that were significantly higher than normal levels (Table 7). On August 10, the Redding site, in Shasta County, recorded a PM2.5 concentration four times higher than normally seen in August. Later in the month, August 16, the Weaverville monitor in Trinity County, recorded a PM10 concentration ten times higher than average.
7/20/2009
57
Figure 57. PM2.5 Concentrations at Northern California monitoring sites, August 1 to 31, 2008
PM2.5 FRM Concentrations - Northern CaliforniaAugust 1 to 31, 2008
0
20
40
60
80
100
8/1 8/4 8/7 8/10 8/13 8/16 8/19 8/22 8/25 8/28 8/31
PM
2.5
(ug/
m3)
PM2.5 Mass NAAQS
Table 7 PM Monitoring Data Requested for Exclusion – August, 2008
DATE DISTRICT SITE_NAME AIRS ID POLLUTANT PM Conc (ug/m3)
8/10/2008 SHA Redding-Health Dept 060890004 PM2.5 32.7 8/16/2008 NSI Weaverville 061050002 PM10 180.2
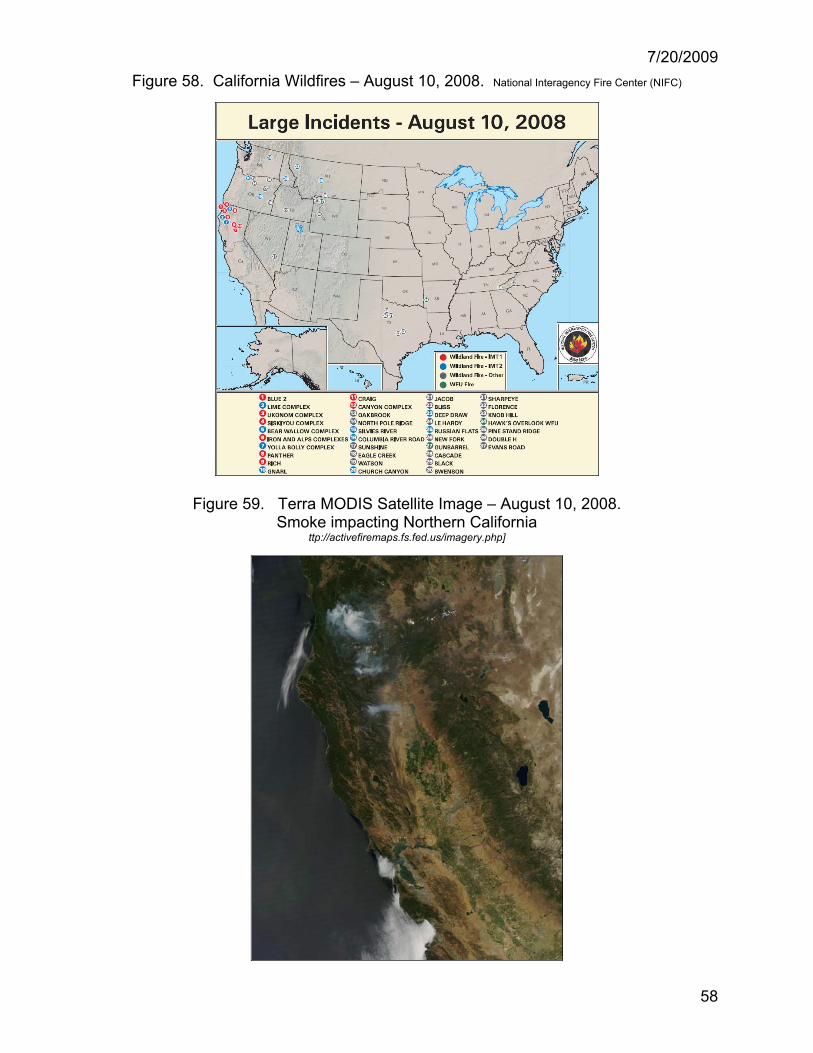
August 10. Most of the lightning ignited wildfires had been contained by late July, but many were still burning and emitting smoke (Figure 58). Although concentrations were not over the federal 24-hour standard, on August 10 the Redding monitoring site recorded a PM2.5 mass concentration high enough to negatively impact its design value and, as was noted previously, was four times higher than typically seen in August. Both the NOAA Smoke Text Product (Appendix E), and the satellite image (Figure 59) below show dense smoke from surrounding fires impacting the region.
7/20/2009
58
Figure 58. California Wildfires – August 10, 2008. National Interagency Fire Center (NIFC)
Figure 59. Terra MODIS Satellite Image – August 10, 2008. Smoke impacting Northern California
ttp://activefiremaps.fs.fed.us/imagery.php]
7/20/2009
59
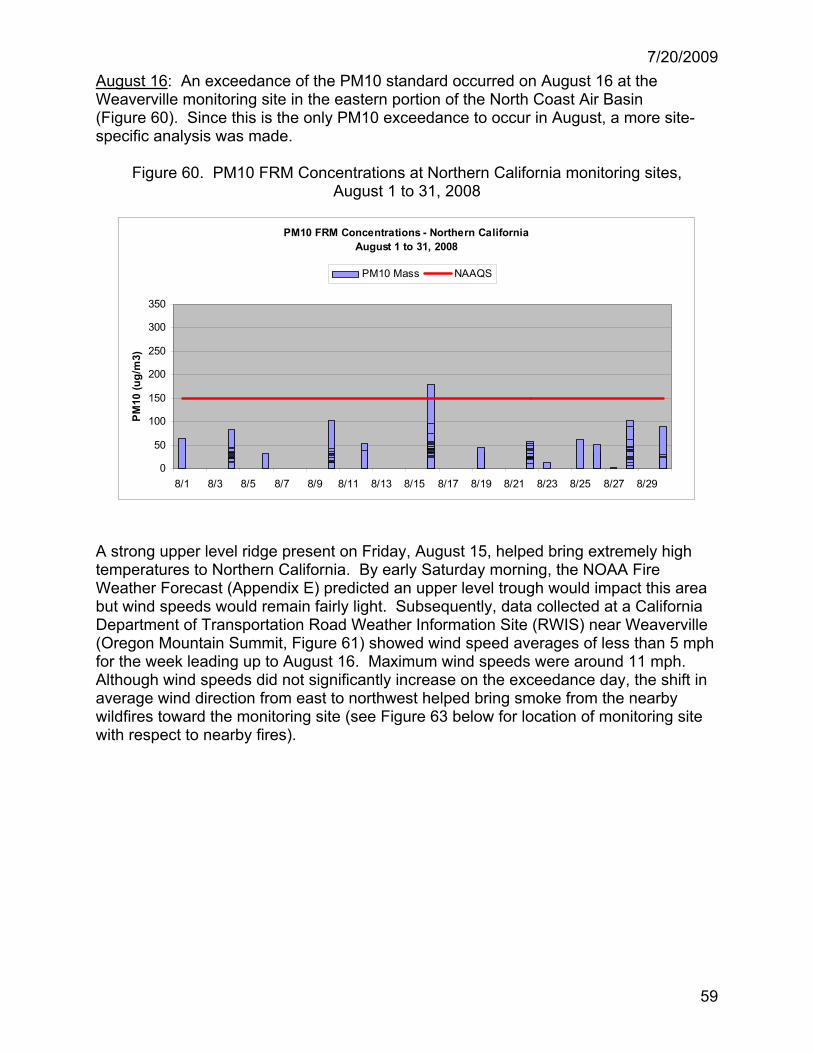
August 16: An exceedance of the PM10 standard occurred on August 16 at the Weaverville monitoring site in the eastern portion of the North Coast Air Basin (Figure 60). Since this is the only PM10 exceedance to occur in August, a more site-specific analysis was made.
Figure 60. PM10 FRM Concentrations at Northern California monitoring sites, August 1 to 31, 2008
PM10 FRM Concentrations - Northern CaliforniaAugust 1 to 31, 2008
0
50
100
150
200
250
300
350
8/1 8/3 8/5 8/7 8/9 8/11 8/13 8/15 8/17 8/19 8/21 8/23 8/25 8/27 8/29
PM10
(ug/
m3)
PM10 Mass NAAQS
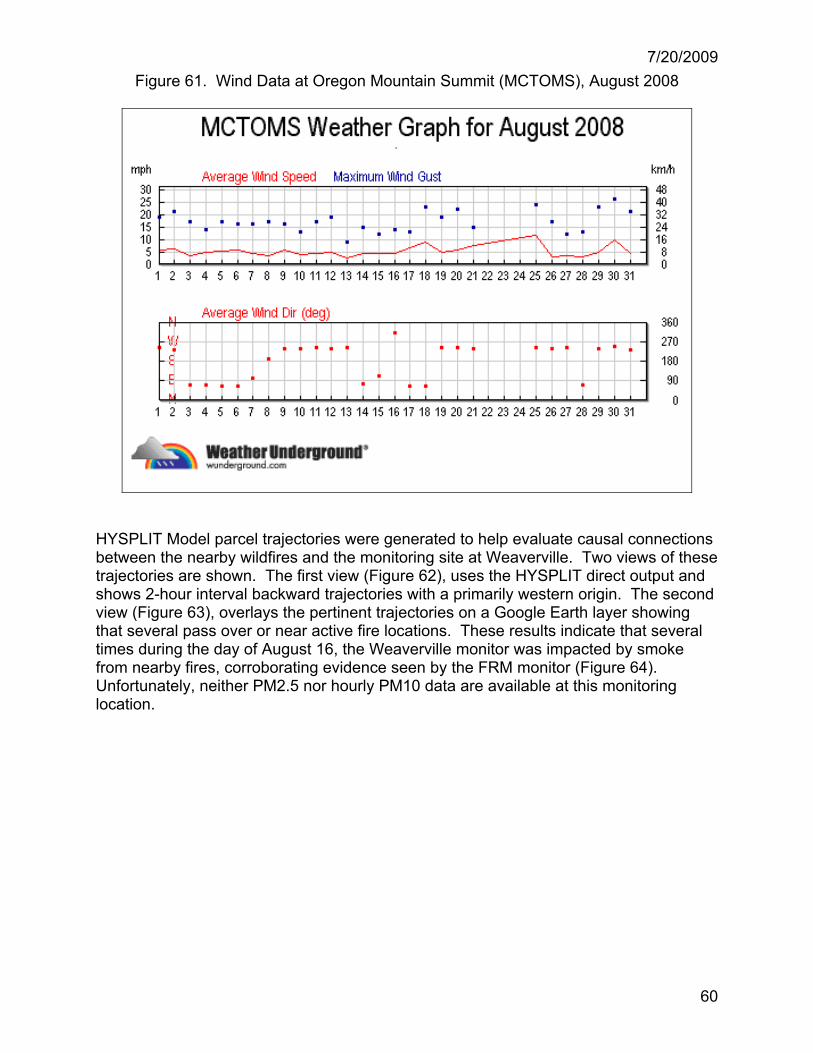
A strong upper level ridge present on Friday, August 15, helped bring extremely high temperatures to Northern California. By early Saturday morning, the NOAA Fire Weather Forecast (Appendix E) predicted an upper level trough would impact this area but wind speeds would remain fairly light. Subsequently, data collected at a California Department of Transportation Road Weather Information Site (RWIS) near Weaverville (Oregon Mountain Summit, Figure 61) showed wind speed averages of less than 5 mph for the week leading up to August 16. Maximum wind speeds were around 11 mph. Although wind speeds did not significantly increase on the exceedance day, the shift in average wind direction from east to northwest helped bring smoke from the nearby wildfires toward the monitoring site (see Figure 63 below for location of monitoring site with respect to nearby fires).
7/20/2009
60
Figure 61. Wind Data at Oregon Mountain Summit (MCTOMS), August 2008
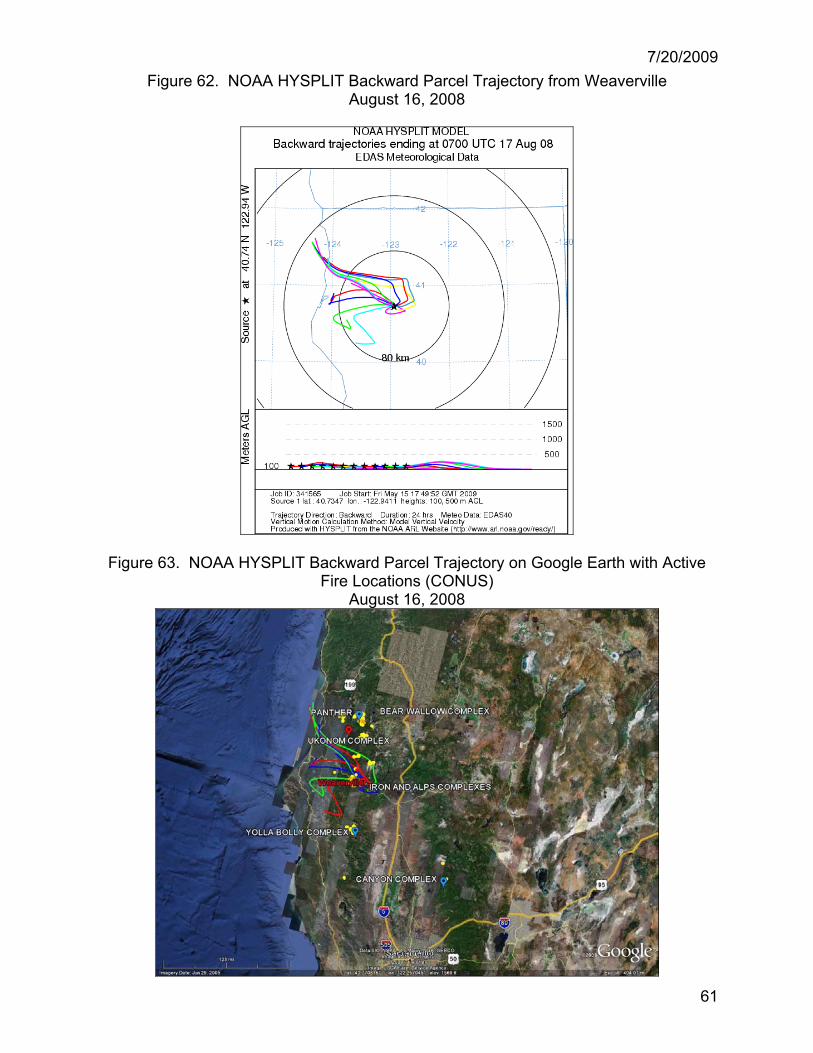
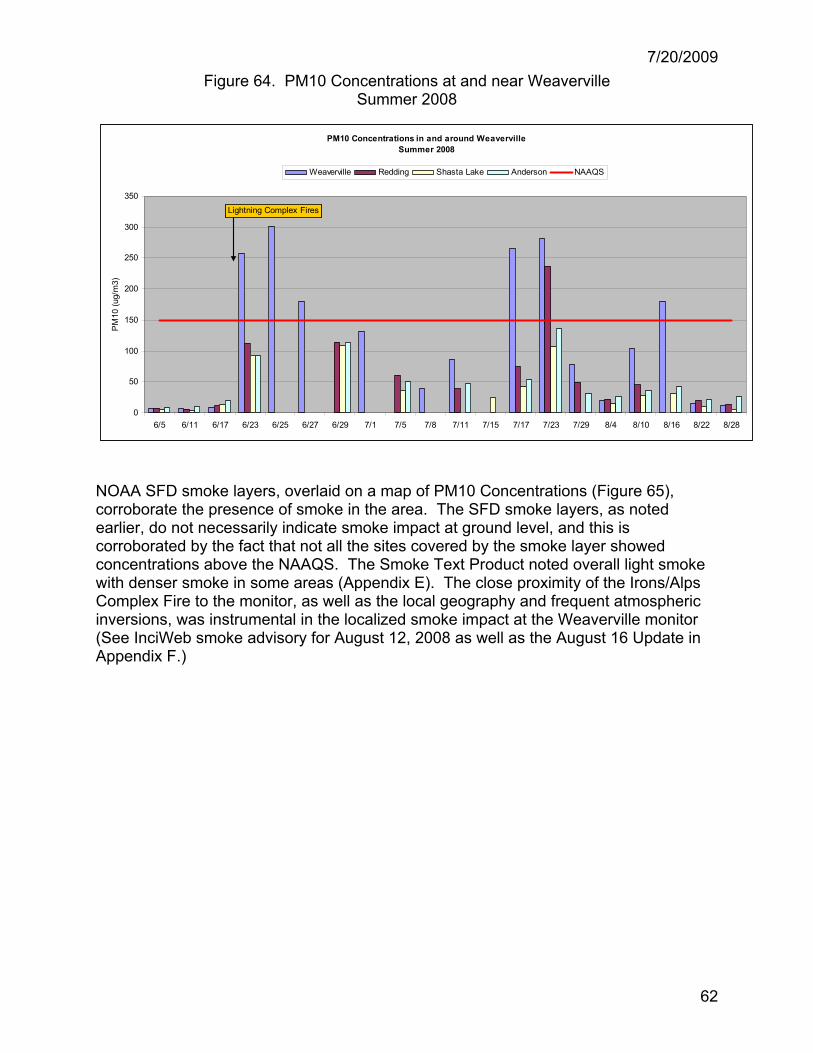
HYSPLIT Model parcel trajectories were generated to help evaluate causal connections between the nearby wildfires and the monitoring site at Weaverville. Two views of these trajectories are shown. The first view (Figure 62), uses the HYSPLIT direct output and shows 2-hour interval backward trajectories with a primarily western origin. The second view (Figure 63), overlays the pertinent trajectories on a Google Earth layer showing that several pass over or near active fire locations. These results indicate that several times during the day of August 16, the Weaverville monitor was impacted by smoke from nearby fires, corroborating evidence seen by the FRM monitor (Figure 64). Unfortunately, neither PM2.5 nor hourly PM10 data are available at this monitoring location.
7/20/2009
61
Figure 62. NOAA HYSPLIT Backward Parcel Trajectory from Weaverville August 16, 2008
Figure 63. NOAA HYSPLIT Backward Parcel Trajectory on Google Earth with Active Fire Locations (CONUS)
August 16, 2008
7/20/2009
62
Figure 64. PM10 Concentrations at and near Weaverville Summer 2008
PM10 Concentrations in and around WeavervilleSummer 2008
0
50
100
150
200
250
300
350
6/5 6/11 6/17 6/23 6/25 6/27 6/29 7/1 7/5 7/8 7/11 7/15 7/17 7/23 7/29 8/4 8/10 8/16 8/22 8/28
PM
10 (u
g/m
3)
Weaverville Redding Shasta Lake Anderson NAAQS
Lightning Complex Fires
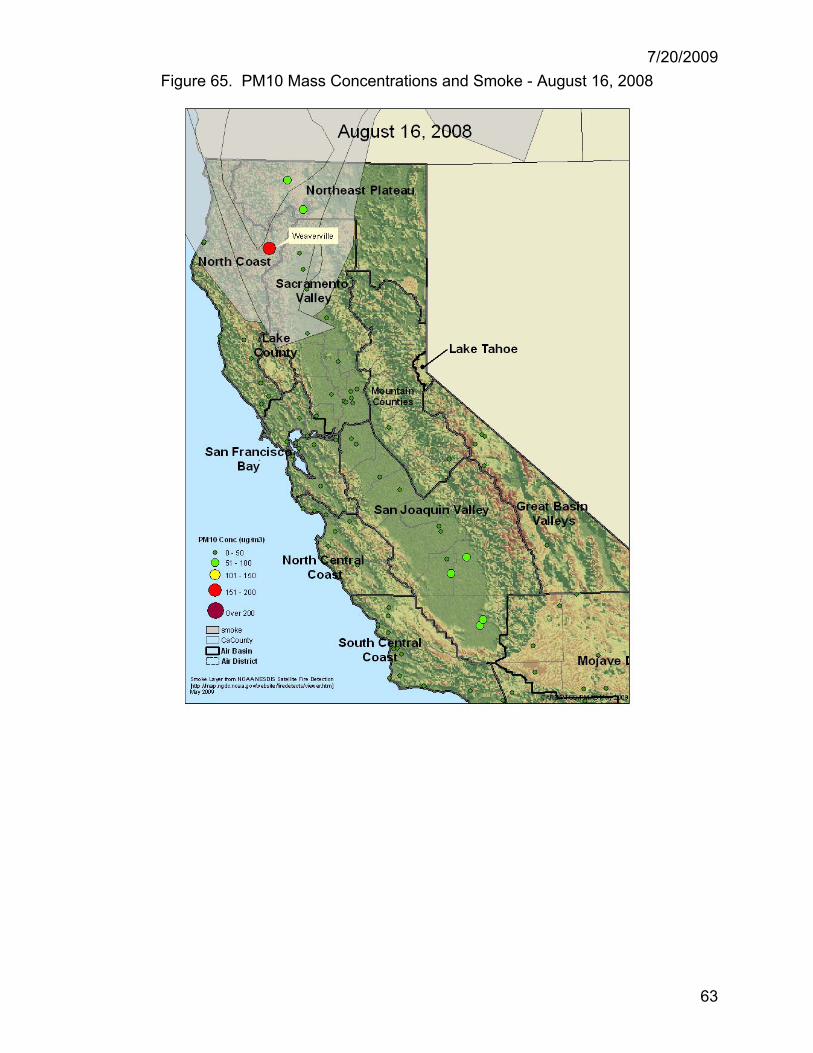
NOAA SFD smoke layers, overlaid on a map of PM10 Concentrations (Figure 65), corroborate the presence of smoke in the area. The SFD smoke layers, as noted earlier, do not necessarily indicate smoke impact at ground level, and this is corroborated by the fact that not all the sites covered by the smoke layer showed concentrations above the NAAQS. The Smoke Text Product noted overall light smoke with denser smoke in some areas (Appendix E). The close proximity of the Irons/Alps Complex Fire to the monitor, as well as the local geography and frequent atmospheric inversions, was instrumental in the localized smoke impact at the Weaverville monitor (See InciWeb smoke advisory for August 12, 2008 as well as the August 16 Update in Appendix F.)
7/20/2009
63
Figure 65. PM10 Mass Concentrations and Smoke - August 16, 2008
7/20/2009
64
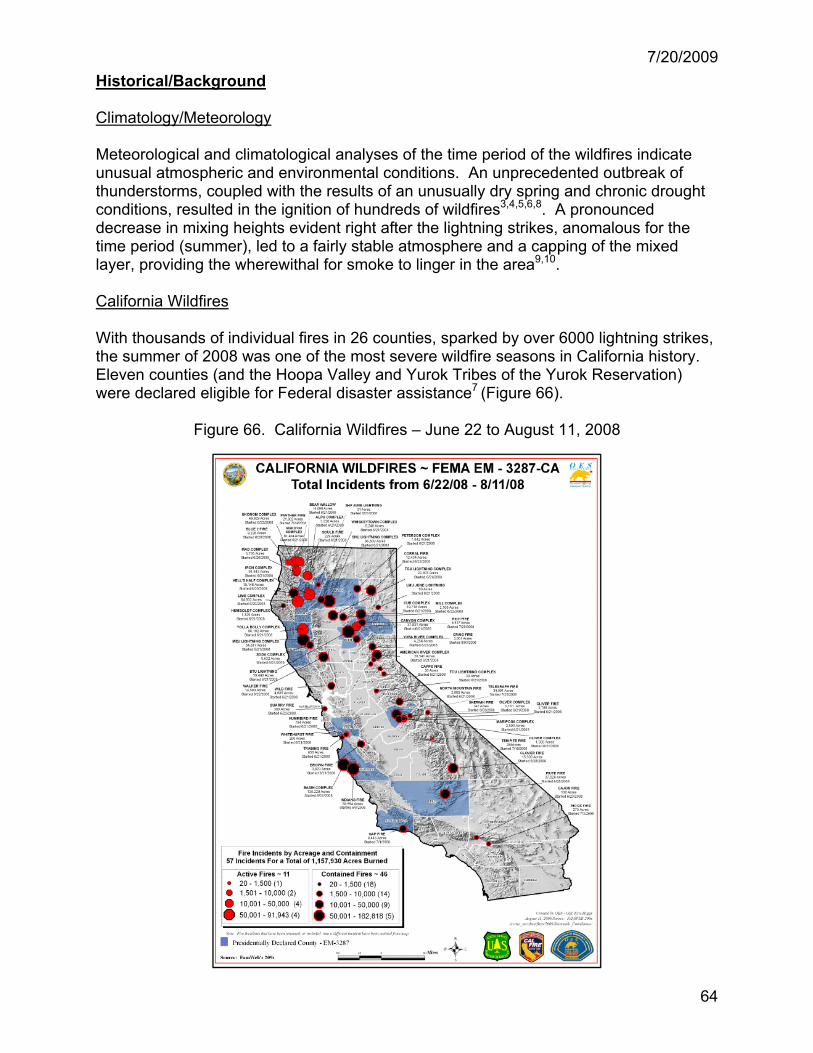
Historical/Background Climatology/Meteorology Meteorological and climatological analyses of the time period of the wildfires indicate unusual atmospheric and environmental conditions. An unprecedented outbreak of thunderstorms, coupled with the results of an unusually dry spring and chronic drought conditions, resulted in the ignition of hundreds of wildfires3,4,5,6,8. A pronounced decrease in mixing heights evident right after the lightning strikes, anomalous for the time period (summer), led to a fairly stable atmosphere and a capping of the mixed layer, providing the wherewithal for smoke to linger in the area9,10. California Wildfires With thousands of individual fires in 26 counties, sparked by over 6000 lightning strikes, the summer of 2008 was one of the most severe wildfire seasons in California history. Eleven counties (and the Hoopa Valley and Yurok Tribes of the Yurok Reservation) were declared eligible for Federal disaster assistance7 (Figure 66).
Figure 66. California Wildfires – June 22 to August 11, 2008
7/20/2009
65
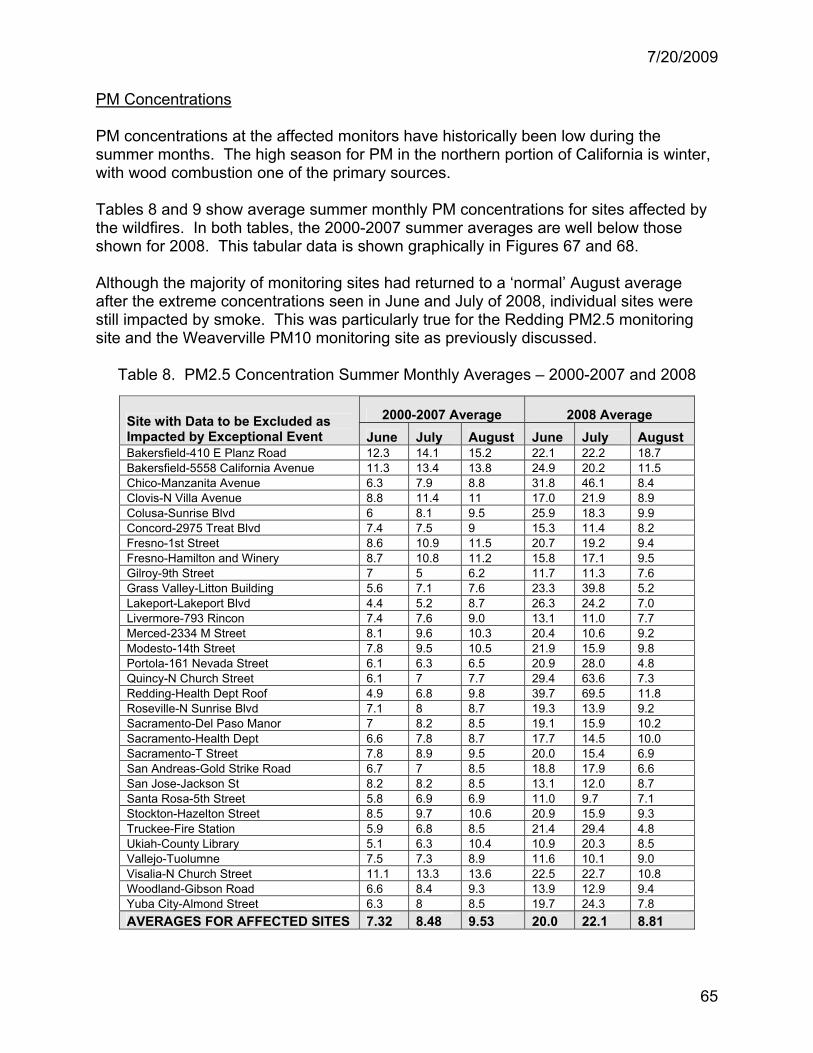
PM Concentrations PM concentrations at the affected monitors have historically been low during the summer months. The high season for PM in the northern portion of California is winter, with wood combustion one of the primary sources. Tables 8 and 9 show average summer monthly PM concentrations for sites affected by the wildfires. In both tables, the 2000-2007 summer averages are well below those shown for 2008. This tabular data is shown graphically in Figures 67 and 68. Although the majority of monitoring sites had returned to a ‘normal’ August average after the extreme concentrations seen in June and July of 2008, individual sites were still impacted by smoke. This was particularly true for the Redding PM2.5 monitoring site and the Weaverville PM10 monitoring site as previously discussed.
Table 8. PM2.5 Concentration Summer Monthly Averages – 2000-2007 and 2008
2000-2007 Average 2008 Average Site with Data to be Excluded as Impacted by Exceptional Event June July August June July August Bakersfield-410 E Planz Road 12.3 14.1 15.2 22.1 22.2 18.7 Bakersfield-5558 California Avenue 11.3 13.4 13.8 24.9 20.2 11.5 Chico-Manzanita Avenue 6.3 7.9 8.8 31.8 46.1 8.4 Clovis-N Villa Avenue 8.8 11.4 11 17.0 21.9 8.9 Colusa-Sunrise Blvd 6 8.1 9.5 25.9 18.3 9.9 Concord-2975 Treat Blvd 7.4 7.5 9 15.3 11.4 8.2 Fresno-1st Street 8.6 10.9 11.5 20.7 19.2 9.4 Fresno-Hamilton and Winery 8.7 10.8 11.2 15.8 17.1 9.5 Gilroy-9th Street 7 5 6.2 11.7 11.3 7.6 Grass Valley-Litton Building 5.6 7.1 7.6 23.3 39.8 5.2 Lakeport-Lakeport Blvd 4.4 5.2 8.7 26.3 24.2 7.0 Livermore-793 Rincon 7.4 7.6 9.0 13.1 11.0 7.7 Merced-2334 M Street 8.1 9.6 10.3 20.4 10.6 9.2 Modesto-14th Street 7.8 9.5 10.5 21.9 15.9 9.8 Portola-161 Nevada Street 6.1 6.3 6.5 20.9 28.0 4.8 Quincy-N Church Street 6.1 7 7.7 29.4 63.6 7.3 Redding-Health Dept Roof 4.9 6.8 9.8 39.7 69.5 11.8 Roseville-N Sunrise Blvd 7.1 8 8.7 19.3 13.9 9.2 Sacramento-Del Paso Manor 7 8.2 8.5 19.1 15.9 10.2 Sacramento-Health Dept 6.6 7.8 8.7 17.7 14.5 10.0 Sacramento-T Street 7.8 8.9 9.5 20.0 15.4 6.9 San Andreas-Gold Strike Road 6.7 7 8.5 18.8 17.9 6.6 San Jose-Jackson St 8.2 8.2 8.5 13.1 12.0 8.7 Santa Rosa-5th Street 5.8 6.9 6.9 11.0 9.7 7.1 Stockton-Hazelton Street 8.5 9.7 10.6 20.9 15.9 9.3 Truckee-Fire Station 5.9 6.8 8.5 21.4 29.4 4.8 Ukiah-County Library 5.1 6.3 10.4 10.9 20.3 8.5 Vallejo-Tuolumne 7.5 7.3 8.9 11.6 10.1 9.0 Visalia-N Church Street 11.1 13.3 13.6 22.5 22.7 10.8 Woodland-Gibson Road 6.6 8.4 9.3 13.9 12.9 9.4 Yuba City-Almond Street 6.3 8 8.5 19.7 24.3 7.8 AVERAGES FOR AFFECTED SITES 7.32 8.48 9.53 20.0 22.1 8.81
7/20/2009
66
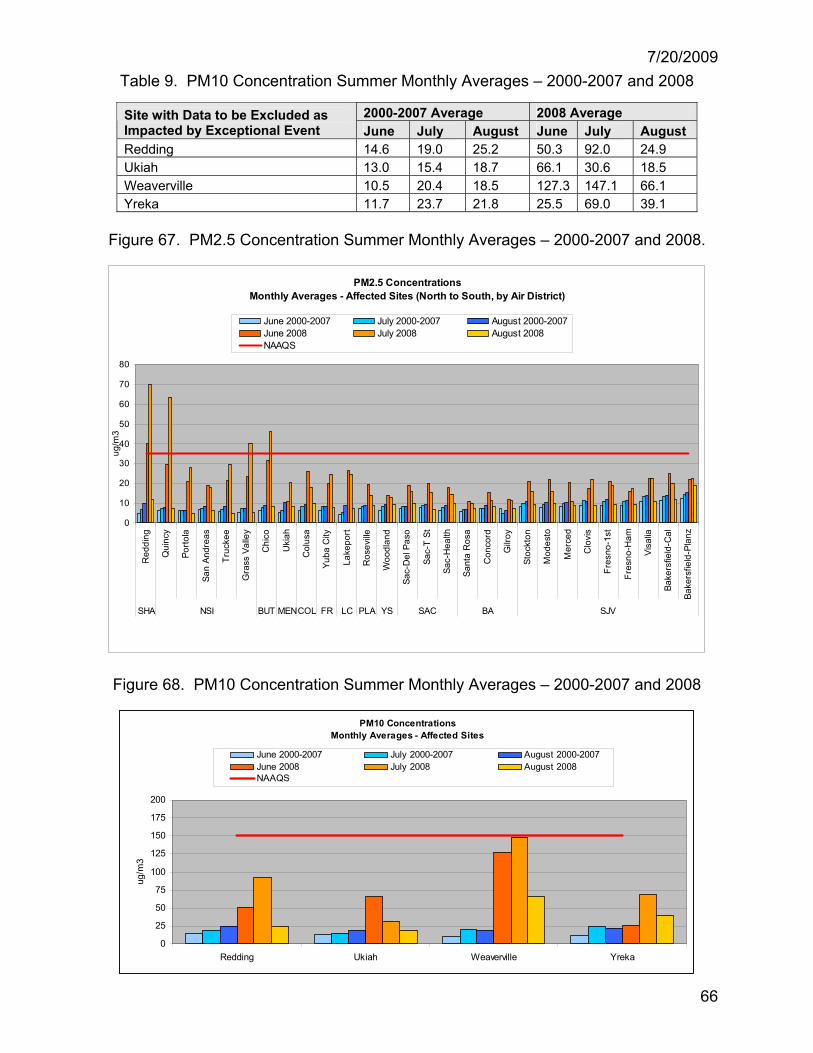
Table 9. PM10 Concentration Summer Monthly Averages – 2000-2007 and 2008
2000-2007 Average 2008 Average Site with Data to be Excluded as Impacted by Exceptional Event June July August June July August Redding 14.6 19.0 25.2 50.3 92.0 24.9 Ukiah 13.0 15.4 18.7 66.1 30.6 18.5 Weaverville 10.5 20.4 18.5 127.3 147.1 66.1 Yreka 11.7 23.7 21.8 25.5 69.0 39.1
Figure 67. PM2.5 Concentration Summer Monthly Averages – 2000-2007 and 2008.
PM2.5 Concentrations Monthly Averages - Affected Sites (North to South, by Air District)
0
10
20
30
40
50
60
70
80
Red
ding
Qui
ncy
Porto
la
San
Andr
eas
Truc
kee
Gra
ss V
alle
y
Chi
co
Uki
ah
Col
usa
Yuba
City
Lake
port
Ros
eville
Woo
dlan
d
Sac-
Del
Pas
o
Sac-
T St
Sac-
Hea
lth
Sant
a R
osa
Con
cord
Gilr
oy
Stoc
kton
Mod
esto
Mer
ced
Clo
vis
Fres
no-1
st
Fres
no-H
am
Visa
lia
Bake
rsfie
ld-C
al
Bake
rsfie
ld-P
lanz
SHA NSI BUT MENCOL FR LC PLA YS SAC BA SJV
ug/m
3
June 2000-2007 July 2000-2007 August 2000-2007June 2008 July 2008 August 2008NAAQS
Figure 68. PM10 Concentration Summer Monthly Averages – 2000-2007 and 2008
PM10 ConcentrationsMonthly Averages - Affected Sites
0
25
50
75
100
125
150
175
200
Redding Ukiah Weaverville Yreka
ug/m
3
June 2000-2007 July 2000-2007 August 2000-2007June 2008 July 2008 August 2008NAAQS
7/20/2009
67
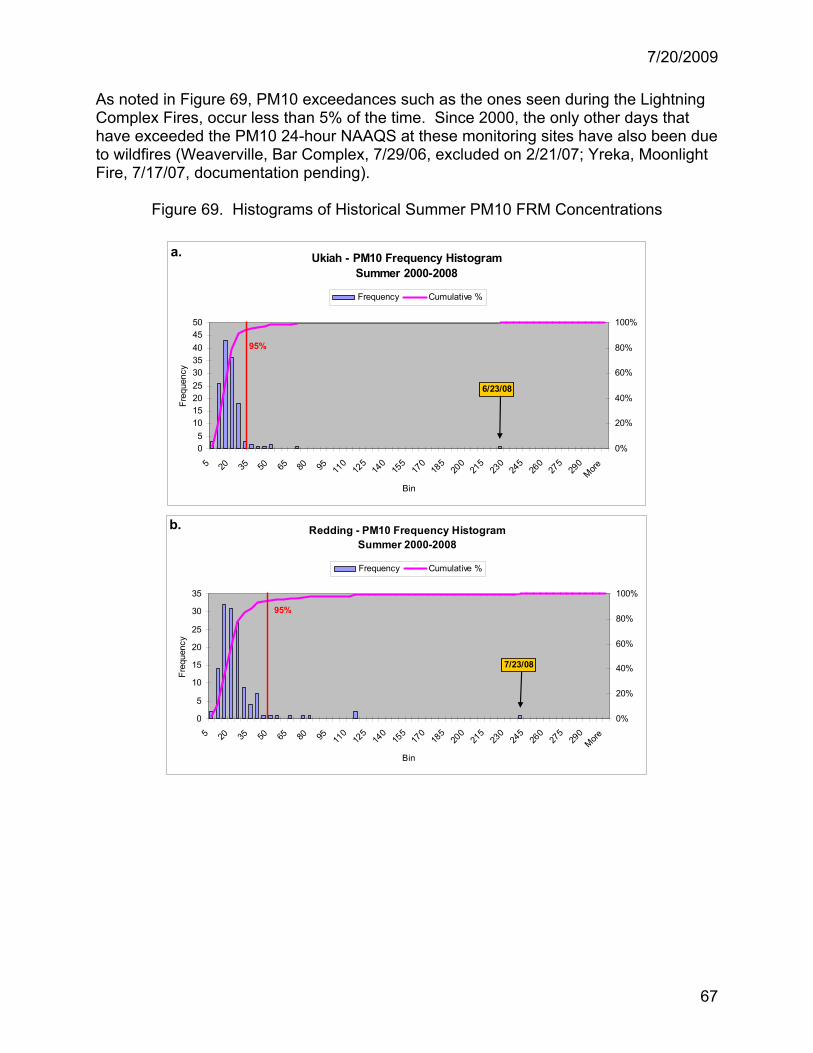
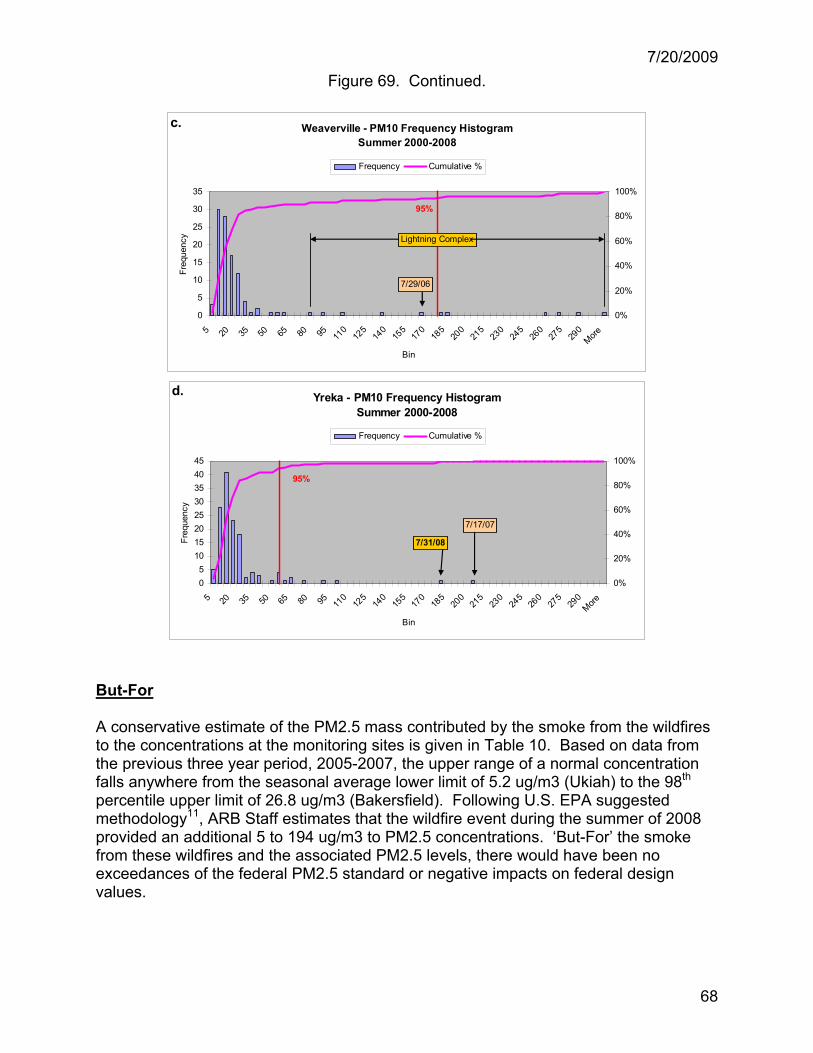
As noted in Figure 69, PM10 exceedances such as the ones seen during the Lightning Complex Fires, occur less than 5% of the time. Since 2000, the only other days that have exceeded the PM10 24-hour NAAQS at these monitoring sites have also been due to wildfires (Weaverville, Bar Complex, 7/29/06, excluded on 2/21/07; Yreka, Moonlight Fire, 7/17/07, documentation pending).
Figure 69. Histograms of Historical Summer PM10 FRM Concentrations
Ukiah - PM10 Frequency HistogramSummer 2000-2008
05
101520253035404550
5 20 35 50 65 80 95 110
125
140
155
170
185
200
215
230
245
260
275
290
More
Bin
Freq
uenc
y
0%
20%
40%
60%
80%
100%
Frequency Cumulative %
95%
6/23/08
a.
Redding - PM10 Frequency HistogramSummer 2000-2008
0
5
10
15
20
25
30
35
5 20 35 50 65 80 95 110
125
140
155
170
185
200
215
230
245
260
275
290
More
Bin
Freq
uenc
y
0%
20%
40%
60%
80%
100%
Frequency Cumulative %
95%
7/23/08
b.
7/20/2009
68
Figure 69. Continued.
Weaverville - PM10 Frequency HistogramSummer 2000-2008
0
5
10
15
20
25
30
35
5 20 35 50 65 80 95 110
125
140
155
170
185
200
215
230
245
260
275
290
More
Bin
Freq
uenc
y
0%
20%
40%
60%
80%
100%
Frequency Cumulative %
95%
Lightning Complex
7/29/06
c.
Yreka - PM10 Frequency HistogramSummer 2000-2008
05
1015202530354045
5 20 35 50 65 80 95 110
125
140
155
170
185
200
215
230
245
260
275
290
More
Bin
Freq
uenc
y
0%
20%
40%
60%
80%
100%
Frequency Cumulative %
95%
7/31/08
7/17/07
d.
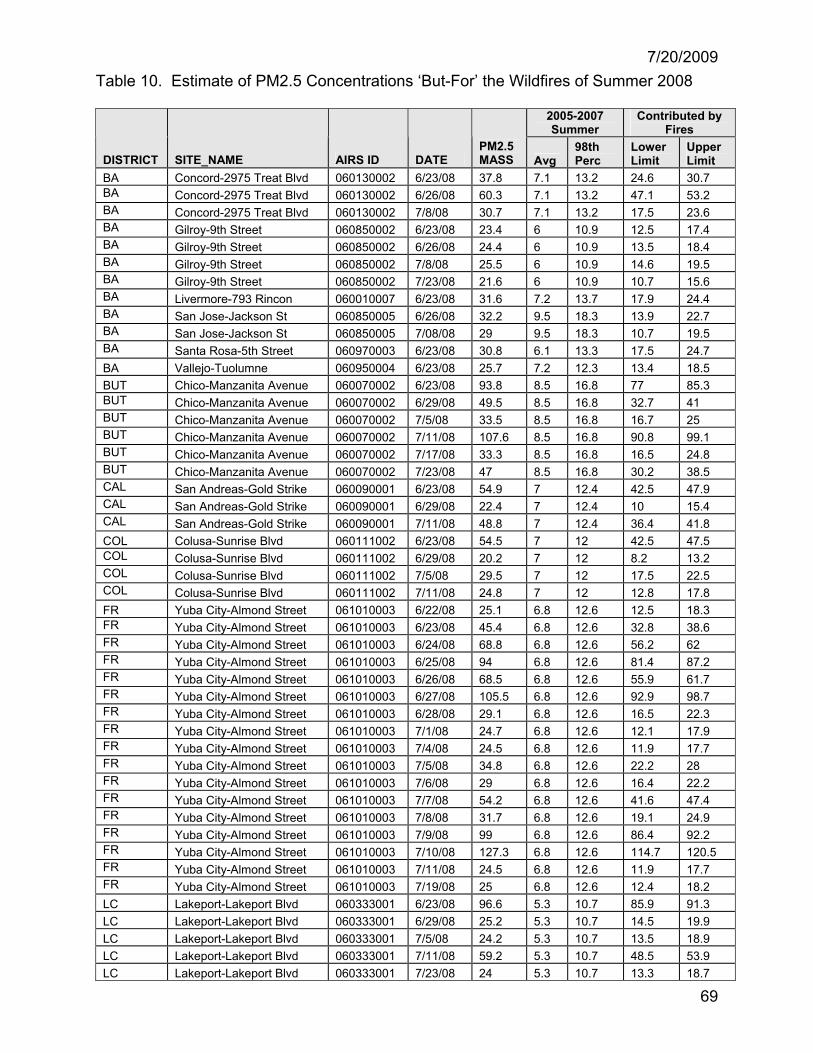
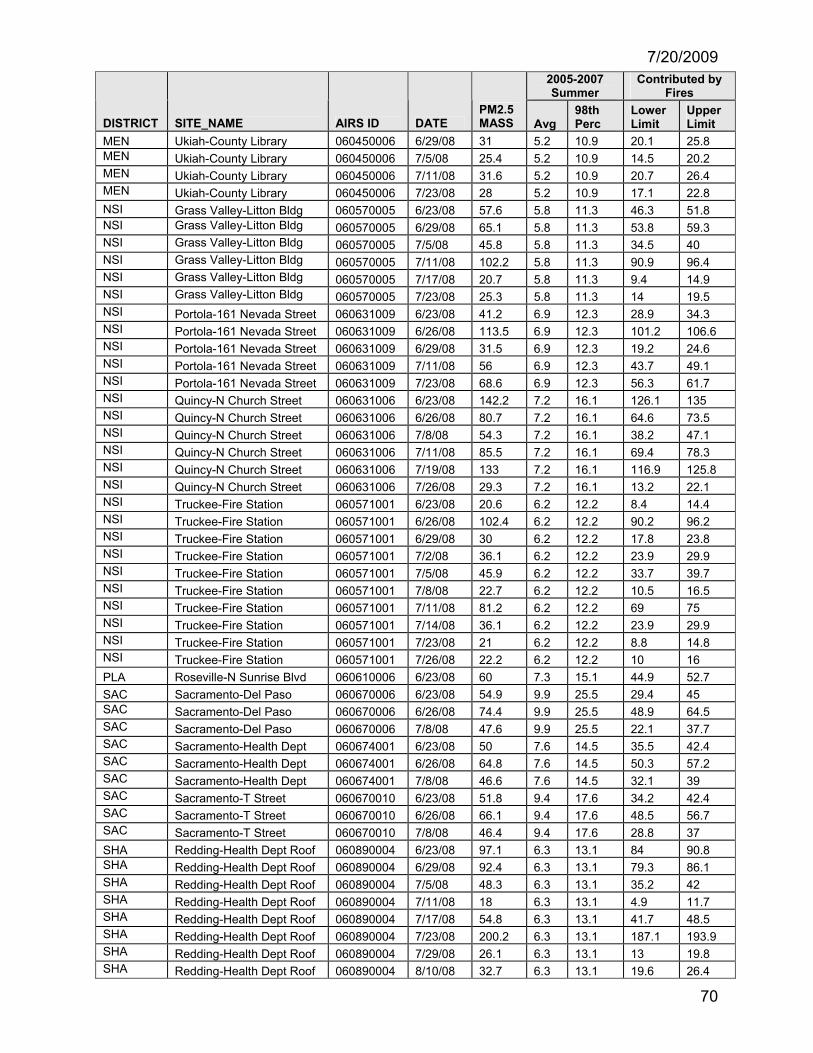
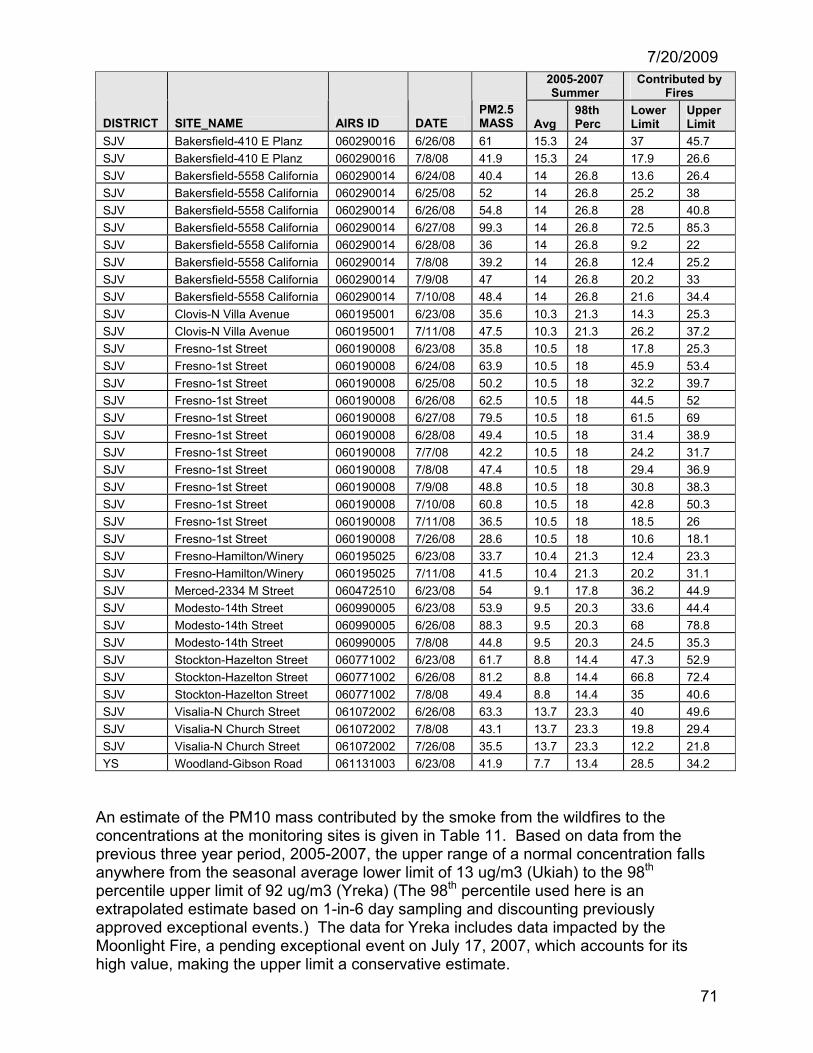
But-For A conservative estimate of the PM2.5 mass contributed by the smoke from the wildfires to the concentrations at the monitoring sites is given in Table 10. Based on data from the previous three year period, 2005-2007, the upper range of a normal concentration falls anywhere from the seasonal average lower limit of 5.2 ug/m3 (Ukiah) to the 98th percentile upper limit of 26.8 ug/m3 (Bakersfield). Following U.S. EPA suggested methodology11, ARB Staff estimates that the wildfire event during the summer of 2008 provided an additional 5 to 194 ug/m3 to PM2.5 concentrations. ‘But-For’ the smoke from these wildfires and the associated PM2.5 levels, there would have been no exceedances of the federal PM2.5 standard or negative impacts on federal design values.
7/20/2009
69
Table 10. Estimate of PM2.5 Concentrations ‘But-For’ the Wildfires of Summer 2008
2005-2007 Summer
Contributed by Fires
DISTRICT SITE_NAME AIRS ID DATE PM2.5 MASS Avg
98th Perc
Lower Limit
Upper Limit
BA Concord-2975 Treat Blvd 060130002 6/23/08 37.8 7.1 13.2 24.6 30.7 BA Concord-2975 Treat Blvd 060130002 6/26/08 60.3 7.1 13.2 47.1 53.2 BA Concord-2975 Treat Blvd 060130002 7/8/08 30.7 7.1 13.2 17.5 23.6 BA Gilroy-9th Street 060850002 6/23/08 23.4 6 10.9 12.5 17.4 BA Gilroy-9th Street 060850002 6/26/08 24.4 6 10.9 13.5 18.4 BA Gilroy-9th Street 060850002 7/8/08 25.5 6 10.9 14.6 19.5 BA Gilroy-9th Street 060850002 7/23/08 21.6 6 10.9 10.7 15.6 BA Livermore-793 Rincon 060010007 6/23/08 31.6 7.2 13.7 17.9 24.4 BA San Jose-Jackson St 060850005 6/26/08 32.2 9.5 18.3 13.9 22.7 BA San Jose-Jackson St 060850005 7/08/08 29 9.5 18.3 10.7 19.5 BA Santa Rosa-5th Street 060970003 6/23/08 30.8 6.1 13.3 17.5 24.7 BA Vallejo-Tuolumne 060950004 6/23/08 25.7 7.2 12.3 13.4 18.5 BUT Chico-Manzanita Avenue 060070002 6/23/08 93.8 8.5 16.8 77 85.3 BUT Chico-Manzanita Avenue 060070002 6/29/08 49.5 8.5 16.8 32.7 41 BUT Chico-Manzanita Avenue 060070002 7/5/08 33.5 8.5 16.8 16.7 25 BUT Chico-Manzanita Avenue 060070002 7/11/08 107.6 8.5 16.8 90.8 99.1 BUT Chico-Manzanita Avenue 060070002 7/17/08 33.3 8.5 16.8 16.5 24.8 BUT Chico-Manzanita Avenue 060070002 7/23/08 47 8.5 16.8 30.2 38.5 CAL San Andreas-Gold Strike 060090001 6/23/08 54.9 7 12.4 42.5 47.9 CAL San Andreas-Gold Strike 060090001 6/29/08 22.4 7 12.4 10 15.4 CAL San Andreas-Gold Strike 060090001 7/11/08 48.8 7 12.4 36.4 41.8 COL Colusa-Sunrise Blvd 060111002 6/23/08 54.5 7 12 42.5 47.5 COL Colusa-Sunrise Blvd 060111002 6/29/08 20.2 7 12 8.2 13.2 COL Colusa-Sunrise Blvd 060111002 7/5/08 29.5 7 12 17.5 22.5 COL Colusa-Sunrise Blvd 060111002 7/11/08 24.8 7 12 12.8 17.8 FR Yuba City-Almond Street 061010003 6/22/08 25.1 6.8 12.6 12.5 18.3 FR Yuba City-Almond Street 061010003 6/23/08 45.4 6.8 12.6 32.8 38.6 FR Yuba City-Almond Street 061010003 6/24/08 68.8 6.8 12.6 56.2 62 FR Yuba City-Almond Street 061010003 6/25/08 94 6.8 12.6 81.4 87.2 FR Yuba City-Almond Street 061010003 6/26/08 68.5 6.8 12.6 55.9 61.7 FR Yuba City-Almond Street 061010003 6/27/08 105.5 6.8 12.6 92.9 98.7 FR Yuba City-Almond Street 061010003 6/28/08 29.1 6.8 12.6 16.5 22.3 FR Yuba City-Almond Street 061010003 7/1/08 24.7 6.8 12.6 12.1 17.9 FR Yuba City-Almond Street 061010003 7/4/08 24.5 6.8 12.6 11.9 17.7 FR Yuba City-Almond Street 061010003 7/5/08 34.8 6.8 12.6 22.2 28 FR Yuba City-Almond Street 061010003 7/6/08 29 6.8 12.6 16.4 22.2 FR Yuba City-Almond Street 061010003 7/7/08 54.2 6.8 12.6 41.6 47.4 FR Yuba City-Almond Street 061010003 7/8/08 31.7 6.8 12.6 19.1 24.9 FR Yuba City-Almond Street 061010003 7/9/08 99 6.8 12.6 86.4 92.2 FR Yuba City-Almond Street 061010003 7/10/08 127.3 6.8 12.6 114.7 120.5 FR Yuba City-Almond Street 061010003 7/11/08 24.5 6.8 12.6 11.9 17.7 FR Yuba City-Almond Street 061010003 7/19/08 25 6.8 12.6 12.4 18.2 LC Lakeport-Lakeport Blvd 060333001 6/23/08 96.6 5.3 10.7 85.9 91.3 LC Lakeport-Lakeport Blvd 060333001 6/29/08 25.2 5.3 10.7 14.5 19.9 LC Lakeport-Lakeport Blvd 060333001 7/5/08 24.2 5.3 10.7 13.5 18.9 LC Lakeport-Lakeport Blvd 060333001 7/11/08 59.2 5.3 10.7 48.5 53.9 LC Lakeport-Lakeport Blvd 060333001 7/23/08 24 5.3 10.7 13.3 18.7
7/20/2009
70
2005-2007 Summer
Contributed by Fires
DISTRICT SITE_NAME AIRS ID DATE PM2.5 MASS Avg
98th Perc
Lower Limit
Upper Limit
MEN Ukiah-County Library 060450006 6/29/08 31 5.2 10.9 20.1 25.8 MEN Ukiah-County Library 060450006 7/5/08 25.4 5.2 10.9 14.5 20.2 MEN Ukiah-County Library 060450006 7/11/08 31.6 5.2 10.9 20.7 26.4 MEN Ukiah-County Library 060450006 7/23/08 28 5.2 10.9 17.1 22.8 NSI Grass Valley-Litton Bldg 060570005 6/23/08 57.6 5.8 11.3 46.3 51.8 NSI Grass Valley-Litton Bldg 060570005 6/29/08 65.1 5.8 11.3 53.8 59.3 NSI Grass Valley-Litton Bldg 060570005 7/5/08 45.8 5.8 11.3 34.5 40 NSI Grass Valley-Litton Bldg 060570005 7/11/08 102.2 5.8 11.3 90.9 96.4 NSI Grass Valley-Litton Bldg 060570005 7/17/08 20.7 5.8 11.3 9.4 14.9 NSI Grass Valley-Litton Bldg 060570005 7/23/08 25.3 5.8 11.3 14 19.5 NSI Portola-161 Nevada Street 060631009 6/23/08 41.2 6.9 12.3 28.9 34.3 NSI Portola-161 Nevada Street 060631009 6/26/08 113.5 6.9 12.3 101.2 106.6 NSI Portola-161 Nevada Street 060631009 6/29/08 31.5 6.9 12.3 19.2 24.6 NSI Portola-161 Nevada Street 060631009 7/11/08 56 6.9 12.3 43.7 49.1 NSI Portola-161 Nevada Street 060631009 7/23/08 68.6 6.9 12.3 56.3 61.7 NSI Quincy-N Church Street 060631006 6/23/08 142.2 7.2 16.1 126.1 135 NSI Quincy-N Church Street 060631006 6/26/08 80.7 7.2 16.1 64.6 73.5 NSI Quincy-N Church Street 060631006 7/8/08 54.3 7.2 16.1 38.2 47.1 NSI Quincy-N Church Street 060631006 7/11/08 85.5 7.2 16.1 69.4 78.3 NSI Quincy-N Church Street 060631006 7/19/08 133 7.2 16.1 116.9 125.8 NSI Quincy-N Church Street 060631006 7/26/08 29.3 7.2 16.1 13.2 22.1 NSI Truckee-Fire Station 060571001 6/23/08 20.6 6.2 12.2 8.4 14.4 NSI Truckee-Fire Station 060571001 6/26/08 102.4 6.2 12.2 90.2 96.2 NSI Truckee-Fire Station 060571001 6/29/08 30 6.2 12.2 17.8 23.8 NSI Truckee-Fire Station 060571001 7/2/08 36.1 6.2 12.2 23.9 29.9 NSI Truckee-Fire Station 060571001 7/5/08 45.9 6.2 12.2 33.7 39.7 NSI Truckee-Fire Station 060571001 7/8/08 22.7 6.2 12.2 10.5 16.5 NSI Truckee-Fire Station 060571001 7/11/08 81.2 6.2 12.2 69 75 NSI Truckee-Fire Station 060571001 7/14/08 36.1 6.2 12.2 23.9 29.9 NSI Truckee-Fire Station 060571001 7/23/08 21 6.2 12.2 8.8 14.8 NSI Truckee-Fire Station 060571001 7/26/08 22.2 6.2 12.2 10 16 PLA Roseville-N Sunrise Blvd 060610006 6/23/08 60 7.3 15.1 44.9 52.7 SAC Sacramento-Del Paso 060670006 6/23/08 54.9 9.9 25.5 29.4 45 SAC Sacramento-Del Paso 060670006 6/26/08 74.4 9.9 25.5 48.9 64.5 SAC Sacramento-Del Paso 060670006 7/8/08 47.6 9.9 25.5 22.1 37.7 SAC Sacramento-Health Dept 060674001 6/23/08 50 7.6 14.5 35.5 42.4 SAC Sacramento-Health Dept 060674001 6/26/08 64.8 7.6 14.5 50.3 57.2 SAC Sacramento-Health Dept 060674001 7/8/08 46.6 7.6 14.5 32.1 39 SAC Sacramento-T Street 060670010 6/23/08 51.8 9.4 17.6 34.2 42.4 SAC Sacramento-T Street 060670010 6/26/08 66.1 9.4 17.6 48.5 56.7 SAC Sacramento-T Street 060670010 7/8/08 46.4 9.4 17.6 28.8 37 SHA Redding-Health Dept Roof 060890004 6/23/08 97.1 6.3 13.1 84 90.8 SHA Redding-Health Dept Roof 060890004 6/29/08 92.4 6.3 13.1 79.3 86.1 SHA Redding-Health Dept Roof 060890004 7/5/08 48.3 6.3 13.1 35.2 42 SHA Redding-Health Dept Roof 060890004 7/11/08 18 6.3 13.1 4.9 11.7 SHA Redding-Health Dept Roof 060890004 7/17/08 54.8 6.3 13.1 41.7 48.5 SHA Redding-Health Dept Roof 060890004 7/23/08 200.2 6.3 13.1 187.1 193.9 SHA Redding-Health Dept Roof 060890004 7/29/08 26.1 6.3 13.1 13 19.8 SHA Redding-Health Dept Roof 060890004 8/10/08 32.7 6.3 13.1 19.6 26.4
7/20/2009
71
2005-2007 Summer
Contributed by Fires
DISTRICT SITE_NAME AIRS ID DATE PM2.5 MASS Avg
98th Perc
Lower Limit
Upper Limit
SJV Bakersfield-410 E Planz 060290016 6/26/08 61 15.3 24 37 45.7 SJV Bakersfield-410 E Planz 060290016 7/8/08 41.9 15.3 24 17.9 26.6 SJV Bakersfield-5558 California 060290014 6/24/08 40.4 14 26.8 13.6 26.4 SJV Bakersfield-5558 California 060290014 6/25/08 52 14 26.8 25.2 38 SJV Bakersfield-5558 California 060290014 6/26/08 54.8 14 26.8 28 40.8 SJV Bakersfield-5558 California 060290014 6/27/08 99.3 14 26.8 72.5 85.3 SJV Bakersfield-5558 California 060290014 6/28/08 36 14 26.8 9.2 22 SJV Bakersfield-5558 California 060290014 7/8/08 39.2 14 26.8 12.4 25.2 SJV Bakersfield-5558 California 060290014 7/9/08 47 14 26.8 20.2 33 SJV Bakersfield-5558 California 060290014 7/10/08 48.4 14 26.8 21.6 34.4 SJV Clovis-N Villa Avenue 060195001 6/23/08 35.6 10.3 21.3 14.3 25.3 SJV Clovis-N Villa Avenue 060195001 7/11/08 47.5 10.3 21.3 26.2 37.2 SJV Fresno-1st Street 060190008 6/23/08 35.8 10.5 18 17.8 25.3 SJV Fresno-1st Street 060190008 6/24/08 63.9 10.5 18 45.9 53.4 SJV Fresno-1st Street 060190008 6/25/08 50.2 10.5 18 32.2 39.7 SJV Fresno-1st Street 060190008 6/26/08 62.5 10.5 18 44.5 52 SJV Fresno-1st Street 060190008 6/27/08 79.5 10.5 18 61.5 69 SJV Fresno-1st Street 060190008 6/28/08 49.4 10.5 18 31.4 38.9 SJV Fresno-1st Street 060190008 7/7/08 42.2 10.5 18 24.2 31.7 SJV Fresno-1st Street 060190008 7/8/08 47.4 10.5 18 29.4 36.9 SJV Fresno-1st Street 060190008 7/9/08 48.8 10.5 18 30.8 38.3 SJV Fresno-1st Street 060190008 7/10/08 60.8 10.5 18 42.8 50.3 SJV Fresno-1st Street 060190008 7/11/08 36.5 10.5 18 18.5 26 SJV Fresno-1st Street 060190008 7/26/08 28.6 10.5 18 10.6 18.1 SJV Fresno-Hamilton/Winery 060195025 6/23/08 33.7 10.4 21.3 12.4 23.3 SJV Fresno-Hamilton/Winery 060195025 7/11/08 41.5 10.4 21.3 20.2 31.1 SJV Merced-2334 M Street 060472510 6/23/08 54 9.1 17.8 36.2 44.9 SJV Modesto-14th Street 060990005 6/23/08 53.9 9.5 20.3 33.6 44.4 SJV Modesto-14th Street 060990005 6/26/08 88.3 9.5 20.3 68 78.8 SJV Modesto-14th Street 060990005 7/8/08 44.8 9.5 20.3 24.5 35.3 SJV Stockton-Hazelton Street 060771002 6/23/08 61.7 8.8 14.4 47.3 52.9 SJV Stockton-Hazelton Street 060771002 6/26/08 81.2 8.8 14.4 66.8 72.4 SJV Stockton-Hazelton Street 060771002 7/8/08 49.4 8.8 14.4 35 40.6 SJV Visalia-N Church Street 061072002 6/26/08 63.3 13.7 23.3 40 49.6 SJV Visalia-N Church Street 061072002 7/8/08 43.1 13.7 23.3 19.8 29.4 SJV Visalia-N Church Street 061072002 7/26/08 35.5 13.7 23.3 12.2 21.8 YS Woodland-Gibson Road 061131003 6/23/08 41.9 7.7 13.4 28.5 34.2
An estimate of the PM10 mass contributed by the smoke from the wildfires to the concentrations at the monitoring sites is given in Table 11. Based on data from the previous three year period, 2005-2007, the upper range of a normal concentration falls anywhere from the seasonal average lower limit of 13 ug/m3 (Ukiah) to the 98th percentile upper limit of 92 ug/m3 (Yreka) (The 98th percentile used here is an extrapolated estimate based on 1-in-6 day sampling and discounting previously approved exceptional events.) The data for Yreka includes data impacted by the Moonlight Fire, a pending exceptional event on July 17, 2007, which accounts for its high value, making the upper limit a conservative estimate.

7/20/2009
72
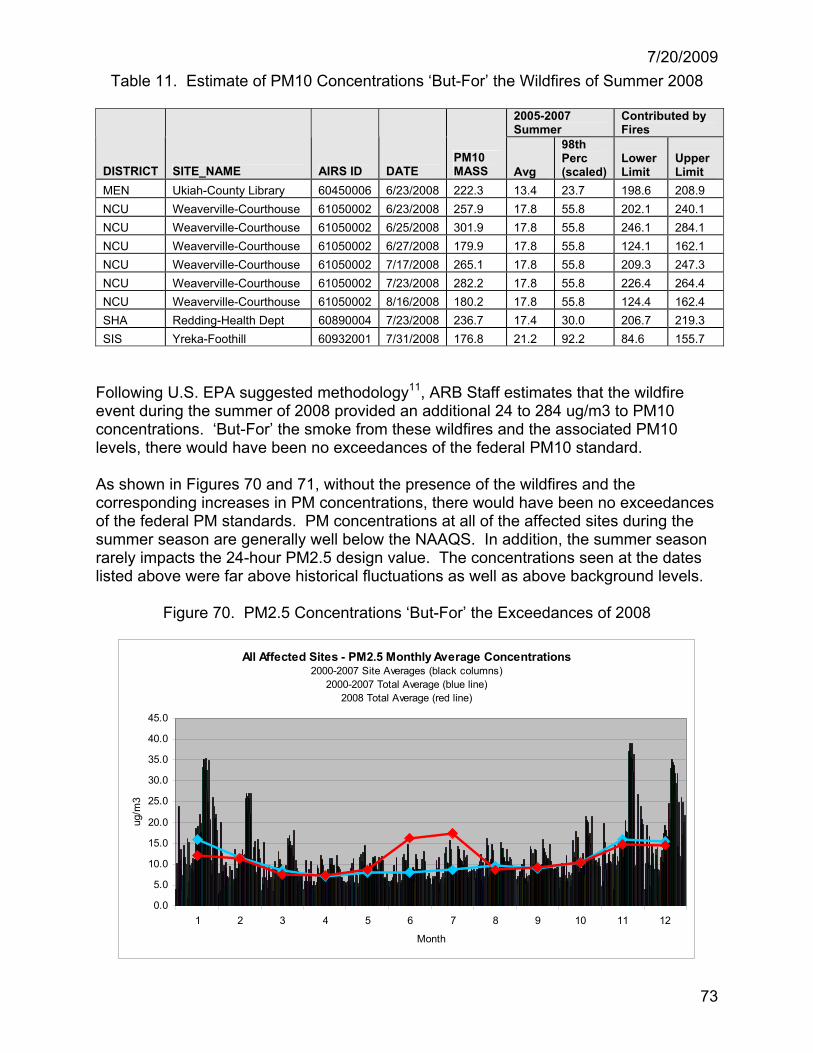
7/20/2009
73
Table 11. Estimate of PM10 Concentrations ‘But-For’ the Wildfires of Summer 2008
2005-2007 Summer
Contributed by Fires
DISTRICT SITE_NAME AIRS ID DATE PM10 MASS Avg
98th Perc (scaled)
Lower Limit
Upper Limit
MEN Ukiah-County Library 60450006 6/23/2008 222.3 13.4 23.7 198.6 208.9 NCU Weaverville-Courthouse 61050002 6/23/2008 257.9 17.8 55.8 202.1 240.1 NCU Weaverville-Courthouse 61050002 6/25/2008 301.9 17.8 55.8 246.1 284.1 NCU Weaverville-Courthouse 61050002 6/27/2008 179.9 17.8 55.8 124.1 162.1 NCU Weaverville-Courthouse 61050002 7/17/2008 265.1 17.8 55.8 209.3 247.3 NCU Weaverville-Courthouse 61050002 7/23/2008 282.2 17.8 55.8 226.4 264.4 NCU Weaverville-Courthouse 61050002 8/16/2008 180.2 17.8 55.8 124.4 162.4 SHA Redding-Health Dept 60890004 7/23/2008 236.7 17.4 30.0 206.7 219.3 SIS Yreka-Foothill 60932001 7/31/2008 176.8 21.2 92.2 84.6 155.7
Following U.S. EPA suggested methodology11, ARB Staff estimates that the wildfire event during the summer of 2008 provided an additional 24 to 284 ug/m3 to PM10 concentrations. ‘But-For’ the smoke from these wildfires and the associated PM10 levels, there would have been no exceedances of the federal PM10 standard. As shown in Figures 70 and 71, without the presence of the wildfires and the corresponding increases in PM concentrations, there would have been no exceedances of the federal PM standards. PM concentrations at all of the affected sites during the summer season are generally well below the NAAQS. In addition, the summer season rarely impacts the 24-hour PM2.5 design value. The concentrations seen at the dates listed above were far above historical fluctuations as well as above background levels.
Figure 70. PM2.5 Concentrations ‘But-For’ the Exceedances of 2008
All Affected Sites - PM2.5 Monthly Average Concentrations 2000-2007 Site Averages (black columns)
2000-2007 Total Average (blue line)2008 Total Average (red line)
0.0
5.0
10.0
15.0
20.0
25.0
30.0
35.0
40.0
45.0
1 2 3 4 5 6 7 8 9 10 11 12
Month
ug/m
3
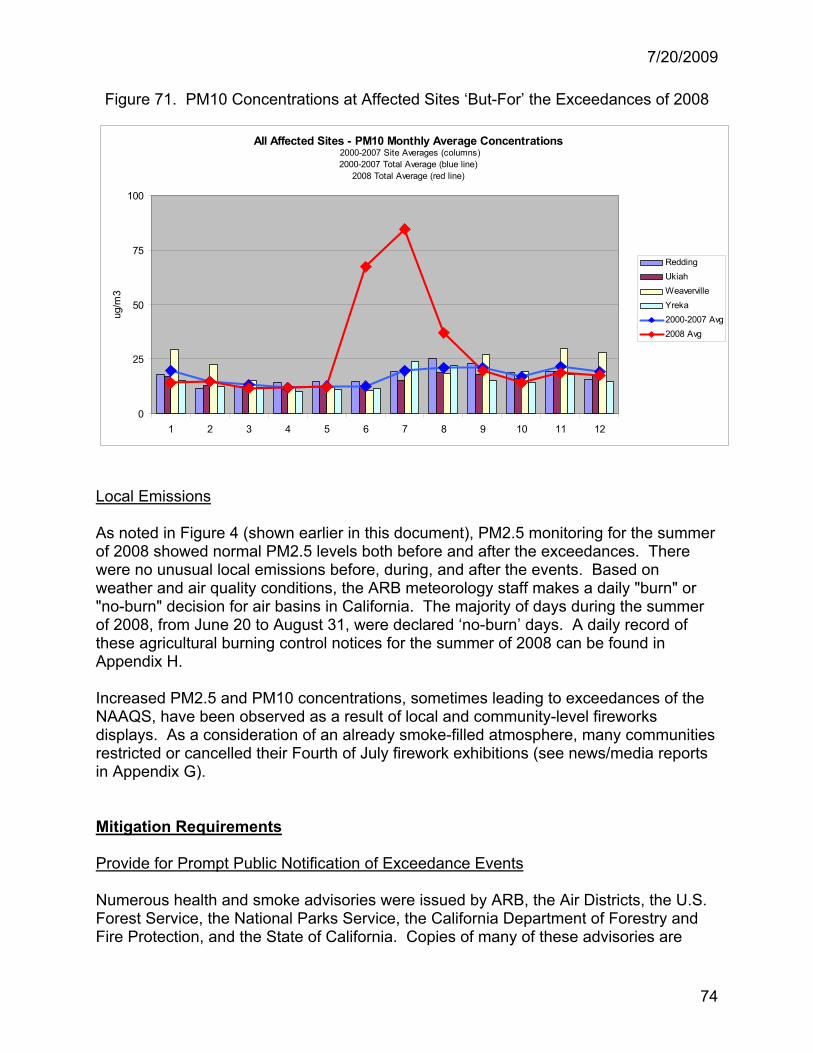
7/20/2009
74
Figure 71. PM10 Concentrations at Affected Sites ‘But-For’ the Exceedances of 2008
All Affected Sites - PM10 Monthly Average Concentrations 2000-2007 Site Averages (columns) 2000-2007 Total Average (blue line)
2008 Total Average (red line)
0
25
50
75
100
1 2 3 4 5 6 7 8 9 10 11 12
ug/m
3
ReddingUkiahWeavervilleYreka2000-2007 Avg2008 Avg
Local Emissions As noted in Figure 4 (shown earlier in this document), PM2.5 monitoring for the summer of 2008 showed normal PM2.5 levels both before and after the exceedances. There were no unusual local emissions before, during, and after the events. Based on weather and air quality conditions, the ARB meteorology staff makes a daily "burn" or "no-burn" decision for air basins in California. The majority of days during the summer of 2008, from June 20 to August 31, were declared ‘no-burn’ days. A daily record of these agricultural burning control notices for the summer of 2008 can be found in Appendix H. Increased PM2.5 and PM10 concentrations, sometimes leading to exceedances of the NAAQS, have been observed as a result of local and community-level fireworks displays. As a consideration of an already smoke-filled atmosphere, many communities restricted or cancelled their Fourth of July firework exhibitions (see news/media reports in Appendix G). Mitigation Requirements Provide for Prompt Public Notification of Exceedance Events Numerous health and smoke advisories were issued by ARB, the Air Districts, the U.S. Forest Service, the National Parks Service, the California Department of Forestry and Fire Protection, and the State of California. Copies of many of these advisories are

7/20/2009
75
included in Appendix F. Advisories issued by individual Air Districts are included in their supporting documents. Health Advisory Programs exist at all of the Air Districts to promptly notify the public, via website postings, news media releases, faxes, e-mail, and phone text messages, of unhealthy air quality events when data indicate the likelihood of air pollutant concentrations reaching the Unhealthy for Sensitive Groups range or exceeding the NAAQS. Numerous agencies (including the Air Districts and ARB) operate PM2.5 BAM sites (both permanent and temporary) for forecasting purposes. This data is used to keep the public informed of current conditions, and much of it is posted to the Internet via the ARB’s website. In the case of any smoke incursion, ARB and the Air Districts work in cooperation with local health agencies, media, and other entities to provide timely information to the public on the health hazards of smoke and ways to minimize health impacts. Provide for Public Education on How to Minimize Exposure ARB, the Air Districts, the U.S. Forest Service, the National Park Service, the California Department of Forestry and Fire Protection, and the State of California, all have active community outreach programs, as well as easily accessible information on numerous websites, to aid in public education on the hazards posed by smoke from wildfires and how to minimize exposure. For example, ARB has published, "Wildfire Smoke: A Guide for Public Health Officials", readily available as hard-copy or on-line, to aid local officials, as well as the general public, in understanding the health impacts of wildfire smoke12. In addition, the California Air Pollution Control Officers’ Association (CAPCOA) Public Outreach Committee, comprised of representatives of all the California Air Districts, maintains an up-to-date webpage to consolidate and disseminate consistent information on the impact of smoke on public health13. Summary This report documents that the event met the criteria stated earlier and provides analysis to demonstrate that:
I. The events were not reasonably controllable or preventable because the smoke originated from a non-anthropogenic source; The smoke impacting the monitoring sites originated from numerous wildfires throughout Northern and Central California, ignited when a series of dry thunderstorms moved through the area on June 20-21, 2008. Most of these fires were not contained until late-July or early-August, with some contained as late as October. Smoke impacts were experienced over a vast area, encompassing the entire State of California and portions of neighboring states as detailed in numerous news reports as well as in the NOAA Smoke Text Products in Appendix E.
7/20/2009
76
II. There is a clear-causal connection between the smoke from the wildfires and the exceedances at the monitoring sites.; Both satellite images and on-the-ground smoke reports reiterate the extent of the smoke in the affected areas. Although detailed speciation data is not available for all sites, the three representative sites show that a marked increase in organic carbon concentrations. A clear-causal connection exists between the smoke from the fires and the rising PM levels seen at the monitoring sites. III. The measured concentrations were beyond normal historical levels; The average PM mass concentrations for the affected sites, without impacts from the Lightning Complex Fires, are well below the NAAQS. The measured concentrations during June, July, and August ranged from twice to almost thirty times the expected levels, making the PM concentrations historically significant. IV. The exceedances would not have occurred “but for” the smoke from the wildfires. PM concentration levels at the affected sites before June 20 were close to expected levels for summer. As noted in Tables 10 and 11 above, an estimated 5 to 284 ug/m3 was contributed by the smoke from the wildfires. ‘But-for’ this contribution, PM levels would have been substantially below the NAAQS.
The rise in PM concentrations at the affected sites, accompanied by close proximity to smoke from the extensive Lightning Complex Fires and further implicated by satellite images, trajectory analysis, and news media reports, indicate a clear and causal connection between the smoke from the wildfires and the exceedances at the monitors. Further analysis of historical and background levels, as well as local emissions, indicates that ‘but-for’ the smoke, there would not have been an exceedance at the affected monitors. List of Appendices
A. Complete List of Monitoring Sites and Days Requested for Exclusion B. Meteorology Surface and Upper-Air Maps C. Satellite Images D. Fire Maps E. NOAA Satellite Services Division, Smoke Maps, and Smoke Text Products F. Health and Smoke Advisories G. Media reports H. ARB Agricultural Burn Decisions
List of Attachments
1. Air District Documents 2. State of California Ozone Natural Event Document
7/20/2009
77
References 1. Federal Register (72 FR 13560-13581). Treatment of Data Influenced by Exceptional Events; Final Rule. Vol.72, No. 55, Pages 13560-13581, March 22, 2007, 2. National Oceanic and Atmospheric Administration (NOAA). MODIS Rapid Response System. Frequently Asked Questions. [rapidfire.sci.gsfc.nasa.gov/faq/]. 2009 3. National Oceanic and Atmospheric Administration (NOAA). National Weather Service, Sacramento Fire Weather 2008 Annual Summary [www.wrh.noaa.gov/sto/fire_wx_verification_2008.pdf], 2009 4. National Oceanic and Atmospheric Administration (NOAA). National Weather Service, Eureka Fire Weather 2008 Annual Summary [www.wrh.noaa.gov/eka/firewx/2008 Annual Report – print version.pdf], 2009 5. Berlant, Daniel. The June Lightning Siege. Communique, CalFIRE, Spring 2009 6. Burger, Mark A. The Northwest California Lightning Event of June 20-21, 2008. National Weather Service [www.wrh.noaa.gov/wrh/08TAs/ta0814.pdf], November 24, 2008 7. U.S. Department of Homeland Security, Federal Emergency Management Association, California Wildfires Emergency Declaration [/www.fema.gov/news/event.fema?id=10207], June 28, 2008 8. U.S. Department of Commerce, National Climate Data Center. Climate of 2008 Wildfire Season Summary. [www.ncdc.noaa.gov/oa/climate/research/2008/fire08.html]. Updated January 8, 2009. 9. Abatzoglou, J., and T. Brown. Climatology of June-July 2008 smoke event in California: A brief analysis. Desert Research Institute, July 12, 2008. 10. Brown, T., Abatzoglou, J., and J. Snook. The Meteorological and Fire Extremes of California 2008. Geophysical Res. Abstracts, Vol. 11, EGU2009-11548, 2009. 11. United States Environmental Protection Agency (U.S. EPA), Neil Frank, Presenting Evidence to Justify Data Exclusion as an Exceptional Event, Presentation to Westar State/EPA Exceptional Events Implementation Meeting, February 25-26, 2009. 12. California Air Resources Board (ARB). Smoke Management Program. Wildfire Smoke: A Guide for Public Health Officials [www.arb.ca.gov/smp/progdevpubeduc/wfgv8.pdf], Rev. July 2008. 13. California Air Pollution Control Officers’ Association (CAPCOA). Smoke Impact. [www.airquality.org/smokeimpact/], 2009
7/20/2009
78
Resources California Air Resources Board (CARB). Air Quality and Meteorological Information System (AQMIS2). [www.arb.ca.gov/aqmis2/aqinfo.php], 2009 California Air Resources Board (CARB). California Ambient Air Quality Data (1980-2007). 2009 Air Quality Data DVD, January 2009. National Oceanic and Atmospheric Administration (NOAA). Air Resources Laboratory, Hybrid Single Particle Lagrangian Integrated Trajectory Model (HYSPLIT): http://www.arl.noaa.gov/HYSPLIT.php, 2009 National Oceanic and Atmospheric Administration (NOAA). Satellite Services Division, Smoke Text Product: http://www.ssd.noaa.gov/ps/fire/data/smoke, 2009 National Oceanic and Atmospheric Administration (NOAA). Satellite and Information Service, National Environmental Satellite, Data, and Information Service (NESDIS) Satellite Fire Detections: http://map.ngdc.noaa.gov/website/firedetects/viewer.htm, 2009 National Oceanic and Atmospheric Administration (NOAA). Storm Prediction Center, Fire Weather Forecast Archives: http://www.spc.noaa.gov/products/fire_wx/, 2009 National Oceanic and Atmospheric Administration (NOAA). National Centers for Environmental Prediction. Hydrometeorological Prediction Center. Daily Weather Maps. http://www.hpc.ncep.noaa.gov/dailywxmap/index.html, 2009 University of Maryland, Baltimore County. U.S. Air Quality Website. http://alg.umbc.edu/usaq/archives/2008_06.html http://alg.umbc.edu/usaq/archives/2008_07.html http://alg.umbc.edu/usaq/archives/2008_08.html Websites Detailing the Exceptional Event (sites active as of time of submission of this document) Exceptional Events. 2008 Wildfires. Youtube. http://www.youtube.com/partmatter 2008 Lightning Siege Overview. California Department of Forestry and Fire Prevention. http://www.fire.ca.gov/index_incidents_overview.php California Wildfires June 2008. Mahalo.com. http://www.mahalo.com/california-wildfires-june-2008 California Wildfires. NOAA Goddard Earth Sciences, Data and Information Services Center. http://disc.sci.gsfc.nasa.gov/oceancolor/locus/wildfires.shtml Fires in California. NASA Earth Observatory. http://earthobservatory.nasa.gov/NaturalHazards/view.php?id=20145 Summer 2008 California wildfires. Wikipedia. http://en.wikipedia.org/wiki/Summer_2008_California_wildfires
7/20/2009
79
California Wildfires 2008 Aftermath. University Business Magazine. http://blogs.universitybusiness.com/2008/11/california-wildfires-2008-aftermath-part-i.html http://blogs.universitybusiness.com/2008/11/california-wildfires-2008-aftermath-part-ii.html Northern California Fire Updates. About.com: San Francisco. http://sanfrancisco.about.com/b/2008/06/28/northern-california-fire-updates.htm