plotting direct and indirect assessment radar charts …lottin direct and indirect assessment radar...
TRANSCRIPT
Submit Manuscript | http://medcraveonline.com
IntroductionAcademic courses are prepared and delivered to students under
specific learning outcomes and objectives. Outcomes refer to the theoretical or practical knowledge and abilities students attain by the time they are graduated from the course.1 Objectives refer to potential skills and abilities students will have after graduating from the course.1 ABET (Accreditation Board for Engineering and Technology) categorizes the student outcomes of a given course into 16 categories, depicted by the letters (a to k):
a. “An ability to apply knowledge of mathematics, science and engineering,
b. An ability to design and conduct experiments, as well as to analyze and interpret data,
c. An ability to design a system, component, or process to meet desired needs within realistic constraints such as economic, environmental, social, political, ethical, health and safety, manufacturability, and sustainability,
d. An ability to function on multidisciplinary teams,
e. An ability to identify, formulate, and solve engineering problems,
f. An understanding of professional and ethical responsibility,
g. An ability to communicate effectively (orally, written),
h. The broad education necessary to understand the impact of engineering solutions in a global, economic, environmental, and societal context,
i. A recognition of the need for, and an ability to engage in life–long learning,
j. A knowledge of contemporary issues,
k. An ability to use the techniques, skills, and modern engineering tools necessary for engineering practice”.1
One important measurement in the academic field is the measurement of the degree to which an academic program has succeeded in delivering its content to the students, and how much did the students achieved with regards to set objectives and outcomes of the specific program? Furthermore, ABET defines different types of assessments including direct, indirect, qualitative and quantitative ones.1 In this paper the authors described the vital steps needed to prepare direct and indirect student assessment tools in a simple and easy format.
ABET direct assessment
ABET defines assessment as “Assessment is one or more processes that identify, collect, and prepare data to evaluate the attainment of student outcomes and program educational objectives. Effective assessment uses relevant direct, indirect, quantitative, and qualitative measures as appropriate to the objective or outcome being measured. Appropriate sampling methods may be used as part of an assessment process.”2,3 ABET elaborates more on direct assessments by stating that “Direct assessments provide for the direct examination or observation of student knowledge or skills against measurable learning outcomes. Direct assessments of student learning could be conducted throughout a course using such techniques as exams, quizzes, demonstrations, simulations, portfolio, and reports. These techniques provide a sampling of what students know and/or can do. Besides they provide strong evidence of student learning”.4 Examples of direct assessment methods include comprehensive examinations; commercial, and standardized designs; certification or licensure examinations; course assignments; research papers; capstone or senior design project evaluations; internship portfolio valuations; reflective journal appraisals; writing proficiency examinations; oral presentation judgments with criteria or rubrics; case study review and national standard tests; etc.5–7
ABET indirect assessment
ABET defines indirect assessment as “Indirect assessments of student learning ascertain the perceived extent or value of learning
Int Rob Auto J. 2017;2(5):171‒181. 171©2017 Abdel–Magid et al. This is an open access article distributed under the terms of the Creative Commons Attribution License, which permits unrestricted use, distribution, and build upon your work non-commercially.
Plotting direct and indirect assessment radar charts for an academic course following abet accreditation system
Volume 2 Issue 5 - 2017
Mohammed Isam Mohammed Abdel–Magid,1 CEng Isam Mohammed Abdel–Magid2
1Health Assistance Medical Services, Qatar2Department of the Centre of Scientific Publications, Imam Abdulrahman Al Faisal University, Saudi Arabia
Correspondence: CEng Isam Mohammed Abdel–Magid, Department of the Centre of Scientific Publications, Imam Abdulrahman AlFaisal University, Saudi Arabia, Tel +966530310018, Email
Received: May 05, 2017 | Published: July 05, 2017
Abstract
The objectives of this paper are to describe in detail the steps to be followed in order to plot. Direct assessment chart for Student Learning Outcomes (SLOs) for an academic course following ABET accreditation system, and Student Indirect Assessment (SIA) for the learning outcomes of the same. Assessments to be followed are those defined by ABET as one of sixteen categories named a to k. Two methods are used to achieve the stated objectives: the first method is done using MS Excel spreadsheet program, while the second one relied on a special tool that was developed by the authors to serve the purpose of plotting Radar Charts for SLOs.
Keywords: ABET, student learning outcomes, student indirect assessment, radar chart, accreditation system
International Robotics & Automation Journal
Research Article Open Access
Plotting direct and indirect assessment radar charts for an academic course following abet accreditation system
172Copyright:
©2017 Abdel–Magid et al.
Citation: Abdel–Magid MIM Abdel–Magid CIM. Plotting direct and indirect assessment radar charts for an academic course following abet accreditation system. Int Rob Auto J. 2017;2(5):171‒181. DOI: 10.15406/iratj.2017.02.00032
experiences. They assess opinions or thoughts about student knowledge or skills. Indirect measures can provide information about student perception of their learning and how this learning is valued by different constituencies. An indirect assessment is useful in that it can be used to measure certain implicit qualities of student learning, such as values, perceptions, and attitudes, from a variety of perspectives. However, in the absence of direct evidence, assumptions must be made about how well perceptions match the reality of actual achievement of student learning”.4 Examples of indirect assessment methods include archival data, interviews, questionnaires, surveys, internal/external peer reviews of performance; exit interviews/surveys; alumni surveys; employer surveys; student satisfaction surveys; student course evaluations; graduation and retention rates; job placement of graduates; focus group discussions; graduate school acceptance rates; alumni honors, awards, and achievements; etc.5,8,9,10 More information may be obtained from the “ABET assessment webinar series” prepared by ABET (ABET 2017c).7
ObjectivesThe objective of this paper is be to delineate the steps to follow in
order to plot direct assessment chart for Student Learning Outcomes (SLOs) for an academic course following ABET accreditation system. Another chart for Student Indirect Assessment (SIA) for the learning outcomes will also be shown.
Direct assessment radar chart for student learning outcomes (SLOs)
In the following sections, the steps to plot SLO chart will be shown using two methods. The first method will be using Microsoft Excel (MS Excel) to draw the charts. The second method will use a tool that was specifically programmed by the authors to achieve the same results. For purposes of demonstrating the steps involved in calculations, a sample class of (5) students will be used throughout the discussion.
First method (MS Excel plot)
In the first method, the assessor will be using MS Excel spreadsheet software to accomplish the task of plotting a radar chart for the direct assessment of students SLOs.11,12
Task: Draw Student Learning Outcomes (SLOs) radar chart for the academic course “Library skills” (course code: HUMN 203), offered at the Environmental Engineering Dept. of the College of Engineering at Imam Abdulrahman Bin Faisal University, given the following information:
a. Overall grade records (Table 1).
b. Record of activities (Table 2).
c. Records of mid–term examination results (Table 3).
d. Records of final examination results (Table 4).
Detailed solution for task: The program must have documented student outcomes that prepare graduates to attain the program educational objectives. Student outcomes are outcomes (a) through (k) plus any additional outcomes that may be articulated by the program (ABET).
Step 1: Formulate course ABET outcomes.
As an example, select ABET Student Outcomes (SO) for the academic course in “Library skills, HUMN 203” to include the three (3) selections out of ABET (a) through (k) outcomes i.e. (d), (f) and (i).
Step 2: Prepare needed data to plot chart (include all marks and results attained by all students for different identified assessment components. In the case under consideration, the data gathered contained: quizzes, assignments and activities, plus mid and final term examinations):
a. Record quiz results (Quiz number, students enrolled and related marks in any exam question as related to its affiliated (a) through (k) outcomes) (Table 1). In this case, two (2) quizzes were offered and ten (10) marks were allocated for the two (2) of them (five (5) marks for each) out of the course total as presented in Table 5.
b. Note results for “assignments and activities” as presented in Table 2. Assignments ought to be distributed as per their actual weights. For instance, in this worked example twenty (20) activities were introduced to students with outcomes of (d), (f) and (i) of (13), (2) and (5) for each corresponding activity, respectively (This gives a ratio distribution of 65, 10 and 25 percent between their 30 allocated marks) (Table 6). Total marks reserved for assignments are thirty (30) marks out of hundred (100) for the course. Distribution of marks for students will be as presented in Table 7.
c. Register midterm examination results for each student as given in Table 3. In this case, twenty (20) marks were reserved for this component. Number of questions given in the midterm exam was five (5) questions addressing items (f) and (i) only with ratios as depicted in Table 8. The adjusted midterm examination results are shown in Table 9.
d. Final examination results are shown in Table 4. In this case forty (40) marks were reserved for this issue. Four (4) questions portrayed the exam addressing (i) and (f) outcomes in ratios given in Table 10. Then final examination adjusted results are as given in Table 11.
Table 1 Overall grade records for sample class
#
Student's Term evaluations End of term exam grade
Rounded final grade
Letter gradeID # Name 1st
Quiz2nd Quiz Assignments Mid term
examTotal mark
Mark distribution 5 5 30 20 40 100
1 X Student # 3 4 4 30 18 34 90 A
2 X Student # 4 5 4 30 18 33 90 A
3 X Student # 5 5 4 30 18 34 91 A
4 X Student # 6 4 4 30 19 34 91 A
5 X Student # 7 4 5 30 15 27 81 B
Plotting direct and indirect assessment radar charts for an academic course following abet accreditation system
173Copyright:
©2017 Abdel–Magid et al.
Citation: Abdel–Magid MIM Abdel–Magid CIM. Plotting direct and indirect assessment radar charts for an academic course following abet accreditation system. Int Rob Auto J. 2017;2(5):171‒181. DOI: 10.15406/iratj.2017.02.00032
Table 2 Record of activities for sample class
Activity number
#1 #2 #3 #4 #5 #6 #7 #8 #9 #10 #11 #12 #13 #14 #15 #16 #17 #18 #19 #20Total out of 30 marks (or %)Name i f d d i d f d d d d d d i d i d d d i
X 8 10 9 9 6 9 10 10 10 10 9 10 10 10 8 10 10 0 10 10 26.7
X 0 0 9 9 0 10 12 10 14 0 15 8 10 8 10 0 10 35 10 10 25.5
X 10 12 8 9 10 10 12 10 14 9 15 10 10 9 10 10 10 0 10 10 29.7
X 10 10 9 9 12 10 9 10 10 7 8 15 10 10 10 10 10 0 10 10 28.35
X 10 9 9 10 7 9 10 10 10 10 9 10 10 10 8 12 10 0 10 10 27.45
Table 3 Records of mid-term examination results for sample class
Name Q1 Q2 Q3 Q4 Q5 Total out of 100 marks
Total out of 20 marks
1 X 17.5 18 16 15 18 84.5 16.9
2 X 17.5 18 16 16 19 86.5 17.3
3 X 17.5 19 18 15 18 87.5 17.5
4 X 17.5 19 19 17 19 91.5 18.3
5 X 17.5 10 19 15 12 73.5 14.7
Table 4 Records of final examination results for sample class
Name Q1 Q2 Q3 Q4 Total out of 100 marks Total out of 40 marks
1 X 21 23 21 18 83 33.2
2 X 20 23 21 18 82 32.8
3 X 23 20 20 22 85 34
4 X 22 21 20 21 84 33.6
5 X 20 18 21 8 67 26.8
Table 5 Quiz results for all students enrolled within the course for a sample class
ABET(d)
(f)(i) Total out of 5 marks
Quiz (2) Quiz (1) Total for Quiz 1 Total for Quiz 2
1 X 4 4 4 4
2 X 4 4.5 4.5 4
3 X 4 5 5 4
4 X 4 3.5 3.5 4
5 X 5 4 4 5
Class average 4.2 4.2
Table 6 Assignments and activities as related to ABET SLOs (d), (f), and (i) for sample class
Distribution of assignments between each other
Distribution of assignments between each other
(d) (f) (i)
Total # of assignments=20 13 2 5
Fraction of total 0.65 0.1 0.25
Percent of total (%) 65 10 25

Plotting direct and indirect assessment radar charts for an academic course following abet accreditation system
174Copyright:
©2017 Abdel–Magid et al.
Citation: Abdel–Magid MIM Abdel–Magid CIM. Plotting direct and indirect assessment radar charts for an academic course following abet accreditation system. Int Rob Auto J. 2017;2(5):171‒181. DOI: 10.15406/iratj.2017.02.00032
Table 7 Weighted results for assignments and activities for sample class
ID # Name (d) (f) (i) Total
1 X 17.1 3 6.6 26.7
2 X 21 1.8 2.7 25.5
3 X 18.75 3.6 7.35 29.7
4 X 17.7 2.85 7.8 28.35
5 X 17.25 2.85 7.35 27.45
class average 18.36 2.82 6.36 27.54
Table 8 Midterm examination questions as related to ABET SLOs (f) and (i) for sample class
ABET (d) (f) (i) Total
Questions Q1+Q2+Q3 Q4+Q5
Fraction of total mark 0.4 0.6 1
Percentage of total mark 40 60 100
Table 9 Midterm adjusted examination results for sample class
Name (d) (f) (i) Total out of 20 marks
1 xxxxxxxxx 10.3 6.6 16.9
2 xxxxxxxxx 10.3 7 17.3
3 xxxxxxxxx 10.9 6.6 17.5
4 xxxxxxxxx 11.1 7.2 18.3
5 xxxxxxxxx 9.3 5.4 14.7
class average 10.38 6.56 16.94
Table 10 Final examination questions as related to ABET SLOs (i) and (f) for sample class
ABET (i) (f) Total
Questions Q2+Q4 Q1+Q3
Fraction of total mark 0.5 0.5 1
Percentage of total mark 50 50 100
Table 11 Final adjusted examination results for sample class
Name (d) (f) (i) Total out of 40 marks
1 X 16.8 16.4 33.2
2 X 16.4 16.4 32.8
3 X 17.2 16.8 34
4 X 16.8 16.8 33.6
5 X 16.4 10.4 26.8
class average 16.72 15.36 32.08
Step (3): An assessment tool need to be assumed and selected as depicted in Table 12. In this case, the ratios selected for course ingredients were adhered–to in formulating the SLOs assessment tool.
Step (4): Find weighted actual marks for all students as indicated in Table 13. Average for each category (d, f and i) should be calculated
for the whole class of students. Total ought to be related to the assessment tool of Table 12.
Step (5): Prepare results from Table 13 as shown in Table 14.
Table 12 Assessment tool for (d), (f), and (i) ABET SLOs, selected for sample course
Assessment tool/SLO (d) (f) (i)
Ratio used Herein is the same one approved for course portfolio
Quizzes 5 5 10
Assignments 19.5 3 7.5 30
Midterm exam 12 8 20
Final exam 20 20 40
Total 24.5 35 40.5 100
Table 13 Weighted actual marks for all students for sample class
Actual marks (d) (f) (i)
Quizzes 4.2 4.2
Assignments 18.36 2.8 6.36
Midterm exam 10.38 6.56
Final exam 16.72 15.36
Total 22.56 29.92 32.48
Total related to assessment tool 92.08 85.49 80.2
Table 14 Averages for sample class as related to assessment tool
ABET SLO
(a) (b) (c) (d) (e) (f) (g) (h) (i) (j) (k)
Weighted marks
92.08 85.5 80.2
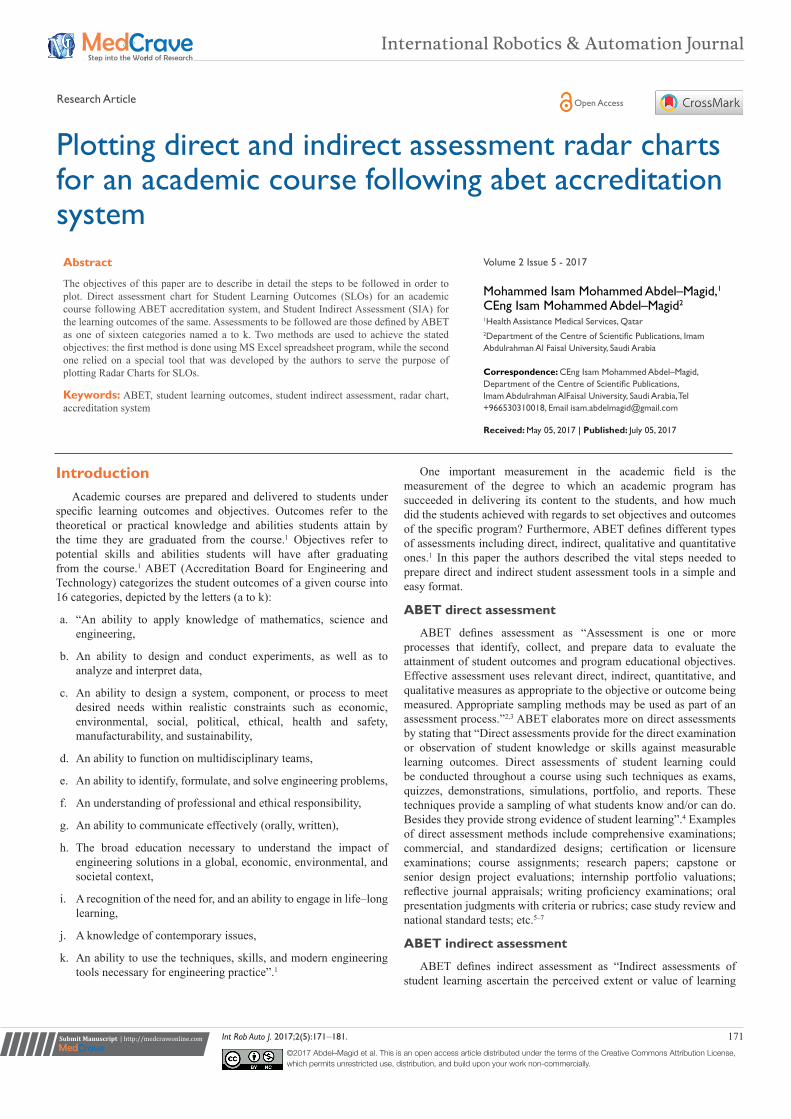
Step (6): Plot the radar chart by selecting “Insert” from MS Excel menu. Then select “Radar” from Charts → Other Charts. The inserted Radar chart is shown in Figure 1.
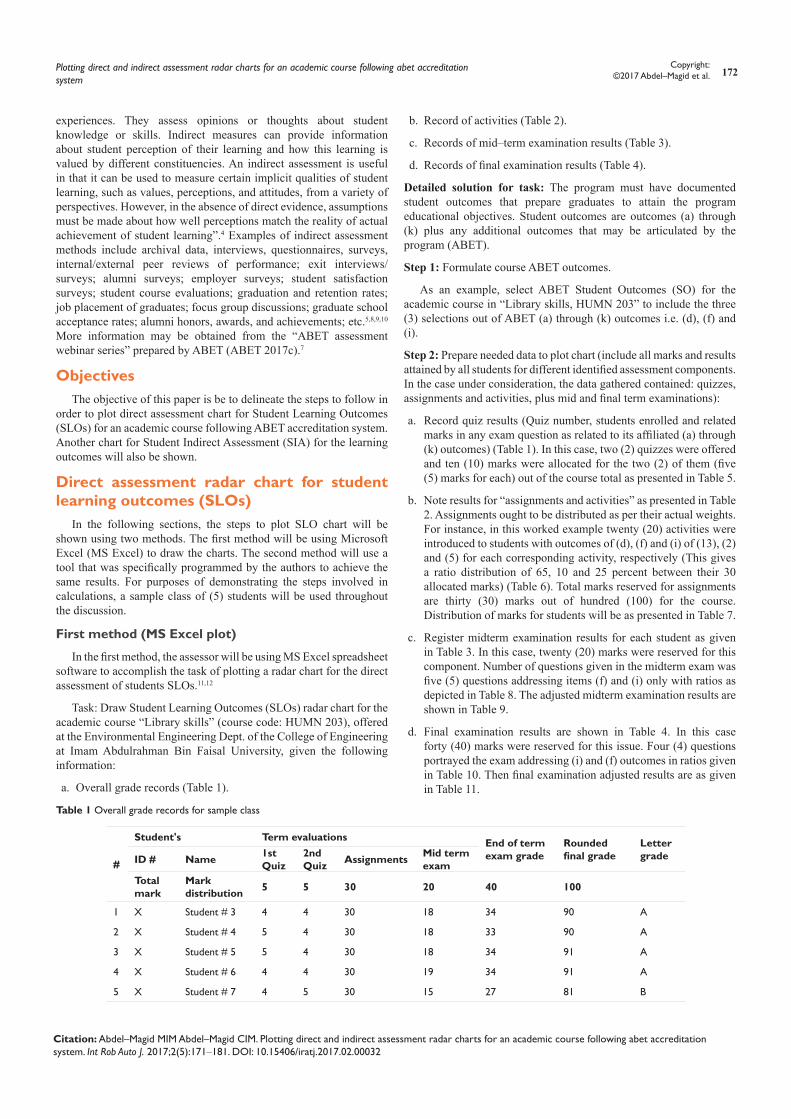
Step (7): Manually connect the dots and add to the plot the triangle (d f i) of LOs on top of the radar web as presented in Figure 2.
Second method (Abdel–Magid RadarChart Creator Tool)
In the second method, you will be using a tool that the authors have prepared specifically for this task. The tool is called “Radar Chart Creator Tool” and can be obtained by contacting the author (Dr. Mohammed Isam Mohammed Abdel–Magid) through his email. Task: Draw Student Learning Outcomes (SLOs) radar chart for the academic course “Library skills” (course code: HUMN 203), offered at the Environmental Engineering Dept. of the College of Engineering at Imam Abdulrahman Bin Faisal University, given the information detailed in Tables (1–4).
Detailed solution for task
After obtaining the tool executable file, double click on it in Windows Explorer to run the tool. Afterwards, follow these steps in order to accomplish the task at hand:
Plotting direct and indirect assessment radar charts for an academic course following abet accreditation system
175Copyright:
©2017 Abdel–Magid et al.
Citation: Abdel–Magid MIM Abdel–Magid CIM. Plotting direct and indirect assessment radar charts for an academic course following abet accreditation system. Int Rob Auto J. 2017;2(5):171‒181. DOI: 10.15406/iratj.2017.02.00032
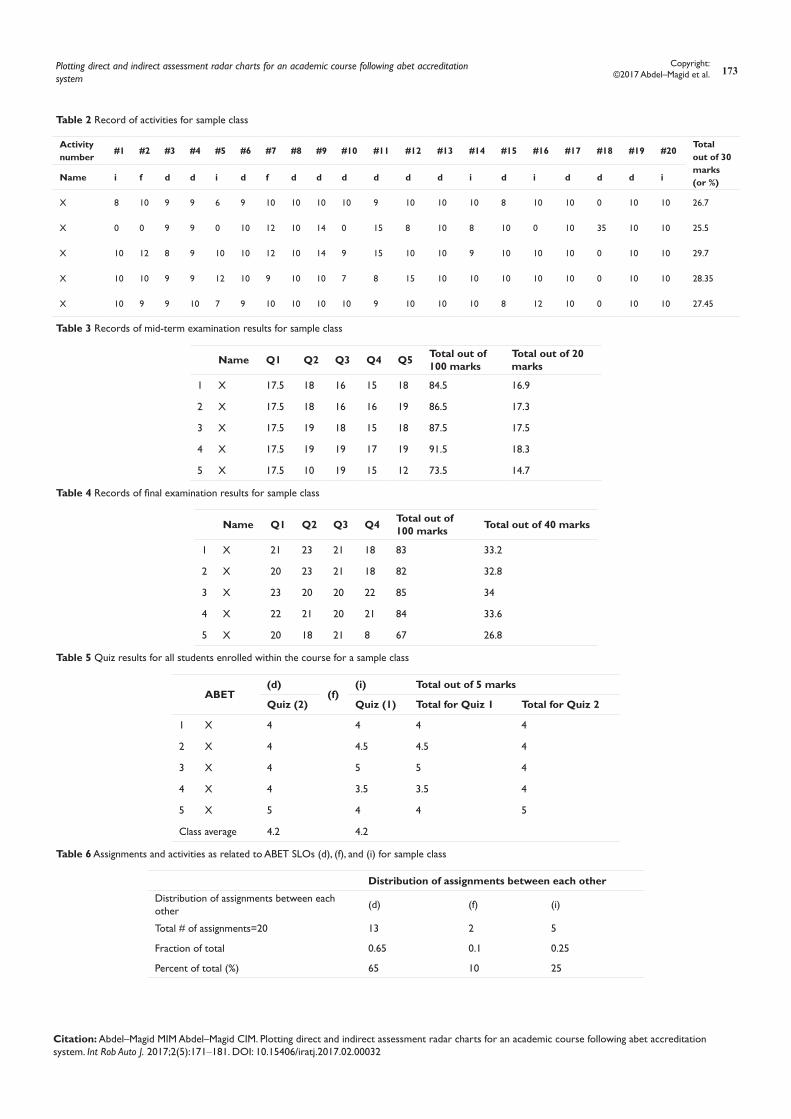
Step (1): The first screen of the program is shown in Figure 3. Fill in the fields with the course data, as shown in Figure 4.
Figure 1 Sample course SLOs radar chart in MS Excel.
Figure 2 Final SLOs radar chart for sample course.
Figure 3 First screen of the Radar Chart Creator Tool.
Figure 4 First screen of the Radar Chart Creator Tool with fields filled out.
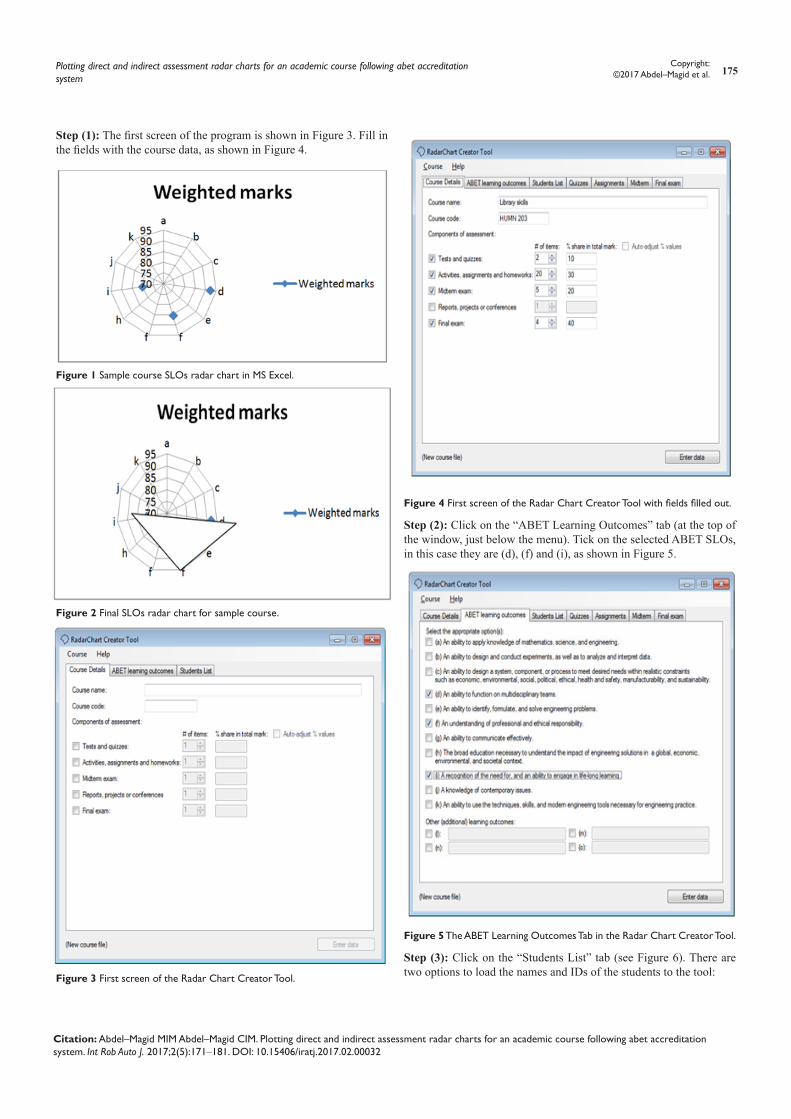
Step (2): Click on the “ABET Learning Outcomes” tab (at the top of the window, just below the menu). Tick on the selected ABET SLOs, in this case they are (d), (f) and (i), as shown in Figure 5.
Figure 5 The ABET Learning Outcomes Tab in the Radar Chart Creator Tool.
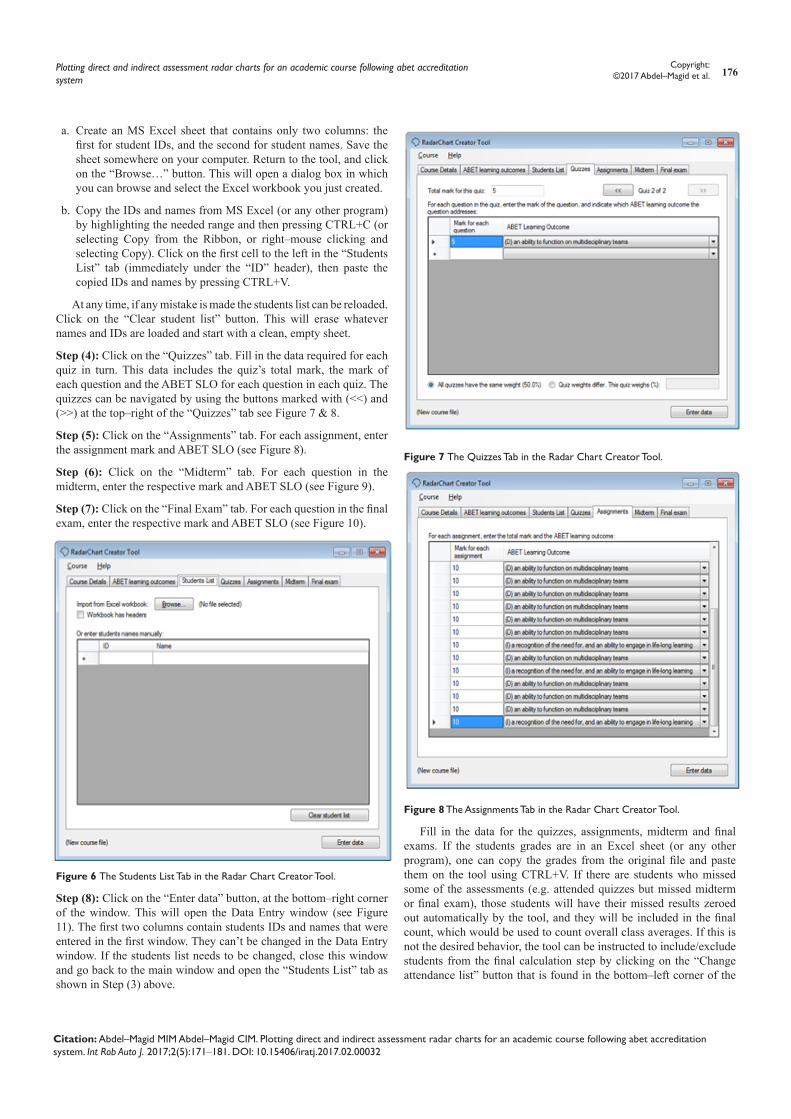
Step (3): Click on the “Students List” tab (see Figure 6). There are two options to load the names and IDs of the students to the tool:
Plotting direct and indirect assessment radar charts for an academic course following abet accreditation system
176Copyright:
©2017 Abdel–Magid et al.
Citation: Abdel–Magid MIM Abdel–Magid CIM. Plotting direct and indirect assessment radar charts for an academic course following abet accreditation system. Int Rob Auto J. 2017;2(5):171‒181. DOI: 10.15406/iratj.2017.02.00032
a. Create an MS Excel sheet that contains only two columns: the first for student IDs, and the second for student names. Save the sheet somewhere on your computer. Return to the tool, and click on the “Browse…” button. This will open a dialog box in which you can browse and select the Excel workbook you just created.
b. Copy the IDs and names from MS Excel (or any other program) by highlighting the needed range and then pressing CTRL+C (or selecting Copy from the Ribbon, or right–mouse clicking and selecting Copy). Click on the first cell to the left in the “Students List” tab (immediately under the “ID” header), then paste the copied IDs and names by pressing CTRL+V.
At any time, if any mistake is made the students list can be reloaded. Click on the “Clear student list” button. This will erase whatever names and IDs are loaded and start with a clean, empty sheet.
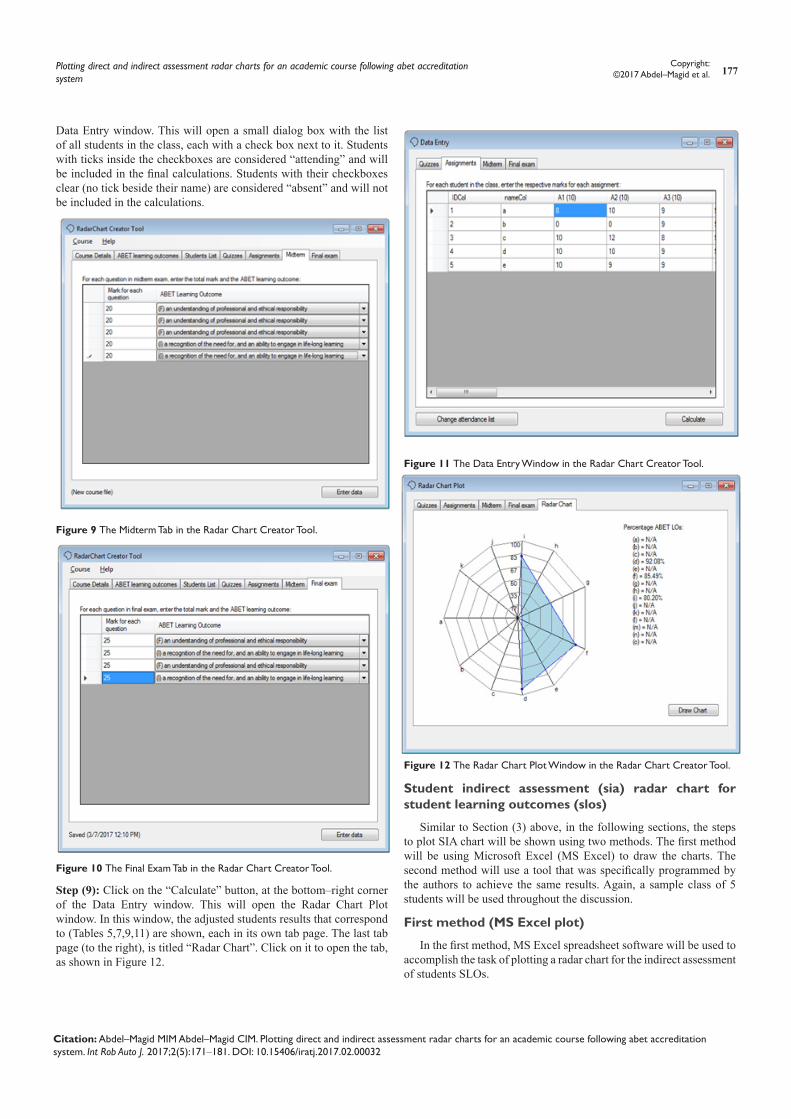
Step (4): Click on the “Quizzes” tab. Fill in the data required for each quiz in turn. This data includes the quiz’s total mark, the mark of each question and the ABET SLO for each question in each quiz. The quizzes can be navigated by using the buttons marked with (<<) and (>>) at the top–right of the “Quizzes” tab see Figure 7 & 8.
Step (5): Click on the “Assignments” tab. For each assignment, enter the assignment mark and ABET SLO (see Figure 8).
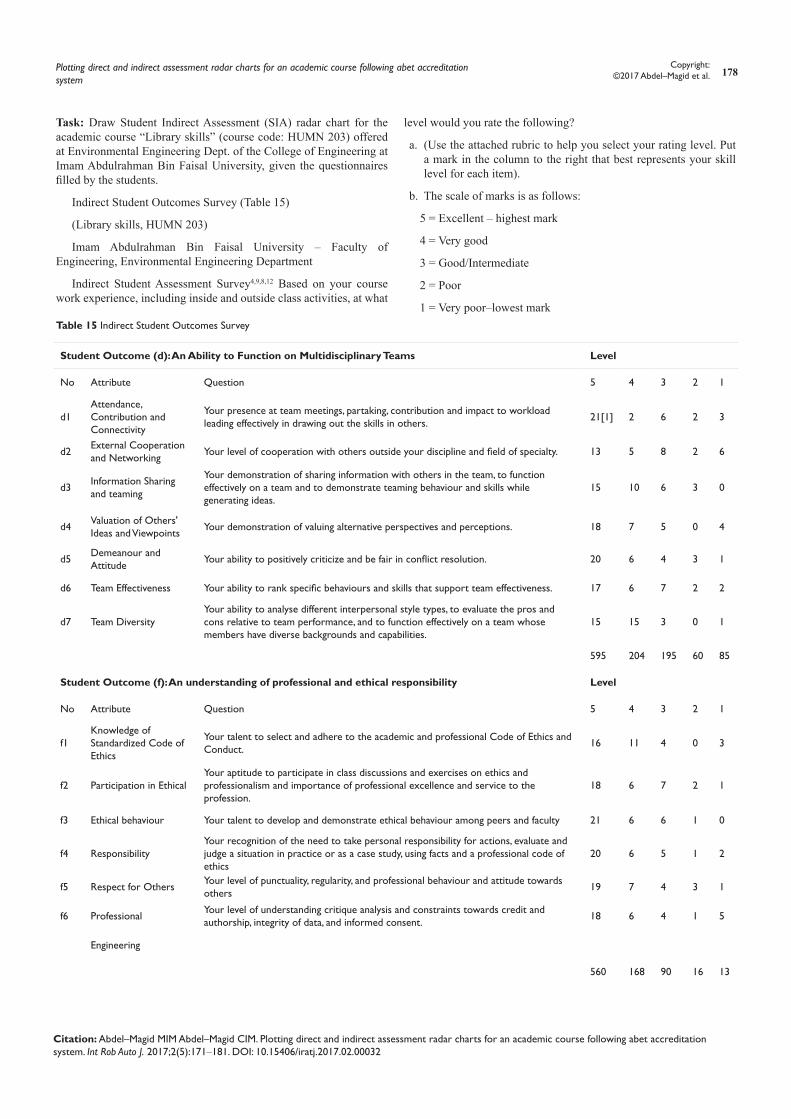
Step (6): Click on the “Midterm” tab. For each question in the midterm, enter the respective mark and ABET SLO (see Figure 9).
Step (7): Click on the “Final Exam” tab. For each question in the final exam, enter the respective mark and ABET SLO (see Figure 10).
Figure 6 The Students List Tab in the Radar Chart Creator Tool.
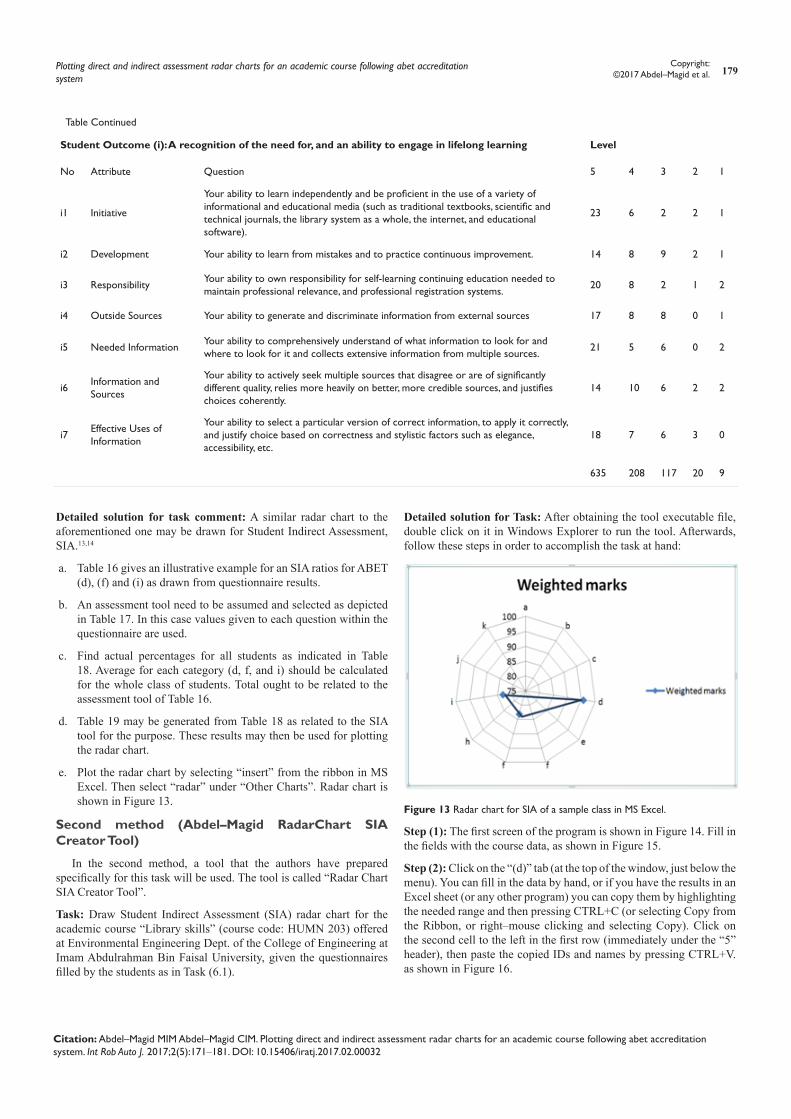
Step (8): Click on the “Enter data” button, at the bottom–right corner of the window. This will open the Data Entry window (see Figure 11). The first two columns contain students IDs and names that were entered in the first window. They can’t be changed in the Data Entry window. If the students list needs to be changed, close this window and go back to the main window and open the “Students List” tab as shown in Step (3) above.
Figure 7 The Quizzes Tab in the Radar Chart Creator Tool.
Figure 8 The Assignments Tab in the Radar Chart Creator Tool.
Fill in the data for the quizzes, assignments, midterm and final exams. If the students grades are in an Excel sheet (or any other program), one can copy the grades from the original file and paste them on the tool using CTRL+V. If there are students who missed some of the assessments (e.g. attended quizzes but missed midterm or final exam), those students will have their missed results zeroed out automatically by the tool, and they will be included in the final count, which would be used to count overall class averages. If this is not the desired behavior, the tool can be instructed to include/exclude students from the final calculation step by clicking on the “Change attendance list” button that is found in the bottom–left corner of the
Plotting direct and indirect assessment radar charts for an academic course following abet accreditation system
177Copyright:
©2017 Abdel–Magid et al.
Citation: Abdel–Magid MIM Abdel–Magid CIM. Plotting direct and indirect assessment radar charts for an academic course following abet accreditation system. Int Rob Auto J. 2017;2(5):171‒181. DOI: 10.15406/iratj.2017.02.00032
Data Entry window. This will open a small dialog box with the list of all students in the class, each with a check box next to it. Students with ticks inside the checkboxes are considered “attending” and will be included in the final calculations. Students with their checkboxes clear (no tick beside their name) are considered “absent” and will not be included in the calculations.
Figure 9 The Midterm Tab in the Radar Chart Creator Tool.
Figure 10 The Final Exam Tab in the Radar Chart Creator Tool.
Step (9): Click on the “Calculate” button, at the bottom–right corner of the Data Entry window. This will open the Radar Chart Plot window. In this window, the adjusted students results that correspond to (Tables 5,7,9,11) are shown, each in its own tab page. The last tab page (to the right), is titled “Radar Chart”. Click on it to open the tab, as shown in Figure 12.
Figure 11 The Data Entry Window in the Radar Chart Creator Tool.
Figure 12 The Radar Chart Plot Window in the Radar Chart Creator Tool.
Student indirect assessment (sia) radar chart for student learning outcomes (slos)
Similar to Section (3) above, in the following sections, the steps to plot SIA chart will be shown using two methods. The first method will be using Microsoft Excel (MS Excel) to draw the charts. The second method will use a tool that was specifically programmed by the authors to achieve the same results. Again, a sample class of 5 students will be used throughout the discussion.
First method (MS Excel plot)
In the first method, MS Excel spreadsheet software will be used to accomplish the task of plotting a radar chart for the indirect assessment of students SLOs.
Plotting direct and indirect assessment radar charts for an academic course following abet accreditation system
178Copyright:
©2017 Abdel–Magid et al.
Citation: Abdel–Magid MIM Abdel–Magid CIM. Plotting direct and indirect assessment radar charts for an academic course following abet accreditation system. Int Rob Auto J. 2017;2(5):171‒181. DOI: 10.15406/iratj.2017.02.00032
Task: Draw Student Indirect Assessment (SIA) radar chart for the academic course “Library skills” (course code: HUMN 203) offered at Environmental Engineering Dept. of the College of Engineering at Imam Abdulrahman Bin Faisal University, given the questionnaires filled by the students.
Indirect Student Outcomes Survey (Table 15)
(Library skills, HUMN 203)
Imam Abdulrahman Bin Faisal University – Faculty of Engineering, Environmental Engineering Department
Indirect Student Assessment Survey4,9,8,12 Based on your course work experience, including inside and outside class activities, at what
level would you rate the following?
a. (Use the attached rubric to help you select your rating level. Put a mark in the column to the right that best represents your skill level for each item).
b. The scale of marks is as follows:
5 = Excellent – highest mark
4 = Very good
3 = Good/Intermediate
2 = Poor
1 = Very poor–lowest markTable 15 Indirect Student Outcomes Survey
Student Outcome (d): An Ability to Function on Multidisciplinary Teams Level
No Attribute Question 5 4 3 2 1
d1Attendance, Contribution and Connectivity
Your presence at team meetings, partaking, contribution and impact to workload leading effectively in drawing out the skills in others. 21[1] 2 6 2 3
d2 External Cooperation and Networking
Your level of cooperation with others outside your discipline and field of specialty. 13 5 8 2 6
d3 Information Sharing and teaming
Your demonstration of sharing information with others in the team, to function effectively on a team and to demonstrate teaming behaviour and skills while generating ideas.
15 10 6 3 0
d4 Valuation of Others' Ideas and Viewpoints Your demonstration of valuing alternative perspectives and perceptions. 18 7 5 0 4
d5 Demeanour and Attitude Your ability to positively criticize and be fair in conflict resolution. 20 6 4 3 1
d6 Team Effectiveness Your ability to rank specific behaviours and skills that support team effectiveness. 17 6 7 2 2
d7 Team DiversityYour ability to analyse different interpersonal style types, to evaluate the pros and cons relative to team performance, and to function effectively on a team whose members have diverse backgrounds and capabilities.
15 15 3 0 1
595 204 195 60 85
Student Outcome (f): An understanding of professional and ethical responsibility Level
No Attribute Question 5 4 3 2 1
f1Knowledge of Standardized Code of Ethics
Your talent to select and adhere to the academic and professional Code of Ethics and Conduct. 16 11 4 0 3
f2 Participation in EthicalYour aptitude to participate in class discussions and exercises on ethics and professionalism and importance of professional excellence and service to the profession.
18 6 7 2 1
f3 Ethical behaviour Your talent to develop and demonstrate ethical behaviour among peers and faculty 21 6 6 1 0
f4 ResponsibilityYour recognition of the need to take personal responsibility for actions, evaluate and judge a situation in practice or as a case study, using facts and a professional code of ethics
20 6 5 1 2
f5 Respect for Others Your level of punctuality, regularity, and professional behaviour and attitude towards others
19 7 4 3 1
f6 ProfessionalYour level of understanding critique analysis and constraints towards credit and authorship, integrity of data, and informed consent. 18 6 4 1 5
Engineering
560 168 90 16 13
Plotting direct and indirect assessment radar charts for an academic course following abet accreditation system
179Copyright:
©2017 Abdel–Magid et al.
Citation: Abdel–Magid MIM Abdel–Magid CIM. Plotting direct and indirect assessment radar charts for an academic course following abet accreditation system. Int Rob Auto J. 2017;2(5):171‒181. DOI: 10.15406/iratj.2017.02.00032
Student Outcome (i): A recognition of the need for, and an ability to engage in lifelong learning Level
No Attribute Question 5 4 3 2 1
i1 Initiative
Your ability to learn independently and be proficient in the use of a variety of informational and educational media (such as traditional textbooks, scientific and technical journals, the library system as a whole, the internet, and educational software).
23 6 2 2 1
i2 Development Your ability to learn from mistakes and to practice continuous improvement. 14 8 9 2 1
i3 ResponsibilityYour ability to own responsibility for self-learning continuing education needed to maintain professional relevance, and professional registration systems. 20 8 2 1 2
i4 Outside Sources Your ability to generate and discriminate information from external sources 17 8 8 0 1
i5 Needed Information Your ability to comprehensively understand of what information to look for and where to look for it and collects extensive information from multiple sources.
21 5 6 0 2
i6 Information and Sources
Your ability to actively seek multiple sources that disagree or are of significantly different quality, relies more heavily on better, more credible sources, and justifies choices coherently.
14 10 6 2 2
i7 Effective Uses of Information
Your ability to select a particular version of correct information, to apply it correctly, and justify choice based on correctness and stylistic factors such as elegance, accessibility, etc.
18 7 6 3 0
635 208 117 20 9
Table Continued
Detailed solution for task comment: A similar radar chart to the aforementioned one may be drawn for Student Indirect Assessment, SIA.13,14
a. Table 16 gives an illustrative example for an SIA ratios for ABET (d), (f) and (i) as drawn from questionnaire results.
b. An assessment tool need to be assumed and selected as depicted in Table 17. In this case values given to each question within the questionnaire are used.
c. Find actual percentages for all students as indicated in Table 18. Average for each category (d, f, and i) should be calculated for the whole class of students. Total ought to be related to the assessment tool of Table 16.
d. Table 19 may be generated from Table 18 as related to the SIA tool for the purpose. These results may then be used for plotting the radar chart.
e. Plot the radar chart by selecting “insert” from the ribbon in MS Excel. Then select “radar” under “Other Charts”. Radar chart is shown in Figure 13.
Second method (Abdel–Magid RadarChart SIA Creator Tool)
In the second method, a tool that the authors have prepared specifically for this task will be used. The tool is called “Radar Chart SIA Creator Tool”.
Task: Draw Student Indirect Assessment (SIA) radar chart for the academic course “Library skills” (course code: HUMN 203) offered at Environmental Engineering Dept. of the College of Engineering at Imam Abdulrahman Bin Faisal University, given the questionnaires filled by the students as in Task (6.1).
Detailed solution for Task: After obtaining the tool executable file, double click on it in Windows Explorer to run the tool. Afterwards, follow these steps in order to accomplish the task at hand:
Figure 13 Radar chart for SIA of a sample class in MS Excel.
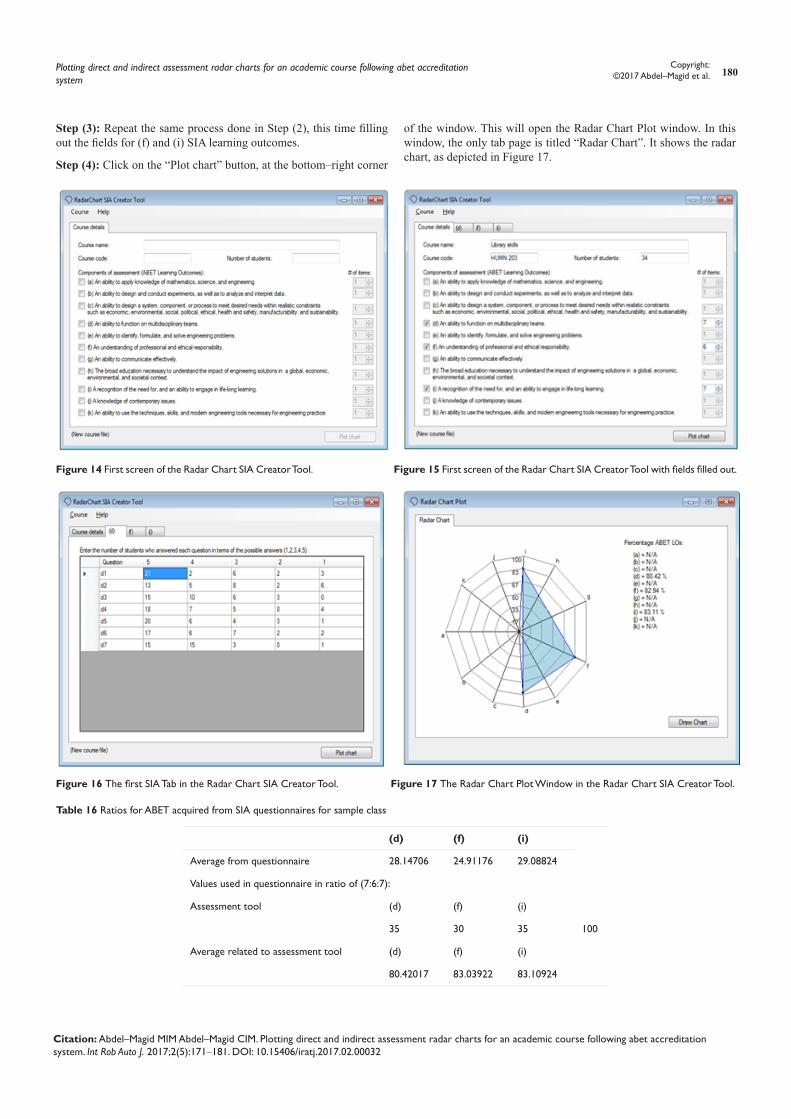
Step (1): The first screen of the program is shown in Figure 14. Fill in the fields with the course data, as shown in Figure 15.
Step (2): Click on the “(d)” tab (at the top of the window, just below the menu). You can fill in the data by hand, or if you have the results in an Excel sheet (or any other program) you can copy them by highlighting the needed range and then pressing CTRL+C (or selecting Copy from the Ribbon, or right–mouse clicking and selecting Copy). Click on the second cell to the left in the first row (immediately under the “5” header), then paste the copied IDs and names by pressing CTRL+V. as shown in Figure 16.
Plotting direct and indirect assessment radar charts for an academic course following abet accreditation system
180Copyright:
©2017 Abdel–Magid et al.
Citation: Abdel–Magid MIM Abdel–Magid CIM. Plotting direct and indirect assessment radar charts for an academic course following abet accreditation system. Int Rob Auto J. 2017;2(5):171‒181. DOI: 10.15406/iratj.2017.02.00032
Figure 14 First screen of the Radar Chart SIA Creator Tool. Figure 15 First screen of the Radar Chart SIA Creator Tool with fields filled out.
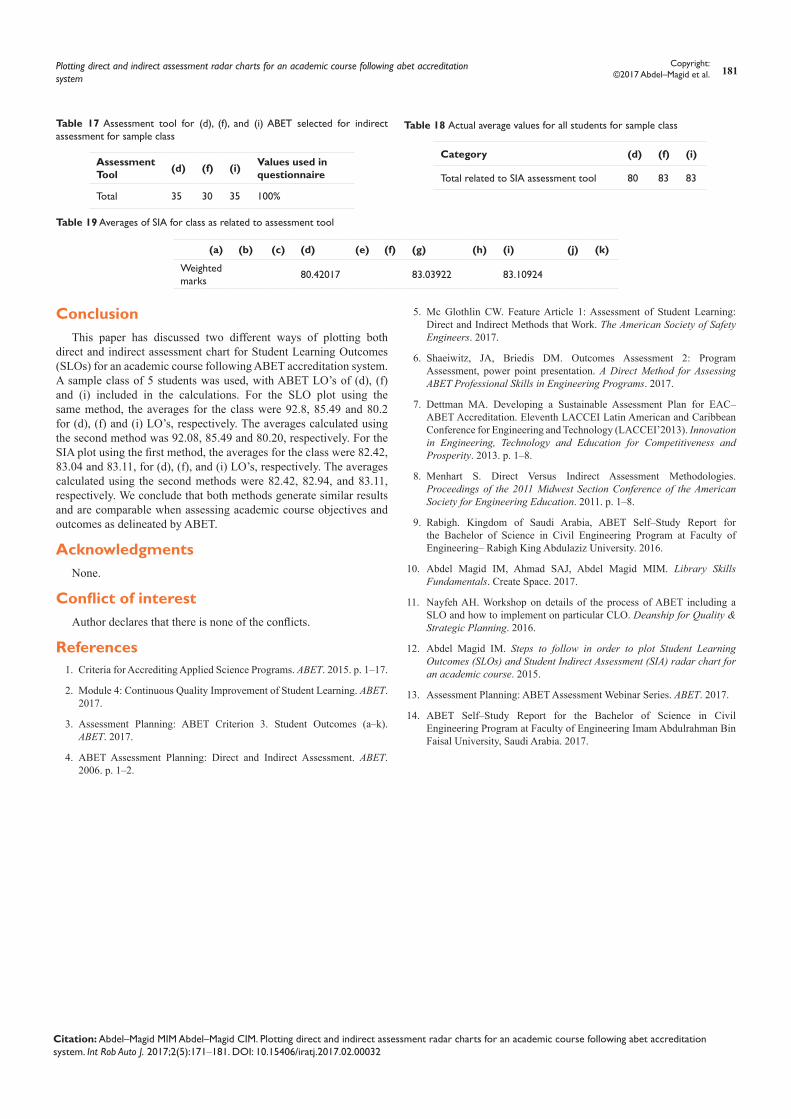
Figure 16 The first SIA Tab in the Radar Chart SIA Creator Tool. Figure 17 The Radar Chart Plot Window in the Radar Chart SIA Creator Tool.
Step (3): Repeat the same process done in Step (2), this time filling out the fields for (f) and (i) SIA learning outcomes.
Step (4): Click on the “Plot chart” button, at the bottom–right corner
of the window. This will open the Radar Chart Plot window. In this window, the only tab page is titled “Radar Chart”. It shows the radar chart, as depicted in Figure 17.
Table 16 Ratios for ABET acquired from SIA questionnaires for sample class
(d) (f) (i)
Average from questionnaire 28.14706 24.91176 29.08824
Values used in questionnaire in ratio of (7:6:7):
Assessment tool (d) (f) (i)
35 30 35 100
Average related to assessment tool (d) (f) (i)
80.42017 83.03922 83.10924
Plotting direct and indirect assessment radar charts for an academic course following abet accreditation system
181Copyright:
©2017 Abdel–Magid et al.
Citation: Abdel–Magid MIM Abdel–Magid CIM. Plotting direct and indirect assessment radar charts for an academic course following abet accreditation system. Int Rob Auto J. 2017;2(5):171‒181. DOI: 10.15406/iratj.2017.02.00032
Table 17 Assessment tool for (d), (f), and (i) ABET selected for indirect assessment for sample class
Assessment Tool (d) (f) (i) Values used in
questionnaire
Total 35 30 35 100%
Table 18 Actual average values for all students for sample class
Category (d) (f) (i)
Total related to SIA assessment tool 80 83 83
Table 19 Averages of SIA for class as related to assessment tool
(a) (b) (c) (d) (e) (f) (g) (h) (i) (j) (k)
Weighted marks 80.42017 83.03922 83.10924
ConclusionThis paper has discussed two different ways of plotting both
direct and indirect assessment chart for Student Learning Outcomes (SLOs) for an academic course following ABET accreditation system. A sample class of 5 students was used, with ABET LO’s of (d), (f) and (i) included in the calculations. For the SLO plot using the same method, the averages for the class were 92.8, 85.49 and 80.2 for (d), (f) and (i) LO’s, respectively. The averages calculated using the second method was 92.08, 85.49 and 80.20, respectively. For the SIA plot using the first method, the averages for the class were 82.42, 83.04 and 83.11, for (d), (f), and (i) LO’s, respectively. The averages calculated using the second methods were 82.42, 82.94, and 83.11, respectively. We conclude that both methods generate similar results and are comparable when assessing academic course objectives and outcomes as delineated by ABET.
AcknowledgmentsNone.
Conflict of interestAuthor declares that there is none of the conflicts.
References1. Criteria for Accrediting Applied Science Programs. ABET. 2015. p. 1–17.
2. Module 4: Continuous Quality Improvement of Student Learning. ABET. 2017.
3. Assessment Planning: ABET Criterion 3. Student Outcomes (a–k). ABET. 2017.
4. ABET Assessment Planning: Direct and Indirect Assessment. ABET. 2006. p. 1–2.
5. Mc Glothlin CW. Feature Article 1: Assessment of Student Learning: Direct and Indirect Methods that Work. The American Society of Safety Engineers. 2017.
6. Shaeiwitz, JA, Briedis DM. Outcomes Assessment 2: Program Assessment, power point presentation. A Direct Method for Assessing ABET Professional Skills in Engineering Programs. 2017.
7. Dettman MA. Developing a Sustainable Assessment Plan for EAC–ABET Accreditation. Eleventh LACCEI Latin American and Caribbean Conference for Engineering and Technology (LACCEI’2013). Innovation in Engineering, Technology and Education for Competitiveness and Prosperity. 2013. p. 1–8.
8. Menhart S. Direct Versus Indirect Assessment Methodologies. Proceedings of the 2011 Midwest Section Conference of the American Society for Engineering Education. 2011. p. 1–8.
9. Rabigh. Kingdom of Saudi Arabia, ABET Self–Study Report for the Bachelor of Science in Civil Engineering Program at Faculty of Engineering– Rabigh King Abdulaziz University. 2016.
10. Abdel Magid IM, Ahmad SAJ, Abdel Magid MIM. Library Skills Fundamentals. Create Space. 2017.
11. Nayfeh AH. Workshop on details of the process of ABET including a SLO and how to implement on particular CLO. Deanship for Quality & Strategic Planning. 2016.
12. Abdel Magid IM. Steps to follow in order to plot Student Learning Outcomes (SLOs) and Student Indirect Assessment (SIA) radar chart for an academic course. 2015.
13. Assessment Planning: ABET Assessment Webinar Series. ABET. 2017.
14. ABET Self–Study Report for the Bachelor of Science in Civil Engineering Program at Faculty of Engineering Imam Abdulrahman Bin Faisal University, Saudi Arabia. 2017.