pleasecitethisarticleas: grobe,a.,urai,j.l.,littke,r.,l ... · accepted manuscript accepted...
TRANSCRIPT

�������� ����� ��
Hydrocarbon generation and migration under a large overthrust: The carbon-ate platform under the Semail Ophiolite, Jebel Akhdar, Oman
A. Grobe, J.L. Urai, R. Littke, N.K. Lunsdorf
PII: S0166-5162(16)30030-1DOI: doi: 10.1016/j.coal.2016.02.007Reference: COGEL 2595
To appear in: International Journal of Coal Geology
Received date: 2 December 2015Revised date: 24 February 2016Accepted date: 25 February 2016
Please cite this article as: Grobe, A., Urai, J.L., Littke, R., Lunsdorf, N.K., Hydrocarbongeneration and migration under a large overthrust: The carbonate platform under theSemail Ophiolite, Jebel Akhdar, Oman, International Journal of Coal Geology (2016), doi:10.1016/j.coal.2016.02.007
This is a PDF file of an unedited manuscript that has been accepted for publication.As a service to our customers we are providing this early version of the manuscript.The manuscript will undergo copyediting, typesetting, and review of the resulting proofbefore it is published in its final form. Please note that during the production processerrors may be discovered which could affect the content, and all legal disclaimers thatapply to the journal pertain.

ACC
EPTE
D M
ANU
SCR
IPT
ACCEPTED MANUSCRIPT
1
Hydrocarbon generation and migration under a large overthrust: The carbonate
platform under the Semail Ophiolite, Jebel Akhdar, Oman.
Grobe, A., Urai, J.L., Littke, R., Lünsdorf, N.K.
Keywords: burial history, Oman Mountains, solid bitumen reflectance, temperature, Raman
spectroscopy, FT-IR
Highlights
- Thermal and burial history of Natih B in Wadi Nakhr;
- Natih B reached maximum of 240 °C at a maximum burial depth of 7.4-8 km;
- Paragenetic sequence of Natih and Muti Fm.;
- Proof that Raman spectroscopy of organic rich matrix reveals valid maturity results;
- Modelling of hydrocarbon generation and migration events.
Abstract
The Natih B source rock of the Jebel Akhdar dome in the Oman Mountains hosts at least
three different generations of solid bitumen. This study presents detailed analyses of
thermal maturity based on solid bitumen reflectance, Rock-Eval pyrolysis, Fourier
transform infrared spectroscopy and Raman spectroscopy of matrix and solid bitumen. The
Natih B source rock was sampled in different valleys (Wadis) around the Jebel Akhdar
Dome. Detailed petrography of organic material was conducted by optical and scanning
electron microscopy (SEM). The petrographic data was used to calibrate an integrated
thermal basin model of the Wadi Nakhr area. Due to ophiolite obduction the Natih B source
rock was buried to 7.4 to 8 km and a maximum temperature of c. 240 °C. Hydrocarbon
generation and associated primary migration was burial induced and took place from 78 to
66 Ma with solid bitumen precipitation in the source rock. A resulting high-reflective solid
bitumen generation reflects temperatures of deepest burial in the order of 225 °C to 240 °C.
Based on an elaborated paragenetic sequence two other solid bitumen generations were
linked to two oil migration events taking place during uplift (55-50 Ma and 48-45 Ma), after
deepest burial (around 65 Ma).

ACC
EPTE
D M
ANU
SCR
IPT
ACCEPTED MANUSCRIPT
2
1. Introduction
The Oman Mountains are unique as natural analogue to study exposed hydrocarbon
systems on the Arabian Peninsula, hosting the most prolific ones on earth. Source and
reservoir rocks crop out at the surface of the Jebel Akhdar dome at reservoir scale. Studies
in the past focused on the facies distribution and sequence stratigraphy of source rocks
(Grelaud et al., 2006; Homewood et al., 2008; Rousseau et al., 2006; Van Buchem et al.,
2002, 1996), reservoir rocks (Immenhauser et al., 2004, 1999), the origin of fractured
carbonate reservoirs in a high pressure cell (Bertotti et al., 2005; Gomez-Rivas et al., 2014;
Hilgers et al., 2006; Virgo et al., 2013) and associated fluid flow events (Arndt et al., 2014;
Breesch et al., 2009; Stenhouse, 2014). Solid bitumen in veins and host rocks provide
evidence on different hydrocarbon migration events (Fink et al., 2015). However, a
systematic analysis of their paragenesis is lacking and an absolute timing of the migration
events not known. Solid bitumen precipitation results from thermal cracking,
biodegradation or gas deasphalting of oil accumulations (Blanc and Connan, 1994; Rogers
et al., 1974). At temperatures above 150 °C oil becomes unstable and thermal cracking is
mainly responsible for solid bitumen precipitation (Dahl et al., 1999), whereas
biodegradation takes places at lower temperatures (<80 °C, Larter et al., 2006). In some
cases, multiple migration events can be deduced based on solid bitumen generations of
different reflectance (Gentzis and Goodarzi, 1990).
In this paper the data presented include two different paleo-thermometers, namely solid
bitumen reflectance and Raman spectroscopy of source rocks sampled at outcrops around
the Jebel Akhdar dome. Solid bitumen of different generations and their thermal maturities
were geochemically and petrographically analyzed. Combining an elaborated paragenetic
sequence with laboratory results and a well calibrated basin model enables to link thermal
maturity, deepest burial and burial history. Based on this approach we present a model of
the relative and absolute timing of oil generation and migration.
1.1. Geologic and tectonic evolution of the Oman Mountains

ACC
EPTE
D M
ANU
SCR
IPT
ACCEPTED MANUSCRIPT
3
The Oman Mountains expose mainly carbonate rocks deposited on a late Proterozoic
basement of the passive continental margin of the Neo-Tethyan Ocean (Figure 1, e.g. Breton
et al., 2004; Loosveld et al., 1996; Rabu et al., 1990; Roger et al., 1991). The succession of
the Oman Mountains is subdivided into the sedimentary units Autochthon A (late-
Proterozoic to Devonian age, i.a. Le Metour et al., 1990; Rabu et al., 1990) and B (mid
Permian to mid-Upper Cretaceous, i.a. Breton et al., 2004), the allochthonous units of Semail
ophiolite and sedimentary Hawasina nappes, and the Neo-Autochthon deposited on top of it
(Breton et al., 2004). The Autochthon B, also named Hajar Supergroup, is impressively
forming the flanks of the Jebel Akhdar dome and contains a formerly active hydrocarbon
system: The Natih formation (late Albian-early Turonian,
Figure 1). It acts as source and reservoir rock and is, from top to bottom, subdivided into
the members A to G (e.g. Philip et al., 1995). Natih B and E represent source rocks and the
Natih A acts as reservoir rock (Homewood et al., 2008; Van Buchem et al., 2002). The
overlying carbonates and conglomerates of the Muti Fm. are interpreted as northern
continuation of the Fiqa Fm. seal (Terken et al., 2001). The Muti Fm. was deposited after a
moving, flexural forebulge, formed in front of the ophiolite nappe, has uplifted the
carbonate platform and partly eroded the topmost Natih layers (Robertson, 1987). Directly
below the Natih the Nahr Umr shale is situated and represents a bottom seal.
Figure 1: Overview of sampled Wadis and locations (X) in the Oman Mountains (a) with
highlighted lithologies (WGS 84 UTM Zone 40N, Sources: Esri, DigitalGlobe, GeoEye, i-cubed,
USGS, Aerogrid, swisstopo, and the GIS user Community). Color legend is given by the
stratigraphic chart (b) and a cross section of the structure of the Jebel Akhdar anticline at
present day (c, compiled from Al-lazki et al., 2002; Filbrandt et al., 2006; Searle, 2007).
The Natih A is known as a large scale fractured carbonate reservoir in north Oman (Terken,
1999; Van Buchem et al., 1996). The evolution of the stress field is recorded by at least 7
vein generations, stylolites, faults and fractures. Briefly summarized in their genetic order,
earliest structures are related to burial and represented by layer confined veins (Virgo,
2015) and burial stylolites (Breesch et al., 2011; Gomez-Rivas et al., 2014). Large scale

ACC
EPTE
D M
ANU
SCR
IPT
ACCEPTED MANUSCRIPT
4
overthrusts occur and their top-to-S movement is linked to a compressive N-S stress regime
that was initiated by first subsea ophiolite obduction and generated N-S striking veins
(Grobe et al., 2015; Holland et al., 2009; Virgo, 2015). N-S oriented veins are overprinted by
NW-SE oriented ones and interpreted as onset of an overpressure cell at the top Natih Fm.
Possible causes are a rapid burial linked to the ophiolite obduction or hydrocarbon
generation within the formation (Hilgers et al., 2006; Holland et al., 2009). E-W and NE-SW
striking vein sets overprint these early structures and are associated to the obduction-
related overpressure cell and an anticlockwise rotating stress field during burial (Holland
et al., 2009). During deepest burial higher temperatures are preserved in ductile boudinage,
representing a large scale top-to-NE shear zone that occurs in the deeper Cretaceous
carbonates (Grobe et al., 2015; Holland et al., 2009). Holland et al. (2009) found bedding
parallel structures, e.g. veins and sigmoidal clasts, with movement indicating top-to-N to
top-to-E and also linked these features to the above described large scale shear zone. This
shear zone is also present in the Saih Hatat window in the East (Fournier et al., 2006). All
these structures are overprinted by E-W trending oblique to normal faults which are
reactivated as strike-slip faults (Grobe et al., 2015; Virgo, 2015). These stress field changed
were linked to the movement of India, bypassing Arabia in the East (Filbrandt et al., 2006).
Gomez-Rivas et al. (2014) related tectonic stylolites to this oblique collision with India. At a
later stage, the collision of Arabia and Europe resulted in the updoming of the Oman
Mountains (Figure 1c, Glennie et al., 1973; Hanna, 1990; Searle, 1985, 2007). Still unclear
are the movements of the faults and their exact timing: Some authors interpret at least
some of the faults as normal faults and date them prior to doming (Holland et al., 2009;
Virgo, 2015). Opposed, Gomez-Rivas et al. (2014) postulated a dominant strike-slip to
oblique character of the faults and date them prior to the top-to-NE shearing.
2. Methods
A total of 63 source rock samples were taken of the Natih B Fm. in different valleys/Wadis
around the Jebel Akhdar dome (Figure 1). Visibly unweathered material was dug out and
sampled. In addition, 16 samples were taken in neighboring formations directly above and
below the Natih formation.

ACC
EPTE
D M
ANU
SCR
IPT
ACCEPTED MANUSCRIPT
5
48 dark-colored samples were pulverized and used for the analysis of total organic (TOC)
and inorganic carbon (TIC). Elemental analysis was conducted on 100 mg of each sample by
combustion in a liquiTOC II analyzer under constant oxygen supply. The instrument is using
a temperature ramp method (300 °C/min to 550 °C, held for 600 s, quickly raised to
1000 °C and held for 400 s), which enables a direct determination of TOC and TIC without
the need of prior acidification. Generated CO2 is analyzed by a non-dispersed infrared
detector (NDIR: detection limit 10 ppm, rel. TOC error 0.6 %, TIC error 1.7 %).
To characterize the quality of organic matter, the 4 samples with highest TOC content were
selected for Rock-Eval VI pyrolysis according to Espitalié et al. (1977).
Fourier transform infrared spectroscopy (FT-IR) was used to determine the proportion of
aliphatic and aromatic compounds (cp. Ganz and Kalkreuth, 1991; Robin and Rouxhet,
1978). After HCl acidification, the carbonate free samples were analyzed using a Perkin
Elmer Spotlight FT-IR at attenuated total reflection mode (ATR) at wavenumbers of 4000 to
750 cm-1.
Based on their TOC content samples were selected for thermal maturity analyzes by solid
bitumen reflectance (BRr). Samples were cut perpendicular to bedding and embedded as
whole rock samples in an epoxy-resin-mix. During exothermal hardening temperatures of
36 °C were not exceeded. The embedded samples were polished with successively finer
abrasives (320, 400, 600 mm). Details of the preparation procedure are described in Littke
et. al. (2012). Reflectance measurements were conducted using a Zeiss Axioplan microscope
with an oil immersion lens of 50-times magnification and monochromatic light with a
wavelength of 546 nm, calibrated by standards of Gadolinium Garnet (1.714 %) and Cubic
Zirconia (3.125 %). Solid bitumen particles were only selected for measurement if any sign
of oxidation was missing. The gathered BRr data was used to calculate vitrinite reflectance
and maximum temperatures. According to Ferreiro Mählmann and Frey (2012) BRr values
below 1.5 % were transformed to random vitrinite reflectance (VRr) by the formula of Jacob
(Eq. 1, 1989).
[%] (Eq. 1)

ACC
EPTE
D M
ANU
SCR
IPT
ACCEPTED MANUSCRIPT
6
Within the range of 1.5 to 3.0 % BRr the equation of Landis and Castano (1995) was used
(Eq. 2).
[%] (Eq. 2)
For values above 3.0 % we assume BRr ≈ VRr. Maximum burial temperatures were
calculated based on the approach of Barker and Pawlewicz (Eq. 3, 1994). To estimate values
for faster burial hydrothermal temperatures were calculated as well (Eq. 4).
[°C] (Eq. 3)
[°C] (Eq. 4)
Moreover, Raman spectroscopy was carried out to investigate the maturity range of the
analyzed samples. In addition to local measurements of solid bitumen particles, this
technique enables the analysis of dispersed solid bitumen that is too small or too uneven to
be measured by reflectance techniques. The method is based on the reorganization of
amorphous carbonaceous material (kerogen) to graphite, which is caused by increased
temperatures (Aoya et al., 2010; Kouketsu et al., 2014; Lahfid et al., 2010; Wopenka and
Pasteris, 1993; Yui et al., 1996).
For this we used a Horiba Jobin Yvon HR800 UV spectrometer attached to an Olympus BX-
41 microscope with a 100x objective at the Geoscience Center, Department of Experimental
and Applied Mineralogy, University of Göttingen. A high-power diode laser with a
wavelength of 488 nm and an output power of 50 mW was installed. Sample alteration by
heating was avoided by applying a D1 density filter. With a Peltier CCD detector, each
spectral window (center at 1399.82 cm-1, grid of 600 lines/mm) was measured 5 to 10
times for 2 to 20 seconds. To transform the measured data into VRr values the scaled total
area (STA) approach of Lünsdorf (2016) was used and temperatures were calculated using
the equation (Eq. 5, based on data of Lünsdorf, 2016).

ACC
EPTE
D M
ANU
SCR
IPT
ACCEPTED MANUSCRIPT
7
[%] (Eq. 5)
Petrographic interpretation was supplemented by quantitative scanning electron
microscopy (SEM) with a Zeiss Supra 55 SEM, equipped with secondary electron detectors
(SE) comprising INLENS and SE2 (5 kV at 4-6 mm distance). An integrated energy-
dispersive X-ray spectroscope (EDX: Apollo 10 SDD) enabled semi-quantitative mineral
identification (20 kV, 8 mm).
To quantify maximum burial temperatures and reconstruct the burial history of the
analyzed Natih B samples, numerical basin modelling was conducted with the PetroMod1D
2014.1 software package (Schlumberger Technology Center Aachen, Germany). The
incorporated simulation uses forward modeling based on an event-stepping approach. A
combination of a conceptional model of the structural history of the area, the given
lithologies and outcrop geometries with defined thermal boundary conditions enables to
reconstruct a burial curve (Hantschel and Kauerauf, 2009; Nöth et al., 2001). By calibrating
this model with maturity data the thermal history of the Wadi Nakhr area was elaborated.
3. Results
3.1. Organic Geochemistry
Results of TOC and TIC measurements are summarized in Table 1. TOC values range from
0.20 (AG15SR44, 58, 63) to 1.06 wt.-% (AG15SR01) and TIC from 11.78 (AG15SR48) to
13.80 wt.-% (AG15SR47), respectively. The Wadis on the south-western flank of the Jebel
Akhdar (Nakhr, W of Nakhr and N of Al Hamra) showed generally higher TOC values than
the ones in the south-east (Wadis Tanuf and Muaydin) and in the north (Wadis Mistal and
Sahtan).
Table 1: Sample list showing sampling locations, formations and results of the elemental
analysis.

ACC
EPTE
D M
ANU
SCR
IPT
ACCEPTED MANUSCRIPT
8
Rock-Eval pyrolysis was performed on the Natih B source rock samples of highest TOC
contents (Table 2). S1 peaks are generally below 0.1 mg HC/g rock and S2 peaks below
0.2 mg HC/g rock. Calculated hydrogen indices (HI) are between 12–36 mg HC/g TOC,
oxygen indices (OI) between 122-298 mg CO2/g TOC, respectively (Table 2).
Table 2: Results of Rock-Eval VI pyrolysis.
Fourier transform infrared spectroscopy (FT-IR) shows hydrocarbon related peaks at 2912,
2842 (aliphatic components), 1629 and 1614 cm-1 (aromatic components, Figure 2).
Figure 2: Representative spectra of the FT-IR measurements, all measured at sample
AG15SR01. Labeled peaks represent aliphatic (2912, 2842 cm-1) and aromatic (1629, 1614 cm-
1) components.
3.2. Petrology and BRr of the Natih B
The amount of TOC was used to identify samples containing solid bitumen. However, if the
solid bitumen occurs finely dispersed within the matrix, high TOC content not always
represents a high number of measureable solid bitumen particles. Best results were
achieved for samples > 0.25 wt.-% TOC.
First, freshness of pyrites was checked for all polished sections, which is an excellent
indicator for degree of weathering that might have affected the rocks and the organic
matter (Littke et al., 1991). All investigated samples show fresh, unweathered pyrite.
Organic petrology showed that solid bitumen is present in the Natih B source rock in
different shapes: It was always present as finely dispersed, granular particles within the
matrix (Figure 3a-e) containing small micrinitized particles (white spots in matrix,
Figure 3b-e). In addition, solid bitumen was found in matrix pores (Figure 3a). Veins of
solid bitumen exist either as small, randomly oriented veins within the matrix (Figure 3b),
or within calcite veins (Figure 3f). Some veins are oriented parallel to weak zones next to
stylolites (Figure 3c). Likewise, solid bitumen filled former fossils (Figure 3d, e+g) or
showed flow-indicating structures (Figure 3b+h) or droplets (Figure 3i) and rhombohedral

ACC
EPTE
D M
ANU
SCR
IPT
ACCEPTED MANUSCRIPT
9
shaped bodies which are interpreted to be siderite pseudomorphs (Figure 3j+k). In the
surroundings of some veins red colored host rocks appeared (Figure 3g+i); these latter
invasion rims are characterized by light fluorescence colors.
Figure 3: Photographs of different solid bitumen appearances within the Natih B source rock:
Bitumen as particle in the matrix (a), in veins (b,f), stylolites (c) or former fossil shells (d+e). It
shows flow structures (b) or hydrothermal overprinting (h). It represents red host rock
overprinting (g+i) and replaces rhombohedral siderite pseudomorphoses (j, k). (All with oil
immersion at 50x magnification)
Reflectance measurements indicate that at least three different solid bitumen generations
are present in the Natih B source rock (Table 3). The first, high-reflective generation of 2.95
to 3.59 % BRr is represented by particles and filled open voids within the matrix
(Figure 3a); sometimes they appear in rhombohedral shaped bodies (Figure 3h, j, k). They
are not always homogenous and their surfaces are partly fractured and often micrinitized
(Figure 3j). The finely dispersed solid bitumen within the matrix also belongs to this
generation, as well as solid bitumen veins within carbonate veins (Figure 3f).
Measurements were only conducted on homogeneous, unaltered solid bitumen particles. To
exclude that the results were influenced by bireflectance, random reflectance and
bireflectance were measured at two samples. As no differences occur, an influence of
bireflectance is excluded.
Values between 2.26 and 2.56 % BRr characterize a second, medium-reflective solid
bitumen generation. It formed homogenous surfaces, filled voids within the matrix or is
oriented at already existing structures, e.g. stylolites (Figure 3b+c).
A third generation of low reflective solid bitumen (mainly 1.04 – 1.45 % BRr, and two
outliers of 1.64 and 1.90 % BRr) was present as fine crack-fillings within the matrix, as solid
bitumen veins and as fossil-fillings (Figure 3d+e). The veins are mainly oriented parallel to
bedding and associated with fluorescent host rocks in the surroundings (red at incident
light, Figure 3g, i, k). The generation is characterized by homogenous surfaces and pore-
shape related boundaries (Figure 3i).

ACC
EPTE
D M
ANU
SCR
IPT
ACCEPTED MANUSCRIPT
10
Table 3: Results of solid bitumen reflectance measurements of the Natih B source rock.
Calculated burial temperatures are in the order of 226-232 °C for the high reflecting
generation, 208-216 °C and 139-172 °C for the others, respectively (Table 4). Hydrothermal
peak temperatures, representing a higher heating rate that could appear at rapid burial,
range between 296-316 °C, 268-275 °C and 157-210 °C.
Table 4: Temperatures calculated based on solid bitumen reflectance measurements.
Karstification surfaces host organic particles which were accumulated while carbonate was
dissolved (Figure 4). Thereby, they often enrich all present kinds of solid bitumen as
residua and can be used as a quick-look method to unravel the included generations.
Reflectance measurements of these particles were avoided, as an influence of the
karstification process on their reflectance cannot be excluded. This enrichment process is
not observable at the filled stylolites; there the solid bitumen showed flat homogeneous
surfaces. Therefore, stylolite-associated solid bitumen is interpreted to fill cracks that were
generated close to the weak zones oriented parallel to stylolites and therefore appear after
the dissolution event of stylolitization.
Figure 4: Photograph of a karstification surface within the Natih B accumulating different
generations of solid bitumen (oil immersion, 50x magnification).
3.3. Raman Spectroscopy of the Natih B
In addition to the BRr measurements, Raman spectroscopy of carbonaceous material
(RSCM) was carried out on Natih B samples.
As typical for spectra measured at organic material a peak in the range of c. 1250-1450 cm-1
was observed (Figure 5). It represents defects in the carbon atom’s lattice structure and
vacancies in the aromatic ring structures (Pimenta et al., 2007) and is therefore named
defect band, D-band. The width of this peak can also give an idea of the disorder of C-atoms

ACC
EPTE
D M
ANU
SCR
IPT
ACCEPTED MANUSCRIPT
11
within a sample (Beyssac et al., 2002). The second peak appears around 1500-1605 cm-1
and evokes out of longitudinal stretching vibrations within C=C double bonds (Beyssac and
Lazzeri, 2012). As this effect is most pronounced in pure graphite the band is named G-
band. As a consequence of the different origin of peaks, information of the aromatic ring
structure and its relationship to sample maturation can be elaborated by correlating peaks
within a Raman spectrum and their shifts between spectra of different sample maturation
(Figure 5: matrix characterized by carbonate peak at around 1200 cm-1).
Figure 5: Representative spectra showing the consistency of measurements at solid bitumen
particles and of the matrix for the Natih B and the Nahr Umr formation. Matrix spectra not
only show D- and G-band of organic material but also a carbonate peak at c. 1200 cm-1.
This leads to calculated temperatures of 225 to 261 °C for the Natih B matrix, varying
slightly more than the 227 to 231 °C of the high-reflective solid bitumen particles (Table 5).
This proofs that RSCM of the matrix can be used to analyze thermal maturity for rocks of
high-grade diagenesis to anchimetamorphism, when kerogen is much more homogeneous
than at early stages of diagenesis. It represents a method independent of measurable,
homogeneous solid bitumen particles.
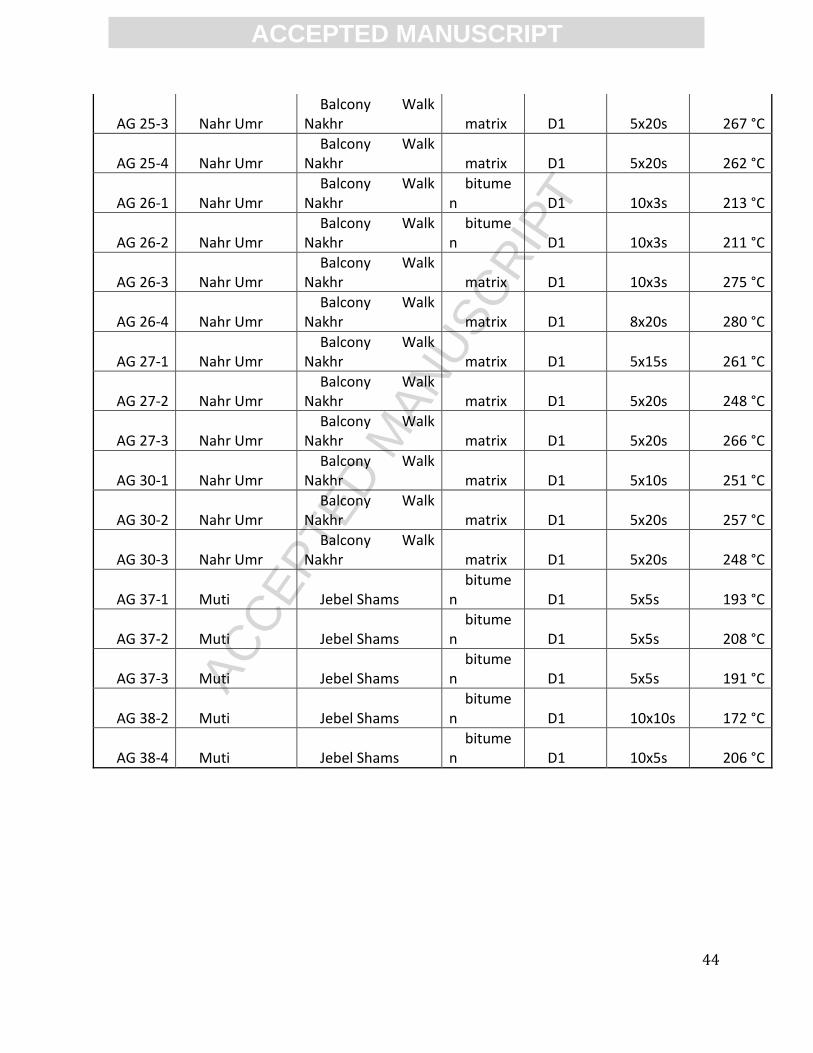
Table 5: Results of the Raman spectra analyses with used filters and measuring times.
3.4. Surrounding lithologies
3.4.1. Petrology, BR, RSCM
Samples of Muti and Nahr Umr Fm. contain the same three solid bitumen generations as in
the Natih B source rock. Their reflectance is shown in Table 6. In the Nahr Umr Fm. the 3rd
generation is missing (in the discussion we will argue that this generation represents
remnants of hydrocarbons produced in the Natih Fm., see 4.4).
Table 6: Results of the solid bitumen reflectance measurements directly above (Muti Fm.) and
below (Nahr Umr Fm.) the Natih formation.

ACC
EPTE
D M
ANU
SCR
IPT
ACCEPTED MANUSCRIPT
12
RSCM of Nahr Umr samples of the Wadi Nakhr gives temperatures of 211-280 °C, Muti Fm.
of the Jebel Shams 172-208 °C, the Hawasina nappes at Sint 193-209 °C and the top of the
Kahmah Group (Shuaiba Fm.) 251-269 °C, respectively (Table 5).
3.4.2. SEM and EDX
For EDX analyses of the composition of the rhombohedral particles we selected analogue
samples of Muti radiolarites from the Gorge pavement. In contrast to the Natih B, matrix
and veins are SiO2 dominated (Figure 6). We observe optically black-impregnated veins
with inclusions of rhombohedral grains with rims (Figure 7). The cores of the rhombohedra
are rich in C, representing the precipitated solid bitumen, and the rims contain Mn, Fe, Ca
and O associated with traces of Mg, K and F.
The shape of the rhombohedra is characteristic for (former) Fe-carbonate (siderite), which
also explains the presence of fluorine as indicated by EDX-SEM. Siderite is interpreted to
have been overgrown by Mn, Fe and Mg oxides before it was dissolved and their
pseudomorphoses replaced by a carbon rich fill, i.e. solid bitumen.
Figure 6: SEM results of SiO2 veins in a radiolarian Muti sample. Si and O are equally
distributed within matrix and vein and particles within the veins are showing C and Mn
enrichments.
Figure 7: SEM results of rhombohedral shaped bodies in SiO2 rich veins of Muti radiolarites.
Overgrowth rims are characterized by F, Fe and Mn enrichments, fillings show strong C
enrichments.
3.5. Numerical basin modelling
A 1D basin model of the Wadi Nakhr area (southern flank of the anticline) was compiled
with input parameters summarized in Table 7. Thicknesses are based on our field
measurements, complemented by literature data. The minimum thickness of the Hawasina
nappes was reconstructed to a value before the thinning by orogenic collapse (Al-Wardi and

ACC
EPTE
D M
ANU
SCR
IPT
ACCEPTED MANUSCRIPT
13
Butler, 2007; Beurrier et al., 1986). Petrophysical parameters of the lithologies are listed in
the Appendix 1. Large scale overthrusted ophiolite was 1-dimensionally realized as rapid
sedimentation.
Table 7: Input parameters for the Wadi Nakhr basin model: Thicknesses and lithologies are
compiled from field data in combination with literature data (Beurrier et al., 1986; Philip et
al., 1995; Pratt et al., 1990). Ages were compiled from Vahrenkamp (2013), Grélaud et al.
(2006), Razin et al. (2010), Rabu et al. (1990), Pöppelreiter et al. (2011) and Masse et al.
(1997). Eroded thicknesses of Semail Crust and Mantle are subject to the presented sensitivity
analysis.
According maximum burial depth was calibrated by thermal maturities presented above
(BRr, Raman spectroscopy) and the uplift path by fission track data (Saddiqi et al., 2006;
Wübbeler et al., 2015). Thermal boundary conditions are shown in Figure 8. The lower
thermal boundary, i.e. basal heat flow, at present day was set to 52 mW/m² (Rolandone et
al., 2013; Visser, 1991). Paleo heat flows were mainly influenced by intracratonic Cambrian
rifting leading to peak values, and passive margin development (Paleozoic to Jurassic)
representing a time of tectonic quietness and associated normal to low basal heat flows
(Loosveld et al., 1996; Terken et al., 2001). In general radiogenic decay and associated loss
of radiogenic minerals leads to a slight decrease of heat flow values over time. The paleo
water depth was reconstructed based on sequence stratigraphic results (Hillgärtner et al.,
2003; Immenhauser and Matthews, 2004; Immenhauser and Scott, 2002; Immenhauser et
al., 1999; Van Buchem et al., 2002). Paleo mean surface temperatures were reconstructed
by a latitude based approach of Wygrala (1989). Corrected by the influence of the paleo
water depth it defines the sediment water interface temperature (SWIT), representing the
upper thermal boundary. Base temperatures of the ophiolite are set to 120 °C by increasing
SWIT at times of obduction. Conducted sensitivity analyses of different ophiolite
temperatures showed no influence on Natih B maturity. Debated in the past, the original
ophiolite thickness is still unknown. Sensitivity analyses of different overburden
thicknesses (eroded Muti Fm., Hawasina nappes and Ophiolite) show that eroded

ACC
EPTE
D M
ANU
SCR
IPT
ACCEPTED MANUSCRIPT
14
overburden of c. 7400-8000 m including 5900-6500 m of ophiolite (Figure 9a) matches our
observations. Normal sedimentation at the Mesozoic carbonate platform was interrupted
by rapid burial induced by the ophiolite emplacement 78 Ma (Figure 9b). This results in a
strong temperature increase within the first million years of burial, e.g. from 40 to 120 °C in
the Natih B source rock, followed by an increase to maximum reached temperatures of c.
240 °C at 65 Ma (Natih B, Figure 9c). According to these temperatures the transformation
ratio vs. time plot (Figure 9d) represents times of oil generation from 78 Ma to 66 Ma.
Figure 8: Boundary conditions used for the thermal basin modelling. Peak of sediment water
interface temperature is representing temperature influence of the warm ophiolite
emplacement.
Figure 9: Results of the Wadi Nakhr area basin model: Sensitivity analysis of overburden
thicknesses (a), burial history (b), temperature evolution of the Natih B source rock over time
(c) and the corresponding transformation ratio (d). b) – d) for an ophiolite thickness of
6300 m.
4. Interpretation and Discussion
4.1. Paragenetic sequence
By combining petrographic observations and results of burial and thermal history
modeling, a paragenetic sequence is proposed: Siderite is interpreted to form during early
burial of the carbonate platform (parasequence 1). Iron, calcium and manganese rich oxides
overgrew the siderites and represent oxidizing conditions (parasequence 2, cf. Johnson et
al., 2005; Xiao-Fei et al., 2011).
After the formation of these overgrowths, siderite dissolved (parasequence 3). Rapid burial
during ophiolite obduction initiated hydrocarbon generation, which filled the former
siderite as pseudomorphoses (parasequence 4). Siderite dissolution under reducing
conditions may have been contemporaneous with hydrocarbon generation and primary
migration.
ACC
EPTE
D M
ANU
SCR
IPT
ACCEPTED MANUSCRIPT
15
By further temperature increase the hydrocarbons were cracked to pyrobitumen. Their
reflectance is interpreted to represent maximum burial temperatures (first solid bitumen
generation, parasequence 5).
The fact that the second generation solid bitumen particles are not as mature as the first
(high-reflecting) generation implies that this second migration event occurred after peak
burial temperatures, associated with uplift. These hydrocarbons are proposed to originate
from an external source (cf. 4.4) and have migrated through the Natih formation to form
medium-reflecting (second generation) solid bitumen in veins and stylolites
(parasequence 6).
The low-reflecting solid bitumen of the third generation is the only solid bitumen present in
dissolved fossil shells (parasequence 7). Therefore these shells were dissolved after
emplacement of high- and medium-reflecting solid bitumen, before the third hydrocarbon
migration event filled the fossils and the hydrocarbon was transformed into low-reflecting
pyrobitumen (parasequence 8).
This sequence is in agreement with burial curves elaborated for the foreland of the Oman
Mountains (Terken et al., 2001; Warburton et al., 1990). Fink et al. (2015) suggested a
similar burial history, with a focus on solid bitumen in calcite veins.
4.2. Depositional environment and maturity distribution in Natih B
TOC values of samples collected around the Jebel Akhdar Dome decrease from S to N and
from W to E. This pattern can be explained by facies changes to the center of the Natih B
intra-shelf basin located in the area of the Wadi Nakhr (SW Oman Mountains) or even
further to the southwest. It could also be related to the thickness of the Natih B, which also
increases slightly to the SW (Beurrier et al., 1986; Philip et al., 1995). Sequence
stratigraphic analyses also placed the main Natih B depocenter in the S of the Oman
Mountains (Grelaud et al., 2006; Homewood et al., 2008), although it remains to be shown
that part of these changes are not caused by tectonic thinning during the top to the NE
shearing event (e.g. Holland et al., 2009).

ACC
EPTE
D M
ANU
SCR
IPT
ACCEPTED MANUSCRIPT
16
Rock-Eval results classify Natih B as an overmature source rock. This is supported by the
high amount of aromatic C=C and C=O bonds and the low intensity of aliphatic compounds
(cp. Figure 2).
While measured maturities, representing maximum temperatures, and deepest burial are
now very well constrained (which is also supported by Rock-Eval and FT-IR data) and
fission track data allow quantification of uplift (Saddiqi et al., 2006; Wübbeler et al., 2015),
the timing of maximum burial is less certain. Ophiolite emplacement onto the continent
took place at 78 Ma and probably led to a fast burial (Hacker and Mosenfelder, 1996).
The first generation solid bitumen particles show only negligible bireflectance. This
suggests that no strain occurred during bitumen formation (Bruns and Littke, 2015), in
agreement with the absence of indicators for bedding parallel shear in all outcrops sampled
for this analysis (Holland et al., 2009, has shown that this bedding parallel shear is
heterogonous).
4.3. Maximum temperatures during burial
Paleo temperatures of the carbonate platform in the Oman Mountains are poorly known.
Our data on BRr of Natih B suggest maximum temperatures of 226-239 °C using the burial
equation of Barker and Pawlewicz (1994). Based on RSCM similar values of 226 to 261 °C
were calculated. BRr, as well as RSCM, is related to the transformation kinetics of organic
material. Therefore, factors affecting this transformation will effect both measurements, e.g.
duration at maximum temperature, but also pressure and strain (Khorasani and Michelsen,
1993). Comparing RSCM results of organic rich matrix and solid bitumen reveals that this
method enables thermal maturity measurements in the absence of optically visible solid
bitumen particles. (For higher heating rates during rapid burial, the hydrothermal equation
of Barker and Pawlewicz (1994) would suggest 296-316 °C but these are very unlikely due
to the metamorphic grade of the rocks as discussed below).
These temperatures are in agreement with Fink et al. (2015): They analyzed bitumen-
impregnated veins (containing the here measured generations 1 and 3) in the Natih A of the
Wadi Nakhr area and inferred maximum burial temperatures of around 225 °C. Quartz-
Calcite thermometry for the uppermost Natih A layers indicate temperatures of 166-255 °C
ACC
EPTE
D M
ANU
SCR
IPT
ACCEPTED MANUSCRIPT
17
(Stenhouse, 2014), also in agreement with our data, and with the lower anchizone
metamorphic grade of the rocks (Breton et al., 2004; Searle, 1985) and the fact that zircon
ages are not reset (Saddiqi et al., 2006) in the Jebel Akhdar, indicating that peak
temperatures were below c. 260 °C.
The results of numerical basin modeling presented above, calibrated by our maturity data,
imply a maximum paleo- depth of 7600-8200 m for the Natih B. An eroded overburden of c.
7400-8000 m including 5900-6500 m of ophiolite (Figure 9a) is in agreement with most
other estimates. A lower ophiolite thickness would correspond to thicker Hawasina nappes
if tectonic thinning as suggested by Al-Wardi and Butler (2007) is less strong.
4.4. Oil generation and migration
The three generations of solid bitumen within the Natih B source rock are interpreted to
reflect three different hydrocarbon migration events (Figure 10). Based on the observation
that only the high-reflecting generation is omnipresent in the matrix, we infer that it was
formed from oil generated by the Natih B with which it underwent deepest burial and
experienced peak temperatures (Figure 10c). We also note that this high-reflecting solid
bitumen was not found in the Nahr Umr Fm., below the Natih, in agreement with this
interpretation. Basin modeling shows that hydrocarbon generation is induced by burial
under the ophiolite and took place between 78 and 66 Ma, prior to deepest burial.
Figure 10: Sketched evolution and related hydrocarbon generation and migration: Burial by
sedimentation (1) and under the ophiolite (2, 3) induced hydrocarbon generation and solid
bitumen formation within the Natih B and led finally to deepest burial (3). Erosion and
doming tilted the layers (4) and two lateral hydrocarbon migration events from the foreland
basins occurred, where the Natih oil kitchen was still active (5,6).
The two lower-reflecting generations must represent two later hydrocarbon migration
events that took place after deepest burial (Figure 10e,f). In our basin model, the
temperatures inferred for the second, medium-reflecting generation are reached at 55-
50 Ma, and for the third, low-reflecting solid bitumen at 48 to 45 Ma.

ACC
EPTE
D M
ANU
SCR
IPT
ACCEPTED MANUSCRIPT
18
As the Natih B source rock in the Jebel Akhdar area became overmature at peak
temperature, the two later migration events have to be derived from an external source as a
consequence of lateral, intraformational petroleum migration. The most likely source for
this is a lower mature producing source somewhere in the SW and a possible migration
initiated due to tilting of the area by updoming of the Jebel Akhdar anticline (cp. Figure 10).
Both ideas are in agreement with interpretations by Fink et al. (2015). It should be noted
that, in most petroleum source rocks permeability parallel to bedding is one or two orders
of magnitude higher than bedding-perpendicular (Ghanizadeh et al., 2014), favoring lateral
migration.
According to Terken (1999) a presently active oil kitchen of the Natih is located 50 km SW
of Wadi Nakhr in the foreland. Here, oil production started slightly later at 70 Ma and
ophiolite obduction did not affect this area directly. This kitchen could represent the source
of our later migration events.
5. Conclusion
The Natih B source rock in the Jebel Akhdar shows thermal maturities that reflect peak
temperatures of 226-239 °C with a corresponding maximum burial depth of 7.6-8.2 km,
including approximately 6 km of obducted ophiolite.
Three generations of solid bitumen in the Natih B are linked to hydrocarbon generation
(78-66 Ma) and primary migration prior to deepest burial and two later, secondary
hydrocarbon migration events (55-50 Ma and 48-45 Ma) after peak burial. The latter events
can only be explained by long distance lateral migration of fluids, probably from the SW due
to tilting of the area by updoming of the Jebel Akhdar anticline.
Maturity data obtained by Raman spectroscopy provides the same results for organic rich
matrix and solid bitumen particles, and correlates well with measured BRr. In the absence
of solid bitumen particles it is regarded as an excellent paleothermometer at the stage of
high-grade diagenesis to anchimetamorphism.
Our data form the basis for a detailed understanding of ophiolite and nappe obduction on
underlying sedimentary sequences with special emphasis on temperature and pressure

ACC
EPTE
D M
ANU
SCR
IPT
ACCEPTED MANUSCRIPT
19
evolution. Integration of field data and numerical modelling is regarded as key to further
develop this approach.
Acknowledgements
The authors would like to express gratitude for fruitful discussions to Christoph von Hagke,
Simon Virgo, Reinhard Fink and Alexander Stock. Donka Macherey is thanked for preparing
and polishing the whole rock samples and Jop Klaver and Joyce Schmatz for conducting the
SEM measurements (all RWTH Aachen University). Reviewers Wiekert Visser and an
anonymous reviewer are thanked for constructive, helpful comments on an earlier draft of
this paper. Funding was provided by a RWTH Aachen University scholarship for doctoral
students. Maps in this publication were created using ArcGIS® software by Esri. ArcGIS®
and ArcMap™ are the intellectual property of Esri and are used herein under license
(Copyright © Esri. All rights reserved).
References
Al-lazki, A.I., Seber, D., Sandvol, E., Barazangi, M., 2002. A crustal transect across the Oman Mountains on the eastern margin of Arabia. GeoArabia 7, 47–78.
Al-Wardi, M., Butler, R.W.H., 2007. Constrictional extensional tectonics in the northern Oman mountains, its role in culmination development and the exhumation of the subducted Arabian continental margin. Geol. Soc. London, Spec. Publ. 272, 187–202. doi:10.1144/GSL.SP.2007.272.01.11
Aoya, M., Kouketsu, Y., Endo, S., Shimizu, H., Mizukami, T., Nakamura, D., Wallis, S., 2010. Extending the applicability of the Raman carbonaceous-material geothermometer using data from contact metamorphic rocks. J. Metamorph. Geol. 28, 895–914. doi:10.1111/j.1525-1314.2010.00896.x
Arndt, M., Virgo, S., Cox, S.F., Urai, J.L., 2014. Changes in fluid pathways in a calcite vein mesh (Natih Fm, Oman Mountains): insights from stable isotopes. Geofluids 1–28. doi:10.1111/gfl.12083
Barker, C.E.E., Pawlewicz, M.J.J., 1994. Calculation of Vitrinite Reflectance from Thermal Histories and Peak Temperatures - A Comparison of Methods, in: Mukhopadhyay, P., Dow, W. (Eds.), Vitrinite Reflectance as a Maturity Parameter. American Chemical Society, pp. 216–229.
Bertotti, G., Immenhauser, A., Taal-van Koppen, J.K.J., 2005. Stratigraphic and regional distribution of fractures in Barremian–Aptian carbonate rocks of Eastern Oman: outcrop data and their extrapolation to Interior Oman hydrocarbon reservoirs. Int. J.

ACC
EPTE
D M
ANU
SCR
IPT
ACCEPTED MANUSCRIPT
20
Earth Sci. 94, 447–461. doi:10.1007/s00531-005-0472-5
Beurrier, M., Bechennec, F., Rabu, D., Hutin, G., 1986. Geological Map of Rustaq - explanatory notes. Sultanat Oman, Minist. Pet. Miner.
Beyssac, O., Goffé, B., Chopin, C., Rouzaud, J.N., 2002. Raman spectra of carbonaceous material in metasediments: A new geothermometer. J. Metamorph. Geol. 20, 859–871. doi:10.1046/j.1525-1314.2002.00408.x
Beyssac, O., Lazzeri, M., 2012. Application of Raman spectroscopy to the study of graphitic carbons in earth science, in: Dubessy, J., Caumon, M.-C., Rull F. (Eds.), Raman Spectroscopy Applied to Earth Sciences and Cultural Heritages. Mineralogical Union & Mineralogical Society of Great Britain & Ireland, London, pp. 414–454.
Blanc, P., Connan, J., 1994. Preservation, degradation, and destruction of trapped oil, in: The Petroluem System - from Source to Trap, 60, AAPG Memoir. pp. 237–247.
Breesch, L., Swennen, R., Dewever, B., Roure, F., Vincent, B., 2011. Diagenesis and fluid system evolution in the northern Oman Mountains, United Arab Emirates: Implications for petroleum exploration. GeoArabia 16, 111–148.
Breesch, L., Swennen, R., Vincent, B., 2009. Fluid flow reconstruction in hanging and footwall carbonates: Compartmentalization by Cenozoic reverse faulting in the Northern Oman Mountains (UAE). Mar. Pet. Geol. 26, 113–128. doi:10.1016/j.marpetgeo.2007.10.004
Breton, J.P., Bechennec, F., Le Metour, J., Moen-Maurel, L., Razin, P., 2004. Eoalpine (Cretaceous) evolution of the Oman Tethyan continental margin; insights from a structural field study in Jabal Akhdar (Oman Mountains). GeoArabia 9, 41–58.
Bruns, B., Littke, R., 2015. Lithological dependency and anisotropy of vitrinite reflectance in high rank sedimentary rocks of the Ibbenbüren area, NW-Germany: Implications for the tectonic and thermal evolution of the Lower Saxony Basin. Int. J. Coal Geol. 137, 124–135. doi:10.1016/j.coal.2014.11.007
Dahl, J.E., Moldowan, J.M., Peters, K.E., Claypool, G.E., Rooney, M. a., Michael, G.E., Mello, M.R., Kohnen, M.L., 1999. Diamondoid hydrocarbons as indicators of natural oil cracking. Nature 399, 54–57. doi:10.1038/19953
Espitalié, J., Laporte, J.L., Madec, M., Marquis, F., Leplat, P., Paulet, J., Boutefeu, A., 1977. Méthode rapide de caractérisation des roches mètres, de leur potential pétrolier et de leur degré d’évolution. Oil Gas Sci. Technol. 32, 23–42.
Ferreiro Mählmann, R., Frey, M., 2012. Standardisation, calibration and correlation of the Kübler-index and the vitrinite/bituminite reflectance: An inter-laboratory and field related study. Swiss J. Geosci. 105, 153–170. doi:10.1007/s00015-012-0110-8
Filbrandt, J.B., Al-Dhahab, S., Al-Habsy, A., Harris, K., Keating, J., Al-mahruqi, S., Ozkaya, S.I., Richard, P.D., Robertson, T., 2006. Kinematic interpretation and structural evolution of North Oman, Block 6, since the Late Cretaceous and implications for timing of hydrocarbon migration into Cretaceous reservoirs. GeoArabia 11, 97–115.

ACC
EPTE
D M
ANU
SCR
IPT
ACCEPTED MANUSCRIPT
21
Fink, R., Virgo, S., Arndt, M., Visser, W., Littke, R., Urai, J.L., 2015. Solid bitumen in calcite veins from the Natih Formation in the Oman Mountains: multiple phases of petroleum migration in a changing stress field. Int. J. Coal Geol. doi:10.1016/j.coal.2015.07.012
Fournier, M., Lepvrier, C., Razin, P., Jolivet, L., 2006. Late Cretaceous to Paleogene post-obduction extension and subsequent Neogene compression in the Oman Mountains. GeoArabia 11, 17–40.
Ganz, H.H., Kalkreuth, W., 1991. IR classification of kerogen type, thermal maturation, hydrocarbon potential and lithological characteristics. J. Southeast Asian Earth Sci. 5, 19–28. doi:10.1016/0743-9547(91)90007-K
Gentzis, T., Goodarzi, F., 1990. A review of the use of bitumen reflectance in hydrocarbon exploration with examples from Melvelle Island, Arctic Canada, in: Nuccio, V.F., Barker, C.E. (Eds.), Applications of Maturity Studies to Energy Exploration. pp. 23–36.
Ghanizadeh, A., Amann-Hildenbrand, A., Gasparik, M., Gensterblum, Y., Krooss, B.M., Littke, R., 2014. Experimental study of fluid transport processes in the matrix system of the European organic-rich shales: II. Posidonia Shale (Lower Toarcian, northern Germany). Int. J. Coal Geol. 123, 20–33. doi:10.1016/j.coal.2013.06.009
Glennie, K.W., Boeuf, M.G.A., Clarke, M.W.H., Moody-Stuart, M., Pilaar, W.F.H., Reinhardt, B.M., 1973. Late Cretaceous Nappes in Oman Mountains and Their Geologic Evolution. Am. Assoc. Pet. Geol. Bull. 57, 5–27.
Gomez-Rivas, E., Bons, P.D., Koehn, D., Urai, J.L., Arndt, M., Virgo, S., Laurich, B., Zeeb, C., Stark, L., Blum, P., 2014. The Jabal Akhdar dome in the Oman Mountains: Evolution of a dynamic fracture system. Am. J. Sci. 314, 1104–1139. doi:10.2475/07.2014.02
Grelaud, C., Razin, P., Homewood, P.W., Schwab, a. M., 2006. Development of Incisions on a Periodically Emergent Carbonate Platform (Natih Formation, Late Cretaceous, Oman). J. Sediment. Res. 76, 647–669. doi:10.2110/jsr.2006.058
Grobe, A., von Hagke, C., Nokar, K., Wuebbeler, F., Littke, R., Urai, J.L., 2015. Understanding obduction dynamics – structural and thermal history of the Oman Mountains. Geotecton. Res. 97, 40–43.
Hacker, B.R., Mosenfelder, J.L., 1996. Metamorphism and deformation along the emplacement thrust of the Samail ophiolite, Oman. Earth Planet. Sci. Lett. 144, 435–451. doi:10.1016/S0012-821X(96)00186-0
Hanna, S.S., 1990. The Alpine deformation of the Central Oman Mountains. Geol. Soc. London, Spec. Publ. 49, 341–359. doi:10.1144/GSL.SP.1992.049.01.21
Hantschel, T., Kauerauf, A.I., 2009. Fundamentals of Basin and Petroleum Systems Modeling. Springer Verlag, Berlin, Heidelberg.
Hilgers, C., Kirschner, D.L., Breton, J.P.P., Urai, J.L., 2006. Fracture sealing and fluid overpressures in limestones of the Jabal Akhdar dome, Oman mountains. Geofluids 6, 168–184. doi:10.1111/j.1468-8123.2006.00141.x
Hillgärtner, H., Van Buchem, F.S.P., Gaumet, F., Razin, P., Pittet, B., Grötsch, J., Droste, H.,

ACC
EPTE
D M
ANU
SCR
IPT
ACCEPTED MANUSCRIPT
22
2003. THE BARREMIAN – APTIAN EVOLUTION OF THE EASTERN ARABIAN CARBONATE PLATFORM MARGIN. J. Sediment. Res. 73, 756–773.
Holland, M., Urai, J.L., Muchez, P., Willemse, E.J.M., 2009. Evolution of fractures in a highly dynamic thermal, hydraulic, and mechanical system – (I) Field observations in Mesozoic Carbonates, Jabal Shams, Oman Mountains. GeoArabia 14, 57–110.
Homewood, P., Razin, P., Grélaud, C., Droste, H., Vahrenkamp, V., Mettraux, M., Mattner, J., 2008. Outcrop sedimentology of the Natih Formation, northern Oman: A field guide to selected outcrops in the Adam Foothills and Al Jabal al Akhdar areas. GeoArabia 13, 39–120.
Immenhauser, A., Hillgärtner, H., Sattler, U., Bertotti, G., Schoepfer, P., Homewood, P., Vahrenkamp, V., Steuber, T., Masse, J., Droste, H., Koppen, J.T., Kooij, B. Van Der, Bentum, E. Van, Verwer, K., Strating, E.H., Swinkels, W., Peters, J., Immenhauser-potthast, I., Maskery, S. Al, 2004. Barremian-lower Aptian Qishn Formation, Haushi-Huqf area, Oman: a new outcrop analogue for the Kharaib/Shu’aiba reservoirs. GeoArabia 9, 153–194.
Immenhauser, A., Matthews, R.K., 2004. Albian sea-level cycles in Oman: the “Rosetta Stone” approach. GeoArabia 9, 11–46.
Immenhauser, A., Schlager, W., Burns, S.J., Scott, R.W., Geel, T., Lehmann, J., van der Gaast, S., Bolder-Schrijver, L.J.A., 1999. Late Aptian to late Albian sea-level fluctuations constrained by geochemical and biological evidence (Nahr Umr formation, Oman). J. Sediment. Res. 69, 434–446.
Immenhauser, A., Scott, R.W., 2002. An estimate of Albian sea-level amplitudes and its implication for the duration of stratigraphic hiatuses. Sediment. Geol. 152, 19–28. doi:10.1016/S0037-0738(02)00260-9
Jacob, H., 1989. Classification, Structure, Genesis and practical importance of natural solid oil bitumen (migrabitumen). Int. J. Coal Geol. 11, 65–79.
Johnson, C.M., Roden, E.E., Welch, S.A., Beard, B.L., 2005. Experimental constraints on Fe isotope fractionation during magnetite and Fe carbonate formation coupled to dissimilatory hydrous ferric oxide reduction. Geochim. Cosmochim. Acta 69, 963–993.
Khorasani, G.K., Michelsen, J.K., 1993. The Thermal Evolution of Solid Bitumens, Bitumen Reflectance, and Kinetic Modeling of Reflectance: Application in Petroleum and Ore Prospecting. Energy Sources 15, 181–204. doi:10.1080/00908319308909024
Kouketsu, Y., Mizukami, T., Mori, H., Endo, S., Aoya, M., Hara, H., Nakamura, D., Wallis, S., 2014. A new approach to develop the Raman carbonaceous material geothermometer for low-grade metamorphism using peak width. Isl. Arc 23, 33–50. doi:10.1111/iar.12057
Lahfid, A., Beyssac, O., Deville, E., Negro, F., Chopin, C., Goffé, B., 2010. Evolution of the Raman spectrum of carbonaceous material in low-grade metasediments of the Glarus Alps (Switzerland). Terra Nov. 22, 354–360. doi:10.1111/j.1365-3121.2010.00956.x

ACC
EPTE
D M
ANU
SCR
IPT
ACCEPTED MANUSCRIPT
23
Landis, C.R., Castano, J.R., 1995. Maturation and bulk chemical properties of a suite of solid hydrocarbons. Org. Geochem. 22, 137–149.
Larter, S.R., Huang, H., Adams, J., Bennet, B., Jokanola, O., Oldenburg, T., Jones, M., Head, I.M., Riediger, C.L., Fowler, M., 2006. The controls on the composition of biodegraded oils in the deep subsurface: Part II - Geological controls on subsurface biodegradation fluxes and constraints on reservoir-fluid property prediction. AAPG Bull. 90, 921–938.
Le Metour, J., Rabu, D., Tegyey, M., Bechennec, F., Beurrier, M., Villey, M., 1990. Subduction and obduction: two stages in the Eo-Alpine tectonometamorphic evolution of the Oman Mountains. Geol. Soc. London, Spec. Publ. 49, 327–339. doi:10.1144/GSL.SP.1992.049.01.20
Littke, R., Klussmann, U., Krooss, B., Leythaeuser, D., 1991. Quantification of loss of calcite, pyrite, and organic matter due to weathering of Toarcian black shales and effects on kerogen and bitumen characteristics. Geochim. Cosmochim. Acta 55, 3369–3378. doi:10.1016/0016-7037(91)90494-P
Littke, R., Urai, J.L., Uffmann, A.K., Risvanis, F., 2012. Reflectance of dispersed vitrinite in Palaeozoic rocks with and without cleavage: Implications for burial and thermal history modeling in the Devonian of Rursee area, northern Rhenish Massif, Germany. Int. J. Coal Geol. 89, 41–50.
Loosveld, R.J.H., Bell, A., Terken, J.J.M., 1996. The tectonic evolution of interior Oman. GeoArabia 1, 28–51.
Lünsdorf, N.K., 2016. Raman spectroscopy of dispersed vitrinite – methodical aspects and correlation with reflectance. Int. J. Coal Geol. 153, 75–86. doi:10.1016/j.coal.2015.11.010
Masse, J., Borgomano, J., Al, S., 1997. Stratigraphy and tectonosedimentary evolution of a late Aptian-Albian carbonate margin: the northeastern Jebel Akhdar (Sultanate of Oman). Sediment. Geol. 113, 269–280.
Nöth, S., Karg, H., Littke, R., 2001. Reconstruction of Late Paleozoic heat flows and burial histories at the Rhenohercynian-Subvariscan boundary, Germany. Int. J. Earth Sci. 90, 234–256. doi:10.1007/s005310000114
Philip, J., Borgomano, J., Al-Maskiry, S., 1995. Cenomanian-Early Turonian carbonate platform of Northern Oman: stratigraphy and palaeo-environments. Palaeogeogr. Palaeoclimatol. Palaeoecol. 119, 77–92.
Pimenta, M. a, Dresselhaus, G., Dresselhaus, M.S., Cançado, L.G., Jorio, a, Saito, R., 2007. Studying disorder in graphite-based systems by Raman spectroscopy. Phys. Chem. Chem. Phys. 9, 1276–1291. doi:10.1039/b613962k
Pöppelreiter, M.C., Schneider, C.J., Obermaier, M., Forke, H.C., Koehrer, B., Aigner, T., 2011. Seal turns into reservoir: Sudair equivalents in outcrops, A1 Jabal al-Akhdar, Sultanate of Oman. GeoArabia 16, 69–108.
Pratt, R., Smewing, D., Swansea, S.A., Pratt, B.R., Smewing, J.D., 1990. Jurassic and Early

ACC
EPTE
D M
ANU
SCR
IPT
ACCEPTED MANUSCRIPT
24
Cretaceous platform margin configuration and evolution, central Oman Mountains. Geol. Soc. London, Spec. Publ. 49, 69–88. doi:10.1144/GSL.SP.1992.049.01.06
Rabu, D., Le Metour, J., Bechennec, F., Beurrier, M., Villey, M., Bourdillon-Jeudy de Grissac, C., 1990. Sedimentary aspects of the Eo-Alpine cycle on the northeast edge of the Arabian Platform (Oman Mountains). Geol. Soc. London, Spec. Publ. 49, 49–68. doi:10.1144/GSL.SP.1992.049.01.05
Razin, P., Homewood, P., Grélaud, C., 2010. Channelized systems in an inner carbonate platform setting: differentiation between incisions and tidal channels (Natih Formation, Late Cretaceous, Oman), in: van Buchem, F.S.P., Gerdes, K.D., Esteban, M. (Eds.), Mesozoic and Cenozoic Carbonate Systems of the Mediterranean and the Middle East: Stratigraphic and Diagenetic Reference Models. Geol. Soc. Spec. Publ., London, pp. 163–186.
Robertson, A., 1987. The transition from a passive margin to an Upper Cretaceous foreland basin related to ophiolite emplacement in the Oman Mountains. Geol. Soc. Am. Bull. 99, 633–653.
Robin, P.L., Rouxhet, P.G., 1978. Characterization of kerogens and study of their evolution by infrared spectroscopy: carbonyl and carboxyl groups. Geochim. Cosmochim. Acta 42, 1341–1349. doi:10.1016/0016-7037(78)90039-X
Rogers, M.A., Mcalary, J.D., Bailey, N.J.L., 1974. Significance of Reservoir Bitumens to Thermal-Maturation Studies, Western Canada Basin. Am. Assoc. Pet. Geol. Bull. 58, 1806–1824.
Rolandone, F., Lucazeau, F., Leroy, S., Mareschal, J.-C., Jorand, R., Goutorbe, B., Bouquerel, H., 2013. New heat flow measurements in Oman and the thermal state of the Arabian Shield and Platform. Tectonophysics 589, 77–89. doi:10.1016/j.tecto.2012.12.034
Rousseau, M., Dromart, G., Droste, H., Homewood, P., 2006. Stratigraphic organisation of the Jurassic sequence in Interior Oman, Arabian Peninsula. GeoArabia 11, 17–50.
Saddiqi, O., Michard, A.N., Goffe, B.R., Poupeau, G.É., Oberhänsli, R.O., 2006. Fission-track thermochronology of the Oman Mountains continental windows, and current problems of tectonic interpretation. Bull. Soc. géol. Fr. 177, 127–134.
Searle, M.., 1985. Sequence of thrusting and origin of culminations in the northern and central Oman Mountains. J. Struct. Geol. 7, 129–143. doi:10.1016/0191-8141(85)90127-0
Searle, M.P., 2007. Structural geometry, style and timing of deformation in the Hawasina Window, Al Jabal al Akhdar and Saih Hatat culminations, Oman Mountains. GeoArabia 12, 99–130.
Stenhouse, P., 2014. Reactive Transport and Fluid Pathways in Fracture-Controlled Flow Systems. Dissertation. Australian National University.
Terken, J.M.J., 1999. The Natih petroleum system of north Oman. GeoArabia 4, 157–180.
Terken, J.M.J., Frewin, N.L., Indrelid, S.L., 2001. Petroleum systems of Oman: Charge timing

ACC
EPTE
D M
ANU
SCR
IPT
ACCEPTED MANUSCRIPT
25
and risks. Am. Assoc. Pet. Geol. Bull. 85, 1817–1845.
Vahrenkamp, V.C., 2013. Carbon-isotope signatures of Albian to Cenomanian (Cretaceous) shelf carbonates of the Natih Formation, Sultanate of Oman. GeoArabia 18, 65–82.
Van Buchem, F.S.P., Razin, P., Homewood, P.W., Oterdoom, W.H., Philip, J., 2002. Stratigraphic Organization of Carbonate Ramps and Organic-Rich Intrashelf Basins: Natih Formation (Middle Cretaceous) of Northern Oman. Am. Assoc. Pet. Geol. Bull. 86, 21–53. doi:10.1306/61EEDA30-173E-11D7-8645000102C1865D
Van Buchem, F.S.P., Razin, P., Homewood, P.W., Philip, J.M., Eberli, G.P., Platel, J., Roger, J., Eschard, R., Desaubliaux, G.M.J., Boisseau, T., Leduc, J., Labourdette, R., Cantaloube, S., 1996. High Resolution Sequence Stratigraphy of the Natih Formation (Cenomanian/Turonian ) in Northern Oman: Distribution of Source Rocks and Reservoir Facies. GeoArabia 1, 65–91.
Virgo, S., 2015. Aspects of crack-seal vein system evolution. Dissertation. RWTH Aachen University.
Virgo, S., Arndt, M., Sobisch, Z.Z., Urai, J.L., 2013. Development of fault and vein networks in a carbonate sequence near Hayl al-Shaz, Oman Mountains. GeoArabia 18, 99–136.
Visser, W., 1991. Burial and thermal history of Proterozoic source rocks in Oman. Precambrian Res. 54, 15–36. doi:10.1016/0301-9268(91)90066-J
Warburton, J., Burnhill, T.J., Graham, R.H., Isaac, K.P., 1990. The evolution of the Oman Mountains Foreland Basin. Geol. Soc. London, Spec. Publ. 49, 419–427. doi:10.1144/GSL.SP.1992.049.01.26
Wopenka, B., Pasteris, J.D., 1993. Structural characterization of kerogens to granulite-facies gaphite: Applicability of Raman microprobe spectroscopy. Am. Mineral. 78, 533–557.
Wübbeler, F., von Hagke, C., Grobe, A., Nokar, K., Urai, J.L., 2015. The latest stage of an obduction orogen - doming of the Jebel Akhdar constrained by structural geology and low-temperature thermochronology. 20th Int. Conf. Deform. Mech. Rheol. Tectonics, Geotecton. Res. 97, 103–105.
Wygrala, B.P., 1989. Integrated study on an oil field in the southern po basin, northern italy. Berichte der Kernforschungsanlage Jülich 2313, 217.
Xiao-Fei, Q., Yao, Q.-Z., Zhou, G.-T., 2011. Synthesis of siderite microspheres and their transformation to magnetite microspheres. Eur. J. Mineral. 23, 759–770.
Yui, T.F., Huang, E., Xu, J., 1996. Raman spectrum of carbonaceous material: a possible metamorphic grade indicator for low-grade metamorphic rocks. J. Metamorph. Geol. 14, 115–124. doi:10.1046/j.1525-1314.1996.05792.x
Appendix 1: Petrophysical parameters for the used lithologies in the numerical basin
model

ACC
EPTE
D M
ANU
SCR
IPT
ACCEPTED MANUSCRIPT
26
Figure 1a

ACC
EPTE
D M
ANU
SCR
IPT
ACCEPTED MANUSCRIPT
27
Figure 1b

ACC
EPTE
D M
ANU
SCR
IPT
ACCEPTED MANUSCRIPT
28
Figure 1c

ACC
EPTE
D M
ANU
SCR
IPT
ACCEPTED MANUSCRIPT
29
Figure 2

ACC
EPTE
D M
ANU
SCR
IPT
ACCEPTED MANUSCRIPT
30
Figure 3

ACC
EPTE
D M
ANU
SCR
IPT
ACCEPTED MANUSCRIPT
31
Figure 4

ACC
EPTE
D M
ANU
SCR
IPT
ACCEPTED MANUSCRIPT
32
Figure 5

ACC
EPTE
D M
ANU
SCR
IPT
ACCEPTED MANUSCRIPT
33
Figure 6

ACC
EPTE
D M
ANU
SCR
IPT
ACCEPTED MANUSCRIPT
34
Figure 7

ACC
EPTE
D M
ANU
SCR
IPT
ACCEPTED MANUSCRIPT
35
Figure 8

ACC
EPTE
D M
ANU
SCR
IPT
ACCEPTED MANUSCRIPT
36
Figure 9

ACC
EPTE
D M
ANU
SCR
IPT
ACCEPTED MANUSCRIPT
37
Figure 10

ACC
EPTE
D M
ANU
SCR
IPT
ACCEPTED MANUSCRIPT
38
Table 1
sample
location form
ation
longitude / latitude, UTM 40Q
TOC [wt.-%]
TIC [wt.-%]
TC [wt.-%]
AG15SR00
Entrance Wadi Nakhr
Natih B 520786 m 2561505 m 0.44 13.36 13.79
AG15SR01
Entrance Wadi Nakhr
Natih B 520786 m 2561505 m 1.06 12.42 13.48
AG15SR08
Entrance Wadi Nakhr
Natih B 520786 m 2561505 m 0.53 13.04 13.58
AG15SR09
Entrance Wadi Nakhr
Natih B 520786 m 2561505 m 0.41 13.40 13.80
AG15SR10
Entrance Wadi Nakhr
Natih B 520786 m 2561505 m 0.82 12.55 13.37
AG15SR11
Wadi Nakhr KH 3 517751 m 2561591 m 0.21 12.55 12.77
AG15SR13
Wadi W of Nakhr Natih 530217 m 2557793 m 0.43 13.41 13.84
AG15SR14
Wadi W of Nakhr Natih 530217 m 2557793 m 0.36 12.91 13.27
AG15SR15
Wadi W of Nakhr Natih 530217 m 2557793 m 0.37 13.28 13.65
AG15SR17
Wadi W of Nakhr Natih 530217 m 2557793 m 0.59 12.94 13.52
AG15SR22
Wadi N of Al Hamra Natih 531024 m 2557020 m 0.42 13.67 14.09
AG15SR23
Wadi N of Al Hamra Natih 531024 m 2557020 m 0.86 13.51 14.37
AG15SR29
Wadi NW of Al Hamra
Natih B 547871 m 2549637 m 0.31 13.18 13.48
AG15SR30
Wadi NW of Al Hamra
Natih B 547871 m 2549637 m 0.36 12.77 13.13
AG15SR32
Wadi NW of Al Hamra
Natih B 547871 m 2549637 m 0.46 13.21 13.66
AG15SR34
Wadi NW of Al Hamra
Natih B 547871 m 2549637 m 0.37 13.40 13.77
AG15SR35
Wadi NW of Al Hamra
Natih B 547871 m 2549637 m 0.26 13.19 13.45
AG15SR37
Wadi Tanuf Natih
B 547844 m 2549686 m 0.23 13.70 13.93
AG15 Wadi Tanuf Natih 547871 m 2549636 m 0.23 13.05 13.28

ACC
EPTE
D M
ANU
SCR
IPT
ACCEPTED MANUSCRIPT
39
SR39 B
AG15SR40
Wadi Tanuf Natih
B 568306 m 2539861 m 0.25 13.53 13.78
AG15SR42
Wadi Tanuf Natih
B 568306 m 2539861 m 0.21 13.10 13.32
AG15SR44
Wadi Muaydin KH 3 568371 m 2538788 m 0.20 12.92 13.12
AG15SR45
Wadi Muaydin
Natih B 568364 m 2538808 m 0.21 13.76 13.96
AG15SR46
Wadi Muaydin
Natih B 521644 m 2564675 m 0.22 13.39 13.61
AG15SR47
Wadi Muaydin
Natih B 521644 m 2564675 m 0.21 13.80 14.01
AG15SR48
Wadi Nakhr KH 2 521227 m 2564015 m 0.28 11.78 12.07
AG15SR50
Wadi Nakhr KH 2 521156 m 2563928 m - - -
AG15SR56
Wadi Sahtan Natih
B 530902 m 2584644 m 0.21 13.46 13.67
AG15SR57
Wadi Sahtan Natih
B 530900 m 2584640 m 0.23 13.25 13.48
AG15SR58
Wadi Mistal Natih
B 570959 m 2577241 m 0.20 12.49 12.69
AG15SR59
Wadi Mistal Natih
B 570960 m 2577241 m 0.22 13.36 13.58
AG15SR60
Wadi Mistal Natih
B 570961 m 2577241 m 0.21 13.20 13.41
AG15SR63
Wadi Mistal Natih
B 571042 m 2577142 m 0.20 12.98 13.17
AG 02
Chessboard Pvmt
Muti A 512673 m 2570368 m 0.22 11.74 11.97
AG 04
Gorge Pvmt Muti
A 514069 m 2572850 m 0.21 0.23 0.44
AG 05
Gorge Pvmt Muti
A 513794 m 2572960 m 0.00 0.22 0.22
AG 06
Gorge Pvmt Muti
A 513771 m 2573124 m 0.00 0.25 0.25
AG 07
Gorge Pvmt Muti
A 513794 m 2573214 m 0.00 0.23 0.23
AG 23
Wadi Ghul Muti
A 515139 m 2562679 m 0.21 0.27 0.48

ACC
EPTE
D M
ANU
SCR
IPT
ACCEPTED MANUSCRIPT
40
AG 25
Balcony Walk Nakhr
Nahr Umr 520913 m 2565658 m 0.23 12.45 12.67
AG 26
Balcony Walk Nakhr
Nahr Umr 521046 m 2565576 m 0.25 8.99 9.24
AG 27
Balcony Walk Nakhr
Nahr Umr 520879 m 2565342 m 0.24 11.60 11.84
AG 28
Balcony Walk Nakhr
Nahr Umr 520855 m 2565307 m 0.23 11.31 11.53
AG 29
Balcony Walk Nakhr
Nahr Umr 520866 m 2565186 m 0.24 10.09 10.33
AG 30
Balcony Walk Nakhr
Nahr Umr 520755 m 2565030 m 0.25 11.80 12.05
AG 31
Jebel Shams Muti
A 520186 m 2569814 m 0.25 7.15 7.40
AG 35
Jebel Shams Muti
A 515084 m 2568916 m 0.22 0.23 0.45
AG 37
Jebel Shams Muti
A 514820 m 2568047 m 0.34 1.25 1.59
AG 38
Jebel Shams Muti
A 514930 m 2567334 m 0.28 3.51 3.79
Table 2
sample location S1 S2 S3 TOC [wt.%]
HI [mg HC/g
TOC]
OI [mg
CO2/gTOC]
AG15SR01 Entrance
Wadi Nakhr
0.09 0.13 1.29 1.06 12 122
AG15SR10 Entrance
Wadi Nakhr
0.03 0.13 1.30 0.82 15 160
AG15SR13 Wadi W of Nakhr
0.05 0.16 1.29 0.43 36 298
AG15SR17 Wadi W of Nakhr
0.04 0.16 1.28 0.59 27 220

ACC
EPTE
D M
ANU
SCR
IPT
ACCEPTED MANUSCRIPT
41
Table 3
sample No. location formation TOC [%]
measured BRr [%]
1st gen (n)
std. 2nd gen (n)
std. 3rd gen (n)
std.
AG15SR00 Entrance Wadi Nakhr Natih B 0.44 3.08 (58) 0.19 2.28 (43) 0.24 1.42 (65) 0.24
AG15SR01 Entrance Wadi Nakhr Natih B 1.06 3.36 (57) 0.19 2.28 (79) 0.18 1.42 (8) 0.14
AG15SR08 Entrance Wadi Nakhr Natih B 0.53 3.59 (38) 0.25 2.40 (86) 0.20 - -
AG15SR10 Entrance Wadi Nakhr Natih B 0.82 3.30 (100) 0.20 - - - -
AG 21 Entrance Wadi Nakhr Natih B 0.29 - - - - 1.04 (15) 0.08
AG15SR13 Wadi W of Wadi Nakhr Natih B 0.43 - - 2.28 (13) 0.37 1.43 (92) 0.26
AG15SR15 Wadi W of Wadi Nakhr Natih B 0.37 - - 2.39 (14) 0.14 1.90 (24) 0.10
AG15SR17 Wadi W of Wadi Nakhr Natih B 0.59 - - 2.45 (24) 0.33 1.27 (54) 0.40
AG15SR21 Wadi N of Al Hamra Natih B - - - - - 1.45 (27) 0.14
AG15SR22 Wadi N of Al Hamra Natih B 0.42 3.34 (3) 0.08 - - 1.31 (84) 0.26
AG15SR23 Wadi N of Al Hamra Natih B 0.86 2.95 (17) 0.28 2.34 (66) 0.38 1.64 (23) 0.23
AG15SR30 Wadi NW of Al Hamra Natih B 0.36 - - - - 1.38 (26) 0.19
AG15SR32 Wadi NW of Al Hamra Natih B 0.46 - - - - 1.23 (44) 0.20
AG15SR34 Wadi NW of Al Hamra Natih B 0.37 - - - - 1.10 (30) 0.10
AG15SR35 Wadi NW of Al Hamra Natih B 0.26 - - 2.26 (9) 0.34 1.46 (94) 0.24
AG15SR40 Wadi Tanuf Natih B 0.25 - - - - 1.08 (25) 0.15
AG15SR46 Wadi Muaydin Natih B 0.22 - - - - 1.34 (33) 0.10
AG15SR57 Wadi Sahtan Natih B 0.23 3.32 (6) 0.20 2.56 (25) 0.56 1.27 (17) 0.12

ACC
EPTE
D M
ANU
SCR
IPT
ACCEPTED MANUSCRIPT
42
Table 4
location format
ion
measured BRr [%] calculated VRr [%]
calculated T burial (Barker&Pawlewicz)
calculated Thydro (Barker&Pawlewicz)
1st gen
2nd gen
3rd gen
1st gen
(VR ≈ BR)
2nd gen
(Landis &
Castano)
3rd gen
(Jacob ´89)
1st gen 2nd gen
3rd gen 1st gen 2nd gen
3rd gen
Wadi Nakhr area Natih B
3.08-3.59
2.28-2.45
1.04-1.90
3.08-3.59
2.47-2.62
1.04-1.57
226-239 °C
208-213 °C
139-172 °C
296-316 °C
268-275 °C
157-210 °C
Al Hamra area Natih B
2.95-3.34
2.26-2.34
1.10-1.64
2.95-3.34
2.45-2.53
1.08-1.41
223-233 °C
208-210 °C
142-163 °C
291-306 °C
267-271 °C
162-196 °C
Wadi Tanuf Natih B - - 1.08 - - 1.07 - - 141 °C - - 160.83
Wadi Muaydin Natih B - - 1.34 - - 1.23 - - 152 °C - - 178.65
Wadi Sahtan Natih B 3.32 2.56 1.27 3.32 2.73 1.18 232 °C 216 °C 149 °C 305.62 280.60 173.34

ACC
EPTE
D M
ANU
SCR
IPT
ACCEPTED MANUSCRIPT
43
Table 5
sample no. lithology location
measured at filter scan T
SV 10-1 Natih Wadi Nakhr
bitumen D1 10x2s 227 °C
SV 10-2 Natih Wadi Nakhr
bitumen D1 10x2s 227 °C
SV 10-3 Natih Wadi Nakhr
bitumen D1 10x2s 228 °C
SV 10-4 Natih Wadi Nakhr
bitumen D1 10x2s 226 °C
SV 10-6 Natih Wadi Nakhr
bitumen D2 10x5s 231 °C
AG 22-1 Natih Wadi Nakhr matrix D1 6x10s 261 °C
AG 22-2 Natih Wadi Nakhr matrix D1 6x10s 243 °C
AG 22-3 Natih Wadi Nakhr matrix D1 10x5s 225 °C
AG 22-4 Natih Wadi Nakhr matrix D2 10x5s 233 °C
AG 01-1
Shuaiba (Kh. Gp.) Wadi Nakhr
bitumen D1 10x5s 252 °C
AG 01-2
Shuaiba (Kh. Gp.) Wadi Nakhr matrix D1 10x5s 269 °C
AG 01-3
Shuaiba (Kh. Gp.) Wadi Nakhr matrix D1 10x5s 253 °C
AG 01-4
Shuaiba (Kh. Gp.) Wadi Nakhr matrix D1 10x5s 251 °C
AG 11-1 Hawasina Sint
bitumen D1 10x2s 209 °C
AG 11-2 Hawasina Sint
bitumen D1 6x10s 215 °C
AG 11-3 Hawasina Sint
bitumen D1 6x10s 193 °C
AG 11-4 Hawasina Sint
bitumen D1 10x2s 207 °C
AG 11-5 Hawasina Sint
bitumen D1 10x2s 213 °C
AG 25-1 Nahr Umr Balcony Walk
Nakhr matrix D1 5x15s 246 °C
AG 25-2 Nahr Umr Balcony Walk
Nakhr matrix D1 5x15s 226 °C
ACC
EPTE
D M
ANU
SCR
IPT
ACCEPTED MANUSCRIPT
44
AG 25-3 Nahr Umr Balcony Walk
Nakhr matrix D1 5x20s 267 °C
AG 25-4 Nahr Umr Balcony Walk
Nakhr matrix D1 5x20s 262 °C
AG 26-1 Nahr Umr Balcony Walk
Nakhr
bitumen D1 10x3s 213 °C
AG 26-2 Nahr Umr Balcony Walk
Nakhr
bitumen D1 10x3s 211 °C
AG 26-3 Nahr Umr Balcony Walk
Nakhr matrix D1 10x3s 275 °C
AG 26-4 Nahr Umr Balcony Walk
Nakhr matrix D1 8x20s 280 °C
AG 27-1 Nahr Umr Balcony Walk
Nakhr matrix D1 5x15s 261 °C
AG 27-2 Nahr Umr Balcony Walk
Nakhr matrix D1 5x20s 248 °C
AG 27-3 Nahr Umr Balcony Walk
Nakhr matrix D1 5x20s 266 °C
AG 30-1 Nahr Umr Balcony Walk
Nakhr matrix D1 5x10s 251 °C
AG 30-2 Nahr Umr Balcony Walk
Nakhr matrix D1 5x20s 257 °C
AG 30-3 Nahr Umr Balcony Walk
Nakhr matrix D1 5x20s 248 °C
AG 37-1 Muti Jebel Shams
bitumen D1 5x5s 193 °C
AG 37-2 Muti Jebel Shams
bitumen D1 5x5s 208 °C
AG 37-3 Muti Jebel Shams
bitumen D1 5x5s 191 °C
AG 38-2 Muti Jebel Shams
bitumen D1 10x10s 172 °C
AG 38-4 Muti Jebel Shams
bitumen D1 10x5s 206 °C

ACC
EPTE
D M
ANU
SCR
IPT
ACCEPTED MANUSCRIPT
45
Table 6
sample No.
location formation TOC [%]
measured BRr [%]
1st gen (n)
std. 2nd gen (n)
std. 3rd gen (n)
std.
AG 02
Chessboard Pvmt. Muti A 0.22
3.04 (9) 0.35 - - - -
AG 04
Road to Gorge Pvmt. Muti A 0.00
3.08 (6) 0.35 2.31 (9) 0.56 - -
AG 05
Way to Gorge Pvmt. Muti A 0.00
3.71 (8) 0.15 - - 1.75 (5) 0.05
AG 06
Way to Gorge Pvmt. Muti A 0.00
3.18 (9) 0.32 - - - -
AG 07
Way to Gorge Pvmt. Muti A 0.00
- - - - 1.55 (5) 0.11
AG 23 Road to Sint Muti A 0.21 3.63 (27) 0.18 2.88 (8) 0.10 - -
AG 31 Jebel Shams Muti A 0.25 - - 1.95 (19) 0.10 1.73 (18) 0.05
AG 35 Jebel Shams Muti A 0.22 - - 2.03 (2) 0.02 - -
AG 37 Jebel Shams Muti A 0.34 - - - - 1.41 (16) 0.08
AG 38 Jebel Shams Muti A 0.28 3.30 (34) 0.17 2.77 (34) 0.14 - -
AG15SR50 Wadi Nakhr Kahmah 2 - 3.47 (6) 0.14 - - - -
AG 25 Balcony Nahr Umr 0.23 - - - - 1.42 (24) 0.09
AG 26 Balcony Nahr Umr 0.25 - - 2.42 (39) 0.23 - -
AG 27 Balcony Nahr Umr 0.24 - - 2.50 (2) 0.06 - -
AG 29 Balcony Nahr Umr 0.24 - - 2.16 (16) 0.05 - -
AG 30 Balcony Nahr Umr 0.25 - - 2.39 (33) 0.19 1.33 (13) 0.07

ACC
EPTE
D M
ANU
SCR
IPT
ACCEPTED MANUSCRIPT
46
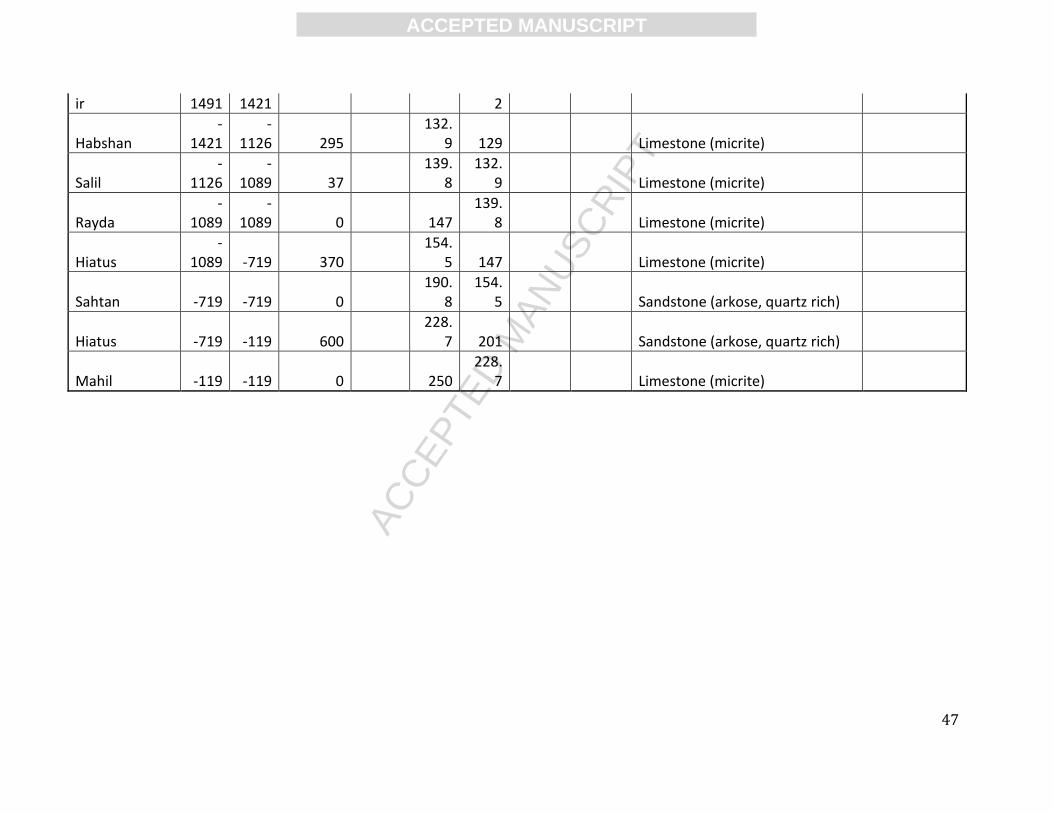
Table 7
layer
top [m
b.s.l.]
base [m
b.s.l.]
thickness [m]
eroded [m]
depo.
start [Ma]
depo. end [Ma]
erosion start [Ma]
erosion end [Ma]
assigned lithology PSE
Semail_Crust
-2033
-2033 0 3150 77.6 65 65 45 Upper crust (oceanic, basalt)
Semail_Mantle
-2033
-2033 0 3150 77.7 77.6 45 40 Peridotite (serpentinized)
Hawasina
-2033
-2033 0 1400 78 77.7 40 25 Limestone (micrite)
Muti -
2033
-1999 34 150 93.9 78 25 20 Conglomerate (typical) Seal Rock
Natih_A
-1999
-1957 42 95 93.9 Limestone (micrite)
Reservoir Rock
Natih_B
-1957
-1917 40 96 95
Limestone (organic rich - 10% TOC) Source Rock
Natih_C_D
-1917
-1847 70 98 96 Limestone (micrite)
Natih_E
-1847
-1836 11 100 98
Limestone (organic rich - 1-2% TOC) Source Rock
Natih_F_G
-1836
-1706 130 101 100 Limestone (ooid grainstone)
Nahr_Umr
-1706
-1706 0 112 101 Limestone (shaly) Seal Rock
Hiatus
-1706
-1666 40 113 112 Limestone (micrite)
Shuaiba
-1666
-1491 175
125.2 113 Limestone (micrite)
Kharaib_Lekha - - 70 129 125. Limestone (shaly)
ACC
EPTE
D M
ANU
SCR
IPT
ACCEPTED MANUSCRIPT
47
ir 1491 1421 2
Habshan
-1421
-1126 295
132.9 129 Limestone (micrite)
Salil -
1126
-1089 37
139.8
132.9 Limestone (micrite)
Rayda
-1089
-1089 0 147
139.8 Limestone (micrite)
Hiatus
-1089 -719 370
154.5 147 Limestone (micrite)
Sahtan -719 -719 0 190.
8
154.5 Sandstone (arkose, quartz rich)
Hiatus -719 -119 600 228.
7 201 Sandstone (arkose, quartz rich)
Mahil -119 -119 0 250
228.7 Limestone (micrite)

ACC
EPTE
D M
ANU
SCR
IPT
ACCEPTED MANUSCRIPT
48
Appendix 1
lithology
density
max. compressibility thermal conductivity heat capacity
[kg/m
3] [Gpa-1]
at 20 °C [W/m/K]
at 100 °C [W/m/K]
at 20 °C [kcal/kg/K]
at 100 °C [kcal/kg/K]
Upper crust (oceanic, basalt) 2870 - 1.80 1.81 0.19 0.22
Peridotite (serpentinized) 3100 - 2.20 2.10 0.17 0.19
Limestone (micrite) 2740 85.00 3.00 2.69 0.20 0.23
Limestone (shaly) 2730 68.65 2.30 2.18 0.20 0.23
Limestone (organic rich - 1-2% TOC)
2710 86.51 2.63 2.42 0.20 0.23
Limestone (organic rich - 10% TOC)
2550 95.68 1.45 1.55 0.20 0.23
Limestone (ooid grainstone) 2740 0.20 3.00 2.69 0.20 0.23
Sandstone (arkose, quartz rich)
2690 26.71 4.05 3.46 0.21 0.24
Conglomerate (typical) 2700 14.21 2.30 2.18 0.20 0.23

ACC
EPTE
D M
ANU
SCR
IPT
ACCEPTED MANUSCRIPT
49
Graphical abstract