plant populations and grassland dynamics - konza prairie population ecology.pdf · plant...
TRANSCRIPT

Plant Populations and
Grassland DynamicsDavid Hartnett
Harmony Dalgleish
Jackie Ott
Maipelo N’Guessan
Gail Wilson
Understanding grassland plant demography is important to:
• Provide a mechanistic understanding of patterns and dynamics at the community and ecosystem levels
• Link population and ecosystem level processes
• Predict responses to environmental change – many global change phenomena are demographic processes (e.g. species invasions, cover change)

In perennial grasslands, vegetative reproduction and and belowground bud banks are important regulators of vegetation dynamics and productivity
Preburn 2May 16May 29May 12Jun 26Jun 11Jul 24Jul 15Aug
Per
cent
cha
nge
-20
0
20
40
60
80
100
Live
ste
ms
/ m2
600
800
1000
1200
1400
1600
1800
2000
SPB20B
a.
Fire
26A
pr
*
* * * * ** *
*
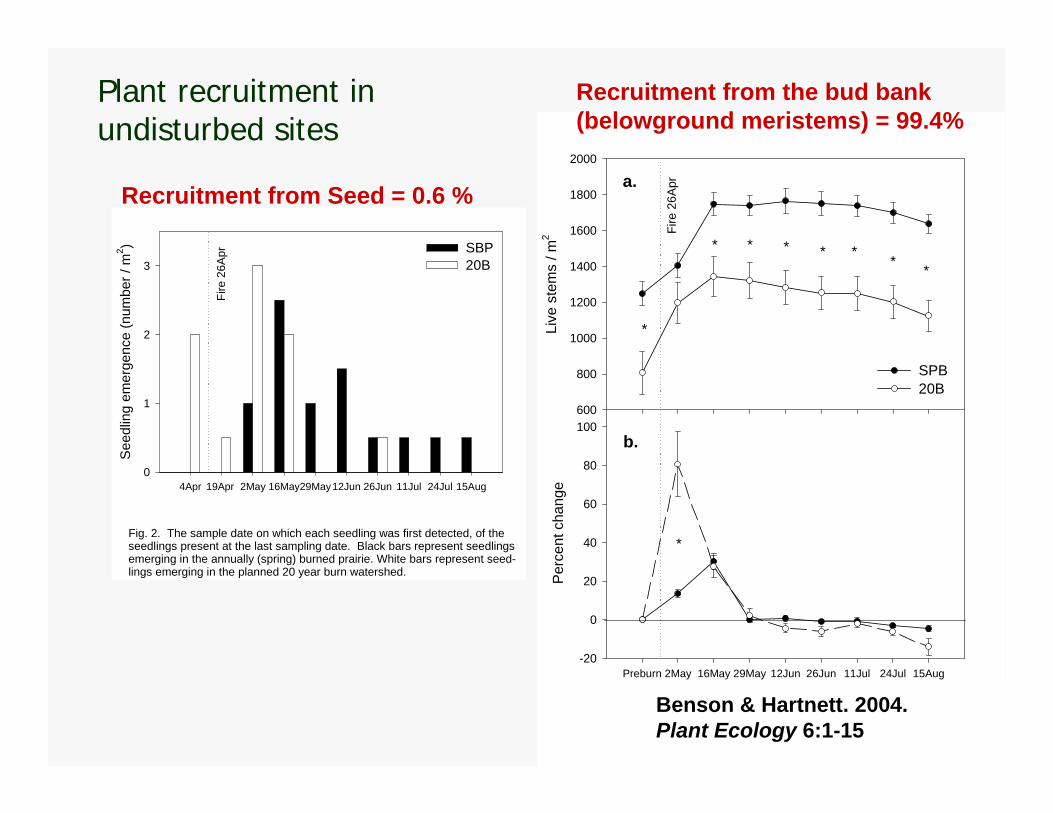
Fig. 13. Overall dynamics of live stems on the annually (spring) burned water-shed (black symbols) and the planned 20 yr burned watershed (open symbols). Error bars represent +/- 1SE of the mean. Asterisks indicate a significant difference between watersheds with p < 0 05 a Average live stem density for
b.
Benson & Hartnett. 2004. Plant Ecology 6:1-15
4Apr 19Apr 2May 16May29May12Jun 26Jun 11Jul 24Jul 15Aug
See
dlin
g em
erge
nce
(num
ber /
m2 )
0
1
2
3SBP20B
Fig. 2. The sample date on which each seedling was first detected, of the seedlings present at the last sampling date. Black bars represent seedlingsemerging in the annually (spring) burned prairie. White bars represent seed-lings emerging in the planned 20 year burn watershed.
Fire
26A
pr
Recruitment from Seed = 0.6 %
Recruitment from the bud bank (belowground meristems) = 99.4%
Plant recruitment in undisturbed sites

Rogers & Hartnett. 2001. Amer. J. Botany 88: 1634-1642
B.
Sampling Period
J96 J96 A96 S96 O96 M97 J97 J97 A97 S970
1
2
3
4
5
6
7
8
9
10
11
12 Large mounds
SDRAIN
CLONAL
SDBANKREGROW
80 %From buds
20 % From seed
Stems 0.01m-2
Plant recruitment in disturbed microsites
Long-term Average Annual Precipitation (mm/year)
200 300 400 500 600 700 800 900 1000
Ave
rage
Bud
Ban
k(b
elow
grou
nd m
eris
tem
s/m
2 )
0200400600800
100012001400160018002000
SEVSGSNVPKANKNZROC
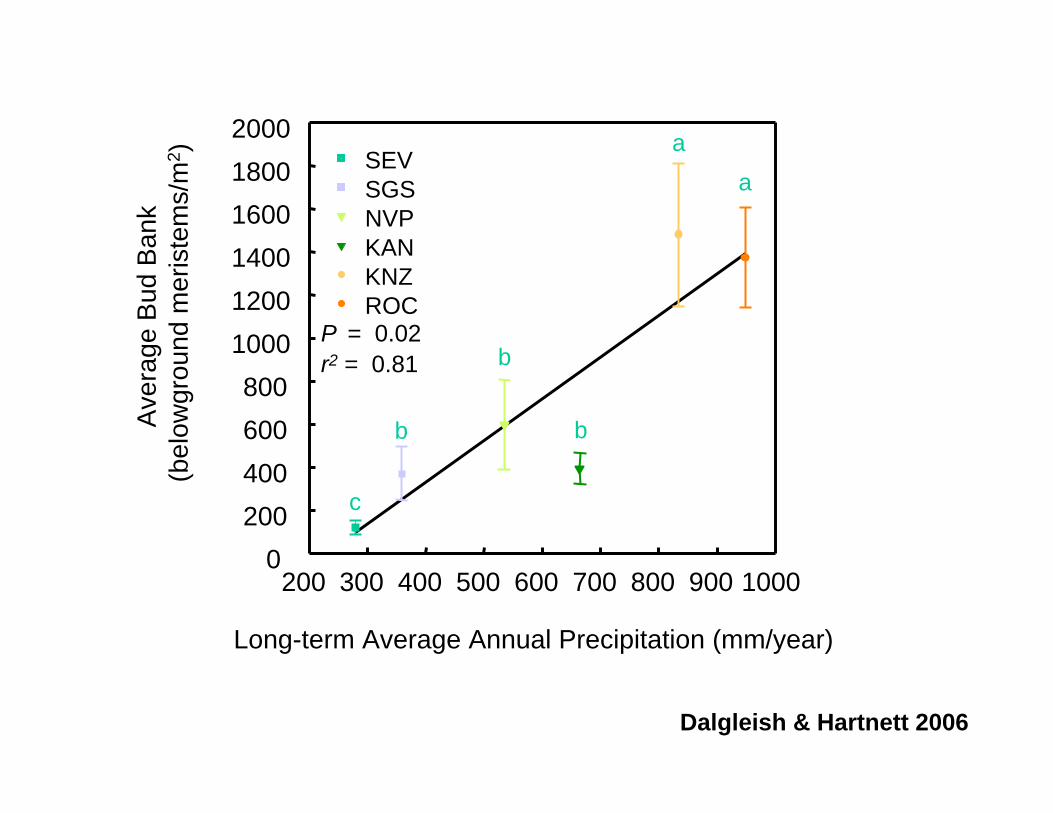
P = 0.02r2 = 0.81
aa
b
b
b
c
Dalgleish & Hartnett 2006

Site
Meristem Limitation Index
(total buds/total stems)Rockefeller Prairie 3.72Konza Prairie 1.35Niobrara Valley Preserve 0.45Kanopolis State Park 0.50Short Grass Steppe 0.33Sevilleta 0.09
Dalgleish & Hartnett 2006

ANPP, Community Structure
Active budpool(meristems/m2)
Dormantbud pool(buds/m2)
Mortality
Mature rhizomepopulation
Bud outgrowth
Ramet population
(No./m2)
seedrain
seedbank
0.42
0.22
2,000
1,550
0.4x10⁻³
0.27
15K
4K
0.78
0.36
2.14
720
Stage-based matrix models: a tool to predict grassland population responses to environmental change

Consequences of bud bank populations and meristem limitation -
1. Grassland responses to environmental change
- tracking changes in resource availability
- resistance to invasibility
- demographic buffering capacity in rare species
- change in growth form dominance (grass-woody)
2. Genetic/evolutionary consequences
AN
PP
(g/m
2 )
Year
Precipitation (m
m)0
500
1000
1500
0
100
200
300
400
500
600
700
800
19951990198519801975
annually burned uplandannually burned lowland
2000
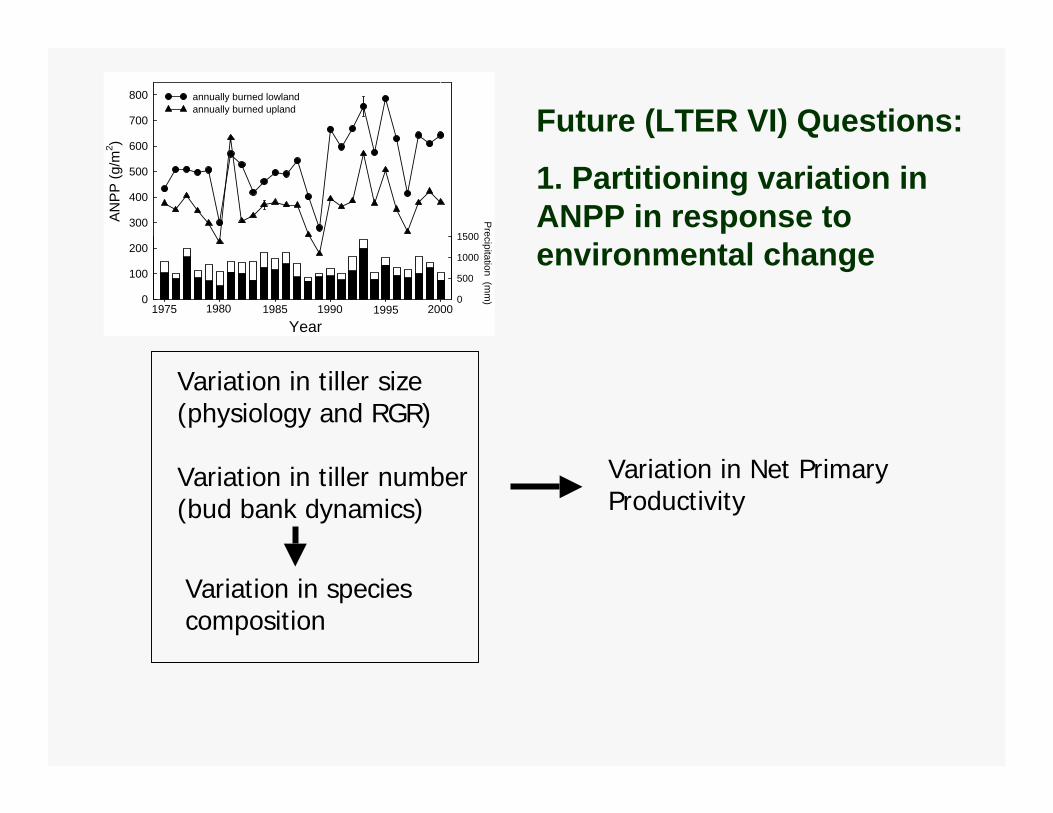
Future (LTER VI) Questions:
1. Partitioning variation in ANPP in response to environmental change
Variation in tiller size (physiology and RGR)
Variation in tiller number (bud bank dynamics)
Variation in species composition
Variation in Net Primary Productivity

Bud FloweringTiller
VegTiller
P1 P2 P3
G2G1
VfVv
A =
P3G200P2G1
VfVvP1
Response to increased resources (Nitrogen) in Sporobolusheterolepis

Elasticities
Control + NP1 0.10 ± 0.003 0.09 ± 0.003P2 0.19 ± 0.005 0.19 ± 0.007P3 0.01 ± 0.001 0.02 ± 0.003G1 0.35 ± 0.003 0.33 ± 0.004G2 0.01 ± 0.002 0.02 ± 0.003Vv 0.33 ± 0.005 0.31 ± 0.007Vf 0.01 ± 0.002 0.02 ± 0.003
S. heterolepis - 2004

Tiller Size
2004 2005 2005
Ave
rage
Tille
r Siz
e (g
)
0.0
0.1
0.2
0.3
0.4Control+ N
S. heterolepis K. macrantha
P = 0.08P = 0.28
P = 0.19

Number of clips1 2 3 4 5 6 7 8
RG
R (g
g-1
d-1)
0.00
0.02
0.04
0.06
0.0820062005
a
a
b b
cc
c c
N’Guessan (2007)
Schyzachrium scoparium
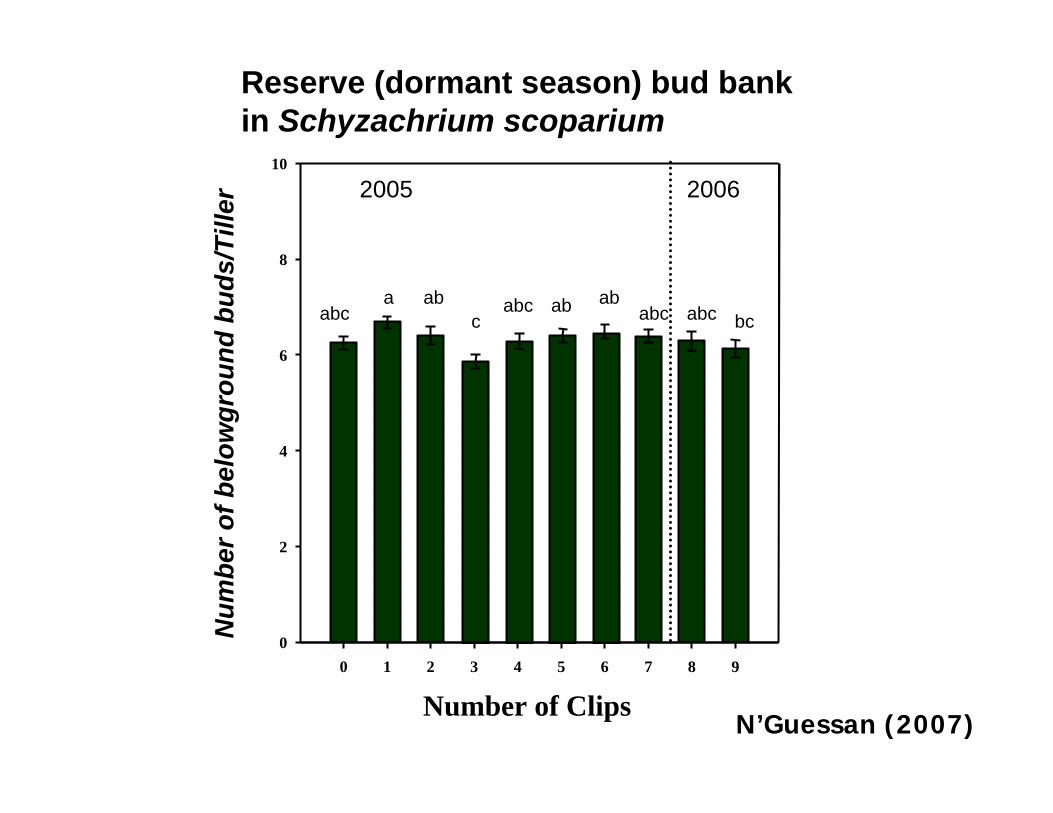
Num
ber o
f bel
owgr
ound
bud
s/Ti
ller
N’Guessan (2007)Number of Clips
0 1 2 3 4 5 6 7 8 90
2
4
6
8
10
abca ab
cabc ab ab
abc abc bc
20062005
Reserve (dormant season) bud bank in Schyzachrium scoparium

Future Questions:
2. Patterns of inter-specific and inter-site variation in bud bank dynamics
Kalahari-KonzaComparative Study
Watershed R20A

Hartnett, Ott, & Dalgleish (in prep)

• Does bud bank size in African grass species influence their resilience to drought and grazing?
•Are seed production and bud production inversely related (trade-offs)?
• How does changing resource availability influence relative allocation to seed vs. vegetative reproduction?
• To what extent do seed banks and reserve bud banks buffer effects of environmental change on plant population dynamics?
Future Questions:
3. Long-term study of factors driving population dynamics of dominant, sub-dominant, and rare species
• Role of intrinsic and extrinsic factors on population dynamics of grass guilds (C4, C3, caespitose, rhizomatous grasses)
• Relative influence of weather, fire, and grazing on population dynamics
(c.f. Jonas and Joern 2007 synthesis on grasshopper dynamics)

Meristem population density (No. m-2)
Commun
ity
stabil
ity
Invasibility
Low
HighInvasibilitythreshold
Low High
Future Questions:
4. Influence of belowground demography (bud bank densities) on invasibility of grasslands
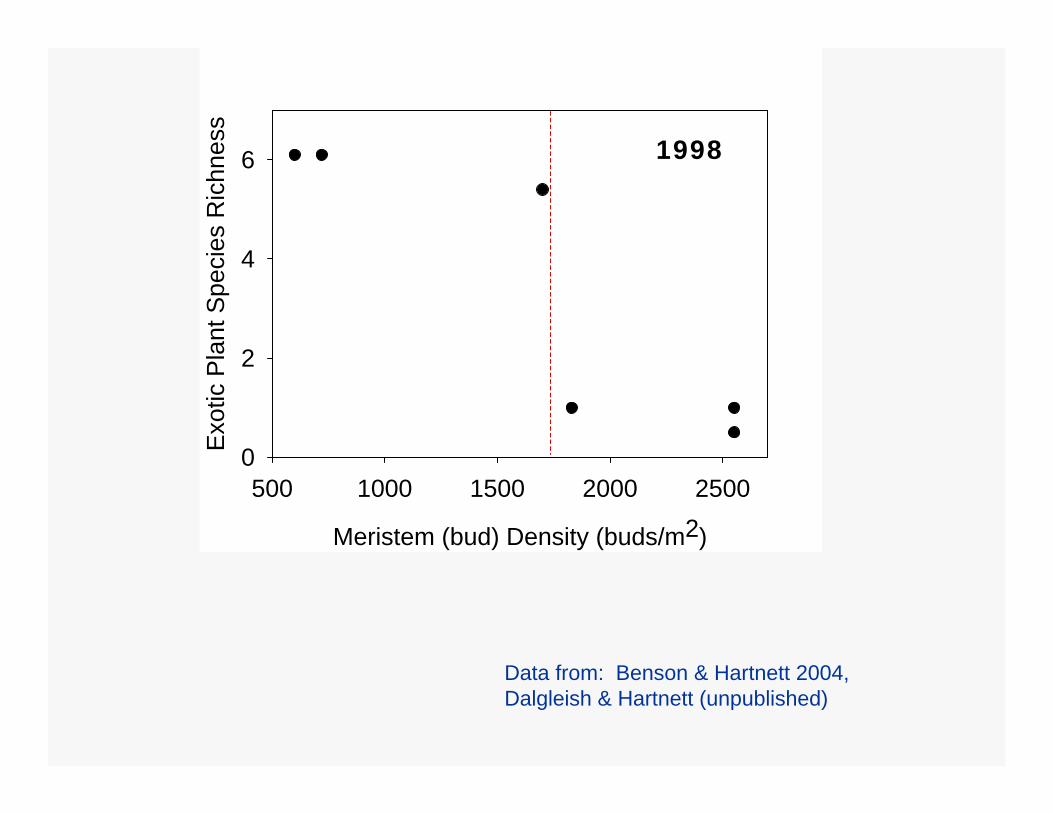
Meristem (bud) Density (buds/m2)
500 1000 1500 2000 2500
Exo
tic P
lant
Spe
cies
Ric
hnes
s
0
2
4
6
Data from: Benson & Hartnett 2004, Dalgleish & Hartnett (unpublished)
1998
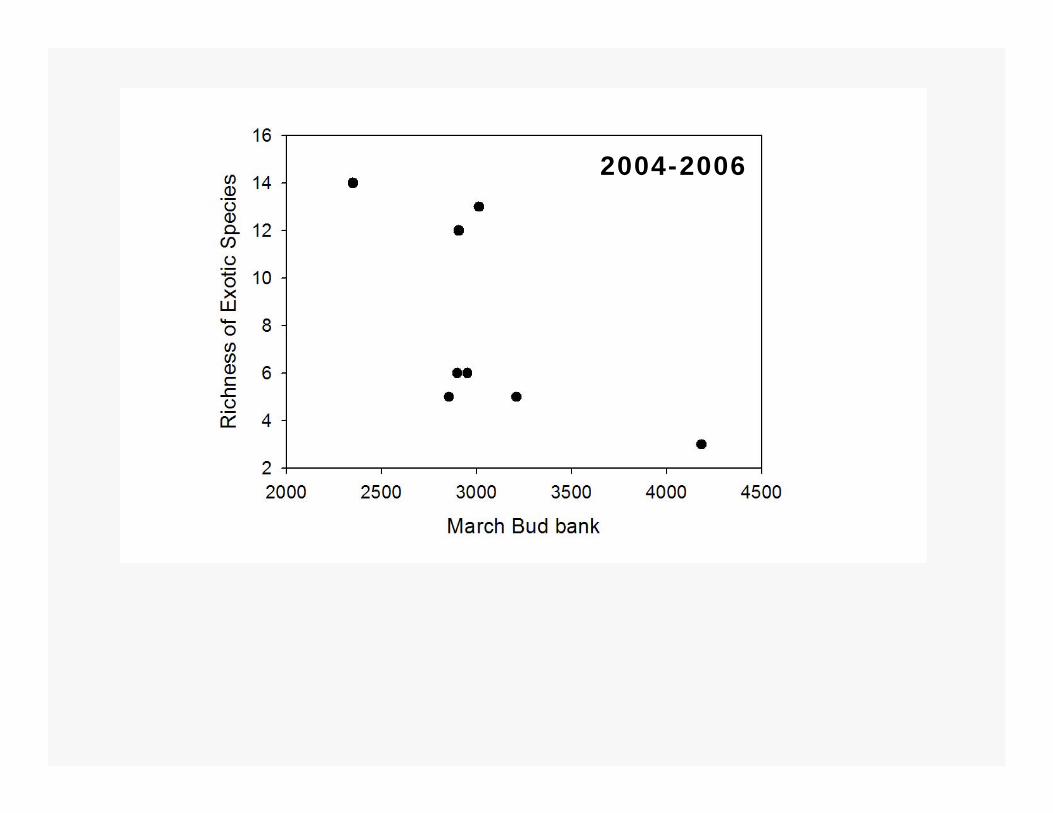
2004-2006

Future Questions:
5. De-coupling effects of fire suppression and woody plant invasion.
1. Split plot study on unburned watershed
• K20A, 20C, N20A, N20B
• Mechanical removal of woody vegetation on one portion of unit
2. Comparison of population dynamics and community trajectories in replicate“wooded” and “un-wooded” sites within unburned watersheds

Unburned Prairie (K20 non-woody)
Native (burned) Prairie
Unburned Prairie (K20 shrub island)
Restoration 1: Herbicide-Treated Shrub Islands
Restoration 2: Burned Shrub Islands
0.95
0.08
0.540.62
Herbaceous community similarity (Morisita’s Index) between tallgrass prairie sites.
Andrade (2007)