plant image retrieval using color, shape and texture...
TRANSCRIPT

© The Author 2010. Published by Oxford University Press on behalf of The British Computer Society. All rights reserved.For Permissions, please email: [email protected]
doi:10.1093/comjnl/bxq037
Plant Image Retrieval Using Color,Shape and Texture Features
Hanife Kebapci, Berrin Yanikoglu∗
and Gozde Unal
Faculty of Engineering and Natural Sciences, Sabanci University, Istanbul 34956, Turkey∗Corresponding author: [email protected]
We present a content-based image retrieval system for plant image retrieval, intended especially forthe house plant identification problem. A plant image consists of a collection of overlapping leavesand possibly flowers, which makes the problem challenging. We studied the suitability of various well-known color, shape and texture features for this problem, as well as introducing some new texturematching techniques and shape features. Feature extraction is applied after segmenting the plantregion from the background using the max-flow min-cut technique. Results on a database of 380plant images belonging to 78 different types of plants show promise of the proposed new techniquesand the overall system: in 55% of the queries, the correct plant image is retrieved among the top-15results. Furthermore, the accuracy goes up to 73% when a 132-image subset of well-segmented plant
images are considered.
Keywords: image retrieval; plants; Gabor wavelets; SIFT
Received 4 October 2009; revised 9 March 2010Handling editor: Hakki Toroslu
1. INTRODUCTION
Content-based image retrieval (CBIR) offers efficient searchand retrieval of images based on their content. With theabundance and increasing number of images in digital librariesand the Internet in the last decades, CBIR has become anactive research area. Two important query categories can bedistinguished: (i) query by example (i.e. find examples similarto this one) and (ii) semantic retrieval using a description of thesearch concept (e.g. find images containing bicycles). Query byexample is often executed by comparing images with respect tolow-level features obtained from the whole image, such as color,texture or shape features. Semantic retrieval on the other handrequires higher-level understanding of the image contents. Inthis case, local features such as scale-invariant feature transform(SIFT) descriptors ([1, 2]) are used for this problem, in locatingobjects within complex scenes. These two broad categories canbe further subdivided. For instance the query by example canbe done by providing a sketch or a template instead of animage. Similarly, the semantic retrieval can be made at differentlevels of abstraction of the query concept (e.g. by providing anexample image or a description of a bicycle) [3].
Examining images based on color is one of the most widelyused techniques. The earliest image retrieval studies used coloras the comparing feature between images [4–6]. A simple color
similarity between two images can be measured by comparingtheir color histograms. The color histogram, which is a commoncolor descriptor, indicates the occurrence frequencies of colorsin the image [7]. More complex color features may involvelooking into the spatial relationship of multiple colors or lookingat the color histograms in automatically segmented regions ofthe image. For example, extending the idea of a histogram, acolor co-occurrence matrix gives information about the colordistribution in neighboring image pixels.
Other widely used features can be grouped as shapeand texture features. Shape is one of the most importantcharacteristics of an object. In CBIR, the problem often refersto finding a particular shape within the queried images, whichrequires image segmentation. Image segmentation is a difficultproblem by itself; in fact, segmentation and recognition oftenform a chicken-or-egg problem. Once segmented, the shape ofan object may be described and matched using a variety of shapefeatures.
Two basic approaches to shape analysis exist: region-basedand boundary-based (contour-based) [8]. Region-based systemstypically use moment descriptors [9] that include geometricalmoments, Zernike moments and Legendre moments [8].Boundary-based systems use the contour of the objects andusually give better results for images that are distinguishableby their contours. Fourier descriptors [8, 9], curvature scale
The Computer Journal, 2010
The Computer Journal Advance Access published April 9, 2010 at S
abanci University on June 29, 2010
http://comjnl.oxfordjournals.org
Dow
nloaded from

2 H. Kebapci et al.
space methods and deformable templates [10] are some of thecommon techniques used in contour-based shape recognition.
Texture can be described as the spatial patterns formed bythe surface characteristics of an object that manifests itself ascolor or grayscale variations in the image. While each surfacehas a texture, some objects can be said to have distinguishingtextures (e.g. skin or sand). Texture analysis and matching canbe done in the spatial or the frequency domain. Commonlyused texture features are gray-level co-occurrence matrices,local binary patterns (LBP), Markov random fields and Gaborwavelets [11–15].
In this paper, we present a plant retrieval system which takesas input the image of a plant and returns the most similar imagesfrom a database. The system is intended to be used as a webservice where users can send images of their house plants (whichthey often do not know by name) to find their Latin names andcare instructions. The problem involves identification of thematching plant, as well as retrieval of related varieties whichmay also be of interest to the user.
We assume that a close snapshot of the plant is given as query,ideally showing the outer boundary of the plant. However, thisassumption does not always hold even for our own database, assome of the pictures are close snapshots not showing the outerboundary of the plant. Sample plant images from our databaseare shown in Fig. 1 to illustrate the complexity of the problem,including illumination, pose and scale variations, as well asdifferences in shape, background and flower colors.
The paper is organized as follows. In Section 2, relatedwork on CBIR is presented. In Section 3, the proposedsystem is described, followed by the description of thecollected database and results, in Sections 4 and 5. Finally, asummary of the contributions and future work are discussed inSections 6 and 7.
2. RELATED WORK
Research on CBIR has shown its first significant results withfeature-based systems in the early 1990s [16–18]. Later researchmoved more toward semantic analysis of content [3, 19], aswell as improving the usability where, for instance, relevancefeedback was used to improve the results. Some of the latestresearch in this field can be found in [3, 5, 19, 20].
While there are some plant images in the commonly usedimage retrieval databases (e.g. the Corel database), we arenot aware of a CBIR system geared specifically toward houseplant retrieval. However, there are some related work in theareas of plant classification and identification that are developedfor botanical or agricultural needs. In systems geared towardbotanical applications [21–30], segmented leaf images are usedto identify unknown plant varieties, using features obtainedfrom the leaf contour.Yahiaoui et al. proposed an image retrievalsystem for identifying plant genes by using contour-based shapefeatures in [21]. The extracted shape descriptors in this studyinclude the length histogram of contour segments in differentdirections [22, 23]. Another work on plant image retrievalfocused on the leaf image retrieval problem using features suchas centroid-contour distance curve, eccentricity and angle codehistograms. These features are extracted from the leaf edgecontour after some preprocessing (e.g. scale normalization).Bruno et al. proposed a shape classification method [24, 25]which they applied to the tree leaf identification problem. Theshape features used in these studies (fractal dimension), areextracted using either segmented leaf outline or leaf venationsystem to retrieve both internal and external leaf characteristics.In some recent work [26, 27], the retrieval algorithm issupported with machine-learning techniques. In [26], plantleaves are classified based on their texture features, using LBPand Gabor wavelets together. The extracted texture features
FIGURE 1. Example images of two plants showing different types of variations among images of the same plant. Above plant: Hyacinth, Below:Calathea.
The Computer Journal, 2010
at Sabanci U
niversity on June 29, 2010 http://com
jnl.oxfordjournals.orgD
ownloaded from

Plant Image Retrieval Using Color, Shape and Texture Features 3
(spatial histograms) are then fed to a support vector machine(SVM) classifier. The study in [27] combined color and texturefeatures (color moments and wavelet transform) after rotatingeach leaf so as to align its central axis with the horizontal. AnSVM classifier is trained with the extracted color and texturefeatures in order to recognize the plants.
Systems geared toward agricultural applications includedetecting weeds in the field [31], detecting position of specificplants [32] and deciding whether or not a plant is damaged bya specified illness [33]. In [31], color and shape informationis used to detect weeds in the field. Sena’s work [33] onidentifying damaged maize plants proposes a segmentation stepto be used first. Leaf segmentation is done by thresholdingthe monochrome images that are converted from RGB using atransformation called the normalized excess green index (2g −r − b, where g, r and b are intensity values on correspondingRGB color channels) to distinguish weeds from soil regions.In [32], the center of a maize plant in a field is located byintersecting the main vein lines of leaves, that are in turndetected by using reflectance difference of veins and leaves.
While they attack a very similar problem, the above-mentioned plant identification systems differ from ours in animportant way: they all use a well-segmented image of the plantleaf, while we use an image of the whole plant which showsvariations in illumination, pose and scale, as well as overallplant shape, background and flower colors, if any.
3. METHODOLOGY
Given a query image, the system first uses an interactivesegmentation step to segment the plant from the background.While we assume that the query pictures will be closesnapshots of the plant, the pictures cannot be assumed to befree of background (e.g. pot, table, background wall). Thesegmentation step ensures the extraction of relevant features, byfocusing on the plant region rather than the background. In thecurrent system, the segmentation is run semi-automatically: forthe database images, the foreground and background regionsare marked manually until a satisfactory segmentation resultis obtained. In the actual use scenario, the user would haveto mark a few regions to identify some background andforeground regions; but once those regions are selected, furtheroperations including segmentation are performed by the systemautomatically without needing any additional information.Using segmented plant image rather than the original imagebrings an important gain in the system performance.
The segmented region is used for feature extraction whichconsists of well-known color, shape and texture features,along with some modifications to existing texture matchingtechniques and introducing some new shape features. Westudied the suitability of these features, both individually andin combination, in order to find the best combination for the
given problem. The feature extraction and matching steps areexplained in the following subsections.
3.1. Image segmentation
We use the max-flow min-cut (MFMC) graph cut method[34] to segment the plant images from the background. TheMFMC technique has recently become one of the most popularsegmentation approaches in computer vision; it efficientlyminimizes an energy defined on a graph constructed over theimage, based on the image descriptors. In the basic graph-cut approach, an image is represented as a graph where thegraph nodes are the pixels and the graph edges are formedbetween the neighboring pixels in the image. The algorithmrequires seed foreground and background pixels (source andsink, respectively) to be specified. It then splits the graph intotwo disjoint sets S (source) and T (sink), minimizing a costfunctional. The selected seeds form the initial values of thesets S and T . The assignment of the image pixels into twodisjoint sets corresponds to a binary labeling of the image withforeground and background regions. The functional is based ontwo values: (i) a spatial smoothness term which measures thecost of assigning the same label (e.g. foreground or background)to adjacent pixels and (ii) an observed data term that measuresthe cost of assigning a label to each pixel.
Once an energy or cost functional is defined as describedabove, one can resort to efficient optimization methods thatexist in the algorithms literature. For solving MFMC problemon directed weighted graphs, the augmenting path algorithmof Ford and Fulkerson [35], the push-relabel method and amodified version of the augmenting path method by Boykovand Kolmogorov [34] were introduced. In our work, Boykovand Kolmogorov’s technique is utilized since it is efficient andwidely used. There is no parameter expected from the user forthe segmentation; both the query and the database images aresegmented using the same settings. The most important variablefor the graph-cut algorithm is the variance estimator (σ 2) that isused to calculate the capacity between adjacent pixels (of edges)in order to maximize the flow. We used the default value forthis variable that is determined according to the image intensityvalues. Specifically, σ 2 is set according to the variance of theforeground seed region points and the maximum intensity ofthe image.
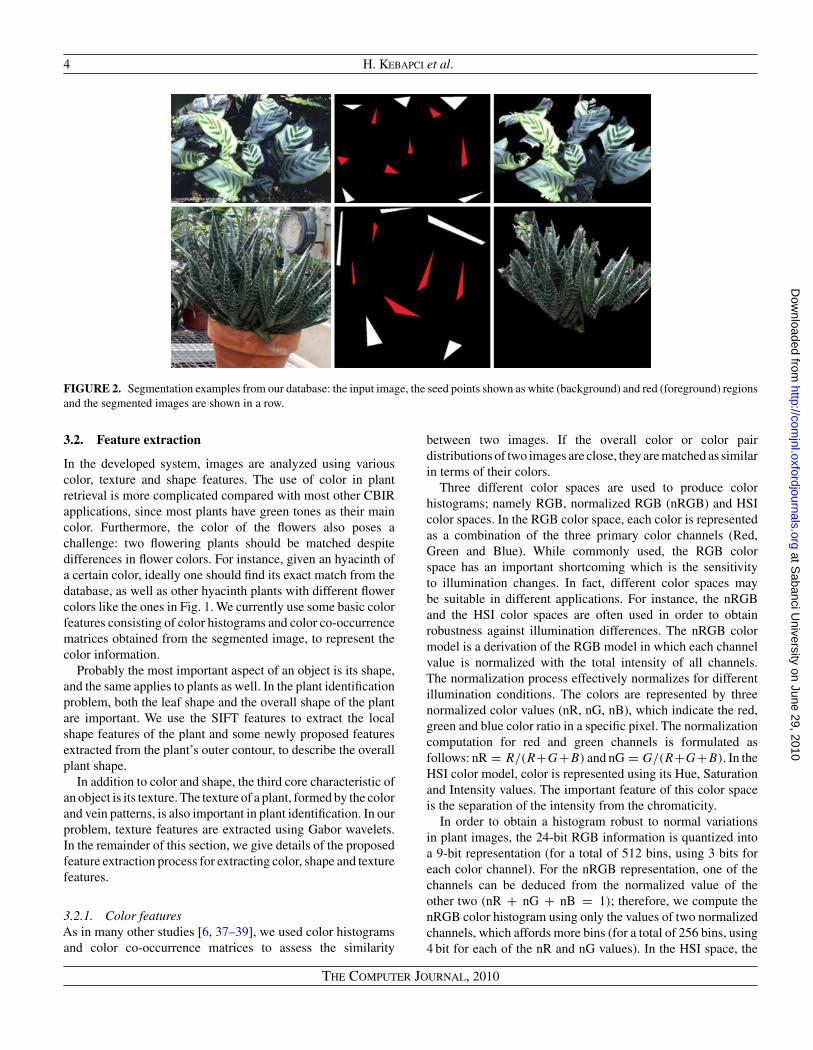
Currently, the seed and background selection is carriedout manually, using a MATLAB GUI program that we haveimplemented. For selecting the seed points more efficiently, theuser selects seed regions by indicating the vertices of polygonalregions. Defining five polygonal seed regions requires theselection of 15 points, on average. Figure 2 shows samplesegmentation results on two plant images from our database.While the segmentation step of the current system is relativelyeasy, we plan on adopting a more user friendly interactivesegmentation technique, such as the GrabCut algorithm [36],in the future.
The Computer Journal, 2010
at Sabanci U
niversity on June 29, 2010 http://com
jnl.oxfordjournals.orgD
ownloaded from
4 H. Kebapci et al.
FIGURE 2. Segmentation examples from our database: the input image, the seed points shown as white (background) and red (foreground) regionsand the segmented images are shown in a row.
3.2. Feature extraction
In the developed system, images are analyzed using variouscolor, texture and shape features. The use of color in plantretrieval is more complicated compared with most other CBIRapplications, since most plants have green tones as their maincolor. Furthermore, the color of the flowers also poses achallenge: two flowering plants should be matched despitedifferences in flower colors. For instance, given an hyacinth ofa certain color, ideally one should find its exact match from thedatabase, as well as other hyacinth plants with different flowercolors like the ones in Fig. 1. We currently use some basic colorfeatures consisting of color histograms and color co-occurrencematrices obtained from the segmented image, to represent thecolor information.
Probably the most important aspect of an object is its shape,and the same applies to plants as well. In the plant identificationproblem, both the leaf shape and the overall shape of the plantare important. We use the SIFT features to extract the localshape features of the plant and some newly proposed featuresextracted from the plant’s outer contour, to describe the overallplant shape.
In addition to color and shape, the third core characteristic ofan object is its texture. The texture of a plant, formed by the colorand vein patterns, is also important in plant identification. In ourproblem, texture features are extracted using Gabor wavelets.In the remainder of this section, we give details of the proposedfeature extraction process for extracting color, shape and texturefeatures.
3.2.1. Color featuresAs in many other studies [6, 37–39], we used color histogramsand color co-occurrence matrices to assess the similarity
between two images. If the overall color or color pairdistributions of two images are close, they are matched as similarin terms of their colors.
Three different color spaces are used to produce colorhistograms; namely RGB, normalized RGB (nRGB) and HSIcolor spaces. In the RGB color space, each color is representedas a combination of the three primary color channels (Red,Green and Blue). While commonly used, the RGB colorspace has an important shortcoming which is the sensitivityto illumination changes. In fact, different color spaces maybe suitable in different applications. For instance, the nRGBand the HSI color spaces are often used in order to obtainrobustness against illumination differences. The nRGB colormodel is a derivation of the RGB model in which each channelvalue is normalized with the total intensity of all channels.The normalization process effectively normalizes for differentillumination conditions. The colors are represented by threenormalized color values (nR, nG, nB), which indicate the red,green and blue color ratio in a specific pixel. The normalizationcomputation for red and green channels is formulated asfollows: nR = R/(R+G+B) and nG = G/(R+G+B). In theHSI color model, color is represented using its Hue, Saturationand Intensity values. The important feature of this color spaceis the separation of the intensity from the chromaticity.
In order to obtain a histogram robust to normal variationsin plant images, the 24-bit RGB information is quantized intoa 9-bit representation (for a total of 512 bins, using 3 bits foreach color channel). For the nRGB representation, one of thechannels can be deduced from the normalized value of theother two (nR + nG + nB = 1); therefore, we compute thenRGB color histogram using only the values of two normalizedchannels, which affords more bins (for a total of 256 bins, using4 bit for each of the nR and nG values). In the HSI space, the
The Computer Journal, 2010
at Sabanci U
niversity on June 29, 2010 http://com
jnl.oxfordjournals.orgD
ownloaded from

Plant Image Retrieval Using Color, Shape and Texture Features 5
360 different hue values are quantized to 10, 30 or 90 bins. Theintensity value is intentionally discarded, while the saturationcomponent is unused in the current work, for simplicity. Priorto histogram matching, we smooth the computed histograms bytaking weighted averages of the consecutive bin values, so as toobtain some robustness against quantization problems.
Although color co-occurrence is generally mentioned as atexture analysis method, it primarily indicates the distributionof color pairs. We use a 30×30 co-occurrence matrix computedfrom the HSI color space, where C[i][j ] stores the numberof neighboring image pixels having the hue values i and j .We generate the co-occurrence matrix using three differentmethods: (i) considering only four neighboring pixels (i.e. top,bottom, right and left neighbors); (ii) considering all eightneighboring pixels; and (iii) using 8-neighbors but ignoringthe diagonal elements of the co-occurrence matrix. Diagonalelements store the number of neighboring pixels that have thesame quantized color and dominate the matching process sincethey correspond to large uniform color regions in the image.Thus, this last method aims to concentrate on areas where colorschange, rather than the uniform areas.
3.2.2. Shape featuresWe use two types of shape features in this work: (i) SIFTfeatures to capture local characteristics of the plant and (ii)newly proposed global shape features describing the overallplant shape.
SIFT features have been successfully used in manyrecognition and retrieval problems [1, 40–42]. In this approach,scale-invariant keypoints (or interest points) in an image arelocated and the descriptors measured at these keypoints arecompared with those obtained in another image. A highnumber of matching keypoints indicate similarity between twoimages. The algorithm can be summarized as follows. Candidatekeypoints on the image are first detected by checking the scalespace extrema obtained from the difference of Gaussian images.After eliminating some of these candidate keypoints (suchas those aligned along the edges), the dominant orientationis selected for each keypoint by computing the weightedaverage of the gradient magnitudes of 4 × 4 neighboringpixels. Then, histograms of gradient orientations are calculatedat each keypoint, relative to the dominant orientation, toprovide rotational invariance. The resulting 128 histogramvalues consisting of 8-bin histograms, for a total of 4 × 4neighboring pixels, constitute the SIFT descriptors. The numberof matching keypoints, as measured by the similarity of theirdescriptors, is used as a measure of similarity of two images.A keypoint obtained in an image is generally matched tomany keypoints in the second image; to eliminate the spuriousmatches, the algorithm checks to see if the match is significant.The significance is measured by considering the ratio of thematch scores of the first and second best matching keypoints. Ifthis ratio is more than the prefixed ratio threshold, the keypointis discarded.
The SIFT features of segmented plant images converted tograyscale are extracted by the public domain SIFT algorithmof David Lowe [2]. The average number of matching keypointsbetween two images is around 20 in our problem, obtained usinga distance ratio parameter of 0.7. Two plant images and thematched keypoints are shown in Fig. 3.
The SIFT algorithm is not as successful in the plant retrievalproblem as it is in some other domains. For this reason and alsobecause we consider the outline of a plant image as an importantcharacteristic, we propose some new features extracted from theoverall plant contour. These global shape features are evaluatedseparately and also in addition to the SIFT features.
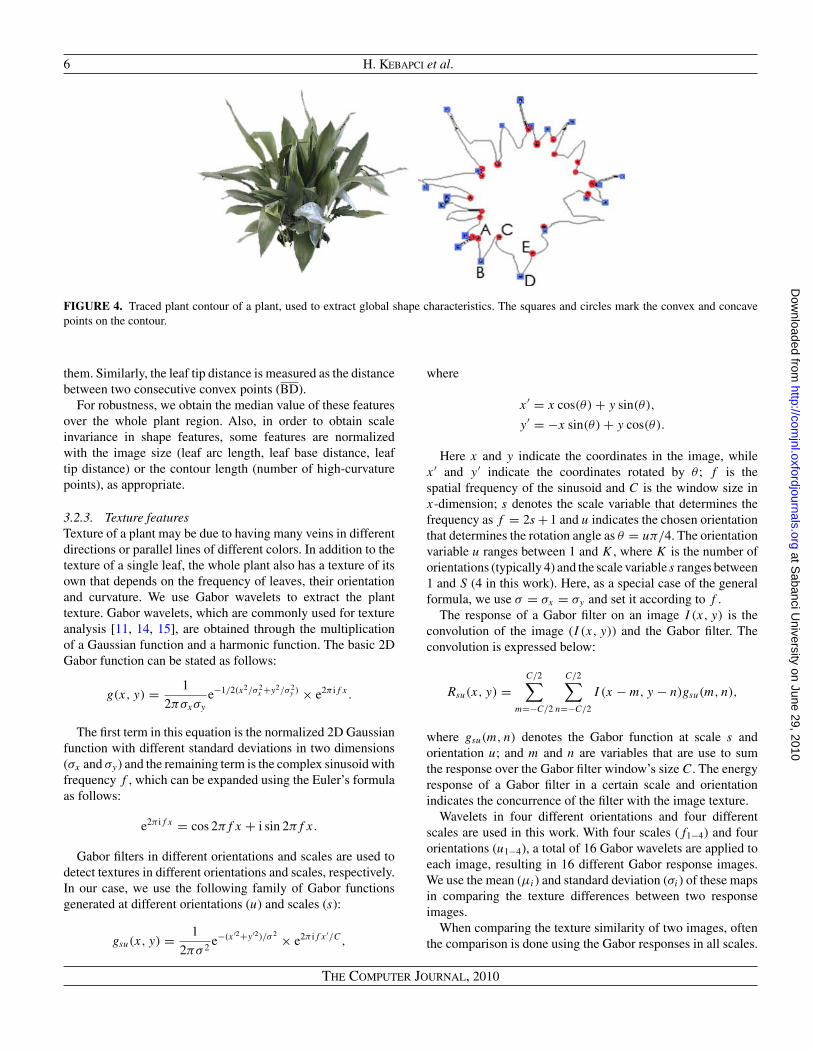
In order to extract the global shape features, first the contourof the plant is extracted by tracing the segmented plant image.The contour is then represented as a chain code, which is acommon representation of contour as a series of enumerateddirection codes ([7, 43]). Next, high curvature points on thecontour are extracted by analyzing direction changes in thechain code. These points are labeled as convex or concavedepending on their position and direction (or curvature of thecontour). Figure 4 shows the contour for a given segmented plantimage, along with the high-curvature points, labeled accordingto their type. Finally, the following six features are extracted,using the extracted contour and the labeled high-curvaturepoints of the contour:
(i) Number of Concave Points (e.g. A, C, E)(ii) Number of Convex Points (e.g. B, D)
(iii) Leaf Base Distance (AC)(iv) Leaf Tip Distance (BD)(v) Leaf Arc Length (ABC)
(vi) Normalized Leaf Arc Length (nABC = ABC/AC)
The leaf arc length is measured as the arc distance betweentwo consecutive concave points (ABC), while the leaf basedistance (AC) is measured as the straight line distance between
FIGURE 3. Matching SIFT keypoints between two plant images. Thelines connect the matching keypoints.
The Computer Journal, 2010
at Sabanci U
niversity on June 29, 2010 http://com
jnl.oxfordjournals.orgD
ownloaded from
6 H. Kebapci et al.
FIGURE 4. Traced plant contour of a plant, used to extract global shape characteristics. The squares and circles mark the convex and concavepoints on the contour.
them. Similarly, the leaf tip distance is measured as the distancebetween two consecutive convex points (BD).
For robustness, we obtain the median value of these featuresover the whole plant region. Also, in order to obtain scaleinvariance in shape features, some features are normalizedwith the image size (leaf arc length, leaf base distance, leaftip distance) or the contour length (number of high-curvaturepoints), as appropriate.
3.2.3. Texture featuresTexture of a plant may be due to having many veins in differentdirections or parallel lines of different colors. In addition to thetexture of a single leaf, the whole plant also has a texture of itsown that depends on the frequency of leaves, their orientationand curvature. We use Gabor wavelets to extract the planttexture. Gabor wavelets, which are commonly used for textureanalysis [11, 14, 15], are obtained through the multiplicationof a Gaussian function and a harmonic function. The basic 2DGabor function can be stated as follows:
g(x, y) = 1
2πσxσy
e−1/2(x2/σ 2x +y2/σ 2
y ) × e2π if x.
The first term in this equation is the normalized 2D Gaussianfunction with different standard deviations in two dimensions(σx and σy) and the remaining term is the complex sinusoid withfrequency f , which can be expanded using the Euler’s formulaas follows:
e2π if x = cos 2πf x + i sin 2πf x.
Gabor filters in different orientations and scales are used todetect textures in different orientations and scales, respectively.In our case, we use the following family of Gabor functionsgenerated at different orientations (u) and scales (s):
gsu(x, y) = 1
2πσ 2e−(x′2+y′2)/σ 2 × e2π if x′/C,
where
x ′ = x cos(θ) + y sin(θ),
y ′ = −x sin(θ) + y cos(θ).
Here x and y indicate the coordinates in the image, whilex ′ and y ′ indicate the coordinates rotated by θ ; f is thespatial frequency of the sinusoid and C is the window size inx-dimension; s denotes the scale variable that determines thefrequency as f = 2s + 1 and u indicates the chosen orientationthat determines the rotation angle as θ = uπ/4. The orientationvariable u ranges between 1 and K , where K is the number oforientations (typically 4) and the scale variable s ranges between1 and S (4 in this work). Here, as a special case of the generalformula, we use σ = σx = σy and set it according to f .
The response of a Gabor filter on an image I (x, y) is theconvolution of the image (I (x, y)) and the Gabor filter. Theconvolution is expressed below:
Rsu(x, y) =C/2∑
m=−C/2
C/2∑
n=−C/2
I (x − m, y − n)gsu(m, n),
where gsu(m, n) denotes the Gabor function at scale s andorientation u; and m and n are variables that are use to sumthe response over the Gabor filter window’s size C. The energyresponse of a Gabor filter in a certain scale and orientationindicates the concurrence of the filter with the image texture.
Wavelets in four different orientations and four differentscales are used in this work. With four scales (f1−4) and fourorientations (u1−4), a total of 16 Gabor wavelets are applied toeach image, resulting in 16 different Gabor response images.We use the mean (μi) and standard deviation (σi) of these mapsin comparing the texture differences between two responseimages.
When comparing the texture similarity of two images, oftenthe comparison is done using the Gabor responses in all scales.
The Computer Journal, 2010
at Sabanci U
niversity on June 29, 2010 http://com
jnl.oxfordjournals.orgD
ownloaded from
Plant Image Retrieval Using Color, Shape and Texture Features 7
We call this the default texture matching method. An alternativeis to do the comparison only in the most dominant scale for eachimage, with the intention of ignoring scale differences acrossimages of the same plant. We call this the max-scale texturematching method. Finally, we introduced a new, third approachwhich is called patch-based, to provide rotational invariance ona leaf level and scale invariance, as explained below.
Patch-based texture extraction When a uniformly texturedobject (e.g. straw or fabric) is rotated, its Gabor response mapsin different orientations on the same scale are circularly shifted.For instance, when an object with a dominant texture alongthe X-axis (0◦) is rotated 45◦, the response of the rotatedimage is dominant on the 45◦ Gabor response. Hence, if werepresent the feature vector starting with the angle with themaximum response and in increasing angular order, we canmatch the corresponding maps to obtain rotation invariance. Inthis example, the initial texture feature vector
{(μ0, σ0), (μ45, σ45), (μ90, σ90), (μ135, σ135)}would be matched to the circularly shifted feature vector of therotated image
{(μ45, σ45), (μ90, σ90), (μ135, σ135), (μ0, σ0)}.The rotation invariance problem is more complex in plant
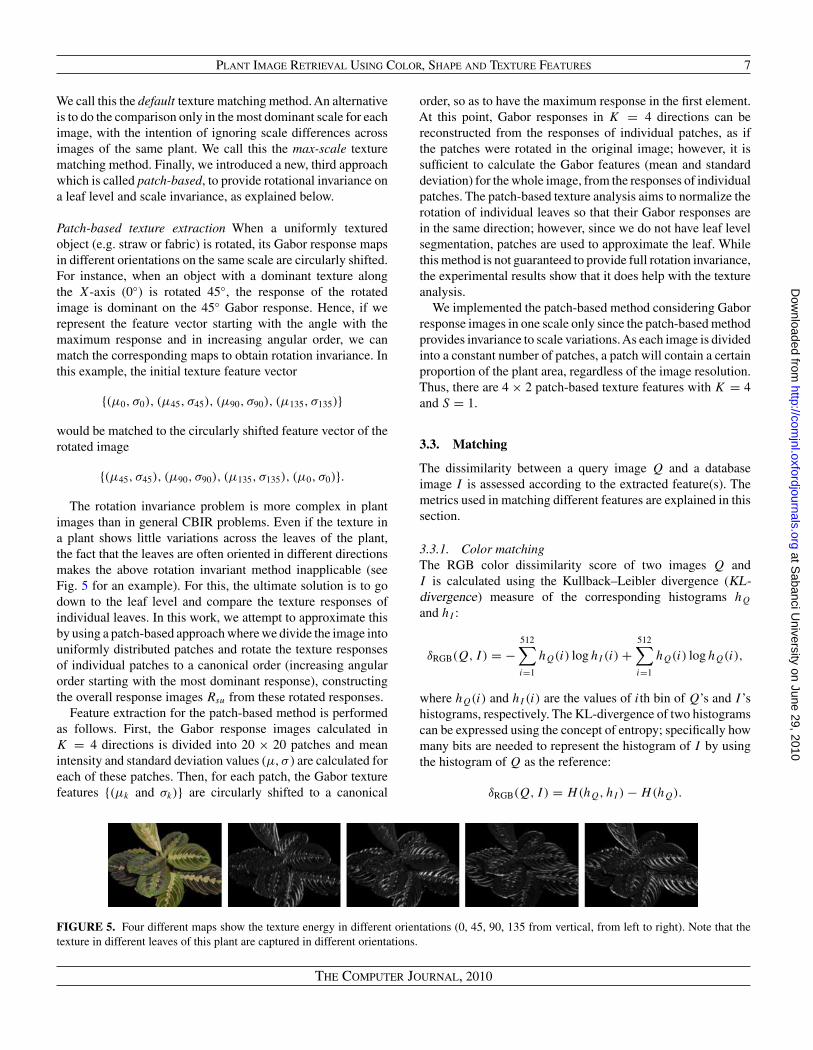
images than in general CBIR problems. Even if the texture ina plant shows little variations across the leaves of the plant,the fact that the leaves are often oriented in different directionsmakes the above rotation invariant method inapplicable (seeFig. 5 for an example). For this, the ultimate solution is to godown to the leaf level and compare the texture responses ofindividual leaves. In this work, we attempt to approximate thisby using a patch-based approach where we divide the image intouniformly distributed patches and rotate the texture responsesof individual patches to a canonical order (increasing angularorder starting with the most dominant response), constructingthe overall response images Rsu from these rotated responses.
Feature extraction for the patch-based method is performedas follows. First, the Gabor response images calculated inK = 4 directions is divided into 20 × 20 patches and meanintensity and standard deviation values (μ, σ ) are calculated foreach of these patches. Then, for each patch, the Gabor texturefeatures {(μk and σk)} are circularly shifted to a canonical
order, so as to have the maximum response in the first element.At this point, Gabor responses in K = 4 directions can bereconstructed from the responses of individual patches, as ifthe patches were rotated in the original image; however, it issufficient to calculate the Gabor features (mean and standarddeviation) for the whole image, from the responses of individualpatches. The patch-based texture analysis aims to normalize therotation of individual leaves so that their Gabor responses arein the same direction; however, since we do not have leaf levelsegmentation, patches are used to approximate the leaf. Whilethis method is not guaranteed to provide full rotation invariance,the experimental results show that it does help with the textureanalysis.
We implemented the patch-based method considering Gaborresponse images in one scale only since the patch-based methodprovides invariance to scale variations.As each image is dividedinto a constant number of patches, a patch will contain a certainproportion of the plant area, regardless of the image resolution.Thus, there are 4 × 2 patch-based texture features with K = 4and S = 1.
3.3. Matching
The dissimilarity between a query image Q and a databaseimage I is assessed according to the extracted feature(s). Themetrics used in matching different features are explained in thissection.
3.3.1. Color matchingThe RGB color dissimilarity score of two images Q andI is calculated using the Kullback–Leibler divergence (KL-divergence) measure of the corresponding histograms hQ
and hI :
δRGB(Q, I) = −512∑
i=1
hQ(i) log hI (i) +512∑
i=1
hQ(i) log hQ(i),
where hQ(i) and hI (i) are the values of ith bin of Q’s and I ’shistograms, respectively. The KL-divergence of two histogramscan be expressed using the concept of entropy; specifically howmany bits are needed to represent the histogram of I by usingthe histogram of Q as the reference:
δRGB(Q, I) = H(hQ, hI ) − H(hQ).
FIGURE 5. Four different maps show the texture energy in different orientations (0, 45, 90, 135 from vertical, from left to right). Note that thetexture in different leaves of this plant are captured in different orientations.
The Computer Journal, 2010
at Sabanci U
niversity on June 29, 2010 http://com
jnl.oxfordjournals.orgD
ownloaded from

8 H. Kebapci et al.
Here H(hQ, hI ) is called cross entropy of hQ and hI , whileH(hQ) is the entropy of Q’s histogram.
The other color features, namely nRGB and hue histogramsand the HSI-based color co-occurrence matrix are matchedsimilarly. In those cases, the summation is done over 256,10/30/90 and 900 (30 × 30) elements, respectively. Prior to thematching of the hue histograms, we smooth the histograms so asto obtain some robustness against quantization problems. This isdone by taking weighted averages of the consecutive bin valuesand brings a very small improvement to the performance. For thecolor co-occurrence matrix, which is basically a 2-dimensionalhistogram, we again used the KL-divergence, with or withoutconsidering the diagonal elements, as explained in Section 3.2.1.
3.3.2. Shape matchingWhen using SIFT features, the similarity of two images ismeasured by the number of matching SIFT keypoints [2]. Weuse the following normalized SIFT dissimilarity score, for twoimages Q and I :
δSIFT(Q, I) = 1 − α(log10(m + 1)),
where m is the number of matching SIFT keypoints, α isa normalization constant with a current value of 0.25 and alogarithmic scale is used since the number of matching pointsrange between 0 and possibly several hundreds. Note that usingthe unnormalized number of matching SIFT points is sufficientfor retrieval, if SIFT features are used alone. Normalizationis necessary when combining the SIFT dissimilarity with thedissimilarity scores obtained from the other features.
Contour-based shape dissimilarity is measured using the L1-distance. For instance, the number of high-curvature (convexand concave) points is matched as follows:
δHighCurv.(Q, I) = ∣∣concQ − concI
∣∣ + ∣∣convQ − convI
∣∣ .
When using multiple shape features, the shape dissimilarityof two images, Q and I , is calculated as the average of theindividual shape feature dissimilarities.
3.3.3. Texture matchingThe default texture dissimilarity of two images is calculated bytaking the dissimilarity of each of the s × u Gabor responsefeatures as displayed in the following two equations. Heres denotes the scale, u denotes the orientation and δsu(Q, I)
denotes the dissimilarity in the given scale and orientation (s, u):
δGabor(Q, I) =∑
s=1,...,4
∑
u=1,...,4
δsu(Q, I), (1)
where
δ2su(Q, I) = w1(μsu(Q) − μsu(I ))2 + w2(σsu(Q) − σsu(I ))2.
Here w1 and w2 are weights of mean and standard deviationdistance squares. We tested a few different values for wi , giving
more weight to the distance of the means (e.g. w1 = 0.8,w2 = 0.2); however, the overall results did not improve. Asa result, we use the weights as w1 = 0.5, w2 = 0.5.
We also compare texture features of two images using twoother approaches. One is called the max-scale method, wherethe texture of two images is matched in the dominant scale, asfollows:
δmaxGabor(Q, I) = maxs=1,...,4
∑
u=1,...,4
δsu(Q, I).
In the newly proposed patch-based method, we obtain Gaborresponse images by rotating patches of the image (see Section3.2.3). While the texture feature computation using the patch-based method is different, the dissimilarity score is computedsimilar to the default method. The only difference is thatpatch-based textures are measured in only one scale; hence,Equation (1) is computed with s = 1.
In addition to these similarity measures involving singlefeatures, we also experimented with combined methods, asdone in various other studies [44, 45]. In this case, the overalldissimilarity score is the average of the individual scores.The outcome of various feature combinations are presented inSection 5.
4. DATABASE
Currently, we have 380 plant images from 78 different planttypes in our database, collected mainly from the Web, but alsoby taking pictures of available house plants. The number ofimages for each plant type varies from type to type, rangingfrom 3 to 14 images, while the average number of images perplant is about 5. All the original images in the database aresemi-automatically segmented to remove the background. Thecreated house plant image database is publicly available.1 Thedata collection is ongoing, with the aim of extending the varietyto a minimum of 100 different plants as part of future work.
In the database the plant images are named following astandard notation: a number prefix indicating the plant type,its Latin name, a sample number and a postfix of “segm” toindicate the images that are segmented. A general gallery viewof our implemented system is depicted in Fig. 6, displayingsome of the images in the database after a particular query.
Some of the images in this database are not very suitablefor shape analysis: close-up shots of the plant that do not showthe outer contour and images with highly textured backgroundsthat are badly segmented, resulting in a jagged contour. For thatreason, we identified a clean subset of the database, consistingof 132 images of 32 different plants, in which each plant typehas at least three images with smooth outer contours. This subsetis used in evaluating shape related results.
Besides the plant image database collection, we use theMySQL database to index the images. The information of each
1http : //people.sabanciuniv.edu/berrin/SUP lants/
The Computer Journal, 2010
at Sabanci U
niversity on June 29, 2010 http://com
jnl.oxfordjournals.orgD
ownloaded from

Plant Image Retrieval Using Color, Shape and Texture Features 9
FIGURE 6. The GUI of the implemented system. The image in the top left corner is the original query, overlaid with blue and yellow regionsindicating seed region selections. The lower left image is the segmented query image used for feature extraction. The images on the right are thetop-15 similar plant images among the whole plant image database (ordered left-to-right and then top-to-bottom).
plant is stored in a table including filename, width, height, RGBhistogram with 512 bins, Hue histogram with 90 bins, color co-occurrence matrix of 30×30 bins, 32 Gabor features consistingof 16μ and 16σ values and 6 × 3 global shape features (in threescales). Since the SIFT computation is time consuming andproduces a variable number of keypoints, for each image in thedatabase, we store the precomputed SIFT similarity scores toeach of the n − 1 images, where n is the number of images inthe database.
During indexing, the features of each image are extractedand inserted into the database. When a query image is uploadedto the system, the features extracted from the query image arecompared with the stored feature values of the database images.
5. EXPERIMENTAL RESULTS
The performance of the system is evaluated by running tests overour plant image database. Each test is done as a one-versus-the-rest test, by querying each image in the database against theremainder. Unless otherwise indicated, the full database is usedin the tests. The clean database is used in shape related testssince certain shape features require a clear outer boundary ofplants.
The main metric used in assessing performance is the top-Nretrieval rates indicating whether the correct plant type is among
the top N returned images. We used top-10 and top-15 retrievalrates, assuming that a user can easily and quickly identifythe correct image among 10–15 returned images. In addition,we present the average minimum rank value which indicatesthe rank of the best matching correct plant, averaged over allqueries.
All three feature classes (color, shape and texture) are testedwith all possible parameters and retrieval methods that weproposed. In addition to these individual tests, several combinedmethods are tested as well. In summary, test results showthat the most useful individual feature class is color, followedby texture and global shape, and that the performance of thesystem is increased when combining several features. Sincethe performance of the proposed method is still relativelylow, we also include the performance of a dummy engine,which randomly selects the retrieved images, in the overallresult tables. The following sections present test results withcomments on the performance of the retrieval methods.
5.1. Results using color features
Results obtained using various color features are given inTable 1. Among distinct color feature analysis approaches, thenRGB color histogram provides the best top-10 and top-15 ratesof 41 and 48%, respectively, while the second best performingcolor feature is the hue-based, modified color co-occurrence
The Computer Journal, 2010
at Sabanci U
niversity on June 29, 2010 http://com
jnl.oxfordjournals.orgD
ownloaded from

10 H. Kebapci et al.
TABLE 1. Color similarity results (full database).
Method Top-10% Top-15% AvgMinRank
RGB hist. (256-bin) 0.25 0.32 71.9nRGB hist.(512-bin) 0.41 0.48 35.9Hue hist. (10-bin) 0.37 0.46 39.7Hue hist. (30-bin) 0.36 0.44 38.9Hue hist. (90-bin) 0.36 0.44 39.4Color co-occ. 0.39 0.44 39.4Color co-occ. (off-diag) 0.40 0.48 37.1Random 0.15 0.23 74.0
matrix. The higher results obtained by nRGB and hue-basedhistograms, in comparison with RGB, may be attributed tothe illumination resistance of nRGB and HSI color spaces.The modified color co-occurrence method, which ignoresdiagonal entries in the co-occurrence matrix, outperforms theconventional color co-occurrence method (48 versus 44% top-15 accuracy). On the other hand, the effect of smoothing thehistograms were insignificant.
5.2. Results using shape features
Results obtained according to various global shape features aregiven in Table 2. The number of high-curvature points featureis more effective than other features with 28% retrieval rate attop-15. Combining all of the global shape features achieves a26% top-10 and 31% top-15 rate.
To evaluate the full potential of the global shape descriptors,shape methods are also tested on the clean database of 132images from 32 plant types. The results of this test, shown inTable 3, indicate that the best performing individual feature isthe number of high-curvature points, as was also the case withthe full database. Again as with the full database, combining allshape features provided the best performance, with 48 and 61%of top-10 and top-15 accuracies, respectively.
The results of the system using only SIFT features aredisplayed in Table 4, along with results of the combination ofSIFT and global shape features. As can be seen in this table, the
TABLE 2. Global shape similarity results (full database).
Feature Top-10% Top-15% AvgMinRank
No. of high curv. pts 0.22 0.28 75.9Leaf arc length 0.15 0.21 86.9Leaf base dist. 0.18 0.22 86.7Leaf tip dist. 0.18 0.22 86.9Norm. leaf arc length 0.15 0.21 88.1All features 0.26 0.31 79.9Random 0.15 0.23 74.0
TABLE 3. Global shape similarity results (clean database).
Feature Top-10% Top-15% AvgMinRank
No. of high curv. pts 0.44 0.56 25.1Leaf base dist. 0.45 0.55 25.2Leaf tip dist. 0.43 0.55 28.6Leaf arc length 0.34 0.50 28.1Norm. leaf arc length 0.30 0.42 33.1All features 0.48 0.61 23.4Random 0.27 0.39 45.7
TABLE 4. SIFT + Global Shape Similarity Results.
Method Top-10% Top-15% AvgMinRank
SIFT (full DB) 0.16 0.22 72.0SIFT (clean DB) 0.29 0.38 27.9SIFT + global 0.44 0.56 22.0Random (full) 0.15 0.23 74.0Random (Clean) 0.27 0.39 45.7
SIFT method by itself is not successful at all; in fact they areroughly the same as those of the dummy retrieval engine. In theclean database where images all have cleaner outer contours, theresults are better (29 and 38% of top-10 and top-15 accuracies,respectively), but they are still very low and significantly lowercompared with the results obtained using global shape features.
The main problem using the SIFT features is the lack ofstrongly defined keypoints on grayscale images of plants, sincesome plants only show a smooth variation in color. Using colorSIFT features may address this problem to some extent. Partof the lower accuracy may also be attributed to the following.When using SIFT features, a Hough transform may be used infinding the global affine transformation that aligns two images[1]; this can be used to improve the similarity assessment,by ignoring erroneously matching SIFT features that are notin agreement with the global transformation. However, in ourproblem, an affine transformation does not model the mappingbetween snapshots of different instances of a given plant.The number, orientations and size of the leaves vary due towithin-class variations of a given plant type. In addition, thelighting conditions in the environment vary from one image toanother. Therefore, in the plant matching problem, the SIFTfeature matching algorithm performs below expectations andthe retrieval performance is degraded.
Using the combination of SIFT and global shape featuresdoes not improve the results of global shape feature resultseither. In fact, the top-10 and the top-15 rates drop (from48 to 44% and 61 to 58%, respectively), while the averageminimum rank improves by a small amount. We believe that thisis due to the difficulty in setting the relative weights of the two
The Computer Journal, 2010
at Sabanci U
niversity on June 29, 2010 http://com
jnl.oxfordjournals.orgD
ownloaded from
Plant Image Retrieval Using Color, Shape and Texture Features 11
dissimilarity scores (SIFT and global shape). The normalizationof SIFT-based dissimilarity is not straightforward, because thenumber of matching keypoints shows a very wide range froma few points to several hundreds for matching images in thedatabase, while the typical number ranges around 20. On theother hand, using SIFT in combination with all other features
TABLE 5. Texture analysis results (full database).
Method Top-10% Top-15% AvgMinRank
Default 0.27 0.36 53.2Max-scale 0.19 0.28 61.8Patch-based 0.27 0.36 50.0Random 0.15 0.23 74.0
(global shape, color, and texture) improve the accuracy, asshown in Table 7. Further research is needed to find the mosteffective normalization and weight parameters, when usingSIFT features.
5.3. Results using texture features
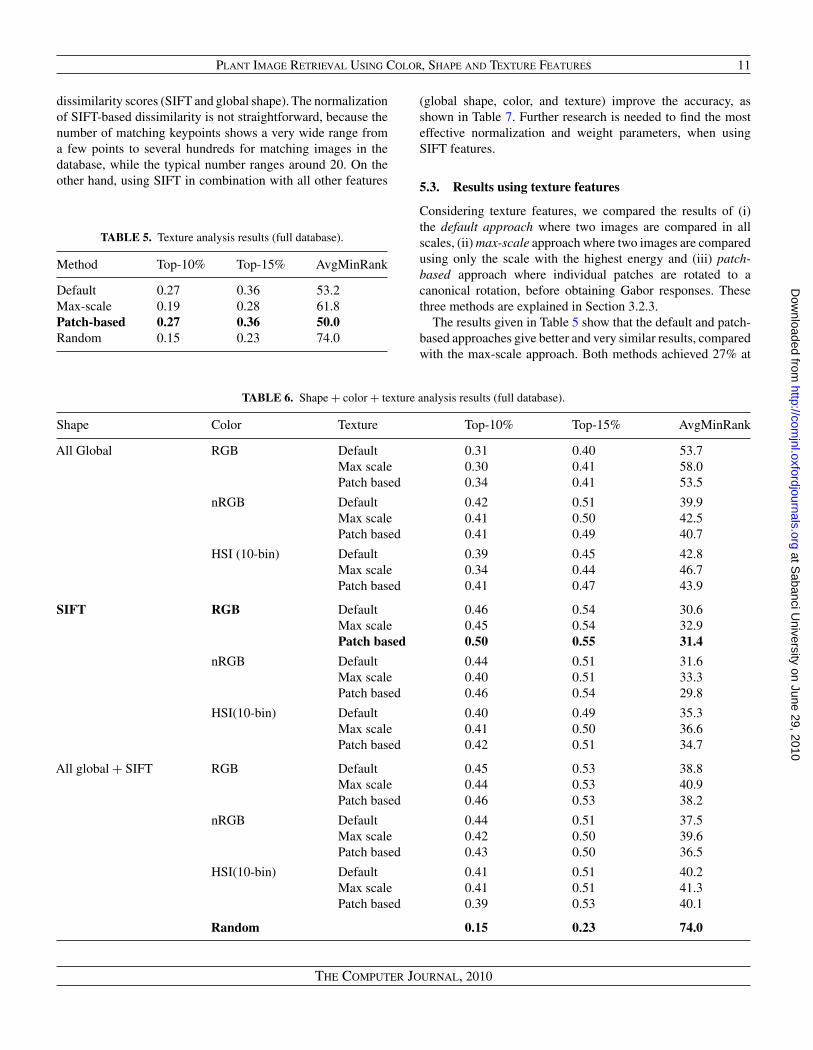
Considering texture features, we compared the results of (i)the default approach where two images are compared in allscales, (ii) max-scale approach where two images are comparedusing only the scale with the highest energy and (iii) patch-based approach where individual patches are rotated to acanonical rotation, before obtaining Gabor responses. Thesethree methods are explained in Section 3.2.3.
The results given in Table 5 show that the default and patch-based approaches give better and very similar results, comparedwith the max-scale approach. Both methods achieved 27% at
TABLE 6. Shape + color + texture analysis results (full database).
Shape Color Texture Top-10% Top-15% AvgMinRank
All Global RGB Default 0.31 0.40 53.7Max scale 0.30 0.41 58.0Patch based 0.34 0.41 53.5
nRGB Default 0.42 0.51 39.9Max scale 0.41 0.50 42.5Patch based 0.41 0.49 40.7
HSI (10-bin) Default 0.39 0.45 42.8Max scale 0.34 0.44 46.7Patch based 0.41 0.47 43.9
SIFT RGB Default 0.46 0.54 30.6Max scale 0.45 0.54 32.9Patch based 0.50 0.55 31.4
nRGB Default 0.44 0.51 31.6Max scale 0.40 0.51 33.3Patch based 0.46 0.54 29.8
HSI(10-bin) Default 0.40 0.49 35.3Max scale 0.41 0.50 36.6Patch based 0.42 0.51 34.7
All global + SIFT RGB Default 0.45 0.53 38.8Max scale 0.44 0.53 40.9Patch based 0.46 0.53 38.2
nRGB Default 0.44 0.51 37.5Max scale 0.42 0.50 39.6Patch based 0.43 0.50 36.5
HSI(10-bin) Default 0.41 0.51 40.2Max scale 0.41 0.51 41.3Patch based 0.39 0.53 40.1
Random 0.15 0.23 74.0
The Computer Journal, 2010
at Sabanci U
niversity on June 29, 2010 http://com
jnl.oxfordjournals.orgD
ownloaded from

12 H. Kebapci et al.
top-10 and 36% at top-15 retrieval accuracy, however, the patch-based approach retrieves the correct plants in a slightly higherrank (50 rather than 53.2). When used in combination with otherfeatures, the patch-based approach was found to be the mostuseful texture analysis method, as shown in Tables 6 and 7.
5.4. Results using color, texture, shape combinations
In order to see the full performance of the proposed system,we combined features from all three classes: color, shapeand texture. Combined methods taking into account color,texture and shape-based features obtained improved results,as expected. The results including all three feature classes areshown in Table 6 for the full database. In this table, we alsoinclude the performance of a dummy (random) retrieval engine,in order to show the improvement of the proposed system overrandom retrieval. The most successful approach is to combine
the SIFT + RGB + Patch-Based features, resulting in 50 and55% as the top-10 and top-15 accuracy rates, respectively.
The combined results given in Table 6 do now show muchimprovements over the performance of individual features, butthis is mostly due to the fact that the full database is not suitableto be used with the global shape features. In order to evaluatethe newly proposed shape features, and their combination withSIFT features, new combined tests are run on the clean databaseconsisting of well-segmented images. The results of these tests,given in Table 7, are the highest accuracy rates among all resultsand they show a performance gain obtained when using all threegroups of features. Furthermore, they also show that the combi-nation of SIFT and global shape features improves the overallsystem performance, supporting the claim of their complemen-tarity. While almost each color, shape and texture feature com-binations are tested, only outstanding methods are given here.With respect to the top-15 accuracy rates, the best-performing
TABLE 7. Shape + color + texture analysis results (clean database).
Shape Color Texture Top-10% Top-15% AvgMinRank
All global RGB Default 0.52 0.61 21.3Max scale 0.51 0.59 22.4Patch based 0.53 0.61 20.7
nRGB Default 0.63 0.69 18.8Max scale 0.60 0.68 19.6Patch based 0.63 0.71 18.6
HSI(10-bin) Default 0.54 0.63 20.7Max scale 0.54 0.63 21.2Patch based 0.59 0.71 18.8
SIFT RGB Default 0.50 0.57 20.1Max scale 0.44 0.55 21.2Patch based 0.50 0.60 19.3
nRGB Default 0.53 0.66 18.2Max scale 0.54 0.62 19.0Patch based 0.53 0.66 17.7
HSI(10-bin) Default 0.44 0.59 20.2Max scale 0.47 0.57 21.1Patch based 0.50 0.57 18.9
All global + SIFT RGB Default 0.51 0.62 19.5Max scale 0.54 0.63 20.9Patch based 0.60 0.66 19.7
nRGB Default 0.64 0.72 18.0Max scale 0.61 0.69 19.1Patch based 0.60 0.73 18.6
HSI(10-bin) Default 0.59 0.68 19.7Max scale 0.57 0.66 19.9Patch based 0.58 0.68 18.7
Random 0.27 0.39 45.7
The Computer Journal, 2010
at Sabanci U
niversity on June 29, 2010 http://com
jnl.oxfordjournals.orgD
ownloaded from

Plant Image Retrieval Using Color, Shape and Texture Features 13
method is the Global-shape + SIFT + nRGB + Patch-basedmethod, with 63% top-10 and 71% top-15 rates.
The results of CBIR studies are normally evaluated basedon precision and recall rates. Precision is defined to be theratio of the relevant images in all of the returned images.Recall is defined to be the ratio of retrieved relevant imagesto all relevant images. These metrics are not very suitablein identification problems where higher precision values aredesired, but sufficient to have only one relevant image among asmall number of returned images. For identification problems,top-N results are often reported. Our problem is mostlyan identification problem, considering that we are primarilyinterested in the correct match. However, retrieving similarplants are also useful, for instance, to find different varietiesof a particular plant, or similar plants. Therefore, the problemcan be seen as a retrieval problem, as well. We report top-Nrates since assessing how similar or related other plant varietiesare is out of the scope of this paper.
To get a better understanding of the system performance, weplot the probability of having a relevant result in the top-Nresults for changing N values, in Figs 7 and 8. In Fig. 7, theaccuracy is plotted for a subset of the individual color, shapeand texture methods, using the full database. Here, we observethat color methods are most successful (nRGB, hue and colorco-occurrence), followed by patch-based Gabor texture, andthen the global shape features. The patch-based approach issignificantly more accurate than the default texture method ,especially for larger N .
In Fig. 8, we plot the probability of having a relevant result inthe top-N for changing N values, for outstanding individual andcombined methods, using the clean database. As can be seenin this figure, the accuracy curves of two combined methods(nRGB + patch + shape and nRGB + default + shape) areindistinguishable and outperform the others.
0 20 40 60 80 1000
50
100
150
200
250
300
350Top−N Accuracy
nRGBHuePatch−basedColor co−oc.Default textureGlobal Shape (full)
FIGURE 7. Accuracies of individual color, shape (global) and texturemethods on the full database.
0 10 20 30 40 500
20
40
60
80
100
120
140Top−N Accuracy
nRGB+Patch+Global ShapenRGB+Default+Global ShapeRGB+Patch+Global ShapenRGBPatch−basedGlobal Shape (full)
FIGURE 8. Accuracies of outstanding color, shape (global), textureand combined methods on the clean database.
The experiments are performed on a 1.60 GHz CeleronM CPU with 2 GB RAM. We developed the application onMicrosoft Visual Studio 2005 and used the Windows Vistaplatform. Retrieval time for a segmented query image (witha medium size of 600 × 800) is 125 ms on average: 16 Gaborresponse images of the segmented image are produced in about10–15 and the remaining feature extraction operations take 10 s.Segmentation is the longest process with an average of 90, 40–45 s of which is spent for the seed region selection.
5.5. Challenges
The primary challenge we have encountered in color analysisis caused indirectly by bad segmentation results. When thebackground region is not cleaned up smoothly, these regionseffect and bias the generated color histograms. Additionallyusing hue histograms, there is the well-known problem ofundefined saturation and hue values. Such values are obtained intwo situations: (i) singularity problems cause zero saturation andundefined hue values; (ii) very dark and very bright points havesaturation values of 0 and 1, respectively, while their hue valuesvary widely. To avoid undefined hue and saturation values, thesystem may be enhanced with additional controls on singularitypoints, and very dark or bright points. For instance RGB, orintensity values may be used as a color feature in such casesas proposed in [46]. In fact, we implemented a modificationto ignore pixels with undefined or problematic values, but thisattempt was not very successful, mainly due to ignoring whiteareas inside the plants.
The accuracy of image segmentation is the most importantfactor directly affecting the success of shape-based features, aswell. Bad plant contours resulting from inaccurate segmentation(often due to textured background) is a common problem thatleads to faulty feature extraction. Figure 9 depicts a typical case
The Computer Journal, 2010
at Sabanci U
niversity on June 29, 2010 http://com
jnl.oxfordjournals.orgD
ownloaded from

14 H. Kebapci et al.
FIGURE 9. Example for a bad (jagged) plant contour caused by inadequate segmentation. Left: Segmented image, Middle: Segmentation map tosee the segmentation faults, Right: Traced contour of the image with spurious high-curvature points.
where the extracted jagged contour makes it look like the planthas very small leaves, while, in fact, the plant has a few longand smooth leaves.
The main challenge in texture analysis is due to the variancein image size and resolution, which cause the texture toappear in different scales using Gabor filters. Our textureanalysis methods propose two alternative solutions: max-scaleand patch-based methods which aim to overcome orientationand scale variance problems. In particular, in the patch-based approach, images are partitioned into fixed numberof patches. This approach overcomes the image resolutionvariance problem by using a fixed number of patches per image,effectively dealing with the resolution problem. Moreover, thismethod partially overcomes the rotation variance problem ofleaves, by rotating all patches to a canonical orientation.
Note that while we assume that the plant images clearlyindicate the general structure or the outline of the plant, notall the pictures in the database are of this type. If a constraintis defined to regulate the plant size in the image (e.g. the imageshows only a minimal amount of background to clearly showthe outer contour of the plant), scale problems will only dependon image resolution and can be handled more easily.
6. SUMMARY AND CONCLUSION
We present a plant image retrieval system, combiningvarious CBIR approaches with a segmentation preprocessingstep. Extracting plant regions from images by the MFMCsegmentation technique has given us an opportunity to focussolely on the plant, which increased consistency of the retrievedglobal features. Furthermore, combining different color, shapeand texture features extracted from the images enhance theaccuracy of the system.
Common techniques are used in color and texture featureextraction steps: color histograms, color co-occurrence matricesand Gabor filters. However, with a modification on Gabortexture analysis, we were able to focus on the local featuresof the approximated leaf regions obtained by our patch-basedapproach. The novelty of this technique is that rotating theapproximated leaf patches to a canonical direction providesthe effect of rotating the plant leaves to the same orientation.
The proposed patch-based approach appears as the best texturemethod in the overall results in Table 7. For shape-basedretrieval, we used SIFT features that capture local characteristicsof the plant, as well as newly proposed global shape descriptorsthat are based on the outer contour of the plant. Boththe modified Gabor texture method and new global shapedescriptors provided improvements over the existing methods.
While there is clearly room for improvement, the proposedapproach got promising results for the plant retrieval problem.Using color, shape and texture features in combinationhave improved the system performance. The highest top-15identification rate obtained on the clean database (73%) is acombined method of nRGB histogram, local and global shapefeatures and patch-based texture methods. Furthermore, we seethat the average rank of the top matching image is 18.6, whichalso looks promising.
7. DISCUSSION AND FUTURE WORK
While a direct comparison is not meaningful, the fact manyCBIR problems report precision values around 50–60% [19,20, 44, 47], can give an idea of the difficulty of the CBIRproblem. Shape-based retrieval in botanical collections [21],which is the closest study to our problem, reports precision ratesof 0.92 at top-5 and 0.88 at top-10 retrieval ranks. These resultsare obtained on the public Swedish tree leaves database, whichconsists of 1125 isolated leaves from 15 different Swedish treesspecies. In the current problem, on the one hand we have moreinformation (the whole plant image) which would help with theproblem. On the other hand, the problem is more difficult interms of the difficulty of extracting a single leaf from the fullimage.
Future studies will include expanding the database in orderto make it useful as a practical application; extending SIFTimplementation to color SIFT to improve its effectiveness;and evaluating new features such as spatial color histogramsto address the particular problem. How to combine differentfeatures is also an important problem that we plan to studyfurther.
The Computer Journal, 2010
at Sabanci U
niversity on June 29, 2010 http://com
jnl.oxfordjournals.orgD
ownloaded from

Plant Image Retrieval Using Color, Shape and Texture Features 15
8. FUNDING
The research was conducted at Sabanci University, Istanbul,Turkey.
REFERENCES
[1] Lowe, D.G. (1999) Object Recognition from Local Scale-Invariant Features. ICCV, pp. 1150–1157.
[2] Lowe, D.G. (2004) Distinctive image features from scale-invariant keypoints. Int. J. Comp. Vis., 60, 91–110.
[3] Eakins, J.P. (2002) Towards intelligent image retrieval. PatternRecognit., 35, 3–14.
[4] Venters, C.C. and Cooper, D.M. (2000) A Review of Content-Based Image Retrieval Systems. Technical Report, ManchesterVisualization Centre, Manchester Computing, University ofManchester, Manchester, UK.
[5] Smeulders, A.W.M., Worring, M., Santini, S., Gupta, A. and Jain,R. (2000) Content-based image retrieval at the end of the earlyyears. IEEE Trans. Pattern Anal. Mach. Intell., 22, 1349–1380.
[6] Tico, M., Haverinen, T. and Kuosmanen, P. (2000) A Methodof Color Histogram Creation for Image Retrieval. Proc. NordicSignal Processing Symp. (NORSIG’2000), Kolmarden, Sweden,June, pp. 157–160.
[7] Gonzalez, R.C. and Woods, R.E. (2001) Digital ImageProcessing. Addison-Wesley, Boston, MA, USA.
[8] El-ghazal, A., Basir, O.A. and Belkasim, S. (2007) Shape-based Image Retrieval Using Pair-wise Candidate Co-ranking.In Kamel, M.S. and Campilho, A.C. (eds), ICIAR, pp. 650–661.Lecture Notes in Computer Science, 4633. Springer.
[9] Park, J.S. and Kim, T.-Y. (2004) Shape-based Image RetrievalUsing Invariant Features. InAizawa, K., Nakamura,Y. and Satoh,S. (eds) Advances in Multimedia Information Processing—PCM2004, pp. 146–153. Lecture Notes in Computer Science. Springer,Berlin.
[10] Abbasi, S., Mokhtarian, F. and Kittler, J. (1999) Curvature scalespace image in shape similarity retrieval. Multimedia Syst., 7,467–476.
[11] Ma, W. and Manjunath, B. (1996) Texture Features and LearningSimilarity. Proc. Conf. Computer Vis. Pattern Recognition(CVPR), June, pp. 425–430.
[12] Han, J. and Ma, K.-K. (2007) Rotation-invariant and scale-invariant gabor features for texture image retrieval. Image Vis.Comput., 25, 1474–1481.
[13] Dengsheng Zhang, M.I., Aylwin, W. and Lu, G. (2000) ContentBased Image Retrieval Using Gabor Texture Features. Proc.1st IEEE Pacific Rim Conf. Multimedia (PCM’00), December,pp. 392–395.
[14] Manjunath, B. and Ma, W. (1996) Texture features for browsingand retrieval of image data. IEEE Trans. Pattern Anal. Mach.Intell., 18, 837–842.
[15] Liu, C. and Wechsler, H. (2001) A Gabor Feature Classifier forFace Recognition. ICCV, Vol. 2, pp. 270–275.
[16] Haralick, R.M. and Shapiro, L.G. (1992) Computer and RobotVision. Addison-Wesley, Boston, MA, USA.
[17] Flickner, M. et al. (1995) Query by image and video content: theQBIC system. IEEE Comput., 28, 23–32.
[18] Bach, J.R., Fuller, C., Gupta, A., Hampapur, A., Horowitz, B.,Humphrey, R., Jain, R.C. and Shu, C.F. (1996) Virage ImageSearch Engine: An Open Framework for Image Management. InSethi, I.K. and Jain, R.C. (eds), Storage and Retrieval for StillImage and Video Databases IV, pp. 76–87. SPIE.
[19] Lew, M.S., Sebe, N., Djeraba, C. and Jain, R. (2006) Content-based multimedia information retrieval: state of the art andchallenges. ACM Trans. Multimedia Comput. Commun. Appl.,2, 1–19.
[20] Veltkamp, R.C. and Tanase, M. (2000). Content-based imageretrieval systems: a survey.
[21] Yahiaoui, I., Hervé, N. and Boujemaa, N. (2006) Shape-BasedImage Retrieval in Botanical Collections. PCM, pp. 357–364.
[22] Wang, Z., Chi, Z. and Feng, D. (2003) Shape based leaf imageretrieval. IEE Proc.—Vis., Image and Signal Process., 150, 34–43.
[23] Wang, Z., Chi, Z., Feng, D. and Wang, Q. (2000) Leaf ImageRetrieval with Shape Features. VISUAL’00: Proc. 4th Int. Conf.Advances in Visual Information Systems, London, UK, pp. 477–487. Springer.
[24] Backes, A.R. and Bruno, O.M. (2010) Shape classification usingcomplex network and multi-scale fractal dimension. PatternRecognit. Lett., 31, 44–51.
[25] Bruno, O.M., Plotze, R.D.O., Falvo, M. and de Castro, M. (2008)Fractal dimension applied to plant identification. Inf. Sci., 178,2722–2733.
[26] Lin, F.-Y., Zheng, C.-H., Wang, X.-F. and Man, Q.-K. (2008)Multiple Classification of Plant Leaves Based on GaborTransform and LBP Operator. ICIC, Vol. 3, pp. 432–439.
[27] Man, Q.-K., Zheng, C.-H., Wang, X.-F. and Lin, F.-Y. (2008)Recognition of Plant Leaves Using Support Vector Machine.ICIC, Vol. 3, pp. 192–199.
[28] Woebbecke, D.M., Meyer, G.E., Bargen, K.V. and Mortensen,D.A. (1993) Plant Species Identification, Size, and EnumerationUsing Machine Vision Techniques on Near-Binary Images.Optics in Agriculture and Forestry, pp. 208–219. SPIE.
[29] Yonekawa, S., Sakai, N. and Kitani, O. (1996) Identification ofidealized leaf types using simple dimensionless shape factors byimage analysis. Trans. ASAE, 39, 1525–2533.
[30] Abbasi, S., Mokhtarian, F. and Kittler, J. (1997) ReliableClassification of Chrysanthemum Leaves Through CurvatureScale Space. SCALE-SPACE’97: Proc. 1st Int. Conf. Scale-SpaceTheory in Computer Vision, London, UK, pp. 284–295. Springer.
[31] Pérez, A.J., López, F., Benlloch, J.V. and Christensen, S. (2000)Colour and shape analysis techniques for weed detection in cerealfields. Comput. Electron. Agric., 25, 197–212.
[32] Jia, J. and Krutz, G. (1992) Location of the maize plant withmachine vision. J. Agric. Eng. Res., 52, 169–181.
[33] D.G. Sena Jr, Pinto, F.A.C., Queiroz, D.M. andViana, P.A. (2003)Fall armyworm damaged maize plant identification using digitalimages. Biosyst. Eng., 85, 449–454.
[34] Boykov, Y. and Kolmogorov, V. (2004) An experimentalcomparison of min-cut/max- flow algorithms for energyminimization in vision. IEEE Trans. Pattern Anal. Mach. Intell.,26, 1124–1137.
[35] Ford, L.R.F. and Fulkerson, D.R. (1956) Maximal flow througha network. Canad. J. Math., 8, 399–404.
The Computer Journal, 2010
at Sabanci U
niversity on June 29, 2010 http://com
jnl.oxfordjournals.orgD
ownloaded from
16 H. Kebapci et al.
[36] Rother, C., Kolmogorov, V. and Blake, A. (2004) “Grabcut”:interactive foreground extraction using iterated graph cuts. ACMTrans. Graph., 23, 309–314.
[37] Zarit, B., Super, B. and Quek, F. (1999) Comparison of FiveColor Models in Skin Pixel Classification. Proc. Int. Workshopon Recognition, Analysis, and Tracking of Faces and Gestures inReal-Time Systems, pp. 58–63.
[38] Sural, S., Qian, G. and Pramanik, S. (2002) Segmentation andHistogram Generation Using the HSV Color Space for ImageRetrieval. ICIP, Vol. 2, pp. II-589–II-592.
[39] Shim, S.-O. and Choi, T.-S. (2003) Image Indexing by ModifiedColor Co-occurrence Matrix. ICIP, September, Vol. 2, pp. III-493–III-496.
[40] Jain, A.K. and Vailaya, A. (1996) Image retrieval using color andshape. Pattern Recognit., 29, 1233–1244.
[41] Ledwich, L. and Williams, S. (2004) Reduced SIFT Featuresfor Image Retrieval and Indoor Localisation. Australian Conf.Robotics and Automation.
[42] Wang, J., Zha, H. and Cipolla, R. (2005) Combining InterestPoints and Edges for Content-Based Image Retrieval. IEEE Int.Conf. Image Processing, 2005. ICIP 2005, September, pp. 1256–1259.
[43] Šonka, M., Hlavác, V. and Boyle, R.D. (1993) Image Processing,Analysis and MachineVision (1st edn). Chapman & Hall, London,UK.
[44] Iqbal, Q. and Aggarwal, J.K. (2002) Combining Structure, Colorand Texture for Image Retrireval:A Performance Evaluation. 16thInt. Conf. Pattern Recognition (ICPR), August, pp. 438–443.
[45] Arevalillo-Herráez, M., Domingo, J. and Ferri, F.J. (2008)Combining similarity measures in content-based image retrieval.Pattern Recognit. Lett., 29, 2174–2181.
[46] Plataniotis, K.N. and Venetsanopoulos, A.N. (2000) Color ImageProcessing and Applications. Springer New York, USA.
[47] Wong, Y.M., Hoi, S. and Lyu, M. (2007) An Empirical Studyon Large-Scale Content-based Image Retrieval. IEEE Int. Conf.Multimedia and Expo, July, pp. 2206–2209.
The Computer Journal, 2010
at Sabanci U
niversity on June 29, 2010 http://com
jnl.oxfordjournals.orgD
ownloaded from