plant for lignocellulosic bioethanol production in serbia...
TRANSCRIPT
Faculty of Technical Sciences, Novi Sad, Serbia Department of Environmental Engineering
PLANT FOR LIGNOCELLULOSIC BIOETHANOL PRODUCTION IN SERBIA
Case Study
–Final Report–
Authors
Prof. Dr. Milan Martinov, editor Ass. Prof. Dr. Djordje Djatkov MSc Marko Golub MSc Miodrag Viskovic Ass, Prof. Dr. Sanja Bojic Jovan Krstic, Dipl. Ing.
Novi Sad, Serbia, 2015
C O N T E N T
1. INTRODUCTION 3
1.1 Objectives of the study
5
2. LCB– STATE OF THE ART 7
2.1 Status of the LCB technology 7
2.2 Existing plants 11
2.2.1 Project ABBK in Hugoton, Kansas, USA 2.2.2 Project LIBERTY in Emmetsburg, Iowa, USA 2.2.3 Project IBP in Crescentino, Italy
11 12 13
3. FEEDSTOCK POTENTIALS IN SERBIA 15
3.1 Potentials 3.1.1 Potentials for biofuels
15 18
3.2 Own measurements 3.2.1 Corn 3.2.2 Wheat
20 20 24
3.3 Overall potential for LCB 3.3.1 Additional potentials
26 27
4. FEEDSTOCK PROCUREMENT 29
4.1 Collection 29
4.1.1 Corn stover collection procedures 4.1.2 Straw collection
30 40
4.2 Storage 4.3 Logistic – supply chain 4.4 Supply security issues
41 45 47
5. FEEDSTOCK COSTS 50
5.1 Price of feedstock
52
6. ENVIRONMENT AND SUSTAINABILITY ISSUES 54
6.1 Preservation of soil fertility 6.2 GHG mitigation 6.3 Balances of LCB production process
54 55 59
7. LCB PLANT IN SERBIA 60
7.1 Plant location – supply costs 7.1.1 Supply costs
7.2 Profitability of investment 7.2.1 Expenses 7.2.2 Financial analysis
61 63 64 65 65
8. CONCLUSIONS AND FURTHER ACTIVITIES
70
REFERENCES
73
APPENDIX 1 APPENDIX 2
77 81
Faculty of Technical Sciences. Novi Sad, Serbia
Department of Environmental Engineering LIGNOCELLULOSIC BIOETHANOL PRODUCTION
IN SERBIA
3
1. INTRODUCTION
Recent news, second half of April, is (citation):
„The ILUC file passed the ENVI committee vote last week by 51 votes to 12”. The ILUC file passed the European Parliament’s ENVI committee vote on the 14th of April despite the fears that a coalition may vote to halt Indirect Land Use Change (ILUC) negotiations. The agreed text will be voted in the European Parliament’s plenary on the 29th of April, where it is widely expected to pass. After that, ILUC will be published in the official journal. In practice this means that ILUC negotiations between the Council and the European Parliament are over as an agreement was found after nearly 3 years of negotiation. Despite of the restrictive nature of ILUC’s revision, many observers believe that it is better for the European biofuels industry to have a decision at EU level, what enables trade between countries and ensures a common European standard. Even if the compromise is not perfect, the final version is more positive for the biomethane sector than previous positions. The three key points are the following:
A cap of 7 % on energy crops, out of the EU’s total transport consumption. Non-binding and single counted advanced biofuels target of 0.5 %, where “grassy
energy crops with a low starch content” such as ryegrass, switchgrass, miscanthus, giant cane, cover crops before and after main crops are included within the advanced category.
ILUC factors will not be applied directly, but only be used for reporting purposes.“
In this regard, utilization of crop residues as a feedstock for biofuels is positive, and will be, indirectly, supported by European legislation.
Serbia, as a contracting member of Energy Community, since 2005, accepted obligation to follow EU energy policy, what includes policy related to renewable energy sources, defined in Directive 2009/28/EC (in the text RED – Renewables Energy Directive), as well as other directives and documents of EU. The most challenging demand is to obtain share of 10 % of transportation fuels till 2020. This target is rather complex for all EU members, and current situation is not optimistic.
New demand is to introduce biofuels of second generation –G2, and this is even more difficult and still not clear. Due to availability of solid biomass, first of all crop residues, production of lignocellulosic bioethanol (LCB) would be priority for Serbia and most of surrounding countries.
The defined sustainability criteria, first in RED, and Directive 2009/30/EC, as well as in relevant communication C 160/8 (Anonymous, 2010), are logical and needed, but make the viability of LCB production even more difficult.
Recently, as consequences of decision of European Parliament of April the 18th, is expected introduction of ILUC (Indirect Land Use Change) into European legislation, and implementation of restriction of agricultural land for biofuel production. In this sense use of crop residues as a feedstock, LCB production, is positive.
Most important national document related to this issue is National action plan (Anonymous, 2013), which followed rather confused Biomass Action Plan (BAP) for the period 2010-2012, published in 2009. The following table, related to fuels for transportation, describes national targets.
There is included only ethanol, named bioethanol, made of starch materials, potato and corn grains. We guess, the following row related to biofuels, is related to the G2. It is
Faculty of Technical Sciences. Novi Sad, Serbia
Department of Environmental Engineering LIGNOCELLULOSIC BIOETHANOL PRODUCTION
IN SERBIA
4
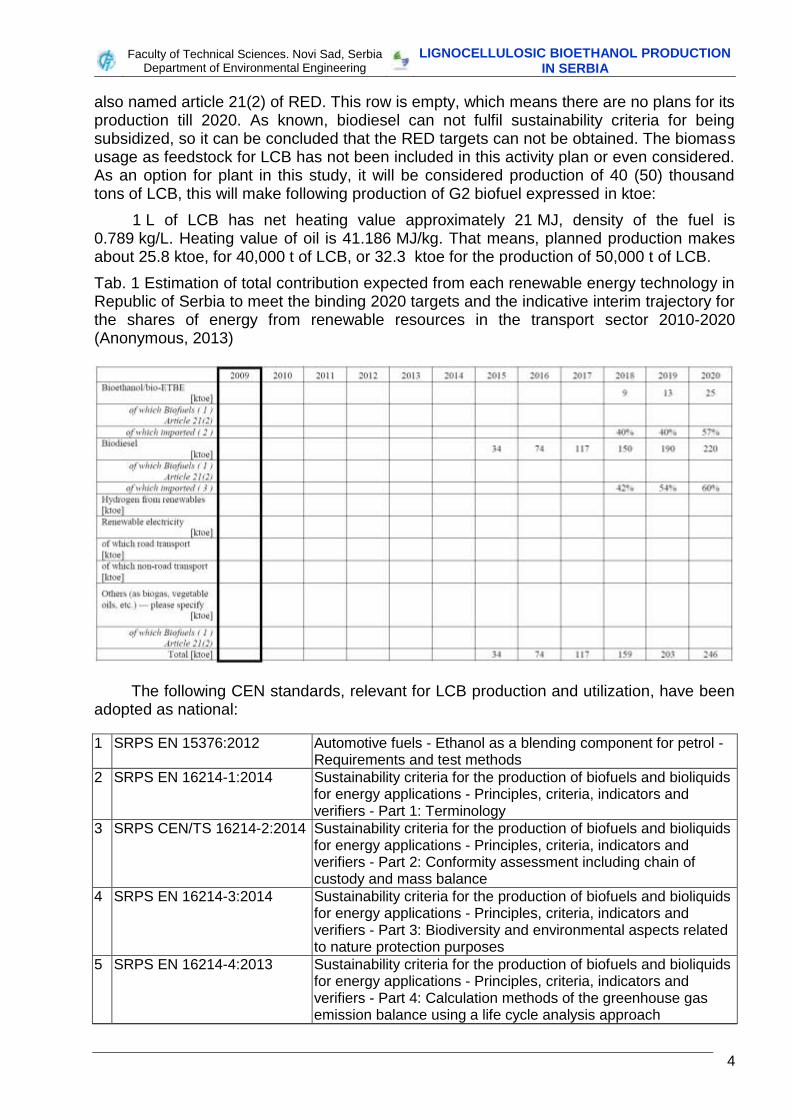
also named article 21(2) of RED. This row is empty, which means there are no plans for its production till 2020. As known, biodiesel can not fulfil sustainability criteria for being subsidized, so it can be concluded that the RED targets can not be obtained. The biomass usage as feedstock for LCB has not been included in this activity plan or even considered. As an option for plant in this study, it will be considered production of 40 (50) thousand tons of LCB, this will make following production of G2 biofuel expressed in ktoe:
1 L of LCB has net heating value approximately 21 MJ, density of the fuel is 0.789 kg/L. Heating value of oil is 41.186 MJ/kg. That means, planned production makes about 25.8 ktoe, for 40,000 t of LCB, or 32.3 ktoe for the production of 50,000 t of LCB.
Tab. 1 Estimation of total contribution expected from each renewable energy technology in Republic of Serbia to meet the binding 2020 targets and the indicative interim trajectory for the shares of energy from renewable resources in the transport sector 2010-2020 (Anonymous, 2013)
The following CEN standards, relevant for LCB production and utilization, have been adopted as national:
1 SRPS EN 15376:2012 Automotive fuels - Ethanol as a blending component for petrol - Requirements and test methods
2 SRPS EN 16214-1:2014 Sustainability criteria for the production of biofuels and bioliquids for energy applications - Principles, criteria, indicators and verifiers - Part 1: Terminology
3 SRPS CEN/TS 16214-2:2014 Sustainability criteria for the production of biofuels and bioliquids for energy applications - Principles, criteria, indicators and verifiers - Part 2: Conformity assessment including chain of custody and mass balance
4 SRPS EN 16214-3:2014 Sustainability criteria for the production of biofuels and bioliquids for energy applications - Principles, criteria, indicators and verifiers - Part 3: Biodiversity and environmental aspects related to nature protection purposes
5 SRPS EN 16214-4:2013 Sustainability criteria for the production of biofuels and bioliquids for energy applications - Principles, criteria, indicators and verifiers - Part 4: Calculation methods of the greenhouse gas emission balance using a life cycle analysis approach
Faculty of Technical Sciences. Novi Sad, Serbia
Department of Environmental Engineering LIGNOCELLULOSIC BIOETHANOL PRODUCTION
IN SERBIA
5
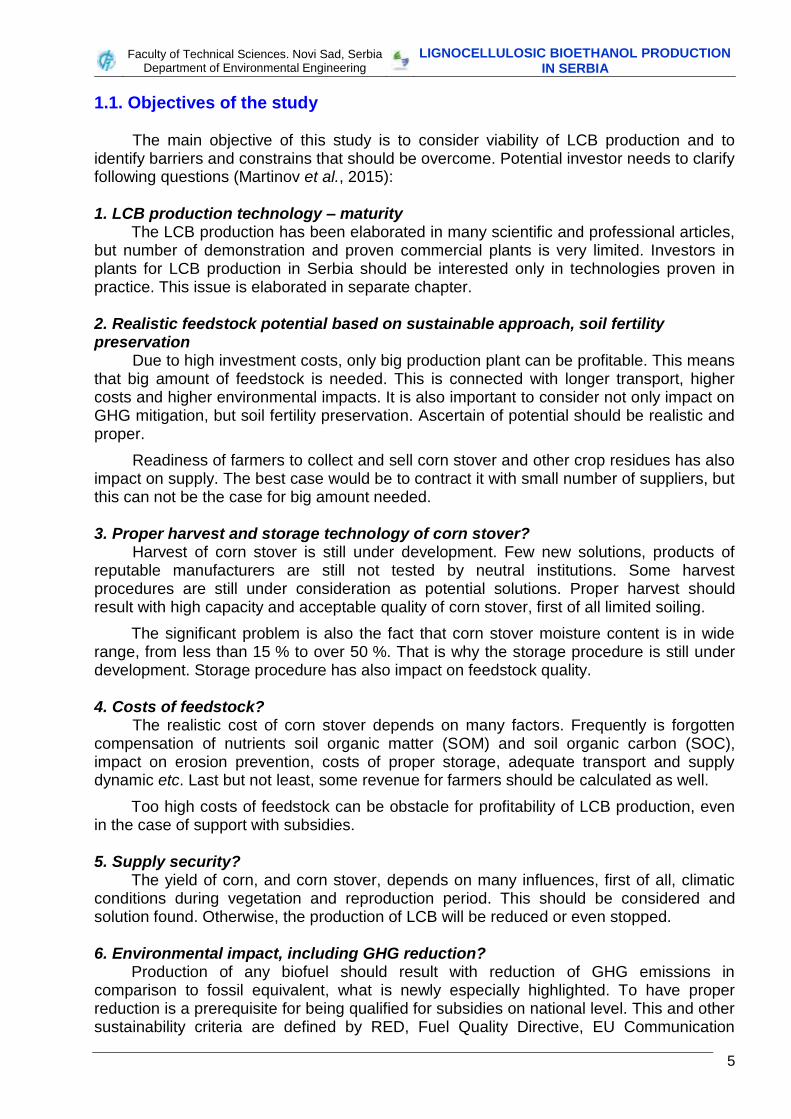
1.1. Objectives of the study
The main objective of this study is to consider viability of LCB production and to identify barriers and constrains that should be overcome. Potential investor needs to clarify following questions (Martinov et al., 2015): 1. LCB production technology – maturity
The LCB production has been elaborated in many scientific and professional articles, but number of demonstration and proven commercial plants is very limited. Investors in plants for LCB production in Serbia should be interested only in technologies proven in practice. This issue is elaborated in separate chapter. 2. Realistic feedstock potential based on sustainable approach, soil fertility preservation
Due to high investment costs, only big production plant can be profitable. This means that big amount of feedstock is needed. This is connected with longer transport, higher costs and higher environmental impacts. It is also important to consider not only impact on GHG mitigation, but soil fertility preservation. Ascertain of potential should be realistic and proper.
Readiness of farmers to collect and sell corn stover and other crop residues has also impact on supply. The best case would be to contract it with small number of suppliers, but this can not be the case for big amount needed. 3. Proper harvest and storage technology of corn stover?
Harvest of corn stover is still under development. Few new solutions, products of reputable manufacturers are still not tested by neutral institutions. Some harvest procedures are still under consideration as potential solutions. Proper harvest should result with high capacity and acceptable quality of corn stover, first of all limited soiling.
The significant problem is also the fact that corn stover moisture content is in wide range, from less than 15 % to over 50 %. That is why the storage procedure is still under development. Storage procedure has also impact on feedstock quality. 4. Costs of feedstock?
The realistic cost of corn stover depends on many factors. Frequently is forgotten compensation of nutrients soil organic matter (SOM) and soil organic carbon (SOC), impact on erosion prevention, costs of proper storage, adequate transport and supply dynamic etc. Last but not least, some revenue for farmers should be calculated as well.
Too high costs of feedstock can be obstacle for profitability of LCB production, even in the case of support with subsidies. 5. Supply security?
The yield of corn, and corn stover, depends on many influences, first of all, climatic conditions during vegetation and reproduction period. This should be considered and solution found. Otherwise, the production of LCB will be reduced or even stopped. 6. Environmental impact, including GHG reduction?
Production of any biofuel should result with reduction of GHG emissions in comparison to fossil equivalent, what is newly especially highlighted. To have proper reduction is a prerequisite for being qualified for subsidies on national level. This and other sustainability criteria are defined by RED, Fuel Quality Directive, EU Communication

Faculty of Technical Sciences. Novi Sad, Serbia
Department of Environmental Engineering LIGNOCELLULOSIC BIOETHANOL PRODUCTION
IN SERBIA
6
C 160/8 (Anonymous, 2010), and detailed described for Serbia (Denvir et al., 2015). Actually, production of biofuels can be heavily profitable, without fulfilling sustainability criteria, and be eligible for subsidies. This is why the calculation of GHG reduction should be very important step for any investor.
Faculty of Technical Sciences. Novi Sad, Serbia
Department of Environmental Engineering LIGNOCELLULOSIC BIOETHANOL PRODUCTION
IN SERBIA
7
2. LCB– STATE OF THE ART
Survey of all LCB plants, world wide, of different type and status has been done. This is presented in the APPENDIX 1. Only first four seems to be appropriate for LCB production based on crop residues, all recently put into operation (one 2013, and three 2014), and only one located in Europe.
2.1 Status of LCB technology
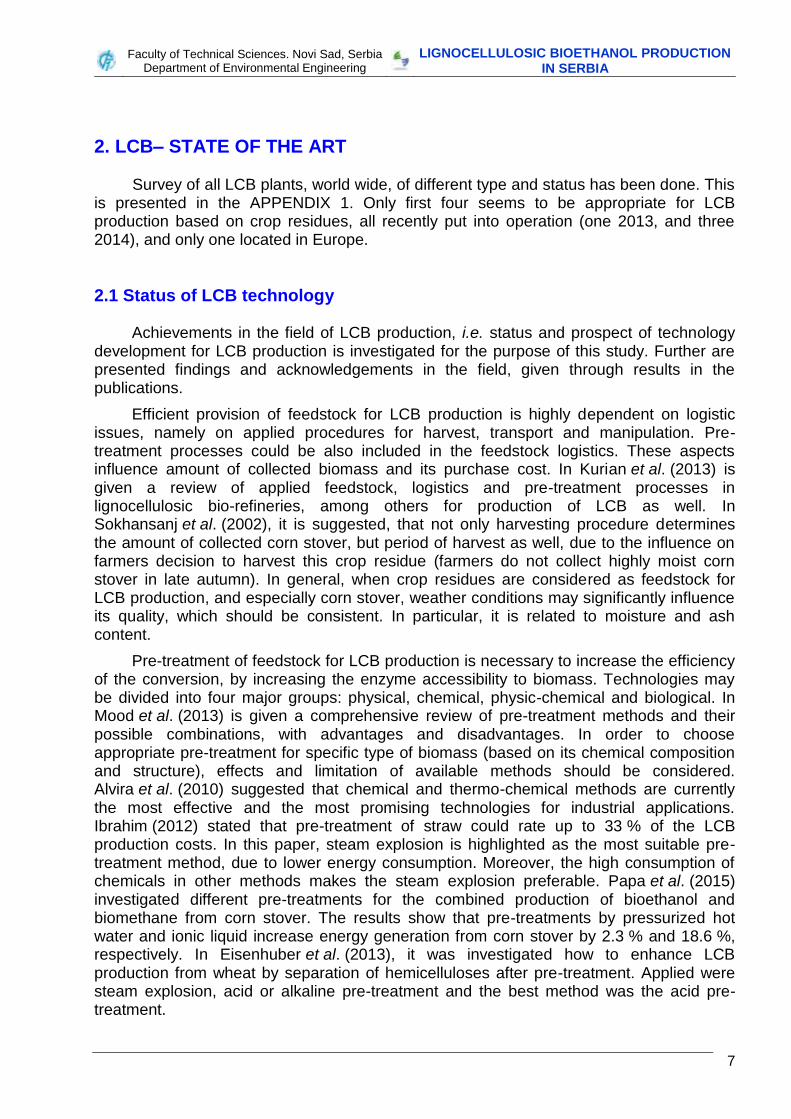
Achievements in the field of LCB production, i.e. status and prospect of technology development for LCB production is investigated for the purpose of this study. Further are presented findings and acknowledgements in the field, given through results in the publications.
Efficient provision of feedstock for LCB production is highly dependent on logistic issues, namely on applied procedures for harvest, transport and manipulation. Pre-treatment processes could be also included in the feedstock logistics. These aspects influence amount of collected biomass and its purchase cost. In Kurian et al. (2013) is given a review of applied feedstock, logistics and pre-treatment processes in lignocellulosic bio-refineries, among others for production of LCB as well. In Sokhansanj et al. (2002), it is suggested, that not only harvesting procedure determines the amount of collected corn stover, but period of harvest as well, due to the influence on farmers decision to harvest this crop residue (farmers do not collect highly moist corn stover in late autumn). In general, when crop residues are considered as feedstock for LCB production, and especially corn stover, weather conditions may significantly influence its quality, which should be consistent. In particular, it is related to moisture and ash content.
Pre-treatment of feedstock for LCB production is necessary to increase the efficiency of the conversion, by increasing the enzyme accessibility to biomass. Technologies may be divided into four major groups: physical, chemical, physic-chemical and biological. In Mood et al. (2013) is given a comprehensive review of pre-treatment methods and their possible combinations, with advantages and disadvantages. In order to choose appropriate pre-treatment for specific type of biomass (based on its chemical composition and structure), effects and limitation of available methods should be considered. Alvira et al. (2010) suggested that chemical and thermo-chemical methods are currently the most effective and the most promising technologies for industrial applications. Ibrahim (2012) stated that pre-treatment of straw could rate up to 33 % of the LCB production costs. In this paper, steam explosion is highlighted as the most suitable pre-treatment method, due to lower energy consumption. Moreover, the high consumption of chemicals in other methods makes the steam explosion preferable. Papa et al. (2015) investigated different pre-treatments for the combined production of bioethanol and biomethane from corn stover. The results show that pre-treatments by pressurized hot water and ionic liquid increase energy generation from corn stover by 2.3 % and 18.6 %, respectively. In Eisenhuber et al. (2013), it was investigated how to enhance LCB production from wheat by separation of hemicelluloses after pre-treatment. Applied were steam explosion, acid or alkaline pre-treatment and the best method was the acid pre-treatment.
Faculty of Technical Sciences. Novi Sad, Serbia
Department of Environmental Engineering LIGNOCELLULOSIC BIOETHANOL PRODUCTION
IN SERBIA
8
Influence of the LCB production and use on the environment and sustainability is assessed in various literature sources. In Wiloso et al. (2012), the literature review of LCA studies for the second generation bioethanol is provided. It was concluded that, regarding two studied impact categories, net energy output and global warming, second generation bioethanol performs better than fossil fuels. Next, GHG emission reduction of LCB from corn stover and wheat (blends 100 % bioethanol), rates between 82 and 91 %. In Sheehan (2003) is presented a model developed to determine environmental impact of substituting of gasoline with corn stover. It includes the impact of collecting the stover on soil, considering soil erosion and soil organic matter.
Production costs are decisive for the successful application of the LCB. In Sassner et al. (2008), LCB production costs for three different feedstock were compared–willow, corn stover and spruce. Based on whether bioethanol was produced either on base case or pentose-fermenting case, the cost of its production from corn stover is 0.58 or 0.45 €/L, respectively. Research on importance of policy and prices of feedstock on economic feasibility of LCB production from wheat straw is conducted by Littlewood et al. (2013). Thereby, various state-of-the-art pre-treatment technologies (steam explosion with and without acid catalyst, liquid hot water, dilute acid and wet oxidation) were assessed. It was found out that wet oxidation pre-treatment has the lowest minimum ethanol selling price of 0.48 €/L. The results showed also, that feedstock price and enzyme costs were the greatest contributors to the minimum ethanol selling price. In the case if wheat straw price would be 49 €, bioethanol production could be competitive with petrol. Analysis on competitiveness of second-generation biofuels with first generation and opportunities for cost reduction is given in Stephen et al. (2011), which could not be achieved only by improvements in one area. It is suggested that producers of LCB should not compare with the current production costs of the first generation bioethanol, but with the future, reduced cost (which is generally decreasing). Sanchez and Gomez (2014) reviewed production costs of cellulosic ethanol in the past and made forecasting the development of costs in the future. For the plant processing capacities between 1,050 and 2,000 t/day of dry corn stover, production costs were between 0.31 and 1.00 $/L. Ling et al. (2013) conducted research to determine the influence of corn stover composition on ethanol yield which consequently would influence production costs. Obtained results were in the range 0.92 and 1.16 $/L. Enzyme costs may significantly vary and therewith influence the production costs of lignocellulosic bioethanol, which is determined in the study conducted by Klein-Marcuschamer et al. (2012). In Ma and Eckhoff (2014) were investigated influences of bulk densities, transportation cost, and producer incentives with different sizes of facilities on bioethanol production costs from corn stover and miscanthus.
In Banerjee et al. (2010) is the LCB technology overviewed and suggestions are provided that could facilitate commercial LCB production economically viable. In this research it is stated that possible measures are: use of cheaper substrates, appliance of cost-effective pre-treatment approaches; overproducing and recombinant strains for maximized ethanol tolerance and yields; improved recovery processes; efficient bioprocess integration; economic exploitation of side products; energy and waste minimization. In Wei et al. (2014) is reviewed the membrane technology for bioethanol production, as a highly selective and energy-saving separation process. Beside others, the advantages and limitations for the aspect of bioethanol recovery are discussed. In Schuster and Chinn (2013) is presented how consolidated bioprocessing (CBP) has the potential to make LCB production economically viable, by combining enzyme production, polysaccharide hydrolysis and sugar fermentation. Conversion technologies for LCB production are investigated as well by Sanna (2014). In Chen and Qiu (2010) is given an overview of the new technologies required and the technology advances for LCB production, in order to achieve an economical and environmentally-friendly second
Faculty of Technical Sciences. Novi Sad, Serbia
Department of Environmental Engineering LIGNOCELLULOSIC BIOETHANOL PRODUCTION
IN SERBIA
9
generation bioethanol production by using straw as a substrate. Soccol et al. (2010) provided an overview of status and perspectives for LCB production in Brazil, where the sugarcane bagasse represents the main substrate.
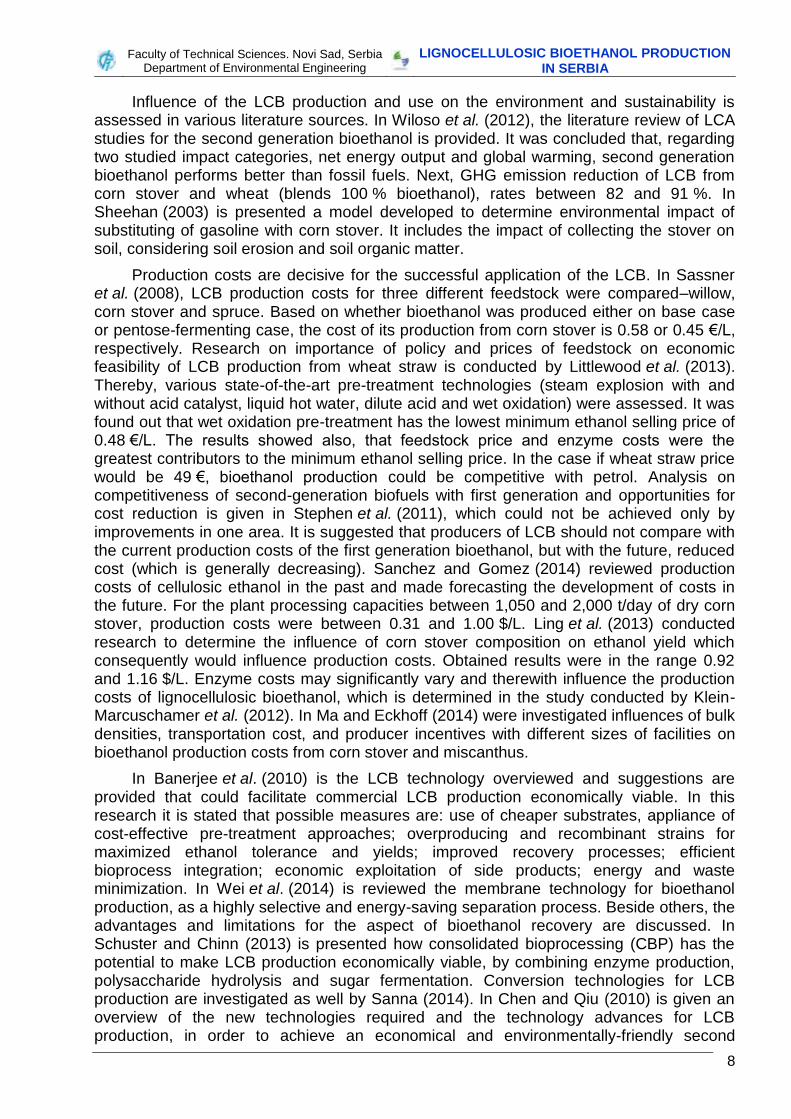
In Kazi et al. (2010a; 2010b) are considered process technologies for production of cellulosic ethanol from corn stover in order to obtain their techno-economic analysis and mutual comparison. In this regard, four pre-treatment technologies (dilute-acid, 2-stage dilute-acid, hot water, and ammonia fibre explosion or AFEX) and three variations of downstream processes (evaporation, separate 5-carbon and 6-carbon sugars fermentation, and on-site enzyme production) were analyzed, fig. 1. All analyses were based on assumption for plant capacity of 2,000 t/day of dry corn stover. Production costs of bioethanol from corn stover were in the range 0.89 to 1.17 $/L. The scenario with dilute-acid pre-treatment process has the lowest production costs, which is estimated to be 1.36 $/L of gasoline equivalent. Conducted sensitivity analysis showed that the bioethanol production cost is the most sensitive to feedstock and enzyme costs, as well as to investment costs, which is determined by selected technology and therewith installed equipment. A significant part of investment is related to facility for production of heat and power from lignin.
Fig. 1 General scheme of cellulosic ethanol plant with considered process technologies for the analysis (Kazi et al., 2010a)
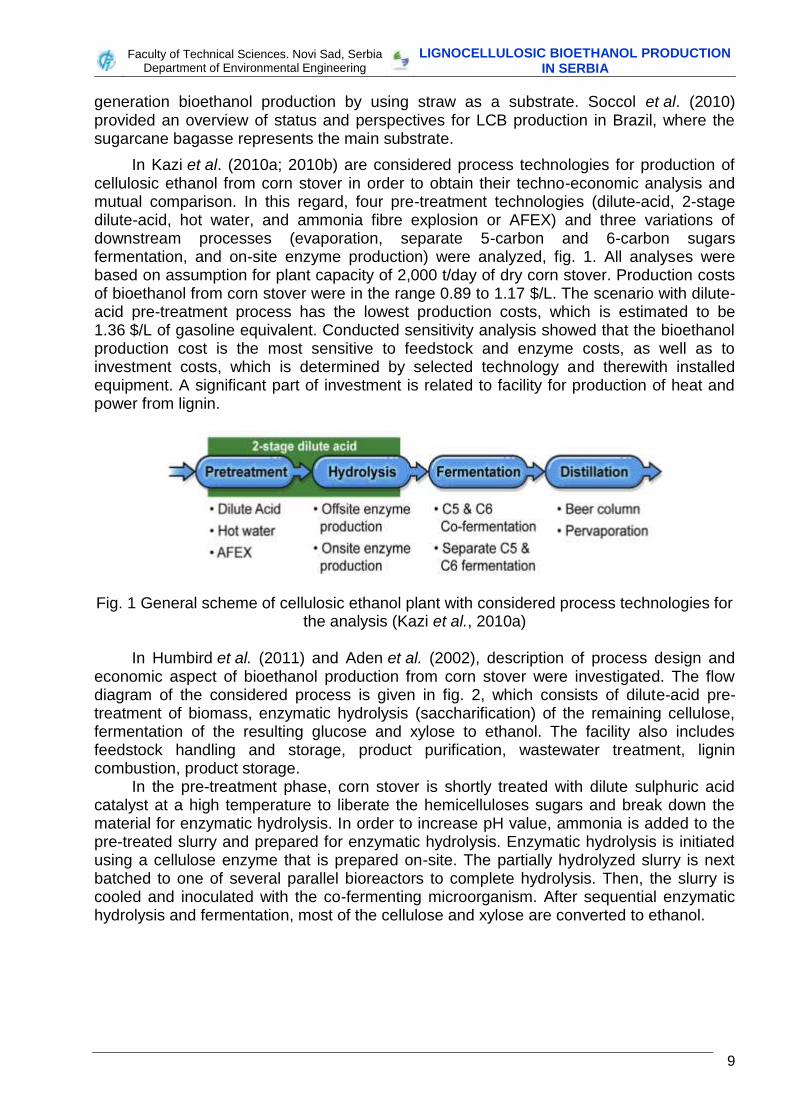
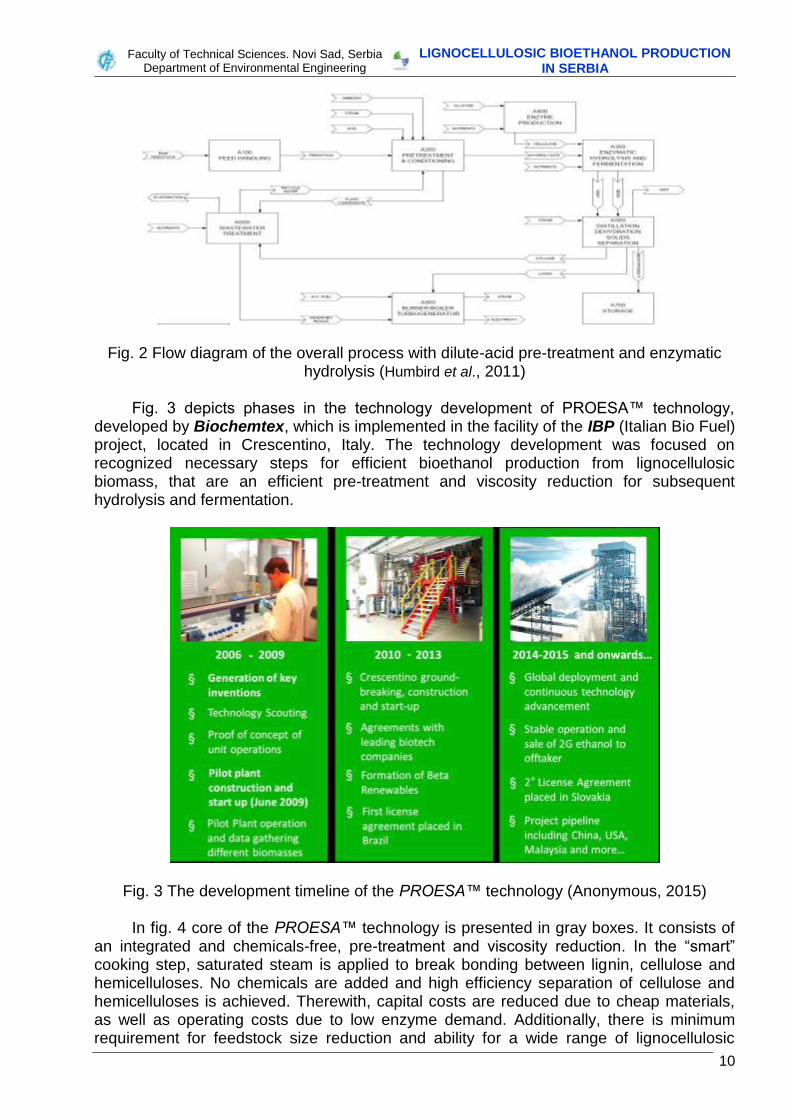
In Humbird et al. (2011) and Aden et al. (2002), description of process design and
economic aspect of bioethanol production from corn stover were investigated. The flow diagram of the considered process is given in fig. 2, which consists of dilute-acid pre-treatment of biomass, enzymatic hydrolysis (saccharification) of the remaining cellulose, fermentation of the resulting glucose and xylose to ethanol. The facility also includes feedstock handling and storage, product purification, wastewater treatment, lignin combustion, product storage.
In the pre-treatment phase, corn stover is shortly treated with dilute sulphuric acid catalyst at a high temperature to liberate the hemicelluloses sugars and break down the material for enzymatic hydrolysis. In order to increase pH value, ammonia is added to the pre-treated slurry and prepared for enzymatic hydrolysis. Enzymatic hydrolysis is initiated using a cellulose enzyme that is prepared on-site. The partially hydrolyzed slurry is next batched to one of several parallel bioreactors to complete hydrolysis. Then, the slurry is cooled and inoculated with the co-fermenting microorganism. After sequential enzymatic hydrolysis and fermentation, most of the cellulose and xylose are converted to ethanol.
Faculty of Technical Sciences. Novi Sad, Serbia
Department of Environmental Engineering LIGNOCELLULOSIC BIOETHANOL PRODUCTION
IN SERBIA
10
Fig. 2 Flow diagram of the overall process with dilute-acid pre-treatment and enzymatic hydrolysis (Humbird et al., 2011)
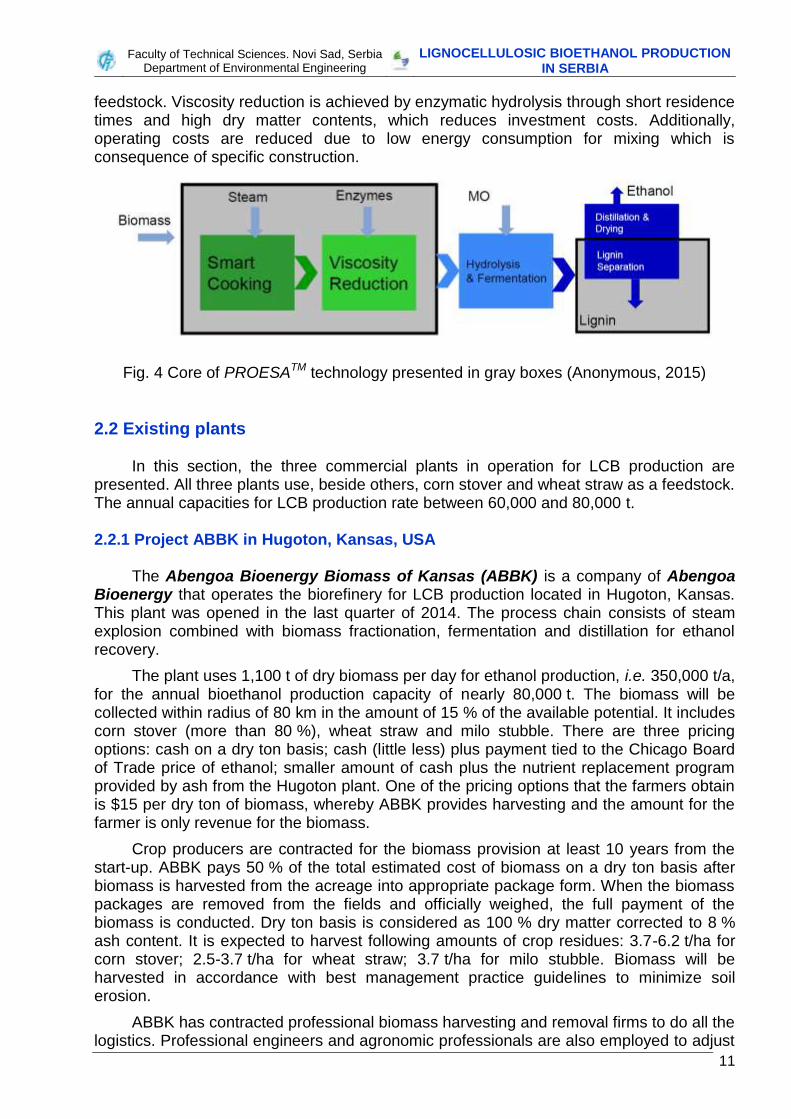
Fig. 3 depicts phases in the technology development of PROESA™ technology,
developed by Biochemtex, which is implemented in the facility of the IBP (Italian Bio Fuel) project, located in Crescentino, Italy. The technology development was focused on recognized necessary steps for efficient bioethanol production from lignocellulosic biomass, that are an efficient pre-treatment and viscosity reduction for subsequent hydrolysis and fermentation.
Fig. 3 The development timeline of the PROESA™ technology (Anonymous, 2015)
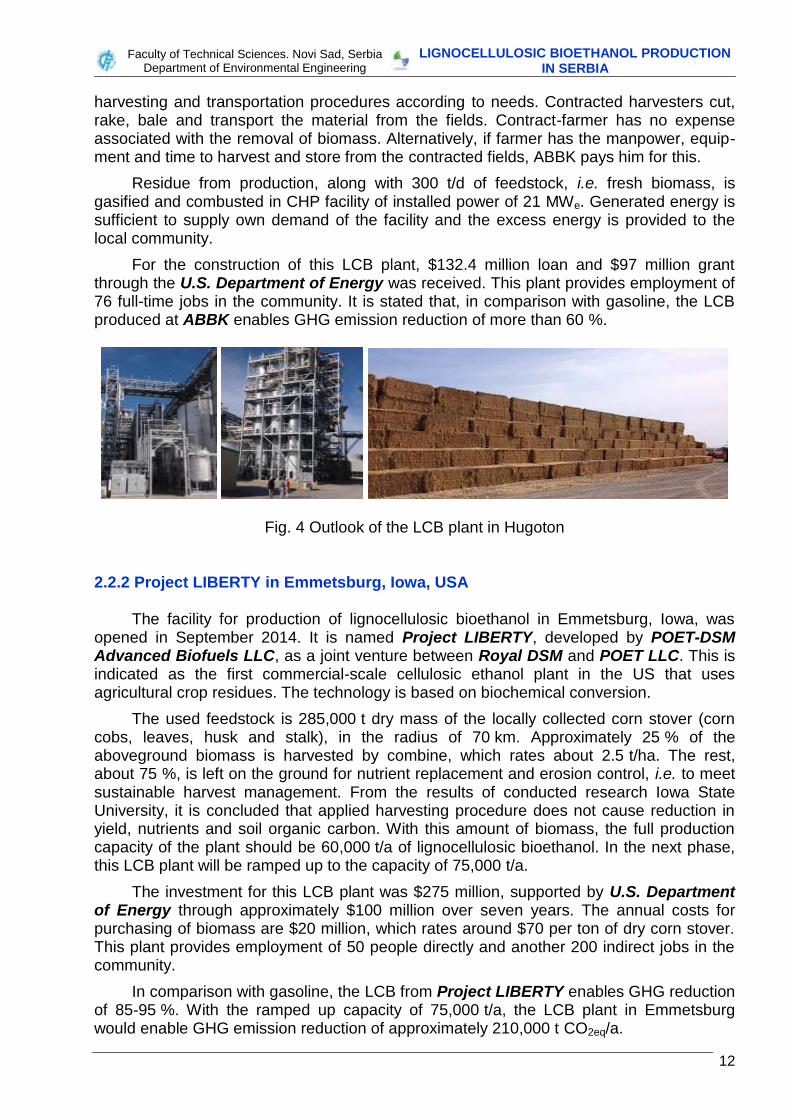
In fig. 4 core of the PROESA™ technology is presented in gray boxes. It consists of an integrated and chemicals-free, pre-treatment and viscosity reduction. In the “smart” cooking step, saturated steam is applied to break bonding between lignin, cellulose and hemicelluloses. No chemicals are added and high efficiency separation of cellulose and hemicelluloses is achieved. Therewith, capital costs are reduced due to cheap materials, as well as operating costs due to low enzyme demand. Additionally, there is minimum requirement for feedstock size reduction and ability for a wide range of lignocellulosic
Faculty of Technical Sciences. Novi Sad, Serbia
Department of Environmental Engineering LIGNOCELLULOSIC BIOETHANOL PRODUCTION
IN SERBIA
11
feedstock. Viscosity reduction is achieved by enzymatic hydrolysis through short residence times and high dry matter contents, which reduces investment costs. Additionally, operating costs are reduced due to low energy consumption for mixing which is consequence of specific construction.
Fig. 4 Core of PROESATM technology presented in gray boxes (Anonymous, 2015)
2.2 Existing plants
In this section, the three commercial plants in operation for LCB production are presented. All three plants use, beside others, corn stover and wheat straw as a feedstock. The annual capacities for LCB production rate between 60,000 and 80,000 t. 2.2.1 Project ABBK in Hugoton, Kansas, USA
The Abengoa Bioenergy Biomass of Kansas (ABBK) is a company of Abengoa Bioenergy that operates the biorefinery for LCB production located in Hugoton, Kansas. This plant was opened in the last quarter of 2014. The process chain consists of steam explosion combined with biomass fractionation, fermentation and distillation for ethanol recovery.
The plant uses 1,100 t of dry biomass per day for ethanol production, i.e. 350,000 t/a, for the annual bioethanol production capacity of nearly 80,000 t. The biomass will be collected within radius of 80 km in the amount of 15 % of the available potential. It includes corn stover (more than 80 %), wheat straw and milo stubble. There are three pricing options: cash on a dry ton basis; cash (little less) plus payment tied to the Chicago Board of Trade price of ethanol; smaller amount of cash plus the nutrient replacement program provided by ash from the Hugoton plant. One of the pricing options that the farmers obtain is $15 per dry ton of biomass, whereby ABBK provides harvesting and the amount for the farmer is only revenue for the biomass.
Crop producers are contracted for the biomass provision at least 10 years from the start-up. ABBK pays 50 % of the total estimated cost of biomass on a dry ton basis after biomass is harvested from the acreage into appropriate package form. When the biomass packages are removed from the fields and officially weighed, the full payment of the biomass is conducted. Dry ton basis is considered as 100 % dry matter corrected to 8 % ash content. It is expected to harvest following amounts of crop residues: 3.7-6.2 t/ha for corn stover; 2.5-3.7 t/ha for wheat straw; 3.7 t/ha for milo stubble. Biomass will be harvested in accordance with best management practice guidelines to minimize soil erosion.
ABBK has contracted professional biomass harvesting and removal firms to do all the logistics. Professional engineers and agronomic professionals are also employed to adjust
Faculty of Technical Sciences. Novi Sad, Serbia
Department of Environmental Engineering LIGNOCELLULOSIC BIOETHANOL PRODUCTION
IN SERBIA
12
harvesting and transportation procedures according to needs. Contracted harvesters cut, rake, bale and transport the material from the fields. Contract-farmer has no expense associated with the removal of biomass. Alternatively, if farmer has the manpower, equip-ment and time to harvest and store from the contracted fields, ABBK pays him for this.
Residue from production, along with 300 t/d of feedstock, i.e. fresh biomass, is gasified and combusted in CHP facility of installed power of 21 MWe. Generated energy is sufficient to supply own demand of the facility and the excess energy is provided to the local community.
For the construction of this LCB plant, $132.4 million loan and $97 million grant through the U.S. Department of Energy was received. This plant provides employment of 76 full-time jobs in the community. It is stated that, in comparison with gasoline, the LCB produced at ABBK enables GHG emission reduction of more than 60 %.
Fig. 4 Outlook of the LCB plant in Hugoton 2.2.2 Project LIBERTY in Emmetsburg, Iowa, USA
The facility for production of lignocellulosic bioethanol in Emmetsburg, Iowa, was opened in September 2014. It is named Project LIBERTY, developed by POET-DSM Advanced Biofuels LLC, as a joint venture between Royal DSM and POET LLC. This is indicated as the first commercial-scale cellulosic ethanol plant in the US that uses agricultural crop residues. The technology is based on biochemical conversion.
The used feedstock is 285,000 t dry mass of the locally collected corn stover (corn cobs, leaves, husk and stalk), in the radius of 70 km. Approximately 25 % of the aboveground biomass is harvested by combine, which rates about 2.5 t/ha. The rest, about 75 %, is left on the ground for nutrient replacement and erosion control, i.e. to meet sustainable harvest management. From the results of conducted research Iowa State University, it is concluded that applied harvesting procedure does not cause reduction in yield, nutrients and soil organic carbon. With this amount of biomass, the full production capacity of the plant should be 60,000 t/a of lignocellulosic bioethanol. In the next phase, this LCB plant will be ramped up to the capacity of 75,000 t/a.
The investment for this LCB plant was $275 million, supported by U.S. Department of Energy through approximately $100 million over seven years. The annual costs for purchasing of biomass are $20 million, which rates around $70 per ton of dry corn stover. This plant provides employment of 50 people directly and another 200 indirect jobs in the community.
In comparison with gasoline, the LCB from Project LIBERTY enables GHG reduction of 85-95 %. With the ramped up capacity of 75,000 t/a, the LCB plant in Emmetsburg would enable GHG emission reduction of approximately 210,000 t CO2eq/a.
Faculty of Technical Sciences. Novi Sad, Serbia
Department of Environmental Engineering LIGNOCELLULOSIC BIOETHANOL PRODUCTION
IN SERBIA
13
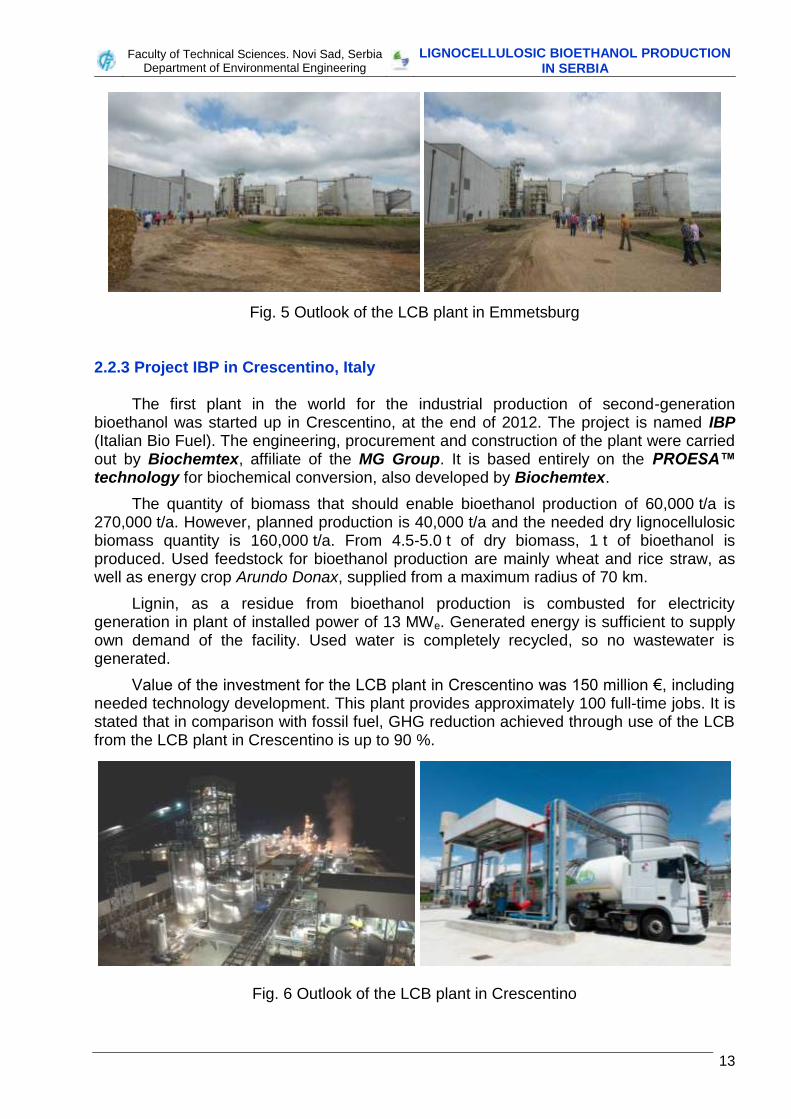
Fig. 5 Outlook of the LCB plant in Emmetsburg 2.2.3 Project IBP in Crescentino, Italy
The first plant in the world for the industrial production of second-generation bioethanol was started up in Crescentino, at the end of 2012. The project is named IBP (Italian Bio Fuel). The engineering, procurement and construction of the plant were carried out by Biochemtex, affiliate of the MG Group. It is based entirely on the PROESA™ technology for biochemical conversion, also developed by Biochemtex.
The quantity of biomass that should enable bioethanol production of 60,000 t/a is 270,000 t/a. However, planned production is 40,000 t/a and the needed dry lignocellulosic biomass quantity is 160,000 t/a. From 4.5-5.0 t of dry biomass, 1 t of bioethanol is produced. Used feedstock for bioethanol production are mainly wheat and rice straw, as well as energy crop Arundo Donax, supplied from a maximum radius of 70 km.
Lignin, as a residue from bioethanol production is combusted for electricity generation in plant of installed power of 13 MWe. Generated energy is sufficient to supply own demand of the facility. Used water is completely recycled, so no wastewater is generated.
Value of the investment for the LCB plant in Crescentino was 150 million €, including needed technology development. This plant provides approximately 100 full-time jobs. It is stated that in comparison with fossil fuel, GHG reduction achieved through use of the LCB from the LCB plant in Crescentino is up to 90 %.
Fig. 6 Outlook of the LCB plant in Crescentino
Faculty of Technical Sciences. Novi Sad, Serbia
Department of Environmental Engineering LIGNOCELLULOSIC BIOETHANOL PRODUCTION
IN SERBIA
14
Comments There are several commercial LCB production facilities in operation that use agricultural harvesting residues as feedstock and few more in planning phase. However, only few commercial LCB facilities exist, which process corn stover as feedstock. Therefore, LCB technology can be considered as technology in developing phase. Moreover, this proves number of demonstration and pilot plants (see APPENDIX 1), as well as results from conducted research in the literature. Although there are only few existing LCB production facilities, some advances in technology are already achieved, in order to optimize the process for the specific feedstock that originate from agriculture and which quality and composition may strongly vary. However, these are not validated in practice, since all existing commercial LCB production facilities, and especially those which use corn stover, have been started-up recently. More investments and further development of LCB technology is expected in coming years, after several years of operation of existing facilities, when effects, reliability and cost-effectiveness of operation on longer term operation could be proven.
Faculty of Technical Sciences. Novi Sad, Serbia
Department of Environmental Engineering LIGNOCELLULOSIC BIOETHANOL PRODUCTION
IN SERBIA
15
3. FEEDSTOCK POTENTIALS IN SERBIA
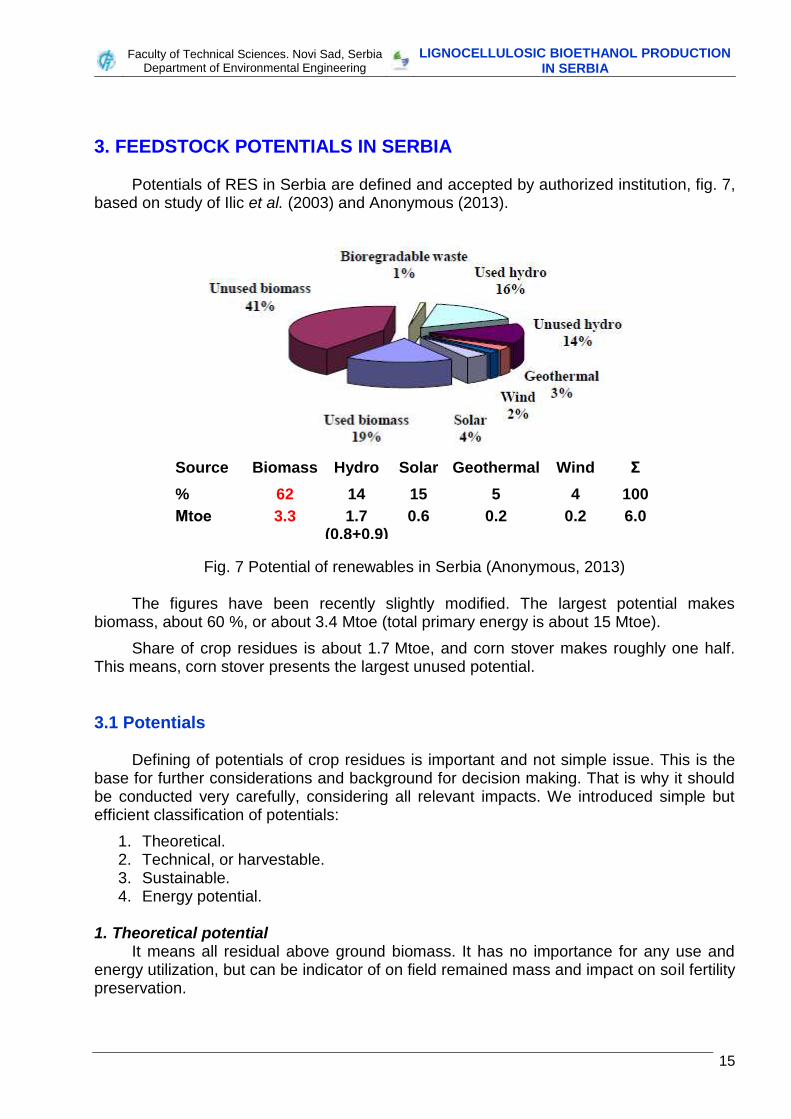
Potentials of RES in Serbia are defined and accepted by authorized institution, fig. 7, based on study of Ilic et al. (2003) and Anonymous (2013).
Source Biomass Hydro Solar Geothermal Wind Σ
% 62 14 15 5 4 100
Мtое 3.3 1.7 (0.8+0.9)
0.6 0.2 0.2 6.0
Fig. 7 Potential of renewables in Serbia (Anonymous, 2013)
The figures have been recently slightly modified. The largest potential makes biomass, about 60 %, or about 3.4 Mtoe (total primary energy is about 15 Mtoe).
Share of crop residues is about 1.7 Mtoe, and corn stover makes roughly one half. This means, corn stover presents the largest unused potential.
3.1 Potentials
Defining of potentials of crop residues is important and not simple issue. This is the base for further considerations and background for decision making. That is why it should be conducted very carefully, considering all relevant impacts. We introduced simple but efficient classification of potentials:
1. Theoretical. 2. Technical, or harvestable. 3. Sustainable. 4. Energy potential.
1. Theoretical potential
It means all residual above ground biomass. It has no importance for any use and energy utilization, but can be indicator of on field remained mass and impact on soil fertility preservation.
Faculty of Technical Sciences. Novi Sad, Serbia
Department of Environmental Engineering LIGNOCELLULOSIC BIOETHANOL PRODUCTION
IN SERBIA
16
2. Technical potential Presents amount of crop residues which can be harvested, harvestable, by applying
of common or specific harvest procedure. In most cases it is in the range between 22 and 65 % of theoretical potential, depending on crop.
3. Sustainable potential
This is related to the amount of residual biomass which can be off taken without negative impact on soil fertility, as well as to have influence on other issues related to the soil fertility preservation and environment in general. Calculation of this potential is rather complex, and should be performed for specific region, depending on crops, agro pedological characteristics, TOC conditions, underground water, etc.
4. Energy potential
This amount is obtained after subtraction of crop residues amount used for other purposes, e.g. typical use of straw for bedding or as a raw material for some products. After this subtraction, remained crop residues can be used as energy sources.
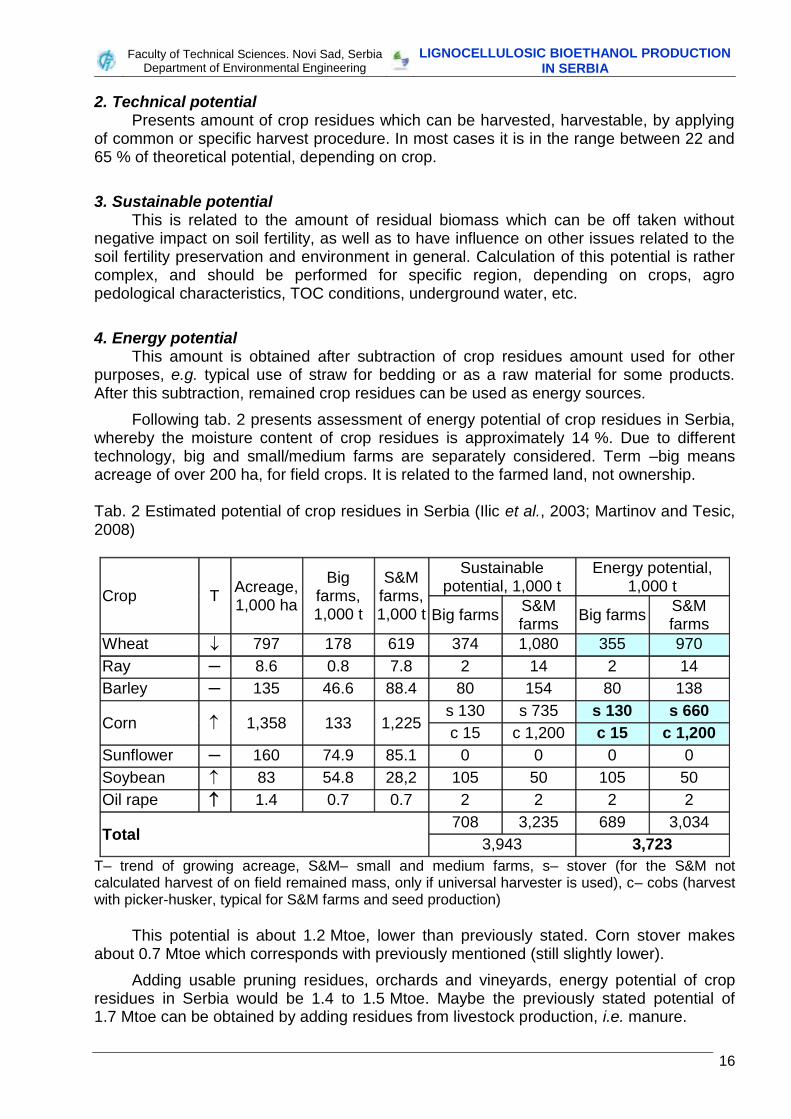
Following tab. 2 presents assessment of energy potential of crop residues in Serbia, whereby the moisture content of crop residues is approximately 14 %. Due to different technology, big and small/medium farms are separately considered. Term –big means acreage of over 200 ha, for field crops. It is related to the farmed land, not ownership. Tab. 2 Estimated potential of crop residues in Serbia (Ilic et al., 2003; Martinov and Tesic, 2008)
Crop T Acreage, 1,000 ha
Big farms, 1,000 t
S&M farms, 1,000 t
Sustainable potential, 1,000 t
Energy potential, 1,000 t
Big farms S&M farms
Big farms S&M farms
Wheat 797 178 619 374 1,080 355 970
Ray ─ 8.6 0.8 7.8 2 14 2 14
Barley ─ 135 46.6 88.4 80 154 80 138
Corn 1,358 133 1,225 s 130 s 735 s 130 s 660
c 15 c 1,200 c 15 c 1,200
Sunflower ─ 160 74.9 85.1 0 0 0 0
Soybean 83 54.8 28,2 105 50 105 50
Oil rape 1.4 0.7 0.7 2 2 2 2
Total 708 3,235 689 3,034
3,943 3,723
T– trend of growing acreage, S&M– small and medium farms, s– stover (for the S&M not calculated harvest of on field remained mass, only if universal harvester is used), c– cobs (harvest with picker-husker, typical for S&M farms and seed production)
This potential is about 1.2 Mtoe, lower than previously stated. Corn stover makes
about 0.7 Mtoe which corresponds with previously mentioned (still slightly lower).
Adding usable pruning residues, orchards and vineyards, energy potential of crop residues in Serbia would be 1.4 to 1.5 Mtoe. Maybe the previously stated potential of 1.7 Mtoe can be obtained by adding residues from livestock production, i.e. manure.
Faculty of Technical Sciences. Novi Sad, Serbia
Department of Environmental Engineering LIGNOCELLULOSIC BIOETHANOL PRODUCTION
IN SERBIA
17
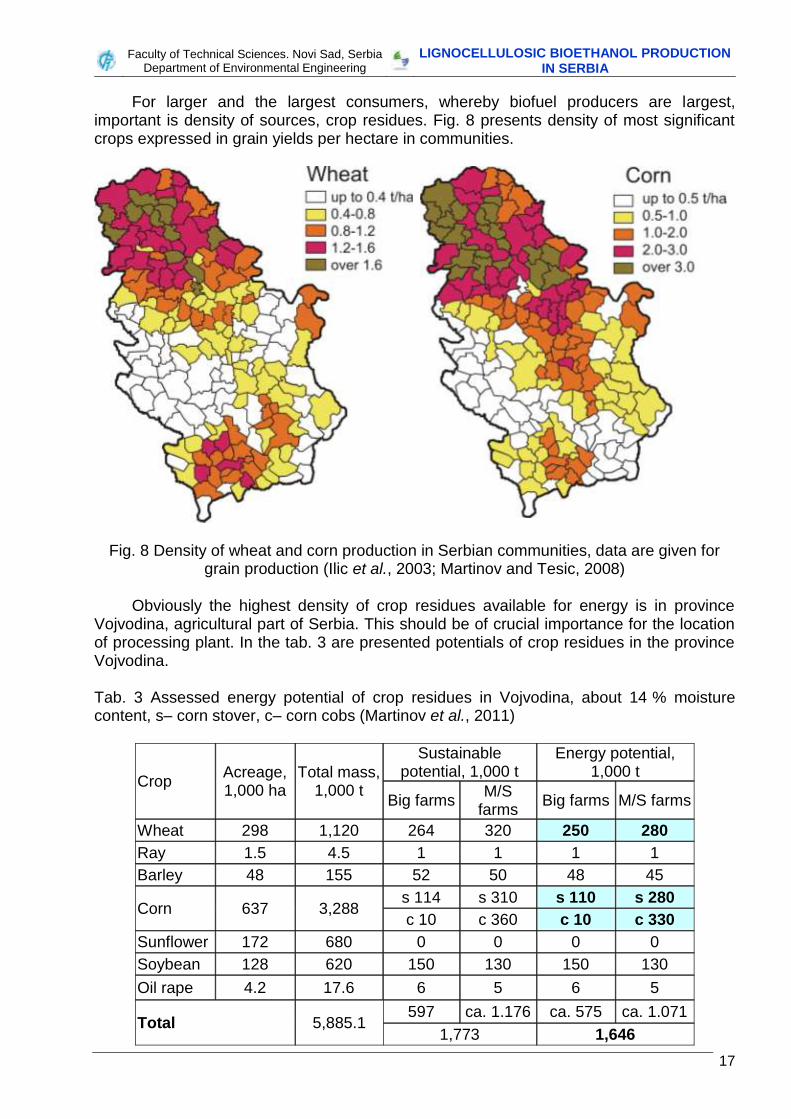
For larger and the largest consumers, whereby biofuel producers are largest, important is density of sources, crop residues. Fig. 8 presents density of most significant crops expressed in grain yields per hectare in communities.
Fig. 8 Density of wheat and corn production in Serbian communities, data are given for
grain production (Ilic et al., 2003; Martinov and Tesic, 2008)
Obviously the highest density of crop residues available for energy is in province Vojvodina, agricultural part of Serbia. This should be of crucial importance for the location of processing plant. In the tab. 3 are presented potentials of crop residues in the province Vojvodina. Tab. 3 Assessed energy potential of crop residues in Vojvodina, about 14 % moisture content, s– corn stover, c– corn cobs (Martinov et al., 2011)
Crop Acreage, 1,000 ha
Total mass, 1,000 t
Sustainable potential, 1,000 t
Energy potential, 1,000 t
Big farms M/S
farms Big farms M/S farms
Wheat 298 1,120 264 320 250 280
Ray 1.5 4.5 1 1 1 1
Barley 48 155 52 50 48 45
Corn 637 3,288 s 114 s 310 s 110 s 280
c 10 c 360 c 10 c 330
Sunflower 172 680 0 0 0 0
Soybean 128 620 150 130 150 130
Oil rape 4.2 17.6 6 5 6 5
Total 5,885.1 597 ca. 1.176 ca. 575 ca. 1.071
1,773 1,646
Faculty of Technical Sciences. Novi Sad, Serbia
Department of Environmental Engineering LIGNOCELLULOSIC BIOETHANOL PRODUCTION
IN SERBIA
18
Here is again the largest potential of wheat straw, about 190 ktoe and corn stover 260 ktoe. Here presented figures have been changed in last years: the acreage of corn increases, but number and acreages of big farms too. Also, this two crop residues can be, potentially, feedstock for LCB production.
Comments
1. The data presented in tab. 3 should be renew–upgraded. Structure of the ownership of agricultural land is changing slowly, but constantly toward increase of bigger and big farms. Much intensive is trend of renting land to the farmers-entrepreneurs whose cultivate (do not own!) over 50, and frequently over 200 ha. These changes also corn stover availability significantly. This is also followed by change of harvest technique – use of combine harvester, not picker-sheller.
2. The amount of available cobs, given in tab. 3, is nowadays reduced (assumption to the 2/3), but still significant. This valuable material can be also considered as a feedstock for LCB. Of course, proper procurement of it should be organized.
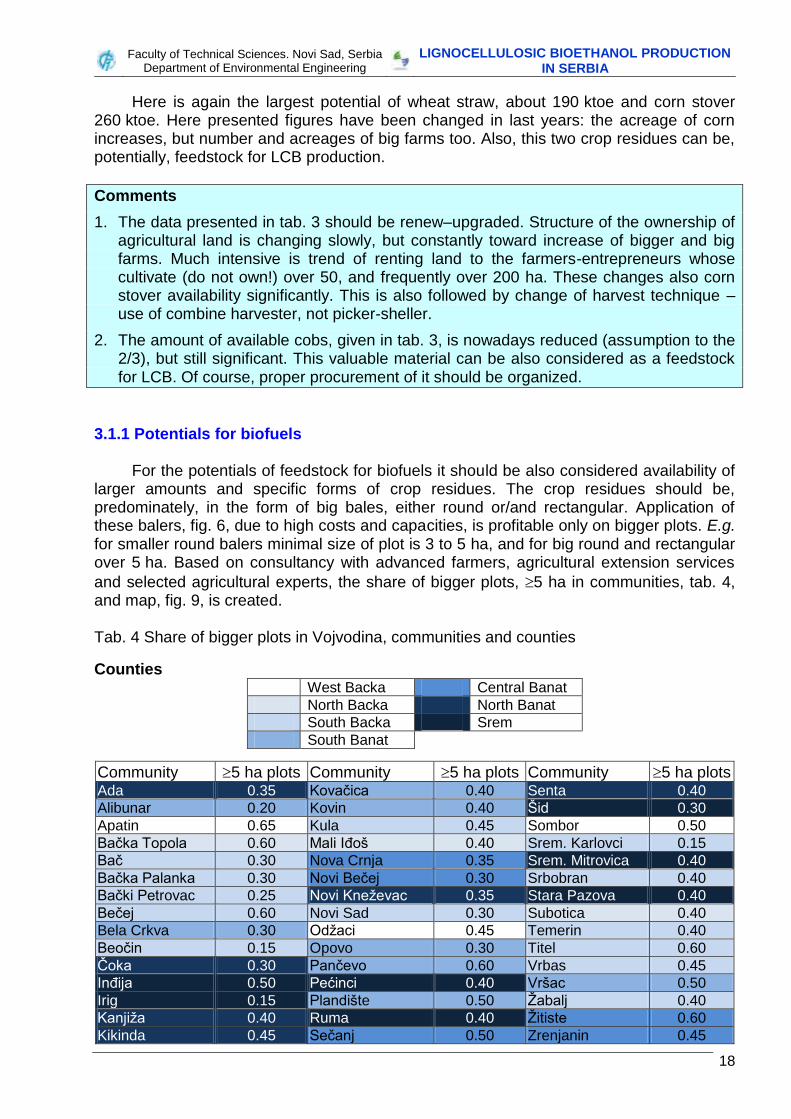
3.1.1 Potentials for biofuels For the potentials of feedstock for biofuels it should be also considered availability of
larger amounts and specific forms of crop residues. The crop residues should be, predominately, in the form of big bales, either round or/and rectangular. Application of these balers, fig. 6, due to high costs and capacities, is profitable only on bigger plots. E.g. for smaller round balers minimal size of plot is 3 to 5 ha, and for big round and rectangular over 5 ha. Based on consultancy with advanced farmers, agricultural extension services
and selected agricultural experts, the share of bigger plots, 5 ha in communities, tab. 4, and map, fig. 9, is created. Tab. 4 Share of bigger plots in Vojvodina, communities and counties
Counties West Backa Central Banat
North Backa North Banat
South Backa Srem
South Banat
Community 5 ha plots Community 5 ha plots Community 5 ha plots Ada 0.35 Kovačica 0.40 Senta 0.40
Alibunar 0.20 Kovin 0.40 Šid 0.30
Apatin 0.65 Kula 0.45 Sombor 0.50
Bačka Topola 0.60 Mali Iđoš 0.40 Srem. Karlovci 0.15
Bač 0.30 Nova Crnja 0.35 Srem. Mitrovica 0.40
Bačka Palanka 0.30 Novi Bečej 0.30 Srbobran 0.40
Bački Petrovac 0.25 Novi Kneževac 0.35 Stara Pazova 0.40
Bečej 0.60 Novi Sad 0.30 Subotica 0.40
Bela Crkva 0.30 Odžaci 0.45 Temerin 0.40
Beočin 0.15 Opovo 0.30 Titel 0.60
Čoka 0.30 Pančevo 0.60 Vrbas 0.45
Inđija 0.50 Pećinci 0.40 Vršac 0.50
Irig 0.15 Plandište 0.50 Žabalj 0.40
Kanjiža 0.40 Ruma 0.40 Žitiste 0.60
Kikinda 0.45 Sečanj 0.50 Zrenjanin 0.45
Faculty of Technical Sciences. Novi Sad, Serbia
Department of Environmental Engineering LIGNOCELLULOSIC BIOETHANOL PRODUCTION
IN SERBIA
19
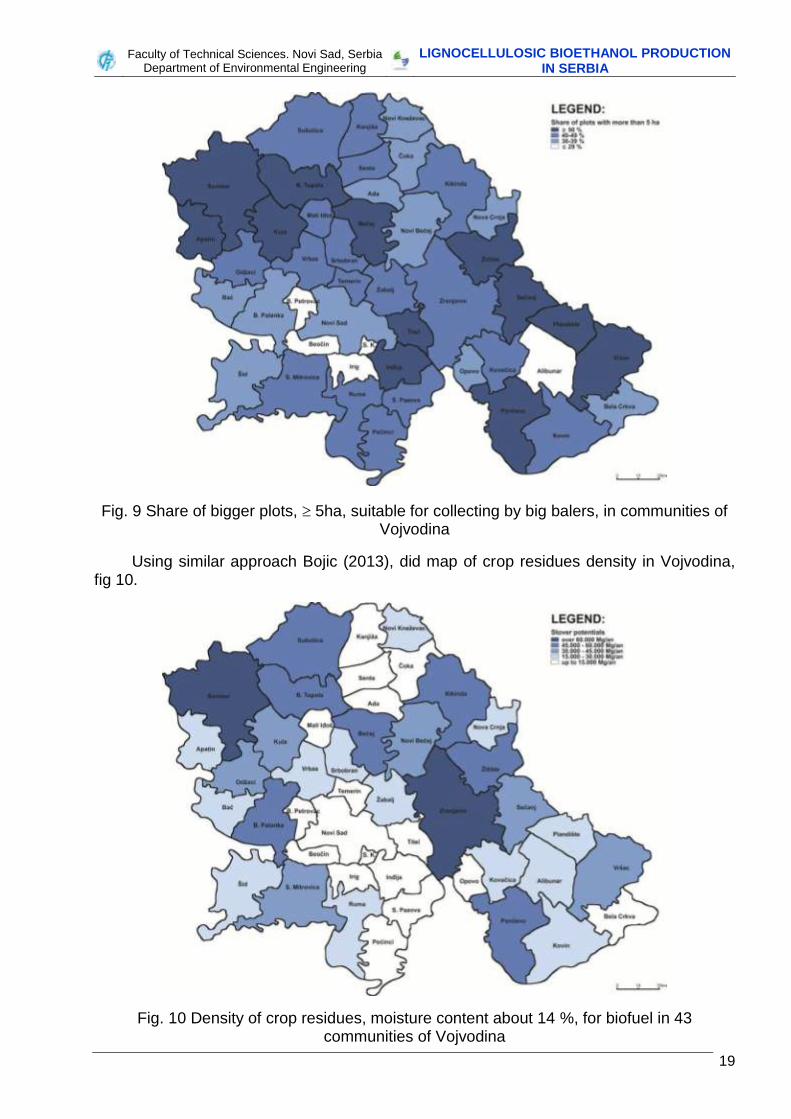
Fig. 9 Share of bigger plots, 5ha, suitable for collecting by big balers, in communities of Vojvodina
Using similar approach Bojic (2013), did map of crop residues density in Vojvodina, fig 10.
Fig. 10 Density of crop residues, moisture content about 14 %, for biofuel in 43 communities of Vojvodina
Faculty of Technical Sciences. Novi Sad, Serbia
Department of Environmental Engineering LIGNOCELLULOSIC BIOETHANOL PRODUCTION
IN SERBIA
20
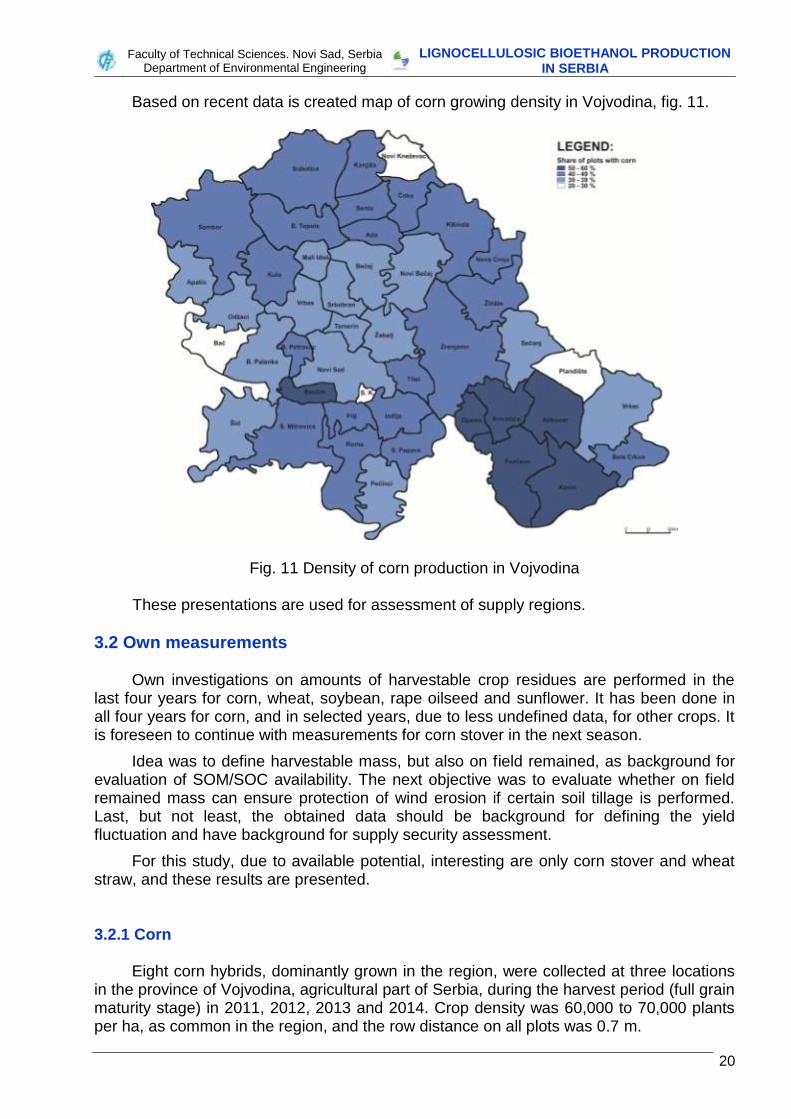
Based on recent data is created map of corn growing density in Vojvodina, fig. 11.
Fig. 11 Density of corn production in Vojvodina
These presentations are used for assessment of supply regions.
3.2 Own measurements
Own investigations on amounts of harvestable crop residues are performed in the last four years for corn, wheat, soybean, rape oilseed and sunflower. It has been done in all four years for corn, and in selected years, due to less undefined data, for other crops. It is foreseen to continue with measurements for corn stover in the next season.
Idea was to define harvestable mass, but also on field remained, as background for evaluation of SOM/SOC availability. The next objective was to evaluate whether on field remained mass can ensure protection of wind erosion if certain soil tillage is performed. Last, but not least, the obtained data should be background for defining the yield fluctuation and have background for supply security assessment.
For this study, due to available potential, interesting are only corn stover and wheat straw, and these results are presented. 3.2.1 Corn
Eight corn hybrids, dominantly grown in the region, were collected at three locations in the province of Vojvodina, agricultural part of Serbia, during the harvest period (full grain maturity stage) in 2011, 2012, 2013 and 2014. Crop density was 60,000 to 70,000 plants per ha, as common in the region, and the row distance on all plots was 0.7 m.
Faculty of Technical Sciences. Novi Sad, Serbia
Department of Environmental Engineering LIGNOCELLULOSIC BIOETHANOL PRODUCTION
IN SERBIA
21
For each hybrid and location, five randomly selected samples were taken from plots, from area of 1.4 m2 each. Corn plants were cut to the ground, packed and transported to the Laboratory of Biosystems Engineering, at the Faculty of Technical Sciences Novi Sad, for further preparations.
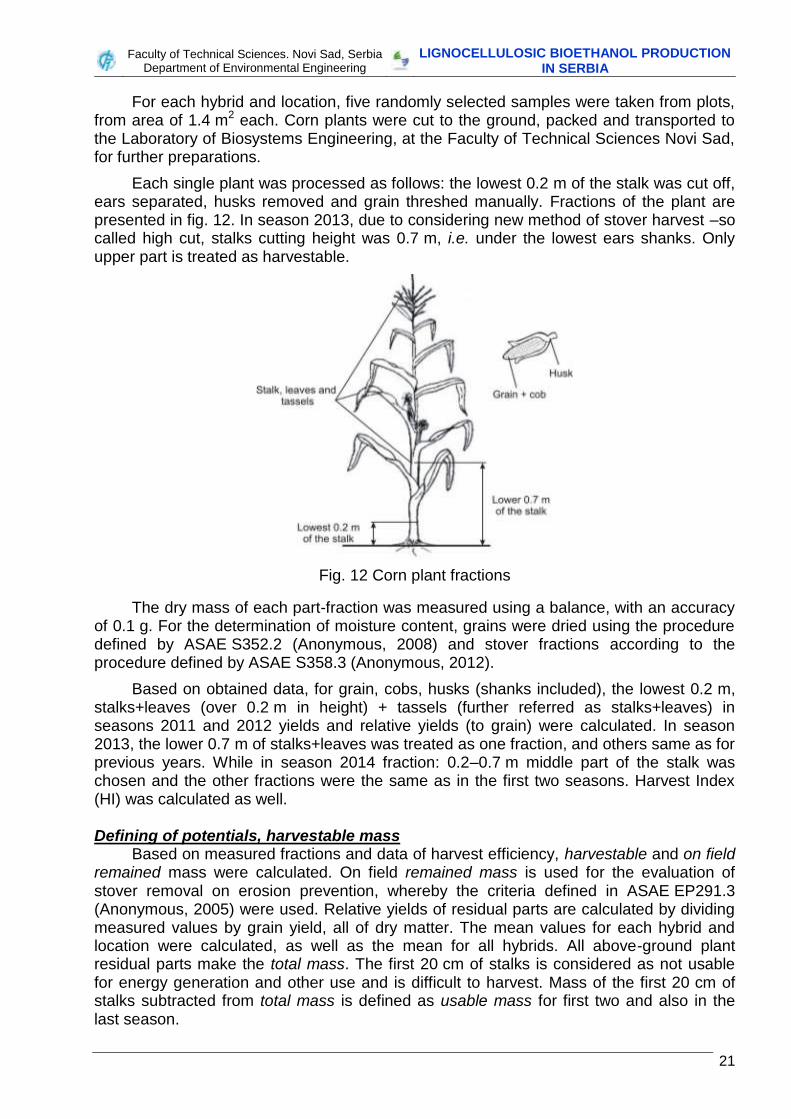
Each single plant was processed as follows: the lowest 0.2 m of the stalk was cut off, ears separated, husks removed and grain threshed manually. Fractions of the plant are presented in fig. 12. In season 2013, due to considering new method of stover harvest –so called high cut, stalks cutting height was 0.7 m, i.e. under the lowest ears shanks. Only upper part is treated as harvestable.
Fig. 12 Corn plant fractions
The dry mass of each part-fraction was measured using a balance, with an accuracy of 0.1 g. For the determination of moisture content, grains were dried using the procedure defined by ASAE S352.2 (Anonymous, 2008) and stover fractions according to the procedure defined by ASAE S358.3 (Anonymous, 2012).
Based on obtained data, for grain, cobs, husks (shanks included), the lowest 0.2 m, stalks+leaves (over 0.2 m in height) + tassels (further referred as stalks+leaves) in seasons 2011 and 2012 yields and relative yields (to grain) were calculated. In season 2013, the lower 0.7 m of stalks+leaves was treated as one fraction, and others same as for previous years. While in season 2014 fraction: 0.2–0.7 m middle part of the stalk was chosen and the other fractions were the same as in the first two seasons. Harvest Index (HI) was calculated as well. Defining of potentials, harvestable mass
Based on measured fractions and data of harvest efficiency, harvestable and on field remained mass were calculated. On field remained mass is used for the evaluation of stover removal on erosion prevention, whereby the criteria defined in ASAE EP291.3 (Anonymous, 2005) were used. Relative yields of residual parts are calculated by dividing measured values by grain yield, all of dry matter. The mean values for each hybrid and location were calculated, as well as the mean for all hybrids. All above-ground plant residual parts make the total mass. The first 20 cm of stalks is considered as not usable for energy generation and other use and is difficult to harvest. Mass of the first 20 cm of stalks subtracted from total mass is defined as usable mass for first two and also in the last season.
Faculty of Technical Sciences. Novi Sad, Serbia
Department of Environmental Engineering LIGNOCELLULOSIC BIOETHANOL PRODUCTION
IN SERBIA
22
The lowest part of stalks, beneath the ears, as previously reported, contains more nutrients and higher moisture content. If the on field remained mass should be higher, this part of the stover may be left. This is why in the seasons 2013 and 2014 so called high cut was considered, and mass of the first 70 cm of stalks subtracted as fraction.
The residual mass that is expected to be harvested, depending on harvest procedure, is assigned as harvestable mass. On-field remaining mass of crop residues is calculated by subtracting harvestable from total mass.
Potential harvest procedures are based on those previously described in Golub et al. (2012), Keene et al. (2013), Straeter (2011), Shinners et al. (2012). The calculation of harvestable mass is based on the share of harvested fractions and harvest losses, and is performed for three procedures, low, high and medium offtake:
1. Single-pass, cobs and husks harvest: Cobs, husks and parts of leaves, MOG, that exit combine separator are harvested. As solution, pressing of material by trailed round baler powered by combine, described in Keene et al. (2013), has been considered. By these solutions contact of stover and ground is avoided, i.e. contamination by soil. Complete amount of cobs and husks is harvested, and some of leaves.
2. Two-pass harvest – windrower: Grain harvest by combine with ear snapper corn header and integrated shredder-cornrower described in Straeter (2011) and Shinners et al. (2012). The stover is picked up from windrow by a round or big rectangular baler. Cutting height is 0.2 m. Percentages of harvested fractions are 70, 90 and 90 %, for stalks+leaves, cobs and husks, respectively.
3. Two-pass harvest – high cut: Cutting header (as for forage harvesters) with cutting height of 0.7 m would be used. Stalk+leaves fraction beneath 0.7 m is chopped and scattered on the field by in header integrated shredder. Upper stalk+leaves fraction and ears pass through combine, as presented by Shinners et al. (2012) for single pass procedure. MOG forms windrow which is collected and pressed by baler in second pass. Percentages of harvested fractions are 80 % for upper stalks+leaves and 90 % for cobs and husks.
The average data of measured crop characteristics are presented in tab. 5.
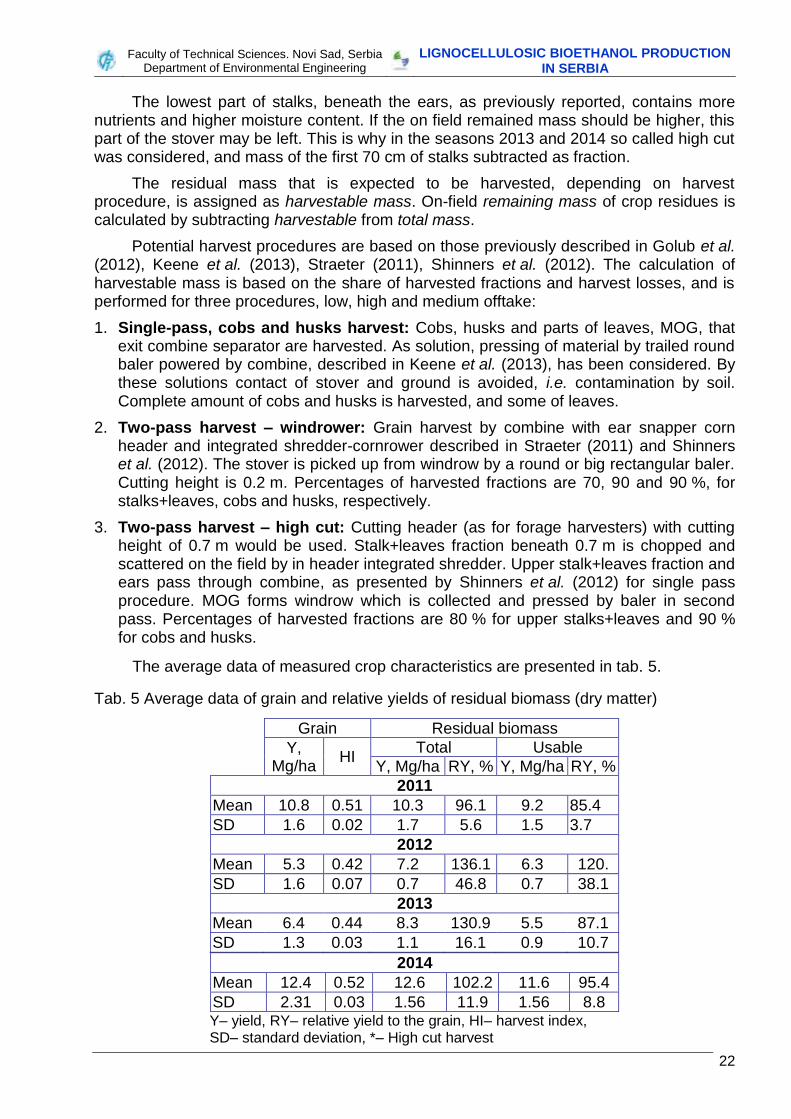
Tab. 5 Average data of grain and relative yields of residual biomass (dry matter)
Grain Residual biomass
Y, Mg/ha
HI Total Usable
Y, Mg/ha RY, % Y, Mg/ha RY, %
2011
Mean 10.8 0.51 10.3 96.1 9.2 85.4
SD 1.6 0.02 1.7 5.6 1.5 3.7
2012
Mean 5.3 0.42 7.2 136.1 6.3 120.
SD 1.6 0.07 0.7 46.8 0.7 38.1
2013
Mean 6.4 0.44 8.3 130.9 5.5 87.1
SD 1.3 0.03 1.1 16.1 0.9 10.7
2014
Mean 12.4 0.52 12.6 102.2 11.6 95.4
SD 2.31 0.03 1.56 11.9 1.56 8.8 Y– yield, RY– relative yield to the grain, HI– harvest index, SD– standard deviation, *– High cut harvest
Faculty of Technical Sciences. Novi Sad, Serbia
Department of Environmental Engineering LIGNOCELLULOSIC BIOETHANOL PRODUCTION
IN SERBIA
23
The average grain yields of samples were 10.8, 5.3, 6.4 and 12.4 Mg1/ha of DM and HI 0.51, 0.41, 0.44 and 0.52 for seasons 2011, 2012, 2013 and 2014, respectively. The average grain yield in seasons 2012 and 2013 was considerably lower as the consequence of extremely dry weather conditions and very high temperatures. Harvestable and on filed remained mass
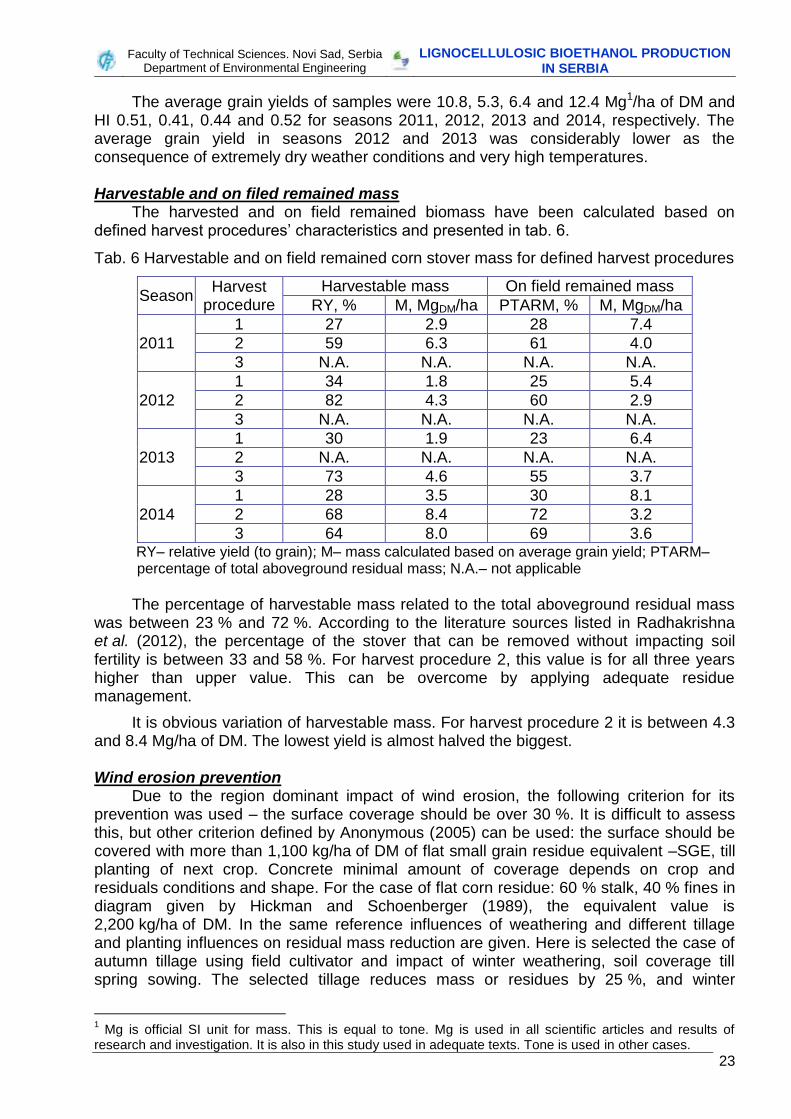
The harvested and on field remained biomass have been calculated based on defined harvest procedures’ characteristics and presented in tab. 6.
Tab. 6 Harvestable and on field remained corn stover mass for defined harvest procedures
Season Harvest
procedure
Harvestable mass On field remained mass
RY, % M, MgDM/ha PTARM, % M, MgDM/ha
2011
1 27 2.9 28 7.4
2 59 6.3 61 4.0
3 N.A. N.A. N.A. N.A.
2012
1 34 1.8 25 5.4
2 82 4.3 60 2.9
3 N.A. N.A. N.A. N.A.
2013
1 30 1.9 23 6.4
2 N.A. N.A. N.A. N.A.
3 73 4.6 55 3.7
2014
1 28 3.5 30 8.1
2 68 8.4 72 3.2
3 64 8.0 69 3.6 RY– relative yield (to grain); M– mass calculated based on average grain yield; PTARM– percentage of total aboveground residual mass; N.A.– not applicable
The percentage of harvestable mass related to the total aboveground residual mass
was between 23 % and 72 %. According to the literature sources listed in Radhakrishna et al. (2012), the percentage of the stover that can be removed without impacting soil fertility is between 33 and 58 %. For harvest procedure 2, this value is for all three years higher than upper value. This can be overcome by applying adequate residue management.
It is obvious variation of harvestable mass. For harvest procedure 2 it is between 4.3 and 8.4 Mg/ha of DM. The lowest yield is almost halved the biggest. Wind erosion prevention
Due to the region dominant impact of wind erosion, the following criterion for its prevention was used – the surface coverage should be over 30 %. It is difficult to assess this, but other criterion defined by Anonymous (2005) can be used: the surface should be covered with more than 1,100 kg/ha of DM of flat small grain residue equivalent –SGE, till planting of next crop. Concrete minimal amount of coverage depends on crop and residuals conditions and shape. For the case of flat corn residue: 60 % stalk, 40 % fines in diagram given by Hickman and Schoenberger (1989), the equivalent value is 2,200 kg/ha of DM. In the same reference influences of weathering and different tillage and planting influences on residual mass reduction are given. Here is selected the case of autumn tillage using field cultivator and impact of winter weathering, soil coverage till spring sowing. The selected tillage reduces mass or residues by 25 %, and winter
1 Mg is official SI unit for mass. This is equal to tone. Mg is used in all scientific articles and results of
research and investigation. It is also in this study used in adequate texts. Tone is used in other cases.
Faculty of Technical Sciences. Novi Sad, Serbia
Department of Environmental Engineering LIGNOCELLULOSIC BIOETHANOL PRODUCTION
IN SERBIA
24
weathering by 10 %. That means, the minimal surface biomass needed to ensure wind erosion prevention should be more than 3,275 kg/ha of DM, for selected conditions.
For our own measurements on field remaining biomass, dry matter, was between 4.0 and 7.4 Mg/ha, 2.9 and 5.4 Mg/ha, 3.7 to 6.4 Mg/ha and 3.2 to 8.1 Mg/ha of DM, for the seasons 2011, 2012, 2013 and 2014, respectively. For example, in 2012 and 2014, remaining mass for the harvest procedure 2 was 2.9 and 3.2 Mg/ha of DM, respectively, which means, lower than for defined conditions calculated as 3,275 kg/ha of DM.
The values of on field remained mass are in all other cases above defined minimal mass needed to ensure wind erosion prevention. 3.2.2 Wheat
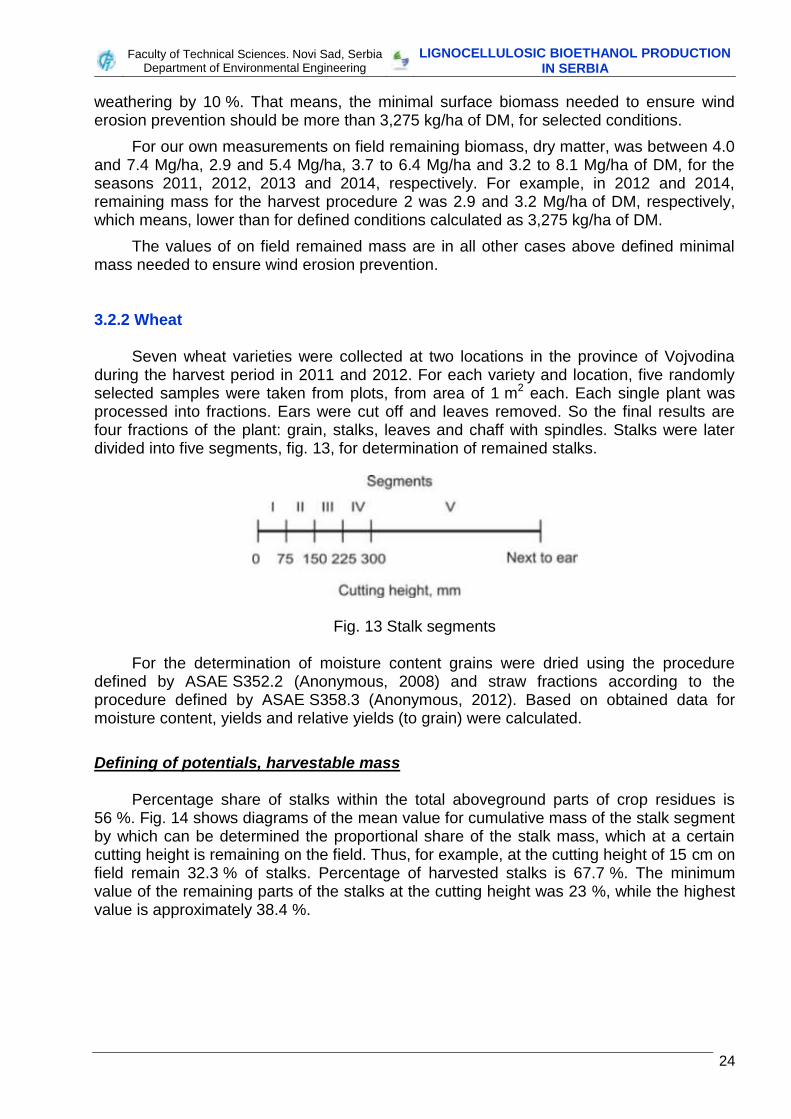
Seven wheat varieties were collected at two locations in the province of Vojvodina during the harvest period in 2011 and 2012. For each variety and location, five randomly selected samples were taken from plots, from area of 1 m2 each. Each single plant was processed into fractions. Ears were cut off and leaves removed. So the final results are four fractions of the plant: grain, stalks, leaves and chaff with spindles. Stalks were later divided into five segments, fig. 13, for determination of remained stalks.
Fig. 13 Stalk segments
For the determination of moisture content grains were dried using the procedure defined by ASAE S352.2 (Anonymous, 2008) and straw fractions according to the procedure defined by ASAE S358.3 (Anonymous, 2012). Based on obtained data for moisture content, yields and relative yields (to grain) were calculated.
Defining of potentials, harvestable mass
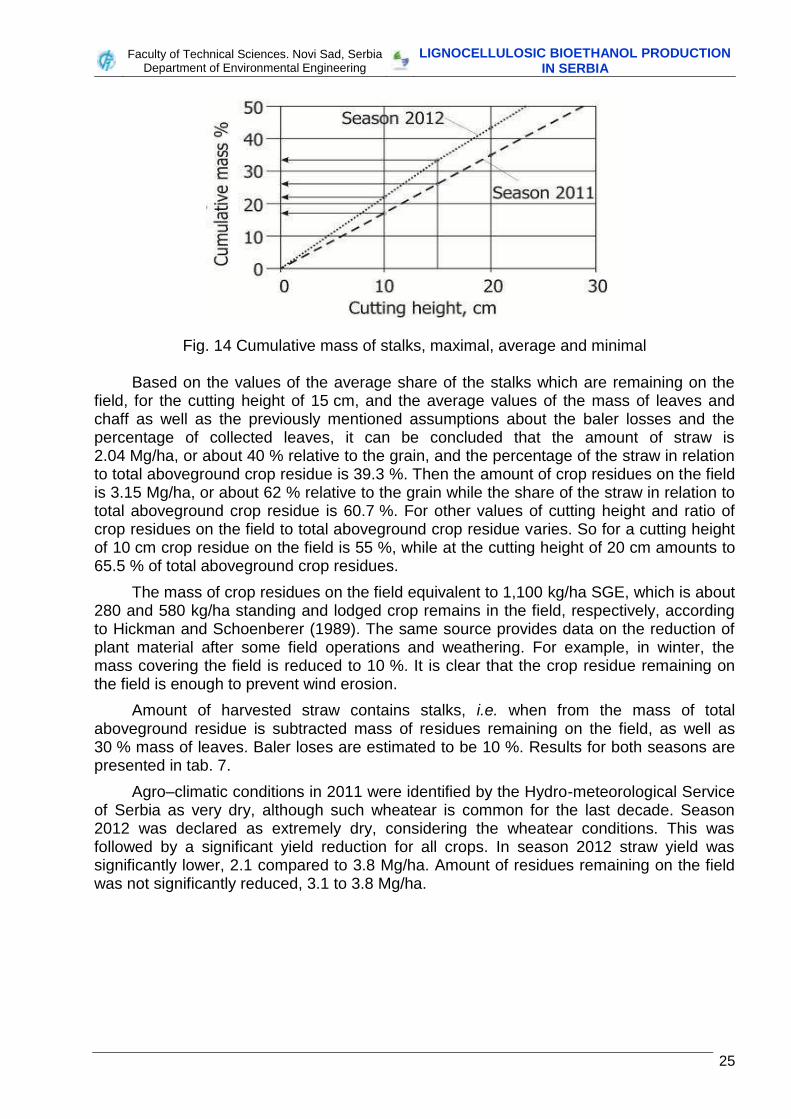
Percentage share of stalks within the total aboveground parts of crop residues is 56 %. Fig. 14 shows diagrams of the mean value for cumulative mass of the stalk segment by which can be determined the proportional share of the stalk mass, which at a certain cutting height is remaining on the field. Thus, for example, at the cutting height of 15 cm on field remain 32.3 % of stalks. Percentage of harvested stalks is 67.7 %. The minimum value of the remaining parts of the stalks at the cutting height was 23 %, while the highest value is approximately 38.4 %.
Faculty of Technical Sciences. Novi Sad, Serbia
Department of Environmental Engineering LIGNOCELLULOSIC BIOETHANOL PRODUCTION
IN SERBIA
25
Fig. 14 Cumulative mass of stalks, maximal, average and minimal
Based on the values of the average share of the stalks which are remaining on the field, for the cutting height of 15 cm, and the average values of the mass of leaves and chaff as well as the previously mentioned assumptions about the baler losses and the percentage of collected leaves, it can be concluded that the amount of straw is 2.04 Mg/ha, or about 40 % relative to the grain, and the percentage of the straw in relation to total aboveground crop residue is 39.3 %. Then the amount of crop residues on the field is 3.15 Mg/ha, or about 62 % relative to the grain while the share of the straw in relation to total aboveground crop residue is 60.7 %. For other values of cutting height and ratio of crop residues on the field to total aboveground crop residue varies. So for a cutting height of 10 cm crop residue on the field is 55 %, while at the cutting height of 20 cm amounts to 65.5 % of total aboveground crop residues.
The mass of crop residues on the field equivalent to 1,100 kg/ha SGE, which is about 280 and 580 kg/ha standing and lodged crop remains in the field, respectively, according to Hickman and Schoenberer (1989). The same source provides data on the reduction of plant material after some field operations and weathering. For example, in winter, the mass covering the field is reduced to 10 %. It is clear that the crop residue remaining on the field is enough to prevent wind erosion.
Amount of harvested straw contains stalks, i.e. when from the mass of total aboveground residue is subtracted mass of residues remaining on the field, as well as 30 % mass of leaves. Baler loses are estimated to be 10 %. Results for both seasons are presented in tab. 7.
Agro–climatic conditions in 2011 were identified by the Hydro-meteorological Service of Serbia as very dry, although such wheatear is common for the last decade. Season 2012 was declared as extremely dry, considering the wheatear conditions. This was followed by a significant yield reduction for all crops. In season 2012 straw yield was significantly lower, 2.1 compared to 3.8 Mg/ha. Amount of residues remaining on the field was not significantly reduced, 3.1 to 3.8 Mg/ha.
Faculty of Technical Sciences. Novi Sad, Serbia
Department of Environmental Engineering LIGNOCELLULOSIC BIOETHANOL PRODUCTION
IN SERBIA
26
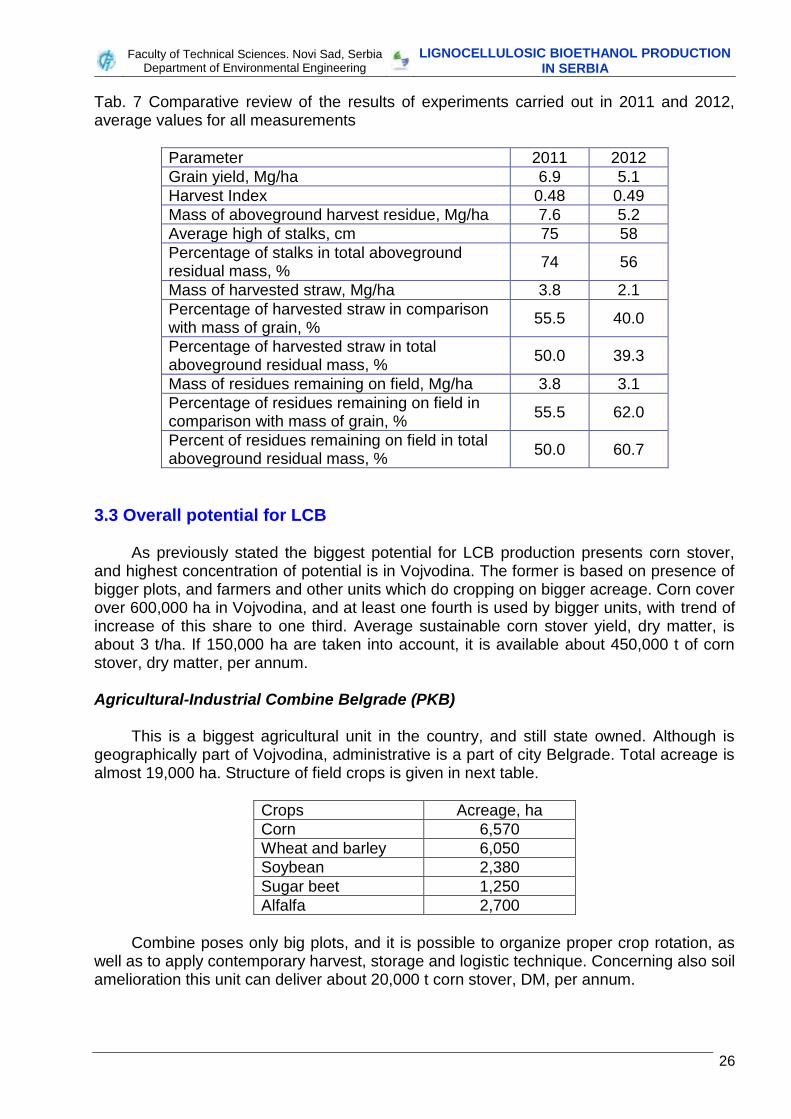
Tab. 7 Comparative review of the results of experiments carried out in 2011 and 2012, average values for all measurements
Parameter 2011 2012
Grain yield, Mg/ha 6.9 5.1
Harvest Index 0.48 0.49
Mass of aboveground harvest residue, Mg/ha 7.6 5.2
Average high of stalks, cm 75 58
Percentage of stalks in total aboveground residual mass, %
74 56
Mass of harvested straw, Mg/ha 3.8 2.1
Percentage of harvested straw in comparison with mass of grain, %
55.5 40.0
Percentage of harvested straw in total aboveground residual mass, %
50.0 39.3
Mass of residues remaining on field, Mg/ha 3.8 3.1
Percentage of residues remaining on field in comparison with mass of grain, %
55.5 62.0
Percent of residues remaining on field in total aboveground residual mass, %
50.0 60.7
3.3 Overall potential for LCB
As previously stated the biggest potential for LCB production presents corn stover, and highest concentration of potential is in Vojvodina. The former is based on presence of bigger plots, and farmers and other units which do cropping on bigger acreage. Corn cover over 600,000 ha in Vojvodina, and at least one fourth is used by bigger units, with trend of increase of this share to one third. Average sustainable corn stover yield, dry matter, is about 3 t/ha. If 150,000 ha are taken into account, it is available about 450,000 t of corn stover, dry matter, per annum. Agricultural-Industrial Combine Belgrade (PKB)
This is a biggest agricultural unit in the country, and still state owned. Although is geographically part of Vojvodina, administrative is a part of city Belgrade. Total acreage is almost 19,000 ha. Structure of field crops is given in next table.
Crops Acreage, ha
Corn 6,570
Wheat and barley 6,050
Soybean 2,380
Sugar beet 1,250
Alfalfa 2,700
Combine poses only big plots, and it is possible to organize proper crop rotation, as
well as to apply contemporary harvest, storage and logistic technique. Concerning also soil amelioration this unit can deliver about 20,000 t corn stover, DM, per annum.
Faculty of Technical Sciences. Novi Sad, Serbia
Department of Environmental Engineering LIGNOCELLULOSIC BIOETHANOL PRODUCTION
IN SERBIA
27
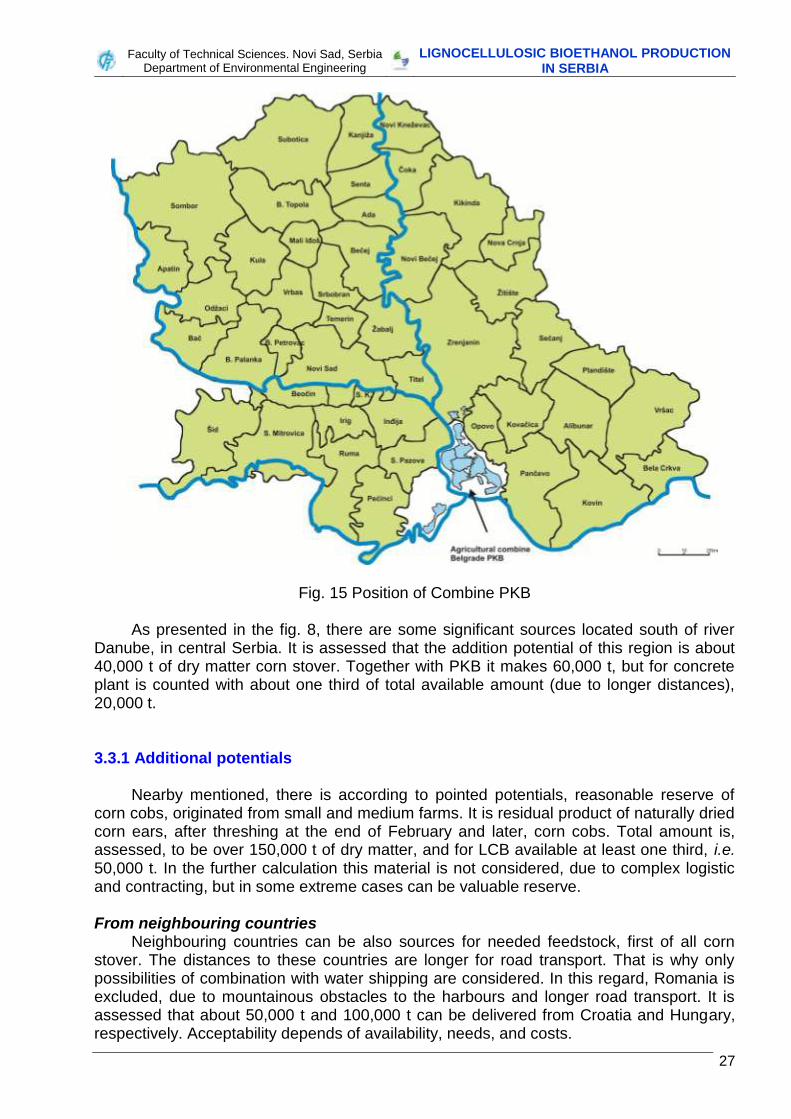
Fig. 15 Position of Combine PKB
As presented in the fig. 8, there are some significant sources located south of river Danube, in central Serbia. It is assessed that the addition potential of this region is about 40,000 t of dry matter corn stover. Together with PKB it makes 60,000 t, but for concrete plant is counted with about one third of total available amount (due to longer distances), 20,000 t. 3.3.1 Additional potentials
Nearby mentioned, there is according to pointed potentials, reasonable reserve of corn cobs, originated from small and medium farms. It is residual product of naturally dried corn ears, after threshing at the end of February and later, corn cobs. Total amount is, assessed, to be over 150,000 t of dry matter, and for LCB available at least one third, i.e. 50,000 t. In the further calculation this material is not considered, due to complex logistic and contracting, but in some extreme cases can be valuable reserve. From neighbouring countries
Neighbouring countries can be also sources for needed feedstock, first of all corn stover. The distances to these countries are longer for road transport. That is why only possibilities of combination with water shipping are considered. In this regard, Romania is excluded, due to mountainous obstacles to the harbours and longer road transport. It is assessed that about 50,000 t and 100,000 t can be delivered from Croatia and Hungary, respectively. Acceptability depends of availability, needs, and costs.
Faculty of Technical Sciences. Novi Sad, Serbia
Department of Environmental Engineering LIGNOCELLULOSIC BIOETHANOL PRODUCTION
IN SERBIA
28
Wheat straw
Cereal straw, firstly wheat, has also considerable potential. This is in Vojvodina and part of central Serbia about 100,000 t. However, cereal straw is used for other purposes, as a feedstock for pelletizing, and general for thermal conversion. Other potential problem will be change of LCB production, due to need of other enzymes, although one of plant is declared to be rather suitable for utilization of diverse lignocellulosic materials.
Notice All mentioned additional potentials can be treated as emergence, for the case of lack of corn stover, or other disturbance of supply.
Faculty of Technical Sciences. Novi Sad, Serbia
Department of Environmental Engineering LIGNOCELLULOSIC BIOETHANOL PRODUCTION
IN SERBIA
29
4. FEEDSTOCK PROCUREMENT
This is very important chapter which should result with harvest and logistic solutions, list of obstacles, barriers and possibilities of overcoming. It should include also other issues related to supply security, impact on soil fertility, storage, contracting, expected prices, etc.
Feedstock procurement, provision, consists, in the case of biofuels, of:
1. Collection of crop residues on the field. 2. Loading of feedstock to the transport vehicle. 3. Transport to the primary storage. 4. Unloading and storing–stocking. 5. Loading to the long distance vehicle. 6. Transport to the plant storage. 7. Unloading and storing. 8. Exemption from storage, pre-processing, feeding the plant.
This list can be simplified, reduced, by merging to three groups:
A. Harvest, includes points 1-4, all operations to storing at primary storage. B. Logistic, supply chain, includes points 5-7. C. Preparatory for the process 8 (here included in pre-processing chain in the plant).
Preparatory includes all activities related to preparatory of feedstock for LCB plants. For baled material, bale disintegration and chopping to the needed particle size is included, and for silage grabbing and conveying. This part is included in activities within plant.
4.1 Collection
Today dominant type of collection is one where combine harvests ears and separates the corn kernels from the cob. Once, the corn grain is harvested the remaining corn stover is either returned to the ground and allowed to deteriorate for next year’s planting, or collected, by using multi-pass procedures, for use as animal feed and bedding. Frequently all crop residues are left on the field by common corn cropping procedures. Although it looks like it is the least work intensive method of getting rid of the excess material, there are some problems. With the development of higher yielding and more resilient hybrids of corn, the remaining crop residue is more difficult to decompose over the winter weathering which inhibits new crop planting in the spring. To solve this problem, additional passes over the field with shredders or extra tillage either in the fall or spring are needed.
At the moment, research is undertaken to efficiently collect, transport and process corn stover. In current harvest systems corn stover has been usually used as ground fodder. Currently, the multi-pass collection procedures of corn stover for livestock point up quantity rather than quality of harvested material. Yet, this principle must be abandoned to improve quality and to address sustainability concerns for the future.
Faculty of Technical Sciences. Novi Sad, Serbia
Department of Environmental Engineering LIGNOCELLULOSIC BIOETHANOL PRODUCTION
IN SERBIA
30
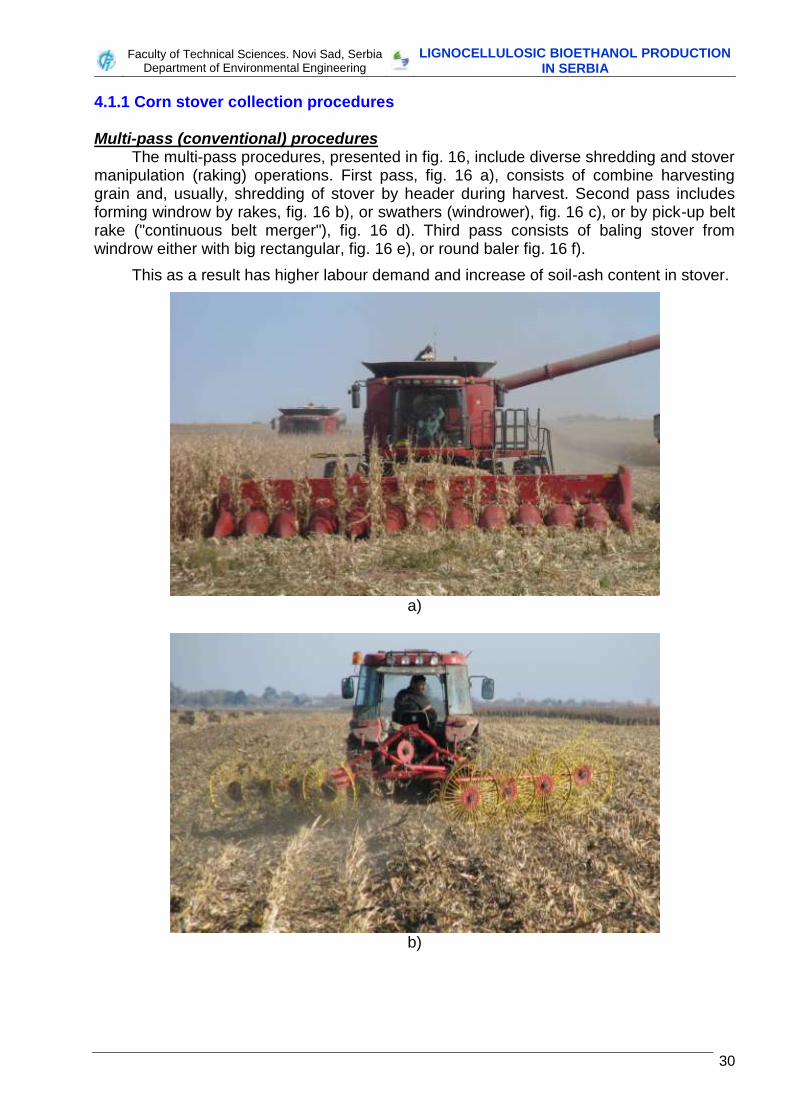
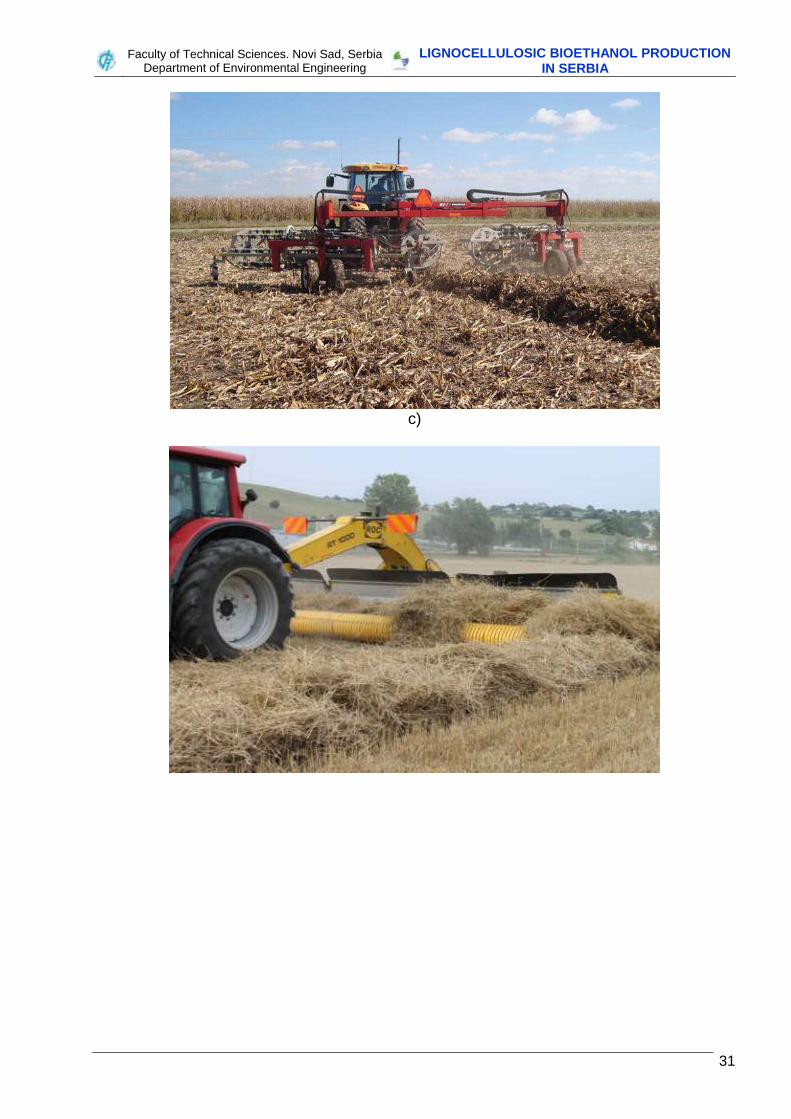
4.1.1 Corn stover collection procedures Multi-pass (conventional) procedures
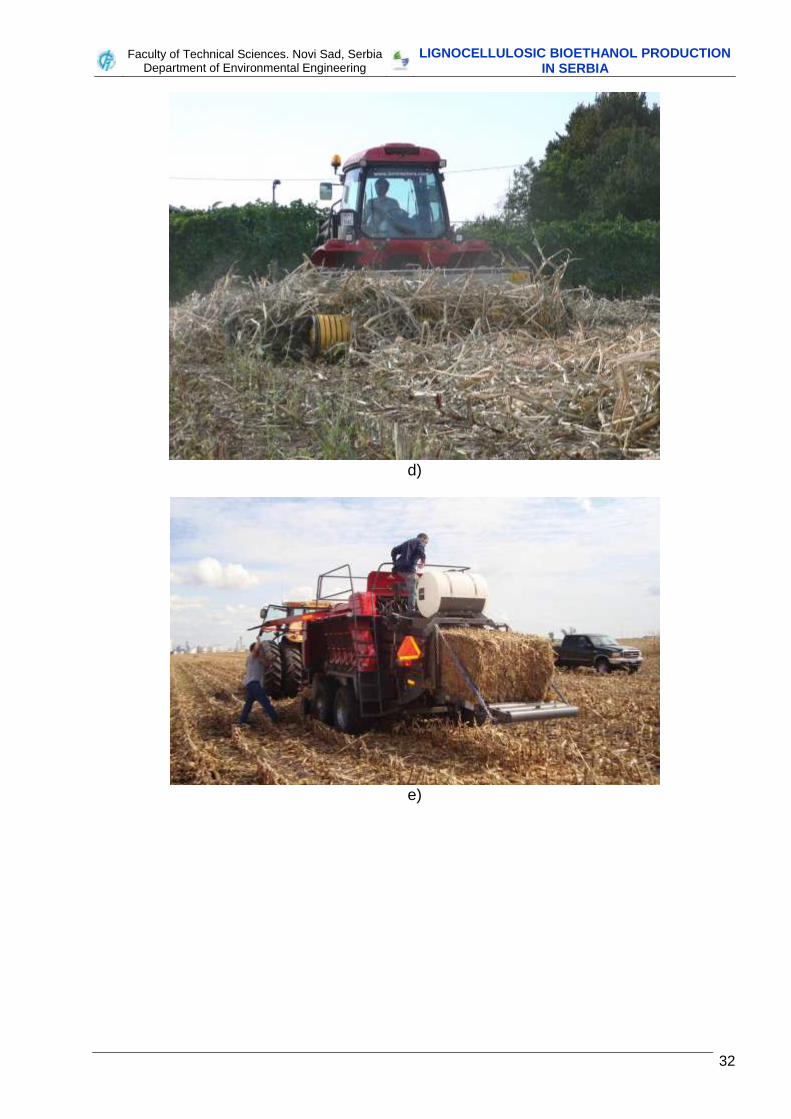
The multi-pass procedures, presented in fig. 16, include diverse shredding and stover manipulation (raking) operations. First pass, fig. 16 a), consists of combine harvesting grain and, usually, shredding of stover by header during harvest. Second pass includes forming windrow by rakes, fig. 16 b), or swathers (windrower), fig. 16 c), or by pick-up belt rake ("continuous belt merger"), fig. 16 d). Third pass consists of baling stover from windrow either with big rectangular, fig. 16 e), or round baler fig. 16 f).
This as a result has higher labour demand and increase of soil-ash content in stover.
a)
b)
Faculty of Technical Sciences. Novi Sad, Serbia
Department of Environmental Engineering LIGNOCELLULOSIC BIOETHANOL PRODUCTION
IN SERBIA
31
c)
Faculty of Technical Sciences. Novi Sad, Serbia
Department of Environmental Engineering LIGNOCELLULOSIC BIOETHANOL PRODUCTION
IN SERBIA
32
d)
e)
Faculty of Technical Sciences. Novi Sad, Serbia
Department of Environmental Engineering LIGNOCELLULOSIC BIOETHANOL PRODUCTION
IN SERBIA
33
f)
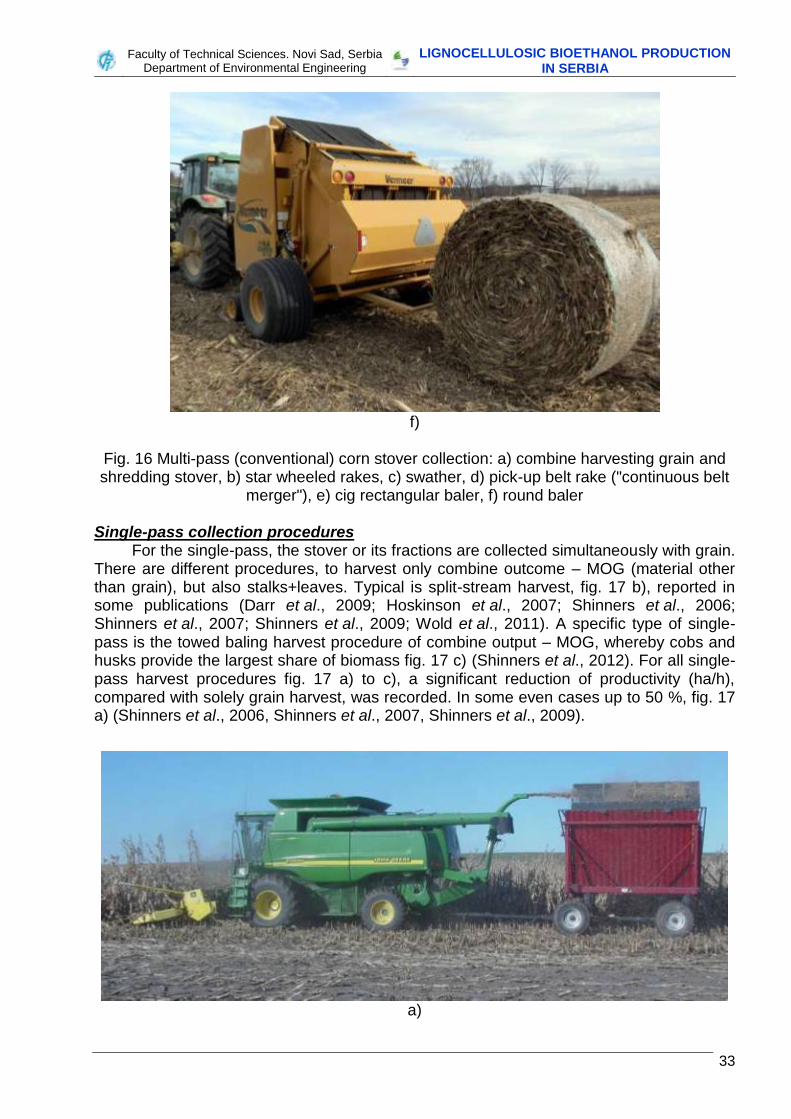
Fig. 16 Multi-pass (conventional) corn stover collection: a) combine harvesting grain and shredding stover, b) star wheeled rakes, c) swather, d) pick-up belt rake ("continuous belt
merger"), e) cig rectangular baler, f) round baler
Single-pass collection procedures For the single-pass, the stover or its fractions are collected simultaneously with grain.
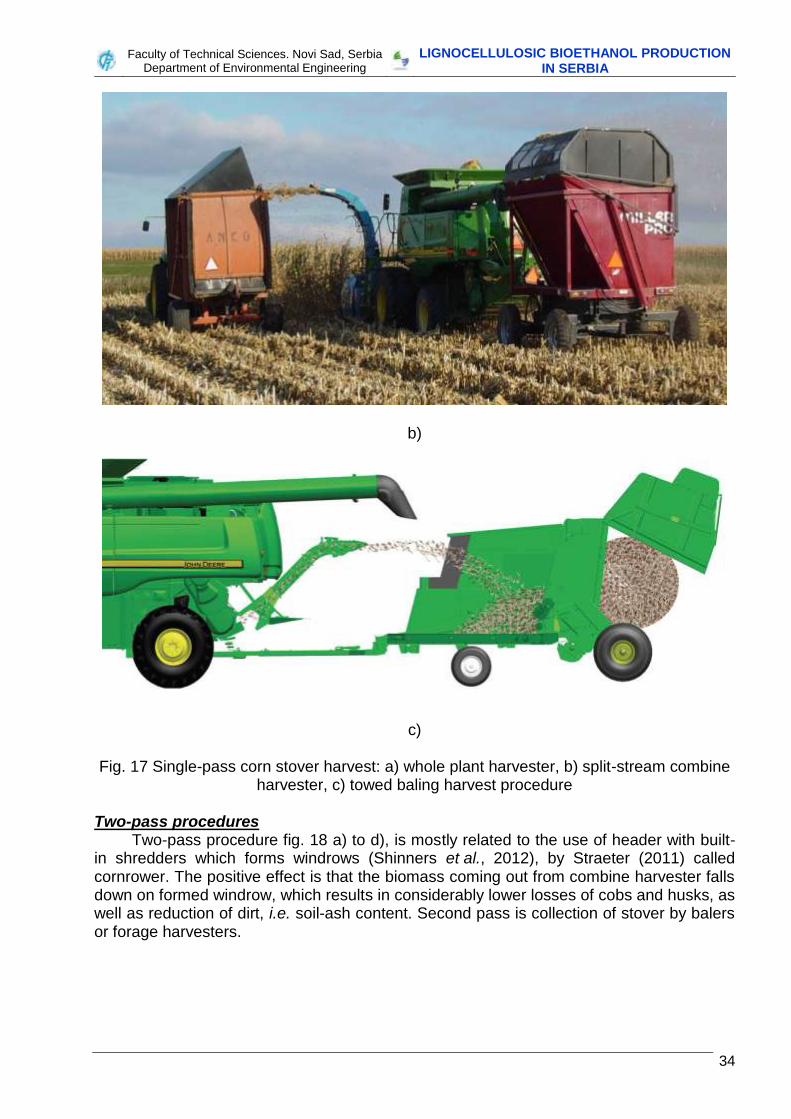
There are different procedures, to harvest only combine outcome – MOG (material other than grain), but also stalks+leaves. Typical is split-stream harvest, fig. 17 b), reported in some publications (Darr et al., 2009; Hoskinson et al., 2007; Shinners et al., 2006; Shinners et al., 2007; Shinners et al., 2009; Wold et al., 2011). A specific type of single-pass is the towed baling harvest procedure of combine output – MOG, whereby cobs and husks provide the largest share of biomass fig. 17 c) (Shinners et al., 2012). For all single-pass harvest procedures fig. 17 a) to c), a significant reduction of productivity (ha/h), compared with solely grain harvest, was recorded. In some even cases up to 50 %, fig. 17 a) (Shinners et al., 2006, Shinners et al., 2007, Shinners et al., 2009).
a)
Faculty of Technical Sciences. Novi Sad, Serbia
Department of Environmental Engineering LIGNOCELLULOSIC BIOETHANOL PRODUCTION
IN SERBIA
34
b)
c)
Fig. 17 Single-pass corn stover harvest: a) whole plant harvester, b) split-stream combine harvester, c) towed baling harvest procedure
Two-pass procedures
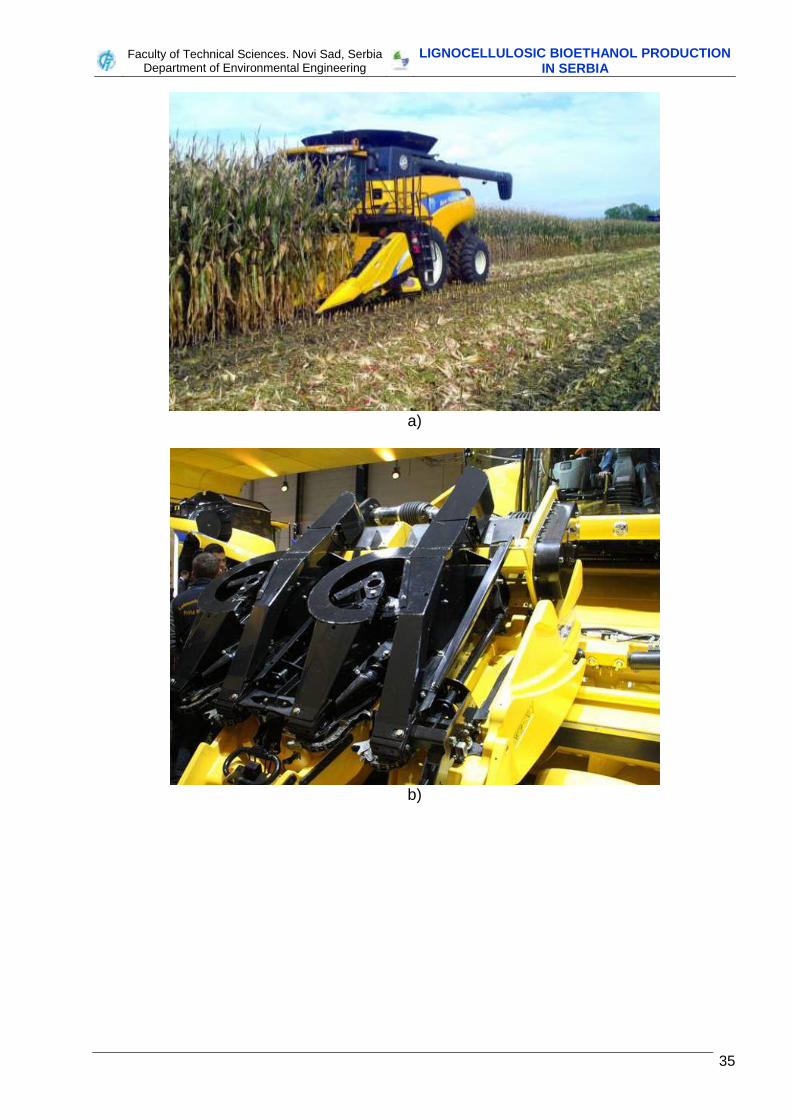
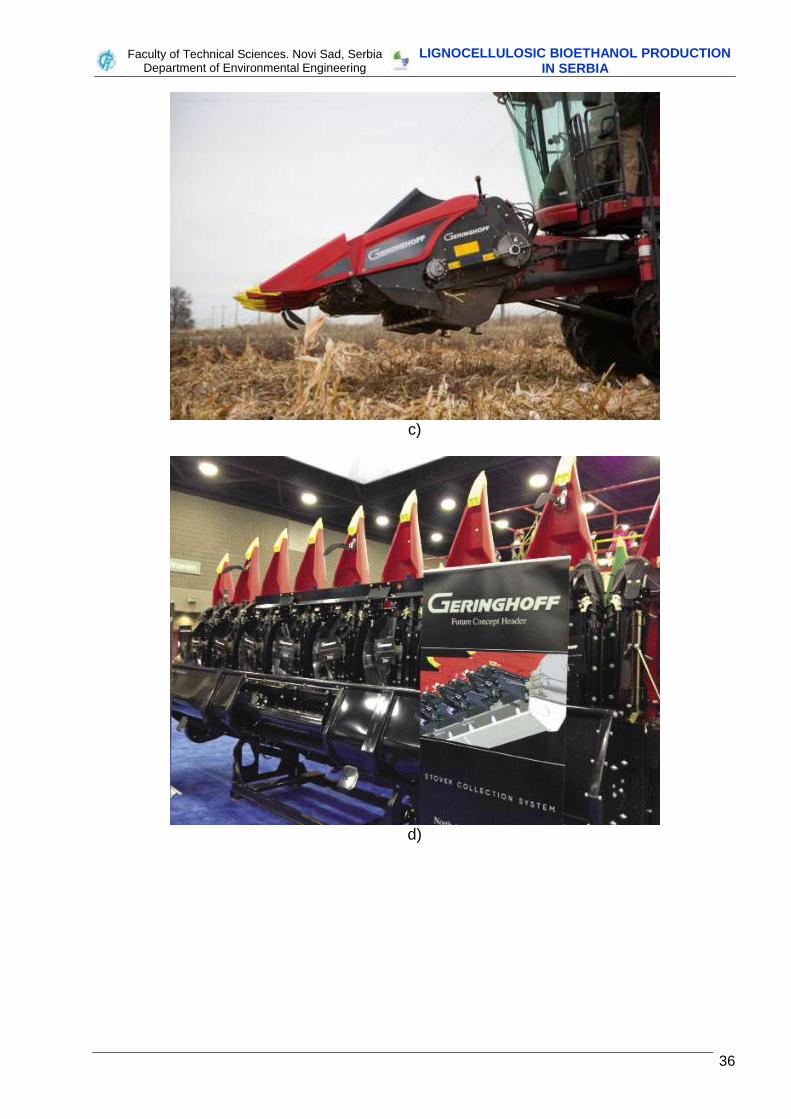
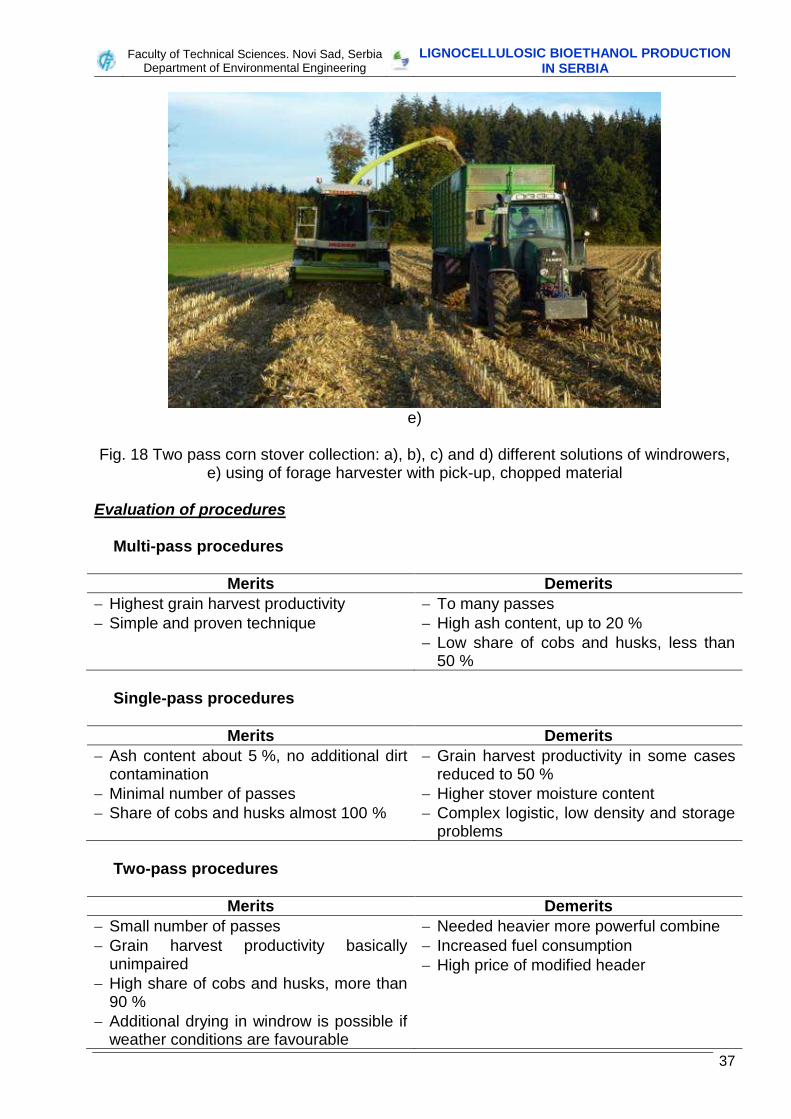
Two-pass procedure fig. 18 a) to d), is mostly related to the use of header with built-in shredders which forms windrows (Shinners et al., 2012), by Straeter (2011) called cornrower. The positive effect is that the biomass coming out from combine harvester falls down on formed windrow, which results in considerably lower losses of cobs and husks, as well as reduction of dirt, i.e. soil-ash content. Second pass is collection of stover by balers or forage harvesters.
Faculty of Technical Sciences. Novi Sad, Serbia
Department of Environmental Engineering LIGNOCELLULOSIC BIOETHANOL PRODUCTION
IN SERBIA
35
a)
b)
Faculty of Technical Sciences. Novi Sad, Serbia
Department of Environmental Engineering LIGNOCELLULOSIC BIOETHANOL PRODUCTION
IN SERBIA
36
c)
d)
Faculty of Technical Sciences. Novi Sad, Serbia
Department of Environmental Engineering LIGNOCELLULOSIC BIOETHANOL PRODUCTION
IN SERBIA
37
e)
Fig. 18 Two pass corn stover collection: a), b), c) and d) different solutions of windrowers, e) using of forage harvester with pick-up, chopped material
Evaluation of procedures
Multi-pass procedures
Merits Demerits
Highest grain harvest productivity
Simple and proven technique
To many passes
High ash content, up to 20 %
Low share of cobs and husks, less than 50 %
Single-pass procedures
Merits Demerits
Ash content about 5 %, no additional dirt contamination
Minimal number of passes
Share of cobs and husks almost 100 %
Grain harvest productivity in some cases reduced to 50 %
Higher stover moisture content
Complex logistic, low density and storage problems
Two-pass procedures
Merits Demerits
Small number of passes
Grain harvest productivity basically unimpaired
High share of cobs and husks, more than 90 %
Additional drying in windrow is possible if weather conditions are favourable
Needed heavier more powerful combine
Increased fuel consumption
High price of modified header
Faculty of Technical Sciences. Novi Sad, Serbia
Department of Environmental Engineering LIGNOCELLULOSIC BIOETHANOL PRODUCTION
IN SERBIA
38
The two procedures that have emerged as possible solutions to maximize collection and harvest of corn are the two-pass windrower procedure Straeter (2011) and the towed baling (single-pass) procedure Shinners et al. (2012). Both procedures have been analyzed but no production scale economic studies have been produced that can be used by the producer or end user to determine the applicability of this technology. Production scale economic and productivity data will help establish the predicted economic value of corn stover to the producer to ensure a profit for the extra work that will come along with collecting corn stover. There was also very little data collected to evaluate the effects of the additional stover harvested, weather conditions, and collection procedures on the productivity of the combine. The lack of this information can lead to inaccurate predictions of collection costs. It can also hinder further investigation into procedures which can improve harvesting.
Obviously the activities related to corn stover collection are very intensive, and some new developments are promising. It seems that two pass procedure, including formation of windrow, can offer good performances and fair quality. Further improvements should be related toward:
1. Increase of productivity. 2. Reduction of moisture content of stover (e.g. on field drying if possible). 3. Increase of process quality.
We stated following milestones for the process performances quality: 1. Soiling, contamination of stover by soil, must not overcome limit of about 5 %, or total ash content, including minerals in stover limit is 10 %. 2. Stover collection must not significantly impact corn grain harvest productivity. Reduction of productivity should be as low as possible – upper limit is 10 %. 3. Additional grain losses, due stover harvest, must be under 0.5 %.
One collection possibility, but only for very small distances to the LCB plant, e.g. up
to 10 km, and for supply during collection season, is to collect corn stover, from windrow, by forage harvester. In this case is material already prepared for processing. For the certain period, e.g. up to one month, this stover can be stored in trench silos. This solution can have advantages and should be considered. POET-DSM collection procedure
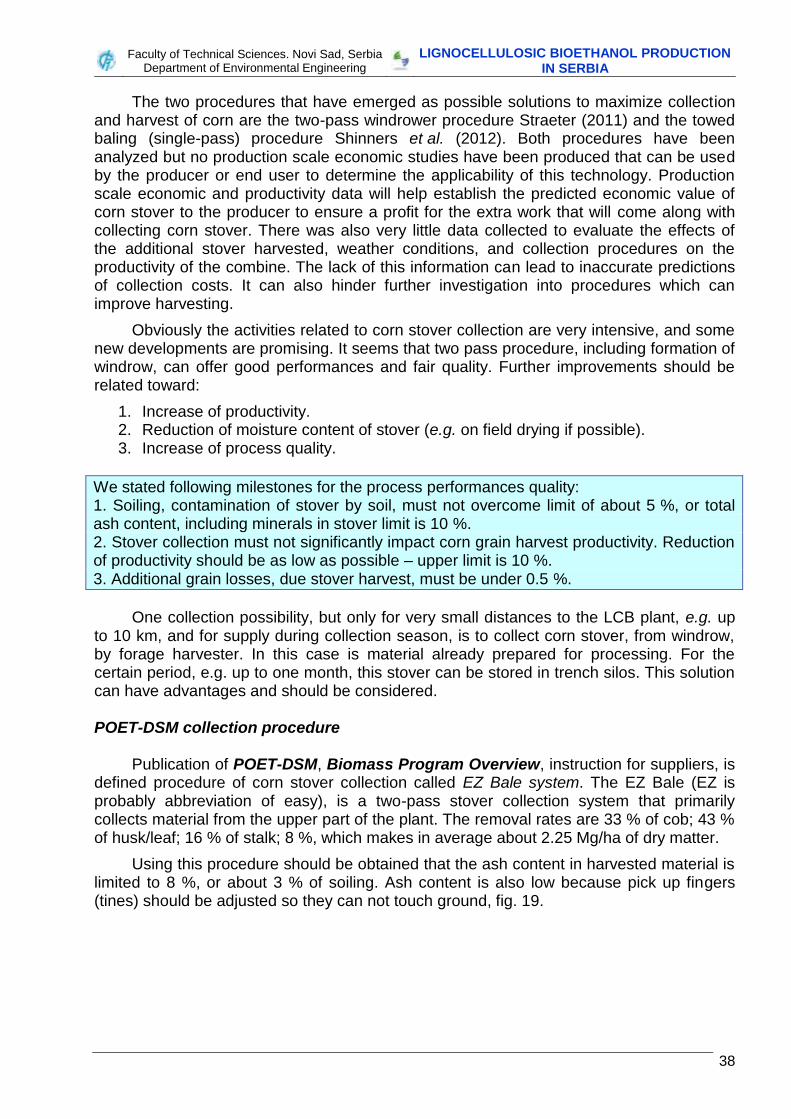
Publication of POET-DSM, Biomass Program Overview, instruction for suppliers, is defined procedure of corn stover collection called EZ Bale system. The EZ Bale (EZ is probably abbreviation of easy), is a two-pass stover collection system that primarily collects material from the upper part of the plant. The removal rates are 33 % of cob; 43 % of husk/leaf; 16 % of stalk; 8 %, which makes in average about 2.25 Mg/ha of dry matter.
Using this procedure should be obtained that the ash content in harvested material is limited to 8 %, or about 3 % of soiling. Ash content is also low because pick up fingers (tines) should be adjusted so they can not touch ground, fig. 19.
Faculty of Technical Sciences. Novi Sad, Serbia
Department of Environmental Engineering LIGNOCELLULOSIC BIOETHANOL PRODUCTION
IN SERBIA
39
Fig. 19 Setting correct baler pickup height
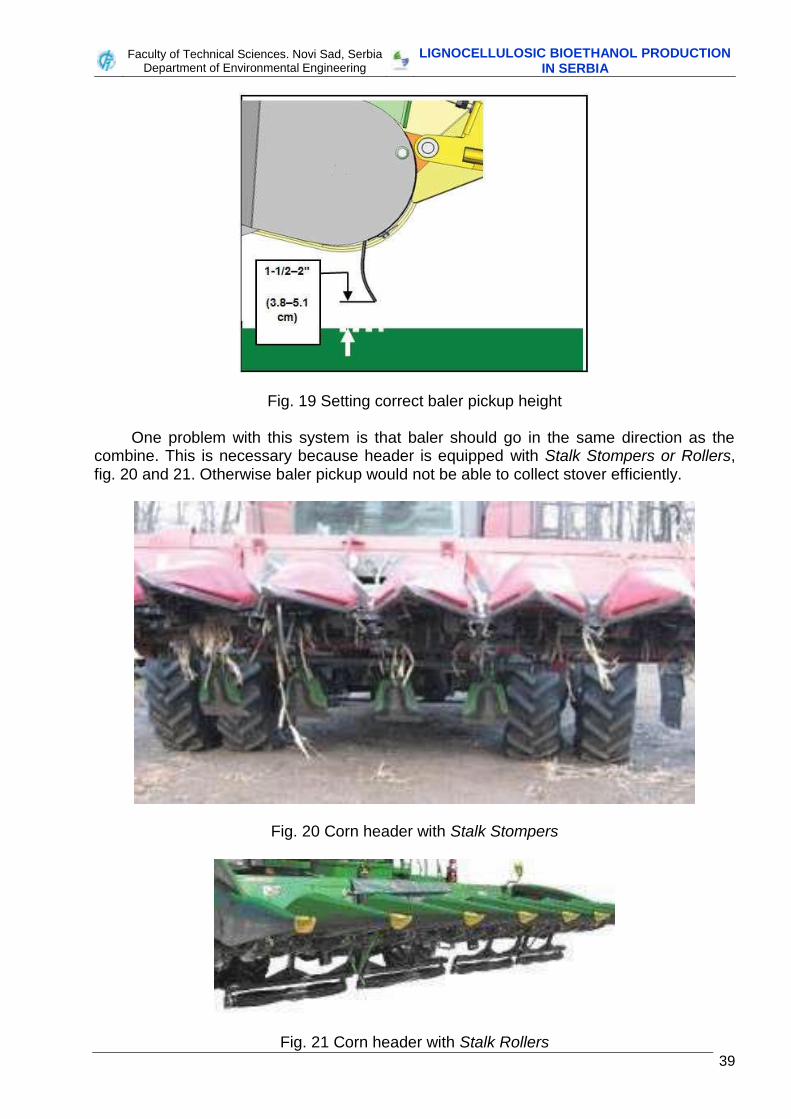
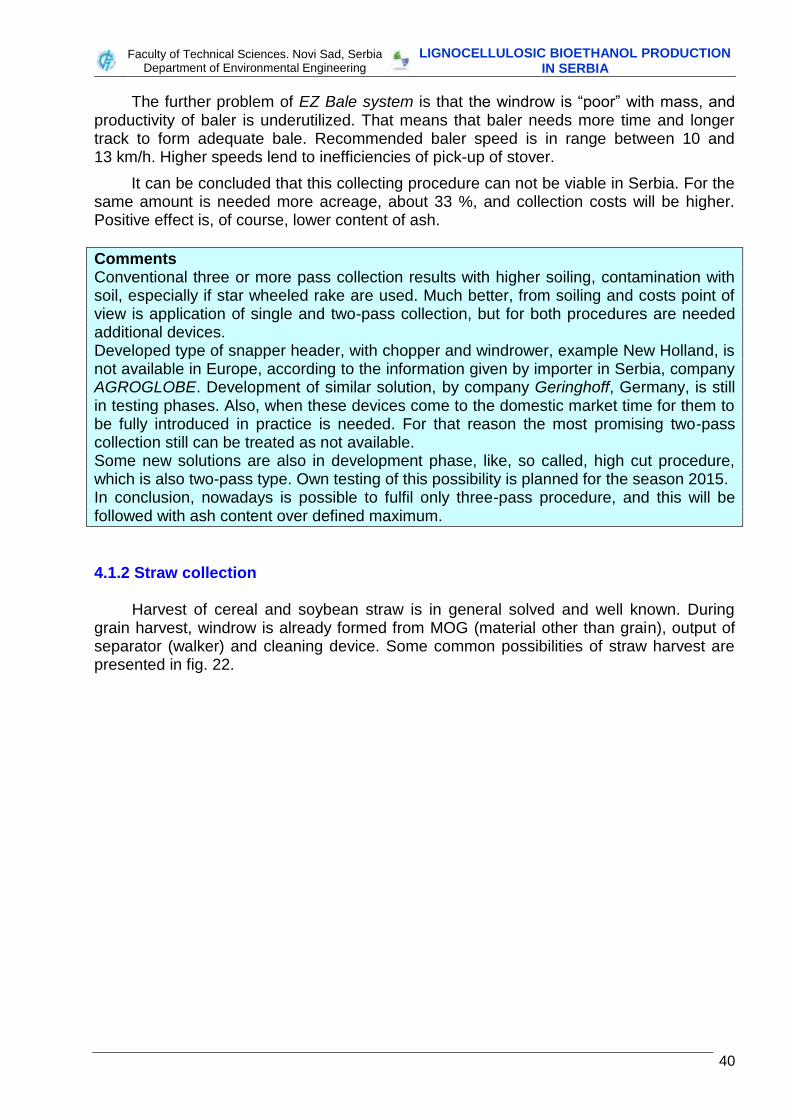
One problem with this system is that baler should go in the same direction as the combine. This is necessary because header is equipped with Stalk Stompers or Rollers, fig. 20 and 21. Otherwise baler pickup would not be able to collect stover efficiently.
Fig. 20 Corn header with Stalk Stompers
Fig. 21 Corn header with Stalk Rollers
Faculty of Technical Sciences. Novi Sad, Serbia
Department of Environmental Engineering LIGNOCELLULOSIC BIOETHANOL PRODUCTION
IN SERBIA
40
The further problem of EZ Bale system is that the windrow is “poor” with mass, and productivity of baler is underutilized. That means that baler needs more time and longer track to form adequate bale. Recommended baler speed is in range between 10 and 13 km/h. Higher speeds lend to inefficiencies of pick-up of stover.
It can be concluded that this collecting procedure can not be viable in Serbia. For the same amount is needed more acreage, about 33 %, and collection costs will be higher. Positive effect is, of course, lower content of ash.
Comments Conventional three or more pass collection results with higher soiling, contamination with soil, especially if star wheeled rake are used. Much better, from soiling and costs point of view is application of single and two-pass collection, but for both procedures are needed additional devices. Developed type of snapper header, with chopper and windrower, example New Holland, is not available in Europe, according to the information given by importer in Serbia, company AGROGLOBE. Development of similar solution, by company Geringhoff, Germany, is still in testing phases. Also, when these devices come to the domestic market time for them to be fully introduced in practice is needed. For that reason the most promising two-pass collection still can be treated as not available. Some new solutions are also in development phase, like, so called, high cut procedure, which is also two-pass type. Own testing of this possibility is planned for the season 2015. In conclusion, nowadays is possible to fulfil only three-pass procedure, and this will be followed with ash content over defined maximum.
4.1.2 Straw collection
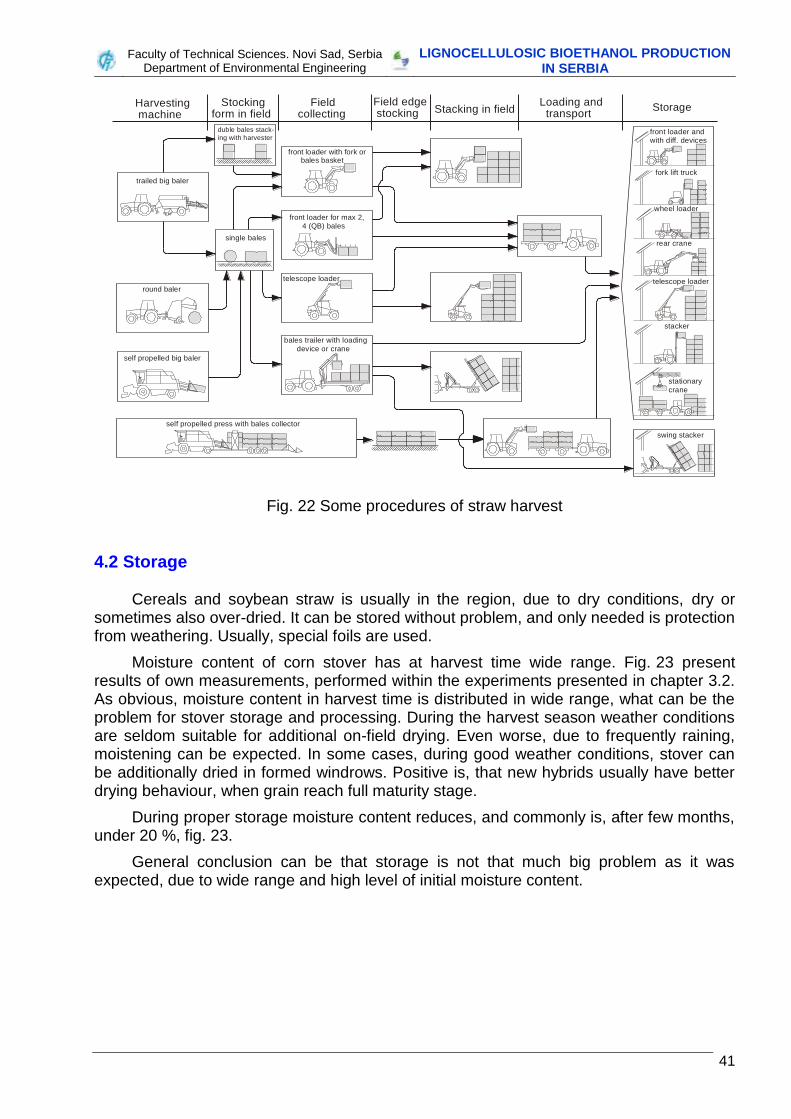
Harvest of cereal and soybean straw is in general solved and well known. During grain harvest, windrow is already formed from MOG (material other than grain), output of separator (walker) and cleaning device. Some common possibilities of straw harvest are presented in fig. 22.
Faculty of Technical Sciences. Novi Sad, Serbia
Department of Environmental Engineering LIGNOCELLULOSIC BIOETHANOL PRODUCTION
IN SERBIA
41
Harvesting machine
Stocking form in field
Fieldcollecting
Field edge stocking Stacking in field
Loading and transport
Storage
trailed big baler
front loader with fork or bales basket
duble bales stack-
ing with harvester
telescope loader
rear crane
stacker
stationary
crane
swing stacker
wheel loader
fork lift truck
front loader andwith diff. devices
front loader for max 2,
4 (QB) bales
single bales
telescope loader
bales trailer with loading
device or crane
round baler
self propelled big baler
self propelled press with bales collector
Fig. 22 Some procedures of straw harvest
4.2 Storage
Cereals and soybean straw is usually in the region, due to dry conditions, dry or sometimes also over-dried. It can be stored without problem, and only needed is protection from weathering. Usually, special foils are used.
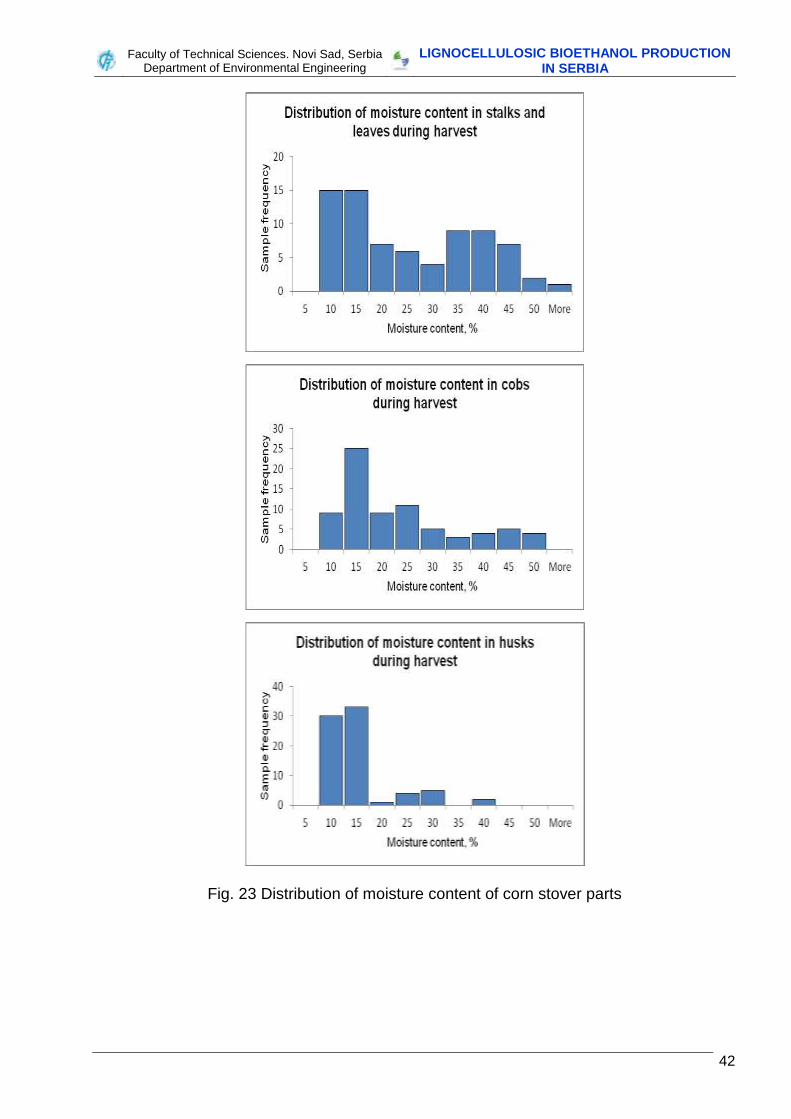
Moisture content of corn stover has at harvest time wide range. Fig. 23 present results of own measurements, performed within the experiments presented in chapter 3.2. As obvious, moisture content in harvest time is distributed in wide range, what can be the problem for stover storage and processing. During the harvest season weather conditions are seldom suitable for additional on-field drying. Even worse, due to frequently raining, moistening can be expected. In some cases, during good weather conditions, stover can be additionally dried in formed windrows. Positive is, that new hybrids usually have better drying behaviour, when grain reach full maturity stage.
During proper storage moisture content reduces, and commonly is, after few months, under 20 %, fig. 23.
General conclusion can be that storage is not that much big problem as it was expected, due to wide range and high level of initial moisture content.
Faculty of Technical Sciences. Novi Sad, Serbia
Department of Environmental Engineering LIGNOCELLULOSIC BIOETHANOL PRODUCTION
IN SERBIA
42
Fig. 23 Distribution of moisture content of corn stover parts
Faculty of Technical Sciences. Novi Sad, Serbia
Department of Environmental Engineering LIGNOCELLULOSIC BIOETHANOL PRODUCTION
IN SERBIA
43
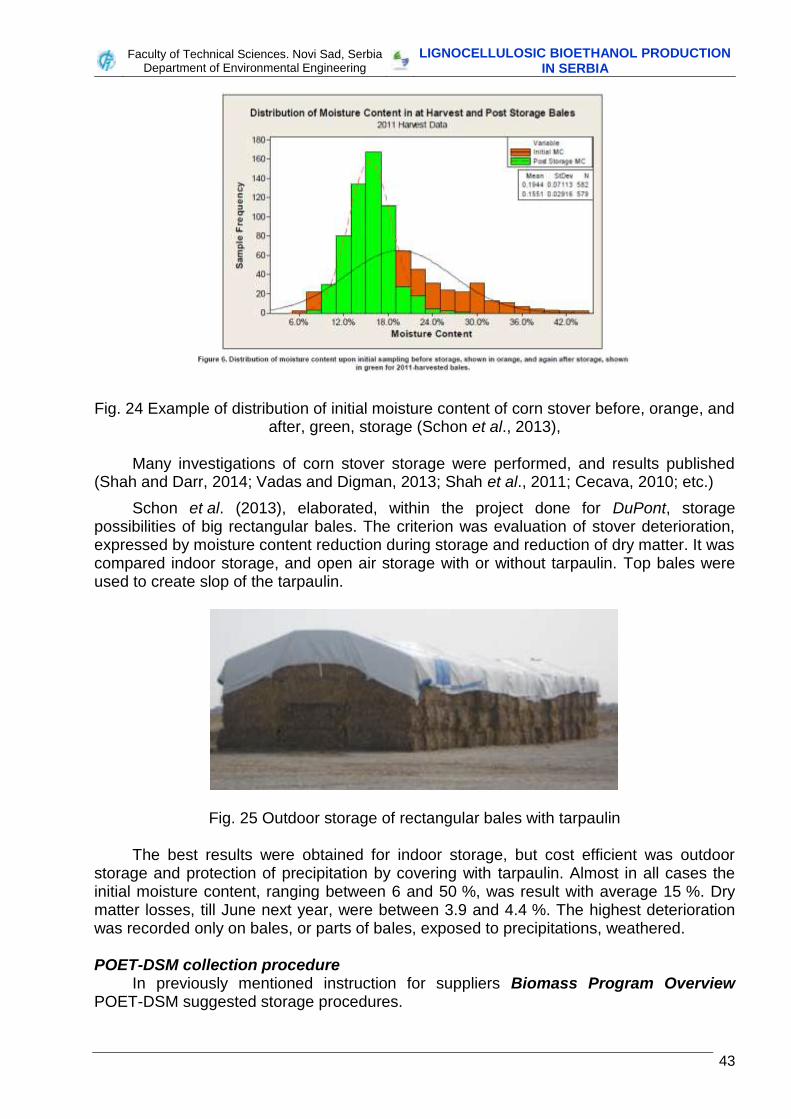
Fig. 24 Example of distribution of initial moisture content of corn stover before, orange, and after, green, storage (Schon et al., 2013),
Many investigations of corn stover storage were performed, and results published
(Shah and Darr, 2014; Vadas and Digman, 2013; Shah et al., 2011; Cecava, 2010; etc.)
Schon et al. (2013), elaborated, within the project done for DuPont, storage possibilities of big rectangular bales. The criterion was evaluation of stover deterioration, expressed by moisture content reduction during storage and reduction of dry matter. It was compared indoor storage, and open air storage with or without tarpaulin. Top bales were used to create slop of the tarpaulin.
Fig. 25 Outdoor storage of rectangular bales with tarpaulin
The best results were obtained for indoor storage, but cost efficient was outdoor storage and protection of precipitation by covering with tarpaulin. Almost in all cases the initial moisture content, ranging between 6 and 50 %, was result with average 15 %. Dry matter losses, till June next year, were between 3.9 and 4.4 %. The highest deterioration was recorded only on bales, or parts of bales, exposed to precipitations, weathered.
POET-DSM collection procedure
In previously mentioned instruction for suppliers Biomass Program Overview POET-DSM suggested storage procedures.
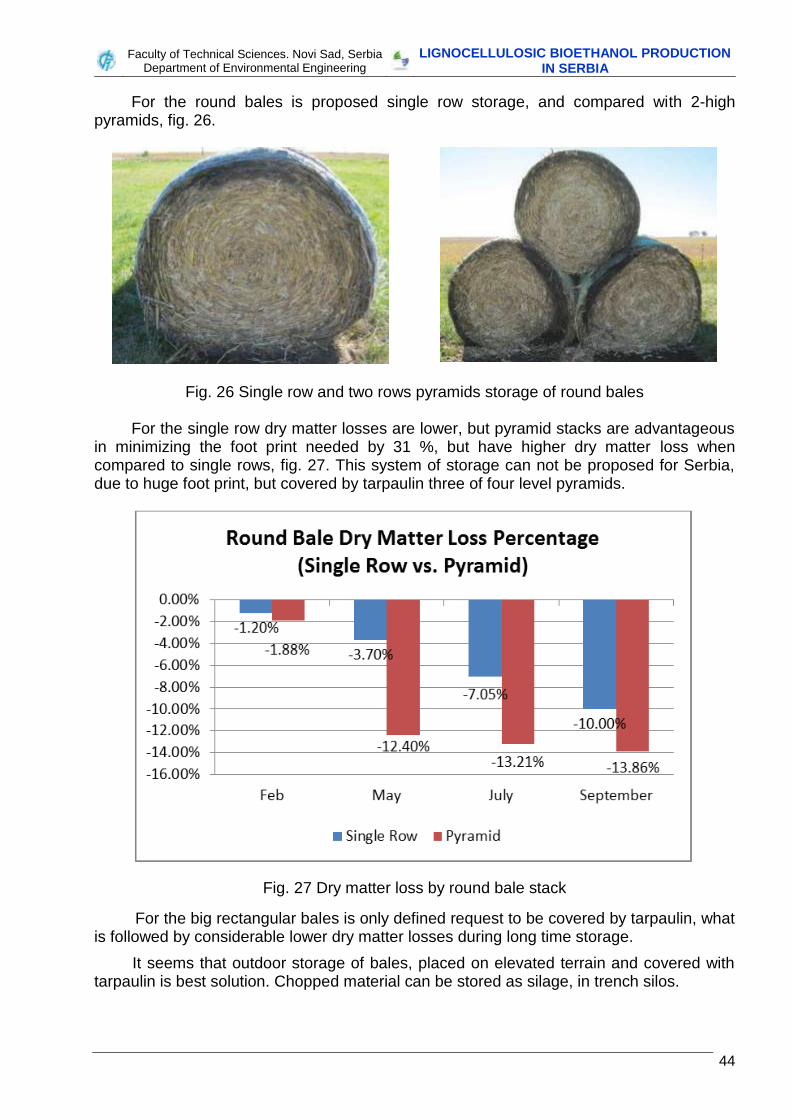
Faculty of Technical Sciences. Novi Sad, Serbia
Department of Environmental Engineering LIGNOCELLULOSIC BIOETHANOL PRODUCTION
IN SERBIA
44
For the round bales is proposed single row storage, and compared with 2-high pyramids, fig. 26.
Fig. 26 Single row and two rows pyramids storage of round bales
For the single row dry matter losses are lower, but pyramid stacks are advantageous in minimizing the foot print needed by 31 %, but have higher dry matter loss when compared to single rows, fig. 27. This system of storage can not be proposed for Serbia, due to huge foot print, but covered by tarpaulin three of four level pyramids.
Fig. 27 Dry matter loss by round bale stack
For the big rectangular bales is only defined request to be covered by tarpaulin, what is followed by considerable lower dry matter losses during long time storage.
It seems that outdoor storage of bales, placed on elevated terrain and covered with tarpaulin is best solution. Chopped material can be stored as silage, in trench silos.
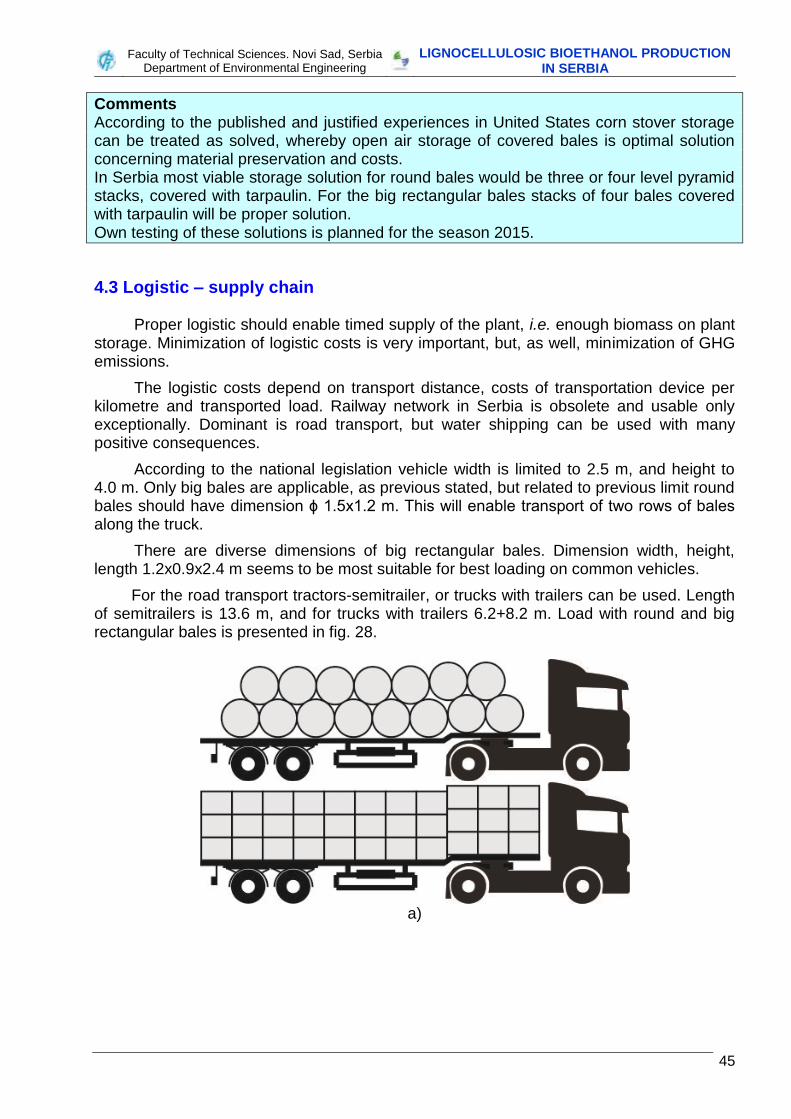
Faculty of Technical Sciences. Novi Sad, Serbia
Department of Environmental Engineering LIGNOCELLULOSIC BIOETHANOL PRODUCTION
IN SERBIA
45
Comments According to the published and justified experiences in United States corn stover storage can be treated as solved, whereby open air storage of covered bales is optimal solution concerning material preservation and costs. In Serbia most viable storage solution for round bales would be three or four level pyramid stacks, covered with tarpaulin. For the big rectangular bales stacks of four bales covered with tarpaulin will be proper solution. Own testing of these solutions is planned for the season 2015.
4.3 Logistic – supply chain
Proper logistic should enable timed supply of the plant, i.e. enough biomass on plant storage. Minimization of logistic costs is very important, but, as well, minimization of GHG emissions.
The logistic costs depend on transport distance, costs of transportation device per kilometre and transported load. Railway network in Serbia is obsolete and usable only exceptionally. Dominant is road transport, but water shipping can be used with many positive consequences.
According to the national legislation vehicle width is limited to 2.5 m, and height to 4.0 m. Only big bales are applicable, as previous stated, but related to previous limit round bales should have dimension ϕ 1.5x1.2 m. This will enable transport of two rows of bales along the truck.
There are diverse dimensions of big rectangular bales. Dimension width, height, length 1.2x0.9x2.4 m seems to be most suitable for best loading on common vehicles.
For the road transport tractors-semitrailer, or trucks with trailers can be used. Length of semitrailers is 13.6 m, and for trucks with trailers 6.2+8.2 m. Load with round and big rectangular bales is presented in fig. 28.
a)
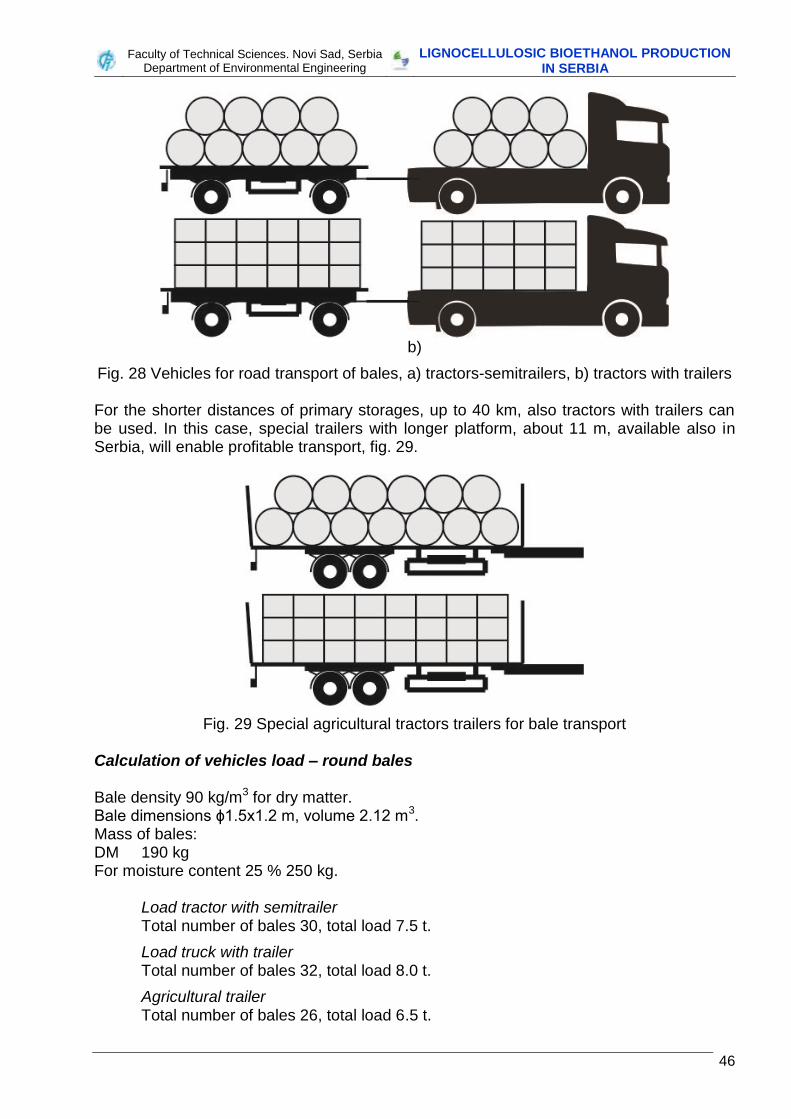
Faculty of Technical Sciences. Novi Sad, Serbia
Department of Environmental Engineering LIGNOCELLULOSIC BIOETHANOL PRODUCTION
IN SERBIA
46
b)
Fig. 28 Vehicles for road transport of bales, a) tractors-semitrailers, b) tractors with trailers For the shorter distances of primary storages, up to 40 km, also tractors with trailers can be used. In this case, special trailers with longer platform, about 11 m, available also in Serbia, will enable profitable transport, fig. 29.
Fig. 29 Special agricultural tractors trailers for bale transport Calculation of vehicles load – round bales Bale density 90 kg/m3 for dry matter. Bale dimensions ϕ1.5x1.2 m, volume 2.12 m3. Mass of bales: DM 190 kg For moisture content 25 % 250 kg.
Load tractor with semitrailer Total number of bales 30, total load 7.5 t.
Load truck with trailer Total number of bales 32, total load 8.0 t.
Agricultural trailer Total number of bales 26, total load 6.5 t.
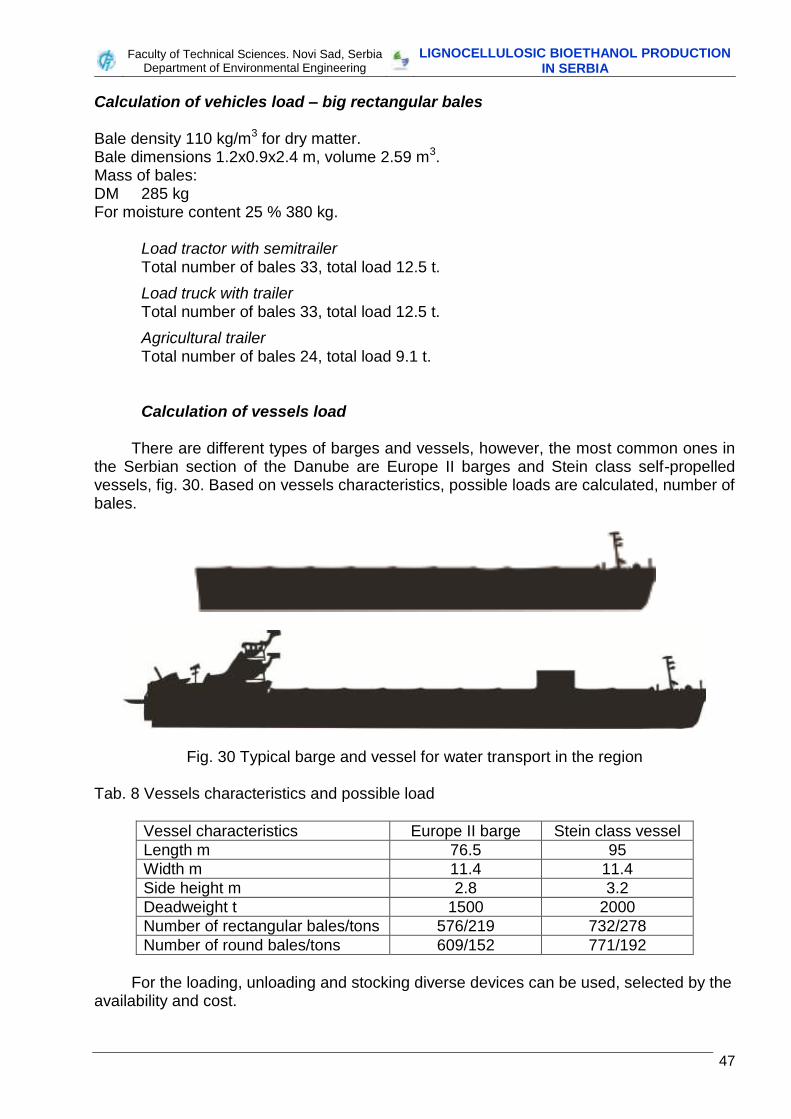
Faculty of Technical Sciences. Novi Sad, Serbia
Department of Environmental Engineering LIGNOCELLULOSIC BIOETHANOL PRODUCTION
IN SERBIA
47
Calculation of vehicles load – big rectangular bales Bale density 110 kg/m3 for dry matter. Bale dimensions 1.2x0.9x2.4 m, volume 2.59 m3. Mass of bales: DM 285 kg For moisture content 25 % 380 kg.
Load tractor with semitrailer Total number of bales 33, total load 12.5 t.
Load truck with trailer Total number of bales 33, total load 12.5 t.
Agricultural trailer Total number of bales 24, total load 9.1 t. Calculation of vessels load
There are different types of barges and vessels, however, the most common ones in
the Serbian section of the Danube are Europe II barges and Stein class self-propelled vessels, fig. 30. Based on vessels characteristics, possible loads are calculated, number of bales.
Fig. 30 Typical barge and vessel for water transport in the region Tab. 8 Vessels characteristics and possible load
Vessel characteristics Europe II barge Stein class vessel
Length m 76.5 95
Width m 11.4 11.4
Side height m 2.8 3.2
Deadweight t 1500 2000
Number of rectangular bales/tons 576/219 732/278
Number of round bales/tons 609/152 771/192
For the loading, unloading and stocking diverse devices can be used, selected by the
availability and cost.
Faculty of Technical Sciences. Novi Sad, Serbia
Department of Environmental Engineering LIGNOCELLULOSIC BIOETHANOL PRODUCTION
IN SERBIA
48
4.4 Supply security issues
For the uninterrupted continuous production, proper amount of feedstock of adequate quality and continuous, timely supply, are needed. Contracting
First task is to ensure proper quality and quantity of feedstock for all-around-the-year operation of the plant. This means that plant work in full capacity, plus some reserve. This amount should be contracted, but all eventual missing delivery calculated, taken into consideration. The best case is to contract big farms, with stable production, and application of contemporary agro technology. This also reduces risk of supply.
Price of feedstock offered to the suppliers also plays important role. Farmers, suppliers, will be ready to supply under favourable contractual conditions. The principle, question of market, is, if the WTP price (willingness to pay) of buyer, at the same time can be farmersʼ WTA price (willingness to accept). In this case, it can be carried out. WTP should cover all farmers’ costs and some revenue. Details are discussed in chapter 5.
Farmers all around the world are specific population. They are always suspicious, especially if some bad experiences are known. These are also bad examples with negative impact on supply contracting in the future.
Company Victoria Group, from Serbia, planned to step into investment of biomass CHP or electricity power plants and motivated some suppliers to start with the collection of straw. Afterwards they decided to withdraw and farmers lost invested money and engagement.
The other example is company BPI – Bridge Power Investment, from Czech Republic, which started with the plant for manufacturing agro pellets based on wheat straw and corn stover. It was planned to use 100,000 t/a. The investor had no experiences in this field and was faced with many technical problems. It seems that they collapsed, and farmers are not paid for their delivery.
Comments Contracting is important for the feedstock supply, and part of procurement chain. Priority for contracting should have big suppliers, 1,000 t/a and more. Contractors can be farmers, but also enterprises involved in collection of corn stover and other crop residues.
Yield fluctuation
Yield of corn and crop residues vary depending on climate conditions and other influences, e.g. crop diseases, pest attacks etc. This can be treated as force majeure. In the year 2014, negative case happened seldom, to high level of precipitation and partly flooding.
As it was demonstrated by our experiments, extreme drought caused considerable reduction of harvestable mass of corn stover. Based on data of own measurements, chapter 3, are presented fluctuation for acceptable collection procedures, 2 and 3, fig. 31 and 32.
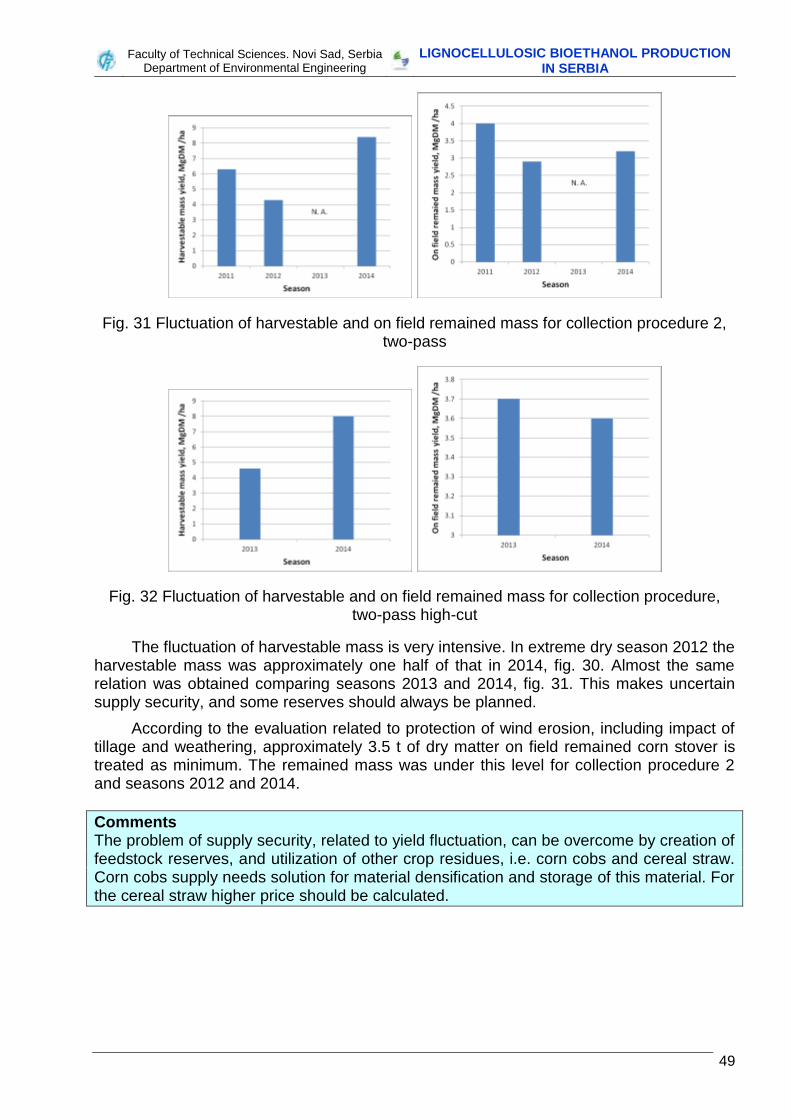
Faculty of Technical Sciences. Novi Sad, Serbia
Department of Environmental Engineering LIGNOCELLULOSIC BIOETHANOL PRODUCTION
IN SERBIA
49
Fig. 31 Fluctuation of harvestable and on field remained mass for collection procedure 2, two-pass
Fig. 32 Fluctuation of harvestable and on field remained mass for collection procedure, two-pass high-cut
The fluctuation of harvestable mass is very intensive. In extreme dry season 2012 the harvestable mass was approximately one half of that in 2014, fig. 30. Almost the same relation was obtained comparing seasons 2013 and 2014, fig. 31. This makes uncertain supply security, and some reserves should always be planned.
According to the evaluation related to protection of wind erosion, including impact of tillage and weathering, approximately 3.5 t of dry matter on field remained corn stover is treated as minimum. The remained mass was under this level for collection procedure 2 and seasons 2012 and 2014.
Comments The problem of supply security, related to yield fluctuation, can be overcome by creation of feedstock reserves, and utilization of other crop residues, i.e. corn cobs and cereal straw. Corn cobs supply needs solution for material densification and storage of this material. For the cereal straw higher price should be calculated.
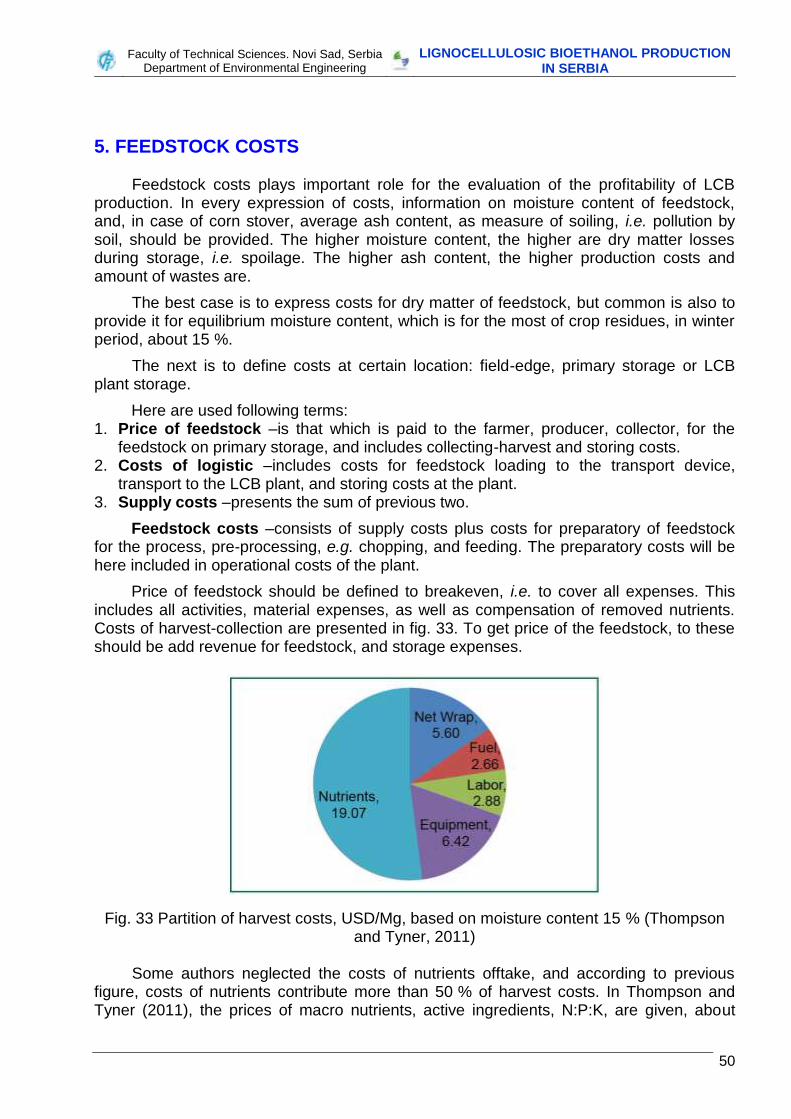
Faculty of Technical Sciences. Novi Sad, Serbia
Department of Environmental Engineering LIGNOCELLULOSIC BIOETHANOL PRODUCTION
IN SERBIA
50
5. FEEDSTOCK COSTS
Feedstock costs plays important role for the evaluation of the profitability of LCB production. In every expression of costs, information on moisture content of feedstock, and, in case of corn stover, average ash content, as measure of soiling, i.e. pollution by soil, should be provided. The higher moisture content, the higher are dry matter losses during storage, i.e. spoilage. The higher ash content, the higher production costs and amount of wastes are.
The best case is to express costs for dry matter of feedstock, but common is also to provide it for equilibrium moisture content, which is for the most of crop residues, in winter period, about 15 %.
The next is to define costs at certain location: field-edge, primary storage or LCB plant storage.
Here are used following terms: 1. Price of feedstock –is that which is paid to the farmer, producer, collector, for the
feedstock on primary storage, and includes collecting-harvest and storing costs. 2. Costs of logistic –includes costs for feedstock loading to the transport device,
transport to the LCB plant, and storing costs at the plant. 3. Supply costs –presents the sum of previous two.
Feedstock costs –consists of supply costs plus costs for preparatory of feedstock for the process, pre-processing, e.g. chopping, and feeding. The preparatory costs will be here included in operational costs of the plant.
Price of feedstock should be defined to breakeven, i.e. to cover all expenses. This includes all activities, material expenses, as well as compensation of removed nutrients. Costs of harvest-collection are presented in fig. 33. To get price of the feedstock, to these should be add revenue for feedstock, and storage expenses.
Fig. 33 Partition of harvest costs, USD/Mg, based on moisture content 15 % (Thompson and Tyner, 2011)
Some authors neglected the costs of nutrients offtake, and according to previous
figure, costs of nutrients contribute more than 50 % of harvest costs. In Thompson and Tyner (2011), the prices of macro nutrients, active ingredients, N:P:K, are given, about
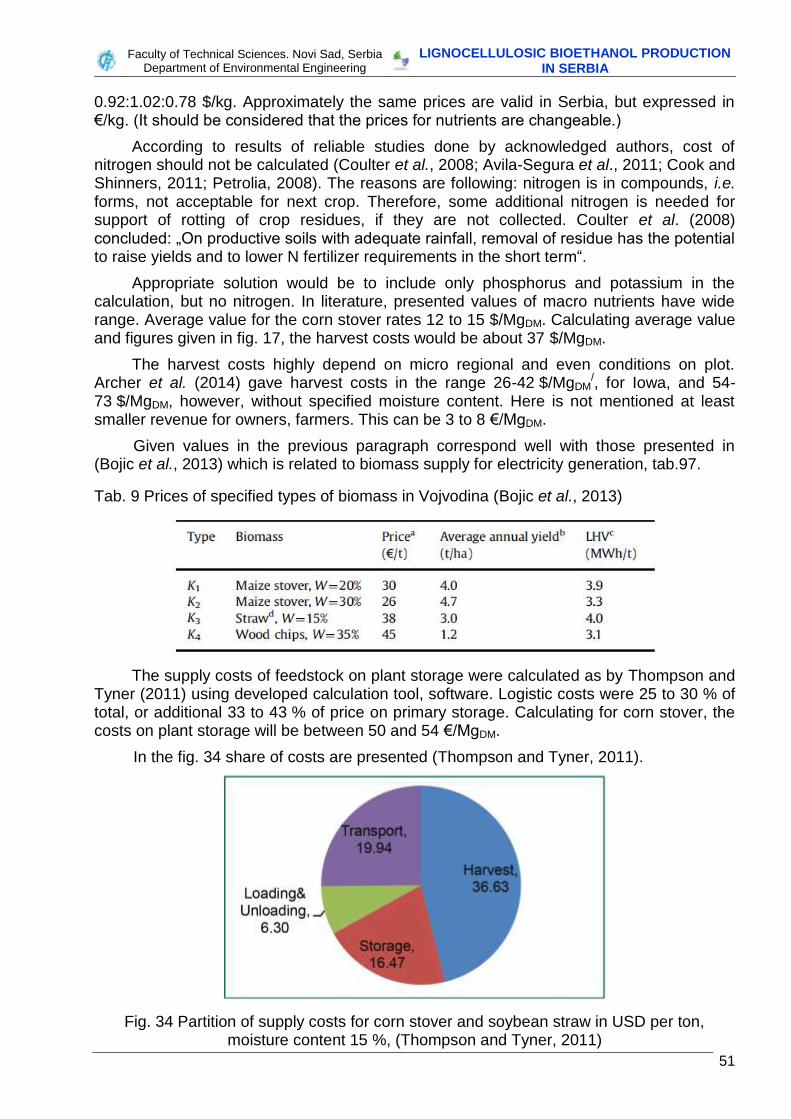
Faculty of Technical Sciences. Novi Sad, Serbia
Department of Environmental Engineering LIGNOCELLULOSIC BIOETHANOL PRODUCTION
IN SERBIA
51
0.92:1.02:0.78 $/kg. Approximately the same prices are valid in Serbia, but expressed in €/kg. (It should be considered that the prices for nutrients are changeable.)
According to results of reliable studies done by acknowledged authors, cost of nitrogen should not be calculated (Coulter et al., 2008; Avila-Segura et al., 2011; Cook and Shinners, 2011; Petrolia, 2008). The reasons are following: nitrogen is in compounds, i.e. forms, not acceptable for next crop. Therefore, some additional nitrogen is needed for support of rotting of crop residues, if they are not collected. Coulter et al. (2008) concluded: „On productive soils with adequate rainfall, removal of residue has the potential to raise yields and to lower N fertilizer requirements in the short term“.
Appropriate solution would be to include only phosphorus and potassium in the calculation, but no nitrogen. In literature, presented values of macro nutrients have wide range. Average value for the corn stover rates 12 to 15 $/MgDM. Calculating average value and figures given in fig. 17, the harvest costs would be about 37 $/MgDM.
The harvest costs highly depend on micro regional and even conditions on plot. Archer et al. (2014) gave harvest costs in the range 26-42 $/MgDM
/, for Iowa, and 54-73 $/MgDM, however, without specified moisture content. Here is not mentioned at least smaller revenue for owners, farmers. This can be 3 to 8 €/MgDM.
Given values in the previous paragraph correspond well with those presented in (Bojic et al., 2013) which is related to biomass supply for electricity generation, tab.97.
Tab. 9 Prices of specified types of biomass in Vojvodina (Bojic et al., 2013)
The supply costs of feedstock on plant storage were calculated as by Thompson and Tyner (2011) using developed calculation tool, software. Logistic costs were 25 to 30 % of total, or additional 33 to 43 % of price on primary storage. Calculating for corn stover, the costs on plant storage will be between 50 and 54 €/MgDM.
In the fig. 34 share of costs are presented (Thompson and Tyner, 2011).
Fig. 34 Partition of supply costs for corn stover and soybean straw in USD per ton, moisture content 15 %, (Thompson and Tyner, 2011)
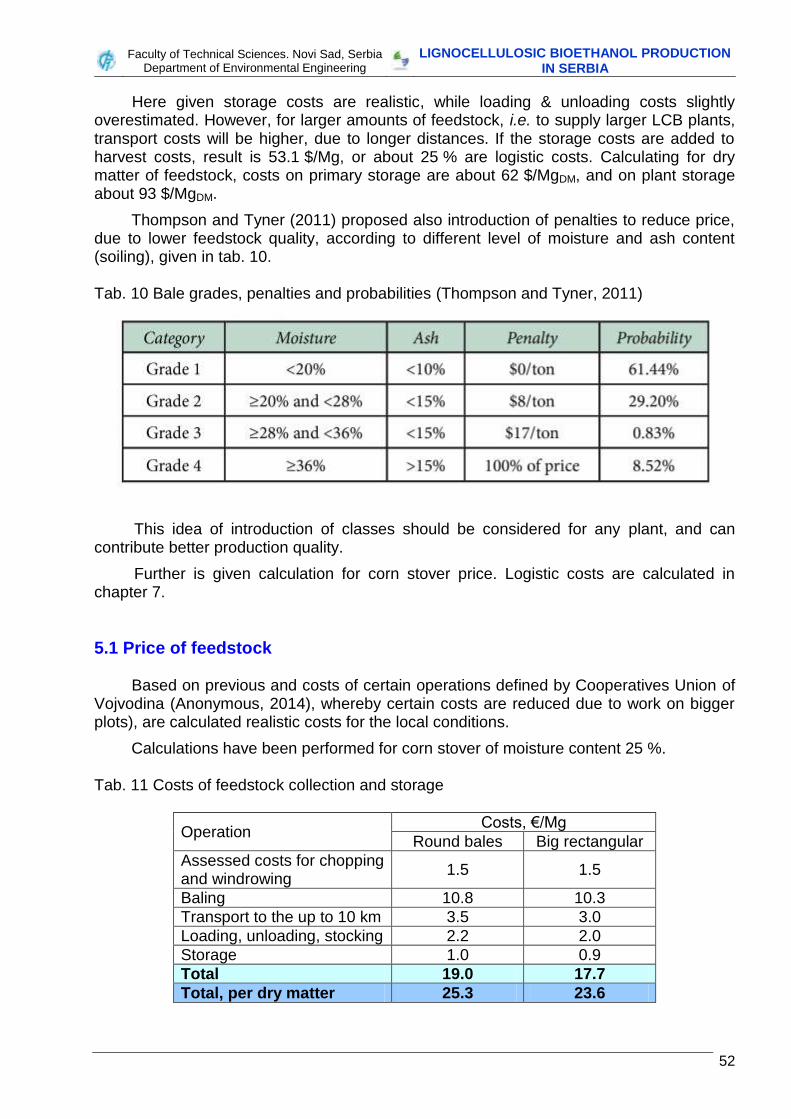
Faculty of Technical Sciences. Novi Sad, Serbia
Department of Environmental Engineering LIGNOCELLULOSIC BIOETHANOL PRODUCTION
IN SERBIA
52
Here given storage costs are realistic, while loading & unloading costs slightly overestimated. However, for larger amounts of feedstock, i.e. to supply larger LCB plants, transport costs will be higher, due to longer distances. If the storage costs are added to harvest costs, result is 53.1 $/Mg, or about 25 % are logistic costs. Calculating for dry matter of feedstock, costs on primary storage are about 62 $/MgDM, and on plant storage about 93 $/MgDM.
Thompson and Tyner (2011) proposed also introduction of penalties to reduce price, due to lower feedstock quality, according to different level of moisture and ash content (soiling), given in tab. 10.
Tab. 10 Bale grades, penalties and probabilities (Thompson and Tyner, 2011)
This idea of introduction of classes should be considered for any plant, and can contribute better production quality.
Further is given calculation for corn stover price. Logistic costs are calculated in chapter 7.
5.1 Price of feedstock
Based on previous and costs of certain operations defined by Cooperatives Union of Vojvodina (Anonymous, 2014), whereby certain costs are reduced due to work on bigger plots), are calculated realistic costs for the local conditions.
Calculations have been performed for corn stover of moisture content 25 %. Tab. 11 Costs of feedstock collection and storage
Operation Costs, €/Mg
Round bales Big rectangular
Assessed costs for chopping and windrowing
1.5 1.5
Baling 10.8 10.3
Transport to the up to 10 km 3.5 3.0
Loading, unloading, stocking 2.2 2.0
Storage 1.0 0.9
Total 19.0 17.7
Total, per dry matter 25.3 23.6
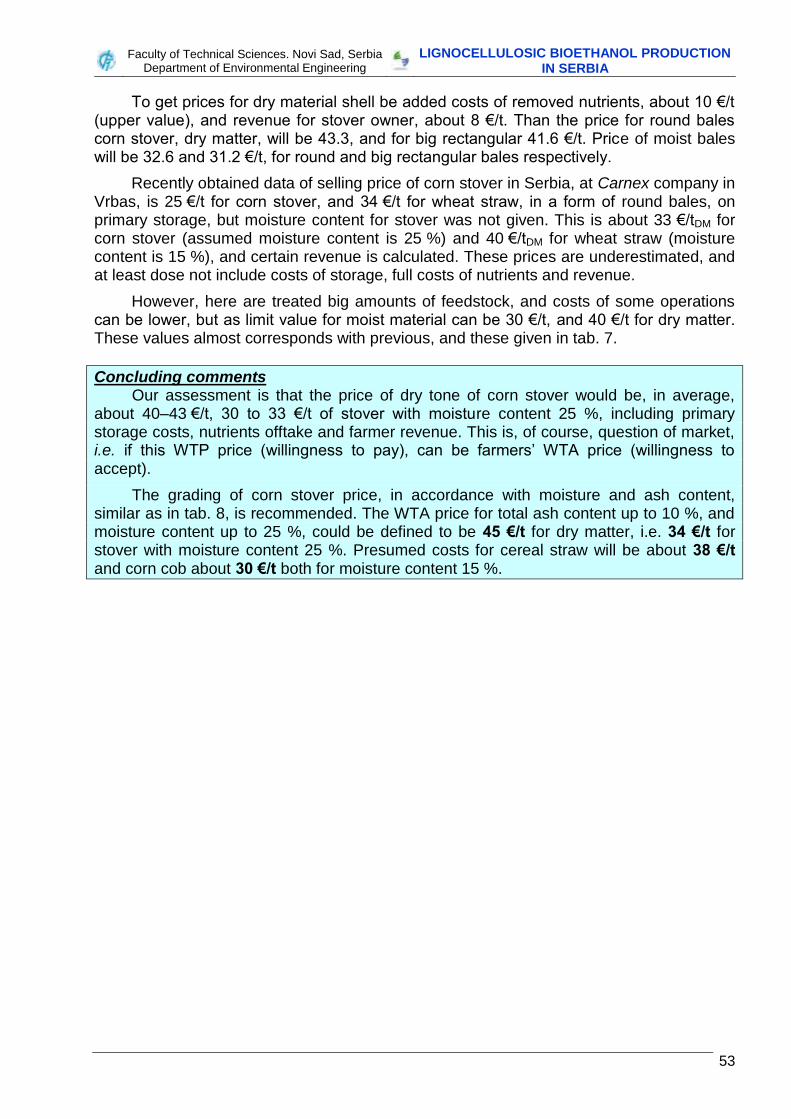
Faculty of Technical Sciences. Novi Sad, Serbia
Department of Environmental Engineering LIGNOCELLULOSIC BIOETHANOL PRODUCTION
IN SERBIA
53
To get prices for dry material shell be added costs of removed nutrients, about 10 €/t (upper value), and revenue for stover owner, about 8 €/t. Than the price for round bales corn stover, dry matter, will be 43.3, and for big rectangular 41.6 €/t. Price of moist bales will be 32.6 and 31.2 €/t, for round and big rectangular bales respectively.
Recently obtained data of selling price of corn stover in Serbia, at Carnex company in Vrbas, is 25 €/t for corn stover, and 34 €/t for wheat straw, in a form of round bales, on primary storage, but moisture content for stover was not given. This is about 33 €/tDM for corn stover (assumed moisture content is 25 %) and 40 €/tDM for wheat straw (moisture content is 15 %), and certain revenue is calculated. These prices are underestimated, and at least dose not include costs of storage, full costs of nutrients and revenue.
However, here are treated big amounts of feedstock, and costs of some operations can be lower, but as limit value for moist material can be 30 €/t, and 40 €/t for dry matter. These values almost corresponds with previous, and these given in tab. 7.
Concluding comments Our assessment is that the price of dry tone of corn stover would be, in average,
about 40–43 €/t, 30 to 33 €/t of stover with moisture content 25 %, including primary storage costs, nutrients offtake and farmer revenue. This is, of course, question of market, i.e. if this WTP price (willingness to pay), can be farmersʼ WTA price (willingness to accept).
The grading of corn stover price, in accordance with moisture and ash content, similar as in tab. 8, is recommended. The WTA price for total ash content up to 10 %, and moisture content up to 25 %, could be defined to be 45 €/t for dry matter, i.e. 34 €/t for stover with moisture content 25 %. Presumed costs for cereal straw will be about 38 €/t and corn cob about 30 €/t both for moisture content 15 %.
Faculty of Technical Sciences. Novi Sad, Serbia
Department of Environmental Engineering LIGNOCELLULOSIC BIOETHANOL PRODUCTION
IN SERBIA
54
6. ENVIRONMENT AND SUSTAINABILITY ISSUES
As previously mentioned, main motivation for biofuels production and use is reduction of GHG emission, i.e. mitigation of global warming effects (Clini et al., 2011). In the same time other effects on environment have to be considered and respected. Utilization of plant materials as a feedstock must be performed on sustainable manner. This, firstly, means preservation of soil fertility. The second is to have no disturbance of food security, i.e. proper supply of mankind with needed food.
Other environmental issues should be respected as well, e.g. material flow and close loop production, without generation of wastes, especially hazardous ones. Production of feedstock and biofuel must not have negative impact on air and water pollution as well.
6.1 Preservation of soil fertility
Agricultural soil is treated as non-renewable resource. In reality, spoiled soil can be remediated, but for this process is needed time longer than human life.
Removal of crop residues should be considered from all aspects, and one of the most significant is impact on soil fertility, productivity, including all other environmental and ecological by-effects (Blum et al., 2010; Gerzabek, 2014). Powlson (2006) focused issue of soil fertility related to crop residues, primarily straw, and impact on SOM (Soil Organic Matter), and SOC (Soil Organic Carbon) changing, and gave some general recommendations, i.e. need of establishment of proper soil management related to the soil and climatic characteristics and crop rotation.
The effects of residual corn biomass offtake have been investigated by many researchers. The most significant effects are: the removal of nutrients available in the stover, the impact on SOC, the effects on reduction or elimination of erosion and soil compaction protection cover, the impact on soil structure. This should be considered in order to preserve soil fertility, productivity, by taking adequate measures. Wilhelm et al. (2004) presented a thorough literature review related to these issues. Some of the investigations resulted in the conclusion that the removal of residual biomass is followed by a reduction of grain yield in following years. Some long-term investigations did not confirm this statement, and most serious considered impact of climatic and pedological conditions and crop rotation (Blum et al., 2010; Rampazzo et al., 2010). The general conclusion was that sustainable management of corn stover offtake should be provided.
Nowadays statement that is dominant is that the best measure for soil erosion prevention represents conservation tillage, defined in ASAE EP291.3 (Anonymous, 2005). In this publication, any tillage or seeding system that maintains a minimum of 30 % residue cover on the soil surface after planting to reduce soil erosion by water; or where soil erosion by wind is the primary concern, maintains at least 1,100 kg/ha of flat small grain residue equivalent on the soil surface during the critical erosion period is considered as conservation tillage.
The value of nutrients removed with corn stover and SOM (soil organic matter), i.e. SOC should be taken into account, quantified and expressed as additional costs of biomass removed. Nutrient removal in stover is quantified in the range 0.5 to 3.2 kg for phosphorus and 5 to 16.5 kg for potassium for every Mg of corn stover DM (Cook and Schinners, 2011; Hoskinson et al., 2007; Karlen et al., 2011; Sheehan et al., 2012). Some
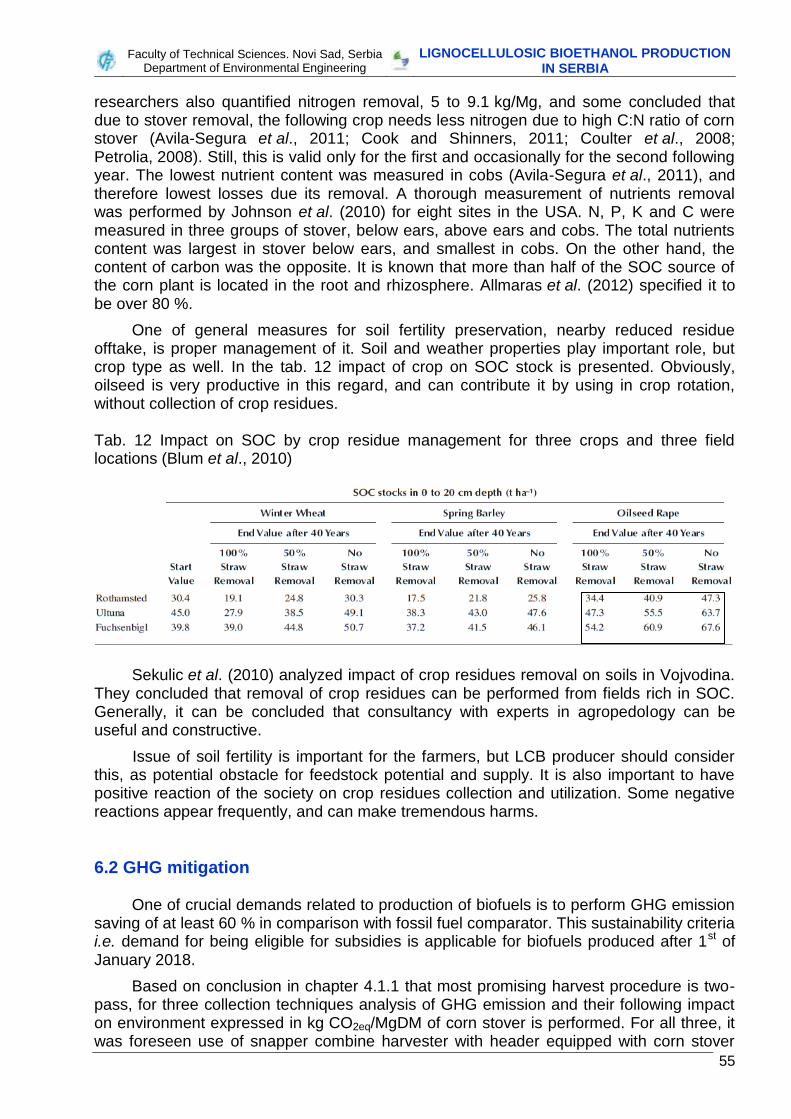
Faculty of Technical Sciences. Novi Sad, Serbia
Department of Environmental Engineering LIGNOCELLULOSIC BIOETHANOL PRODUCTION
IN SERBIA
55
researchers also quantified nitrogen removal, 5 to 9.1 kg/Mg, and some concluded that due to stover removal, the following crop needs less nitrogen due to high C:N ratio of corn stover (Avila-Segura et al., 2011; Cook and Shinners, 2011; Coulter et al., 2008; Petrolia, 2008). Still, this is valid only for the first and occasionally for the second following year. The lowest nutrient content was measured in cobs (Avila-Segura et al., 2011), and therefore lowest losses due its removal. A thorough measurement of nutrients removal was performed by Johnson et al. (2010) for eight sites in the USA. N, P, K and C were measured in three groups of stover, below ears, above ears and cobs. The total nutrients content was largest in stover below ears, and smallest in cobs. On the other hand, the content of carbon was the opposite. It is known that more than half of the SOC source of the corn plant is located in the root and rhizosphere. Allmaras et al. (2012) specified it to be over 80 %.
One of general measures for soil fertility preservation, nearby reduced residue offtake, is proper management of it. Soil and weather properties play important role, but crop type as well. In the tab. 12 impact of crop on SOC stock is presented. Obviously, oilseed is very productive in this regard, and can contribute it by using in crop rotation, without collection of crop residues. Tab. 12 Impact on SOC by crop residue management for three crops and three field locations (Blum et al., 2010)
Sekulic et al. (2010) analyzed impact of crop residues removal on soils in Vojvodina. They concluded that removal of crop residues can be performed from fields rich in SOC. Generally, it can be concluded that consultancy with experts in agropedology can be useful and constructive.
Issue of soil fertility is important for the farmers, but LCB producer should consider this, as potential obstacle for feedstock potential and supply. It is also important to have positive reaction of the society on crop residues collection and utilization. Some negative reactions appear frequently, and can make tremendous harms.
6.2 GHG mitigation
One of crucial demands related to production of biofuels is to perform GHG emission saving of at least 60 % in comparison with fossil fuel comparator. This sustainability criteria i.e. demand for being eligible for subsidies is applicable for biofuels produced after 1st of January 2018.
Based on conclusion in chapter 4.1.1 that most promising harvest procedure is two-pass, for three collection techniques analysis of GHG emission and their following impact on environment expressed in kg CO2eq/MgDM of corn stover is performed. For all three, it was foreseen use of snapper combine harvester with header equipped with corn stover
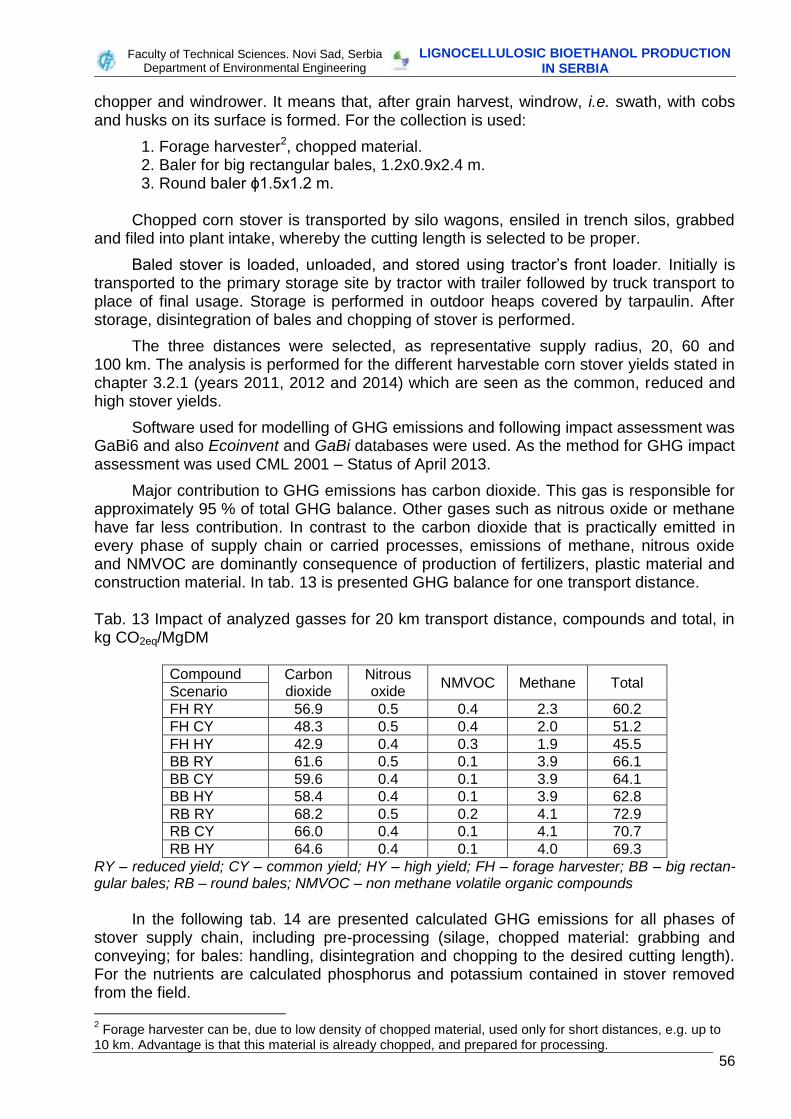
Faculty of Technical Sciences. Novi Sad, Serbia
Department of Environmental Engineering LIGNOCELLULOSIC BIOETHANOL PRODUCTION
IN SERBIA
56
chopper and windrower. It means that, after grain harvest, windrow, i.e. swath, with cobs and husks on its surface is formed. For the collection is used:
1. Forage harvester2, chopped material. 2. Baler for big rectangular bales, 1.2x0.9x2.4 m. 3. Round baler ϕ1.5x1.2 m.
Chopped corn stover is transported by silo wagons, ensiled in trench silos, grabbed
and filed into plant intake, whereby the cutting length is selected to be proper.
Baled stover is loaded, unloaded, and stored using tractor’s front loader. Initially is transported to the primary storage site by tractor with trailer followed by truck transport to place of final usage. Storage is performed in outdoor heaps covered by tarpaulin. After storage, disintegration of bales and chopping of stover is performed.
The three distances were selected, as representative supply radius, 20, 60 and 100 km. The analysis is performed for the different harvestable corn stover yields stated in chapter 3.2.1 (years 2011, 2012 and 2014) which are seen as the common, reduced and high stover yields.
Software used for modelling of GHG emissions and following impact assessment was GaBi6 and also Ecoinvent and GaBi databases were used. As the method for GHG impact assessment was used CML 2001 – Status of April 2013.
Major contribution to GHG emissions has carbon dioxide. This gas is responsible for approximately 95 % of total GHG balance. Other gases such as nitrous oxide or methane have far less contribution. In contrast to the carbon dioxide that is practically emitted in every phase of supply chain or carried processes, emissions of methane, nitrous oxide and NMVOC are dominantly consequence of production of fertilizers, plastic material and construction material. In tab. 13 is presented GHG balance for one transport distance.
Tab. 13 Impact of analyzed gasses for 20 km transport distance, compounds and total, in kg CO2eq/MgDM
Compound Carbon dioxide
Nitrous oxide
NMVOC Methane Total Scenario FH RY 56.9 0.5 0.4 2.3 60.2 FH CY 48.3 0.5 0.4 2.0 51.2 FH HY 42.9 0.4 0.3 1.9 45.5 BB RY 61.6 0.5 0.1 3.9 66.1 BB CY 59.6 0.4 0.1 3.9 64.1 BB HY 58.4 0.4 0.1 3.9 62.8 RB RY 68.2 0.5 0.2 4.1 72.9 RB CY 66.0 0.4 0.1 4.1 70.7 RB HY 64.6 0.4 0.1 4.0 69.3
RY – reduced yield; CY – common yield; HY – high yield; FH – forage harvester; BB – big rectan-gular bales; RB – round bales; NMVOC – non methane volatile organic compounds
In the following tab. 14 are presented calculated GHG emissions for all phases of
stover supply chain, including pre-processing (silage, chopped material: grabbing and conveying; for bales: handling, disintegration and chopping to the desired cutting length). For the nutrients are calculated phosphorus and potassium contained in stover removed from the field.
2 Forage harvester can be, due to low density of chopped material, used only for short distances, e.g. up to
10 km. Advantage is that this material is already chopped, and prepared for processing.
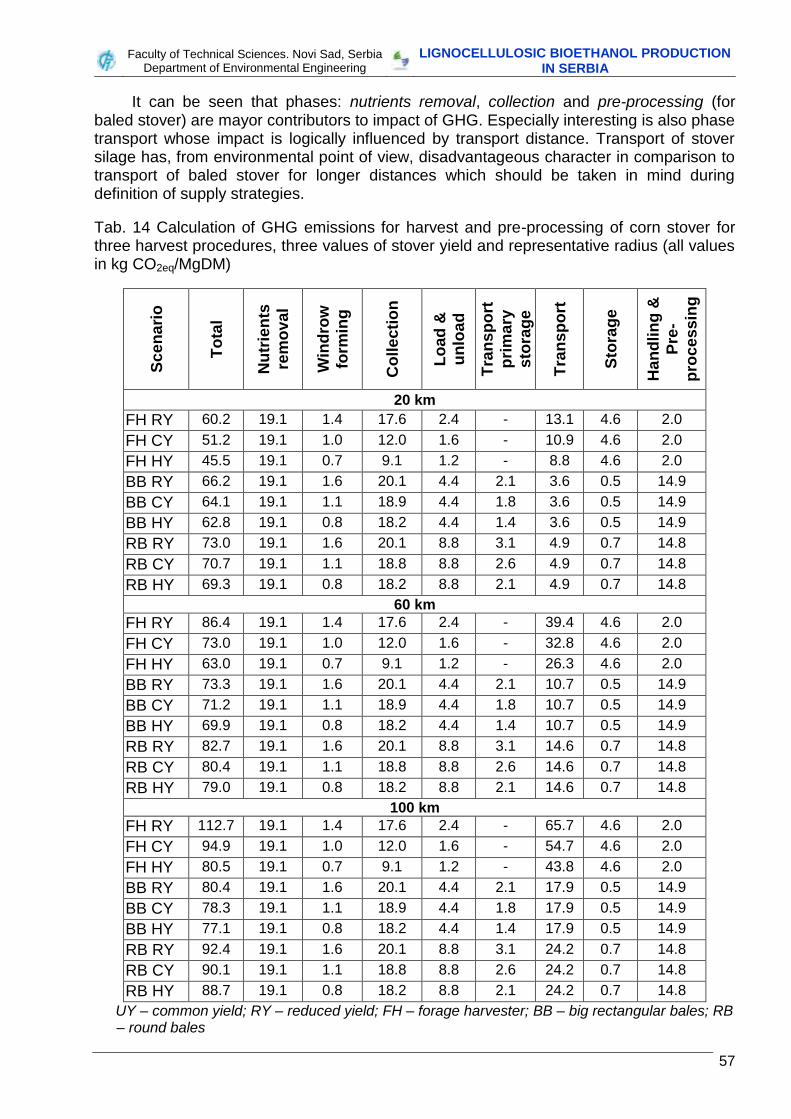
Faculty of Technical Sciences. Novi Sad, Serbia
Department of Environmental Engineering LIGNOCELLULOSIC BIOETHANOL PRODUCTION
IN SERBIA
57
It can be seen that phases: nutrients removal, collection and pre-processing (for baled stover) are mayor contributors to impact of GHG. Especially interesting is also phase transport whose impact is logically influenced by transport distance. Transport of stover silage has, from environmental point of view, disadvantageous character in comparison to transport of baled stover for longer distances which should be taken in mind during definition of supply strategies.
Tab. 14 Calculation of GHG emissions for harvest and pre-processing of corn stover for three harvest procedures, three values of stover yield and representative radius (all values in kg CO2eq/MgDM)
Sc
en
ari
o
To
tal
Nu
trie
nts
rem
ov
al
Win
dro
w
form
ing
Co
lle
cti
on
Lo
ad
&
un
loa
d
Tra
nsp
ort
pri
ma
ry
sto
rag
e
Tra
nsp
ort
Sto
rag
e
Han
dli
ng
&
Pre
-
pro
ce
ssin
g
20 km
FH RY 60.2 19.1 1.4 17.6 2.4 - 13.1 4.6 2.0
FH CY 51.2 19.1 1.0 12.0 1.6 - 10.9 4.6 2.0
FH HY 45.5 19.1 0.7 9.1 1.2 - 8.8 4.6 2.0
BB RY 66.2 19.1 1.6 20.1 4.4 2.1 3.6 0.5 14.9
BB CY 64.1 19.1 1.1 18.9 4.4 1.8 3.6 0.5 14.9
BB HY 62.8 19.1 0.8 18.2 4.4 1.4 3.6 0.5 14.9
RB RY 73.0 19.1 1.6 20.1 8.8 3.1 4.9 0.7 14.8
RB CY 70.7 19.1 1.1 18.8 8.8 2.6 4.9 0.7 14.8
RB HY 69.3 19.1 0.8 18.2 8.8 2.1 4.9 0.7 14.8
60 km FH RY 86.4 19.1 1.4 17.6 2.4 - 39.4 4.6 2.0
FH CY 73.0 19.1 1.0 12.0 1.6 - 32.8 4.6 2.0
FH HY 63.0 19.1 0.7 9.1 1.2 - 26.3 4.6 2.0
BB RY 73.3 19.1 1.6 20.1 4.4 2.1 10.7 0.5 14.9
BB CY 71.2 19.1 1.1 18.9 4.4 1.8 10.7 0.5 14.9
BB HY 69.9 19.1 0.8 18.2 4.4 1.4 10.7 0.5 14.9
RB RY 82.7 19.1 1.6 20.1 8.8 3.1 14.6 0.7 14.8
RB CY 80.4 19.1 1.1 18.8 8.8 2.6 14.6 0.7 14.8
RB HY 79.0 19.1 0.8 18.2 8.8 2.1 14.6 0.7 14.8
100 km
FH RY 112.7 19.1 1.4 17.6 2.4 - 65.7 4.6 2.0
FH CY 94.9 19.1 1.0 12.0 1.6 - 54.7 4.6 2.0
FH HY 80.5 19.1 0.7 9.1 1.2 - 43.8 4.6 2.0
BB RY 80.4 19.1 1.6 20.1 4.4 2.1 17.9 0.5 14.9
BB CY 78.3 19.1 1.1 18.9 4.4 1.8 17.9 0.5 14.9
BB HY 77.1 19.1 0.8 18.2 4.4 1.4 17.9 0.5 14.9
RB RY 92.4 19.1 1.6 20.1 8.8 3.1 24.2 0.7 14.8
RB CY 90.1 19.1 1.1 18.8 8.8 2.6 24.2 0.7 14.8
RB HY 88.7 19.1 0.8 18.2 8.8 2.1 24.2 0.7 14.8
UY – common yield; RY – reduced yield; FH – forage harvester; BB – big rectangular bales; RB – round bales
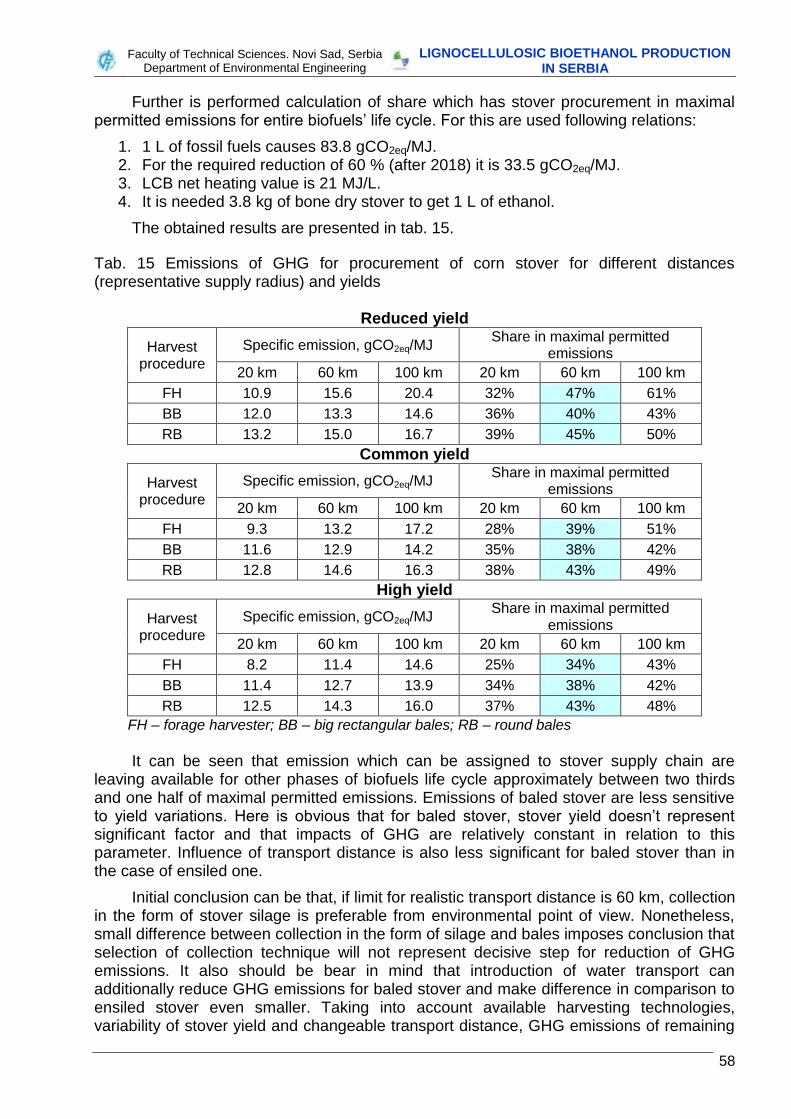
Faculty of Technical Sciences. Novi Sad, Serbia
Department of Environmental Engineering LIGNOCELLULOSIC BIOETHANOL PRODUCTION
IN SERBIA
58
Further is performed calculation of share which has stover procurement in maximal permitted emissions for entire biofuels’ life cycle. For this are used following relations:
1. 1 L of fossil fuels causes 83.8 gCO2eq/MJ. 2. For the required reduction of 60 % (after 2018) it is 33.5 gCO2eq/MJ. 3. LCB net heating value is 21 MJ/L. 4. It is needed 3.8 kg of bone dry stover to get 1 L of ethanol.
The obtained results are presented in tab. 15.
Tab. 15 Emissions of GHG for procurement of corn stover for different distances (representative supply radius) and yields
Reduced yield
Harvest procedure
Specific emission, gCO2eq/MJ Share in maximal permitted
emissions
20 km 60 km 100 km 20 km 60 km 100 km
FH 10.9 15.6 20.4 32% 47% 61%
BB 12.0 13.3 14.6 36% 40% 43%
RB 13.2 15.0 16.7 39% 45% 50%
Common yield
Harvest procedure
Specific emission, gCO2eq/MJ Share in maximal permitted
emissions
20 km 60 km 100 km 20 km 60 km 100 km
FH 9.3 13.2 17.2 28% 39% 51%
BB 11.6 12.9 14.2 35% 38% 42%
RB 12.8 14.6 16.3 38% 43% 49%
High yield
Harvest procedure
Specific emission, gCO2eq/MJ Share in maximal permitted
emissions
20 km 60 km 100 km 20 km 60 km 100 km
FH 8.2 11.4 14.6 25% 34% 43%
BB 11.4 12.7 13.9 34% 38% 42%
RB 12.5 14.3 16.0 37% 43% 48%
FH – forage harvester; BB – big rectangular bales; RB – round bales
It can be seen that emission which can be assigned to stover supply chain are
leaving available for other phases of biofuels life cycle approximately between two thirds and one half of maximal permitted emissions. Emissions of baled stover are less sensitive to yield variations. Here is obvious that for baled stover, stover yield doesn’t represent significant factor and that impacts of GHG are relatively constant in relation to this parameter. Influence of transport distance is also less significant for baled stover than in the case of ensiled one.
Initial conclusion can be that, if limit for realistic transport distance is 60 km, collection in the form of stover silage is preferable from environmental point of view. Nonetheless, small difference between collection in the form of silage and bales imposes conclusion that selection of collection technique will not represent decisive step for reduction of GHG emissions. It also should be bear in mind that introduction of water transport can additionally reduce GHG emissions for baled stover and make difference in comparison to ensiled stover even smaller. Taking into account available harvesting technologies, variability of stover yield and changeable transport distance, GHG emissions of remaining
Faculty of Technical Sciences. Novi Sad, Serbia
Department of Environmental Engineering LIGNOCELLULOSIC BIOETHANOL PRODUCTION
IN SERBIA
59
life cycle phases of LCB (production, distribution and utilization) have 60 % of maximal permitted or 20 gCO2eq/MJ.
6.3 Balances of LCB production process
Annex V, point E of directive 28/2009/EC provides default value for GHG emissions of wheat straw produced ethanol, 13 gCO2eq/MJ. Value of this emission is associated with cultivation of feedstock, production, transport and distribution of ethanol. If 100 % LCB is considered (no blending), this value represents total GHG emissions. It is obvious that the sustainability criteria is met due to GHG emissions reduction of approximately 85 %. This value represents default value and it is possible that value is underestimated.
Precise estimation of impacts originating from GHG emissions associated with stover based LCB production, transport, distribution and utilization is complicated by large uncertainties regarding applicable technology and expected modelling parameters.
Main problem represent production phase of LCB. Lack of data in existing databases concerning this issue prevents prediction about expected GHG emissions. In existing studies (Wiloso et al, 2012; Heath et al., 2009; Murphy, 2013; Spatari et al., 2005), limited explanations regarding applied methodology, measurement assumptions and applied system boundaries, prevent their applicability and further data exploitation. Another issue is blending ratio of ethanol with petrol and their influence to overall emissions. Wiloso et al. (2012) emphasize high influence of blending ratio to final results of impacts related to GHG emissions.
Within stated value for GHG emissions associated with life cycle of wheat straw produced ethanol, cultivation (or more precisely procurement) of straw is responsible for 3 gCO2eq/MJ which means that production, transport and distribution make 10 gCO2eq/MJ of bioethanol. If this value is seen as applicable value also for stover produced bioethanol, in combination with results stated in previous chapter related to stover procurement phase, it can be concluded that life cycle of LCB from stover satisfies sustainability criteria because total balance of GHG emissions is between approximately 18 and 25 gCO2eq/MJ (depending from the applied collection technique and transport distance).
Comments Fulfilment of the sustainability criteria, i.e. eligibility for subsidies, will be obtained if GHG total emission is under 33.5 gCO2eq/MJ. It is currently unrealistic to obtain precise value for total GHG emission for LCB, due to lack of data for production. Here are calculated GHG emission for feedstock procurement and pre-processing. They are, for supply region radius 60 km in the range 13 to 15 gCO2eq/MJ, what makes about 40 % of defined limit.
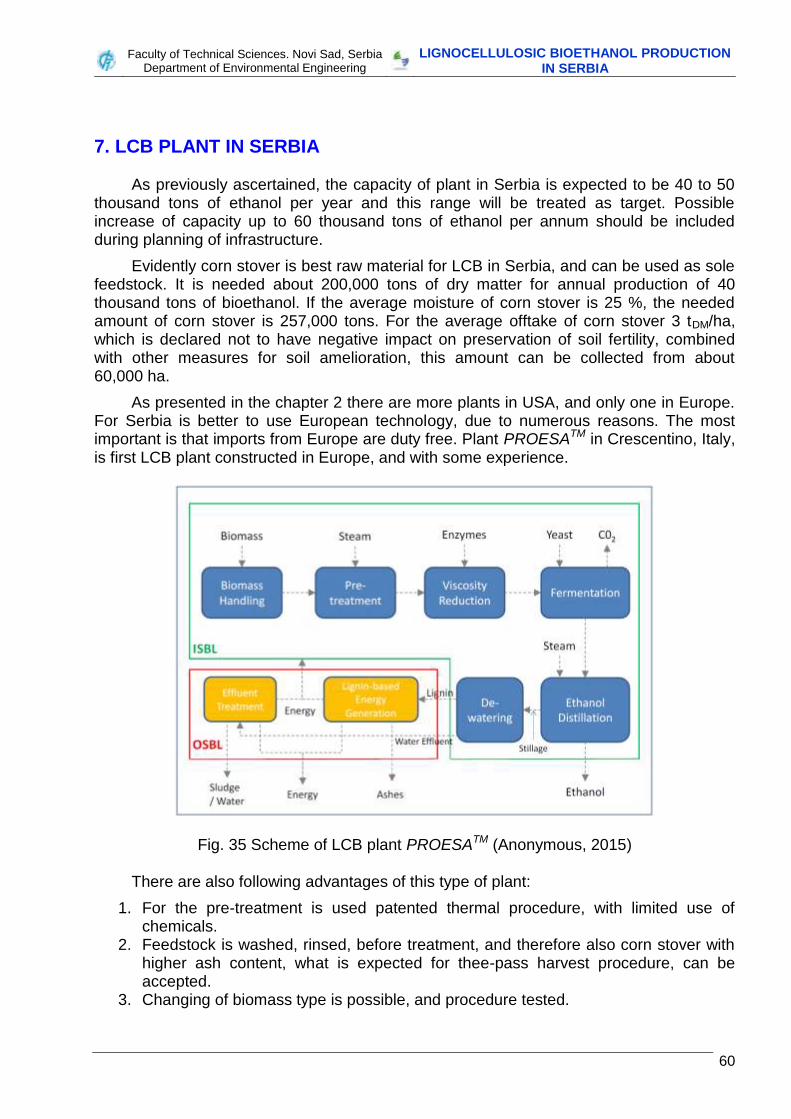
Faculty of Technical Sciences. Novi Sad, Serbia
Department of Environmental Engineering LIGNOCELLULOSIC BIOETHANOL PRODUCTION
IN SERBIA
60
7. LCB PLANT IN SERBIA
As previously ascertained, the capacity of plant in Serbia is expected to be 40 to 50 thousand tons of ethanol per year and this range will be treated as target. Possible increase of capacity up to 60 thousand tons of ethanol per annum should be included during planning of infrastructure.
Evidently corn stover is best raw material for LCB in Serbia, and can be used as sole feedstock. It is needed about 200,000 tons of dry matter for annual production of 40 thousand tons of bioethanol. If the average moisture of corn stover is 25 %, the needed amount of corn stover is 257,000 tons. For the average offtake of corn stover 3 tDM/ha, which is declared not to have negative impact on preservation of soil fertility, combined with other measures for soil amelioration, this amount can be collected from about 60,000 ha.
As presented in the chapter 2 there are more plants in USA, and only one in Europe. For Serbia is better to use European technology, due to numerous reasons. The most important is that imports from Europe are duty free. Plant PROESATM in Crescentino, Italy, is first LCB plant constructed in Europe, and with some experience.
Fig. 35 Scheme of LCB plant PROESATM (Anonymous, 2015)
There are also following advantages of this type of plant:
1. For the pre-treatment is used patented thermal procedure, with limited use of chemicals.
2. Feedstock is washed, rinsed, before treatment, and therefore also corn stover with higher ash content, what is expected for thee-pass harvest procedure, can be accepted.
3. Changing of biomass type is possible, and procedure tested.
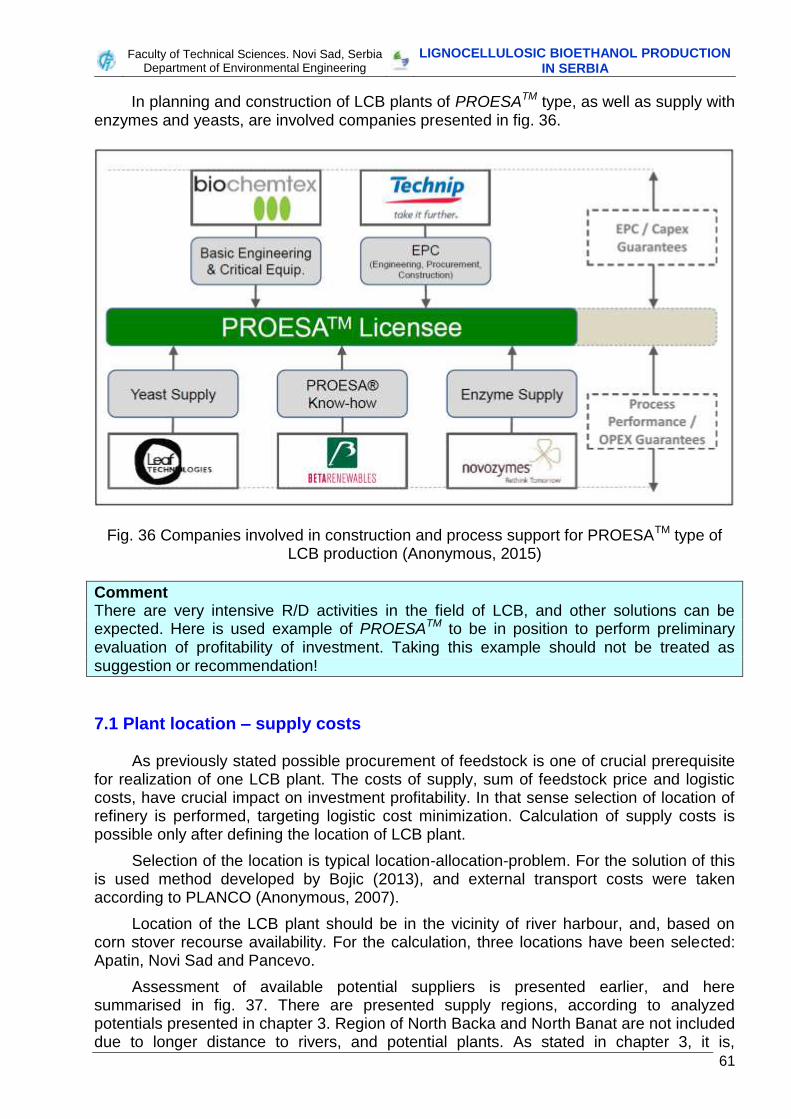
Faculty of Technical Sciences. Novi Sad, Serbia
Department of Environmental Engineering LIGNOCELLULOSIC BIOETHANOL PRODUCTION
IN SERBIA
61
In planning and construction of LCB plants of PROESATM type, as well as supply with enzymes and yeasts, are involved companies presented in fig. 36.
Fig. 36 Companies involved in construction and process support for PROESATM type of LCB production (Anonymous, 2015)
Comment There are very intensive R/D activities in the field of LCB, and other solutions can be expected. Here is used example of PROESATM to be in position to perform preliminary evaluation of profitability of investment. Taking this example should not be treated as suggestion or recommendation!
7.1 Plant location – supply costs
As previously stated possible procurement of feedstock is one of crucial prerequisite for realization of one LCB plant. The costs of supply, sum of feedstock price and logistic costs, have crucial impact on investment profitability. In that sense selection of location of refinery is performed, targeting logistic cost minimization. Calculation of supply costs is possible only after defining the location of LCB plant.
Selection of the location is typical location-allocation-problem. For the solution of this is used method developed by Bojic (2013), and external transport costs were taken according to PLANCO (Anonymous, 2007).
Location of the LCB plant should be in the vicinity of river harbour, and, based on corn stover recourse availability. For the calculation, three locations have been selected: Apatin, Novi Sad and Pancevo.
Assessment of available potential suppliers is presented earlier, and here summarised in fig. 37. There are presented supply regions, according to analyzed potentials presented in chapter 3. Region of North Backa and North Banat are not included due to longer distance to rivers, and potential plants. As stated in chapter 3, it is,
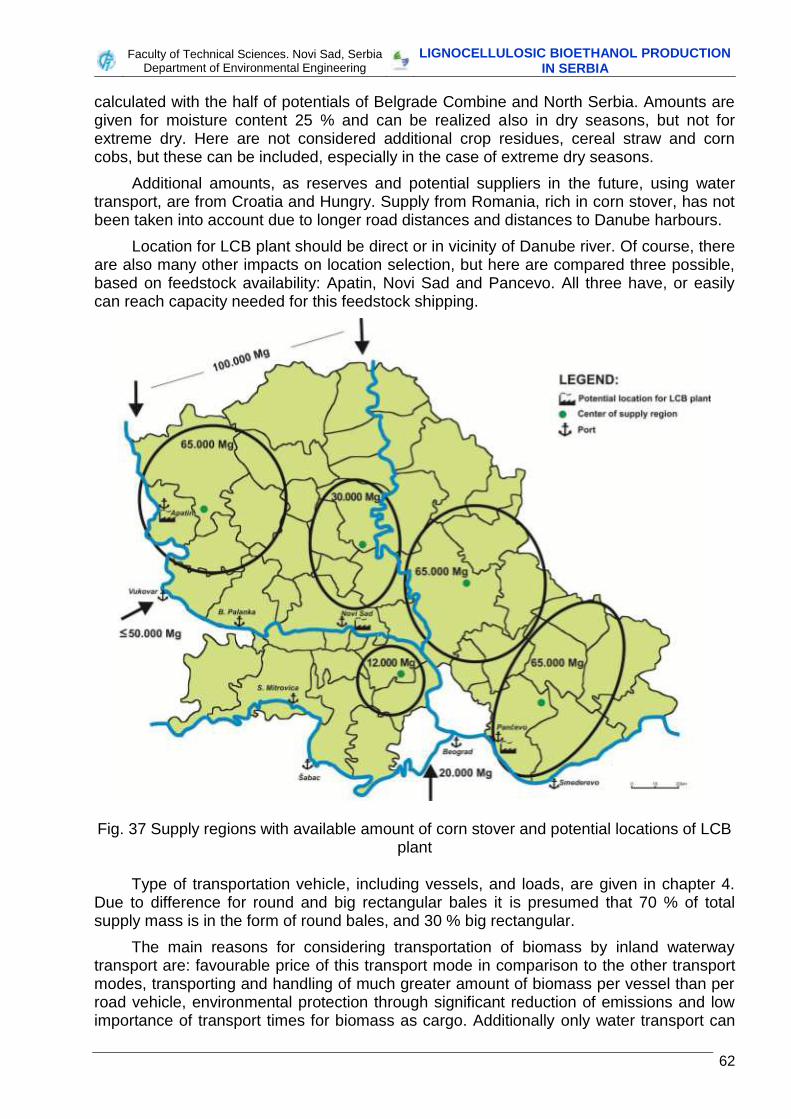
Faculty of Technical Sciences. Novi Sad, Serbia
Department of Environmental Engineering LIGNOCELLULOSIC BIOETHANOL PRODUCTION
IN SERBIA
62
calculated with the half of potentials of Belgrade Combine and North Serbia. Amounts are given for moisture content 25 % and can be realized also in dry seasons, but not for extreme dry. Here are not considered additional crop residues, cereal straw and corn cobs, but these can be included, especially in the case of extreme dry seasons.
Additional amounts, as reserves and potential suppliers in the future, using water transport, are from Croatia and Hungry. Supply from Romania, rich in corn stover, has not been taken into account due to longer road distances and distances to Danube harbours.
Location for LCB plant should be direct or in vicinity of Danube river. Of course, there are also many other impacts on location selection, but here are compared three possible, based on feedstock availability: Apatin, Novi Sad and Pancevo. All three have, or easily can reach capacity needed for this feedstock shipping.
Fig. 37 Supply regions with available amount of corn stover and potential locations of LCB plant
Type of transportation vehicle, including vessels, and loads, are given in chapter 4.
Due to difference for round and big rectangular bales it is presumed that 70 % of total supply mass is in the form of round bales, and 30 % big rectangular.
The main reasons for considering transportation of biomass by inland waterway transport are: favourable price of this transport mode in comparison to the other transport modes, transporting and handling of much greater amount of biomass per vessel than per road vehicle, environmental protection through significant reduction of emissions and low importance of transport times for biomass as cargo. Additionally only water transport can
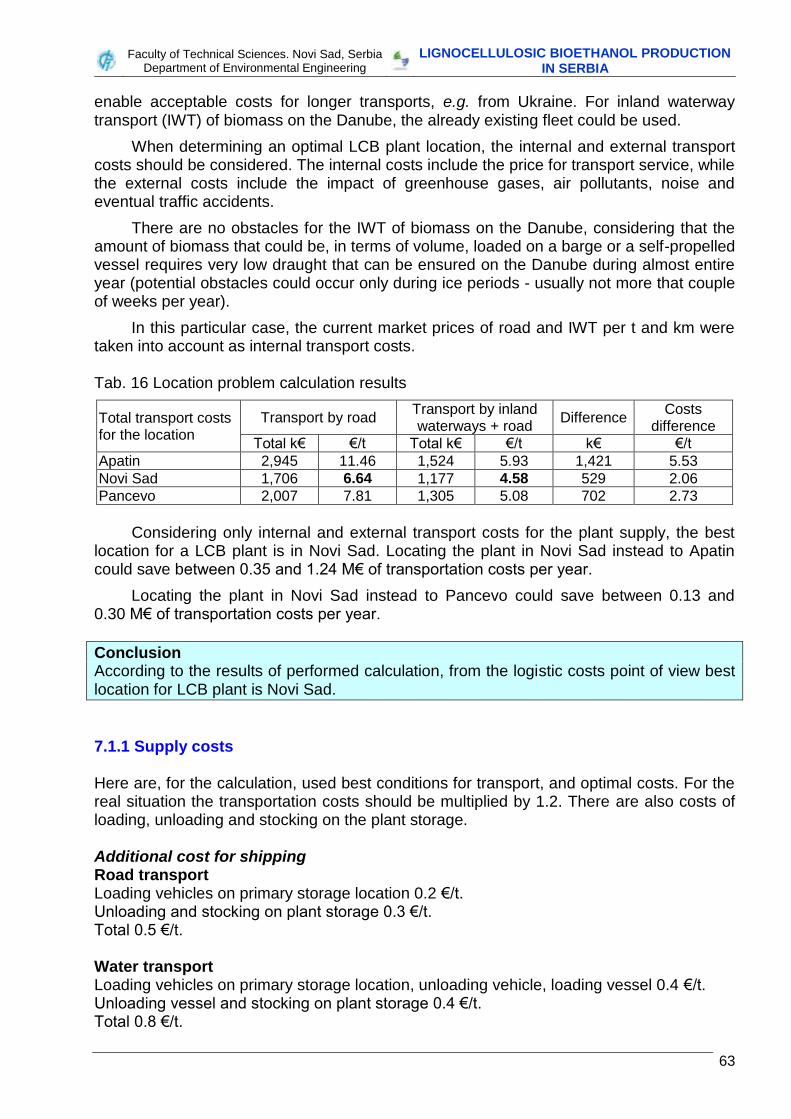
Faculty of Technical Sciences. Novi Sad, Serbia
Department of Environmental Engineering LIGNOCELLULOSIC BIOETHANOL PRODUCTION
IN SERBIA
63
enable acceptable costs for longer transports, e.g. from Ukraine. For inland waterway transport (IWT) of biomass on the Danube, the already existing fleet could be used.
When determining an optimal LCB plant location, the internal and external transport costs should be considered. The internal costs include the price for transport service, while the external costs include the impact of greenhouse gases, air pollutants, noise and eventual traffic accidents.
There are no obstacles for the IWT of biomass on the Danube, considering that the amount of biomass that could be, in terms of volume, loaded on a barge or a self-propelled vessel requires very low draught that can be ensured on the Danube during almost entire year (potential obstacles could occur only during ice periods - usually not more that couple of weeks per year).
In this particular case, the current market prices of road and IWT per t and km were taken into account as internal transport costs. Tab. 16 Location problem calculation results
Total transport costs for the location
Transport by road Transport by inland waterways + road
Difference Costs
difference Total k€ €/t Total k€ €/t k€ €/t
Apatin 2,945 11.46 1,524 5.93 1,421 5.53 Novi Sad 1,706 6.64 1,177 4.58 529 2.06 Pancevo 2,007 7.81 1,305 5.08 702 2.73
Considering only internal and external transport costs for the plant supply, the best
location for a LCB plant is in Novi Sad. Locating the plant in Novi Sad instead to Apatin could save between 0.35 and 1.24 M€ of transportation costs per year.
Locating the plant in Novi Sad instead to Pancevo could save between 0.13 and 0.30 M€ of transportation costs per year.
Conclusion According to the results of performed calculation, from the logistic costs point of view best location for LCB plant is Novi Sad.
7.1.1 Supply costs Here are, for the calculation, used best conditions for transport, and optimal costs. For the real situation the transportation costs should be multiplied by 1.2. There are also costs of loading, unloading and stocking on the plant storage. Additional cost for shipping Road transport Loading vehicles on primary storage location 0.2 €/t. Unloading and stocking on plant storage 0.3 €/t. Total 0.5 €/t. Water transport Loading vehicles on primary storage location, unloading vehicle, loading vessel 0.4 €/t. Unloading vessel and stocking on plant storage 0.4 €/t. Total 0.8 €/t.
Faculty of Technical Sciences. Novi Sad, Serbia
Department of Environmental Engineering LIGNOCELLULOSIC BIOETHANOL PRODUCTION
IN SERBIA
64
Organizational costs for contracting and logistic should be also calculated. Here are presumed to be 2 €/t of moist feedstock. Tab. 17 Supply costs for location Novi Sad (all costs in €/t, and for moisture content 25 %, except last row)
Operation Road transport Water transport
Price of feedstock1 34
Shipping costs 8.0 5.5
Additional costs 0.5 0.8
Organizational costs 2.0 2.0
Total 44.5 42.3
Total of dry material 59.3 56.4 1 Average price on primary storage according to explanation given in chapter 5
Storage costs on plant storage, manipulation/feeding, and pre-processing expenses
are not included here, but are the part of operational costs or LCB plant. Costs comparison with example in practice
The only existing logistic unit in Province Vojvodina is Victoria Group Logistic. This unit looks after for crop residues, wheat and soybean straw supply for two big consumers. One is biomass boiler for thermal energy supply of soybean processing unit Sojaprotein in Becej, about 15,000 t/a, and another straw pelletizing unit in Zrenjanin, with consumption of about 25,000 t/a. They practice payment of 10 to 15 € per hectare for farmers. This is 5 to 7 €/t of collected straw. Total costs on primary storage are in average 45 €/t, moisture content about 14 %. Due to very good organization of logistic, transport distance under 50 km, final costs, on processor yard, are 50 to 55 €/t. Actually, they also contract better overall price with soybean supplier of Sojaprotein. They cover following communities: Becej, Zrenjanin, Novi Becej, Zabalj, Vrbas, Srbobran, and partly Novi Sad and Kula.
Person in charge of these activities, Mr. Mandic, expressed optimisms related to the possibility of collecting 250,000 t of corn stover, average moisture content 20 %, but he estimated that the total costs would be about 65 €/t of dry mater. This value is little bit overestimated (comparing with previously mentioned for wheat and soybean straw), but it is close to previously calculated.
7.2 Profitability of investment
For the financial analysis is used simplified developed tool, software (Martinov and Djatkov, 2011). For the analyses were also respected national rules, regulations and instructions for investors.
General conditions are:
Time of project completing is twelve months.
Project lasting is twenty years.
The discount rate is calculated as the weighted average value of the total financing sources, whereby it is assumed that the investor's own capital to be placed on the market with an interest rate of 4.5 % per annum.
The purchases of the primary means, with lasting period shorter than half of project lasting, are proposed to be financed from plant accumulation.
Faculty of Technical Sciences. Novi Sad, Serbia
Department of Environmental Engineering LIGNOCELLULOSIC BIOETHANOL PRODUCTION
IN SERBIA
65
Profit tax in Serbia is 15 %.
Criterions for investment profitability are:
Average annual net gain is at least 15 %.
Net current value of project is positive.
Liquidity is achieved in all years.
Internal rate of return is higher than discount rate.
Internal rate of return of own and shareholders capital is twice higher than discount rate.
Payback period is less than half of project lasting.
The financial analyses are performed so to define minimal price of LCB needed to obtain profitability of investment. 7.2.1 Expenses Capital expenses
Capital expenses, CAPEX, are based on data obtained for LCB plant type PROESATM. They are:
Overall expenses of suppliers and local costs, including license and spare parts for one year are 100 M€3.
Fund working capital based on OPEX (4 to 6.6 M€) calculated based on annual income and turnover ratio 10.
Expenses for loan processing 1 % (applied only if loans are included).
Total CAPEX are calculated as a sum of mentioned. Operational expenses
Operational expenses, OPEX, annual business expenses, include:
Annual expenses for feedstock, corn stover, based on dry matter, 200,000 t x costs per tone (supply management included).
Costs of enzymes and yeasts are 180 € per tone of produced LCB.
Ash disposal expenses are 10,000 t of ashes x 12.5 €/t.
Gross salaries are 40 employees x 800 €/month x 12 months.
Maintenance costs, based on average about 2 %, are 2.000,000 € per annum.
Annual expenses for license are based on costs per tone, 22 to 26 €.
Other business expenses, heating, cleaning, marketing, assurance, consumables, etc. 300,000 €.
Due to energy self supply, costs are zero. 7.2.2 Financial analysis
The following cases have been analysed: A – Finances sources and incentives impact. Cost of feedstock 60 €/t of dry matter, costs of license 22 €/t of produced LCB, three scenarios of finances:
3 M means mega, million.
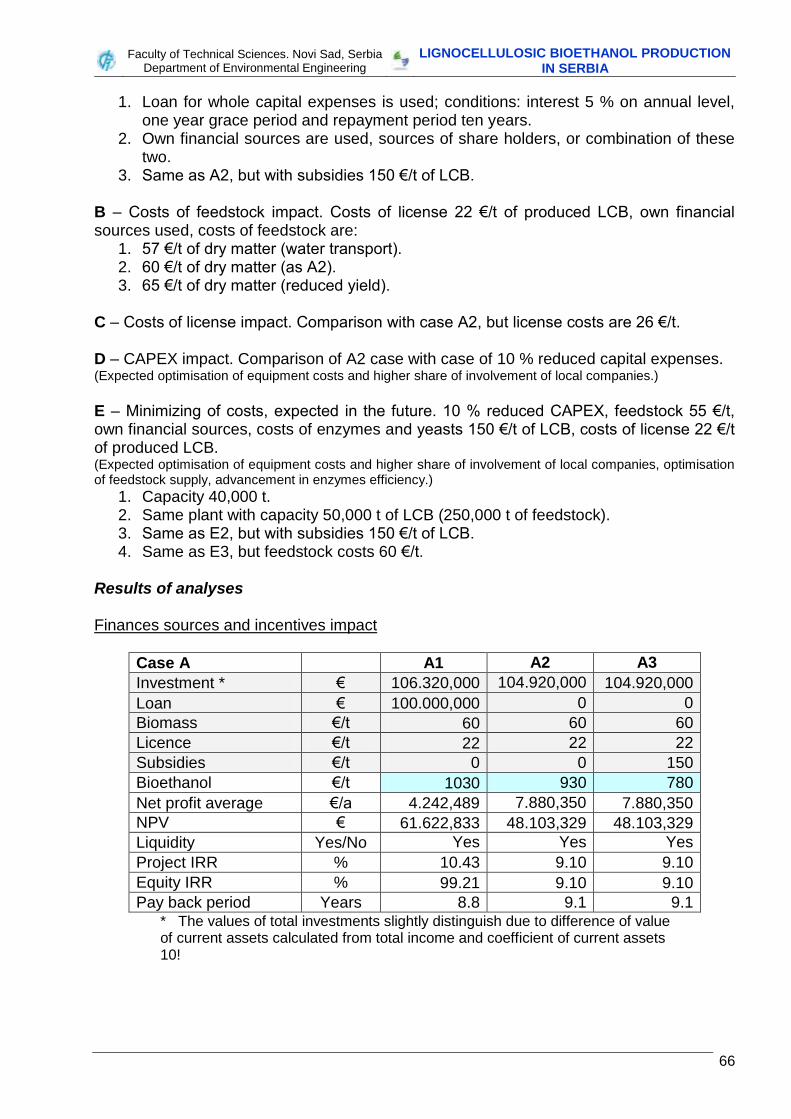
Faculty of Technical Sciences. Novi Sad, Serbia
Department of Environmental Engineering LIGNOCELLULOSIC BIOETHANOL PRODUCTION
IN SERBIA
66
1. Loan for whole capital expenses is used; conditions: interest 5 % on annual level, one year grace period and repayment period ten years.
2. Own financial sources are used, sources of share holders, or combination of these two.
3. Same as A2, but with subsidies 150 €/t of LCB. B – Costs of feedstock impact. Costs of license 22 €/t of produced LCB, own financial sources used, costs of feedstock are:
1. 57 €/t of dry matter (water transport). 2. 60 €/t of dry matter (as A2). 3. 65 €/t of dry matter (reduced yield).
C – Costs of license impact. Comparison with case A2, but license costs are 26 €/t. D – CAPEX impact. Comparison of A2 case with case of 10 % reduced capital expenses. (Expected optimisation of equipment costs and higher share of involvement of local companies.)
E – Minimizing of costs, expected in the future. 10 % reduced CAPEX, feedstock 55 €/t, own financial sources, costs of enzymes and yeasts 150 €/t of LCB, costs of license 22 €/t of produced LCB. (Expected optimisation of equipment costs and higher share of involvement of local companies, optimisation of feedstock supply, advancement in enzymes efficiency.)
1. Capacity 40,000 t. 2. Same plant with capacity 50,000 t of LCB (250,000 t of feedstock). 3. Same as E2, but with subsidies 150 €/t of LCB. 4. Same as E3, but feedstock costs 60 €/t.
Results of analyses Finances sources and incentives impact
Case A A1 A2 A3
Investment * € 106.320,000 104.920,000 104.920,000
Loan € 100.000,000 0 0
Biomass €/t 60 60 60
Licence €/t 22 22 22
Subsidies €/t 0 0 150
Bioethanol €/t 1030 930 780
Net profit average €/a 4.242,489 7.880,350 7.880,350
NPV € 61.622,833 48.103,329 48.103,329
Liquidity Yes/No Yes Yes Yes
Project IRR % 10.43 9.10 9.10
Equity IRR % 99.21 9.10 9.10
Pay back period Years 8.8 9.1 9.1 * The values of total investments slightly distinguish due to difference of value of current assets calculated from total income and coefficient of current assets 10!
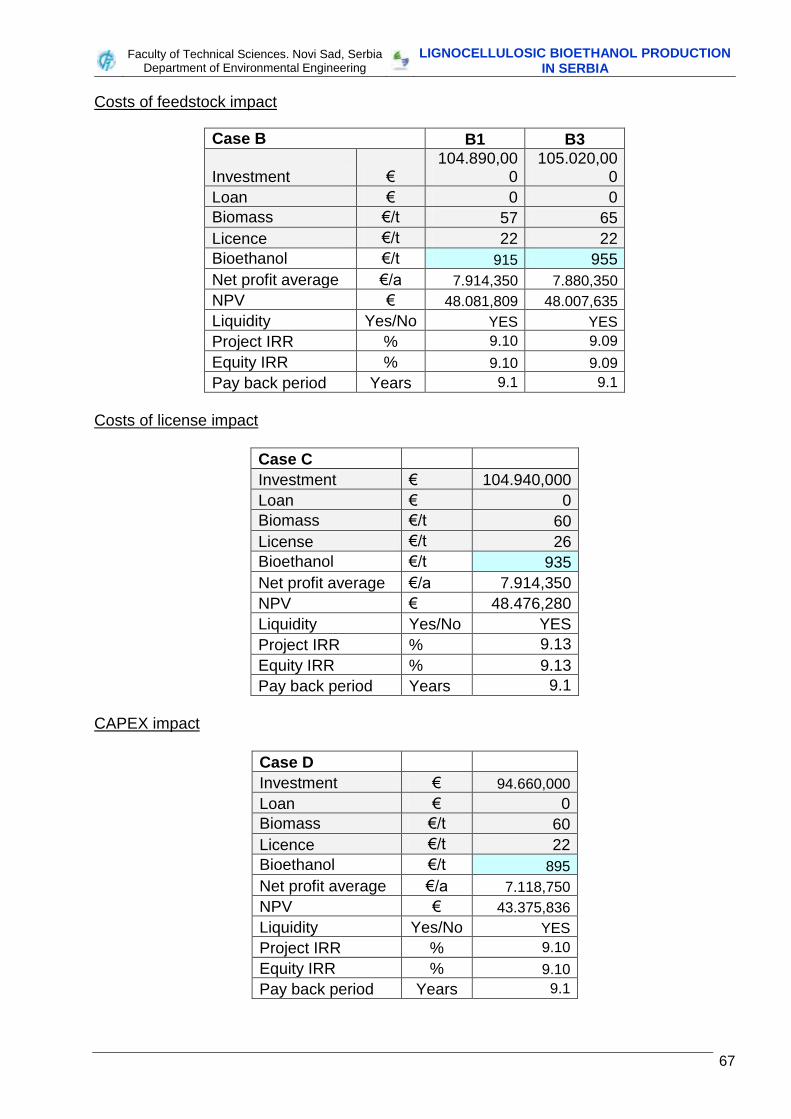
Faculty of Technical Sciences. Novi Sad, Serbia
Department of Environmental Engineering LIGNOCELLULOSIC BIOETHANOL PRODUCTION
IN SERBIA
67
Costs of feedstock impact
Case B B1 B3
Investment € 104.890,00
0 105.020,00
0
Loan € 0 0
Biomass €/t 57 65
Licence €/t 22 22
Bioethanol €/t 915 955
Net profit average €/a 7.914,350 7.880,350
NPV € 48.081,809 48.007,635
Liquidity Yes/No YES YES
Project IRR % 9.10 9.09
Equity IRR % 9.10 9.09
Pay back period Years 9.1 9.1
Costs of license impact
Case C
Investment € 104.940,000
Loan € 0
Biomass €/t 60
License €/t 26
Bioethanol €/t 935
Net profit average €/a 7.914,350
NPV € 48.476,280
Liquidity Yes/No YES
Project IRR % 9.13
Equity IRR % 9.13
Pay back period Years 9.1
CAPEX impact
Case D
Investment € 94.660,000
Loan € 0
Biomass €/t 60
Licence €/t 22
Bioethanol €/t 895
Net profit average €/a 7.118,750
NPV € 43.375,836
Liquidity Yes/No YES
Project IRR % 9.10
Equity IRR % 9.10
Pay back period Years 9.1
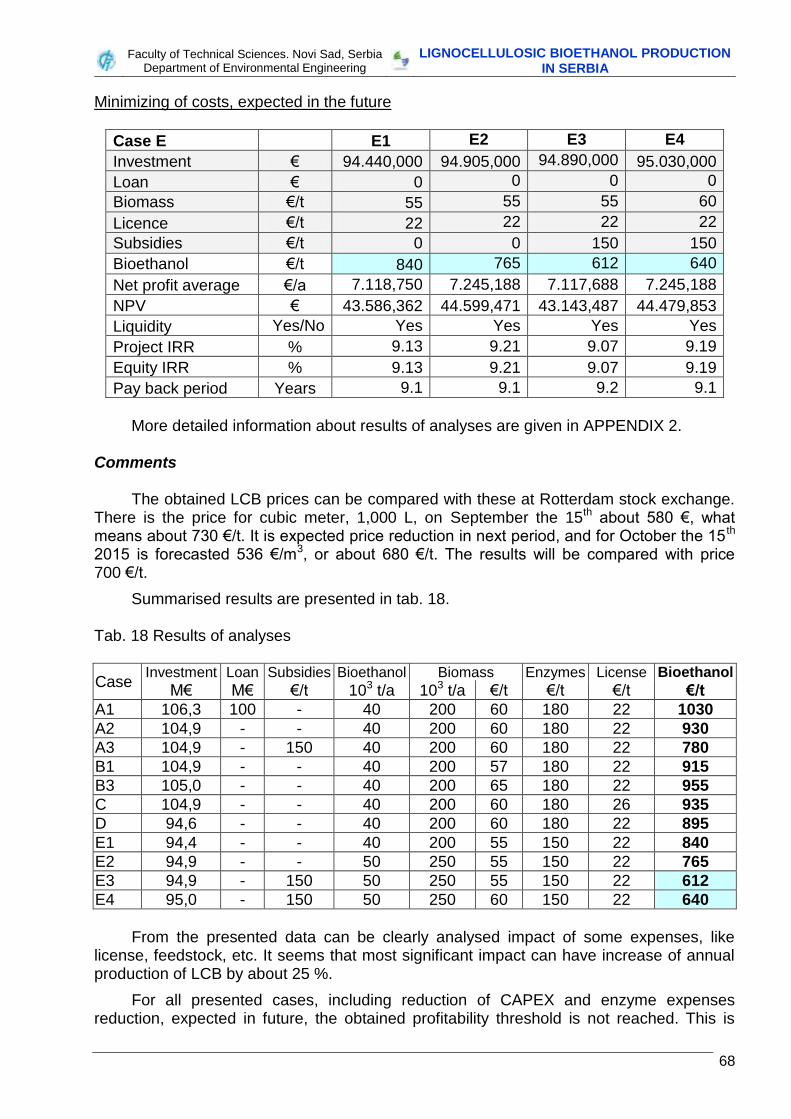
Faculty of Technical Sciences. Novi Sad, Serbia
Department of Environmental Engineering LIGNOCELLULOSIC BIOETHANOL PRODUCTION
IN SERBIA
68
Minimizing of costs, expected in the future
Case E E1 E2 E3 E4
Investment € 94.440,000 94.905,000 94.890,000 95.030,000
Loan € 0 0 0 0
Biomass €/t 55 55 55 60
Licence €/t 22 22 22 22
Subsidies €/t 0 0 150 150
Bioethanol €/t 840 765 612 640
Net profit average €/a 7.118,750 7.245,188 7.117,688 7.245,188
NPV € 43.586,362 44.599,471 43.143,487 44.479,853
Liquidity Yes/No Yes Yes Yes Yes
Project IRR % 9.13 9.21 9.07 9.19
Equity IRR % 9.13 9.21 9.07 9.19
Pay back period Years 9.1 9.1 9.2 9.1
More detailed information about results of analyses are given in APPENDIX 2.
Comments
The obtained LCB prices can be compared with these at Rotterdam stock exchange. There is the price for cubic meter, 1,000 L, on September the 15th about 580 €, what means about 730 €/t. It is expected price reduction in next period, and for October the 15 th 2015 is forecasted 536 €/m3, or about 680 €/t. The results will be compared with price 700 €/t.
Summarised results are presented in tab. 18. Tab. 18 Results of analyses
Case Investment Loan Subsidies Bioethanol Biomass Enzymes License Bioethanol
M€ M€ €/t 103 t/a 103 t/a €/t €/t €/t €/t
A1 106,3 100 - 40 200 60 180 22 1030
A2 104,9 - - 40 200 60 180 22 930
A3 104,9 - 150 40 200 60 180 22 780
B1 104,9 - - 40 200 57 180 22 915
B3 105,0 - - 40 200 65 180 22 955
C 104,9 - - 40 200 60 180 26 935
D 94,6 - - 40 200 60 180 22 895
E1 94,4 - - 40 200 55 150 22 840
E2 94,9 - - 50 250 55 150 22 765
E3 94,9 - 150 50 250 55 150 22 612
E4 95,0 - 150 50 250 60 150 22 640
From the presented data can be clearly analysed impact of some expenses, like
license, feedstock, etc. It seems that most significant impact can have increase of annual production of LCB by about 25 %.
For all presented cases, including reduction of CAPEX and enzyme expenses reduction, expected in future, the obtained profitability threshold is not reached. This is

Faculty of Technical Sciences. Novi Sad, Serbia
Department of Environmental Engineering LIGNOCELLULOSIC BIOETHANOL PRODUCTION
IN SERBIA
69
also valid for expected reduction of CAPEX and enzymes in the future. Only if incentives 150 €/t are applied, production can be profitable, cases E3 and E4.
Faculty of Technical Sciences. Novi Sad, Serbia
Department of Environmental Engineering LIGNOCELLULOSIC BIOETHANOL PRODUCTION
IN SERBIA
70
8. CONCLUSIONS
In chapter INTRODUCTION many open questions related to lignocellulosic bioethanol production based on corn stover and other crop residues are presented. Aim of this study was to try to give the answers and future expectation, and, especially, to assess possibility of profitable production of LCB in Serbia. Crucial prerequisite is, of course, to define potentials for LCB domestic production, and surrounding countries. Also is important to emphasize needed R&D activities in the future.
1. LCB production technology – maturity
Although many pilot and even demonstration plants confirmed viability of LCB production technology, due to lack of reliable information of some aspects on commercial plants, maturity of it still can not be confirmed. Serbia may not, due to many reasons, invest in uncertain and not profitable LCB plant. As it is in chapter 2 mentioned, there were long period of preparatory for now operating plants, and it is already time to start with it in Serbia. Due to fact that few commercial plants, based on corn stover as feedstock, are recently put into operation, it is expected that this technology can be ascertained as viable or not, within one year, or maximal two.
For Serbia is prerequisite to have the reliable data for the utilization of corn stover as a feedstock for LCB production. Interesting would be also, from feedstock potential and supply point of view, to have possibility to use wheat straw and other crop residues – plant materials, in the same plant. This plant should be also more tolerant regarding higher soiling, ash content, in feedstock, typical for corn stover. Also, due to clear reasons, preferential will be application of European technology and equipment.
Based on the study outcomes it seems that PROESATM procedure is promising. This include thermal pre-treatment, it is tolerant regarding high level of soiling. The possibility of changing of feedstock, corn stover – corn cobs – wheat straw, is proven and confirmed. It is possible to use lignin for the generation of electric and thermal energy needed for the process, and, combined with purification, closed loop for needed water.
However, this technology, like others, is still in developing phase, and further advancements are expected in next period. For example, it is expected development of more efficient enzymes, what can have direct impact on the reduction of operational costs.
2. Feedstock potential
All backgrounds for assessment of realistic feedstock potential are elaborated. A new term is introduced: Potential for biofuels. Corn stover is identified to be most important potential source for LCB production in Serbia. The potential of it is assessed to be, in the Province Vojvodina, about 450,000 tons of dry matter. As reserve can be used about 50,000 tons of corn cobs and about 100,000 tons of cereal straw.
Additional can be counted with about 60,000 tons of corn stover available in regions out of Vojvodina, central Serbia. It has been assessed that from Croatia and Hungary can be imported about 150,000 tons of corn stover.
Faculty of Technical Sciences. Novi Sad, Serbia
Department of Environmental Engineering LIGNOCELLULOSIC BIOETHANOL PRODUCTION
IN SERBIA
71
3. Harvest and storage technology of corn stover
Harvested forms of corn stover are round bales, ϕ1.5x1.2 m, and big rectangular bales, best dimensions 1.2x0.8x2.4 m.
Applying three or even four pass harvest technology results with high soiling, and ash content reach up to 20 % (ash content of clean corn stover, content of mineral matters, is about 5 %). Striving is to reduce soiling to the maximal 5 %. This can be obtained only by applying of single or two-pass harvest. In the same time harvest of corn stover must not considerable reduce productivity of grain harvest (productivity reduction of 10 % is stated as upper limit). This is nowadays possible to obtain only by applying two-pass harvest procedure. Until now is developed, as practice applicable, use of header with chopper and windrower, followed with balling. Unfortunately, there is no windrower offered on European market. Also, after introducing this procedure, some time is needed to equip enough combines with it. That means, nowadays is in Serbia available only three-pass procedure, what is followed by higher ash content.
For the season 2015 is planned own experiment with so called high cut (also two-pass) of corn plants. This harvest procedure will be evaluated as positive if reduction of grain harvest productivity would be within defined limit, and additional grain losses under 0.5 %.
Harvest of cereal straw can be treated as solved.
Best possibility of storage of bales, based on experiences in United States, is on open air, on elevated terrain (protection of ground water), and covered by tarpaulin (protection from precipitations). Own testing of bale storage is planed for season 2015.
4. Supply chain, supply security
Based on previous defined potentials, supply regions are identified. For the supply chains, two possibilities are elaborated, road and water transport. Loadings of common vehicles and vessels are calculated. Previously developed method is used to calculate transport costs for three selected potential locations for LCB plant, all next to Danube harbours. Best result is obtained for Novi Sad.
Supply security is identified as serious problem. One issue is contracting and obtaining secure delivery for realistic price. The other is fluctuation of yield of corn and corn stover, depending on weathering. Own investigation showed that in favourable seasons yield is doubled compared with it in seasons with extreme drought. This can be overcome by use of other crop residues, corn cobs and straw, and by making corn stover reserves.
5. Feedstock costs
Terminology for these costs is introduced: price of feedstock (on primary storage), and logistic costs. Sum of this two makes supply costs. (Feedstock costs include supply costs and preparatory costs on plant. The costs of preparatory are included in operational costs.) Supply costs depend on many influences. Here is calculated that they are, in average, 60 and 57 €/t, for road and water transport, respectively.
Faculty of Technical Sciences. Novi Sad, Serbia
Department of Environmental Engineering LIGNOCELLULOSIC BIOETHANOL PRODUCTION
IN SERBIA
72
These values are given for dry season. In the case of extreme dry seasons those costs are expected to be higher, due to yield reduction.
6. Environmental impacts
From the ILUC point of view, using corn stover and other crop residues for biofuel production is very positive.
Here are presented results of own investigation of corn stover harvest, harvested and on field remained mass. Almost in all cases remained mass enables, under mentioned conditions, protection of wind erosion.
Following request in Directives 2009/28/EC and 2009/30/EC related to the eligibility for subsidies, GHG (CO2eq) emissions of feedstock procurement are calculated. They are compared with values obtained for 60 % reduction of these for fossil fuels, and expressed as a share of it. It is found out that for road transport 60 km to the supply region centre can be treated as upper limit. Share of GHG emissions for feedstock procurement are in range 34 to 47 % of total permitted emissions. Calculation of GHG emissions for the case of water transport has not been performed, due to lack of data bases for it. It can be only expected that water transport can considerably increase acceptable transport distances.
There are not available data related to GHG emissions for LCB production and delivery to the users. However, here given results present good background for precise calculation of overall emissions.
7. Profitability of investment
Based on estimated supply costs, and needed 5 tons of corn stover dry matter for one tone of bioethanol, feedstock costs make about 0.30 €/kg, or 0.24 €/L.
Profitability calculation is performed by using capital and operational expenses for the plant with annual production of 40,000 tons of bioethanol. Selling price of bioethanol has been calculated, for different conditions, sources of finances and costs of feedstock, feedstock costs, etc. These prices, in the range 840 to 1,030 €/t, are above market price, now about 700 €/t.
It is also considered reduction of CAPEX, 10 %, which can be result of further development and higher engagement of product and services in Serbia, and expected reduction of enzymes costs, due to improvement of their efficiency, from 180 to 150 €/t of produced LCB. Also with this reduction the profitable production can not be obtained. First after introduction of incentives, subsidies, 150 €/t, can be achieved profitable production, with the prices in range 612 to 640 €/t.
This calculation should be treated as preliminary, and valid for given case, CAPEX and OPEX, and other conditions for financial appraisal.
Faculty of Technical Sciences. Novi Sad, Serbia
Department of Environmental Engineering LIGNOCELLULOSIC BIOETHANOL PRODUCTION
IN SERBIA
73
REFERENCES
1. Aden, A., Ruth, M., Ibsen, K., Jechura, J., Neeves, K., Sheehan, J., Wallace, B., Montague, L., Slayton, A., Lukas, J. 2002. Lignocellulosic Biomass to Ethanol Process Design and Economics Utilizing Co-Current Dilute Acid Prehydrolysis and Enzymatic Hydrolysis for Corn Stover. National Renewable Energy Laboratory (NREL), Colorado, USA.
2. Allmaras, R.R., Linden, D.R., Clapp, C.E .2012. Corn-residue transformations into root and soil carbon as related to nitrogen, tillage, and stover management. Soil Sci. Soc. Am. J. 68(4): 1366-1375.
3. Alvira, P., Tomás-Pejó, E., Ballesteros, M., Negro, M.J. 2010. Pretreatment technologies for an efficient bioethanol production process based on enzymatic hydrolysis: A review. Bioresource Technology 101: 4851–4861.
4. Archer, D.W., Karlen, D.L., Liebig, M.A. 2014. Crop Residue Harvest Economics: An Iowa and North Dakota Case Study. Bioenergy Research 7: 568–575.
5. Avila-Segura, M., Barak, P., Hedtcke, J.L., Posner, J.L. 2011. Nutrient and alkalinity removal by corn grain, stover and cob harvest in Upper Midwest USA. Biomass and Bioenergy 35 (3): 1190-1195.
6. Banerjee, S., Mudliar, S., Sen, R., Giri, B., Satpute, D., Chakrabarti, T., et. al. 2010. Commercializing lignocellulosic bioethanol: technology bottlenecks and possible remedies. Biofuels, Bioproducts and Biorefining 4: 77–93.
7. Blum, W.E.H., Gerzabek, M.H., Hackländer, K., Horn, R., Reimoser, F., Winiwarter, W., Zechmeister-Boltenstern, S., Zehetner, F. 2010. Ecological consequences of biofuels. In: Lal R and Stewart BA: Soil quality and biofuel production, Taylor & Francis Group, Roca Raton, pp 63-91.
8. Bojic, Sanja, Djatkov, Dj., Brcanov, D., Georgijevic, M., Martinov, M. 2013. Location allocation of solid biomass power plants: Case study of Vojvodina. Renewable and Sustainable Energy Reviews 26: 769-775.
9. Bojic, Sanja. 2013. Location Problems in Supply Chains and their influence on the logistic costs. PhD thesis. Faculty of Technical Sciences, Novi Sad.
10. Cecava, M.J. 2010. Storage and processing of corn stover Eastern Iowa mid-scale trials: Practical considerations. Near-term Opportunities for Biorefineries Sypmposium, October 11-12, Champaign, IL.
11. Chen, H., Qiu, W. 2010. Key technologies for bioethanol production from lignocellulose. Biotechnology Advances 28: 556–562.
12. Clini, C., Rebuá, Mariangela, Ericson, S.O. ed. 2011. The global bioenergy partnership sustainability indicators for bioenergy – First edition. GBEP Secretariat, Food and Agricultural Organization of the United Nations (FAO), Climate, Energy and Tenure Division, Rome.
13. Cook, D.E., Shinners, K.J. 2011. Economics of alternative corn stover logistics systems. ASABE Paper No. 1111130. St. Joseph, Mich.
14. Coulter, J.A., Nafziger, A, Emerson, D. 2008. Continuous corn response to residue management and nitrogen fertilization. Agronomy Journal 100(6): 1774-1780.
15. Darr, M., Birrell, S., Shah, A., Webster, K., Thoreson, C. 2009. Analysis of corn stover harvesting equipment and corn stover storage methods, Iowa State University, College of Agriculture and Life Sciences.
16. Denvir, B., Bauen, A., Panoutsou, Calliope, Stojadinovic, D. 2015. Sustainability Criteria for Biofuels: Report for Serbia. E4tech Ltd, London.
17. Eisenhuber, Katharina, Krennhuber, K., Steinmüller, V., Jäger, A. 2013. Comparison of Different Pre-Treatment Methods for Separating Hemicellulose from Straw during Lignocellulose Bioethanol Production. Energy Procedia 40: 172–181.
18. Gerzabek, M.H. 2014. Global soil use in biomass production: opportunities and challenges of ecological and sustainable intensification in agriculture. Die Bodenkultur 65(1): 5-15.
19. Golub, M., Bojic, S., Djatkov, Dj., Mickovic, G., Martinov, M. 2012. Corn stover harvesting for renewable energy and residual soil effects. Agricultural mechanization in Asia, Africa, and Latin America 43(4): 72-79.
Faculty of Technical Sciences. Novi Sad, Serbia
Department of Environmental Engineering LIGNOCELLULOSIC BIOETHANOL PRODUCTION
IN SERBIA
74
20. Heath, G.A, Hsu D.D., Inman, D., Aden, A., Mann, M.K. 2009. Life Cycle Assessment of the Energy Independence and Security Act of 2007: Ethanol – Global Warming Potential and Environmental Emissions. In Proc. ASME 3rd International Conference on Energy Sustainability 857-861. San Francisco, California, July 19-23.
21. Hickman, J.S., Schoenberger, D.L. 1989. Estimating corn residue, Cooperative Extension Service. Manhattan: Kansas.
22. Hoskinson, R.L., Karlen, D.L., Birrell, S.J., Radtke, C.W., Wilhelm, W. 2007. Engineering, nutrient removal, and feedstock conversion evaluations of four corn stover harvest scenarios. Biomass and Bioenergy 31(2-3): 126–136.
23. Humbird, D., Davis, R., Tao, L., Kinchin, Hsu, D., Aden, A., Schoen, P., Lukas, J., Olthof, B., Worley, M., Sexton, D., Dudgeon, D. 2011. Process Design and Economics for Biochemical Conversion of Lignocellulosic Biomass to Ethanol: Dilute-Acid Pretreatment and Enzymatic Hydrolysis of Corn Stover. National Renewable Energy Laboratory (NREL), Colorado, USA.
24. Ibrahim‚ H.A.H. 2012. Pretreatment of straw for bioethanol production. Energy Procedia 14: 542–551.
25. Ilic, M. ed. 2003. Energy potentials and characteristics of residual biomass and technologies for its processing and utilization as energy source in Serbia (Energetski potencijal i karakteristike ostataka biomase i tehnologije za njenu pripremu i energetsko iskorišćenje u Srbiji). Institute Vinca, Belgrade. In Serbian.
26. Johnson, J.M.F., Wilhelm, W., Karlen, D.L., Archer, D.W., Wienhold, B. 2010. Nutrient removal as a function of corn stover cutting height and cob harvest. Bioenergy Research 3(4): 342–352.
27. Karlen, D.L., Birell, S.J., Hess, J.R. 2011. A five-year assessment of corn stover harvest in central Iowa, USA. Soil & Tillage Research 115–116: 47–55.
28. Kazi, F.K., Fortman, J.A., Anex, R.P., Kothandaraman, G., Hsu, D.D., Aden, A., Dutta, A. 2010a. Techno-Economic Analysis of Biochemical Scenarios for Production of Cellulosic Ethanol. National Renewable Energy Laboratory (NREL), Colorado, USA.
29. Kazi, F.K., Fortman, J.A., Anex, R.P., Hsu, D.D., Aden, A., Dutta, A., Kothandaraman, G. 2010b. Techno-economic comparison of process technologies for biochemical ethanol production from corn stover. Fuel 89: S20–S28.
30. Keene, J.R., Shinners, K.J., Hill, L.J., Stallcop, A.J., Wemhoff, S.J., Anstey, H.D., Bruns, A.J., Johnson, J.K. 2013. Single-pass baling of corn stover. Transactions of the ASABE 56(1): 33-40.
31. Klein-Marcuschamer, D., Oleskowicz-Popiel, P., Simmons, B.A., Blanch, H.W. 2012. The Challenge of Enzyme Cost in the Production of Lignocellulosic Biofuels. Biotechnology and Bioengineering 109(4): 1083–1087.
32. Kurian, J.K, Nair, G.R., Hussain, A., Raghavan, G.S.V. 2013. Feedstock, logistics and pre-treatment processes for sustainable lignocellulosic biorefineries: A comprehensive review. Renewable and Sustainable Energy Reviews 25: 205–219.
33. Ling Tao, L., Templeton, D.W., Humbird, D., Aden, A. 2013. Effect of corn stover compositional variability on minimum ethanol selling price (MESP). Bioresource Technology 140: 426–430.
34. Littlewood, J., Murphy, R.J., Wang, L. 2013. Importance of policy support and feedstock prices on economic feasibility of bioethanol production from wheat straw in the UK. Renewable and Sustainable Energy Reviews 17: 291–300.
35. Ma, S., Eckhoff, S.R. 2014. Economy of scale for biomass refineries: bulk densities, transportation cost, and producer incentives. Transactions of the ASABE 57(1): 85-91.
36. Martinov, M., Djatkov, Dj., Golub, M., Bojic, S., Viskovic, M. 2015. Corn stover as a feedstock for advanced biofuels in Serbia. ABBE 2015-workshop: Advanced Biofuels, Biorefinery and Bio-Economy– A challenge for Central and East European Countries, Bratislava, 25th-27th March, Book of Abstracts, 33.
37. Martinov, M., Brkić, M., Janjić, T., Đatkov, Đ., Golub, M. 2011. Biomass in Vojvodina –RES 2020 (Biomasa u Vojvodini –RES 2020). Contemporary agricultural engineering 37(2): 119-134.
38. Martinov, M., Djatkov, Dj. ed. 2011. Program za ocenu ekonomskih pokazatelja za energetsku primenu biomase (Program for the assessment of economic performances for application of biomass as energy source). Faculty of Technical Sciences, Novi Sad.
39. Martinov, M., Tesic, M. 2008. Cereal/soybean straw and other crop residues utilization as fin Serbia–status and prospects. In Scarlat, N, Dallemand J.F, Martinov, M. ed.: "Cereals straw
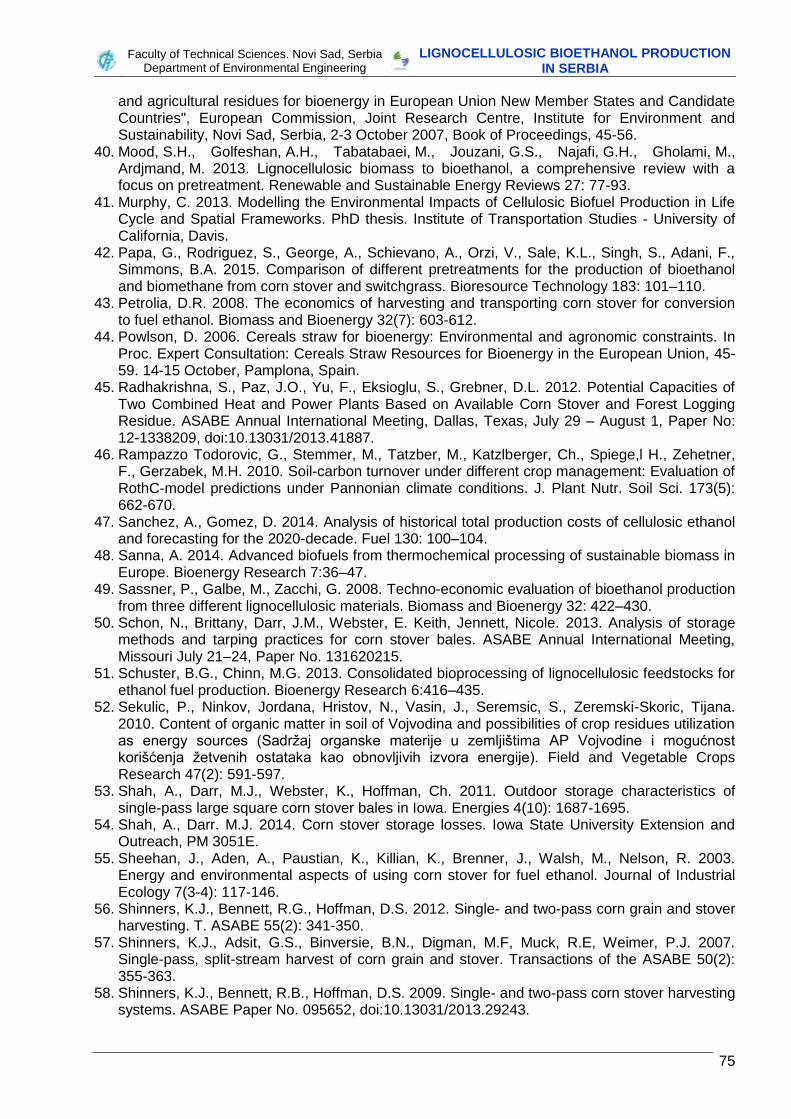
Faculty of Technical Sciences. Novi Sad, Serbia
Department of Environmental Engineering LIGNOCELLULOSIC BIOETHANOL PRODUCTION
IN SERBIA
75
and agricultural residues for bioenergy in European Union New Member States and Candidate Countries", European Commission, Joint Research Centre, Institute for Environment and Sustainability, Novi Sad, Serbia, 2-3 October 2007, Book of Proceedings, 45-56.
40. Mood, S.H., Golfeshan, A.H., Tabatabaei, M., Jouzani, G.S., Najafi, G.H., Gholami, M., Ardjmand, M. 2013. Lignocellulosic biomass to bioethanol, a comprehensive review with a focus on pretreatment. Renewable and Sustainable Energy Reviews 27: 77-93.
41. Murphy, C. 2013. Modelling the Environmental Impacts of Cellulosic Biofuel Production in Life Cycle and Spatial Frameworks. PhD thesis. Institute of Transportation Studies - University of California, Davis.
42. Papa, G., Rodriguez, S., George, A., Schievano, A., Orzi, V., Sale, K.L., Singh, S., Adani, F., Simmons, B.A. 2015. Comparison of different pretreatments for the production of bioethanol and biomethane from corn stover and switchgrass. Bioresource Technology 183: 101–110.
43. Petrolia, D.R. 2008. The economics of harvesting and transporting corn stover for conversion to fuel ethanol. Biomass and Bioenergy 32(7): 603-612.
44. Powlson, D. 2006. Cereals straw for bioenergy: Environmental and agronomic constraints. In Proc. Expert Consultation: Cereals Straw Resources for Bioenergy in the European Union, 45-59. 14-15 October, Pamplona, Spain.
45. Radhakrishna, S., Paz, J.O., Yu, F., Eksioglu, S., Grebner, D.L. 2012. Potential Capacities of Two Combined Heat and Power Plants Based on Available Corn Stover and Forest Logging Residue. ASABE Annual International Meeting, Dallas, Texas, July 29 – August 1, Paper No: 12-1338209, doi:10.13031/2013.41887.
46. Rampazzo Todorovic, G., Stemmer, M., Tatzber, M., Katzlberger, Ch., Spiege,l H., Zehetner, F., Gerzabek, M.H. 2010. Soil-carbon turnover under different crop management: Evaluation of RothC-model predictions under Pannonian climate conditions. J. Plant Nutr. Soil Sci. 173(5): 662-670.
47. Sanchez, A., Gomez, D. 2014. Analysis of historical total production costs of cellulosic ethanol and forecasting for the 2020-decade. Fuel 130: 100–104.
48. Sanna, A. 2014. Advanced biofuels from thermochemical processing of sustainable biomass in Europe. Bioenergy Research 7:36–47.
49. Sassner, P., Galbe, M., Zacchi, G. 2008. Techno-economic evaluation of bioethanol production from three different lignocellulosic materials. Biomass and Bioenergy 32: 422–430.
50. Schon, N., Brittany, Darr, J.M., Webster, E. Keith, Jennett, Nicole. 2013. Analysis of storage methods and tarping practices for corn stover bales. ASABE Annual International Meeting, Missouri July 21–24, Paper No. 131620215.
51. Schuster, B.G., Chinn, M.G. 2013. Consolidated bioprocessing of lignocellulosic feedstocks for ethanol fuel production. Bioenergy Research 6:416–435.
52. Sekulic, P., Ninkov, Jordana, Hristov, N., Vasin, J., Seremsic, S., Zeremski-Skoric, Tijana. 2010. Content of organic matter in soil of Vojvodina and possibilities of crop residues utilization as energy sources (Sadržaj organske materije u zemljištima AP Vojvodine i mogućnost korišćenja žetvenih ostataka kao obnovljivih izvora energije). Field and Vegetable Crops Research 47(2): 591-597.
53. Shah, A., Darr, M.J., Webster, K., Hoffman, Ch. 2011. Outdoor storage characteristics of single-pass large square corn stover bales in Iowa. Energies 4(10): 1687-1695.
54. Shah, A., Darr. M.J. 2014. Corn stover storage losses. Iowa State University Extension and Outreach, PM 3051E.
55. Sheehan, J., Aden, A., Paustian, K., Killian, K., Brenner, J., Walsh, M., Nelson, R. 2003. Energy and environmental aspects of using corn stover for fuel ethanol. Journal of Industrial Ecology 7(3-4): 117-146.
56. Shinners, K.J., Bennett, R.G., Hoffman, D.S. 2012. Single- and two-pass corn grain and stover harvesting. T. ASABE 55(2): 341-350.
57. Shinners, K.J., Adsit, G.S., Binversie, B.N., Digman, M.F, Muck, R.E, Weimer, P.J. 2007. Single-pass, split-stream harvest of corn grain and stover. Transactions of the ASABE 50(2): 355-363.
58. Shinners, K.J., Bennett, R.B., Hoffman, D.S. 2009. Single- and two-pass corn stover harvesting systems. ASABE Paper No. 095652, doi:10.13031/2013.29243.
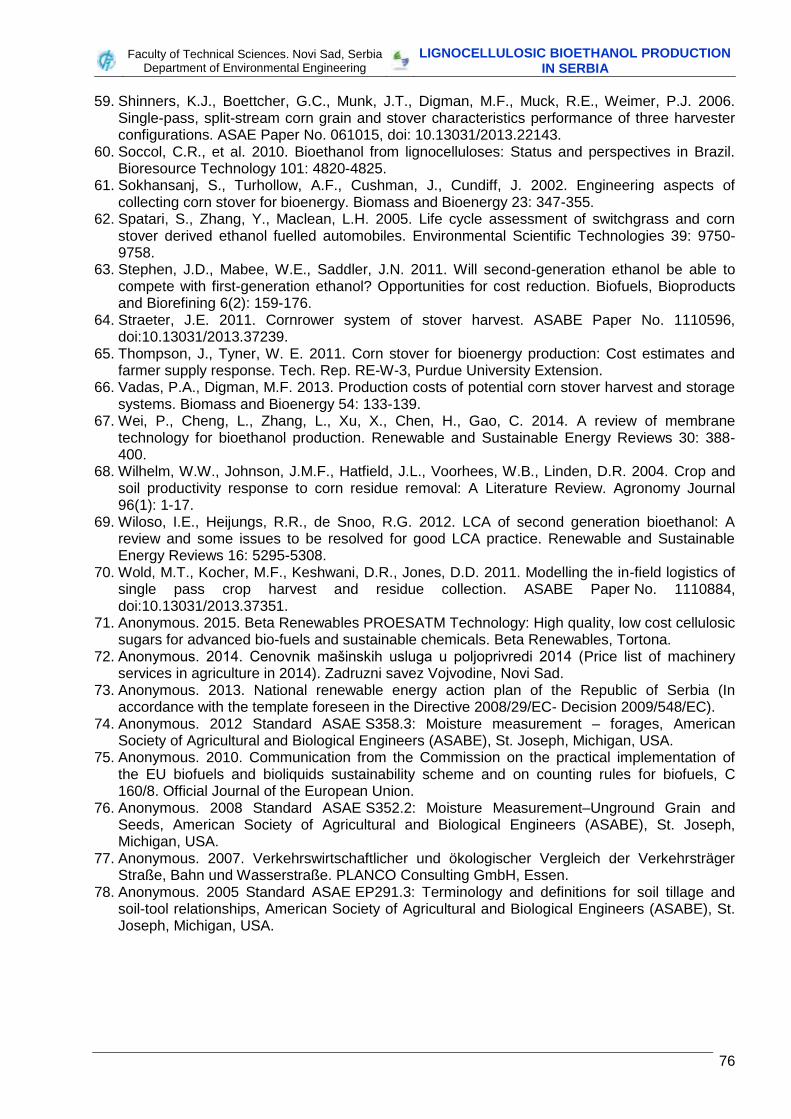
Faculty of Technical Sciences. Novi Sad, Serbia
Department of Environmental Engineering LIGNOCELLULOSIC BIOETHANOL PRODUCTION
IN SERBIA
76
59. Shinners, K.J., Boettcher, G.C., Munk, J.T., Digman, M.F., Muck, R.E., Weimer, P.J. 2006. Single-pass, split-stream corn grain and stover characteristics performance of three harvester configurations. ASAE Paper No. 061015, doi: 10.13031/2013.22143.
60. Soccol, C.R., et al. 2010. Bioethanol from lignocelluloses: Status and perspectives in Brazil. Bioresource Technology 101: 4820-4825.
61. Sokhansanj, S., Turhollow, A.F., Cushman, J., Cundiff, J. 2002. Engineering aspects of collecting corn stover for bioenergy. Biomass and Bioenergy 23: 347-355.
62. Spatari, S., Zhang, Y., Maclean, L.H. 2005. Life cycle assessment of switchgrass and corn stover derived ethanol fuelled automobiles. Environmental Scientific Technologies 39: 9750-9758.
63. Stephen, J.D., Mabee, W.E., Saddler, J.N. 2011. Will second-generation ethanol be able to compete with first-generation ethanol? Opportunities for cost reduction. Biofuels, Bioproducts and Biorefining 6(2): 159-176.
64. Straeter, J.E. 2011. Cornrower system of stover harvest. ASABE Paper No. 1110596, doi:10.13031/2013.37239.
65. Thompson, J., Tyner, W. E. 2011. Corn stover for bioenergy production: Cost estimates and farmer supply response. Tech. Rep. RE-W-3, Purdue University Extension.
66. Vadas, P.A., Digman, M.F. 2013. Production costs of potential corn stover harvest and storage systems. Biomass and Bioenergy 54: 133-139.
67. Wei, P., Cheng, L., Zhang, L., Xu, X., Chen, H., Gao, C. 2014. A review of membrane technology for bioethanol production. Renewable and Sustainable Energy Reviews 30: 388-400.
68. Wilhelm, W.W., Johnson, J.M.F., Hatfield, J.L., Voorhees, W.B., Linden, D.R. 2004. Crop and soil productivity response to corn residue removal: A Literature Review. Agronomy Journal 96(1): 1-17.
69. Wiloso, I.E., Heijungs, R.R., de Snoo, R.G. 2012. LCA of second generation bioethanol: A review and some issues to be resolved for good LCA practice. Renewable and Sustainable Energy Reviews 16: 5295-5308.
70. Wold, M.T., Kocher, M.F., Keshwani, D.R., Jones, D.D. 2011. Modelling the in-field logistics of single pass crop harvest and residue collection. ASABE Paper No. 1110884, doi:10.13031/2013.37351.
71. Anonymous. 2015. Beta Renewables PROESATM Technology: High quality, low cost cellulosic sugars for advanced bio-fuels and sustainable chemicals. Beta Renewables, Tortona.
72. Anonymous. 2014. Cenovnik mašinskih usluga u poljoprivredi 2014 (Price list of machinery services in agriculture in 2014). Zadruzni savez Vojvodine, Novi Sad.
73. Anonymous. 2013. National renewable energy action plan of the Republic of Serbia (In accordance with the template foreseen in the Directive 2008/29/EC- Decision 2009/548/EC).
74. Anonymous. 2012 Standard ASAE S358.3: Moisture measurement – forages, American Society of Agricultural and Biological Engineers (ASABE), St. Joseph, Michigan, USA.
75. Anonymous. 2010. Communication from the Commission on the practical implementation of the EU biofuels and bioliquids sustainability scheme and on counting rules for biofuels, C 160/8. Official Journal of the European Union.
76. Anonymous. 2008 Standard ASAE S352.2: Moisture Measurement–Unground Grain and Seeds, American Society of Agricultural and Biological Engineers (ASABE), St. Joseph, Michigan, USA.
77. Anonymous. 2007. Verkehrswirtschaftlicher und ökologischer Vergleich der Verkehrsträger Straße, Bahn und Wasserstraße. PLANCO Consulting GmbH, Essen.
78. Anonymous. 2005 Standard ASAE EP291.3: Terminology and definitions for soil tillage and soil-tool relationships, American Society of Agricultural and Biological Engineers (ASABE), St. Joseph, Michigan, USA.
77
APPENDIX 1 Commercial plants in operation
Investor Location Raw material Starting-up Capacity, t/a
Abengoa Bioenergy Biomass of Kansas Hugoton, KS lignocellulosic crops or residues; corn stover, wheat straw, switch grass 2014 79.000
POET-DSM Advanced Biofuels Emmetsburg, IA lignocellulosic crops or residues; agricultural residues 2014 75.000
GranBio Sao Miguel, Br lignocellulosic crops or residues; Sugarcane bagasse and straw 2014 65.000
Biochemtex/TPG Capital/Novozymes Crescentino, It lignocellulosic crops or residues 2013 60.000
Gevo Luverne, MN biomass /biomass coal blends; corn 2006 54.000
Longlive Bio-technology Co. Ltd. Yucheng, Cn lignocellulosic crops or residues; corn cob 2012 50.000
Cane Technology Center (CTC) Piracicaba, Br lignocellulosic crops or residues; bagasse 2012 40.000
Raizen Energia Costa Pinto, Br lignocellulosic crops or residues; bagasse – 32.000
Enerkem Alberta Biofuels LP Edmonton, Ca biomass /biomass coal blends; Post-sorted municipal solid waste (MSW)
2014 30.000
INEOS Bio Vero Beach, FL lignocellulosic crops or residues; Vegetative Waste, Waste wood, Garden Waste
2013 24.000
Borregaard Industries AS Sarpsborg, No lignocellulosic crops or residues; sulphite spent liquor (SSL, 33% dry content) from spruce wood pulping
1938 15.800
Quad-County Corn Processors Galva, IA other; corn kernel fibre 2014 6.000
Commercial plants in planning
Investor Location Raw material Starting-up Capacity, t/a
Beta Renewables Brawly, NC lignocellulosic crops or residues 2016 90.000
ZeaChem Inc Boardman, OR lignocellulosic crops or residues; poplar trees, wheat straw 2014 75.000
Beta Renewables Clinton, CA lignocellulosic crops or residues; energy grasses 2016 60.000
Frontier Renewable Resources Kincheloe, MI lignocellulosic crops or residues; wood chip – 60.000
Mascoma Drayton, Ca lignocellulosic crops or residues; wood 2015 60.000
Maabjerg Energy Concept Consortium Holstebro, Dk lignocellulosic crops or residues; plant dry matter, manure 2017 50.000
Enerkem Mississippi Biofuels LLC Pontotoc, MS organic residues and waste streams; Sorted municipal solid waste and wood residues
– 30.000
Abengoa Seville, Es organic residues and waste streams 2016 22.000
78
Demo plants in operation
Investor Location Raw material Starting-up Capacity, t/a
DuPont Vonore, TN lignocellulosic crops or residues; corn stover, cobs and fibre; switchgrass 2010 750
ZeaChem Boardman, OR lignocellulosic crops or residues; poplar trees, wheat straw 2011 750
Petrobras and Blue Sugars Upton, WY sugarcane bagasse 2011 700
Woodland Biofuels Sarnia, Ca organic residues and waste streams; wood waste 2013 600
Mascoma Corporation Rome, NY lignocellulosic crops or residues; Wood Chips, Switchgrass and other raw materials
– 500
Licella Somersby, Au lignocellulosic crops or residues; Radiata Pine, Banna Grass, Algae 2008 350
SP/EPAP Ornskoldsvik, Sw lignocellulosic crops or residues; primary wood chips; sugarcane bagasse, wheat, corn stover, energy grass, recycled waste etc have been tested
2004 160
Borregaard AS Sarpsborg, No lignocellulosic crops or residues; sugarcane bagasse, straw, wood, energy crops, other lignocellulosic
2012 110
Tembec Chemical Group Temiscaming, Ca lignocellulosic crops or residues; spent sulphite liquor feedstock – 13.000
Anhui BBCA Biochemical Anhui, Cn lignocellulosic crops or residues; Corncob/corn stover 2009 5.000
Chempolis Ltd. Oulu, Fi lignocellulosic crops or residues; non-wood and non-food lignocellulosic biomass such as straw, reed, empty fruit bunch, bagasse, corn stalks, as well as wood residues
2008 5.000
Blue Sugars Corporation Upton, WY lignocellulosic crops or residues; Sugarcane bagasse and other biomass 2008 4.500
Inbicon (DONG Energy) Kalundborg, Dk lignocellulosic crops or residues; wheat straw 2009 4.300
BP Biofuels Jennings, LA lignocellulosic crops or residues; dedicated energy crops 2009 4.200
Abengoa Bioenergy Babilafuente, Es lignocellulosic crops or residues; cereal straw (mostly barley and wheat) 2008 4.000
Enerkem Westbury, Ca biomass /biomass coal blends; Treated wood (i.e. decommissioned electricity poles, and railway ties), wood waste and MSW
2009 4.000
Fiberight LLC Lawrenceville, VA organic residues and waste streams 2012 3
Henan Tianguan Group Henan, Cn lignocellulosic crops or residues; Wheat/corn stover 2009 3.000
Jilin Fuel Alcohol Jilin, Cn lignocellulosic crops or residues; Corn/sorghum stover 2008 3.000
Jilin Fuel Alcohol Jilin, Cn lignocellulosic crops or residues; Straw 2006 3.000
Shandong Zesheng Biotech Co. Shandong, Cn lignocellulosic crops or residues; Straw 2006 3.000
Summit Natural Energy Cornelius, OR other; waste 2011 3.000
Iogen Corporation Ottawa, Ca lignocellulosic crops or residues; wheat, barley and oat straw; corn stover, sugar cane bagasse and other agricultural residues
2004 1.600
Abengoa Salamanca, Es organic residues and waste streams 2013 1.190
Clariant Straubing, De lignocellulosic crops or residues; wheat straw 2012 1.000
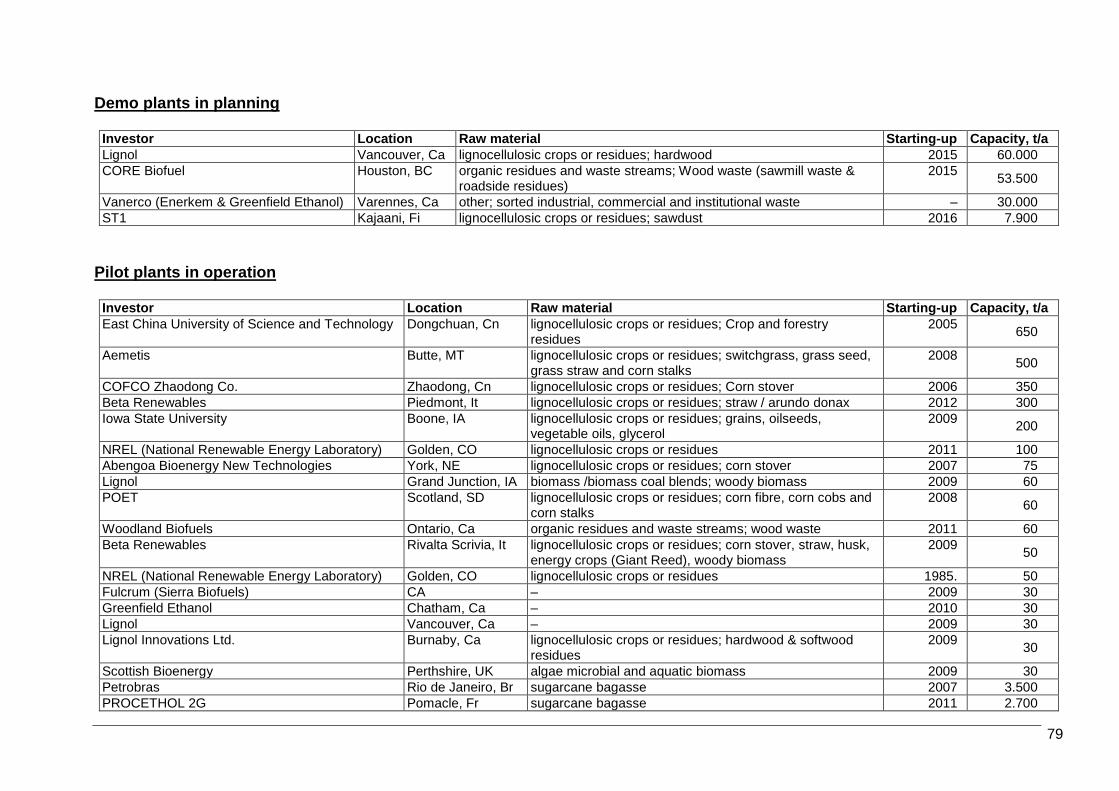
79
Demo plants in planning
Investor Location Raw material Starting-up Capacity, t/a
Lignol Vancouver, Ca lignocellulosic crops or residues; hardwood 2015 60.000
CORE Biofuel Houston, BC organic residues and waste streams; Wood waste (sawmill waste & roadside residues)
2015 53.500
Vanerco (Enerkem & Greenfield Ethanol) Varennes, Ca other; sorted industrial, commercial and institutional waste – 30.000
ST1 Kajaani, Fi lignocellulosic crops or residues; sawdust 2016 7.900
Pilot plants in operation
Investor Location Raw material Starting-up Capacity, t/a
East China University of Science and Technology Dongchuan, Cn lignocellulosic crops or residues; Crop and forestry residues
2005 650
Aemetis Butte, MT lignocellulosic crops or residues; switchgrass, grass seed, grass straw and corn stalks
2008 500
COFCO Zhaodong Co. Zhaodong, Cn lignocellulosic crops or residues; Corn stover 2006 350
Beta Renewables Piedmont, It lignocellulosic crops or residues; straw / arundo donax 2012 300
Iowa State University Boone, IA lignocellulosic crops or residues; grains, oilseeds, vegetable oils, glycerol
2009 200
NREL (National Renewable Energy Laboratory) Golden, CO lignocellulosic crops or residues 2011 100
Abengoa Bioenergy New Technologies York, NE lignocellulosic crops or residues; corn stover 2007 75
Lignol Grand Junction, IA biomass /biomass coal blends; woody biomass 2009 60
POET Scotland, SD lignocellulosic crops or residues; corn fibre, corn cobs and corn stalks
2008 60
Woodland Biofuels Ontario, Ca organic residues and waste streams; wood waste 2011 60
Beta Renewables Rivalta Scrivia, It lignocellulosic crops or residues; corn stover, straw, husk, energy crops (Giant Reed), woody biomass
2009 50
NREL (National Renewable Energy Laboratory) Golden, CO lignocellulosic crops or residues 1985. 50
Fulcrum (Sierra Biofuels) CA – 2009 30
Greenfield Ethanol Chatham, Ca – 2010 30
Lignol Vancouver, Ca – 2009 30
Lignol Innovations Ltd. Burnaby, Ca lignocellulosic crops or residues; hardwood & softwood residues
2009 30
Scottish Bioenergy Perthshire, UK algae microbial and aquatic biomass 2009 30
Petrobras Rio de Janeiro, Br sugarcane bagasse 2007 3.500
PROCETHOL 2G Pomacle, Fr sugarcane bagasse 2011 2.700
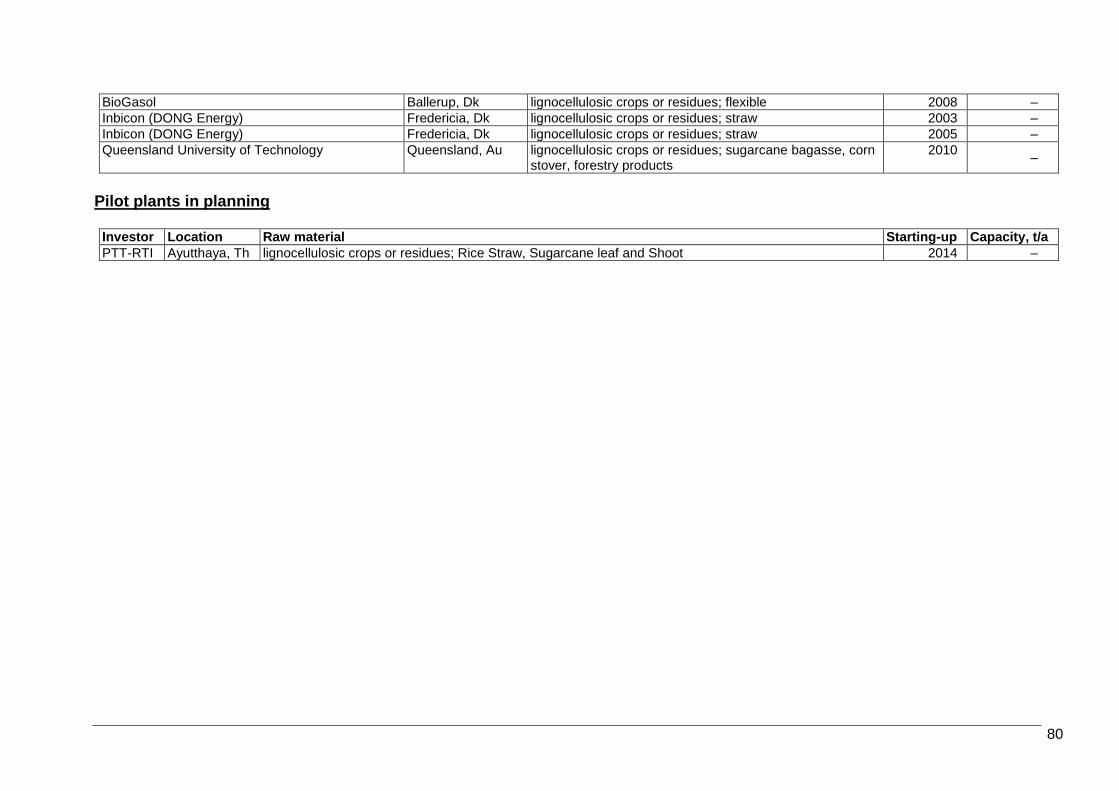
80
BioGasol Ballerup, Dk lignocellulosic crops or residues; flexible 2008 –
Inbicon (DONG Energy) Fredericia, Dk lignocellulosic crops or residues; straw 2003 –
Inbicon (DONG Energy) Fredericia, Dk lignocellulosic crops or residues; straw 2005 –
Queensland University of Technology Queensland, Au lignocellulosic crops or residues; sugarcane bagasse, corn stover, forestry products
2010 –
Pilot plants in planning
Investor Location Raw material Starting-up Capacity, t/a
PTT-RTI Ayutthaya, Th lignocellulosic crops or residues; Rice Straw, Sugarcane leaf and Shoot 2014 –
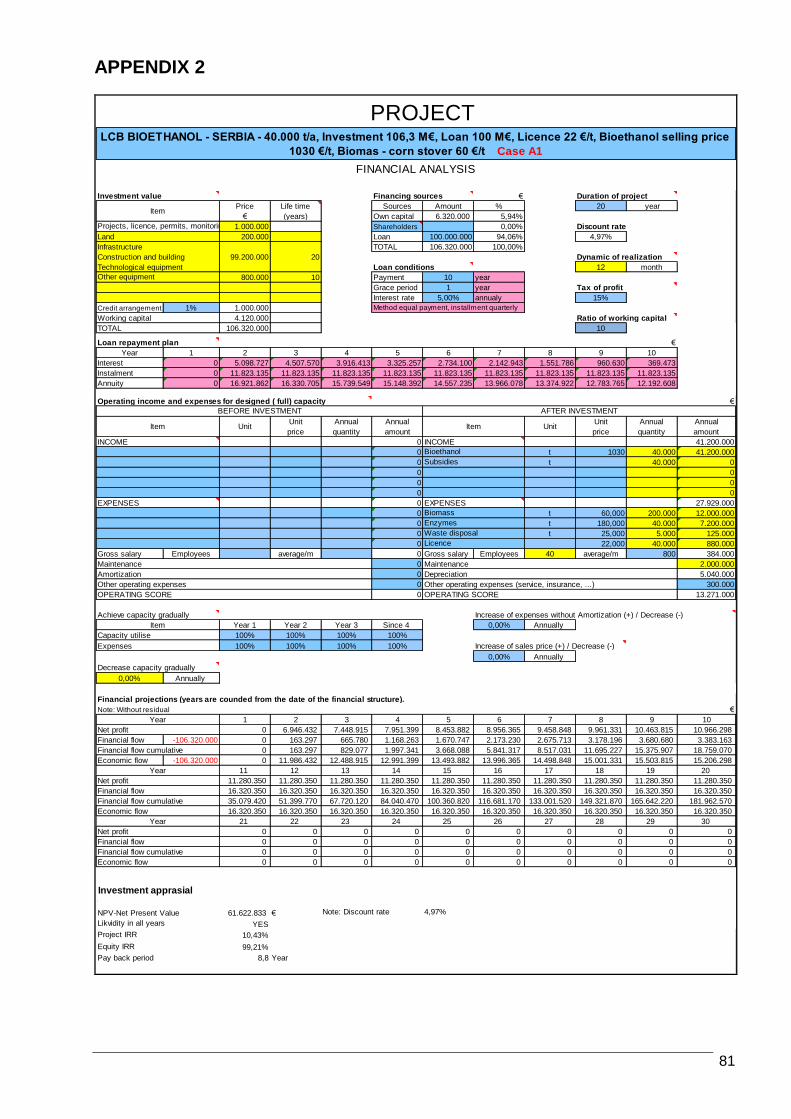
81
APPENDIX 2
€
Price Life time Sources Amount % 20 year
€ (years) Own capital 6.320.000 5,94%
1.000.000 Shareholders 0,00%
200.000 Loan 100.000.000 94,06% 4,97%
Infrastructure TOTAL 106.320.000 100,00%
Construction and building 99.200.000 20
Technological equipment 12 month
800.000 10 Payment 10 year
Grace period 1 year
Interest rate 5,00% annualy 15%
Credit arrangement 1% 1.000.000
4.120.000
106.320.000 10
€
Year 1 2 3 4 5 6 7 8 9 10
Interest 0 5.098.727 4.507.570 3.916.413 3.325.257 2.734.100 2.142.943 1.551.786 960.630 369.473
Instalment 0 11.823.135 11.823.135 11.823.135 11.823.135 11.823.135 11.823.135 11.823.135 11.823.135 11.823.135
Annuity 0 16.921.862 16.330.705 15.739.549 15.148.392 14.557.235 13.966.078 13.374.922 12.783.765 12.192.608
€
Unit Annual Annual Unit Annual Annual
price quantity amount price quantity amount
0 41.200.000
0 t 1030 40.000 41.200.000
0 t 40.000 0
0 0
0 0
0 0
0 27.929.000
0 t 60,000 200.000 12.000.000
0 t 180,000 40.000 7.200.000
0 t 25,000 5.000 125.000
0 22,000 40.000 880.000
Gross salary Employees average/m 0 Gross salary Employees 40 average/m 800 384.000
0 2.000.000
0 5.040.000
0 300.000
0 13.271.000
Year 1 Year 2 Year 3 Since 4 0,00% Annually
100% 100% 100% 100%
100% 100% 100% 100%
0,00% Annually
0,00% Annually
Financial projections (years are counded from the date of the financial structure).
Note: Without residual €
1 2 3 4 5 6 7 8 9 10
0 6.946.432 7.448.915 7.951.399 8.453.882 8.956.365 9.458.848 9.961.331 10.463.815 10.966.298
Financial flow -106.320.000 0 163.297 665.780 1.168.263 1.670.747 2.173.230 2.675.713 3.178.196 3.680.680 3.383.163
0 163.297 829.077 1.997.341 3.668.088 5.841.317 8.517.031 11.695.227 15.375.907 18.759.070
Economic flow -106.320.000 0 11.986.432 12.488.915 12.991.399 13.493.882 13.996.365 14.498.848 15.001.331 15.503.815 15.206.298
11 12 13 14 15 16 17 18 19 20
11.280.350 11.280.350 11.280.350 11.280.350 11.280.350 11.280.350 11.280.350 11.280.350 11.280.350 11.280.350
16.320.350 16.320.350 16.320.350 16.320.350 16.320.350 16.320.350 16.320.350 16.320.350 16.320.350 16.320.350
35.079.420 51.399.770 67.720.120 84.040.470 100.360.820 116.681.170 133.001.520 149.321.870 165.642.220 181.962.570
16.320.350 16.320.350 16.320.350 16.320.350 16.320.350 16.320.350 16.320.350 16.320.350 16.320.350 16.320.350
21 22 23 24 25 26 27 28 29 30
0 0 0 0 0 0 0 0 0 0
0 0 0 0 0 0 0 0 0 0
0 0 0 0 0 0 0 0 0 0
0 0 0 0 0 0 0 0 0 0
.
61.622.833 € 4,97%
YES
10,43%
Equity IRR 99,21%
Pay back period 8,8 Year
Land
Item
Projects, licence, permits, monitoring Discount rate
Dynamic of realization
Loan conditions
Other equipment
Method equal payment, installment quarterly
Working capital
BEFORE INVESTMENT AFTER INVESTMENT
Item
TOTAL
Tax of profit
Ratio of working capital
Operating income and expenses for designed ( full) capacity
Unit
Loan repayment plan
Unit
Investment value Financing sources Duration of project
PROJECTLCB BIOETHANOL - SERBIA - 40.000 t/a, Investment 106,3 M€, Loan 100 M€, Licence 22 €/t, Bioethanol selling price
1030 €/t, Biomas - corn stover 60 €/t Case A1
FINANCIAL ANALYSIS
Other operating expenses Other operating expenses (service, insurance, ...)
Year
Net profit
Licence
Maintenance Maintenance
Amortization Depreciation
OPERATING SCORE OPERATING SCORE
Waste disposal
Subsidies
Item
EXPENSES EXPENSES
Biomass
Enzymes
INCOME INCOME
Bioethanol
NPV-Net Present Value Note: Discount rate
Increase of expenses without Amortization (+) / Decrease (-)Achieve capacity gradually
Financial flow cumulative
Year
Net profit
Decrease capacity gradually
Item
Capacity utilise
Expenses Increase of sales price (+) / Decrease (-)
Likvidity in all years
Project IRR
Economic flow
Financial flow cumulative
Year
Net profit
Financial flow
Financial flow cumulative
Financial flow
Economic flow
Investment apprasial

82
€
Price Life time Sources Amount % 20 year
€ (years) Own capital 104.920.000 100,00%
1.000.000 Shareholders 0,00%
200.000 Loan 0,00% 4,50%
Infrastructure TOTAL 104.920.000 100,00%
Construction and building 99.200.000 20
Technological equipment 12 month
800.000 10 Payment year
Grace period year
Interest rate annualy 15%
Credit arrangement 0
3.720.000
104.920.000 10
€
Year 1 2 3 4 5 6 7 8 9 10
Interest 0 0 0 0 0 0 0 0 0 0
Instalment 0 0 0 0 0 0 0 0 0 0
Annuity 0 0 0 0 0 0 0 0 0 0
€
Unit Annual Annual Unit Annual Annual
price quantity amount price quantity amount
0 37.200.000
0 t 930 40.000 37.200.000
0 t 40.000 0
0 0
0 0
0 0
0 27.929.000
0 t 60,000 200.000 12.000.000
0 t 180,000 40.000 7.200.000
0 t 12,500 10.000 125.000
0 22,000 40.000 880.000
Gross salary Employees average/m 0 Gross salary Employees 40 average/m 800 384.000
0 2.000.000
0 5.040.000
0 300.000
0 9.271.000
Year 1 Year 2 Year 3 Since 4 0,00% Annually
100% 100% 100% 100%
100% 100% 100% 100%
0,00% Annually
0,00% Annually
Financial projections (years are counded from the date of the financial structure).
Note: Without residual €
1 2 3 4 5 6 7 8 9 10
0 7.880.350 7.880.350 7.880.350 7.880.350 7.880.350 7.880.350 7.880.350 7.880.350 7.880.350
Financial flow -104.920.000 0 12.920.350 12.920.350 12.920.350 12.920.350 12.920.350 12.920.350 12.920.350 12.920.350 12.120.350
0 12.920.350 25.840.700 38.761.050 51.681.400 64.601.750 77.522.100 90.442.450 103.362.800 115.483.150
Economic flow -104.920.000 0 12.920.350 12.920.350 12.920.350 12.920.350 12.920.350 12.920.350 12.920.350 12.920.350 12.120.350
11 12 13 14 15 16 17 18 19 20
7.880.350 7.880.350 7.880.350 7.880.350 7.880.350 7.880.350 7.880.350 7.880.350 7.880.350 7.880.350
12.920.350 12.920.350 12.920.350 12.920.350 12.920.350 12.920.350 12.920.350 12.920.350 12.920.350 12.920.350
128.403.500 141.323.850 154.244.200 167.164.550 180.084.900 193.005.250 205.925.600 218.845.950 231.766.300 244.686.650
12.920.350 12.920.350 12.920.350 12.920.350 12.920.350 12.920.350 12.920.350 12.920.350 12.920.350 12.920.350
21 22 23 24 25 26 27 28 29 30
0 0 0 0 0 0 0 0 0 0
0 0 0 0 0 0 0 0 0 0
0 0 0 0 0 0 0 0 0 0
0 0 0 0 0 0 0 0 0 0
.
48.103.329 € 4,50%
YES
9,10%
Equity IRR 9,10%
Pay back period 9,1 Year
Financial flow cumulative
Year
Net profit
Financial flow cumulative
Year
Net profit
Likvidity in all years
Project IRR
Financial flow
Financial flow cumulative
Economic flow
Economic flow
Financial flow
Investment apprasial
NPV-Net Present Value Note: Discount rate
Other operating expenses Other operating expenses (service, insurance, ...)
Waste disposal
Decrease capacity gradually
Item
Capacity utilise
Expenses Increase of sales price (+) / Decrease (-)
OPERATING SCORE OPERATING SCORE
Year
Net profit
Land
Item
Projects, licence, permits, monitoring Discount rate
Increase of expenses without Amortization (+) / Decrease (-)Achieve capacity gradually
Enzymes
Amortization Depreciation
Biomass
EXPENSES EXPENSES
PROJECTLCB BIOETHANOL - SERBIA - 40.000 t/a, Investment 104,9 M€, Without Loan, Licence 22 €/t, Bioethanol selling price
930 €/t, Biomas - corn stover 60 €/t Case A2
FINANCIAL ANALYSIS
Investment value Financing sources Duration of project
BEFORE INVESTMENT
INCOME INCOME
Maintenance Maintenance
Dynamic of realization
Loan conditions
Other equipment
Bioethanol
Tax of profit
Ratio of working capital
Method equal payment, installment quarterly
Working capital
UnitItem
TOTAL
Operating income and expenses for designed ( full) capacity
Unit
Loan repayment plan
AFTER INVESTMENT
Item
Licence
Subsidies
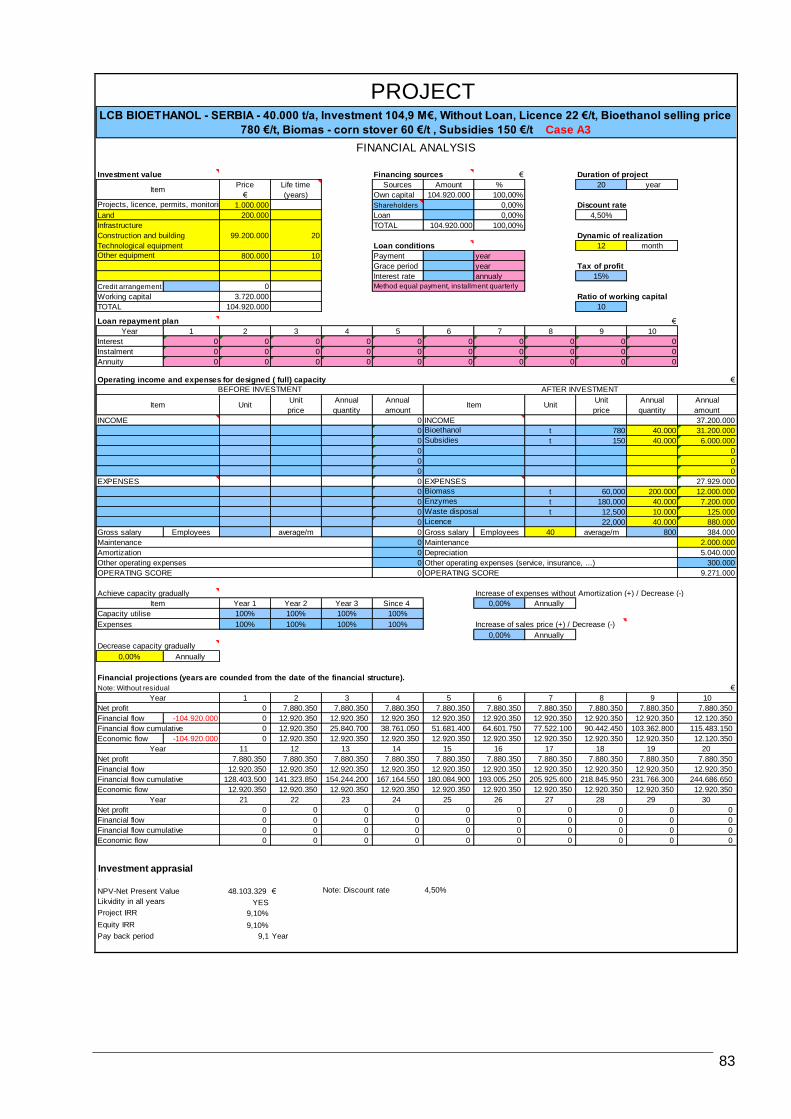
83
€
Price Life time Sources Amount % 20 year
€ (years) Own capital 104.920.000 100,00%
1.000.000 Shareholders 0,00%
200.000 Loan 0,00% 4,50%
Infrastructure TOTAL 104.920.000 100,00%
Construction and building 99.200.000 20
Technological equipment 12 month
800.000 10 Payment year
Grace period year
Interest rate annualy 15%
Credit arrangement 0
3.720.000
104.920.000 10
€
Year 1 2 3 4 5 6 7 8 9 10
Interest 0 0 0 0 0 0 0 0 0 0
Instalment 0 0 0 0 0 0 0 0 0 0
Annuity 0 0 0 0 0 0 0 0 0 0
€
Unit Annual Annual Unit Annual Annual
price quantity amount price quantity amount
0 37.200.000
0 t 780 40.000 31.200.000
0 t 150 40.000 6.000.000
0 0
0 0
0 0
0 27.929.000
0 t 60,000 200.000 12.000.000
0 t 180,000 40.000 7.200.000
0 t 12,500 10.000 125.000
0 22,000 40.000 880.000
Gross salary Employees average/m 0 Gross salary Employees 40 average/m 800 384.000
0 2.000.000
0 5.040.000
0 300.000
0 9.271.000
Year 1 Year 2 Year 3 Since 4 0,00% Annually
100% 100% 100% 100%
100% 100% 100% 100%
0,00% Annually
0,00% Annually
Financial projections (years are counded from the date of the financial structure).
Note: Without residual €
1 2 3 4 5 6 7 8 9 10
0 7.880.350 7.880.350 7.880.350 7.880.350 7.880.350 7.880.350 7.880.350 7.880.350 7.880.350
Financial flow -104.920.000 0 12.920.350 12.920.350 12.920.350 12.920.350 12.920.350 12.920.350 12.920.350 12.920.350 12.120.350
0 12.920.350 25.840.700 38.761.050 51.681.400 64.601.750 77.522.100 90.442.450 103.362.800 115.483.150
Economic flow -104.920.000 0 12.920.350 12.920.350 12.920.350 12.920.350 12.920.350 12.920.350 12.920.350 12.920.350 12.120.350
11 12 13 14 15 16 17 18 19 20
7.880.350 7.880.350 7.880.350 7.880.350 7.880.350 7.880.350 7.880.350 7.880.350 7.880.350 7.880.350
12.920.350 12.920.350 12.920.350 12.920.350 12.920.350 12.920.350 12.920.350 12.920.350 12.920.350 12.920.350
128.403.500 141.323.850 154.244.200 167.164.550 180.084.900 193.005.250 205.925.600 218.845.950 231.766.300 244.686.650
12.920.350 12.920.350 12.920.350 12.920.350 12.920.350 12.920.350 12.920.350 12.920.350 12.920.350 12.920.350
21 22 23 24 25 26 27 28 29 30
0 0 0 0 0 0 0 0 0 0
0 0 0 0 0 0 0 0 0 0
0 0 0 0 0 0 0 0 0 0
0 0 0 0 0 0 0 0 0 0
.
48.103.329 € 4,50%
YES
9,10%
Equity IRR 9,10%
Pay back period 9,1 Year
Economic flow
Investment apprasial
NPV-Net Present Value Note: Discount rate
Decrease capacity gradually
Item
Capacity utilise
Expenses Increase of sales price (+) / Decrease (-)
Likvidity in all years
Project IRR
Economic flow
Financial flow
Year
Net profit
Financial flow cumulative
Year
Net profit
Financial flow cumulative
Year
Net profit
Financial flow
Financial flow cumulative
EXPENSES EXPENSES
Biomass
Enzymes
Increase of expenses without Amortization (+) / Decrease (-)Achieve capacity gradually
INCOME INCOME
Bioethanol
OPERATING SCORE OPERATING SCORE
Subsidies
Amortization Depreciation
Other operating expenses Other operating expenses (service, insurance, ...)
Waste disposal
Licence
Maintenance Maintenance
Investment value Financing sources Duration of project
PROJECTLCB BIOETHANOL - SERBIA - 40.000 t/a, Investment 104,9 M€, Without Loan, Licence 22 €/t, Bioethanol selling price
780 €/t, Biomas - corn stover 60 €/t , Subsidies 150 €/t Case A3
FINANCIAL ANALYSIS
BEFORE INVESTMENT AFTER INVESTMENT
Item
TOTAL
Operating income and expenses for designed ( full) capacity
Unit
Loan repayment plan
Unit
Item
Projects, licence, permits, monitoring
Tax of profit
Ratio of working capital
Method equal payment, installment quarterly
Working capital
Discount rate
Dynamic of realization
Loan conditions
Other equipment
Land
Item
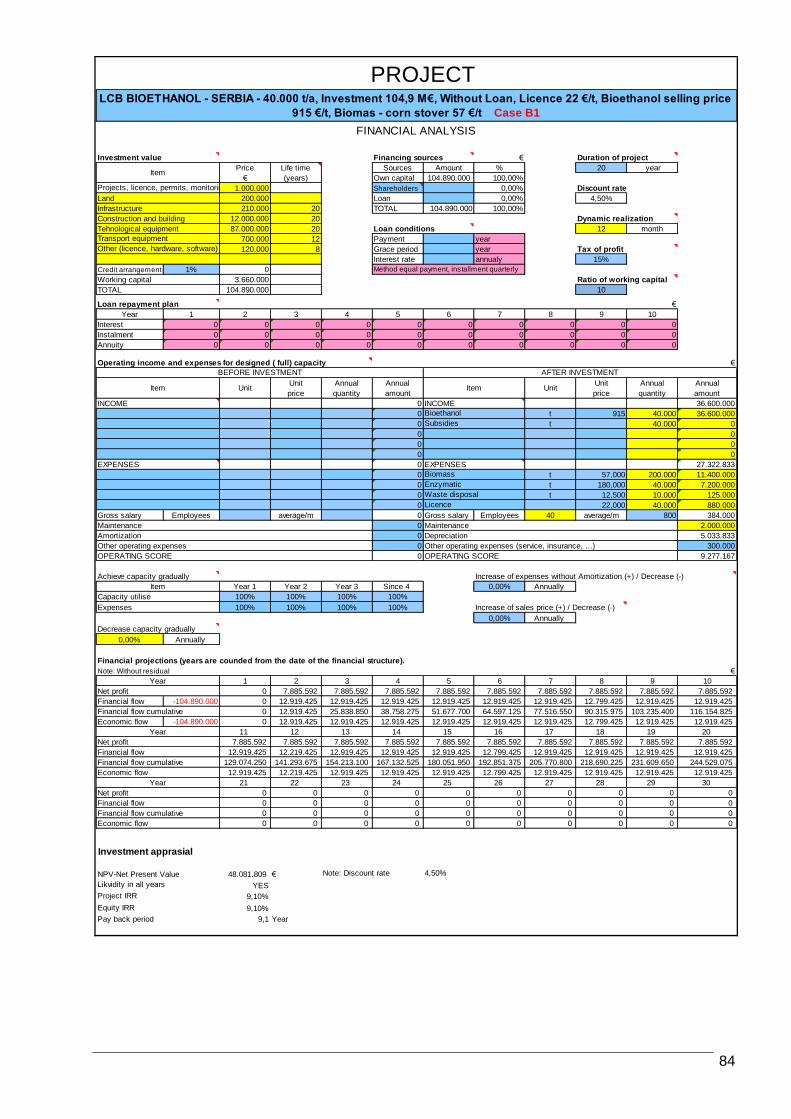
84
€
Price Life time Sources Amount % 20 year
€ (years) Own capital 104.890.000 100,00%
1.000.000 Shareholders 0,00%
200.000 Loan 0,00% 4,50%
210.000 20 TOTAL 104.890.000 100,00%
12.000.000 20
87.000.000 20 12 month
700.000 12 Payment year
120.000 8 Grace period year
Interest rate annualy 15%
Credit arrangement 1% 0
3.660.000
104.890.000 10
€
Year 1 2 3 4 5 6 7 8 9 10
Interest 0 0 0 0 0 0 0 0 0 0
Instalment 0 0 0 0 0 0 0 0 0 0
Annuity 0 0 0 0 0 0 0 0 0 0
€
Unit Annual Annual Unit Annual Annual
price quantity amount price quantity amount
0 36.600.000
0 t 915 40.000 36.600.000
0 t 40.000 0
0 0
0 0
0 0
0 27.322.833
0 t 57,000 200.000 11.400.000
0 t 180,000 40.000 7.200.000
0 t 12,500 10.000 125.000
0 22,000 40.000 880.000
Gross salary Employees average/m 0 Gross salary Employees 40 average/m 800 384.000
0 2.000.000
0 5.033.833
0 300.000
0 9.277.167
Year 1 Year 2 Year 3 Since 4 0,00% Annually
100% 100% 100% 100%
100% 100% 100% 100%
0,00% Annually
0,00% Annually
Financial projections (years are counded from the date of the financial structure).
Note: Without residual €
1 2 3 4 5 6 7 8 9 10
0 7.885.592 7.885.592 7.885.592 7.885.592 7.885.592 7.885.592 7.885.592 7.885.592 7.885.592
Financial flow -104.890.000 0 12.919.425 12.919.425 12.919.425 12.919.425 12.919.425 12.919.425 12.799.425 12.919.425 12.919.425
0 12.919.425 25.838.850 38.758.275 51.677.700 64.597.125 77.516.550 90.315.975 103.235.400 116.154.825
Economic flow -104.890.000 0 12.919.425 12.919.425 12.919.425 12.919.425 12.919.425 12.919.425 12.799.425 12.919.425 12.919.425
11 12 13 14 15 16 17 18 19 20
7.885.592 7.885.592 7.885.592 7.885.592 7.885.592 7.885.592 7.885.592 7.885.592 7.885.592 7.885.592
12.919.425 12.219.425 12.919.425 12.919.425 12.919.425 12.799.425 12.919.425 12.919.425 12.919.425 12.919.425
129.074.250 141.293.675 154.213.100 167.132.525 180.051.950 192.851.375 205.770.800 218.690.225 231.609.650 244.529.075
12.919.425 12.219.425 12.919.425 12.919.425 12.919.425 12.799.425 12.919.425 12.919.425 12.919.425 12.919.425
21 22 23 24 25 26 27 28 29 30
0 0 0 0 0 0 0 0 0 0
0 0 0 0 0 0 0 0 0 0
0 0 0 0 0 0 0 0 0 0
0 0 0 0 0 0 0 0 0 0
.
48.081.809 € 4,50%
YES
9,10%
Equity IRR 9,10%
Pay back period 9,1 Year
Economic flow
Investment apprasial
Financial flow
NPV-Net Present Value Note: Discount rate
Increase of expenses without Amortization (+) / Decrease (-)Achieve capacity gradually
Financial flow cumulative
Year
Net profit
Decrease capacity gradually
Item
Capacity utilise
Expenses Increase of sales price (+) / Decrease (-)
Likvidity in all years
Project IRR
Economic flow
Other operating expenses Other operating expenses (service, insurance, ...)
Year
Net profit
Financial flow cumulative
Year
Net profit
Financial flow
Financial flow cumulative
Method equal payment, installment quarterly
Working capital
BEFORE INVESTMENT AFTER INVESTMENT
Item
TOTAL
Item
Operating income and expenses for designed ( full) capacity
Unit
Loan repayment plan
Licence
Maintenance Maintenance
Amortization Depreciation
OPERATING SCORE OPERATING SCORE
Unit
Tax of profit
Ratio of working capital
Waste disposal
Subsidies
EXPENSES EXPENSES
Biomass
Enzymatic
INCOME INCOME
Bioethanol
PROJECTLCB BIOETHANOL - SERBIA - 40.000 t/a, Investment 104,9 M€, Without Loan, Licence 22 €/t, Bioethanol selling price
915 €/t, Biomas - corn stover 57 €/t Case B1
FINANCIAL ANALYSIS
Investment value Financing sources Duration of project
Land
Infrastructure
Construction and building
Tehnological equipment
Transport equipment
Other (licence, hardware, software)
Item
Projects, licence, permits, monitoring Discount rate
Dynamic realization
Loan conditions

85
€
Price Life time Sources Amount % 20 year
€ (years) Own capital 105.020.000 100,00%
1.000.000 Shareholders 0,00%
200.000 Loan 0,00% 4,50%
Infrastructure TOTAL 105.020.000 100,00%
Construction and building 99.200.000 20
Technological equipment 12 month
800.000 10 Payment year
Grace period year
Interest rate annualy 15%
Credit arrangement 1% 0
3.820.000
105.020.000 10
€
Year 1 2 3 4 5 6 7 8 9 10
Interest 0 0 0 0 0 0 0 0 0 0
Instalment 0 0 0 0 0 0 0 0 0 0
Annuity 0 0 0 0 0 0 0 0 0 0
€
Unit Annual Annual Unit Annual Annual
price quantity amount price quantity amount
0 38.200.000
0 t 955 40.000 38.200.000
0 t 40.000 0
0 0
0 0
0 0
0 28.929.000
0 t 65,000 200.000 13.000.000
0 t 180,000 40.000 7.200.000
0 t 12,500 10.000 125.000
0 22,000 40.000 880.000
Gross salary Employees average/m 0 Gross salary Employees 40 average/m 800 384.000
0 2.000.000
0 5.040.000
0 300.000
0 9.271.000
Year 1 Year 2 Year 3 Since 4 0,00% Annually
100% 100% 100% 100%
100% 100% 100% 100%
0,00% Annually
0,00% Annually
Financial projections (years are counded from the date of the financial structure).
Note: Without residual €
1 2 3 4 5 6 7 8 9 10
0 7.880.350 7.880.350 7.880.350 7.880.350 7.880.350 7.880.350 7.880.350 7.880.350 7.880.350
Financial flow -105.020.000 0 12.920.350 12.920.350 12.920.350 12.920.350 12.920.350 12.920.350 12.920.350 12.920.350 12.120.350
0 12.920.350 25.840.700 38.761.050 51.681.400 64.601.750 77.522.100 90.442.450 103.362.800 115.483.150
Economic flow -105.020.000 0 12.920.350 12.920.350 12.920.350 12.920.350 12.920.350 12.920.350 12.920.350 12.920.350 12.120.350
11 12 13 14 15 16 17 18 19 20
7.880.350 7.880.350 7.880.350 7.880.350 7.880.350 7.880.350 7.880.350 7.880.350 7.880.350 7.880.350
12.920.350 12.920.350 12.920.350 12.920.350 12.920.350 12.920.350 12.920.350 12.920.350 12.920.350 12.920.350
128.403.500 141.323.850 154.244.200 167.164.550 180.084.900 193.005.250 205.925.600 218.845.950 231.766.300 244.686.650
12.920.350 12.920.350 12.920.350 12.920.350 12.920.350 12.920.350 12.920.350 12.920.350 12.920.350 12.920.350
21 22 23 24 25 26 27 28 29 30
0 0 0 0 0 0 0 0 0 0
0 0 0 0 0 0 0 0 0 0
0 0 0 0 0 0 0 0 0 0
0 0 0 0 0 0 0 0 0 0
.
48.007.635 € 4,50%
YES
9,09%
Equity IRR 9,09%
Pay back period 9,1 Year
Land
Other equipment
Item
Projects, licence, permits, monitoring Discount rate
Dynamic of realization
Loan conditions
Method equal payment, installment quarterly
Working capital
BEFORE INVESTMENT AFTER INVESTMENT
Item
TOTAL
Tax of profit
Ratio of working capital
Operating income and expenses for designed ( full) capacity
Unit
Loan repayment plan
Investment value Financing sources Duration of project
PROJECTLCB BIOETHANOL - SERBIA - 40.000 t/a, Investment 105 M€, Without Loan, Licence 22€/t, Bioethanol selling price
955 €/t, Biomas - corn stover 65 €/t Case B3
FINANCIAL ANALYSIS
Other operating expenses Other operating expenses (service, insurance, ...)
Year
Net profit
Licence
Maintenance Maintenance
Amortization Depreciation
OPERATING SCORE OPERATING SCORE
Financial flow
Item
EXPENSES EXPENSES
Biomass
Enzymes
INCOME INCOME
Bioethanol
Unit
Waste disposal
Subsidies
NPV-Net Present Value Note: Discount rate
Increase of expenses without Amortization (+) / Decrease (-)Achieve capacity gradually
Financial flow cumulative
Year
Net profit
Decrease capacity gradually
Item
Capacity utilise
Expenses Increase of sales price (+) / Decrease (-)
Likvidity in all years
Project IRR
Economic flow
Financial flow cumulative
Year
Net profit
Financial flow
Financial flow cumulative
Economic flow
Investment apprasial

86
€
Price Life time Sources Amount % 20 year
€ (years) Own capital 104.940.000 100,00%
1.000.000 Shareholders 0,00%
200.000 Loan 0,00% 4,50%
Infrastructure TOTAL 104.940.000 100,00%
Construction and building 99.200.000 20
Technological equipment 12 month
800.000 10 Payment year
Grace period year
Interest rate annualy 15%
Credit arrangement 1% 0
3.740.000
104.940.000 10
€
Year 1 2 3 4 5 6 7 8 9 10
Interest 0 0 0 0 0 0 0 0 0 0
Instalment 0 0 0 0 0 0 0 0 0 0
Annuity 0 0 0 0 0 0 0 0 0 0
€
Unit Annual Annual Unit Annual Annual
price quantity amount price quantity amount
0 37.400.000
0 t 935 40.000 37.400.000
0 t 40.000 0
0 0
0 0
0 0
0 28.089.000
0 t 60,000 200.000 12.000.000
0 t 180,000 40.000 7.200.000
0 t 12,500 10.000 125.000
0 26,000 40.000 1.040.000
Gross salary Employees average/m 0 Gross salary Employees 40 average/m 800 384.000
0 2.000.000
0 5.040.000
0 300.000
0 9.311.000
Year 1 Year 2 Year 3 Since 4 0,00% Annually
100% 100% 100% 100%
100% 100% 100% 100%
0,00% Annually
0,00% Annually
Financial projections (years are counded from the date of the financial structure).
Note: Without residual €
1 2 3 4 5 6 7 8 9 10
0 7.914.350 7.914.350 7.914.350 7.914.350 7.914.350 7.914.350 7.914.350 7.914.350 7.914.350
Financial flow -104.940.000 0 12.954.350 12.954.350 12.954.350 12.954.350 12.954.350 12.954.350 12.954.350 12.954.350 12.154.350
0 12.954.350 25.908.700 38.863.050 51.817.400 64.771.750 77.726.100 90.680.450 103.634.800 115.789.150
Economic flow -104.940.000 0 12.954.350 12.954.350 12.954.350 12.954.350 12.954.350 12.954.350 12.954.350 12.954.350 12.154.350
11 12 13 14 15 16 17 18 19 20
7.914.350 7.914.350 7.914.350 7.914.350 7.914.350 7.914.350 7.914.350 7.914.350 7.914.350 7.914.350
12.954.350 12.954.350 12.954.350 12.954.350 12.954.350 12.954.350 12.954.350 12.954.350 12.954.350 12.954.350
128.743.500 141.697.850 154.652.200 167.606.550 180.560.900 193.515.250 206.469.600 219.423.950 232.378.300 245.332.650
12.954.350 12.954.350 12.954.350 12.954.350 12.954.350 12.954.350 12.954.350 12.954.350 12.954.350 12.954.350
21 22 23 24 25 26 27 28 29 30
0 0 0 0 0 0 0 0 0 0
0 0 0 0 0 0 0 0 0 0
0 0 0 0 0 0 0 0 0 0
0 0 0 0 0 0 0 0 0 0
.
48.476.280 € 4,50%
YES
9,13%
Equity IRR 9,13%
Pay back period 9,1 Year
Land
Other equipment
Item
Projects, licence, permits, monitoring Discount rate
Dynamic of realization
Loan conditions
Method equal payment, installment quarterly
Working capital
BEFORE INVESTMENT AFTER INVESTMENT
Item
TOTAL
Tax of profit
Ratio of working capital
Operating income and expenses for designed ( full) capacity
Unit
Loan repayment plan
Investment value Financing sources Duration of project
PROJECTLCB BIOETHANOL - SERBIA - 40.000 t/a, Investment 104,9 M€, Without Loan, Licence 26 €/t, Bioethanol selling price
935 €/t, Biomas - corn stover 60 €/t Case C
FINANCIAL ANALYSIS
Other operating expenses Other operating expenses (service, insurance, ...)
Year
Net profit
Licence
Maintenance Maintenance
Amortization Depreciation
OPERATING SCORE OPERATING SCORE
Financial flow
Item
EXPENSES EXPENSES
Biomass
Enzymes
INCOME INCOME
Bioethanol
Unit
Waste disposal
Subsidies
NPV-Net Present Value Note: Discount rate
Increase of expenses without Amortization (+) / Decrease (-)Achieve capacity gradually
Financial flow cumulative
Year
Net profit
Decrease capacity gradually
Item
Capacity utilise
Expenses Increase of sales price (+) / Decrease (-)
Likvidity in all years
Project IRR
Economic flow
Financial flow cumulative
Year
Net profit
Financial flow
Financial flow cumulative
Economic flow
Investment apprasial

87
€
Price Life time Sources Amount % 20 year
€ (years) Own capital 94.660.000 100,00%
900.000 Shareholders 0,00%
180.000 Loan 0,00% 4,50%
Infrastructure TOTAL 94.660.000 100,00%
Construction and building 89.280.000 20
Technological equipment 12 month
720.000 10 Payment year
Grace period year
Interest rate annualy 15%
Credit arrangement 1% 0
3.580.000
94.660.000 10
€
Year 1 2 3 4 5 6 7 8 9 10
Interest 0 0 0 0 0 0 0 0 0 0
Instalment 0 0 0 0 0 0 0 0 0 0
Annuity 0 0 0 0 0 0 0 0 0 0
€
Unit Annual Annual Unit Annual Annual
price quantity amount price quantity amount
0 35.800.000
0 t 895 40.000 35.800.000
0 t 40.000 0
0 0
0 0
0 0
0 27.425.000
0 t 60,000 200.000 12.000.000
0 t 180,000 40.000 7.200.000
0 t 12,500 10.000 125.000
0 22,000 40.000 880.000
Gross salary Employees average/m 0 Gross salary Employees 40 average/m 800 384.000
0 2.000.000
0 4.536.000
0 300.000
0 8.375.000
Year 1 Year 2 Year 3 Since 4 0,00% Annually
100% 100% 100% 100%
100% 100% 100% 100%
0,00% Annually
0,00% Annualy
Financial projections (years are counded from the date of the financial structure).
Note: Without residual €
1 2 3 4 5 6 7 8 9 10
0 7.118.750 7.118.750 7.118.750 7.118.750 7.118.750 7.118.750 7.118.750 7.118.750 7.118.750
Financial flow -94.660.000 0 11.654.750 11.654.750 11.654.750 11.654.750 11.654.750 11.654.750 11.654.750 11.654.750 10.934.750
0 11.654.750 23.309.500 34.964.250 46.619.000 58.273.750 69.928.500 81.583.250 93.238.000 104.172.750
Economic flow -94.660.000 0 11.654.750 11.654.750 11.654.750 11.654.750 11.654.750 11.654.750 11.654.750 11.654.750 10.934.750
11 12 13 14 15 16 17 18 19 20
7.118.750 7.118.750 7.118.750 7.118.750 7.118.750 7.118.750 7.118.750 7.118.750 7.118.750 7.118.750
11.654.750 11.654.750 11.654.750 11.654.750 11.654.750 11.654.750 11.654.750 11.654.750 11.654.750 11.654.750
115.827.500 127.482.250 139.137.000 150.791.750 162.446.500 174.101.250 185.756.000 197.410.750 209.065.500 220.720.250
11.654.750 11.654.750 11.654.750 11.654.750 11.654.750 11.654.750 11.654.750 11.654.750 11.654.750 11.654.750
21 22 23 24 25 26 27 28 29 30
0 0 0 0 0 0 0 0 0 0
0 0 0 0 0 0 0 0 0 0
0 0 0 0 0 0 0 0 0 0
0 0 0 0 0 0 0 0 0 0
.
43.375.836 € 4,50%
YES
9,10%
Equity IRR 9,10%
Pay back period 9,1 Year
Economic flow
Investment apprasial
NPV-Net Present Value Note: Discount rate
Increase of expenses without Amortization (+) / Decrease (-)Achieve capacity gradually
Financial flow cumulative
Year
Net profit
Decrease capacity gradually
Item
Capacity utilise
Expenses Increase of sales price (+) / Decrease (-)
Likvidity in all years
Project IRR
Economic flow
Financial flow cumulative
Year
Net profit
Financial flow
Financial flow cumulative
OPERATING SCORE OPERATING SCORE
Financial flow
Item
EXPENSES EXPENSES
Biomass
Enzymes
INCOME INCOME
Bioethanol
Unit
Waste disposal
Subsidies
Other operating expenses Other operating expenses (service, insurance, ...)
Year
Net profit
Licence
Maintenance Maintenance
Amortization Depreciation
Investment value Financing sources Duration of project
PROJECTLCB BIOETHANOL - SERBIA - 40.000 t/a, Investment 94,6 M€, Without Loan, Licence 22 €/t, Bioethanol selling price
895 €/t, Biomas - corn stover 60 €/t Case D
FINANCIAL ANALYSIS
Working capital
BEFORE INVESTMENT AFTER INVESTMENT
Item
TOTAL
Tax of profit
Ratio of working capital
Operating income and expenses for designed ( full) capacity
Unit
Loan repayment plan
Land
Other equipment
Item
Projects, licence, permits, monitoring Discount rate
Dynamic of realization
Loan conditions
Method equal payment, installment quarterly

88
€
Price Life time Sources Amount % 20 year
€ (years) Own capital 94.440.000 100,00%
900.000 Shareholders 0,00%
180.000 Loan 0,00% 4,50%
Infrastructure TOTAL 94.440.000 100,00%
Construction and building 89.280.000 20
Technological equipment 12 month
720.000 10 Payment year
Grace period year
Interest rate annualy 15%
Credit arrangement 1% 0
3.360.000
94.440.000 10
€
Year 1 2 3 4 5 6 7 8 9 10
Interest 0 0 0 0 0 0 0 0 0 0
Instalment 0 0 0 0 0 0 0 0 0 0
Annuity 0 0 0 0 0 0 0 0 0 0
€
Unit Annual Annual Unit Annual Annual
price quantity amount price quantity amount
0 33.600.000
0 t 840 40.000 33.600.000
0 t 40.000 0
0 0
0 0
0 0
0 25.225.000
0 t 55,000 200.000 11.000.000
0 t 150,000 40.000 6.000.000
0 t 12,500 10.000 125.000
0 22,000 40.000 880.000
Gross salary Employees averrage/m 0 Gross salary Employees 40 averrage/m 800 384.000
0 2.000.000
0 4.536.000
0 300.000
0 8.375.000
Year 1 Year 2 Year 3 Since 4 0,00% Annually
100% 100% 100% 100%
100% 100% 100% 100%
0,00% Annually
0,00% Annually
Financial projections (years are counded from the date of the financial structure).
Note: Without residual €
1 2 3 4 5 6 7 8 9 10
0 7.118.750 7.118.750 7.118.750 7.118.750 7.118.750 7.118.750 7.118.750 7.118.750 7.118.750
Financial flow -94.440.000 0 11.654.750 11.654.750 11.654.750 11.654.750 11.654.750 11.654.750 11.654.750 11.654.750 10.934.750
0 11.654.750 23.309.500 34.964.250 46.619.000 58.273.750 69.928.500 81.583.250 93.238.000 104.172.750
Economic flow -94.440.000 0 11.654.750 11.654.750 11.654.750 11.654.750 11.654.750 11.654.750 11.654.750 11.654.750 10.934.750
11 12 13 14 15 16 17 18 19 20
7.118.750 7.118.750 7.118.750 7.118.750 7.118.750 7.118.750 7.118.750 7.118.750 7.118.750 7.118.750
11.654.750 11.654.750 11.654.750 11.654.750 11.654.750 11.654.750 11.654.750 11.654.750 11.654.750 11.654.750
115.827.500 127.482.250 139.137.000 150.791.750 162.446.500 174.101.250 185.756.000 197.410.750 209.065.500 220.720.250
11.654.750 11.654.750 11.654.750 11.654.750 11.654.750 11.654.750 11.654.750 11.654.750 11.654.750 11.654.750
21 22 23 24 25 26 27 28 29 30
0 0 0 0 0 0 0 0 0 0
0 0 0 0 0 0 0 0 0 0
0 0 0 0 0 0 0 0 0 0
0 0 0 0 0 0 0 0 0 0
.
43.586.362 € 4,50%
YES
9,13%
Equity IRR 9,13%
Pay back period 9,1 Year
Land
Other equipment
Item
Projects, licence, permits, monitoring Discount rate
Dynamic of realization
Loan conditions
Method equal payment, installment quarterly
Working capital
BEFORE INVESTMENT AFTER INVESTMENT
Item
TOTAL
Tax of profit
Ratio of working capital
Operating income and expenses for designed ( full) capacity
Unit
Loan repayment plan
Investment value Financing sources Duration of project
PROJECTLCB BIOETHANOL - SERBIA - 40.000 t/a, Investment 94,4 M€, Without Loan, Licence 22 €/t, Bioethanol selling price
840 €/t, Biomas - corn stover 55 €/t Case E1
FINANCIAL ANALYSIS
Other operating expenses Other operating expenses (service, insurance, ...)
Year
Net profit
Licence
Maintenance Maintenance
Amortization Depreciation
OPERATING SCORE OPERATING SCORE
Financial flow
Item
EXPENSES EXPENSES
Biomass
Enzymes
INCOME INCOME
Bioethanol
Unit
Waste disposal
Subsidies
NPV-Net Present Value Note: Discount rate
Increase of expenses without Amortization (+) / Decrease (-)Achieve capacity gradually
Financial flow cumulative
Year
Net profit
Decrease capacity gradually
Item
Capacity utilise
Expenses Increase of sales price (+) / Decrease (-)
Likvidity in all years
Project IRR
Economic flow
Financial flow cumulative
Year
Net profit
Financial flow
Financial flow cumulative
Economic flow
Investment apprasial
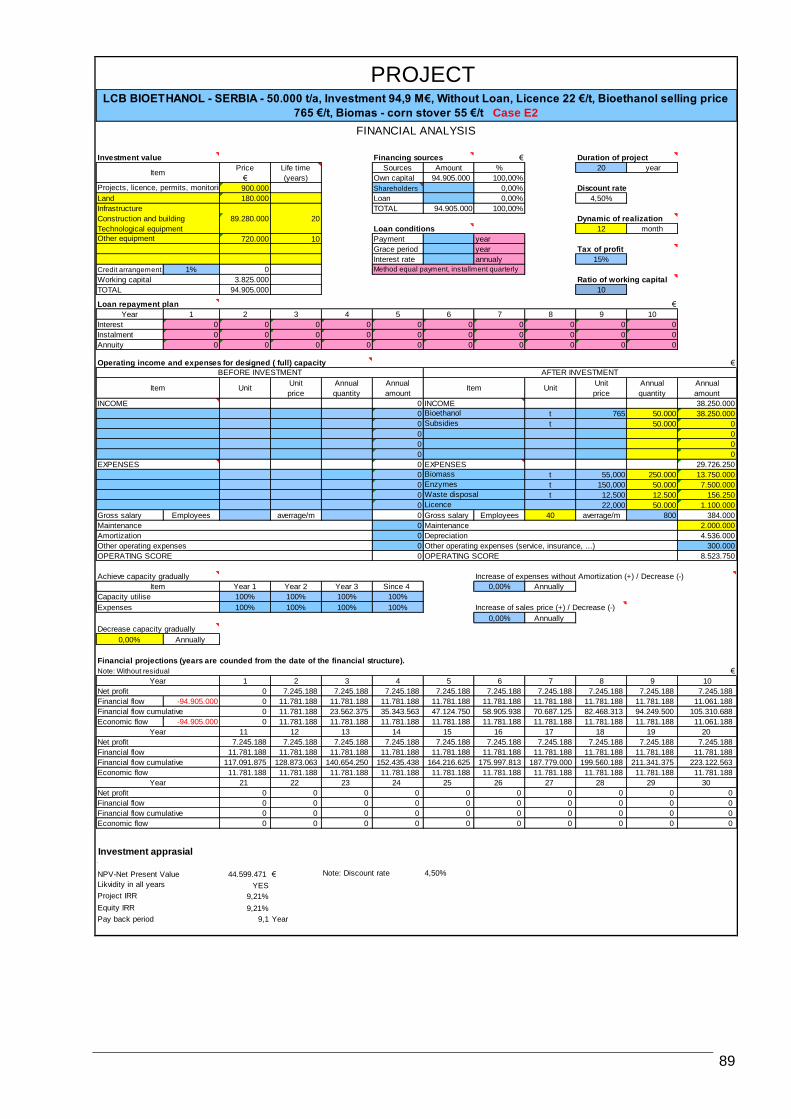
89
€
Price Life time Sources Amount % 20 year
€ (years) Own capital 94.905.000 100,00%
900.000 Shareholders 0,00%
180.000 Loan 0,00% 4,50%
Infrastructure TOTAL 94.905.000 100,00%
Construction and building 89.280.000 20
Technological equipment 12 month
720.000 10 Payment year
Grace period year
Interest rate annualy 15%
Credit arrangement 1% 0
3.825.000
94.905.000 10
€
Year 1 2 3 4 5 6 7 8 9 10
Interest 0 0 0 0 0 0 0 0 0 0
Instalment 0 0 0 0 0 0 0 0 0 0
Annuity 0 0 0 0 0 0 0 0 0 0
€
Unit Annual Annual Unit Annual Annual
price quantity amount price quantity amount
0 38.250.000
0 t 765 50.000 38.250.000
0 t 50.000 0
0 0
0 0
0 0
0 29.726.250
0 t 55,000 250.000 13.750.000
0 t 150,000 50.000 7.500.000
0 t 12,500 12.500 156.250
0 22,000 50.000 1.100.000
Gross salary Employees averrage/m 0 Gross salary Employees 40 averrage/m 800 384.000
0 2.000.000
0 4.536.000
0 300.000
0 8.523.750
Year 1 Year 2 Year 3 Since 4 0,00% Annually
100% 100% 100% 100%
100% 100% 100% 100%
0,00% Annually
0,00% Annually
Financial projections (years are counded from the date of the financial structure).
Note: Without residual €
1 2 3 4 5 6 7 8 9 10
0 7.245.188 7.245.188 7.245.188 7.245.188 7.245.188 7.245.188 7.245.188 7.245.188 7.245.188
Financial flow -94.905.000 0 11.781.188 11.781.188 11.781.188 11.781.188 11.781.188 11.781.188 11.781.188 11.781.188 11.061.188
0 11.781.188 23.562.375 35.343.563 47.124.750 58.905.938 70.687.125 82.468.313 94.249.500 105.310.688
Economic flow -94.905.000 0 11.781.188 11.781.188 11.781.188 11.781.188 11.781.188 11.781.188 11.781.188 11.781.188 11.061.188
11 12 13 14 15 16 17 18 19 20
7.245.188 7.245.188 7.245.188 7.245.188 7.245.188 7.245.188 7.245.188 7.245.188 7.245.188 7.245.188
11.781.188 11.781.188 11.781.188 11.781.188 11.781.188 11.781.188 11.781.188 11.781.188 11.781.188 11.781.188
117.091.875 128.873.063 140.654.250 152.435.438 164.216.625 175.997.813 187.779.000 199.560.188 211.341.375 223.122.563
11.781.188 11.781.188 11.781.188 11.781.188 11.781.188 11.781.188 11.781.188 11.781.188 11.781.188 11.781.188
21 22 23 24 25 26 27 28 29 30
0 0 0 0 0 0 0 0 0 0
0 0 0 0 0 0 0 0 0 0
0 0 0 0 0 0 0 0 0 0
0 0 0 0 0 0 0 0 0 0
.
44.599.471 € 4,50%
YES
9,21%
Equity IRR 9,21%
Pay back period 9,1 Year
Land
Other equipment
Item
Projects, licence, permits, monitoring Discount rate
Dynamic of realization
Loan conditions
Method equal payment, installment quarterly
Working capital
BEFORE INVESTMENT AFTER INVESTMENT
Item
TOTAL
Tax of profit
Ratio of working capital
Operating income and expenses for designed ( full) capacity
Unit
Loan repayment plan
Unit
Investment value Financing sources Duration of project
PROJECTLCB BIOETHANOL - SERBIA - 50.000 t/a, Investment 94,9 M€, Without Loan, Licence 22 €/t, Bioethanol selling price
765 €/t, Biomas - corn stover 55 €/t Case E2
FINANCIAL ANALYSIS
Other operating expenses Other operating expenses (service, insurance, ...)
Year
Net profit
Licence
Maintenance Maintenance
Amortization Depreciation
OPERATING SCORE OPERATING SCORE
Waste disposal
Subsidies
Item
EXPENSES EXPENSES
Biomass
Enzymes
INCOME INCOME
Bioethanol
NPV-Net Present Value Note: Discount rate
Increase of expenses without Amortization (+) / Decrease (-)Achieve capacity gradually
Financial flow cumulative
Year
Net profit
Decrease capacity gradually
Item
Capacity utilise
Expenses Increase of sales price (+) / Decrease (-)
Likvidity in all years
Project IRR
Economic flow
Financial flow cumulative
Year
Net profit
Financial flow
Financial flow cumulative
Financial flow
Economic flow
Investment apprasial

90
€
Price Life time Sources Amount % 20 year
€ (years) Own capital 94.890.000 100,00%
900.000 Shareholders 0,00%
180.000 Loan 0,00% 4,50%
Infrastructure TOTAL 94.890.000 100,00%
Construction and building 89.280.000 20
Technological equipment 12 month
720.000 10 Payment year
Grace period year
Interest rate annualy 15%
Credit arrangement 1% 0
3.810.000
94.890.000 10
€
Year 1 2 3 4 5 6 7 8 9 10
Interest 0 0 0 0 0 0 0 0 0 0
Instalment 0 0 0 0 0 0 0 0 0 0
Annuity 0 0 0 0 0 0 0 0 0 0
€
Unit Annual Annual Unit Annual Annual
price quantity amount price quantity amount
0 38.100.000
0 t 612 50.000 30.600.000
0 t 150 50.000 7.500.000
0 0
0 0
0 0
0 29.726.250
0 t 55,000 250.000 13.750.000
0 t 150,000 50.000 7.500.000
0 t 12,500 12.500 156.250
0 22,000 50.000 1.100.000
Gross salary Employees averrage/m 0 Gross salary Employees 40 averrage/m 800 384.000
0 2.000.000
0 4.536.000
0 300.000
0 8.373.750
Year 1 Year 2 Year 3 Since 4 0,00% Annually
100% 100% 100% 100%
100% 100% 100% 100%
0,00% Annually
0,00% Annually
Financial projections (years are counded from the date of the financial structure).
Note: Without residual €
1 2 3 4 5 6 7 8 9 10
0 7.117.688 7.117.688 7.117.688 7.117.688 7.117.688 7.117.688 7.117.688 7.117.688 7.117.688
Financial flow -94.890.000 0 11.653.688 11.653.688 11.653.688 11.653.688 11.653.688 11.653.688 11.653.688 11.653.688 10.933.688
0 11.653.688 23.307.375 34.961.063 46.614.750 58.268.438 69.922.125 81.575.813 93.229.500 104.163.188
Economic flow -94.890.000 0 11.653.688 11.653.688 11.653.688 11.653.688 11.653.688 11.653.688 11.653.688 11.653.688 10.933.688
11 12 13 14 15 16 17 18 19 20
7.117.688 7.117.688 7.117.688 7.117.688 7.117.688 7.117.688 7.117.688 7.117.688 7.117.688 7.117.688
11.653.688 11.653.688 11.653.688 11.653.688 11.653.688 11.653.688 11.653.688 11.653.688 11.653.688 11.653.688
115.816.875 127.470.563 139.124.250 150.777.938 162.431.625 174.085.313 185.739.000 197.392.688 209.046.375 220.700.063
11.653.688 11.653.688 11.653.688 11.653.688 11.653.688 11.653.688 11.653.688 11.653.688 11.653.688 11.653.688
21 22 23 24 25 26 27 28 29 30
0 0 0 0 0 0 0 0 0 0
0 0 0 0 0 0 0 0 0 0
0 0 0 0 0 0 0 0 0 0
0 0 0 0 0 0 0 0 0 0
.
43.143.487 € 4,50%
YES
9,07%
Equity IRR 9,07%
Pay back period 9,2 Year
Economic flow
Investment apprasial
NPV-Net Present Value Note: Discount rate
Increase of expenses without Amortization (+) / Decrease (-)Achieve capacity gradually
Financial flow cumulative
Year
Net profit
Decrease capacity gradually
Item
Capacity utilise
Expenses Increase of sales price (+) / Decrease (-)
Likvidity in all years
Project IRR
Economic flow
Financial flow cumulative
Year
Net profit
Financial flow
Financial flow cumulative
Financial flow
Item
EXPENSES EXPENSES
Biomass
Enzymes
INCOME INCOME
Bioethanol
Waste disposal
Subsidies
Other operating expenses Other operating expenses (service, insurance, ...)
Year
Net profit
Licence
Maintenance Maintenance
Amortization Depreciation
OPERATING SCORE OPERATING SCORE
Investment value Financing sources Duration of project
PROJECTLCB BIOETHANOL - SERBIA - 50.000 t/a, Investment 94,9 M€, Without Loan, Licence 22 €/t, Bioethanol selling price
612 €/t, Biomas - corn stover 55 €/t, Subsidies 150 €/t Case E3
FINANCIAL ANALYSIS
Working capital
BEFORE INVESTMENT AFTER INVESTMENT
Item
TOTAL
Tax of profit
Ratio of working capital
Operating income and expenses for designed ( full) capacity
Unit
Loan repayment plan
Unit
Land
Other equipment
Item
Projects, licence, permits, monitoring Discount rate
Dynamic of realization
Loan conditions
Method equal payment, installment quarterly

91
€
Price Life time Sources Amount % 20 year
€ (years) Own capital 95.030.000 100,00%
900.000 Shareholders 0,00%
180.000 Loan 0,00% 4,50%
Infrastructure TOTAL 95.030.000 100,00%
Construction and building 89.280.000 20
Technological equipment 12 month
720.000 10 Payment year
Grace period year
Interest rate annualy 15%
Credit arrangement 1% 0
3.950.000
95.030.000 10
€
Year 1 2 3 4 5 6 7 8 9 10
Interest 0 0 0 0 0 0 0 0 0 0
Instalment 0 0 0 0 0 0 0 0 0 0
Annuity 0 0 0 0 0 0 0 0 0 0
€
Unit Annual Annual Unit Annual Annual
price quantity amount price quantity amount
0 39.500.000
0 t 640 50.000 32.000.000
0 t 150 50.000 7.500.000
0 0
0 0
0 0
0 30.976.250
0 t 60,000 250.000 15.000.000
0 t 150,000 50.000 7.500.000
0 t 12,500 12.500 156.250
0 22,000 50.000 1.100.000
Gross salary Employees averrage/m 0 Gross salary Employees 40 averrage/m 800 384.000
0 2.000.000
0 4.536.000
0 300.000
0 8.523.750
Year 1 Year 2 Year 3 Since 4 0,00% Annually
100% 100% 100% 100%
100% 100% 100% 100%
0,00% Annually
0,00% Annually
Financial projections (years are counded from the date of the financial structure).
Note: Without residual €
1 2 3 4 5 6 7 8 9 10
0 7.245.188 7.245.188 7.245.188 7.245.188 7.245.188 7.245.188 7.245.188 7.245.188 7.245.188
Financial flow -95.030.000 0 11.781.188 11.781.188 11.781.188 11.781.188 11.781.188 11.781.188 11.781.188 11.781.188 11.061.188
0 11.781.188 23.562.375 35.343.563 47.124.750 58.905.938 70.687.125 82.468.313 94.249.500 105.310.688
Economic flow -95.030.000 0 11.781.188 11.781.188 11.781.188 11.781.188 11.781.188 11.781.188 11.781.188 11.781.188 11.061.188
11 12 13 14 15 16 17 18 19 20
7.245.188 7.245.188 7.245.188 7.245.188 7.245.188 7.245.188 7.245.188 7.245.188 7.245.188 7.245.188
11.781.188 11.781.188 11.781.188 11.781.188 11.781.188 11.781.188 11.781.188 11.781.188 11.781.188 11.781.188
117.091.875 128.873.063 140.654.250 152.435.438 164.216.625 175.997.813 187.779.000 199.560.188 211.341.375 223.122.563
11.781.188 11.781.188 11.781.188 11.781.188 11.781.188 11.781.188 11.781.188 11.781.188 11.781.188 11.781.188
21 22 23 24 25 26 27 28 29 30
0 0 0 0 0 0 0 0 0 0
0 0 0 0 0 0 0 0 0 0
0 0 0 0 0 0 0 0 0 0
0 0 0 0 0 0 0 0 0 0
.
44.479.853 € 4,50%
YES
9,19%
Equity IRR 9,19%
Pay back period 9,1 Year
Land
Other equipment
Item
Projects, licence, permits, monitoring Discount rate
Dynamic of realization
Loan conditions
Method equal payment, installment quarterly
Working capital
BEFORE INVESTMENT AFTER INVESTMENT
Item
TOTAL
Tax of profit
Ratio of working capital
Operating income and expenses for designed ( full) capacity
Unit
Loan repayment plan
Unit
Investment value Financing sources Duration of project
PROJECTLCB BIOETHANOL - SERBIA - 50.000 t/a, Investment 95 M€, Without Loan, Licence 22 €/t, Bioethanol selling price
640 €/t, Biomas - corn stover 60 €/t, Subsidies 150 €/t Case E4
FINANCIAL ANALYSIS
Other operating expenses Other operating expenses (service, insurance, ...)
Year
Net profit
Licence
Maintenance Maintenance
Amortization Depreciation
OPERATING SCORE OPERATING SCORE
Waste disposal
Subsidies
Item
EXPENSES EXPENSES
Biomass
Enzymes
INCOME INCOME
Bioethanol
NPV-Net Present Value Note: Discount rate
Increase of expenses without Amortization (+) / Decrease (-)Achieve capacity gradually
Financial flow cumulative
Year
Net profit
Decrease capacity gradually
Item
Capacity utilise
Expenses Increase of sales price (+) / Decrease (-)
Likvidity in all years
Project IRR
Economic flow
Financial flow cumulative
Year
Net profit
Financial flow
Financial flow cumulative
Financial flow
Economic flow
Investment apprasial