planning and preparation: first results from the survey of
TRANSCRIPT

Education, skills and learning – Research papers
Planning and preparation: Firstresults from the Survey of Approachesto Educational Planning (SAEP) 2002
by Lisa Shipley, Sylvie Ouellette, Fernando Cartwright
Culture, Tourism and the Centre for Education Statistics Division2001 Main Building, Ottawa, K1A 0T6
Telephone: 1 800 307-3382 Fax: 1 613 951-9040
This paper represents the views of the authors and does not necessarily reflect the opinions of Statistics Canada.
Catalogue no. 81-595-MIE — No. 010
ISSN: 1704-8885
ISBN: 0-662-35449-4
Research Paper
Statistics StatistiqueCanada CanadaHuman Resources Développement des ressourcesDevelopment Canada humaines Canada

Education, skills and learningResearch papers
Planning and preparation:First results from the Survey ofApproaches to Educational Planning(SAEP) 2002
Lisa Shipley, Sylvie Ouellette, Fernando CartwrightStatistics Canada
Published by authority of the Minister responsible for Statistics Canada
© Minister of Industry, 2003
All rights reserved. No part of this publication may be reproduced, stored in a retrieval system ortransmitted in any form or by any means, electronic, mechanical, photocopying, recording or otherwisewithout prior written permission from Licence Services, Marketing Division, Statistics Canada, Ottawa,Ontario, Canada K1A 0T6.
November 2003
Catalogue no. 81-595-MIE2003010
Frequency: Irregular
ISSN 1704-8885ISBN 0-662-35449-4
Ottawa
La version française de cette publication est disponible sur demande (no 81-595-MIF2003010 au catalogue).
Statistics Canada
Human Resources Development Canada
This paper represents the views of the authors and does not necessarily reflect the opinions of Statistics Canada.
How to obtain more information
Specific inquiries about this product and related statistics or services should be directedto: Client Services, Culture, Tourism and the Centre for Education Statistics, StatisticsCanada, Ottawa, Ontario, K1A 0T6 (telephone: (613) 951-7608; toll free at 1 800 307-3382;by fax at (613) 951-9040; or e-mail: [email protected]).
For information on the wide range of data available from Statistics Canada, you cancontact us by calling one of our toll-free numbers. You can also contact us by e-mail or byvisiting our Web site.
National inquiries line 1 800 263-1136National telecommunications device for the hearing impaired 1 800 363-7629E-mail inquiries [email protected] site www.statcan.ca
Ordering information
This product, Catalogue No. 81-595-MIE2003010, is available on the Internet for free.Users can obtain single issues at: http://www.statcan.ca/cgi-bin/downpub/studiesfree.cgi.
Standards of service to the public
Statistics Canada is committed to serving its clients in a prompt, reliable and courteousmanner and in the official language of their choice. To this end, the Agency has developedstandards of service which its employees observe in serving its clients. To obtain a copyof these service standards, please contact Statistics Canada toll free at 1 800 263-1136.

3
Planning and preparation: First results from the Survey of Approaches to Educational Planning (SAEP) 2002
Catalogue no. 81-595-MIE2003010
Acknowledgements
This report was prepared by the Centre for Education Statistics and HumanResources Development Canada (HRDC). We would like to thank all those involvedin the development and production of the Survey of Approaches to EducationalPlanning, in particular the teams at the Learning and Literacy Directorate (HRDC)and Special Surveys Division (Statistics Canada). The assistance of numerousindividuals was critical to the production of this report and we gratefullyacknowledge their contributions. A special thank you is extended to Danielle Baumfor her indispensable help in preparing the manuscript.
Note of appreciation
Canada owes the success of its statistical system to a long-standing co-operativeeffort involving Statistics Canada, the citizens of Canada, its businesses, governmentsand other institutions. Accurate and timely statistical information could not beproduced without their continued co-operation and good will.

4
Planning and preparation: First results from the Survey of Approaches to Educational Planning (SAEP) 2002
Catalogue no. 81-595-MIE2003010
Table of Contents
Introduction 5
Promoting postsecondary education 7
Children’s grades and attitudes to school 10
Savings behaviours 11
Saving strategies 15
Financial planning (other than savings) 16
Amounts saved to 2002 and contribution patterns 19
Amounts expected to have saved for postsecondary education 21
Conclusion 24
Methodology 26
Tables 27
Appendix A: Brief description of the Canadian postsecondary system 41
References 42
Endnotes 43
Cumulative Index 44

5
Planning and preparation: First results from the Survey of Approaches to Educational Planning (SAEP) 2002
Catalogue no. 81-595-MIE2003010
Introduction
The benefits of participation in postsecondary education are many. Increasing levelsof education have been associated with greater participation in volunteering, higherlevels of charitable contributions, more positive perceptions of personal health,increased levels of literacy and a greater potential for higher earnings andemployment stability1. A knowledgeable and educated public also contributes toCanada’s ability to meet the innovative and competitive demands of the labourmarket.
Research has shown that participation in, and persistence through, thepostsecondary education system is related to a number of activities which occurduring the pre-postsecondary years. These include home and school contexts thatsupport and encourage postsecondary participation, meeting postsecondaryadmission requirements such as grades and course prerequisites, financial planning,and appropriate and timely completion of postsecondary admission forms2. Incombination, these factors constitute a complex long-term preparatory process thatis undertaken by families, children and the pre-postsecondary education system.
The Survey of Approaches to Educational Planning, 2002 (SAEP) collectedinformation from parents with children aged 0 to18 on three important elements ofeducational planning related to participation in, and completion of, a postsecondaryeducation: a home context that promotes and supports postsecondary education,children’s academic abilities and perceptions of school, and saving and financialplanning for postsecondary education.
This report is organised around these central themes. The first two sectionsconsider context and abilities while the last three sections examine savings, financialplanning, amounts saved by October 2002, and amounts parents expect to havesaved by the time their children become eligible for postsecondary enrolment.
The first section explores parental perceptions towards education in generaland postsecondary education more specifically. Included is information on parentalbeliefs about the importance of good grades, schooling beyond the high schoollevel, and the hopes and aspirations they have for their children’s educational future.
The second section looks at children’s grades in light of meetingpostsecondary admission requirements. It also includes information on children’sattitudes towards school and overall general performance in school.
Section three examines the many factors that may play a role in whether ornot savings are being put aside for children’s postsecondary education. The analysisexamines parents’ current, future or non-saving status by parental perceptions ofpostsecondary education, parental educational aspirations for children, and children’sacademic abilities and attitudes to school. A number of other factors have beenlinked to saving patterns, such as children’s age, household income and parents’

6
Planning and preparation: First results from the Survey of Approaches to Educational Planning (SAEP) 2002
Catalogue no. 81-595-MIE2003010
own level of educational attainment, which form part of the analysis. Each factor isconsidered individually – not in combination with the others. This section also looksat the various methods that are used to set funds aside for children’s postsecondaryeducation.
A number of financial planning activities, other than parental savings, canhelp meet the anticipated costs of a postsecondary education. Section four examinesthe anticipated use of other sources of funding for postsecondary schooling that areconsidered by parents.
The final section looks at the amounts saved to date, and contributions madeto savings in 2001, including amounts saved and contributed to Registered EducationSavings Plans (RESP) by selected demographic characteristics. Information is alsopresented on the amounts parents expect to have saved by the time the child becomeseligible for postsecondary enrolment.
Statistics Canada, in partnership with Human Resources Development Canada,conducted the Survey of Approaches to Educational Planning (SAEP) in October2002. Just over 10,000 Canadian children aged 0 to 18 were selected for the sample.Their parents/guardians, or in some instances themselves (older children living ontheir own), were contacted by telephone. They were asked a series of questionsabout the perceived importance of a postsecondary education, the educationalaspirations parents have for their children, children’s academic performance, and thefinancing strategies that were to be used to cover the costs of postsecondary education.For more information on the data collection strategy for this survey see theMethodology box at the end of this report.
7
Planning and preparation: First results from the Survey of Approaches to Educational Planning (SAEP) 2002
Catalogue no. 81-595-MIE2003010
Promoting postsecondary education
Parents strongly committed to their children’s postsecondaryeducation
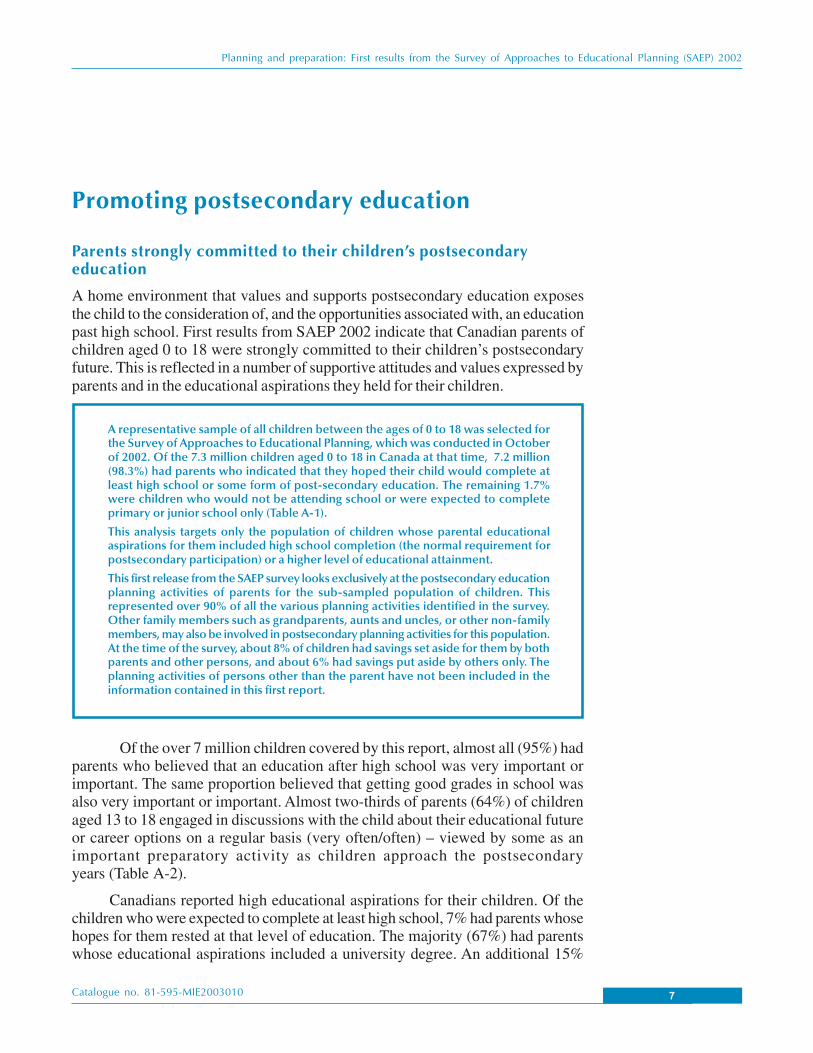
A home environment that values and supports postsecondary education exposesthe child to the consideration of, and the opportunities associated with, an educationpast high school. First results from SAEP 2002 indicate that Canadian parents ofchildren aged 0 to 18 were strongly committed to their children’s postsecondaryfuture. This is reflected in a number of supportive attitudes and values expressed byparents and in the educational aspirations they held for their children.
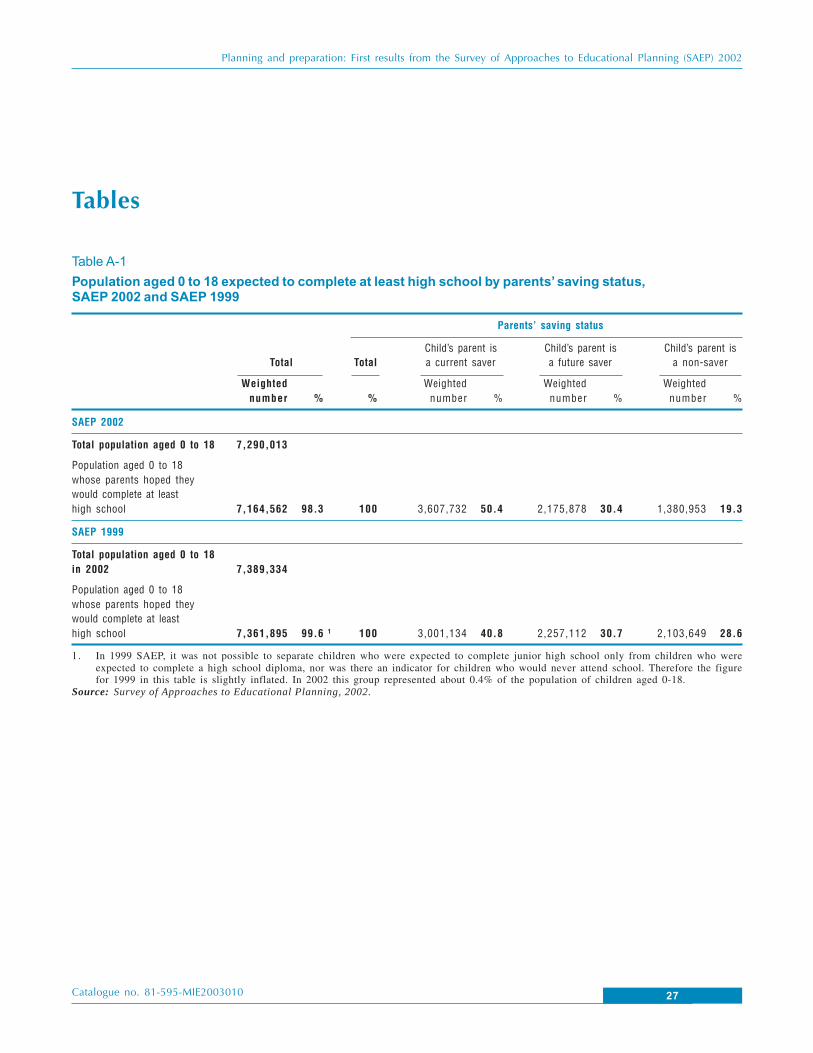
A representative sample of all children between the ages of 0 to 18 was selected forthe Survey of Approaches to Educational Planning, which was conducted in Octoberof 2002. Of the 7.3 million children aged 0 to 18 in Canada at that time, 7.2 million(98.3%) had parents who indicated that they hoped their child would complete atleast high school or some form of post-secondary education. The remaining 1.7%were children who would not be attending school or were expected to completeprimary or junior school only (Table A-1).
This analysis targets only the population of children whose parental educationalaspirations for them included high school completion (the normal requirement forpostsecondary participation) or a higher level of educational attainment.
This first release from the SAEP survey looks exclusively at the postsecondary educationplanning activities of parents for the sub-sampled population of children. Thisrepresented over 90% of all the various planning activities identified in the survey.Other family members such as grandparents, aunts and uncles, or other non-familymembers, may also be involved in postsecondary planning activities for this population.At the time of the survey, about 8% of children had savings set aside for them by bothparents and other persons, and about 6% had savings put aside by others only. Theplanning activities of persons other than the parent have not been included in theinformation contained in this first report.
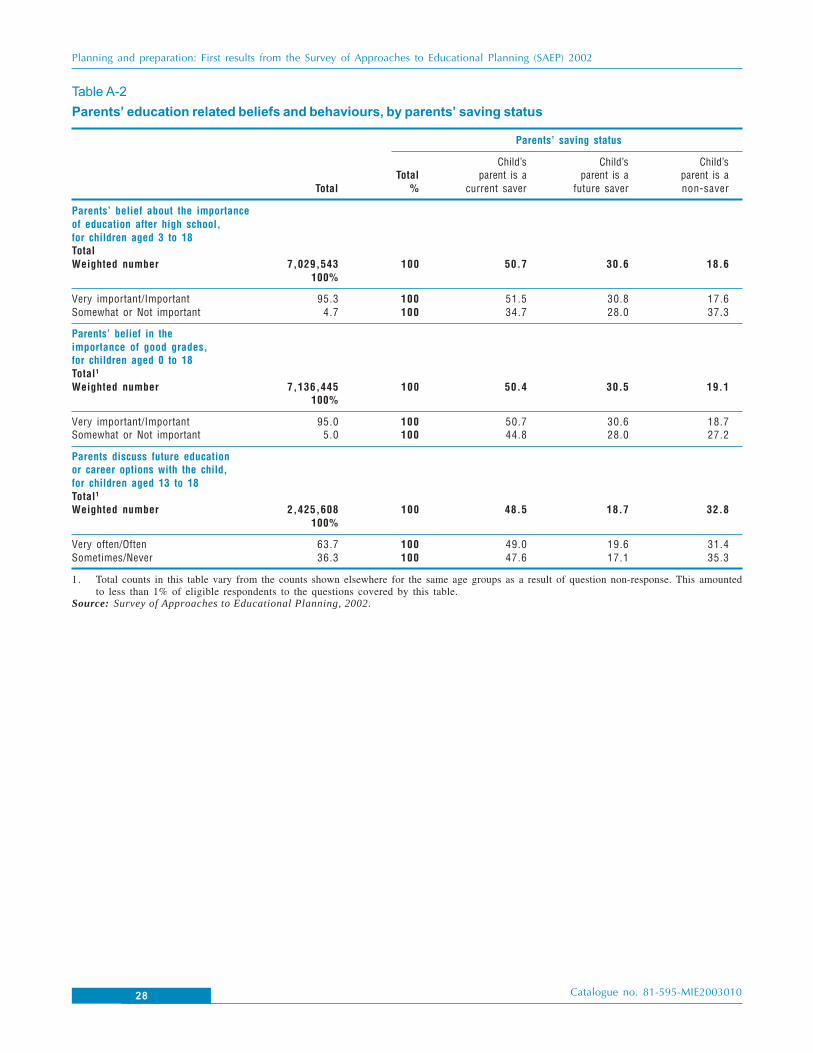
Of the over 7 million children covered by this report, almost all (95%) hadparents who believed that an education after high school was very important orimportant. The same proportion believed that getting good grades in school wasalso very important or important. Almost two-thirds of parents (64%) of childrenaged 13 to 18 engaged in discussions with the child about their educational futureor career options on a regular basis (very often/often) – viewed by some as animportant preparatory activity as children approach the postsecondaryyears (Table A-2).
Canadians reported high educational aspirations for their children. Of thechildren who were expected to complete at least high school, 7% had parents whosehopes for them rested at that level of education. The majority (67%) had parentswhose educational aspirations included a university degree. An additional 15%

8
Planning and preparation: First results from the Survey of Approaches to Educational Planning (SAEP) 2002
Catalogue no. 81-595-MIE2003010
identified CEGEP or college completion, 2% a trade certificate and 9% stated eitherprivate, other or an unknown level of postsecondary education as their educationalaspiration for their child (Table A-3). (See Appendix A for a brief description of thepostsecondary education system in Canada).
Parents’ educational plans for their children varied slightly according to thesex of the child. A slightly larger proportion of male children were expected to gono further than high school relative to female children (8% compared to 5%). At thesame time more consideration was given to the trades for male children (3.5%) thanfor female children (1%*)3. On the other hand, a higher proportion of female childrenhad parents who expressed the hope that they would complete a university degree(71%) than did male children (64%). Parental aspirations were similar for CEGEP/college completions regardless of the sex of the child.
Parental hopes varied greatly according to parents’ own level of educationalexperience. As parental levels of education increased so too did their educationalaspirations for their children. Of the children with parents who had a high schooleducation or less, 12% had parents who also hoped they would complete highschool. More than half (55%) of the parents in this group wanted their children tocomplete university, while 22% wanted their child to complete a CEGEP or collegediploma, 3% identified the trades and 8% stated private or other types ofpostsecondary. By contrast, when the child had parents who had completeduniversity, only 2% of children had high school completion as the associatededucational aspiration. A full 84% of children whose parents were universityeducated were expected to complete university. Only 6% of the children in thisgroup had parents who aspired to CEGEP or college completion for them and 8%had parents who indicated other types of postsecondary education (Table A-4).
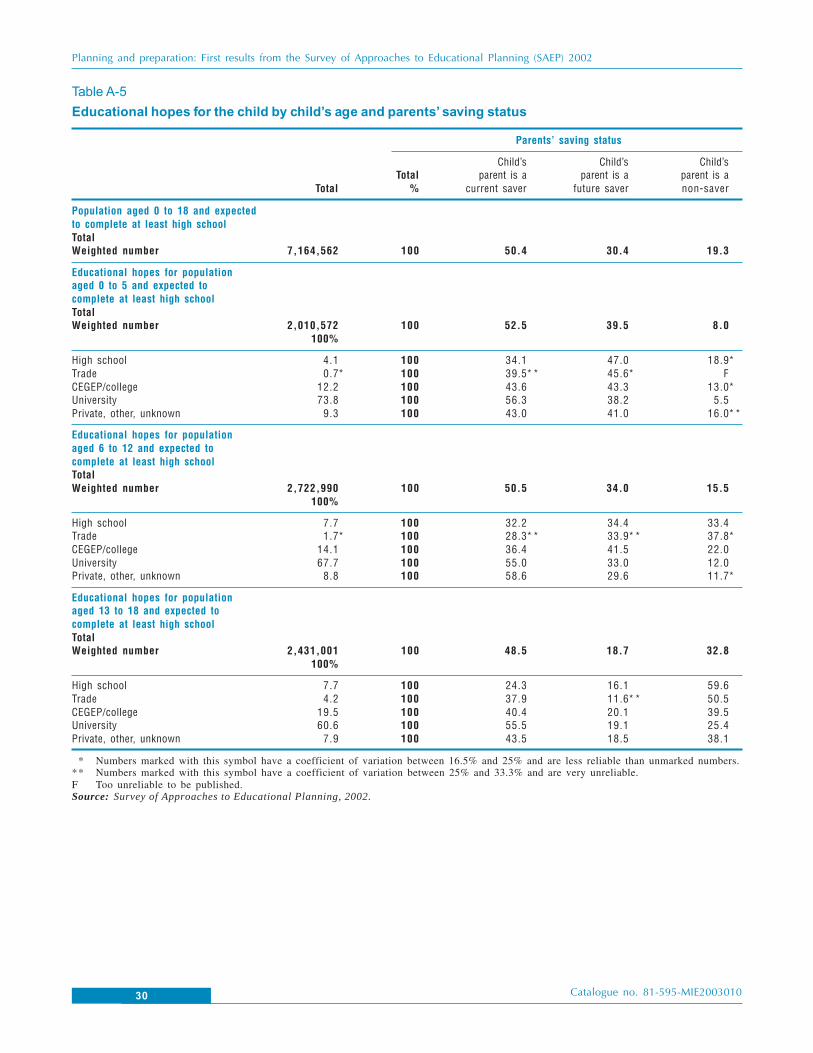
Parents’ educational aspirations for their children were also mitigated by thechild’s age. The increased involvement with the education system as the child agesprovides parents the opportunity to assess children’s school performance, abilitiesand interests and adjust their educational aspirations accordingly. While almost three-quarters of children (74%) of preschool age (aged 0-5) had parents who hoped theywould complete university, this dropped to 68% for those children at the elementaryschool level (aged 6 to 12), and 61% for those typically in the secondary system(aged 13 to 18). As parental university aspirations declined across these age groupsthere were accompanying increases in educational hopes that included tradecertificates (from less than 1%* to 4%) and CEGEP or college diplomas (from 12%to 19%) (Table A-5).

9
Planning and preparation: First results from the Survey of Approaches to Educational Planning (SAEP) 2002
Catalogue no. 81-595-MIE2003010
University
CEGEP/college
Trade
Private, other, unknown
High school
Figure 1
Parent’s educational aspirations for their children, by age group
Age 13 to 18 years
Age 6 to 12 years
Age 0 to 5 years
Parental aspirations
Percent of children
0 20 40 60 80 100

10
Planning and preparation: First results from the Survey of Approaches to Educational Planning (SAEP) 2002
Catalogue no. 81-595-MIE2003010
Children’s grades and attitudes to school
Children were doing well at school, but almost half had parentswho believed they could be doing better
Access to postsecondary education means not only meeting the academicrequirements for admission to a postsecondary school, but also having positiveattitudes towards schooling plus the ability to maintain good school work habitsthroughout the long educative process.
Eight in ten children had parents report that their child’s grades were 70%or higher in 2002 (14% at 90 or above, 32% between 80 and 89, 36% between 70and 79). Should their grades stay at these levels, the majority of children weredoing well enough in 2002 to meet college or university admission requirements inthe future (Table A-6).
Nine in ten children were perceived by parents to either like school (73%)or were neutral about school (16%) mirroring the overall positive attitudes parentshad towards their children’s continued education, as discussed earlier. Only 11% ofchildren seemed to dislike school according to parents. Parental school performanceexpectations were high. The parents of only about half the children (53%) believedthat their children were working to their full potential at school.
11
Planning and preparation: First results from the Survey of Approaches to Educational Planning (SAEP) 2002
Catalogue no. 81-595-MIE2003010
Savings behaviours
The proportion of children with savings for postsecondaryincreased from 41% to 50% in three years
Most would agree that early financial planning for a postsecondary education isdesirable and recent results from the Postsecondary Education Participation Survey(PEPS)4 indicated that family members play an important role in meetingpostsecondary costs. Over half (58%) of full-time postsecondary students interviewedin PEPS were using money (non-repayable) from family members to help covertheir education costs.
According to SAEP, half the children who were expected to complete highschool had parents who were already putting money aside for their postsecondaryeducation (current savers). An additional 30% had parents who intended to startsaving in the future (future savers), and the remaining 19% of these children hadparents who were not, and did not plan to save for postsecondary (non-savers)(Table A-1).
These figures show an increase in the proportion of children with parentswho were already saving when compared to results from the 1999 cycle of SAEP.In 1999, 41% of children had parents who were already saving, 31% of the parentsintended to start saving in the future and 28% of the parents were not, and wouldnot save.
The nine percentage point decline in non-savers between 1999 and 2002translated into an increase in the proportion of current savers, while the proportionof future savers remained stable over the period. About one in five savers in 2002had started saving after 1999.
Parental beliefs about education linked to saving behaviours
About half of the children whose parents believed an education after high schoolwas important already had savings put aside for them in 2002. An additional 31%expected to save in the future. Only 19% of children whose parents believed that aneducation after high school was very important or important had parents who werenon-savers. This contrasts with children whose parents believed that an educationafter high school was only somewhat or not important. In this group 35% hadsavings set aside for them by parents, while 28% had parents who intended to savein the future. More than a third (37%) of the children from this group had parentswho were non-savers.
The same pattern holds true with parents’ beliefs in the importance of goodgrades. Only about 19% of children whose parents believed in good grades wouldnot have savings set aside by the time they became eligible for postsecondary

12
Planning and preparation: First results from the Survey of Approaches to Educational Planning (SAEP) 2002
Catalogue no. 81-595-MIE2003010
enrolment. This rose to 27% of children whose parents felt that good grades wereonly somewhat or not important. (Table A-2)
Whether a parent was a current, future or non-saver was closely tied to theparents’ educational aspirations for their child. As the desired level of education forthe child moved from high school, through trade, CEGEP/college and university,the proportion of children with parents who were current savers increased. About29% of children with parents who wanted them to complete high school had parentswho were current savers. This almost doubled, to 56%, when parents saw universityin their child’s future (Table A-3).
While three in ten children with parents who stated high school as theeducation goal were being saved for at the time of the survey an additional three inten children in this category had parents who intended to start saving in the future.This seems to indicate that many parents are uncertain about their child’spostsecondary future and are saving, or intending to save, in case the child doescontinue on to postsecondary.
Parental savings behaviours strongly tied to the child’s age
In general, parents’ saving status was similar for male and female children, with oneexception. When the educational aspiration for male children was high schoolcompletion, about 32% of parents were already saving and about 39% did not havecurrent savings, nor did they plan to save in the future (non-savers). On the otherhand, under the same conditions for female children, 26% had parents who werecurrently saving and 45% had parents who were non-savers (Table A-3).
Significant differences in parent’s saving status were evident across thepreschool, elementary and secondary age groups of the children. While one mightexpect that the proportion of children with parents who were non-savers woulddecline as the child approached postsecondary enrolment age, just the opposite wastrue. In fact, for each subsequent increase in age category, the proportion of childrenwith parents who were non-savers doubled (8% non-savers for children aged 0 to 5,15% for those aged 6 to 12, and 33% for those aged 13 to 18) (Table A-5).
These increases in the non-saver category by age group were off-set bydecreases in the proportion of children with parents who were intending to save inthe future. About 40% of children aged 0 to 5 had parents who intended to startsaving in the future according to the survey. This proportion dropped by more thanhalf, to 19% for children aged 13 to 18. It appears that parents who intend to startsaving in the future may just run out of time.
As a consequence, about 40% of 13 to 18 year olds whose parents wantedthem to complete college and 25% of children whose parents wanted them tocomplete university would not have any savings set aside for them by the time theybecame eligible for postsecondary enrolment.

13
Planning and preparation: First results from the Survey of Approaches to Educational Planning (SAEP) 2002
Catalogue no. 81-595-MIE2003010
Children who were performing well in school were more likely tohave savings
The proportion of children with parents who were current savers declined both asthe child’s grades dropped and as the child’s attitudes towards school became morenegative.
Almost six in ten children whose reported grades were 90% or higher hadparents who were already saving for their postsecondary education. This comparesto three in ten for children whose grades were below 60%. This pattern is repeatedwhen examining parents’ saving status by children’s attitudes to school. More thanhalf (52%) of the children who liked school had parents who were current savers,while only 37% of the children who disliked school had parents who were saving(Table A-6).
Parental perceptions of whether or not their child was working to their fullpotential appeared to make a smaller, although still significant difference, to parentalsavings behaviours. About 51% of children perceived to be working to their fullpotential had parents who were current savers, compared to 48% for childrenperceived to be underperforming.
It is noteworthy that 42% of children with reported grades between 60 and69, 29% of children whose grades were below 60, 37% of children who did notlike school, and 48% of children perceived by parents not to be working to their fullpotential, nevertheless had savings already set aside for a postsecondary education.
Savings behaviours vary on a number of demographic and familycharacteristics
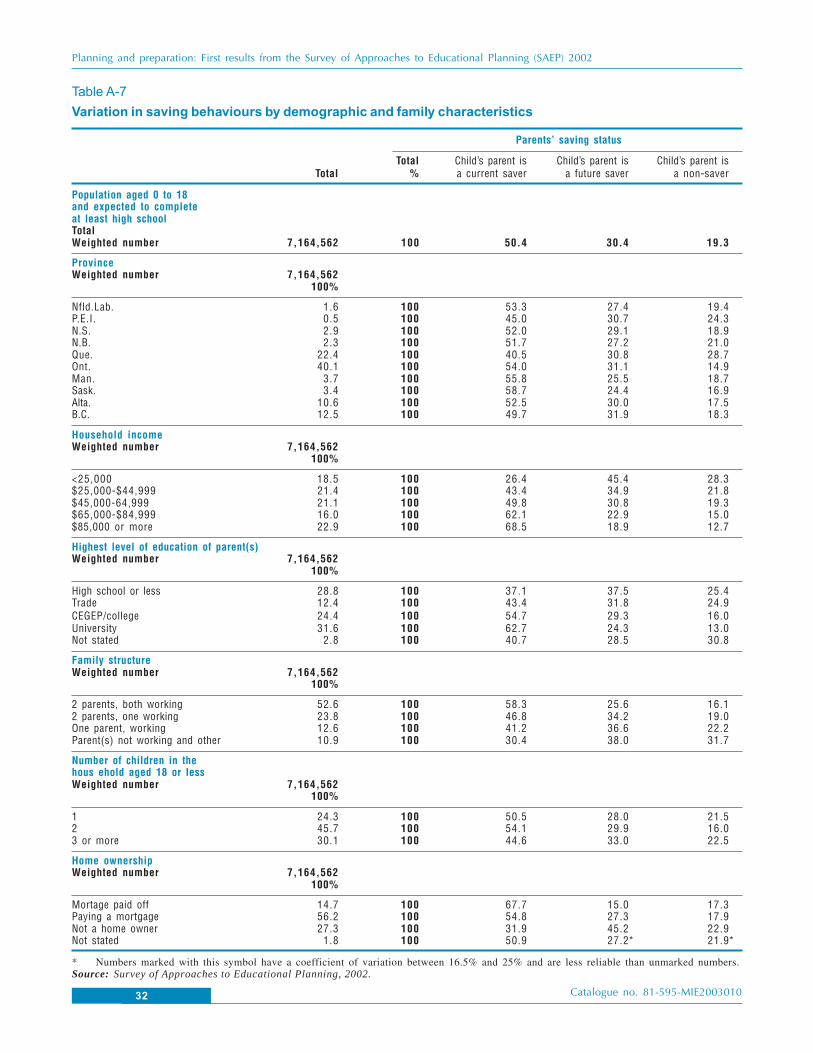
Parents’ savings status varied across provinces. Saskatchewan and Manitoba hadthe highest proportion of children whose parents were current savers (59% and56%, relative to 50% for Canada overall). Quebec had the lowest proportion ofchildren with parents who were saving (40%), perhaps related to the relativelylower costs of attending CEGEP schools in Quebec. Prince Edward Island wasalso below the Canadian average in proportion of current savers (45%), and had thehighest proportion of non-savers (24%) outside of Quebec (Table A-7).
Higher income5 groups had the highest share of current savers. Almost 7 inten children (68%) living in households with incomes of $85,000 or more werecurrently being saved for at the time of the survey. This dropped steadily as incomelevels decreased. Nevertheless, more than a quarter (26%) of children living inhouseholds where the household income was less than $25,000 had parents whowere current savers. And almost half the children in this lowest income group (45%)had parents who intended to start saving in the future.
With income levels tied closely to levels of educational attainment it is notsurprising to find that children in households where at least one parent was universityeducated had the highest proportion of parents who were currently saving (63%).However, 37% of children whose parents had only a high school education alsohad savings already set aside for them.

14
Planning and preparation: First results from the Survey of Approaches to Educational Planning (SAEP) 2002
Catalogue no. 81-595-MIE2003010
The number of parents working seemed to matter more to the ability to savethan whether the child was from a single parent or a two parent family. Children intwo parent families where both parents were working were the most likely to havesavings set aside (58%). Children from two parent families with only one parentworking, and single parent working families, were below the Canadian average ofparents who were current savers, at 47% and 41% respectively. Children betweenthe ages of 0 and 18 in non-standard living arrangements (parent(s) not working orolder children living on their own) were well below the Canadian average inproportion with parents who were saving (30%).
A PROFILE OF CURRENT, FUTURE AND NON-SAVERS
The selection criteria for the SAEP survey population, that is households with childrenbetween the ages of 0 and 18 years, had an important impact on the comparativeprofiles of current, future and non-savers. For example, the majority of children,overall, lived in two parent families, and the majority of children in current saver,future saver and non-saver categories also lived in two parent families. In 2002, mostchildren lived in households with 2 children, as was the case in each of the savingstatus profiles. The specifications of the selection criteria for the survey resulted incomparative profiles that were more similar than dissimilar with some notableexceptions.
A greater share of current savers came from Ontario (43%) than might be expectedfrom the general population distribution (40%). On the other hand, a greater share ofnon-savers lived in Québec (33%) than would be expected from the general distribution(22%). The postsecondary CEGEP system in Québec, with its relatively lower costs, islikely a contributing factor to these differences (Table A-8).
While children who lived in households with incomes of less than $25,000 wereunder represented in the current saver category, (10% relative to 18.5% in the generalpopulation) they were over-represented in both the future saver (28%) and non-saver categories (27%). On the other hand, children from homes with incomes of$85,000 or more represented a higher share of the current saver category (31%) thanin the population as a whole (23%).
Children with parents who had a high school education or less formed a larger shareof both the future (36%) and non-saver categories (38%) relative to their share in theoverall population (29%). Children with parents who had a university degree wereover-represented in the current saver category (39% compared to 32% in the totalpopulation).
Children who lived in households where the parent was not a homeowner(presumably parents were renting), were greatly under-represented in the currentsaver group (17%) when compared to their proportion in the total population (27%).They were over-represented in the future saver category (41%).
15
Planning and preparation: First results from the Survey of Approaches to Educational Planning (SAEP) 2002
Catalogue no. 81-595-MIE2003010
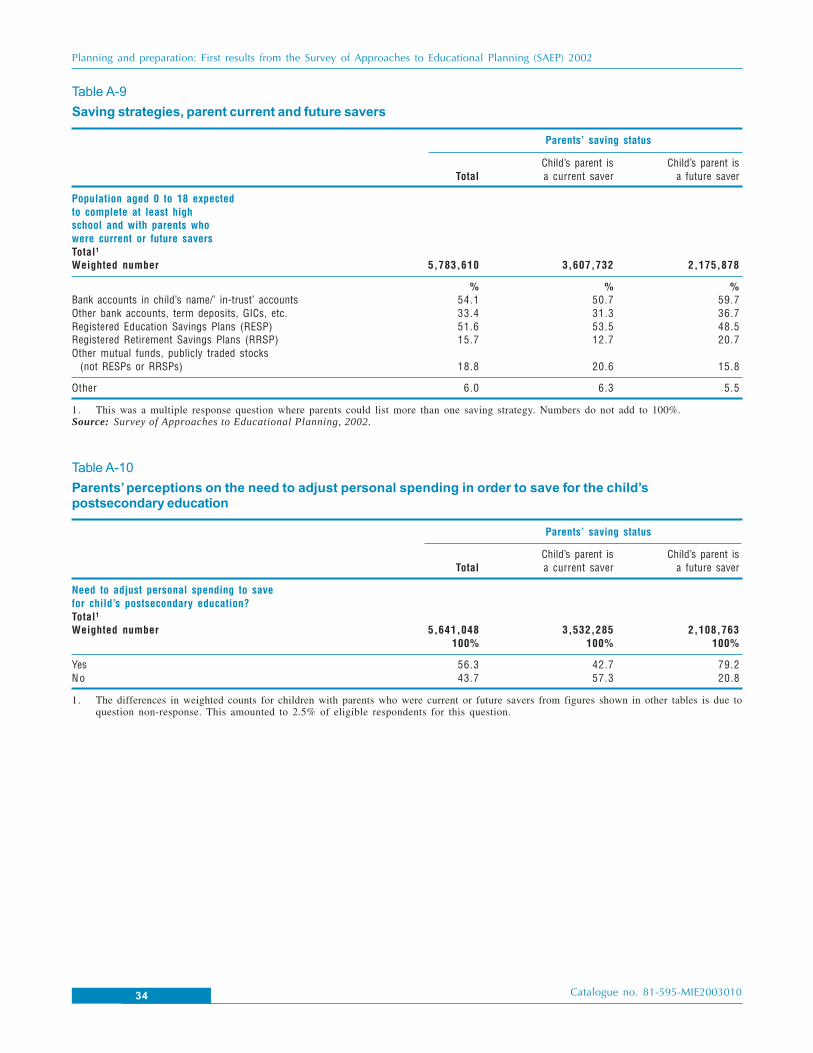
Saving strategiesAbout 80% of children aged 0 to 18 had parents who were either already saving orwere intending to start saving in the future. These parents were asked a series ofquestions about their saving strategies. Parents were using, or intended to use, avariety of methods to save for their children’s postsecondary education, mostindicating at least two methods. Overall, placing savings with a banking institution- either in an account in the child’s name, (54%), or in term deposits, GICs and thelike, (33%) - was the most often cited method by current and future savers. RegisteredEducation Savings Plans (RESP) were popular with just over half (52%) of allparents who were saving or intended to start saving in the future. Funds placed inRESPs attract a contribution made by the federal government through the CanadaEducation Savings Grant program, while those placed in bank savings do not attractthis contribution6 (Table A-9).
About one in ten children with parents who were current savers and one infive with parents as future savers had parents who stated that Registered RetirementSavings Plans were or would be used as a saving method (Table A-9).
Overall, parents of more than half (56%) of the children with current or futuresavings indicated that they believed some adjustment to personal spending wasnecessary in order to save for their child’s postsecondary schooling. This perceptionvaried considerably by parents’ saving status. When savings were currently beingmade, about four in ten (43%) children had parents who felt that they needed toadjust spending habits in order to save. This leapt to almost eight in ten (79%) incases where the parents were future savers. It may be that parents who were currentlysaving had already adjusted their finances, or it may be that the anticipation ofsaving appears more burdensome than the reality (Table A-10).

16
Planning and preparation: First results from the Survey of Approaches to Educational Planning (SAEP) 2002
Catalogue no. 81-595-MIE2003010
Financial planning (other than savings)
A number of other sources are expected to contribute topostsecondary education costs
The SAEP survey asked future and non-savers why they had not yet started to saveor were not going to save. About six in ten future savers and non-savers gave “nodisposable income” or “insufficient money” as a reason for not yet or never saving(Table A-11).
Yet, putting savings aside is not the only financial planning activity that canbe pursued. Both parents and children can contribute to the costs of postsecondaryin ways other than through parental savings, for example through children’s earningsfrom work, student loans, parents providing room and board, and so forth. In fact,98% of children aged 13 to 18 had parents that identified financing strategies thatwere outside of parental savings. Of the 2% who did not have alternative financialstrategies, about one-third already had parental savings set aside for theirpostsecondary education. This left just over 1% of the 13 to 18 year old populationwith no current savings, no intended savings, and no other financing strategies inplace.
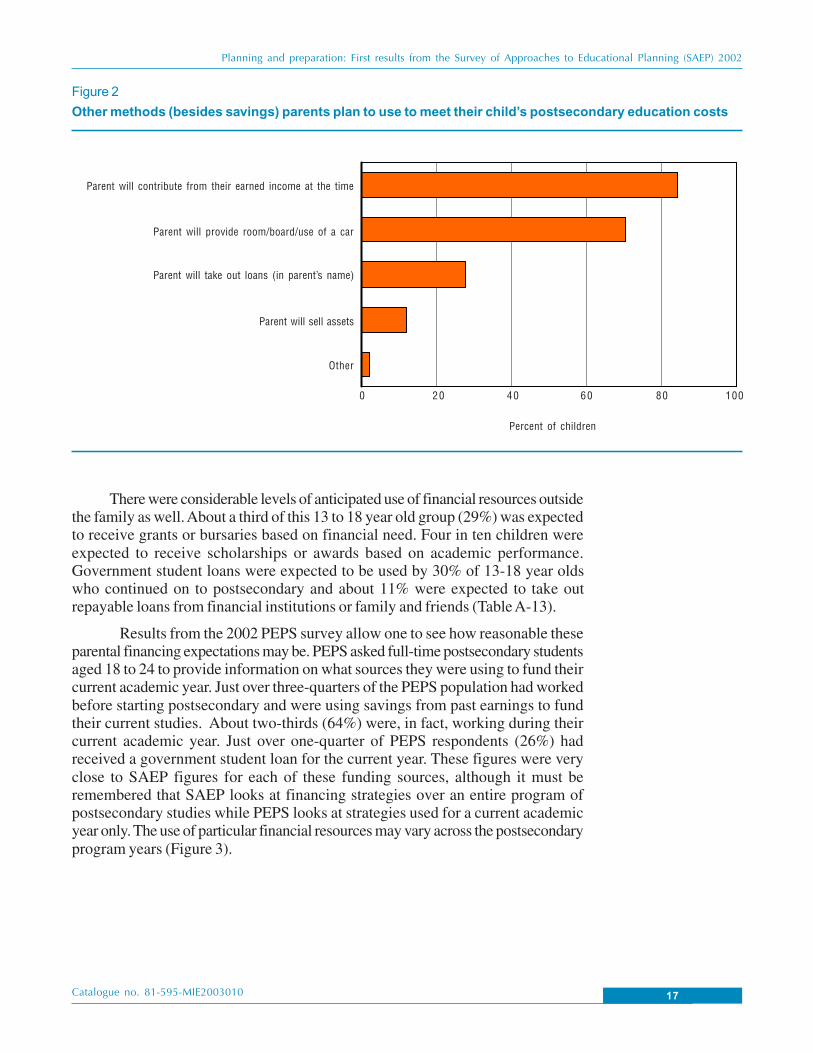
A look at the mix of alternative financing methods reveals the complexityof creating a postsecondary financial plan. Overall, the parents of 86% of childrenaged 13 to 18 stated that they would contribute to postsecondary costs in waysother than from personal savings (Table A-12).
About eight in ten children (84%) had parents who said they would drawon parental earnings at the time to help pay for postsecondary. Just over seven inten children (71%) had parents who reported that they would continue to provideroom and board in order to reduce postsecondary costs. Over a quarter of children(28%) had parents who were prepared to take out personal loans (in the parent’sname) in order to help finance their child’s postsecondary studies (Table A-13).
Various means of meeting postsecondary costs were more child-oriented.Of the 2 million children in this age group, 90% were expected by parents to contributeto their own postsecondary education costs. Almost 80% were expected to workand save before starting their postsecondary education. Two-thirds were expectedto work during postsecondary and it was believed that about 8% might have tointerrupt their postsecondary studies to work.
17
Planning and preparation: First results from the Survey of Approaches to Educational Planning (SAEP) 2002
Catalogue no. 81-595-MIE2003010
There were considerable levels of anticipated use of financial resources outsidethe family as well. About a third of this 13 to 18 year old group (29%) was expectedto receive grants or bursaries based on financial need. Four in ten children wereexpected to receive scholarships or awards based on academic performance.Government student loans were expected to be used by 30% of 13-18 year oldswho continued on to postsecondary and about 11% were expected to take outrepayable loans from financial institutions or family and friends (Table A-13).
Results from the 2002 PEPS survey allow one to see how reasonable theseparental financing expectations may be. PEPS asked full-time postsecondary studentsaged 18 to 24 to provide information on what sources they were using to fund theircurrent academic year. Just over three-quarters of the PEPS population had workedbefore starting postsecondary and were using savings from past earnings to fundtheir current studies. About two-thirds (64%) were, in fact, working during theircurrent academic year. Just over one-quarter of PEPS respondents (26%) hadreceived a government student loan for the current year. These figures were veryclose to SAEP figures for each of these funding sources, although it must beremembered that SAEP looks at financing strategies over an entire program ofpostsecondary studies while PEPS looks at strategies used for a current academicyear only. The use of particular financial resources may vary across the postsecondaryprogram years (Figure 3).
Figure 2
Other methods (besides savings) parents plan to use to meet their child’s postsecondary education costs
Percent of children
0 20 40 60 80 100
Parent will contribute from their earned income at the time
Parent will provide room/board/use of a car
Parent will take out loans (in parent’s name)
Parent will sell assets
Other

18
Planning and preparation: First results from the Survey of Approaches to Educational Planning (SAEP) 2002
Catalogue no. 81-595-MIE2003010
The financing strategies used by PEPS respondents to fund their currentacademic year were substantially different from those expected to be used by childrenin SAEP in three important areas. Only 15% of PEPS respondents had receivedgrants or bursaries based on financial need (or about half the 29% figure in SAEP).About the same proportion of PEPS respondents had received scholarships or awardsbased on academic performance, compared to the expected 40% in SAEP. Theonly identified financing strategy that had a lower expected usage in SAEP thanwas being experienced by current students in PEPS, was in the area of repayableloans from family, friends or financial institutions (11% and 27% respectively).
Figure 3
Other methods children are expected to use, or are using, to finance postsecondary education, SAEP 2002,PEPS 2002
Child will work before starting postsecondary
Child will work during postsecondary
Child will receive scholarships or awards based on academic
performance
Child will take out government student loans
Child will receive grants or bursaries based on financial need
Child will receive gifts or inheritances
Child will take out loans from a financial institution, or fromfamily/friends/spouse
Child will interrupt postsecondary to work
Percent
0 20 40 60 80 10010 30 50 70 90
Expected use of funding source, SAEP 2002
Use of funding source, current full-time students, PEPS 2002
N/A
N/A

19
Planning and preparation: First results from the Survey of Approaches to Educational Planning (SAEP) 2002
Catalogue no. 81-595-MIE2003010
Amounts saved to 2002 and contributionpatterns
$32 billion set aside for postsecondary education
In total, parent current savers had accumulated $32 billion dollars for their children’spostsecondary education by 2002. This is almost double the $17 billion that hadbeen accumulated for children aged 0 to 18 in the 1999 cycle of SAEP(Table A-14). The median amount saved to date in 2002 was $5,000. This comparesto a median amount saved in 1999 of $3,5007.
Of the estimated $32 billion dollars saved by 2002, $11 billion had beenplaced in RESPs and about $20 billion was held in other types of savings. Althoughfewer children had parents who were contributing to RESPs than to other types ofsavings, the median amount saved to date in RESPs was higher at $4,000 than themedian amount saved to date in other types of savings ($3,000).
Parent current savers provided information on the contributions they hadmade to savings for the previous calendar year (2001). For current savers as a group,the total median amount contributed in 2001 was $840. Again the disparity in levelof contribution was notable between RESPs and other types of savings. The medianamount contributed to RESPs in 2001 was $1,000 while the median amountcontributed to other savings was $5008. Although making greater contributions toRESP plans maximizes the return from the Canada Education Savings Grantprogram, a median amount of $1,000 is only half of the $2,000 maximum annualcontribution that attracts CESG grants.
Variations in amounts saved to date and contribution patterns
Saskatchewan, with the highest proportion of children who were being saved for,also had the highest median amount saved to date at $5,900. Current savers in NewBrunswick had the lowest median amount saved to date at $2,900. All saversregardless of province preferred to use savings strategies outside of RESP plans.However, when RESP plans were used, in all provinces the median amount savedto date in RESPs was greater than in other savings. As well, the median amountcontributed to RESPs in 2001 was also greater than the median amount contributedto other savings in all provinces except Newfoundland and Labrador (Table A-15).
With more saving years behind them, children aged 13 to 18 had parents thathad saved the highest median dollar amount to date ($7,900). This compares to$4,900 for children aged 6 to 12 years and $2,000 for preschool-aged children. Theuse of RESPs was far more popular with parents of children in the two youngestage groups. While only 46% of children aged 13 to 18 had parent current saverswho used RESPs, this increased to 55% for children aged 6 to 12 years, and 60%
20
Planning and preparation: First results from the Survey of Approaches to Educational Planning (SAEP) 2002
Catalogue no. 81-595-MIE2003010
for children aged 0 to 5 years. Although the proportion of children with parentsusing RESPs changed across the three age groups, the dollar amounts contributedto RESPs in 2001 were consistently higher than the amounts contributed to othersavings for each of the three age groups (Table A-16).
Not surprisingly, children whose parents had identified high school as theeducational goal for their children had the lowest median dollars saved to date at$2,990*. Median savings were highest when the parental educational hopes for thechild included a university degree at $4,960. Interesting patterns were evident inthe RESP- other savings preferences according to educational aspirations. About93% of children expected to complete high school only had savings outside ofRESPs, while about 76% of those expected to complete university had savingsoutside of RESPs. On the other hand, only 26% of children expected to completehigh school had RESP savings, while 58% of those expected to complete universityhad RESP savings.
Household income was linked to the amount of money saved to date bycurrent savers, the savings strategies used, and the contributions to savings made in2001. Children in households where the income was less than $25,000 had a medianamount of $2,400 saved to date by 2002. This almost tripled for the highest incomegroup where the median amount saved to date was $7,000. A much higher proportionof children living in high income households had parents who were using RESPplans to save, (61%) relative to children living in low income households (42%).
The median amount contributed in 2001 was almost three times higher forhouseholds in the highest income bracket relative to those in the lowest incomebracket. Parent savers in households with incomes of less than $25,000 made amedian contribution of $590 in 2001, while those living in households with $85,000or more in income contributed about $1,400.

21
Planning and preparation: First results from the Survey of Approaches to Educational Planning (SAEP) 2002
Catalogue no. 81-595-MIE2003010
Amounts expected to have saved forpostsecondary educationAs noted earlier, income was related to both the likelihood that parents intended tosave any money for their children’s education and whether or not they were currentlysaving. It is not surprising, therefore, that income was also related to the amountthat parents expected to have saved by the time their children became eligible forpostsecondary enrolment.
Figure 4 compares several distributions describing how much money parentswho were currently saving expected to save for their children’s postsecondaryeducation. Each of the five different lines represents a different group of householdincome. Although the majority of the values (indicated by the high peaks) werebetween $5,000 and $25,000, the distributions indicate a great deal of variability inthe expectations of parents.
For all income groups except the two highest, parents were most likely toexpect around $10,000 in educational savings. Using education costs estimatedfrom the Post-secondary Education Participation Survey, 2002 (PEPS)9, this equatesto approximately 1 year of postsecondary education. However, very few parents inthe lowest income category expected to save more than this amount. The steepnessof the single peak for this group indicates that parents in the lowest income grouptended to be very similar in their expectations of savings.
Figure 4
Expected savings for children’s postsecondary education, by household income (parent current savers)
$0 - $24,999 $25,000 - $44,999 $45,000 - $64,999 $65,000 - $84,999$85,000 or more
$0 — $24,999$25,000 — $44,999$45,000 — $64,999$65,000 — $84,999
$85,000 or more
Household income groups
50
40
30
20
10
0$0 $10,000 $20,000 $30,000 $40,000 $50,000 $60,000 $70,000
Expected savings
Percent

22
Planning and preparation: First results from the Survey of Approaches to Educational Planning (SAEP) 2002
Catalogue no. 81-595-MIE2003010
A density function, or distribution, illustrates where members of a population tend tobe concentrated. Peaks and valleys in the curves indicate areas of higher and lowerconcentration, respectively. A tall, narrow peak indicates that people tend to betightly clustered around a single value, while a low, wide peak indicates that peopletend to be less similar and are spread out over a wider range of values. Often adistribution will have more than one peak, suggesting that people tend to clusteraround more than one value. The closer a curve is to zero for a particular incomevalue, the less likely members of the population are to be around that value.
For this graph, the horizontal axis describes expected savings amounts in incrementsof $10,000, and the vertical axis describes the percentage of cases that fall aroundeach $10,000 multiple for each household income group. For example, the height ofthe curve for the highest income group in the $20,000 region, is approximately 25%.This suggests that roughly a quarter of parent current savers for children in thehighest household income group expect savings of around $20,000. The total areabetween each curve and the horizontal axis is the same for all curves. This represents100% of the children with parents who are current savers for each income group.Approximately 5% of the children in each household income group had parentsreporting expected savings between $70,000 and $500,000, which is to the right of therange depicted in this graph.
Because the area beneath each curve is the same, comparing the heights of twocurves is a simple way to compare how members of different groups are distributed.For example, if the height of one curve is twice the height of another curve at thevalue of $10,000, the comparison suggests that the first group has twice the percentageof people at $10,000 than the second group. However, one would expect that thesecond group was, in turn, more likely than the first group to have some other value.Typically, when two groups are different it is because low values are more likely tooccur in one group and higher values are more likely to occur in the other group.
Not surprisingly, as household income increased, parents expected to saveincreasingly higher amounts. While parents of children in the next two incomegroups ($25,000-$64,999) also tended to be concentrated around $10,000, aboutone in four children had parents who expected to save around $20,000, or theequivalent of two years of postsecondary education.
However, the differences in savings expectations were not proportional tothe increases in income across the three lowest income groups. Although themaximum household income level shifted by $40,000 for these three income groups,parents were still most likely to expect around $10,000 in savings. Few parents inany of the three lowest household income groups expected to save more than around$20,000.
Children from the two highest income groups also had many parentsexpecting savings around $10,000. Nonetheless, the most likely savings for childrenliving at the higher income levels was around $20,000.
There was a greater tendency for parents of children living at the highestincome level to expect savings around $30,000. However, even at the highestincome level, parents of two-thirds of the children still expected to save less than$30,000. It appears that parents who were saving, even those at the highest incomelevels, did not expect to save much more than the equivalent of two years ofpostsecondary costs.

23
Planning and preparation: First results from the Survey of Approaches to Educational Planning (SAEP) 2002
Catalogue no. 81-595-MIE2003010
Interestingly, in each of the five income groups, there was a noticeablepercentage of parents who expected to save around $50,000. The percentage rangedfrom approximately 2% to 7% between income groups and, except for the twohighest income groups, was larger than the percentage expecting to save around$40,000. The presence of this small sub-population implies that, regardless of income,there are some parents who expect to have sufficient savings to pay for the equivalentof at least an undergraduate university degree.

24
Planning and preparation: First results from the Survey of Approaches to Educational Planning (SAEP) 2002
Catalogue no. 81-595-MIE2003010
ConclusionThe 2002 Survey of Approaches to Educational Planning collected information onthree important elements of the long-term postsecondary planning process: a contextthat supports and promotes postsecondary education, the child’s academic abilitiesand attitudes to school, and saving and financial planning.
According to SAEP, the vast majority of children (95%) who were expectedto complete at least high school had parents who believed that good grades and apostsecondary education were important. Parental educational aspirations for theirchildren were high. Of the 7.2 million children who were expected to complete atleast high school, 93% had parents who saw them completing either a trade, college,university or other type of postsecondary education. Parental educational aspirationsvaried according to the child’s age. For children aged 0 to 5 years, 74% were expectedto complete a university degree. This figure fell to 68% of children aged 6 to 12years of age and 61% of children between the ages of 13 to 18. Parents appear toadjust their educational aspirations as their children move through elementary/secondary school, perhaps as parents become more attuned to their children’sacademic interests and abilities.
SAEP indicated that 82% of children in grade one or higher had reportedgrades of 70% or more, high enough to meet many postsecondary admissionrequirements should the grades stay at that level throughout the child’s elementaryand secondary years. Seven in ten children (73%) in grade one or higher wereperceived by their parents to like school, an attitude that may influence participationand persistence in postsecondary.
Savings and financial planning activities were varied and complex. Half ofthe children who were expected to complete at least high school had parents whohad already set funds aside for the child’s postsecondary education, up from 41% in1999. An additional 30% had parents who intended to start saving in the future.The remaining 19% would not have access to parental savings when they becameeligible for postsecondary enrolment. Parents who had not yet started to save, ordid not intend to save, most frequently gave lack of money as the reason for notsaving.
Survey results highlighted the important role played by parental beliefs aboutpostsecondary and the child’s academic performance in parental saving behaviours.When parents believed that an education after high school was important, 52% ofchildren already had savings at the time of the survey. When parents were lesssupportive of a postsecondary education, only 34% of children had savings setaside. About 57% of children with grades of 90% or higher had parents who werecurrently saving. This fell to 29% for children with grades below 60.

25
Planning and preparation: First results from the Survey of Approaches to Educational Planning (SAEP) 2002
Catalogue no. 81-595-MIE2003010
Eighty-six percent of children aged 13 to 18 had parents who would becontributing to the costs of postsecondary in ways other than from savings, includingusing parental earnings at the time, providing room and board or taking out loans(in the parent’s name). Nine in ten children aged 13 to 18 were expected to make acontribution to their postsecondary costs themselves, either through working orthrough grants, scholarships or bank and student loans. Between the variouscombinations of parental savings and other financing strategies, only about 1% ofchildren aged 13 to 18 had no savings or financial plans in place for a postsecondaryeducation.
A comparison between the expected use of particular financing strategiesby parents of 13 to 18 year old children in the SAEP population, to the use of thesestrategies by 18 to 24 year old full-time postsecondary students in the PostsecondaryEducation Participation Survey (PEPS) highlighted substantial differences in threeimportant areas. While about 29% of children in SAEP had parents who expectedthem to receive grants or bursaries based on financial need, only 15% of PEPSrespondents had received grants or bursaries to fund their current academic year.About four in ten children in SAEP had parents who believed they would receivescholarships or awards based on academic performance, while about 15% of PEPSrespondents had received this type of funding for their current postsecondary costs.The only identified financing strategy that had a lower expected usage in SAEPthan was being experienced by current students in PEPS, was in the area of loansfrom family, friends or financial institutions (11% and 27% respectively).
By October 2002, children between the ages of 0 to 18 had an estimated$32 billion already set aside by their parents for their future postsecondary schooling.This was almost double the $17 billion that had been saved for children betweenthe ages of 0 to 18 in the 1999 cycle of SAEP.
The amounts saved to date by parents varied on several factors includingthe child’s age and the household income level. The median amount saved byOctober 2002 for children aged 0 to 5 years was $2,000, for children aged 6 to 12years it was $5,000, and for those aged 13 to 18 years it was $7,000. The amountssaved nearly tripled between the lowest income group ($2,400 saved) and the highestincome group ($7,000 saved).
Parent current savers were asked to estimate how much would be saved bythe time their child became eligible for postsecondary enrolment. The majority ofchildren in this group had parents that hoped to have set aside the equivalent of twoyears or less of postsecondary costs (about $20,000 or less). Those living inhouseholds with incomes under $25,000 were most likely to expect about one yearof costs to be put aside by the time postsecondary began. On the other hand, expectedsavings for children living in households at the highest income levels were equal toabout two years of postsecondary schooling (about$20,000). Few children hadparents who anticipated being able to set aside enough money to be able to coverthe costs of a four year undergraduate degree.
These first results from SAEP demonstrate that the long-term postsecondarypreparatory process is complex and that a number of inter-related factors influenceparents’ educational aspirations for their children, saving behaviours and financingstrategies. Further analysis of the SAEP data will broaden our understanding of therelative importance of the factors influencing the postsecondary planning process.

26
Planning and preparation: First results from the Survey of Approaches to Educational Planning (SAEP) 2002
Catalogue no. 81-595-MIE2003010
MethodologyThe Survey of Approaches to Educational Planning (SAEP) targeted the populationaged 0 to 18 living in the 10 provinces in Canada. Excluded from the survey wereresidents of the Yukon, the Northwest Territories, Nunavut, persons living on IndianReserves, full-time members of the armed forces and residents of institutions. InOctober 2002 , the estimated target population for SAEP was 7,290,013 children.
The survey was undertaken as a supplement to the Labour Force Survey(LFS) by sampling one child per household from the five live LFS rotation groupsin October 2002. The survey was conducted in October and November 2002 bycomputer-assisted telephone interview. A total of 10,788 households participatedin the survey from the 15,089 households with selected children , for a global responserate of 71.5%. We collected information on 10,788 children which corresponds toapproximately 0.15% of all children aged 0 to 18 living in Canada in 2002. TheSAEP sample size allows for relatively detailed estimates at the national level aswell as at the provincial level. However, only limited analysis is possible for provinceswith smaller populations.
27
Planning and preparation: First results from the Survey of Approaches to Educational Planning (SAEP) 2002
Catalogue no. 81-595-MIE2003010
Tables
Table A-1
Population aged 0 to 18 expected to complete at least high school by parents’ saving status,SAEP 2002 and SAEP 1999
Parents’ saving status
Child’s parent is Child’s parent is Child’s parent isTotal Total a current saver a future saver a non-saver
Weighted Weighted Weighted Weightednumber % % number % number % number %
SAEP 2002
Total population aged 0 to 18 7,290,013
Population aged 0 to 18whose parents hoped theywould complete at leasthigh school 7,164,562 98.3 100 3,607,732 50.4 2,175,878 30.4 1,380,953 19.3
SAEP 1999
Total population aged 0 to 18in 2002 7,389,334
Population aged 0 to 18whose parents hoped theywould complete at leasthigh school 7,361,895 99.6 1 100 3,001,134 40.8 2,257,112 30.7 2,103,649 28.6
1. In 1999 SAEP, it was not possible to separate children who were expected to complete junior high school only from children who wereexpected to complete a high school diploma, nor was there an indicator for children who would never attend school. Therefore the figurefor 1999 in this table is slightly inflated. In 2002 this group represented about 0.4% of the population of children aged 0-18.
Source: Survey of Approaches to Educational Planning, 2002.
28
Planning and preparation: First results from the Survey of Approaches to Educational Planning (SAEP) 2002
Catalogue no. 81-595-MIE2003010
Table A-2
Parents’ education related beliefs and behaviours, by parents’ saving status
Parents’ saving status
Child’s Child’s Child’sTotal parent is a parent is a parent is a
Total % current saver future saver non-saver
Parents’ belief about the importanceof education after high school,for children aged 3 to 18TotalWeighted number 7,029,543 100 50.7 30.6 18.6
100%
Very important/Important 95.3 100 51.5 30.8 17.6Somewhat or Not important 4.7 100 34.7 28.0 37.3
Parents’ belief in theimportance of good grades,for children aged 0 to 18Total1
Weighted number 7,136,445 100 50.4 30.5 19.1100%
Very important/Important 95.0 100 50.7 30.6 18.7Somewhat or Not important 5.0 100 44.8 28.0 27.2
Parents discuss future educationor career options with the child,for children aged 13 to 18Total1
Weighted number 2,425,608 100 48.5 18.7 32.8100%
Very often/Often 63.7 100 49.0 19.6 31.4Sometimes/Never 36.3 100 47.6 17.1 35.3
1. Total counts in this table vary from the counts shown elsewhere for the same age groups as a result of question non-response. This amountedto less than 1% of eligible respondents to the questions covered by this table.
Source: Survey of Approaches to Educational Planning, 2002.

29
Planning and preparation: First results from the Survey of Approaches to Educational Planning (SAEP) 2002
Catalogue no. 81-595-MIE2003010
Table A-3
Educational hopes for the child, by sex of child and parents’ saving status
Parents’ saving status
Educational hopes for children Child’s Child’s Child’saged 0 to 18 and expected to Total parent is a parent is a parent is acomplete at least high school Total % current saver future saver non-saver
Both sexes
TotalWeighted number 7,164,562 100 50.4 30.4 19.3
100%
High school 6.7 100 29.4 29.4 41.2Trade 2.3 100 35.3 20.9* 43.8CEGEP/college 15.4 100 39.7 32.7 27.5University 67.0 100 55.5 30.4 14.1Private, other, unknown 8.6 100 49.2 29.6 21.3
Males
TotalWeighted number 3,663,864 100 49.8 30.6 19.6
100%
High school 8.0 100 31.8 29.3 38.9Trade 3.5 100 36.8 19.8* 43.4CEGEP/college 15.8 100 40.6 33.4 26.0University 63.5 100 55.0 31.1 13.9Private, other, unknown 9.2 100 50.2 27.9 21.9
Females
TotalWeighted number 3,500,699 100 50.9 30.1 18.9
100%
High school 5.3 100 25.7 29.5 44.8Trade 1.0* 100 30.2* 24.6** 45.1*CEGEP/college 15.0 100 38.8 31.9 29.3University 70.7 100 56.0 29.7 14.3Private, other, unknown 8.0 100 48.0 31.5 20.5
* Numbers marked with this symbol have a coefficient of variation between 16.5% and 25% and are less reliable than unmarked numbers.** Numbers marked with this symbol have a coefficient of variation between 25% and 33.3% and are very unreliable.Source: Survey of Approaches to Educational Planning, 2002.
Table A-4
Educational hopes for the child, by highest level of educational attainment of parent(s)
Highest level of educational attainment of parent(s)
Educational hopes for children Highaged 0 to 18 and expected to school CEGEP/complete at least high school Total or less Trade college University Not stated
TotalWeighted number 7,164,562 2,065,900 888,986 1,746,535 2,263,916 199,224
100% 100% 100% 100% 100% 100%
High school 6.7 11.9 10.3 4.9 1.8* 8.4 **Trade 2.3 3.1 3.6* 2.3 0.9* 3.3 **CEGEP/college 15.4 21.5 23.0 16.9 5.6 15.1 *University 67.0 55.1 53.6 66.4 83.7 65.0Private, other, unknown 8.6 8.3 9.4 9.5 7.9 8.3 *
* Numbers marked with this symbol have a coefficient of variation between 16.5% and 25% and are less reliable than unmarked numbers.** Numbers marked with this symbol have a coefficient of variation between 25% and 33.3% and are very unreliable.Source: Survey of Approaches to Educational Planning, 2002.
30
Planning and preparation: First results from the Survey of Approaches to Educational Planning (SAEP) 2002
Catalogue no. 81-595-MIE2003010
Table A-5
Educational hopes for the child by child’s age and parents’ saving status
Parents’ saving status
Child’s Child’s Child’sTotal parent is a parent is a parent is a
Total % current saver future saver non-saver
Population aged 0 to 18 and expectedto complete at least high schoolTotalWeighted number 7,164,562 100 50.4 30.4 19.3
Educational hopes for populationaged 0 to 5 and expected tocomplete at least high schoolTotalWeighted number 2,010,572 100 52.5 39.5 8.0
100%
High school 4.1 100 34.1 47.0 18.9*Trade 0.7* 100 39.5** 45.6* FCEGEP/college 12.2 100 43.6 43.3 13.0*University 73.8 100 56.3 38.2 5.5Private, other, unknown 9.3 100 43.0 41.0 16.0**
Educational hopes for populationaged 6 to 12 and expected tocomplete at least high schoolTotalWeighted number 2,722,990 100 50.5 34.0 15.5
100%
High school 7.7 100 32.2 34.4 33.4Trade 1.7* 100 28.3** 33.9** 37.8*CEGEP/college 14.1 100 36.4 41.5 22.0University 67.7 100 55.0 33.0 12.0Private, other, unknown 8.8 100 58.6 29.6 11.7*
Educational hopes for populationaged 13 to 18 and expected tocomplete at least high schoolTotalWeighted number 2,431,001 100 48.5 18.7 32.8
100%
High school 7.7 100 24.3 16.1 59.6Trade 4.2 100 37.9 11.6** 50.5CEGEP/college 19.5 100 40.4 20.1 39.5University 60.6 100 55.5 19.1 25.4Private, other, unknown 7.9 100 43.5 18.5 38.1
* Numbers marked with this symbol have a coefficient of variation between 16.5% and 25% and are less reliable than unmarked numbers.** Numbers marked with this symbol have a coefficient of variation between 25% and 33.3% and are very unreliable.F Too unreliable to be published.Source: Survey of Approaches to Educational Planning, 2002.

31
Planning and preparation: First results from the Survey of Approaches to Educational Planning (SAEP) 2002
Catalogue no. 81-595-MIE2003010
Table A-6
Child’s grades and school related behaviours by parents’ saving status
Parents’ saving status
Child’s Child’s Child’sTotal parent is a parent is a parent is a
Total % current saver future saver non-saver
Population aged 0 to 18and expected to completeat least high schoolTotalWeighted number 7,164,562 100 50.4 30.4 19.3
Child’s grades, for childrenin grade one or higherTotal1
Weighted number 4,688,315100%
90-100% 14.3 100 57.0 23.1 19.980-89% 31.7 100 55.3 25.3 19.470-79% 36.2 100 47.3 26.6 26.060-69% 13.9 100 41.6 29.5 29.0Below 60% 3.9 100 29.3 23.7 47.0
Child’s attitudes to school,for children in gradeone or higherTotal1
Weighted number 4,766,911100%
Likes school 73.2 100 52.1 26.0 21.9Neither likes nor dislikes school 15.6 100 46.8 24.5 28.7Dislikes school 11.1 100 37.3 28.0 34.7
Parents believe child is workingto their full potential in school, forchildren in grade one or higherTotal1
Weighted number 4,728,907100%
Yes 53.1 100 51.3 25.9 22.8No 46.9 100 47.7 25.9 26.3
1. The differences in weighted counts for children in grade one or higher is a result of question non-response. This amounted to 2% or less ofeligible respondents for each question covered by this table.
Source: Survey of Approaches to Educational Planning, 2002.
32
Planning and preparation: First results from the Survey of Approaches to Educational Planning (SAEP) 2002
Catalogue no. 81-595-MIE2003010
Table A-7
Variation in saving behaviours by demographic and family characteristics
Parents’ saving status
Total Child’s parent is Child’s parent is Child’s parent isTotal % a current saver a future saver a non-saver
Population aged 0 to 18and expected to completeat least high schoolTotalWeighted number 7,164,562 100 50.4 30.4 19.3
ProvinceWeighted number 7,164,562
100%
Nfld.Lab. 1.6 100 53.3 27.4 19.4P.E.I. 0.5 100 45.0 30.7 24.3N.S. 2.9 100 52.0 29.1 18.9N.B. 2.3 100 51.7 27.2 21.0Que. 22.4 100 40.5 30.8 28.7Ont. 40.1 100 54.0 31.1 14.9Man. 3.7 100 55.8 25.5 18.7Sask. 3.4 100 58.7 24.4 16.9Alta. 10.6 100 52.5 30.0 17.5B.C. 12.5 100 49.7 31.9 18.3
Household incomeWeighted number 7,164,562
100%
<25,000 18.5 100 26.4 45.4 28.3$25,000-$44,999 21.4 100 43.4 34.9 21.8$45,000-64,999 21.1 100 49.8 30.8 19.3$65,000-$84,999 16.0 100 62.1 22.9 15.0$85,000 or more 22.9 100 68.5 18.9 12.7
Highest level of education of parent(s)Weighted number 7,164,562
100%
High school or less 28.8 100 37.1 37.5 25.4Trade 12.4 100 43.4 31.8 24.9CEGEP/college 24.4 100 54.7 29.3 16.0University 31.6 100 62.7 24.3 13.0Not stated 2.8 100 40.7 28.5 30.8
Family structureWeighted number 7,164,562
100%
2 parents, both working 52.6 100 58.3 25.6 16.12 parents, one working 23.8 100 46.8 34.2 19.0One parent, working 12.6 100 41.2 36.6 22.2Parent(s) not working and other 10.9 100 30.4 38.0 31.7
Number of children in thehous ehold aged 18 or lessWeighted number 7,164,562
100%
1 24.3 100 50.5 28.0 21.52 45.7 100 54.1 29.9 16.03 or more 30.1 100 44.6 33.0 22.5
Home ownershipWeighted number 7,164,562
100%
Mortage paid off 14.7 100 67.7 15.0 17.3Paying a mortgage 56.2 100 54.8 27.3 17.9Not a home owner 27.3 100 31.9 45.2 22.9Not stated 1.8 100 50.9 27.2* 21.9*
* Numbers marked with this symbol have a coefficient of variation between 16.5% and 25% and are less reliable than unmarked numbers.Source: Survey of Approaches to Educational Planning, 2002.

33
Planning and preparation: First results from the Survey of Approaches to Educational Planning (SAEP) 2002
Catalogue no. 81-595-MIE2003010
Table A-8
Comparative demographic and family profiles of current, future and non-savers
Parents’ saving status
Child’s Child’s Child’sparent is a parent is a parent is a
Total current saver future saver non-saver
Population aged 0 to 18 and expectedto complete at least high schoolTotalWeighted number 7,164,562 3,607,732 2,175,878 1,380,953
Province 100% 100% 100% 100%Nfld.Lab. 1.6 1.7 1.5 1.6P.E.I. 0.5 0.4 0.5 0.6N.S. 2.9 3.0 2.8 2.8N.B. 2.3 2.4 2.1 2.5Que. 22.4 18.0 22.7 33.3Ont. 40.1 43.0 41.1 31.0Man. 3.7 4.1 3.1 3.6Sask. 3.4 4.0 2.7 3.0Alta. 10.6 11.0 10.5 9.6B.C. 12.5 12.3 13.1 11.9
Household income 100% 100% 100% 100%<25,000 18.5 9.7 27.6 27.1$25,000-$44,999 21.4 18.4 24.6 24.2$45,000-64,999 21.1 20.9 21.4 21.2$65,000-$84,999 16.0 19.8 12.1 12.5$85,000 or more 22.9 31.2 14.2 15.1
Highest level of education of parent(s) 100% 100% 100% 100%High school or less 28.8 21.2 35.6 38.0Trade 12.4 10.7 13.0 16.0CEGEP/college 24.4 26.5 23.5 20.2University 31.6 39.3 25.3 21.3Not stated 2.8 2.2 2.6 4.4
Family structure 100% 100% 100% 100%2 parents, both working 52.6 60.9 44.3 43.92 parents, one working 23.8 22.1 26.8 23.5One parent, working 12.6 10.3 15.2 14.6Parent(s) not working and other 10.9 6.6 13.7 17.9
Number of children in the household aged 18 or less 100% 100% 100% 100%1 24.3 24.3 22.4 27.02 45.7 49.0 45.0 37.93 or more 30.1 26.6 32.6 35.0
Home ownership 100% 100% 100% 100%Mortage paid off 14.7 19.7 7.2 13.2Paying a mortgage 56.2 61.2 50.5 52.3Not a home owner 27.3 17.3 40.7 32.5Not stated 1.8 1.8* 1.6* 2.0*
* Numbers marked with this symbol have a coefficient of variation between 16.5% and 25% and are less reliable than unmarked numbers.Source: Survey of Approaches to Educational Planning, 2002.
34
Planning and preparation: First results from the Survey of Approaches to Educational Planning (SAEP) 2002
Catalogue no. 81-595-MIE2003010
Table A-9
Saving strategies, parent current and future savers
Parents’ saving status
Child’s parent is Child’s parent isTotal a current saver a future saver
Population aged 0 to 18 expectedto complete at least highschool and with parents whowere current or future saversTotal1
Weighted number 5,783,610 3,607,732 2,175,878
% % %Bank accounts in child’s name/’ in-trust’ accounts 54.1 50.7 59.7Other bank accounts, term deposits, GICs, etc. 33.4 31.3 36.7Registered Education Savings Plans (RESP) 51.6 53.5 48.5Registered Retirement Savings Plans (RRSP) 15.7 12.7 20.7Other mutual funds, publicly traded stocks (not RESPs or RRSPs) 18.8 20.6 15.8
Other 6.0 6.3 5.5
1. This was a multiple response question where parents could list more than one saving strategy. Numbers do not add to 100%.Source: Survey of Approaches to Educational Planning, 2002.
Table A-10
Parents’ perceptions on the need to adjust personal spending in order to save for the child’spostsecondary education
Parents’ saving status
Child’s parent is Child’s parent isTotal a current saver a future saver
Need to adjust personal spending to savefor child’s postsecondary education?Total1
Weighted number 5,641,048 3,532,285 2,108,763100% 100% 100%
Yes 56.3 42.7 79.2No 43.7 57.3 20.8
1. The differences in weighted counts for children with parents who were current or future savers from figures shown in other tables is due toquestion non-response. This amounted to 2.5% of eligible respondents for this question.

35
Planning and preparation: First results from the Survey of Approaches to Educational Planning (SAEP) 2002
Catalogue no. 81-595-MIE2003010
Table A-11
Reasons for not yet or never saving
Reasons for not yet saving Child’s parent is a future saver
Total1
Weighted number 2,175,878
%No disposable income 60.8Other priorities – prefer to pay down debt 11.6Will have saved enough though we will start in the future 6.8Other priorities – prefer to save for other purposes 5.4Other 10.7*
Reasons for never saving Child’s parent is a non-saver
Total1
Weighted number 1,380,593
%Insufficient money 56.9Parent will help pay when child starts postsecondary 29.5Child will pay or take out loans 8.1Child will use savings or income from others 3.6Do not have to pay for postsecondary 3.6*Parents do not feel obliged to pay 3.5*Postsecondary education is not important 2.5*Other 4.9
* Numbers marked with this symbol have a coefficient of variation between 16.5% and 25% and are less reliable than unmarked numbers.1. This was a multiple response question where parents could list more than one saving strategy. Numbers do not add to 100%.Source: Survey of Approaches to Educational Planning, 2002.
Table A-12
Will parent or child contribute to costs once child starts postsecondary (other than from parental savings),population aged 13 to 18, by parents’ saving status
Parents’ saving status
Child’s Child’s Child’sTotal parent is a parent is a parent is a
Total % current saver future saver non-saver
Total population aged 13 to 18 andexpected to complete high schoolTotalWeighted number 2,431,001 100 48.5 18.7 32.8
Who will contribute: 100%Parents only will contribute 7.7 100 54.4 12.6* 33.0Parent and child will contribute 77.8 100 50.2 20.7 29.1Child only will contribute 12.4 100 36.4 11.4* 52.1Neither parent nor child will contribute or don’t know, not stated 2.0 100 32.8* F 58.9
* Numbers marked with this symbol have a coefficient of variation between 16.5% and 25% and are less reliable than unmarked numbers.F Too unreliable to be published.Source: Survey of Approaches to Educational Planning, 2002.

36
Planning and preparation: First results from the Survey of Approaches to Educational Planning (SAEP) 2002
Catalogue no. 81-595-MIE2003010
Table A-13
Alternative financing strategies (other than parental savings), for population aged 13 to 18 andexpected to complete at least high school
Population aged 13 to 18 and expected to complete at least high school Total
TotalWeighted number 2,431,001
Parent will contribute:Total1
Weighted number 2,079,713
%From earned income at the time 84.3Parent will provide free room/board/use of a car 70.5Parent will take out loans (in parent’s name) 27.6Parent will sell assets 12.0Other 2.1
Child will contribute:Total1
Weighted number 2,194,540
%Child will work before starting postsecondary 79.8Child will work during postsecondary 65.9Child will receive scholarships or awards based on academic performance 39.6Child will take out loans (in child’s name) 35.8
government student loans (federal or provincial) 29.7loans from family, friends, others or a financial institution 10.8
Child will receive grants or bursaries based on financial need 28.8Child will receive gifts or inheritances 12.5Child will interrupt postsecondary to work 8.2
1. This was a multiple response question where parents could list more than one saving strategy. Numbers do not add to 100%.Source: Survey of Approaches to Educational Planning, 2002.

37
Planning and preparation: First results from the Survey of Approaches to Educational Planning (SAEP) 2002
Catalogue no. 81-595-MIE2003010
Table A-14
Amounts saved to date by parent current savers and contributions to savings
Amounts saved to date Contributions in 20012
Total $ Total Contributions Contributions saved $ in $ in other contributions to RESPs to other
to date RESPs savings in 20012 in 20012 savings in 20012
SAEP 2002
Total dollar amounts $31,944,641,400 $11,288,302,800 $20,656,338,600 $4,931,258,000 $2,077,581,000 $2,853,677,000
25th percentile $2,000 $2,000 $1,000 $200 $480 $10095% confidence interval-lower $4,659 $3,918 $2,907 $754 $1,000 $495Median1 dollar amounts (50th percentile) $5,000 $4,000 $3,000 $840 $1,000 $50095% confidence interval-upper $5,341 $4,082 $3,093 $926 $1,000 $50575th percentile $10,000 $8,000 $7,570 $2,000 $2,000 $1,000
Number of children 3,607,732 1,928,385 2,799,670 3,579,624 1,754,929 2,603,150
SAEP 1999
Total dollar amounts $17,350,583,800
25th percentile $1,50095% confidence interval-lower $2,953Median1 dollar amounts (50th percentile) $3,500 . . . . . . . . . .95% confidence interval-upper $4,00075th percentile $7,000
Number of children 3,001,134
1. Median dollar amounts are presented. A median splits the population into two equal groups, half the population falls above the medianestimate and half the population falls below the estimate. Note that medians can not be added together to arrive at a total.
2. Median contributions were calculated only for those who made a contribution in 2001. Median RESP amounts were calculated only for thosewho contributed to RESPs in 2001. Median amounts to other savings were calculated only for those who made a contribution to othersavings in 2001.
.. Not available for a specific reference period.Source: Survey of Approaches to Educational Planning, 2002.

38
Planning and preparation: First results from the Survey of Approaches to Educational Planning (SAEP) 2002
Catalogue no. 81-595-MIE2003010
Table A-15
Median1 amounts saved to date and contributed in 2001, parent current savers, by province
Total Nfld.Lab. P.E.I. N.S. N.B. Que. Ont. Man. Sask. Alta. B.C.
Amounts saved to dateWeighted number – current savers 3,607,732 61,814 15,363 107,970 86,379 649,462 1,552,565 148,418 143,286 398,099 444,377% of current savers 100 100 100 100 100 100 100 100 100 100 10025th percentile $1,990 $2,020 $1,520 * $1,760 $1,060 $1,160 $1,980 $1,700 $2,000 $1,970 $1,99095% confidence interval-lower $4,492 $3,506 $3,328 $2,986 $2,411 $2,904 $4,906 $3,240 $4,960 $3,945 $4,381Median (50th percentile) $4,950 $4,610 $4,180 $3,880 $2,910 $3,900 $4,970 $3,900 $5,970 $4,830 $4,89095% confidence interval-upper $4,971 $5,230 $4,871 $4,300 $3,732 $4,488 $5,815 $4,954 $7,084 $4,969 $5,86675th percentile $9,940 $9,010 $7,850 $8,430 $7,710 $7,670 $9,990 $9,810 $11,990 $9,830 $9,950
Amounts saved in RESPs to dateWeighted number 1,928,475 34,020 7,447 54,858 45,436 304,004 873,917 75,691 74,671 210,808 247,623% of current savers 53.5 55.0 48.5 50.8 52.6 46.8 56.3 51.0 52.1 53.0 55.725th percentile $1,920 $1,930 $1,440 * $1,420 $1,370 $1,290 * $1,900 $1,750 $1,980 $1,870 $1,89095% confidence interval-lower $3,873 $2,786 $1,982 $2,352 $2,437 $2,908 $3,811 $2,495 $3,719 $3,073 $3,349Median (50th percentile) $3,930 $3,660 $3,200 * $3,000 $2,950 $3,000 $3,940 $3,330 $4,920 $3,820 $4,47095% confidence interval-upper $3,981 $4,469 $4,531 $3,866 $3,806 $3,900 $4,481 $3,969 $5,948 $4,730 $5,88675th percentile $7,810 $5,820* $5,050 $5,050 $5,970* $5,840 $7,780 $7,380 $8,550 $7,480 $9,230
Amounts saved in other savings to dateWeighted number 2,801,851 46,977 11,511 87,512 64,758 514,349 1,207,275 117,357 124,062 303,584 324,466% of current savers 77.7 76.0 74.9 81.1 75.0 79.2 77.8 79.1 86.6 76.3 73.025th percentile $1,000 $1,420* $950 * $930 $410* $650 * $960 $970 $980 $1,000* $1,00095% confidence interval-lower $2,664 $2,324 $1,850 $1,953 $1,012 $1,473 $2,488 $1,999 $2,711 $2,812 $2,450Median (50th percentile) $2,990 $2,980 $2,750 * $2,390 $1,460 $1,980 * $2,990 $2,810 $3,350 $3,000 $2,91095% confidence interval-upper $2,994 $3,768 $4,125 $2,934 $1,918 $2,879 $3,403 $3,308 $4,826 $3,936 $3,80375th percentile $7,530 $7,820 $6,890 $4,960 * $4,690* $4,920 $8,700 $6,730 $9,650 $6,840 $7,430
Amounts contributed in 20012
Weighted number – contributors in 2001 3,046,521 55,030 12,078 87,153 71,483 552,040 1,327,733 122,097 121,398 351,536 345,972% of all contributors 100 100 100 100 100 100 100 100 100 100 10025th percentile $500 $520 $480 $400 $350 $390 $500 $390 $400 $490 $60095% confidence interval-lower $995 $881 $585 $642 $593 $682 $988 $717 $975 $971 $993Median (50th percentile) $1,000 $980 $850 $950 $670 $840 $1,080 $860 $1,020 $1,010 $1,17095% confidence interval-upper $1,000 $1,154 $1,042 $992 $796 $993 $1,170 $972 $1,190 $1,150 $1,28775th percentile $2,000 $1,770 $1,390 $1,590 $1,270 $1,670 $2,000 $1,970 $2,000 $1,980 $2,020
Amounts contribued to RESPs in 20012
Weighted number 1,598,065 29,478 6,172 44,518 39,448 242,375 733,872 61,719 64,486 180,244 195,754% of all contributors 52.5 53.6 51.1 51.1 55.2 43.9 55.3 50.5 53.1 51.3 56.625th percentile $590 $490 $500 $490 $450 $530 $560 $400 $490 $590 $86095% confidence interval-lower $988 $590 $592 $593 $589 $810 $982 $694 $968 $915 $1,150Median (50th percentile) $1,000 $760 $970 $960 $660 $980 $1,090 $950 $990 $1,010 $1,30095% confidence interval-upper $1,146 $1,119 $1,084 $1,075 $787 $1,000 $1,169 $990 $1,088 $1,120 $1,88975th percentile $2,000 $1,320 $2,000 $1,840 $1,160* $1,800 $2,000 $1,570 $1,830 $1,870 $1,960
Amounts contributed to othersavings in 20012
Weighted number 2,178,578 40,145 8,082 62,490 45,881 415,527 944,616 90,738 94,223 251,131 225,746% of all contributors 71.5 73.0 66.9 71.7 64.2 75.3 71.1 74.3 77.6 71.4 65.225th percentile $290 $400 F $260 $130* $190 $270 $270 * $270 $280 $360*95% confidence interval-lower $599 $553 $356 $486 $301 $483 $565 $592 $492 $586 $539Median (50th percentile) $600 $870 $540 * $590 $400 $490 $680 $650 $570 $660 $600*95% confidence interval-upper $690 $969 $737 $742 $499 $590 $795 $818 $784 $961 $96275th percentile $1,180 $1,190 $1,050 $990 $990 $980 $1,440 $1,140 $1,410 $1,200 $1,300*
1. Median dollar amounts are presented. A median splits the population into two equal groups, half the population falls above the medianestimate and half the population falls below the estimate. Note that medians can not be added together to arrive at a total.
2. Median RESP amounts were calculated only for those who contributed to RESPs in 2001. Median amounts to other savings were calculatedonly for those who made a contribution to other savings in 2001.
* Numbers marked with this symbol have a coefficient of variation between 16.5% and 25% and are less reliable than unmarked numbers.F Too unreliable to be published.Source: Survey of Approaches to Educational Planning, 2002.
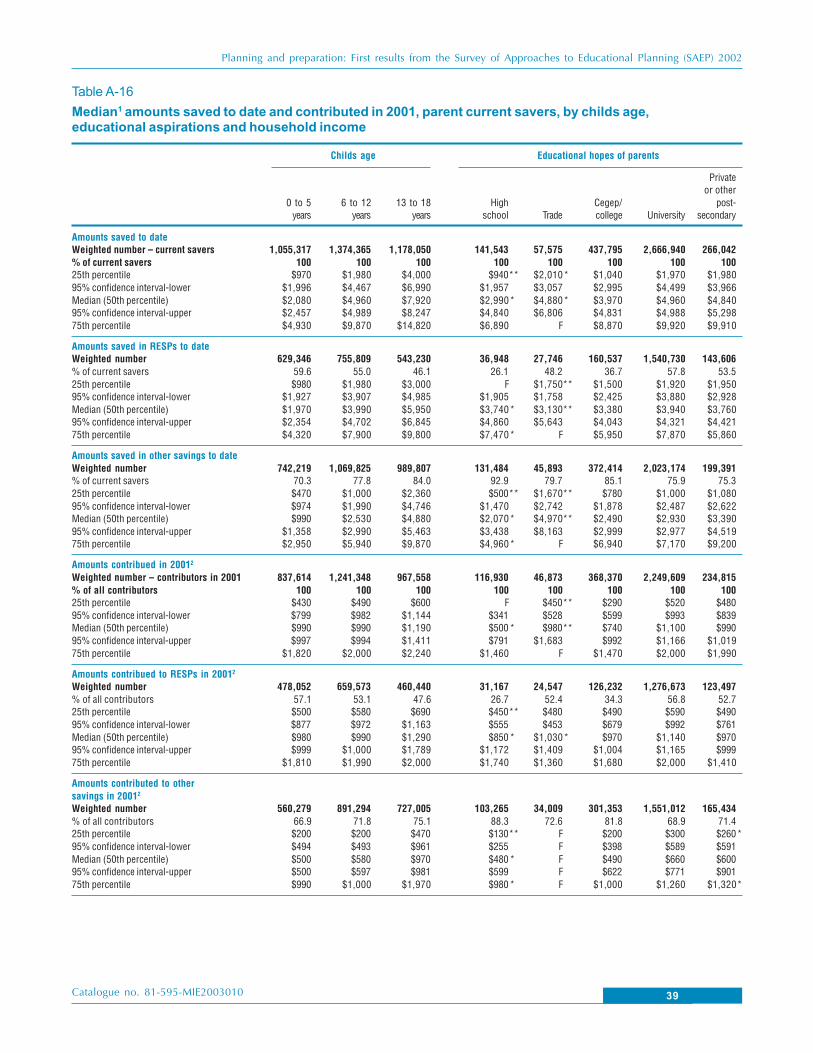
39
Planning and preparation: First results from the Survey of Approaches to Educational Planning (SAEP) 2002
Catalogue no. 81-595-MIE2003010
Table A-16
Median1 amounts saved to date and contributed in 2001, parent current savers, by childs age,educational aspirations and household income
Childs age Educational hopes of parents
Privateor other
0 to 5 6 to 12 13 to 18 High Cegep/ post-years years years school Trade college University secondary
Amounts saved to dateWeighted number – current savers 1,055,317 1,374,365 1,178,050 141,543 57,575 437,795 2,666,940 266,042% of current savers 100 100 100 100 100 100 100 10025th percentile $970 $1,980 $4,000 $940** $2,010* $1,040 $1,970 $1,98095% confidence interval-lower $1,996 $4,467 $6,990 $1,957 $3,057 $2,995 $4,499 $3,966Median (50th percentile) $2,080 $4,960 $7,920 $2,990* $4,880* $3,970 $4,960 $4,84095% confidence interval-upper $2,457 $4,989 $8,247 $4,840 $6,806 $4,831 $4,988 $5,29875th percentile $4,930 $9,870 $14,820 $6,890 F $8,870 $9,920 $9,910
Amounts saved in RESPs to dateWeighted number 629,346 755,809 543,230 36,948 27,746 160,537 1,540,730 143,606% of current savers 59.6 55.0 46.1 26.1 48.2 36.7 57.8 53.525th percentile $980 $1,980 $3,000 F $1,750** $1,500 $1,920 $1,95095% confidence interval-lower $1,927 $3,907 $4,985 $1,905 $1,758 $2,425 $3,880 $2,928Median (50th percentile) $1,970 $3,990 $5,950 $3,740* $3,130** $3,380 $3,940 $3,76095% confidence interval-upper $2,354 $4,702 $6,845 $4,860 $5,643 $4,043 $4,321 $4,42175th percentile $4,320 $7,900 $9,800 $7,470* F $5,950 $7,870 $5,860
Amounts saved in other savings to dateWeighted number 742,219 1,069,825 989,807 131,484 45,893 372,414 2,023,174 199,391% of current savers 70.3 77.8 84.0 92.9 79.7 85.1 75.9 75.325th percentile $470 $1,000 $2,360 $500** $1,670** $780 $1,000 $1,08095% confidence interval-lower $974 $1,990 $4,746 $1,470 $2,742 $1,878 $2,487 $2,622Median (50th percentile) $990 $2,530 $4,880 $2,070* $4,970** $2,490 $2,930 $3,39095% confidence interval-upper $1,358 $2,990 $5,463 $3,438 $8,163 $2,999 $2,977 $4,51975th percentile $2,950 $5,940 $9,870 $4,960* F $6,940 $7,170 $9,200
Amounts contribued in 20012
Weighted number – contributors in 2001 837,614 1,241,348 967,558 116,930 46,873 368,370 2,249,609 234,815% of all contributors 100 100 100 100 100 100 100 10025th percentile $430 $490 $600 F $450** $290 $520 $48095% confidence interval-lower $799 $982 $1,144 $341 $528 $599 $993 $839Median (50th percentile) $990 $990 $1,190 $500 * $980** $740 $1,100 $99095% confidence interval-upper $997 $994 $1,411 $791 $1,683 $992 $1,166 $1,01975th percentile $1,820 $2,000 $2,240 $1,460 F $1,470 $2,000 $1,990
Amounts contribued to RESPs in 20012
Weighted number 478,052 659,573 460,440 31,167 24,547 126,232 1,276,673 123,497% of all contributors 57.1 53.1 47.6 26.7 52.4 34.3 56.8 52.725th percentile $500 $580 $690 $450** $480 $490 $590 $49095% confidence interval-lower $877 $972 $1,163 $555 $453 $679 $992 $761Median (50th percentile) $980 $990 $1,290 $850 * $1,030* $970 $1,140 $97095% confidence interval-upper $999 $1,000 $1,789 $1,172 $1,409 $1,004 $1,165 $99975th percentile $1,810 $1,990 $2,000 $1,740 $1,360 $1,680 $2,000 $1,410
Amounts contributed to othersavings in 20012
Weighted number 560,279 891,294 727,005 103,265 34,009 301,353 1,551,012 165,434% of all contributors 66.9 71.8 75.1 88.3 72.6 81.8 68.9 71.425th percentile $200 $200 $470 $130** F $200 $300 $260*95% confidence interval-lower $494 $493 $961 $255 F $398 $589 $591Median (50th percentile) $500 $580 $970 $480 * F $490 $660 $60095% confidence interval-upper $500 $597 $981 $599 F $622 $771 $90175th percentile $990 $1,000 $1,970 $980 * F $1,000 $1,260 $1,320*

40
Planning and preparation: First results from the Survey of Approaches to Educational Planning (SAEP) 2002
Catalogue no. 81-595-MIE2003010
Table A-16 Continued
Median1 amounts saved to date and contributed in 2001, parent current savers, by childs age,educational aspirations and household income
Household income
$25,000 to $45,000 to $65,000 to $85,000<$25,000 $44,999 64,999 $84,999 or more
Amounts saved to dateWeighted number – current savers 349,062 665,497 753,932 714,142 1,125,099% of current savers 100 100 100 100 10025th percentile $980 $990 $1,840 $2,000 $2,98095% confidence interval-lower $1,931 $2,864 $3,999 $3,987 $6,312Median (50th percentile) $2,430 $3,660 $4,000 $4,960 $6,96095% confidence interval-upper $2,953 $4,068 $4,516 $5,116 $7,82375th percentile $5,200 $7,920 $8,800 $9,380 $13,920
Amounts saved in RESPs to dateWeighted number 147,775 311,648 382,791 398,583 687,588% of current savers 42.3 46.8 50.8 55.8 61.125th percentile $990* $1,140* $1,530 $1,900 $2,45095% confidence interval-lower $1,605 $2,786 $2,999 $2,891 $4,482Median (50th percentile) $2,200 $3,350 $3,420 $3,830 $4,88095% confidence interval-upper $2,918 $3,967 $3,915 $4,493 $5,27175th percentile $3,960* $6,640 $6,480 $6,940 $8,920
Amounts saved in other savings to dateWeighted number 279,893 506,043 575,792 564,765 875,358% of current savers 80.2 76.0 76.4 79.1 77.825th percentile $770 $750 $920 $930 $1,75095% confidence interval-lower $1,437 $1,923 $2,456 $1,963 $3,472Median (50th percentile) $1,890 $1,980 $2,990 $2,620 $4,18095% confidence interval-upper $2,210 $2,750 $2,998 $2,988 $4,79875th percentile $3,960 $4,850 $5,990 $6,700 $9,650
Amounts contribued in 20012
Weighted number – contributors in 2001 267,847 537,741 646,540 608,863 985,531% of all contributors 100 100 100 100 10025th percentile $200 $290 $490 $550 $69095% confidence interval-lower $447 $600 $845 $994 $1,190Median (50th percentile) $590 $790 $970 $1,000 $1,39095% confidence interval-upper $822 $981 $989 $1,167 $1,49975th percentile $1,120* $1,490 $1,800 $2,000 $2,340
Amounts contribued to RESPs in 20012
Weighted number 112,317 255,370 323,496 328,299 578,584% of all contributors 41.9 47.5 50.0 53.9 58.725th percentile $240* $400 $500 $580 $70095% confidence interval-lower $398 $650 $951 $963 $1,144Median (50th percentile) $600* $900 $980 $1,000 $1,20095% confidence interval-upper $937 $987 $1,126 $1,144 $1,55075th percentile $1,570 $1,360 $1,830 $2,000 $1,950
Amounts contributed to othersavings in 20012
Weighted number 199,108 386,188 456,339 449,949 686,995% of all contributors 74.3 71.8 70.6 73.9 69.725th percentile $180 $190 $290 $290 $40095% confidence interval-lower $290 $484 $495 $497 $731Median (50th percentile) $480 $490 $580 $600 $97095% confidence interval-upper $495 $598 $721 $871 $97875th percentile $970 $970 $1,050 $1,190 $2,000
1. Median dollar amounts are presented. A median splits the population into two equal groups, half the population falls above the medianestimate and half the population falls below the estimate. Note that medians can not be added together to arrive at a total.
2. Median contributions were calculated only for those who made a contribution in 2001. Median RESP amounts were calculated only for thosewho contributed to RESPs in 2001. Median amounts to other savings were calculated only for those who made a contribution to othersavings in 2001.
* Numbers marked with this symbol have a coefficient of variation between 16.5% and 25% and are less reliable than unmarked numbers.** Numbers marked with this symbol have a coefficient of variation between 25% and 33.3% and are very unreliable.F Too unreliable to be published.Source: Survey of Approaches to Educational Planning, 2002.
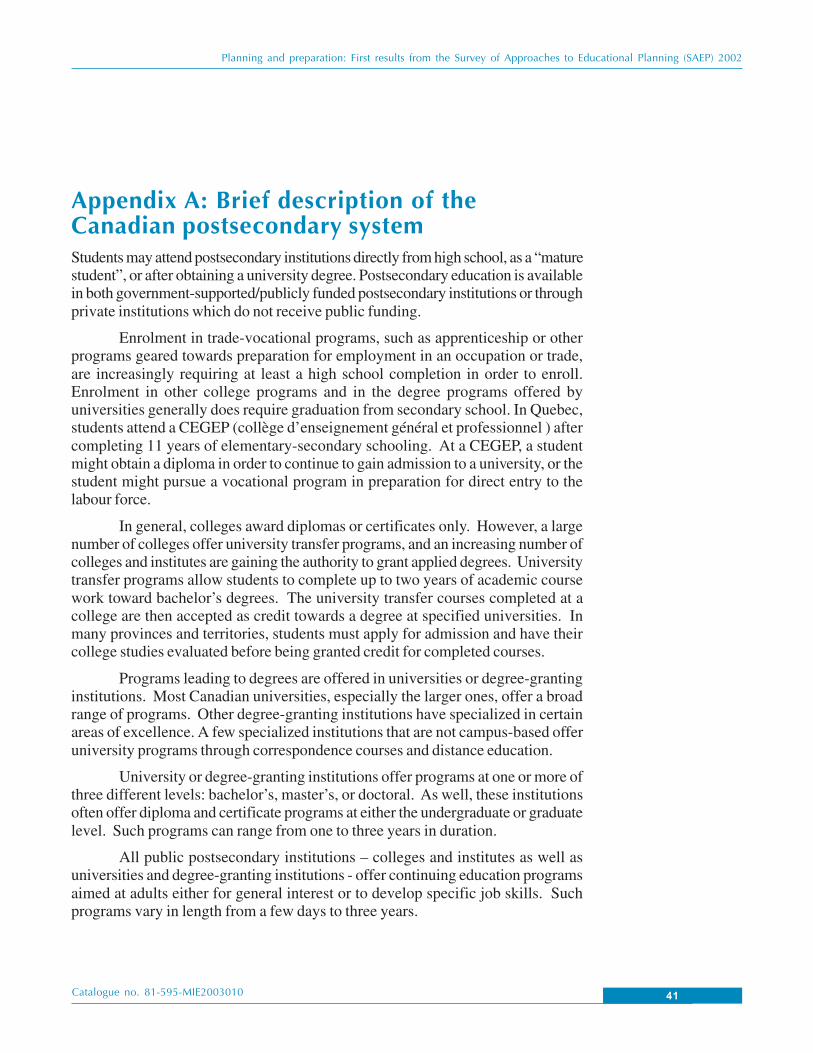
41
Planning and preparation: First results from the Survey of Approaches to Educational Planning (SAEP) 2002
Catalogue no. 81-595-MIE2003010
Appendix A: Brief description of theCanadian postsecondary systemStudents may attend postsecondary institutions directly from high school, as a “maturestudent”, or after obtaining a university degree. Postsecondary education is availablein both government-supported/publicly funded postsecondary institutions or throughprivate institutions which do not receive public funding.
Enrolment in trade-vocational programs, such as apprenticeship or otherprograms geared towards preparation for employment in an occupation or trade,are increasingly requiring at least a high school completion in order to enroll.Enrolment in other college programs and in the degree programs offered byuniversities generally does require graduation from secondary school. In Quebec,students attend a CEGEP (collège d’enseignement général et professionnel ) aftercompleting 11 years of elementary-secondary schooling. At a CEGEP, a studentmight obtain a diploma in order to continue to gain admission to a university, or thestudent might pursue a vocational program in preparation for direct entry to thelabour force.
In general, colleges award diplomas or certificates only. However, a largenumber of colleges offer university transfer programs, and an increasing number ofcolleges and institutes are gaining the authority to grant applied degrees. Universitytransfer programs allow students to complete up to two years of academic coursework toward bachelor’s degrees. The university transfer courses completed at acollege are then accepted as credit towards a degree at specified universities. Inmany provinces and territories, students must apply for admission and have theircollege studies evaluated before being granted credit for completed courses.
Programs leading to degrees are offered in universities or degree-grantinginstitutions. Most Canadian universities, especially the larger ones, offer a broadrange of programs. Other degree-granting institutions have specialized in certainareas of excellence. A few specialized institutions that are not campus-based offeruniversity programs through correspondence courses and distance education.
University or degree-granting institutions offer programs at one or more ofthree different levels: bachelor’s, master’s, or doctoral. As well, these institutionsoften offer diploma and certificate programs at either the undergraduate or graduatelevel. Such programs can range from one to three years in duration.
All public postsecondary institutions – colleges and institutes as well asuniversities and degree-granting institutions - offer continuing education programsaimed at adults either for general interest or to develop specific job skills. Suchprograms vary in length from a few days to three years.

42
Planning and preparation: First results from the Survey of Approaches to Educational Planning (SAEP) 2002
Catalogue no. 81-595-MIE2003010
ReferencesBarr-Telford, L., Cartwright, F., Prasil, S., Shimmons, K. “Access, persistence and
financing: First results from the Postsecondary Education Participation Survey(PEPS)”, Statistics Canada, catalogue no. 81-595-MIE2003007. 2003.
Bushnik, T. “ Learning, Earning and Leaving: The relationship between working inhigh school and dropping out”. Education, Skills and Learning-ResearchPapers. Statistics Canada catalogue no. 81-595-MIE2003004. 2003.
Bushnik, T., Tomkowicz, J. “Who goes to postsecondary and when: pathways chosenby 20 year olds”. Education, Skills and Learning-Research Papers. StatisticsCanada catalogue no. 81-595-MIE2003006. 2003.
Looker, E.D. “Why don’t they go on? Factors affecting the decisions of Canadianyouth not to pursue postsecondary education”. Canadian MillenniumScholarship Foundation. 2002.
Maslove. L., Fischer, L., O’Heron, H. “Making the Transition: No two paths alike.”Association of Universities and Colleges of Canada. Research File, May 1998,Vol.2 No. 4
Organisation for Economic Cooperation and Development and Human ResourcesDevelopment Canada. “Literacy Skills for the Knowledge Society: Furtherresults from the International Adult Literacy Survey”. Paris 1997
Statistics Canada. “Caring Canadians, involved Canadians: Highlights from theNational survey of giving, volunteering and participating”. Catalogue no.71-542-XIE. 2000
U.S. Department of Education, National Centre for Education Statistics. “ Essay2001: Students whose parents did not go to College: Postsecondary access,persistence and attainment”. Washington, 2001.
Wentzel, K. R. “Parents Aspirations for Children’s Educational Attainments: Relationsto Parental Beliefs and Social Address Variables”. Merril-Palmer Quarterly,January 1998. Vol. 44, No. 1.

43
Planning and preparation: First results from the Survey of Approaches to Educational Planning (SAEP) 2002
Catalogue no. 81-595-MIE2003010
Endnotes1 National Population Health Survey. Statistics Canada 1996/1997.
Caring Canadians, involved Canadians: Highlights from the National survey of giving, volunteeringand participating. Statistics Canada, catalogue no. 71-542-XIE. 2000.
2001 Census of population, Statistics Canada.
Labour Force Survey, Statistics Canada.
Literacy Skills for the knowledge society: Further results from the International Adult Literacy Survey.Organisation for Economic Cooperation and Development and Human Resources Development Canada.Paris 1997.
2 U.S. Department of Education, National Centre for Education Statistics. “Essay 2001: Students whoseparents did not go to college: Postsecondary access, persistence and attainment”. Washington, 2001.
3 * Numbers marked with this symbol have a coefficient of variation between 16.5% and 25% and areless reliable than unmarked numbers.
** Numbers marked with this symbol have a coefficient of variation between 25% and 33.3% and arevery unreliable.
F Too unreliable to be published.
4 The Postsecondary Education Participation Survey was conducted by Statistics Canada, in partnershipwith Human Resources Development Canada and the Policy Research Initiative in 2002. The surveyfocused on young people who were not in high school at the time of the survey. They were asked aseries of questions about their educational background and whether or not they had participated ineducation leading to a diploma, certificate or degree above the high school level (postsecondarystudies). They also answered questions on their postsecondary programs, their use of governmentstudent loans, educational and non-educational expenditures and sources of funding.
5 Total income includes earnings, income from government sources such as child tax credits and incomesecurity payments, and income received from investments.
6 The Canada Education Savings Grant (CESG) is a grant from the Government of Canada paid directlyinto a beneficiary’s Registered Education Savings Plan (RESP). It adds 20 percent to the first $2,000in contributions made into an RESP on behalf of an eligible beneficiary each year. This means theGrant can be as much as $400 each year per beneficiary and over the years could amount to a total of$7,200. The annual contribution limit is $4,000 per child for RESPs. For more information on CESG,visit the web site at: www.hrdc-drhc.gc.ca/cesg.
7 Median dollar amounts are presented. A median splits the population into two equal groups, half thepopulation falls above the median estimate and half the population falls below the estimate. Note thatmedians can not be added together to arrive at a total.
8 Median RESP amounts were calculated only for those who contributed to RESPs in 2001. Medianamounts to other savings were calculated only for those who made a contribution to other savings in2001.
9 The PEPS 2002 survey indicated that full-time college students paid a median amount of $9,300 fortheir current academic year while full-time university students paid a median amount of about $11,200.These expenditures included both academic and non-academic costs.
44
Planning and preparation: First results from the Survey of Approaches to Educational Planning (SAEP) 2002
Catalogue no. 81-595-MIE2003010
Culture, Tourism and theCentre for Education StatisticsResearch PapersCumulative Index
Statistics Canada’s Division of Culture, Tourism and the Centre for EducationStatistics develops surveys, provides statistics and conducts research and analysisrelevant to current issues in its three areas of responsibility.
The Culture Statistics Program creates and disseminates timely and comprehensiveinformation on the culture sector in Canada. The program manages a dozen regularcensus surveys and databanks to produce data that support policy decision andprogram management requirements. Issues include the economic impact of culture,the consumption of culture goods and services, government, personal and corporatespending on culture, the culture labour market, and international trade of culturegoods and services. Its analytical output appears in the flagship publication Focuson Culture (www.statcan.ca/english/IPS/Data/87-004-XIE.htm) and in Arts, cultureand recreation – Research papers.
The Tourism Statistics Program provides information on domestic and internationaltourism. The program covers the Canadian Travel Survey and the InternationalTravel Survey. Together, these surveys shed light on the volume and characteristicsof trips and travellers to, from and within Canada. Its analytical output appears inthe flagship publication Travel-log (www.statcan.ca/english/IPS/Data/87-003-XIE.htm) and in Travel and tourism – Research papers.
The Centre for Education Statistics develops and delivers a comprehensiveprogram of pan-Canadian education statistics and analysis in order to support policydecisions and program management, and to ensure that accurate and relevantinformation concerning education is available to the Canadian public and to othereducational stakeholders. The Centre conducts fifteen institutional and over tenhousehold education surveys. Its analytical output appears in the flagship publicationEducation quarterly review (www.statcan.ca/english/IPS/Data/81-003-XIE.htm),in various monographs and in Education, skills and learning – Research papers(www.statcan.ca/english/IPS/Data/81-595-MIE.htm).

45
Planning and preparation: First results from the Survey of Approaches to Educational Planning (SAEP) 2002
Catalogue no. 81-595-MIE2003010
Following is a cumulative index of Culture, Tourism and Education researchpapers published to date
Arts, culture and recreation � Research papersForthcoming
Travel and tourism � Research papersForthcoming
Education, skills and learning � Research papers81-595-MIE2002001 Understanding the rural-urban reading gap
81-595-MIE2003002 Canadian education and training services abroad:the role of contracts funded by internationalfinancial institution
81-595-MIE2003003 Finding their way: a profile of young Canadiangraduates
81-595-MIE2003004 Learning, Earning and Leaving – The relationshipbetween working while in high school and droppingout
81-595-MIE2003005 Linking provincial student assessments with nationaland international assessments
81-595-MIE2003006 Who goes to post-secondary education and when:Pathways chosen by 20 year-olds
81-595-MIE2003007 Access, persistence and financing: First results fromthe Postsecondary Education Participation Survey(PEPS)
81-595-MIE2003008 The labour market impacts of adult education andtraining in Canada
81-595-MIE2003009 Issues in the design of Canada’s Adult Education andTraining Survey
81-595-MIE2003010 Planning and preparation: First results from the Surveyof Approaches to Educational Planning (SAEP) 2002