planet hunters. x. searching for nearby … · planet hunters. x. searching for nearby neighbors of...
TRANSCRIPT
PLANET HUNTERS. X. SEARCHING FOR NEARBY NEIGHBORS OF 75 PLANET AND ECLIPSING BINARYCANDIDATES FROM THE K2 KEPLER EXTENDED MISSION
Joseph R. Schmitt1, Andrei Tokovinin
2, Ji Wang
3, Debra A. Fischer
1, Martti H. Kristiansen
4,10, Daryll M. LaCourse
10,
Robert Gagliano10, Arvin Joseff V. Tan
10, Hans Martin Schwengeler
10, Mark R. Omohundro
10, Alexander Venner
10,
Ivan Terentev10, Allan R. Schmitt
10, Thomas L. Jacobs
10, Troy Winarski
10, Johann Sejpka
10, Kian J. Jek
10,
Tabetha S. Boyajian1, John M. Brewer
1, Sascha T. Ishikawa
5, Chris Lintott
6, Stuart Lynn
5,7,
Kevin Schawinski8, Megan E. Schwamb
9, and Alex Weiksnar
51 Department of Astronomy, Yale University, New Haven, CT 06511, USA; [email protected]
2 Cerro Tololo Inter-American Observatory, Casilla 603, La Serena, Chile3 Department of Astronomy, California Institute of Technology, Pasadena, CA 91125, USA
4 DTU Space, National Space Institute, Technical University of Denmark, Elektrovej 327, DK-2800 Lyngby, Denmark5 Adler Planetarium, Department of Citizen Science, 1300 S. Lake Shore Drive, Chicago, IL 60605, USA
6 Oxford Astrophysics, Denys Wilkinson Building, Keble Road, Oxford OX1 3RH, UK7 CartoDB, 247 Centre Street, New York, NY 10013, USA
8 Institute for Astronomy, Department of Physics, ETH Zurich, Wolfgang-Pauli-Strasse 27, CH-8093 Zurich, Switzerland9 Institute for Astronomy and Astrophysics, Academia Sinica; 11F AS/NTU, National Taiwan University, 1 Roosevelt Road, Sec. 4, Taipei 10617, Taiwan
Received 2016 January 18; accepted 2016 March 15; published 2016 May 27
ABSTRACT
We present high-resolution observations of a sample of 75 K2 targets from Campaigns 1–3 using speckleinterferometry on the Southern Astrophysical Research (SOAR) telescope and adaptive optics imaging at the KeckII telescope. The median SOAR I-band and Keck Ks-band detection limits at 1 were D =m 4.4I mag andD =m 6.1Ks mag, respectively. This sample includes 37 stars likely to host planets, 32 targets likely to be eclipsingbinaries (EBs), and 6 other targets previously labeled as likely planetary false positives. We find nine likelyphysically bound companion stars within 3 of three candidate transiting exoplanet host stars and six likely EBs.Six of the nine detected companions are new discoveries. One of these new discoveries, EPIC 206061524, isassociated with a planet candidate. Among the EB candidates, companions were only found near the shortestperiod ones ( <P 3 days), which is in line with previous results showing high multiplicity near short-period binarystars. This high-resolution data, including both the detected companions and the limits on potential unseencompanions, will be useful in future planet vetting and stellar multiplicity rate studies for planets and binaries.
Key words: binaries: eclipsing – binaries: general – planets and satellites: detection –
techniques: high angular resolution
1. INTRODUCTION
The multiplicity of stellar systems has been well studied(Duchêne & Kraus 2013), from M-dwarfs (e.g., Fischer &Marcy 1992; Dieterich et al. 2012) to solar-type stars (e.g., Abt& Levy 1976; Tokovinin 2014), to higher mass stars (e.g.,Garmany et al. 1980; Sana et al. 2012). High-resolutionimaging is an effective method for searching for companionstars. Adaptive optics (AO) is one such method, which usesnatural or laser guiding stars to measure the air turbulence anddeformable mirrors to correct for it, improving the angularresolution of astronomical images. AO usually provides thehighest resolution for ground-based methods outside of longbaseline interferometry. Speckle methods, on the other hand,take many images of the target star with millisecond exposures(a data cube), essentially freezing the air turbulence in place forthe duration of the short observation, allowing for diffraction-limited resolution, as opposed to seeing-limited. With speckleinterferometry, a Fourier analysis of every frame is performedto find nearby companions (e.g., Howell et al. 2011). Withlucky imaging, a subset of only the best frames are selected foranalysis (e.g., Daemgen et al. 2009). In this paper, we performAO and speckle observations to search for companion stars toplanet host stars or eclipsing binary (EB) candidates from theextended Kepler mission (K2).
2. TARGET SELECTION
The Kepler mission (Borucki et al. 2010) observed∼160,000 stars almost continuously for nearly four yearssearching for planetary transits. The mission discovered morethan 1000 planets and another ∼3700 planet candidates11
(Coughlin et al. 2015). In 2013 May, the second of fourreaction wheels on the Kepler telescope failed, making itunable to continue observing the same field. In its two-wheelphase, called K2, the spacecraft can only reliably point at fieldsin the ecliptic plane for ∼80 day long campaigns before it mustturn to a new field to avoid the Sun. The Kepler spacecraft in itsK2 mission continues to be a source of discovery forexoplanets (Howell et al. 2014).Our target list consists of 75 stars observed by K2 during
Campaigns 1–3. We conducted follow-up images of the 56Campaign 1 (C1) targets and the two Campaign 2 (C2) targetsat SOAR and observed the 17 Campaign 3 (C3) targets usingKeck. The targets and their designations are listed in Table 5,which also lists the selection biases for each target. The URLswithin Table 5 contain the GO proposal identifier as well as thefull proposal for each target. The periods and epochs for all theEBs and EB candidates (EBCs) are listed in Table 1. The planetcandidates are discussed further in Section 4.
The Astronomical Journal, 151:159 (13pp), 2016 June doi:10.3847/0004-6256/151/6/159© 2016. The American Astronomical Society. All rights reserved.
10 Planet Hunters citizen scientist.11 http://exoplanetarchive.ipac.caltech.edu, last accessed 2016 February 25.
1
2.1. Planet Hunters Targets
The citizen science project Planet Hunters12 (PH, Fischeret al. 2012) was the primary source for finding 45 targets fromC1 to C3. PH is a member of the citizen science Zooniverse13
project (Lintott et al. 2008). PH volunteers organized theirsearch on their own, surveying data from the K2 self-flatfielding (K2SFF) database (Vanderburg & Johnson 2014) orreducing the data themselves with the Guest Observer softwarePyKE (Still & Barclay 2012) or their own, self-created tools(e.g., LcTools©14). Users check light curves for the signatureof a planetary transit, EB, or other astrophysical objects (e.g.,
Kato & Osaki 2014). This project crowd-sources the analysis ofK2 light curves and has been successful in the past in findingplanet candidates (Fischer et al. 2012; Lintott et al. 2013; Wanget al. 2013, 2015; Schmitt et al. 2014b), confirming planets(Schwamb et al. 2013; Wang et al. 2013; Schmitt et al. 2014a),finding EBs (LaCourse et al. 2015), and finding other, as of yetunidentified, signals (Boyajian et al. 2016).Among these 45 PH targets are WASP-85A b (Brown
et al. 2014), which is a known exoplanet in a binary system,and nine other targets known to be EBs (eight from C1 and onefrom C3), according to the Guest Observer (GO) proposalsrequesting the targets. We have classified 10 of the 45PH targets as Planet Hunter Objects of Interest (PHOIs), whichis analagous to the Kepler Objects of Interest (KOI)designation. These were also discovered independently byVanderburg et al. (2016). The rest of the PH targets are eitherpreviously known EBs or newly discovered candidate EBs, of
Table 1EB and EBC Properties
EPIC Campaign Status PPH EpochPH PKEB EpochKEBID (days) (KBJDa) (days) (KBJD)
201160662 C1 EBC 1.537 1975.957 1.53687 ± 0.00013 1981.05912 ± L201207683 C1 EBC b 2002.312 L L201246763 C1 EBC 43.663 2014.326 43.66300 ± L 1962.93272 ± 0.57131201253025c C1 EB 3.392 1980.767 6.78617 0.00105 1978.12149 ± 0.03787201270464d C1 EBC 3.155 1977.436 L L201324549e C1 EBC 2.519 1979.500 L L201407812 C1 EBC 2.827 1979.490 2.82678 ± 0.00030 1984.22530 ± 0.04365201408204 C1 EB 8.482 2024.606 8.48191 ± 0.00137 2025.34343 ± 0.03497201458798 C1 EBC 0.619 1977.568 0.61939 ± 0.00003 L201488365 C1 EB 3.362 1975.859 3.36426 ± 0.00039 1981.44082 ± 0.04704201567796 C1 EBC 5.011 1979.536 5.00861 ± 0.00069 2003.31875 ± 0.03142201576812 C1 EB 5.730 1975.858 5.72823 ± 0.00084 1989.66917 ± 0.02229201594823 C1 EB 1.301 1976.659 1.30062 ± 0.00010 1977.93351 ± 0.01931201626686 C1 EBC 5.280 1979.356 5.28011 ± 0.00069 1973.08643 ± 0.03258201648133 C1 EBC 35.020 1980.807 35.02000 ± 0.00735 1972.47647 ± L201665500 C1 EB 3.054 1977.539 3.05352 ± 0.00033 1990.67896 ± 0.03027201704541 C1 EB 0.411 1976.547 0.41138 ± 0.00002 1975.24518 ± 0.02477201705526 C1 EBC 18.103 1986.610 18.09409 ± 0.00381 2012.62636 ± L201711881 C1 EB 5.468 1977.988 5.46846 ± 0.00077 1975.43501 ± 0.30923201725399 C1 EBC 2.162 1978.253 2.16127 ± 0.00020 1986.34269 ± 0.04807201826968 C1 EBC 0.367 1976.608 0.36176 ± 0.00002 1974.23489 ± 0.03098201890494 C1 EBC 2.536 1977.446 2.53657 ± 0.00026 1964.73129 ± 0.02028201928968 C1 EBC 0.320 1980.390 0.32000 ± 0.00001 1979.66097 ± L203533312f C2 EBC 0.176 2061.640 L L204129699 C2 EBC 1.258 2060.600 1.25780 ± 0.00010 2061.86700 ± L205985357 C3 EBC 4.128 2148.728 L L206029314 C3 EBC 7.026 2148.069 L L206047297 C3 EBC 27.317 2166.457 L L206135075 C3 EBC 54.976 2149.868 L L206135267 C3 EB 2.533 2147.052 L L206152015 C3 EBC 0.809 2147.088 L L206173295 C3 EBC 2.176 2147.784 L L206311743 C3 EBC 4.312 2155.042 L L206380678e C3 EBC 2.271 2147.270 L L
Notes. We list here the periods and epochs of the EBs and EB candidates both estimated by PH users, PPH and EpochPH, and many of them also with data from apreliminary Kepler Eclipsing Binary catalog (Prša et al. 2011, K. Conroy 2015, private communication), PKEB and EpochKEB.a Kepler Barycentric Julian Day (KBJD) is equal to JD minus 2454833.0 (UTC = 2009 January 1 12:00:00).b Single stellar eclipse (depth ∼ 24%).c PH users counted each transit as a primary transit, while the initial KEB catalog counted primary and secondary events. This explains the factor of two difference inthe periods and the offset in the epoch.d Eclipse profile is shallow and V-shaped. May have alternating minima.e Eclipse profile is shallow and V-shaped.f The EB candidate may have =P 0.361PH days, double what is listed in the table.
12 http://www.planethunters.org/13 https://www.zooniverse.org/14 https://dl.dropboxusercontent.com/u/78120543/LcTools/LcTools%20Product%20Description.htm
2
The Astronomical Journal, 151:159 (13pp), 2016 June Schmitt et al.
which many were also independently found in Armstronget al. (2015).
2.2. Foreman-Mackey et al. (2015) Targets
Of the C1 targets, 30 were selected from the K2 C1 planetcandidate list by Foreman-Mackey et al. (2015), whichcomprises 36 planet candidates orbiting 31 stars. Several ofthese were also noted by PH volunteers. We selected all butone star, excluding EPIC 201565013 owing to its faintness,KP = 16.91 mag. Of the 30 stars obtained from Foreman-Mackey et al. (2015), 1 of the targets, EPIC 201505350 (K2-19), was later confirmed to host a planet using ground-basedphotometric follow-up, transit timing analysis, AO imaging,spectroscopy, and photo-dynamical analysis (Armstronget al. 2016; Barros et al. 2015; Narita et al. 2015). Montetet al. (2015) later validated planets around 16 of these 30 stars,including the previously mentioned K2-19, using a statisticalelimination of astrophysical false positives, while deeming 6others to be likely false positives. EPIC 201465501 (K2-9) wasalso independently validated by Schlieder et al. (2016). Weobserved all 30 of these targets, regardless of their designation.
3. OBSERVATIONS AND DATA REDUCTION
On the nights of 2015 May 2–3, we observed 58 stars fromthe K2 program; 56 were from C1 and two were from C2. Weused speckle interferometry with HRCAM (Tokovinin &Cantarutti 2008), a high-resolution camera on the SOARAdaptive Optics Module (SAM) at the 4.1 m SouthernAstrophysical Research (SOAR) telescope at Cerro PachónObservatory. On the night of 2015 July 29, a portion of thenight was devoted to observing the 17 stars from C3 with theNIRC2 instrument on the Keck II telescope.
3.1. SOAR Speckle Interferometry
For the 58 targets observed by SOAR, we used the Bessel I-band filter (central wavelength = 866.5 nm) on HRCAMbecause this provided better seeing and a wider bandwidth(FWHM = 391.4 nm) than in the visual and favored thedetection of M-dwarf companion stars. Some time was lostbecause of clouds and technical problems. For both nights, thetelescope was pointed directly into a strong wind. This buffetedthe telescope and could cause high jitter up to 3 .
For each target star, we typically took four data cubes with400 images each. For the first two cubes, the field size was ´ 6. 092 6. 092 using 200× 200 binned (2× 2) pixels withtypical exposures of 200 ms. In the last two cubes, we did notbin the data. Correspondingly, the field size shrank to ´ 3 3 .The exposure times ranged between 20 and 50 ms for thesmaller field. For the highest wind conditions, we onlycollected binned pixel data cubes. The wider fields allowedfor the detection of fainter, more distant companions, while thenarrow field cubes allow for the detection of brighter, closercompanions. The detected companions have all been confirmedin multiple data cubes.
The data were processed using a standard speckle pipeline(Tokovinin et al. 2010). The pipeline delivered five productsfor each target: a power spectrum, an auto-correlation functioncomputed from the power spectrum, an average image, anaverage image re-centered around the centroid, and a shift-and-add image re-centered on the brightest pixel. See Figure 1 foran example of each image product for EPIC 201555883. The
detector orientation and pixel scale were accurately calibratedon wide binaries with well-modeled linear motions.The faint magnitudes of our target stars required modifica-
tions to the standard pipeline. Hot pixels from longer thanstandard exposures were fixed by removing the dark currentand the bias and accounting for the 2 × 2 binning. Clock-injection charges (CICs) were a major contributor to the powerspectrum of faint stars. CICs create a background of spuriousphoton spikes that bias the centroid of the star toward themiddle of the frame, a problem for frames in which the stardeviated far from the center, which occurred during periods ofhigh wind. The CICs were removed by smoothing the imageswith a width of five pixels, taking its median-average as thebackground and then subtracting it. A threshold of 0.3 times themaximum intensity above the background was also subtracted(and clipped at zero). This produces a properly centered image.To reduce the noise associated with CICs, we multiplied eachre-centered image by a Gaussian mask of 15 pixel ( 0. 46)FWHM and calculated alternative power spectra from thosemasked images. Masking improved the signal-to-noise ratio inthe power spectrum, making closer companions more detect-able at the expense of reducing detectability of companionsbeyond 0. 5. Since high wind resulted in temporary losses ofthe image from the field of view (FOV), we removed frames ifthe centroid was calculated to be within 20 pixels of the frameborder. For the shift-and-add method, if the brightest pixel wasmore than 20 pixels away from the centroid, the frame wasremoved as a likely cosmic-ray event.
3.2. Keck AO Imaging
We observed 17 K2 C3 planet candidates with the NIRC2instrument at the Keck II telescope (Mauna Kea, Hawaii,United States). NIRC2 is a near-infrared imager designed forthe Keck AO system (Wizinowich et al. 2000). The observa-tions were made on UT 2015 July 29, with 0. 8– 1. 0 seeing. Weselected the narrow camera mode, which has a pixel scale of 10mas/pixel. The FOV is thus ´ 10 10 for a mosaic 1K×1Kdetector. All images were taken in the Ks band, which provideshigher sensitivity than J and H band for bound companionswith late spectral type. Among the many sensors that allow theprimary mirror segments to act as one mirror, an error in one ofthe sensors caused a co-phasing issue with about 25% of themirror segments. The Keck team hopes to implement betteralarms on the primary mirror to alert them to similar mirror-induced image quality problems (J. Lyke 2016, privatecommunication). This degraded our AO-corrected point-spreadfunction and decreased our performance relative to standardNIRC2 observations. Exposure time was set such that the peakflux of the target was at least 5000 ADU after co-add. Beforeco-add, peak flux was limited to 2000 ADU to avoidnonlinearity and detector persistence. We used a 3-point ditherpattern (three corners of a square) with a throw of 2. 5. Weavoided the lower left quadrant in the dither pattern because ithas a much higher instrumental noise than the other threequadrants on the detector.The raw Keck NIRC2 AO data were processed using
standard techniques to replace bad pixels, subtract dark frames,flat-field, subtract sky background, and align and co-addframes. Our own custom program recorded the differentialmagnitude, separation, position angle (θ), and detectionsignificance. All detections were then visually checked to
3
The Astronomical Journal, 151:159 (13pp), 2016 June Schmitt et al.
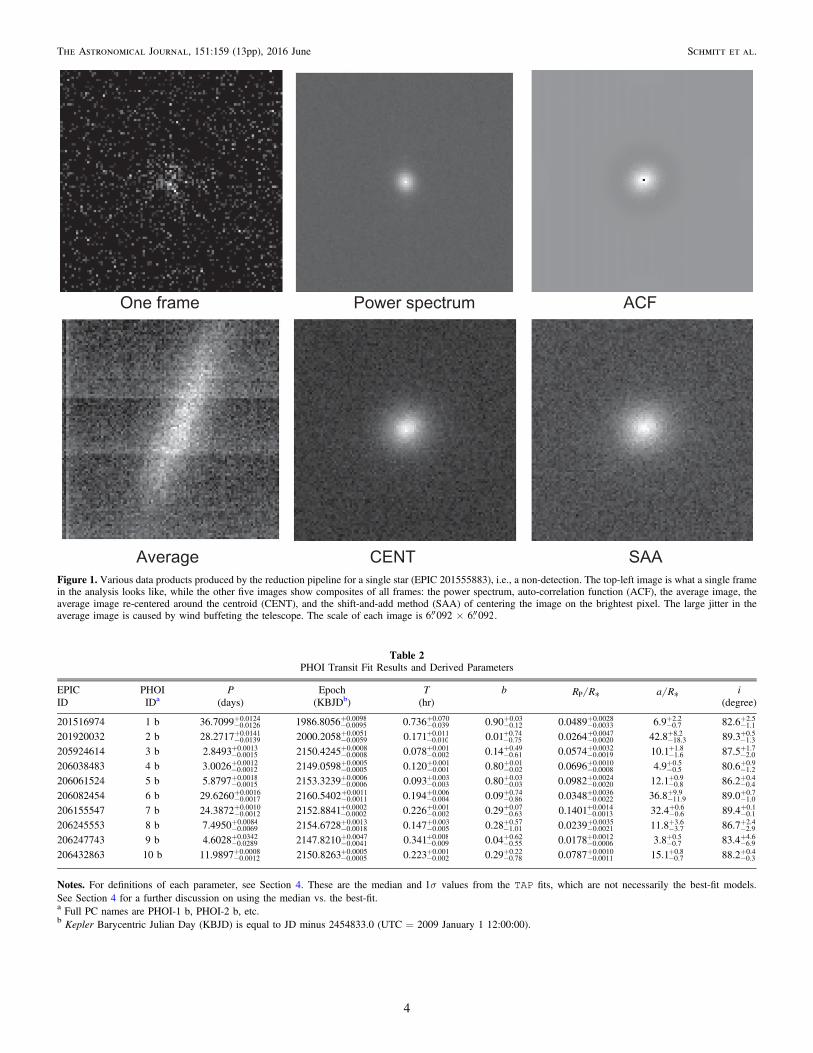
Figure 1. Various data products produced by the reduction pipeline for a single star (EPIC 201555883), i.e., a non-detection. The top-left image is what a single framein the analysis looks like, while the other five images show composites of all frames: the power spectrum, auto-correlation function (ACF), the average image, theaverage image re-centered around the centroid (CENT), and the shift-and-add method (SAA) of centering the image on the brightest pixel. The large jitter in theaverage image is caused by wind buffeting the telescope. The scale of each image is ´ 6. 092 6. 092.
Table 2PHOI Transit Fit Results and Derived Parameters
EPIC PHOI P Epoch T b*R RP *a R i
ID IDa (days) (KBJDb) (hr) (degree)
201516974 1 b -+36.7099 0.0126
0.0124-+1986.8056 0.0095
0.0098-+0.736 0.039
0.070-+0.90 0.12
0.03-+0.0489 0.0033
0.0028-+6.9 0.7
2.2-+82.6 1.1
2.5
201920032 2 b -+28.2717 0.0139
0.0141-+2000.2058 0.0059
0.0051-+0.171 0.010
0.011-+0.01 0.75
0.74-+0.0264 0.0020
0.0047-+42.8 18.3
8.2-+89.3 1.3
0.5
205924614 3 b -+2.8493 0.0015
0.0013-+2150.4245 0.0008
0.0008-+0.078 0.002
0.001-+0.14 0.61
0.49-+0.0574 0.0019
0.0032-+10.1 1.6
1.8-+87.5 2.0
1.7
206038483 4 b -+3.0026 0.0012
0.0012-+2149.0598 0.0005
0.0005-+0.120 0.001
0.001-+0.80 0.02
0.01-+0.0696 0.0008
0.0010-+4.9 0.5
0.5-+80.6 1.2
0.9
206061524 5 b -+5.8797 0.0015
0.0018-+2153.3239 0.0006
0.0006-+0.093 0.003
0.003-+0.80 0.03
0.03-+0.0982 0.0020
0.0024-+12.1 0.8
0.9-+86.2 0.4
0.4
206082454 6 b -+29.6260 0.0017
0.0016-+2160.5402 0.0011
0.0011-+0.194 0.004
0.006-+0.09 0.86
0.74-+0.0348 0.0022
0.0036-+36.8 11.9
9.9-+89.0 1.0
0.7
206155547 7 b -+24.3872 0.0012
0.0010-+2152.8841 0.0002
0.0002-+0.226 0.002
0.001-+0.29 0.63
0.07-+0.1401 0.0013
0.0014-+32.4 0.6
0.6-+89.4 0.1
0.1
206245553 8 b -+7.4950 0.0069
0.0084-+2154.6728 0.0018
0.0013-+0.147 0.005
0.003-+0.28 1.01
0.57-+0.0239 0.0021
0.0035-+11.8 3.7
3.6-+86.7 2.9
2.4
206247743 9 b -+4.6028 0.0289
0.0342-+2147.8210 0.0041
0.0047-+0.341 0.009
0.008-+0.04 0.55
0.62-+0.0178 0.0006
0.0012-+3.8 0.7
0.5-+83.4 6.9
4.6
206432863 10 b -+11.9897 0.0012
0.0008-+2150.8263 0.0005
0.0005-+0.223 0.002
0.001-+0.29 0.78
0.22-+0.0787 0.0011
0.0010-+15.1 0.7
0.8-+88.2 0.3
0.4
Notes. For definitions of each parameter, see Section 4. These are the median and s1 values from the TAP fits, which are not necessarily the best-fit models.See Section 4 for a further discussion on using the median vs. the best-fit.a Full PC names are PHOI-1 b, PHOI-2 b, etc.b Kepler Barycentric Julian Day (KBJD) is equal to JD minus 2454833.0 (UTC = 2009 January 1 12:00:00).
4
The Astronomical Journal, 151:159 (13pp), 2016 June Schmitt et al.
remove confusions such as speckles, background extendedsources, and cosmic-ray hits.
4. TRANSIT FITTING FOR PHOIS
For each of the PHOIs listed in Table 2, we downloaded theK2SFF light curves from Vanderburg & Johnson (2014). TheK2SFF data reduction process removes the effect of thespacecraft thruster fires that occur approximately every sixhours, although it does not do so perfectly in all cases. TheK2SFF reduction process is not intended to remove stellarvariations. We flattened these K2SFF light curves with low-order ( n 4) polynomial fits to out-of-transit data and clippedthe light curves around the transits using a combination of ourown codes, the aforementioned PyKE software, and the IDLprogram autoKep (Gazak et al. 2012). One occasional sideeffect of the K2SFF reduction process was a ringing-likesignature in the location where a transit should have been.These affected transits were typically removed from ouranalysis. However, in the three-transit case of EPIC206155547, we extracted one of these badly reduced transitsfrom the raw data since there was no apparent datadiscontinuity caused by a thruster fire during the transit. Wethen fit the raw, out-of-transit data on either side of the transitto a quadratic polynomial and removed the trend in a similarmanner as the flattening of the K2SFF light curves. Anothercommon effect was a spike in brightness within transits, whichtypically degraded the transit to such a degree that the transitwas simply removed from the analysis. One exception is thebrightness spike in the first transit of EPIC 201516974. Due toits longer period (P = 36.7 day) and thus longer duration, thespike degraded only a minority of the transit. Therefore, wesimply masked the spike out (partially shown by gray squaresin Figure 2).
Some of the PHOIs have suspected signals of stellar activity,either from large-scale brightness variations in the overall lightcurve or from bumps within the transit. For EPIC 206432863,we masked out two suspected starspot crossings (shown in grayin Figure 2). For other stars, there were no sharp, clearlydefined starspot or plage crossings, but small-scale stellaractivity was evident in the increased scatter in the in-transitresiduals of some of the fits.
The transit parameters were fit by the IDL program TAP(Gazak et al. 2012), an MCMC fitting routine using EXOFAST(Eastman et al. 2013) to calculate Mandel & Agol (2002)transit models using a wavelet-based likelihood function(Carter & Winn 2009). TAP was used to fit the impactparameter b, the transit duration T, the ratio of the planet radiusto the stellar radius *R RP , the midtransit times, linear andquadratic limb darkening, red and white noise, and thecoefficients of a quadratic normalization polynomial for eachindividual transit event (in case of an imperfectly normalized orflattened light curve). The ratio of the semimajor axis to thestellar radius *a R and the inclination i were derived from theposterior of each solution by TAP using T and b. Circular orbitswere assumed. Each set of transits were fit with 10 MCMCchains of various lengths (100,000–2,000,000) to ensure noindication of non-convergence according to the Gelman–Rubinstatistic (Gelman & Rubin 1992). The period P is poorlyconstrained by TAP. Therefore, for each PHOI, we randomlydrew 1,000,000 samples of each individual transit’s midpointfrom the TAP posterior and calculated the period betweenconsecutive fitted transits, taking into account missing transits
where necessary. We then took the median and its s1 upper andlower error bars. The transits and their fits are shown inFigure 2.One important caveat to the numbers in Table 2 and the best-
fit lines in Figure 2 is that we have chosen to present themedian values and their s1 error bars because they bettercapture the distribution of each parameter. However, themedian value is not necessarily the most likely model. Transitlight curve fitting can result in bimodal distributions due toweak degeneracies between the parameters, such as T and b.More often than not, the effect is minor, and the median valueclosely approximates the most likely value for the mostimportant physical parameters, such as *R RP . However, thereare cases where the most likely value is moderately differentfrom the median, even being at the edge of the s1 error bars inthe more extreme cases. In Figure 2, this causes the structureone sees in the residual to the median model. One specificexample of this effect is the fit for EPIC 206082454 (PHOI-6 b). The median value of *R RP is actually a local minimum.For this planet, the upper and lower s1 limit closelyapproximates the center of the two local maxima. This hasthe effect in Figure 2 of placing the fit line below most of thedata points in the bottom of the transit. The same applies forEPIC 206245553 (PHOI-8 b). For both stars, *a R and i alsoshow a bimodal distribution. To qualitatively show theagreement (or disagreement) between the median model andthe single most likely individual model, we also plot the mostlikely single model from the MCMC analysis in yellow.
5. RESULTS
5.1. Previously Known Binaries
For all 75 targets, we searched the literature for companionswithin our FOV. Our search included several surveys andcatalogs: APASS (Henden & Munari 2014), SDSS (Alamet al. 2015), 2MASS (Skrutskie et al. 2006), WISE (Wrightet al. 2010), and the Washington Double Star (WDS) catalog(Mason et al. 2001). Many of the potential companions werelow signal to noise, had aberrations caused by diffractionspikes (particularly in SDSS), or were otherwise unlikely to betrue stars. We performed a manual triage to include only high-quality detections of companion stars. Unfortunately, however,the two C2 targets and 11 of the 17 C3 targets have not beenobserved by SDSS. We identified four known companions inthe literature search, one in SDSS (EPIC 201890494), one inthe WDS catalog (EPIC 201862715), and two in Montet et al.(2015, EPIC 201546283 and EPIC 201828749).The companion to EPIC 201890494 found by SDSS was
successfully recovered. We also recovered the companion toEPIC 201862715 (WASP-85). This is a visual, G-K dwarfbinary system (Burnham 1882) listed in the WDS catalog. Theprimary component hosts an inflated hot Jupiter, namedWASP-85A b, which was confirmed via ground-basedphotometry, radial velocities, and K2 photometry (Brownet al. 2014).The two other stars known to have companions were
discovered by Montet et al. (2015), who observed seven of thecandidates in Foreman-Mackey et al. (2015) with the PalomarHigh Angular Resolution Observer (PHARO) infrared detector(Hayward et al. 2001) AO system (Dekany et al. 2013) at the5.1 m Palomar Hale telescope. The two of their targets thatresulted in a detection of a nearby companion star were EPIC
5
The Astronomical Journal, 151:159 (13pp), 2016 June Schmitt et al.
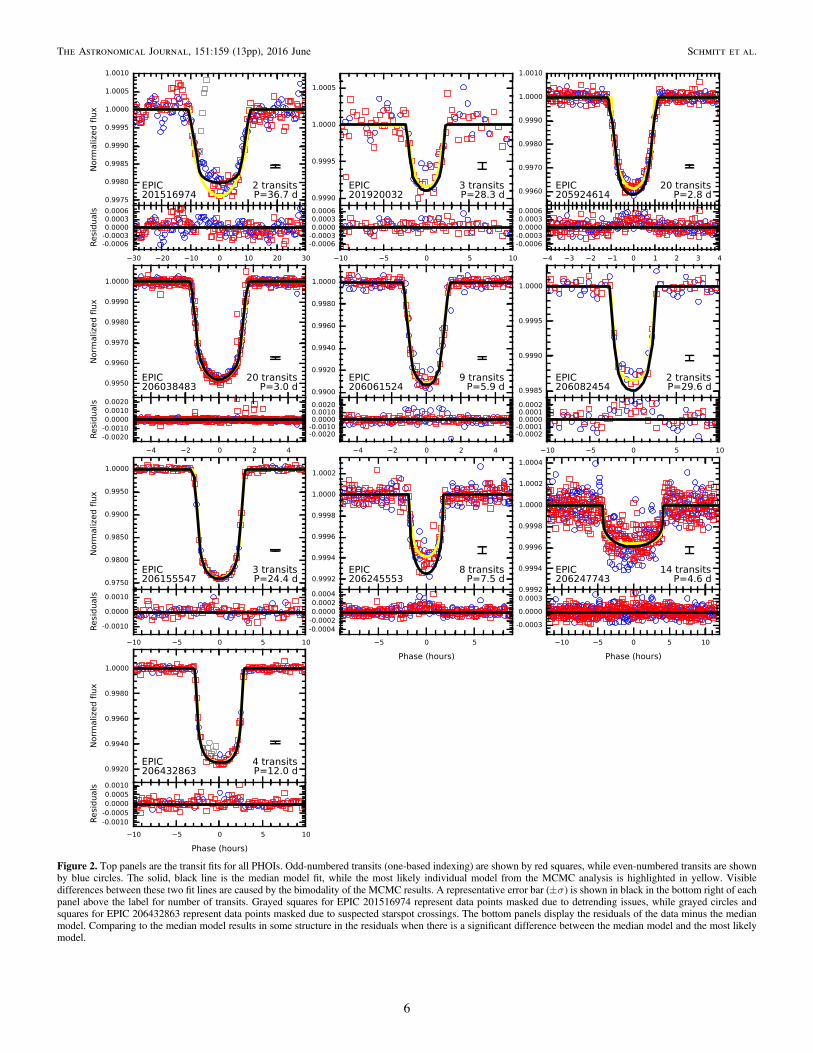
Figure 2. Top panels are the transit fits for all PHOIs. Odd-numbered transits (one-based indexing) are shown by red squares, while even-numbered transits are shownby blue circles. The solid, black line is the median model fit, while the most likely individual model from the MCMC analysis is highlighted in yellow. Visibledifferences between these two fit lines are caused by the bimodality of the MCMC results. A representative error bar ( s ) is shown in black in the bottom right of eachpanel above the label for number of transits. Grayed squares for EPIC 201516974 represent data points masked due to detrending issues, while grayed circles andsquares for EPIC 206432863 represent data points masked due to suspected starspot crossings. The bottom panels display the residuals of the data minus the medianmodel. Comparing to the median model results in some structure in the residuals when there is a significant difference between the median model and the most likelymodel.
6
The Astronomical Journal, 151:159 (13pp), 2016 June Schmitt et al.
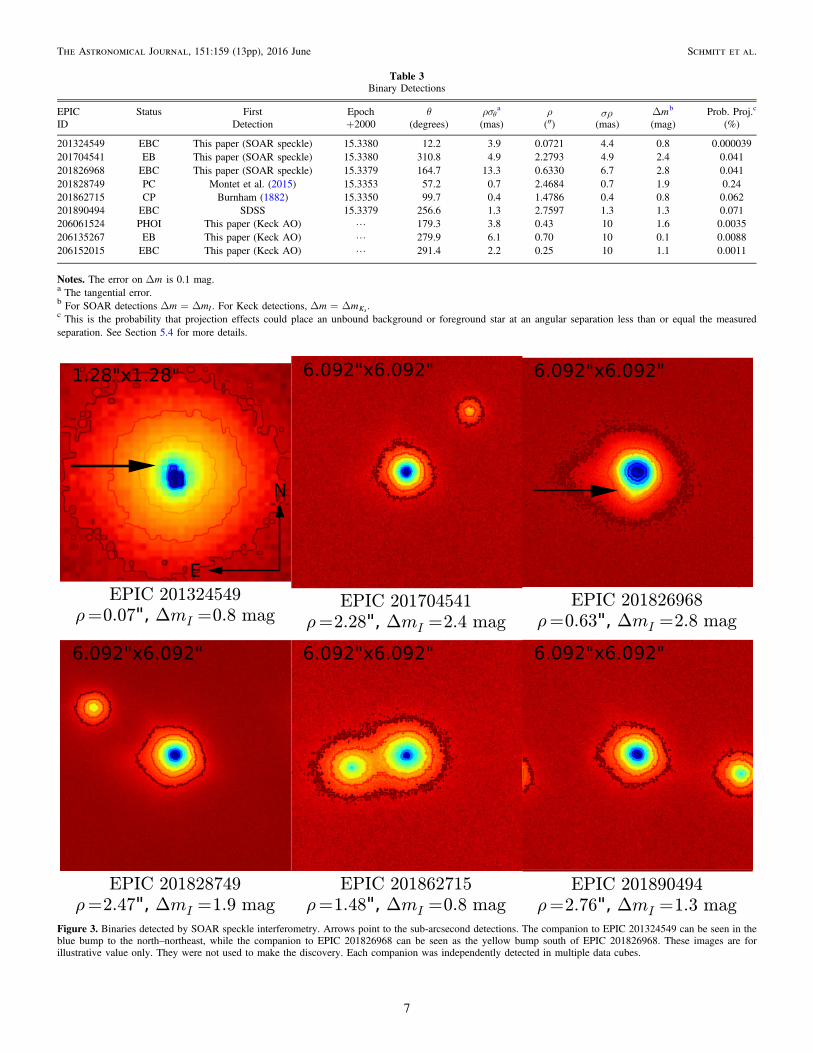
Table 3Binary Detections
EPIC Status First Epoch θ rsqa ρ sr Dmb Prob. Proj.c
ID Detection +2000 (degrees) (mas) (″) (mas) (mag) (%)
201324549 EBC This paper (SOAR speckle) 15.3380 12.2 3.9 0.0721 4.4 0.8 0.000039201704541 EB This paper (SOAR speckle) 15.3380 310.8 4.9 2.2793 4.9 2.4 0.041201826968 EBC This paper (SOAR speckle) 15.3379 164.7 13.3 0.6330 6.7 2.8 0.041201828749 PC Montet et al. (2015) 15.3353 57.2 0.7 2.4684 0.7 1.9 0.24201862715 CP Burnham (1882) 15.3350 99.7 0.4 1.4786 0.4 0.8 0.062201890494 EBC SDSS 15.3379 256.6 1.3 2.7597 1.3 1.3 0.071206061524 PHOI This paper (Keck AO) L 179.3 3.8 0.43 10 1.6 0.0035206135267 EB This paper (Keck AO) L 279.9 6.1 0.70 10 0.1 0.0088206152015 EBC This paper (Keck AO) L 291.4 2.2 0.25 10 1.1 0.0011
Notes. The error on Dm is 0.1 mag.a The tangential error.b For SOAR detections D = Dm mI . For Keck detections, D = Dm mKs.c This is the probability that projection effects could place an unbound background or foreground star at an angular separation less than or equal the measuredseparation. See Section 5.4 for more details.
Figure 3. Binaries detected by SOAR speckle interferometry. Arrows point to the sub-arcsecond detections. The companion to EPIC 201324549 can be seen in theblue bump to the north–northeast, while the companion to EPIC 201826968 can be seen as the yellow bump south of EPIC 201826968. These images are forillustrative value only. They were not used to make the discovery. Each companion was independently detected in multiple data cubes.
7
The Astronomical Journal, 151:159 (13pp), 2016 June Schmitt et al.
201546283 and EPIC 201828749. We recovered only the lattercompanion, which was originally measured to haver = 2. 46 0. 04 andD = m 1.462 0.012J mag (B. Montet2015, private communication). The unrecovered companionwas likely missed due to the combination of the companion’sdistance from the primary (r = 2. 98 0. 05), putting it at theedge of our detector, and its faintness (D =m 3.72Ks mag, B.Montet 2015, private communication), which implies a higherDmI close to our detection limit of D =m 5.0I at > 2 forthis star.
All three companions recovered were found with the SOARobservations. See Table 3 for their properties and Figure 3 forimages of the companions. These images are for illustrativevalue only and were not used to make the discovery. Eachcompanion was found independently in multiple data cubes.
5.2. New Detections
We detected three new companions with the SOARobservations (see Table 3). From the SOAR observations, wedid not discover any new stellar companions among the planetcandidates. Of the eight known EBs, one new companion wasdiscovered (EPIC 201704541). Around the 17 EB candidates,two new companion stars were discovered near EPIC201324549 and EPIC 201826968. See Figure 3 for speckleimages of the companions. Again, these images are forillustrative value only. Each new companion was found inmultiple data cubes.
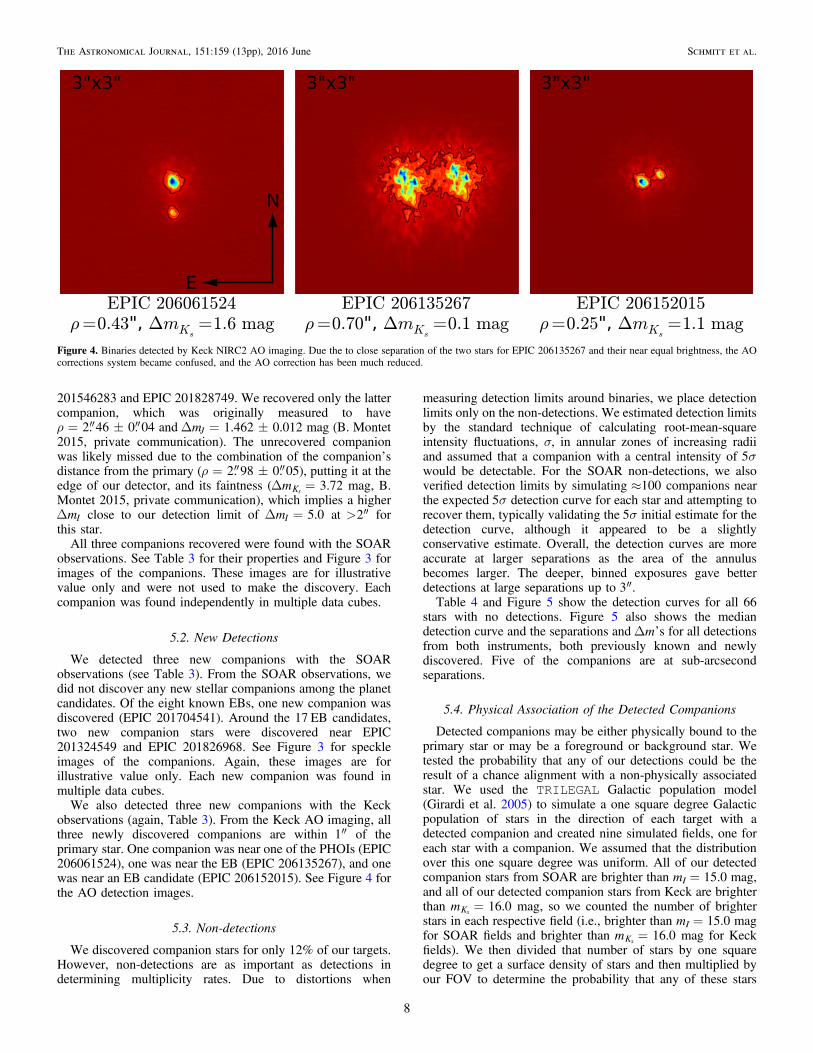
We also detected three new companions with the Keckobservations (again, Table 3). From the Keck AO imaging, allthree newly discovered companions are within 1 of theprimary star. One companion was near one of the PHOIs (EPIC206061524), one was near the EB (EPIC 206135267), and onewas near an EB candidate (EPIC 206152015). See Figure 4 forthe AO detection images.
5.3. Non-detections
We discovered companion stars for only 12% of our targets.However, non-detections are as important as detections indetermining multiplicity rates. Due to distortions when
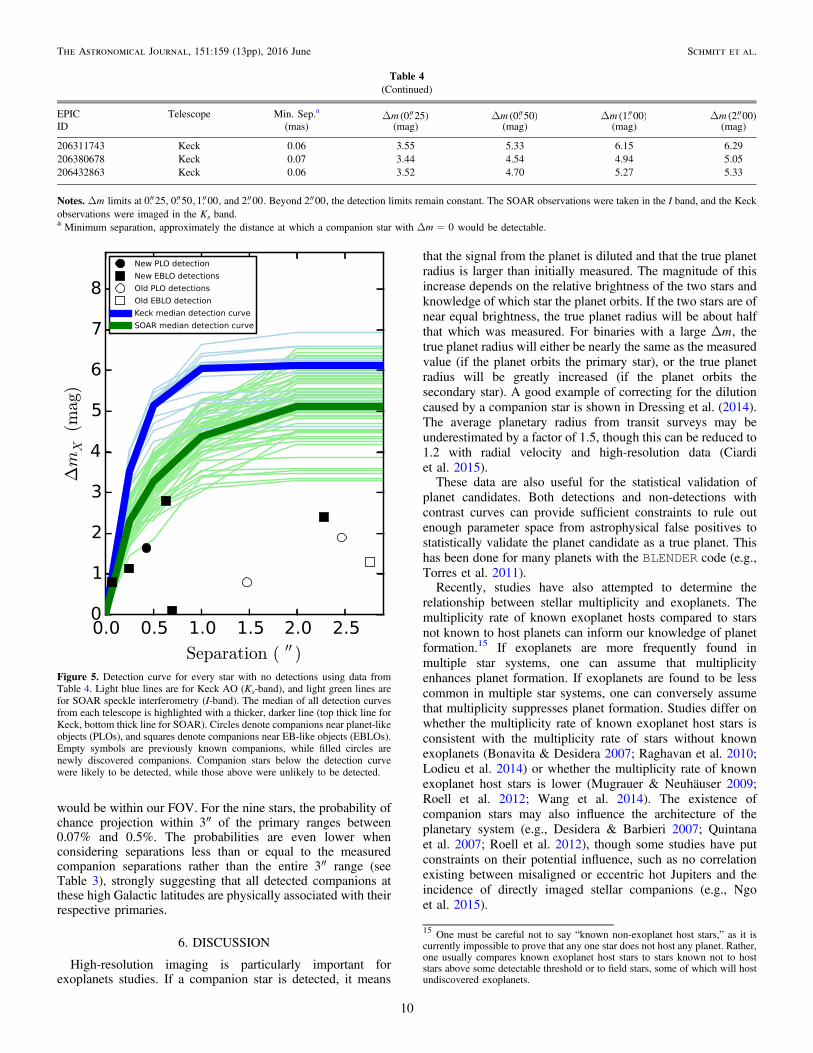
measuring detection limits around binaries, we place detectionlimits only on the non-detections. We estimated detection limitsby the standard technique of calculating root-mean-squareintensity fluctuations, σ, in annular zones of increasing radiiand assumed that a companion with a central intensity of s5would be detectable. For the SOAR non-detections, we alsoverified detection limits by simulating »100 companions nearthe expected s5 detection curve for each star and attempting torecover them, typically validating the s5 initial estimate for thedetection curve, although it appeared to be a slightlyconservative estimate. Overall, the detection curves are moreaccurate at larger separations as the area of the annulusbecomes larger. The deeper, binned exposures gave betterdetections at large separations up to 3 .Table 4 and Figure 5 show the detection curves for all 66
stars with no detections. Figure 5 also shows the mediandetection curve and the separations andDmʼs for all detectionsfrom both instruments, both previously known and newlydiscovered. Five of the companions are at sub-arcsecondseparations.
5.4. Physical Association of the Detected Companions
Detected companions may be either physically bound to theprimary star or may be a foreground or background star. Wetested the probability that any of our detections could be theresult of a chance alignment with a non-physically associatedstar. We used the TRILEGAL Galactic population model(Girardi et al. 2005) to simulate a one square degree Galacticpopulation of stars in the direction of each target with adetected companion and created nine simulated fields, one foreach star with a companion. We assumed that the distributionover this one square degree was uniform. All of our detectedcompanion stars from SOAR are brighter than mI = 15.0 mag,and all of our detected companion stars from Keck are brighterthan =m 16.0Ks mag, so we counted the number of brighterstars in each respective field (i.e., brighter than mI = 15.0 magfor SOAR fields and brighter than =m 16.0Ks mag for Keckfields). We then divided that number of stars by one squaredegree to get a surface density of stars and then multiplied byour FOV to determine the probability that any of these stars
Figure 4. Binaries detected by Keck NIRC2 AO imaging. Due the to close separation of the two stars for EPIC 206135267 and their near equal brightness, the AOcorrections system became confused, and the AO correction has been much reduced.
8
The Astronomical Journal, 151:159 (13pp), 2016 June Schmitt et al.
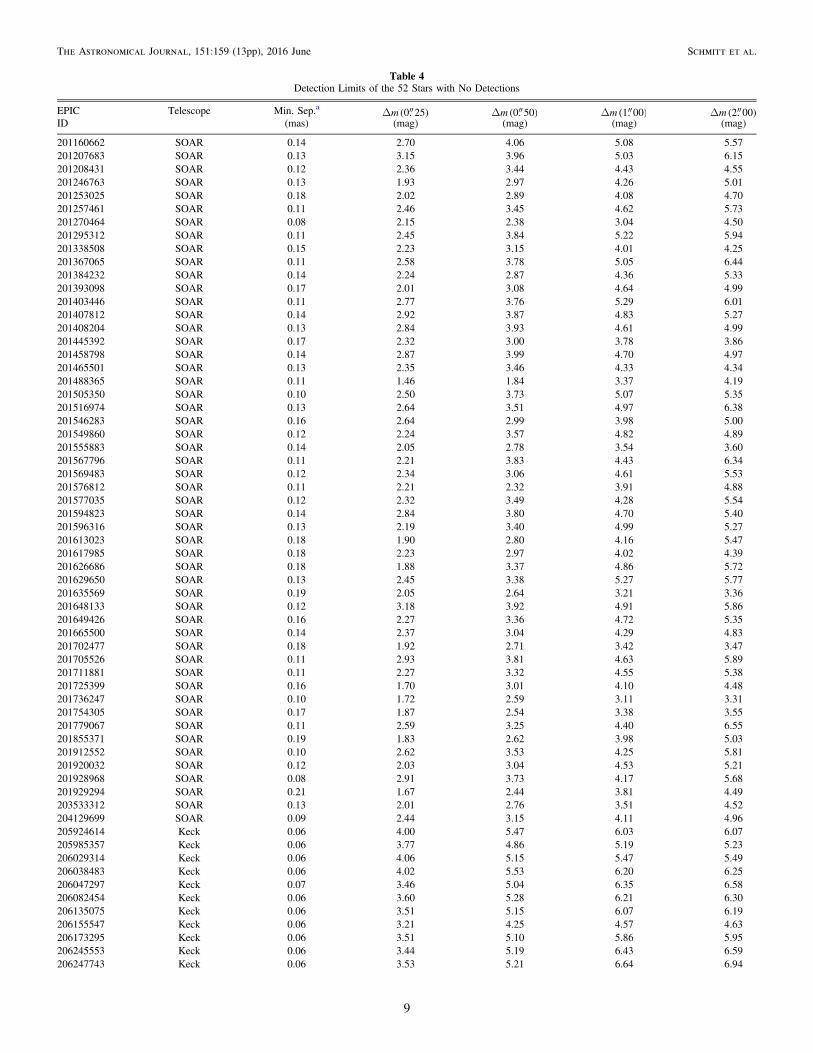
Table 4Detection Limits of the 52 Stars with No Detections
EPIC Telescope Min. Sep.a D m 0. 25( ) D m 0. 50( ) D m 1. 00( ) D m 2. 00( )ID (mas) (mag) (mag) (mag) (mag)
201160662 SOAR 0.14 2.70 4.06 5.08 5.57201207683 SOAR 0.13 3.15 3.96 5.03 6.15201208431 SOAR 0.12 2.36 3.44 4.43 4.55201246763 SOAR 0.13 1.93 2.97 4.26 5.01201253025 SOAR 0.18 2.02 2.89 4.08 4.70201257461 SOAR 0.11 2.46 3.45 4.62 5.73201270464 SOAR 0.08 2.15 2.38 3.04 4.50201295312 SOAR 0.11 2.45 3.84 5.22 5.94201338508 SOAR 0.15 2.23 3.15 4.01 4.25201367065 SOAR 0.11 2.58 3.78 5.05 6.44201384232 SOAR 0.14 2.24 2.87 4.36 5.33201393098 SOAR 0.17 2.01 3.08 4.64 4.99201403446 SOAR 0.11 2.77 3.76 5.29 6.01201407812 SOAR 0.14 2.92 3.87 4.83 5.27201408204 SOAR 0.13 2.84 3.93 4.61 4.99201445392 SOAR 0.17 2.32 3.00 3.78 3.86201458798 SOAR 0.14 2.87 3.99 4.70 4.97201465501 SOAR 0.13 2.35 3.46 4.33 4.34201488365 SOAR 0.11 1.46 1.84 3.37 4.19201505350 SOAR 0.10 2.50 3.73 5.07 5.35201516974 SOAR 0.13 2.64 3.51 4.97 6.38201546283 SOAR 0.16 2.64 2.99 3.98 5.00201549860 SOAR 0.12 2.24 3.57 4.82 4.89201555883 SOAR 0.14 2.05 2.78 3.54 3.60201567796 SOAR 0.11 2.21 3.83 4.43 6.34201569483 SOAR 0.12 2.34 3.06 4.61 5.53201576812 SOAR 0.11 2.21 2.32 3.91 4.88201577035 SOAR 0.12 2.32 3.49 4.28 5.54201594823 SOAR 0.14 2.84 3.80 4.70 5.40201596316 SOAR 0.13 2.19 3.40 4.99 5.27201613023 SOAR 0.18 1.90 2.80 4.16 5.47201617985 SOAR 0.18 2.23 2.97 4.02 4.39201626686 SOAR 0.18 1.88 3.37 4.86 5.72201629650 SOAR 0.13 2.45 3.38 5.27 5.77201635569 SOAR 0.19 2.05 2.64 3.21 3.36201648133 SOAR 0.12 3.18 3.92 4.91 5.86201649426 SOAR 0.16 2.27 3.36 4.72 5.35201665500 SOAR 0.14 2.37 3.04 4.29 4.83201702477 SOAR 0.18 1.92 2.71 3.42 3.47201705526 SOAR 0.11 2.93 3.81 4.63 5.89201711881 SOAR 0.11 2.27 3.32 4.55 5.38201725399 SOAR 0.16 1.70 3.01 4.10 4.48201736247 SOAR 0.10 1.72 2.59 3.11 3.31201754305 SOAR 0.17 1.87 2.54 3.38 3.55201779067 SOAR 0.11 2.59 3.25 4.40 6.55201855371 SOAR 0.19 1.83 2.62 3.98 5.03201912552 SOAR 0.10 2.62 3.53 4.25 5.81201920032 SOAR 0.12 2.03 3.04 4.53 5.21201928968 SOAR 0.08 2.91 3.73 4.17 5.68201929294 SOAR 0.21 1.67 2.44 3.81 4.49203533312 SOAR 0.13 2.01 2.76 3.51 4.52204129699 SOAR 0.09 2.44 3.15 4.11 4.96205924614 Keck 0.06 4.00 5.47 6.03 6.07205985357 Keck 0.06 3.77 4.86 5.19 5.23206029314 Keck 0.06 4.06 5.15 5.47 5.49206038483 Keck 0.06 4.02 5.53 6.20 6.25206047297 Keck 0.07 3.46 5.04 6.35 6.58206082454 Keck 0.06 3.60 5.28 6.21 6.30206135075 Keck 0.06 3.51 5.15 6.07 6.19206155547 Keck 0.06 3.21 4.25 4.57 4.63206173295 Keck 0.06 3.51 5.10 5.86 5.95206245553 Keck 0.06 3.44 5.19 6.43 6.59206247743 Keck 0.06 3.53 5.21 6.64 6.94
9
The Astronomical Journal, 151:159 (13pp), 2016 June Schmitt et al.
would be within our FOV. For the nine stars, the probability ofchance projection within 3 of the primary ranges between0.07% and 0.5%. The probabilities are even lower whenconsidering separations less than or equal to the measuredcompanion separations rather than the entire 3 range (seeTable 3), strongly suggesting that all detected companions atthese high Galactic latitudes are physically associated with theirrespective primaries.
6. DISCUSSION
High-resolution imaging is particularly important forexoplanets studies. If a companion star is detected, it means
that the signal from the planet is diluted and that the true planetradius is larger than initially measured. The magnitude of thisincrease depends on the relative brightness of the two stars andknowledge of which star the planet orbits. If the two stars are ofnear equal brightness, the true planet radius will be about halfthat which was measured. For binaries with a large Dm, thetrue planet radius will either be nearly the same as the measuredvalue (if the planet orbits the primary star), or the true planetradius will be greatly increased (if the planet orbits thesecondary star). A good example of correcting for the dilutioncaused by a companion star is shown in Dressing et al. (2014).The average planetary radius from transit surveys may beunderestimated by a factor of 1.5, though this can be reduced to1.2 with radial velocity and high-resolution data (Ciardiet al. 2015).These data are also useful for the statistical validation of
planet candidates. Both detections and non-detections withcontrast curves can provide sufficient constraints to rule outenough parameter space from astrophysical false positives tostatistically validate the planet candidate as a true planet. Thishas been done for many planets with the BLENDER code (e.g.,Torres et al. 2011).Recently, studies have also attempted to determine the
relationship between stellar multiplicity and exoplanets. Themultiplicity rate of known exoplanet hosts compared to starsnot known to host planets can inform our knowledge of planetformation.15 If exoplanets are more frequently found inmultiple star systems, one can assume that multiplicityenhances planet formation. If exoplanets are found to be lesscommon in multiple star systems, one can conversely assumethat multiplicity suppresses planet formation. Studies differ onwhether the multiplicity rate of known exoplanet host stars isconsistent with the multiplicity rate of stars without knownexoplanets (Bonavita & Desidera 2007; Raghavan et al. 2010;Lodieu et al. 2014) or whether the multiplicity rate of knownexoplanet host stars is lower (Mugrauer & Neuhäuser 2009;Roell et al. 2012; Wang et al. 2014). The existence ofcompanion stars may also influence the architecture of theplanetary system (e.g., Desidera & Barbieri 2007; Quintanaet al. 2007; Roell et al. 2012), though some studies have putconstraints on their potential influence, such as no correlationexisting between misaligned or eccentric hot Jupiters and theincidence of directly imaged stellar companions (e.g., Ngoet al. 2015).
Table 4(Continued)
EPIC Telescope Min. Sep.a D m 0. 25( ) D m 0. 50( ) D m 1. 00( ) D m 2. 00( )ID (mas) (mag) (mag) (mag) (mag)
206311743 Keck 0.06 3.55 5.33 6.15 6.29206380678 Keck 0.07 3.44 4.54 4.94 5.05206432863 Keck 0.06 3.52 4.70 5.27 5.33
Notes.Dm limits at 0. 25, 0. 50, 1. 00, and 2. 00. Beyond 2. 00, the detection limits remain constant. The SOAR observations were taken in the I band, and the Keckobservations were imaged in the Ks band.a Minimum separation, approximately the distance at which a companion star with D =m 0 would be detectable.
Figure 5. Detection curve for every star with no detections using data fromTable 4. Light blue lines are for Keck AO (Ks-band), and light green lines arefor SOAR speckle interferometry (I-band). The median of all detection curvesfrom each telescope is highlighted with a thicker, darker line (top thick line forKeck, bottom thick line for SOAR). Circles denote companions near planet-likeobjects (PLOs), and squares denote companions near EB-like objects (EBLOs).Empty symbols are previously known companions, while filled circles arenewly discovered companions. Companion stars below the detection curvewere likely to be detected, while those above were unlikely to be detected.
15 One must be careful not to say “known non-exoplanet host stars,” as it iscurrently impossible to prove that any one star does not host any planet. Rather,one usually compares known exoplanet host stars to stars known not to hoststars above some detectable threshold or to field stars, some of which will hostundiscovered exoplanets.
10
The Astronomical Journal, 151:159 (13pp), 2016 June Schmitt et al.
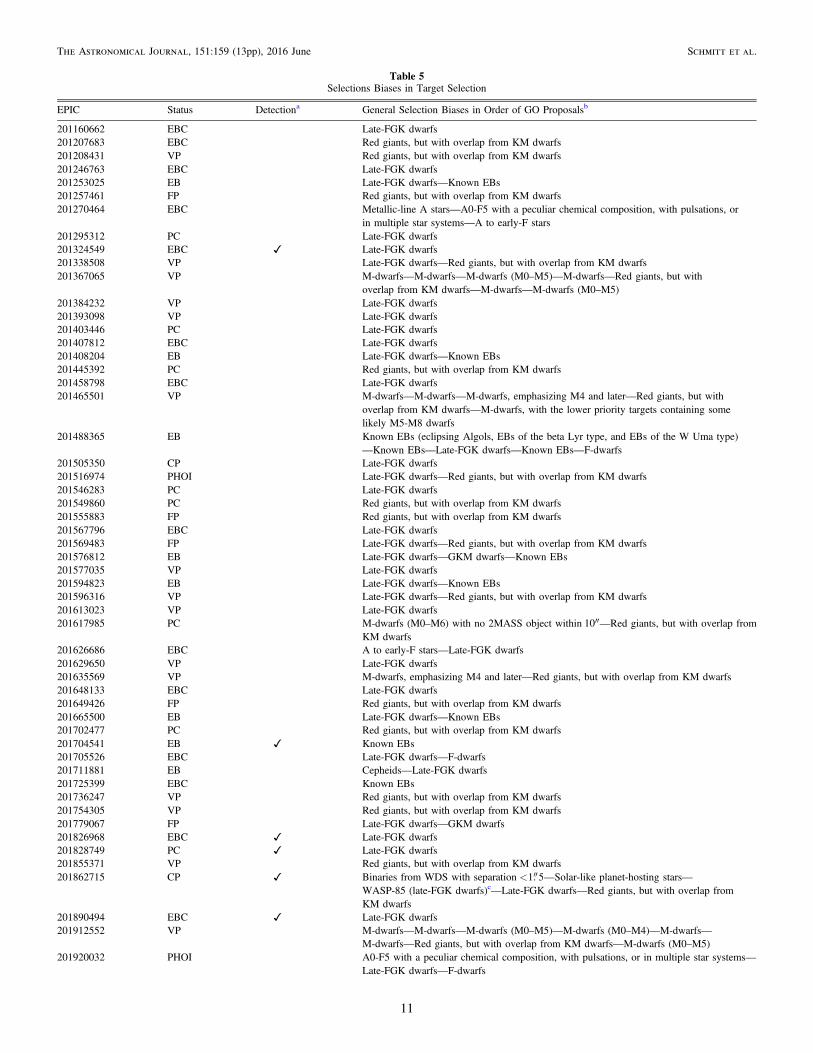
Table 5Selections Biases in Target Selection
EPIC Status Detectiona General Selection Biases in Order of GO Proposalsb
201160662 EBC Late-FGK dwarfs201207683 EBC Red giants, but with overlap from KM dwarfs201208431 VP Red giants, but with overlap from KM dwarfs201246763 EBC Late-FGK dwarfs201253025 EB Late-FGK dwarfs—Known EBs201257461 FP Red giants, but with overlap from KM dwarfs201270464 EBC Metallic-line A stars—A0-F5 with a peculiar chemical composition, with pulsations, or
in multiple star systems—A to early-F stars201295312 PC Late-FGK dwarfs201324549 EBC ✓ Late-FGK dwarfs201338508 VP Late-FGK dwarfs—Red giants, but with overlap from KM dwarfs201367065 VP M-dwarfs—M-dwarfs—M-dwarfs (M0–M5)—M-dwarfs—Red giants, but with
overlap from KM dwarfs—M-dwarfs—M-dwarfs (M0–M5)201384232 VP Late-FGK dwarfs201393098 VP Late-FGK dwarfs201403446 PC Late-FGK dwarfs201407812 EBC Late-FGK dwarfs201408204 EB Late-FGK dwarfs—Known EBs201445392 PC Red giants, but with overlap from KM dwarfs201458798 EBC Late-FGK dwarfs201465501 VP M-dwarfs—M-dwarfs—M-dwarfs, emphasizing M4 and later—Red giants, but with
overlap from KM dwarfs—M-dwarfs, with the lower priority targets containing somelikely M5-M8 dwarfs
201488365 EB Known EBs (eclipsing Algols, EBs of the beta Lyr type, and EBs of the W Uma type)—Known EBs—Late-FGK dwarfs—Known EBs—F-dwarfs
201505350 CP Late-FGK dwarfs201516974 PHOI Late-FGK dwarfs—Red giants, but with overlap from KM dwarfs201546283 PC Late-FGK dwarfs201549860 PC Red giants, but with overlap from KM dwarfs201555883 FP Red giants, but with overlap from KM dwarfs201567796 EBC Late-FGK dwarfs201569483 FP Late-FGK dwarfs—Red giants, but with overlap from KM dwarfs201576812 EB Late-FGK dwarfs—GKM dwarfs—Known EBs201577035 VP Late-FGK dwarfs201594823 EB Late-FGK dwarfs—Known EBs201596316 VP Late-FGK dwarfs—Red giants, but with overlap from KM dwarfs201613023 VP Late-FGK dwarfs201617985 PC M-dwarfs (M0–M6) with no 2MASS object within 10 —Red giants, but with overlap from
KM dwarfs201626686 EBC A to early-F stars—Late-FGK dwarfs201629650 VP Late-FGK dwarfs201635569 VP M-dwarfs, emphasizing M4 and later—Red giants, but with overlap from KM dwarfs201648133 EBC Late-FGK dwarfs201649426 FP Red giants, but with overlap from KM dwarfs201665500 EB Late-FGK dwarfs—Known EBs201702477 PC Red giants, but with overlap from KM dwarfs201704541 EB ✓ Known EBs201705526 EBC Late-FGK dwarfs—F-dwarfs201711881 EB Cepheids—Late-FGK dwarfs201725399 EBC Known EBs201736247 VP Red giants, but with overlap from KM dwarfs201754305 VP Red giants, but with overlap from KM dwarfs201779067 FP Late-FGK dwarfs—GKM dwarfs201826968 EBC ✓ Late-FGK dwarfs201828749 PC ✓ Late-FGK dwarfs201855371 VP Red giants, but with overlap from KM dwarfs201862715 CP ✓ Binaries from WDS with separation < 1. 5—Solar-like planet-hosting stars—
WASP-85 (late-FGK dwarfs)c—Late-FGK dwarfs—Red giants, but with overlap fromKM dwarfs
201890494 EBC ✓ Late-FGK dwarfs201912552 VP M-dwarfs—M-dwarfs—M-dwarfs (M0–M5)—M-dwarfs (M0–M4)—M-dwarfs—
M-dwarfs—Red giants, but with overlap from KM dwarfs—M-dwarfs (M0–M5)201920032 PHOI A0-F5 with a peculiar chemical composition, with pulsations, or in multiple star systems—
Late-FGK dwarfs—F-dwarfs
11
The Astronomical Journal, 151:159 (13pp), 2016 June Schmitt et al.
7. CONCLUSIONS
We found nine companion stars within 3 of three candidatetransiting exoplanet host stars and six EB candidates. All ninecompanion stars are likely to be physically associated with thetarget star. Six of the nine detected companions are newdiscoveries. Five of these six companions are associated withlikely EBs.
Without knowledge of the physical binary separations, it isdifficult to determine whether or not there are any potentiallysignificant deviations between the binary statistics in any sub-sample of our target stars and the binary statistics of thepopulation of field stars. However, it is worth noting that manyof the short-period EBs and EB candidates ( <P 3 days) werefound to have companions, supporting the conclusions inTokovinin et al. (2006) that all short-period ( <P 3 days) EBshave wider companions. These observations contribute to thegrowing data set describing the multiplicity of our galacticneighborhood. This will soon help shed light on the influencethat stellar multiplicity might have on planet formation.
J.R.S. and T.S.B. acknowledge support from NASA ADAP14-0245. D.A.F. acknowledges funding support for PlanetHunters from Yale University and acknowledges support fromNASA ADAP12-0172. T.S.B. acknowledges funding supportfrom 14-K2GO1_2-0075, 14-K2GO2_2-0075, and 15-K2GO3_2-0063. K.S. gratefully acknowledges support from
Swiss National Science Foundation Grant PP00P2_138979/1.The Zooniverse is supported by The Leverhulme Trust and bythe Alfred P. Sloan foundation. PH is supported in part byNASA JPL’s PlanetQuest program. The data presented in thispaper are the result of the efforts of the PH volunteers, withoutwhom this work would not have been possible. Theircontributions are individually acknowledged at http://www.planethunters.org/authors. The authors thank thePH volunteers who participated in identifying and analyzingthe planet and EB candidates presented in this paper. Theauthors also thank Andrew Vanderburg and the Harvard-Smithsonian Center for Astrophysics for making available thereduced light curves for K2 C1, C2, and C3.Some of the research presented in this paper is based on
observations obtained at the Southern Astrophysical Research(SOAR) telescope, which is a joint project of the Ministério daCiência, Tecnologia, e Inovaçao˜ (MCTI) da RepúblicaFederativa do Brasil, the U.S. National Optical AstronomyObservatory (NOAO), the University of North Carolina atChapel Hill (UNC), and Michigan State University (MSU).Some of the data presented herein were obtained at the W. M.Keck Observatory, which is operated as a scientific partnershipamong the California Institute of Technology, the University ofCalifornia and the National Aeronautics and Space Adminis-tration. The Observatory was made possible by the generousfinancial support of the W. M. Keck Foundation.
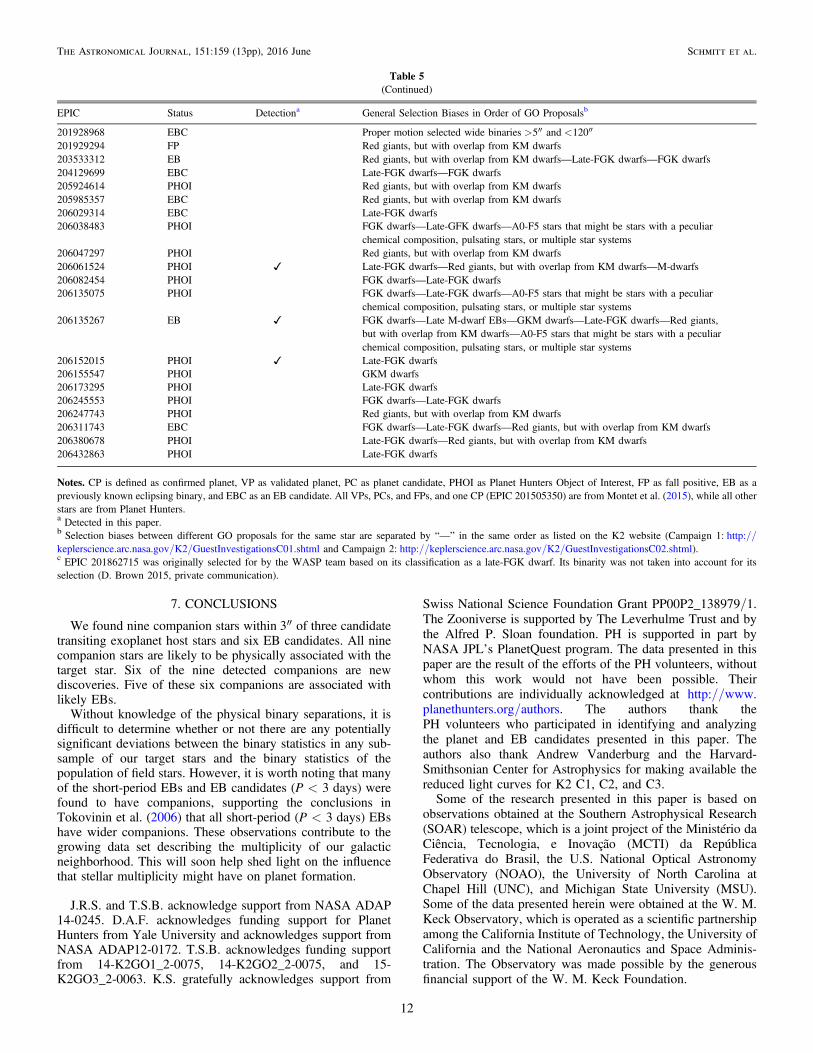
Table 5(Continued)
EPIC Status Detectiona General Selection Biases in Order of GO Proposalsb
201928968 EBC Proper motion selected wide binaries > 5 and < 120201929294 FP Red giants, but with overlap from KM dwarfs203533312 EB Red giants, but with overlap from KM dwarfs—Late-FGK dwarfs—FGK dwarfs204129699 EBC Late-FGK dwarfs—FGK dwarfs205924614 PHOI Red giants, but with overlap from KM dwarfs205985357 EBC Red giants, but with overlap from KM dwarfs206029314 EBC Late-FGK dwarfs206038483 PHOI FGK dwarfs—Late-GFK dwarfs—A0-F5 stars that might be stars with a peculiar
chemical composition, pulsating stars, or multiple star systems206047297 PHOI Red giants, but with overlap from KM dwarfs206061524 PHOI ✓ Late-FGK dwarfs—Red giants, but with overlap from KM dwarfs—M-dwarfs206082454 PHOI FGK dwarfs—Late-FGK dwarfs206135075 PHOI FGK dwarfs—Late-FGK dwarfs—A0-F5 stars that might be stars with a peculiar
chemical composition, pulsating stars, or multiple star systems206135267 EB ✓ FGK dwarfs—Late M-dwarf EBs—GKM dwarfs—Late-FGK dwarfs—Red giants,
but with overlap from KM dwarfs—A0-F5 stars that might be stars with a peculiarchemical composition, pulsating stars, or multiple star systems
206152015 PHOI ✓ Late-FGK dwarfs206155547 PHOI GKM dwarfs206173295 PHOI Late-FGK dwarfs206245553 PHOI FGK dwarfs—Late-FGK dwarfs206247743 PHOI Red giants, but with overlap from KM dwarfs206311743 EBC FGK dwarfs—Late-FGK dwarfs—Red giants, but with overlap from KM dwarfs206380678 PHOI Late-FGK dwarfs—Red giants, but with overlap from KM dwarfs206432863 PHOI Late-FGK dwarfs
Notes. CP is defined as confirmed planet, VP as validated planet, PC as planet candidate, PHOI as Planet Hunters Object of Interest, FP as fall positive, EB as apreviously known eclipsing binary, and EBC as an EB candidate. All VPs, PCs, and FPs, and one CP (EPIC 201505350) are from Montet et al. (2015), while all otherstars are from Planet Hunters.a Detected in this paper.b Selection biases between different GO proposals for the same star are separated by “—” in the same order as listed on the K2 website (Campaign 1: http://keplerscience.arc.nasa.gov/K2/GuestInvestigationsC01.shtml and Campaign 2: http://keplerscience.arc.nasa.gov/K2/GuestInvestigationsC02.shtml).c EPIC 201862715 was originally selected for by the WASP team based on its classification as a late-FGK dwarf. Its binarity was not taken into account for itsselection (D. Brown 2015, private communication).
12
The Astronomical Journal, 151:159 (13pp), 2016 June Schmitt et al.
This paper includes data collected by the Kepler spacecraft,and we gratefully acknowledge the entire Kepler missionteam’s efforts in obtaining and providing the light curves usedin this analysis. Funding for the Kepler mission is provided bythe NASA Science Mission directorate. Support for MAST fornon-HST data is provided by the NASA Office of SpaceScience via grant NNX13AC07G and by other grants andcontracts. This research has made use of NASA’s AstrophysicsData System Bibliographic Services, the Washington DoubleStar Catalog maintained at the U.S. Naval Observatory, and theAPASS database, located at the AAVSO website. Funding forAPASS has been provided by the Robert Martin AyersSciences Fund. This publication makes use of data productsfrom the Two Micron All Sky Survey, which is a joint projectof the University of Massachusetts and the Infrared Processingand Analysis Center/California Institute of Technology,funded by the National Aeronautics and Space Administrationand the National Science Foundation. Funding for the SloanDigital Sky Survey IV has been provided by the Alfred P.Sloan Foundation, the U.S. Department of Energy Office ofScience, and the Participating Institutions. SDSS-IV acknowl-edges support and resources from the Center for High-Performance Computing at the University of Utah. The SDSSwebsite is www.sdss.org. This publication makes use of dataproducts from the Wide-field Infrared Survey Explorer, whichis a joint project of the University of California, Los Angeles,and the Jet Propulsion Laboratory/California Institute ofTechnology, funded by the National Aeronautics and SpaceAdministration.
APPENDIXSELECTION BIASES
Determining the true stellar multiplicity rate of exoplanethost stars requires knowledge of the sample's selection effects.Therefore, we provide here a table of the selection biases foreach star as determined by the GO proposals, which requestedthat the star be observed so that any potential future analysis ofthe occurrence rate using these stars can attempt to account forthese biases.
REFERENCES
Abt, H. A., & Levy, S. G. 1976, ApJS, 30, 273Alam, S., Albareti, F. D., Allende Prieto, C., et al. 2015, ApJS, 219, 12Armstrong, D. J., Kirk, J., Lam, K. W. F., et al. 2016, MNRAS, 456, 2260Armstrong, D. J., Santerne, A., Veras, D., et al. 2015, A&A, 582, A33Barros, S. C. C., Almenara, J. M., Demangeon, O., et al. 2015, MNRAS,
454, 4267Bonavita, M., & Desidera, S. 2007, A&A, 468, 721Borucki, W. J., Koch, D., Basri, G., et al. 2010, Sci, 327, 977Boyajian, T. S., LaCourse, D. M., Rappaport, S. A., et al. 2016, MNRAS,
457, 3988Brown, D. J. A., Anderson, D. R., Armstrong, D. J., et al. 2015, in Proc.
European Planetary Science Congress 2015 (Göttingen: Copernicus),EPSC2015-603
Burnham, S. W. 1882, PWasO, 1, 92Carter, J. A., & Winn, J. N. 2009, ApJ, 704, 51Ciardi, D. R., Beichman, C. A., Horch, E. P., & Howell, S. B. 2015, ApJ,
805, 16Coughlin, J. L., Mullally, F., Thompson, S. E., et al. 2015, arXiv:1512.06149Daemgen, S., Hormuth, F., Brandner, W., et al. 2009, A&A, 498, 567Dekany, R., Roberts, J., Burruss, R., et al. 2013, ApJ, 776, 130Desidera, S., & Barbieri, M. 2007, A&A, 462, 345Dieterich, S. B., Henry, T. J., Golimowski, D. A., Krist, J. E., & Tanner, A. M.
2012, AJ, 144, 64Dressing, C. D., Adams, E. R., Dupree, A. K., Kulesa, C., & McCarthy, D.
2014, AJ, 148, 78Duchêne, G., & Kraus, A. 2013, ARA&A, 51, 269Eastman, J., Gaudi, B. S., & Agol, E. 2013, PASP, 125, 83Fischer, D. A., & Marcy, G. W. 1992, ApJ, 396, 178Fischer, D. A., Schwamb, M. E., Schawinski, K., et al. 2012, MNRAS,
419, 2900Foreman-Mackey, D., Montet, B. T., Hogg, D. W., et al. 2015, ApJ, 806, 215Garmany, C. D., Conti, P. S., & Massey, P. 1980, ApJ, 242, 1063Gazak, J. Z., Johnson, J. A., Tonry, J., et al. 2012, AdAst, 2012, 30Gelman, A., & Rubin, D. B. 1992, StaSc, 7, 457Girardi, L., Groenewegen, M. A. T., Hatziminaoglou, E., & da Costa, L. 2005,
A&A, 436, 895Hayward, T. L., Brandl, B., Pirger, B., et al. 2001, PASP, 113, 105Henden, A., & Munari, U. 2014, CoSka, 43, 518Howell, S. B., Everett, M. E., Sherry, W., Horch, E., & Ciardi, D. R. 2011, AJ,
142, 19Howell, S. B., Sobeck, C., Haas, M., et al. 2014, PASP, 126, 398Kato, T., & Osaki, Y. 2014, PASJ, 66, L5LaCourse, D. M., Jek, K. J., Jacobs, T. L., et al. 2015, MNRAS, 452, 3561Lintott, C. J., Schawinski, K., Slosar, A., et al. 2008, MNRAS, 389, 1179Lintott, C. J., Schwamb, M. E., Barclay, T., et al. 2013, AJ, 145, 151Lodieu, N., Pérez-Garrido, A., Béjar, V. J. S., et al. 2014, A&A, 569, A120Mandel, K., & Agol, E. 2002, ApJL, 580, L171Mason, B. D., Wycoff, G. L., Hartkopf, W. I., Douglass, G. G., &
Worley, C. E. 2001, AJ, 122, 3466Montet, B. T., Morton, T. D., Foreman-Mackey, D., et al. 2015, ApJ, 809, 25Mugrauer, M., & Neuhäuser, R. 2009, A&A, 494, 373Narita, N., Hirano, T., Fukui, A., et al. 2015, ApJ, 815, 47Ngo, H., Knutson, H. A., Hinkley, S., et al. 2015, ApJ, 800, 138Prša, A., Batalha, N., Slawson, R. W., et al. 2011, AJ, 141, 83Quintana, E. V., Adams, F. C., Lissauer, J. J., & Chambers, J. E. 2007, ApJ,
660, 807Raghavan, D., McAlister, H. A., Henry, T. J., et al. 2010, ApJS, 190, 1Roell, T., Neuhäuser, R., Seifahrt, A., & Mugrauer, M. 2012, A&A, 542, A92Sana, H., de Mink, S. E., de Koter, A., et al. 2012, Sci, 337, 444Schlieder, J. E., Crossfield, I. J. M., Petigura, E. A., et al. 2016, ApJ, 818, 87Schmitt, J. R., Agol, E., Deck, K. M., et al. 2014a, ApJ, 795, 167Schmitt, J. R., Wang, J., Fischer, D. A., et al. 2014b, AJ, 148, 28Schwamb, M. E., Orosz, J. A., Carter, J. A., et al. 2013, ApJ, 768, 127Skrutskie, M. F., Cutri, R. M., Stiening, R., et al. 2006, AJ, 131, 1163Still, M., & Barclay, T. 2012, Astrophysics Source Code Library,
ascl:1208.004Tokovinin, A. 2014, AJ, 147, 87Tokovinin, A., & Cantarutti, R. 2008, PASP, 120, 170Tokovinin, A., Mason, B. D., & Hartkopf, W. I. 2010, AJ, 139, 743Tokovinin, A., Thomas, S., Sterzik, M., & Udry, S. 2006, A&A, 450, 681Torres, G., Fressin, F., Batalha, N. M., et al. 2011, ApJ, 727, 24Vanderburg, A., & Johnson, J. A. 2014, PASP, 126, 948Vanderburg, A., Latham, D. W., Buchhave, L. A., et al. 2016, ApJS, 222, 14Wang, J., Fischer, D. A., Barclay, T., et al. 2013, ApJ, 776, 10Wang, J., Fischer, D. A., Barclay, T., et al. 2015, ApJ, 815, 127Wang, J., Fischer, D. A., Xie, J.-W., & Ciardi, D. R. 2014, ApJ, 791, 111Wizinowich, P. L., Acton, D. S., Lai, O., et al. 2000, Proc. SPIE, 4007, 2Wright, E. L., Eisenhardt, P. R. M., Mainzer, A. K., et al. 2010, AJ, 140, 1868
13
The Astronomical Journal, 151:159 (13pp), 2016 June Schmitt et al.