planet hunters educator_guide
TRANSCRIPT
National Aeronautics and Space Administration
nasa.gov Pla
net
Hu
nte
rs G
uid
e
National Aeronautics and Space Administration
Table of Contents
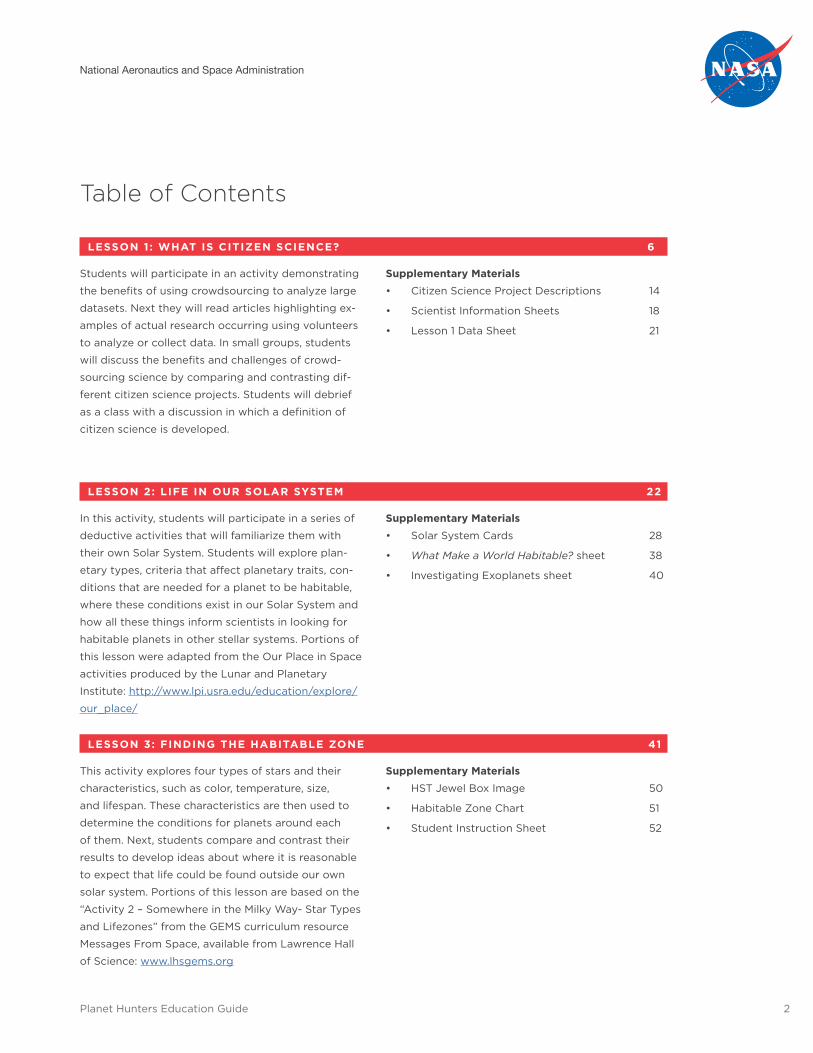
LESSON 1: WHAT IS CITIZEN SCIENCE? 6
Students will participate in an activity demonstrating
the benefits of using crowdsourcing to analyze large
datasets. Next they will read articles highlighting ex-
amples of actual research occurring using volunteers
to analyze or collect data. In small groups, students
will discuss the benefits and challenges of crowd-
sourcing science by comparing and contrasting dif-
ferent citizen science projects. Students will debrief
as a class with a discussion in which a definition of
citizen science is developed.
Supplementary Materials• Citizen Science Project Descriptions 14
• Scientist Information Sheets 18
• Lesson 1 Data Sheet 21
LESSON 2: LIFE IN OUR SOLAR SYSTEM 22
In this activity, students will participate in a series of
deductive activities that will familiarize them with
their own Solar System. Students will explore plan-
etary types, criteria that affect planetary traits, con-
ditions that are needed for a planet to be habitable,
where these conditions exist in our Solar System and
how all these things inform scientists in looking for
habitable planets in other stellar systems. Portions of
this lesson were adapted from the Our Place in Space
activities produced by the Lunar and Planetary
Institute: http://www.lpi.usra.edu/education/explore/
our_place/
Supplementary Materials• Solar System Cards 28
• What Make a World Habitable? sheet 38
• Investigating Exoplanets sheet 40
LESSON 3: FINDING THE HABITABLE ZONE 41
This activity explores four types of stars and their
characteristics, such as color, temperature, size,
and lifespan. These characteristics are then used to
determine the conditions for planets around each
of them. Next, students compare and contrast their
results to develop ideas about where it is reasonable
to expect that life could be found outside our own
solar system. Portions of this lesson are based on the
“Activity 2 – Somewhere in the Milky Way- Star Types
and Lifezones” from the GEMS curriculum resource
Messages From Space, available from Lawrence Hall
of Science: www.lhsgems.org
Supplementary Materials• HST Jewel Box Image 50
• Habitable Zone Chart 51
• Student Instruction Sheet 52
Planet Hunters Education Guide 2
National Aeronautics and Space Administration
Planet Hunters Education Guide 3
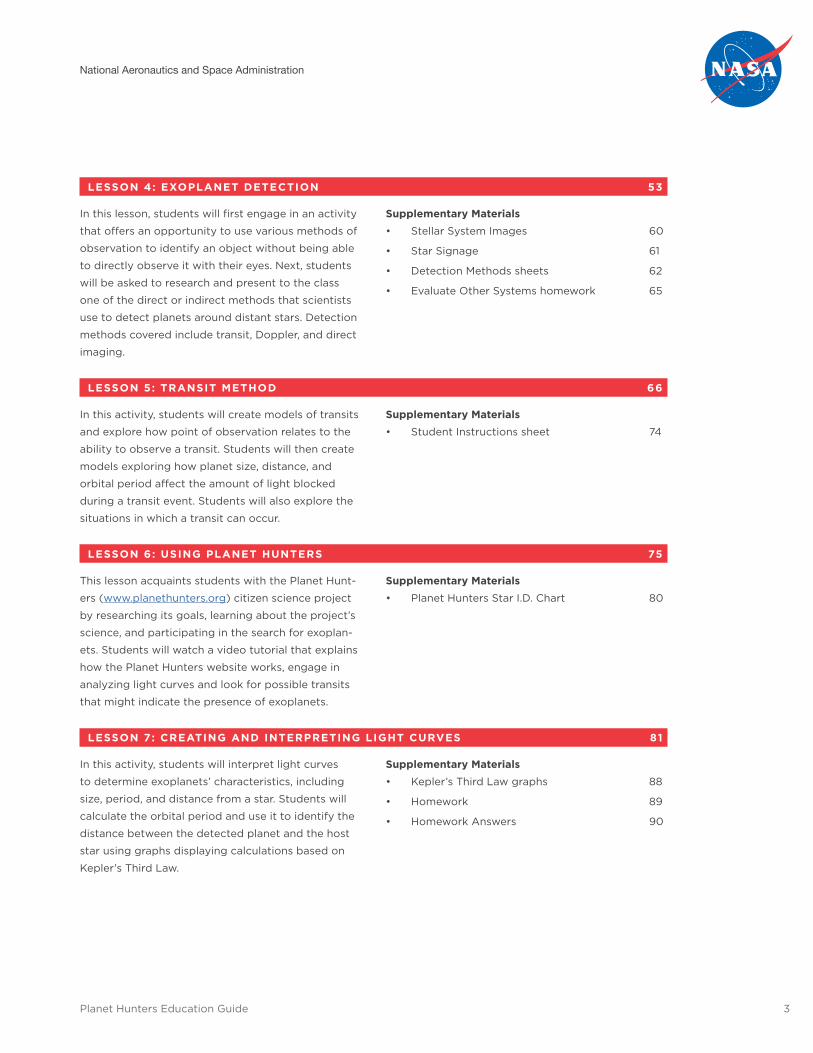
LESSON 4: EXOPLANET DETECTION 53
In this lesson, students will first engage in an activity
that offers an opportunity to use various methods of
observation to identify an object without being able
to directly observe it with their eyes. Next, students
will be asked to research and present to the class
one of the direct or indirect methods that scientists
use to detect planets around distant stars. Detection
methods covered include transit, Doppler, and direct
imaging.
Supplementary Materials• Stellar System Images 60
• Star Signage 61
• Detection Methods sheets 62
• Evaluate Other Systems homework 65
LESSON 5: TRANSIT METHOD 66
In this activity, students will create models of transits
and explore how point of observation relates to the
ability to observe a transit. Students will then create
models exploring how planet size, distance, and
orbital period affect the amount of light blocked
during a transit event. Students will also explore the
situations in which a transit can occur.
Supplementary Materials• Student Instructions sheet 74
LESSON 6: USING PLANET HUNTERS 75
This lesson acquaints students with the Planet Hunt-
ers (www.planethunters.org) citizen science project
by researching its goals, learning about the project’s
science, and participating in the search for exoplan-
ets. Students will watch a video tutorial that explains
how the Planet Hunters website works, engage in
analyzing light curves and look for possible transits
that might indicate the presence of exoplanets.
Supplementary Materials• Planet Hunters Star I.D. Chart 80
LESSON 7: CREATING AND INTERPRETING LIGHT CURVES 81
In this activity, students will interpret light curves
to determine exoplanets’ characteristics, including
size, period, and distance from a star. Students will
calculate the orbital period and use it to identify the
distance between the detected planet and the host
star using graphs displaying calculations based on
Kepler’s Third Law.
Supplementary Materials• Kepler’s Third Law graphs 88
• Homework 89
• Homework Answers 90
National Aeronautics and Space Administration
Planet Hunters Education Guide 4
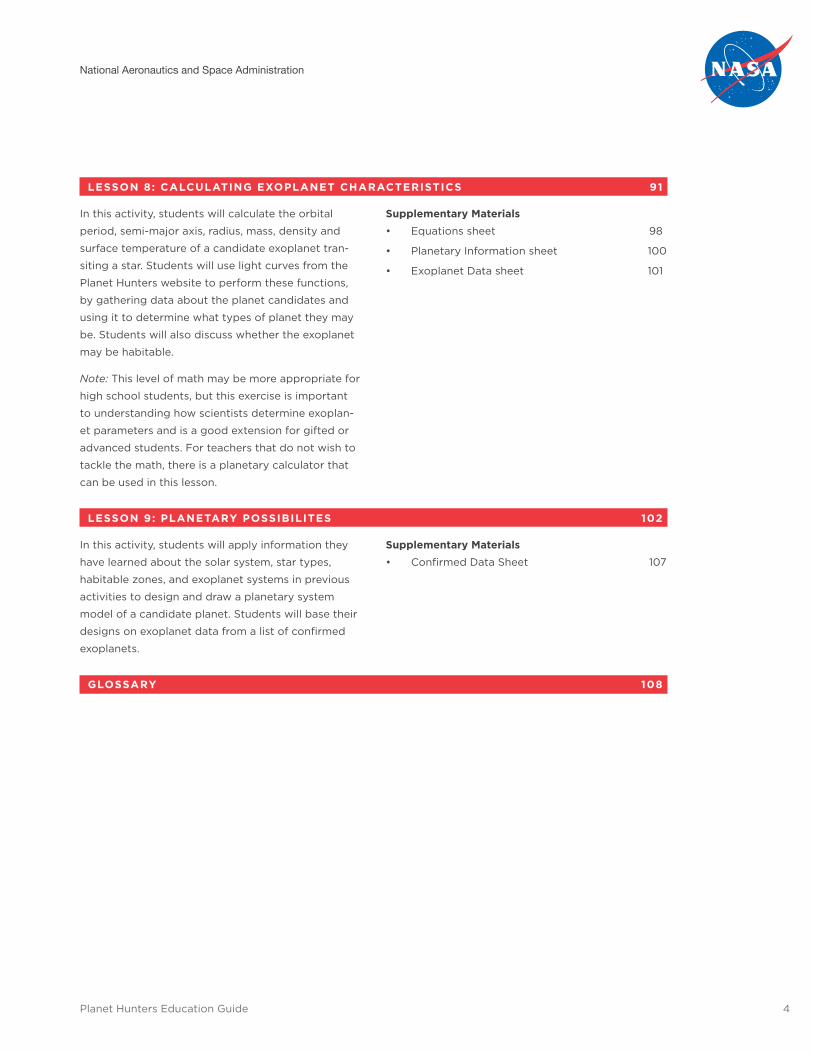
LESSON 8: CALCULATING EXOPLANET CHARACTERISTICS 91
In this activity, students will calculate the orbital
period, semi-major axis, radius, mass, density and
surface temperature of a candidate exoplanet tran-
siting a star. Students will use light curves from the
Planet Hunters website to perform these functions,
by gathering data about the planet candidates and
using it to determine what types of planet they may
be. Students will also discuss whether the exoplanet
may be habitable.
Note: This level of math may be more appropriate for
high school students, but this exercise is important
to understanding how scientists determine exoplan-
et parameters and is a good extension for gifted or
advanced students. For teachers that do not wish to
tackle the math, there is a planetary calculator that
can be used in this lesson.
Supplementary Materials• Equations sheet 98
• Planetary Information sheet 100
• Exoplanet Data sheet 101
LESSON 9: PLANETARY POSSIBILITES 102
In this activity, students will apply information they
have learned about the solar system, star types,
habitable zones, and exoplanet systems in previous
activities to design and draw a planetary system
model of a candidate planet. Students will base their
designs on exoplanet data from a list of confirmed
exoplanets.
Supplementary Materials• Confirmed Data Sheet 107
GLOSSARY 108
National Aeronautics and Space Administration
Planet Hunters Education Guide 5
Planet Hunters Educators Guide Introduction
Bringing real science to the classroom can be empowering for students, but it is challenging to find ways for
classrooms to participate in this type of activity. Citizen science projects can make it easier for teachers to
incorporate real science in classroom science investigations. Citizen science is when crowd sourcing is used to
solve a big data problem by asking the general public to assist scientists in either data collection or data analy-
sis process. Planet Hunters is a citizen science project developed by the Zooniverse and recently NASA and the
Zooniverse collaborated in a rebuild of the project as well as the development of this educator guide.
The activities in this educator guide enable students to study the major concepts involved in finding exoplan-
ets and determining their habitability with the use of models. The models aid in representing how other stellar
systems with exoplanets of varying distances, sizes, and physical properties look to an outside observer. These
models also aid in demonstrating how transits appear in data. This guide was developed with Planet Hunters
classroom use in mind, but could also be adapted for informal education setting.
Upon completion of the lessons in this educator guide, students will know more about citizen science, gain an
understanding of exoplanet detection methods, be able to determine whether an exoplanet can support life as
we know it, interpret data, and propose a mission to a habitable exoplanet. The goal of this guide is to enthuse
students in the search for new worlds and to get them involved in real scientific research.
This curriculum guide was produced by Adler Planetarium under a grant from NASA’s Exoplanet Exploration
Program at the Jet Propulsion Laboratory. Visit the program’s PlanetQuest website: http://planetquest.jpl.nasa.
gov for additional resources for teachers and students and the latest planet-finding news.
National Aeronautics and Space Administration
Planet Hunters Education Guide 6
Lesson 1
What is Citizen Science?
OVERVIEW
Students will participate in an activity demonstrating the benefits of using crowdsourcing to analyze large
datasets. Next they will read articles highlighting examples of actual research occurring using volunteers to
analyze or collect data. In small groups, students will discuss the benefits and challenges of crowdsourcing
science by comparing and contrasting different citizen science projects. Students will debrief as a class with a
discussion in which a definition of citizen science is developed.
STUDENT PREREQUISITE KNOWLEDGE
None
OBJECTIVE
Students will be able to:
• Identify asking questions as an element of doing
scientific research
• Define citizen science
STANDARDS
AAAS Benchmarks: 1B/M1b*, 1B/M2c*, 1C/M1, 1C/M3, 1C/M6*, 1C/M9**(B-
SL), 3A/M2, 3C/M2*, 6A/M8** (BSL)
Common Core: RST 6-8, 2, 10
Next Generations Science Standards: Dimensions:
• Crosscutting Concepts:
° Patterns
• Science and Engineering Practices:
° Asking Questions & Defining Problems
° Obtaining, Evaluating and Communicating
Information
CONCEPTS
Citizen science involves utilizing the efforts of
volunteers, through crowdsourcing, to analyze or
collect data for research purposes.
MATERIALS
• Supplementary materials: Scientist Information
Sheets, Citizen Science Project Descriptions and
Lesson 1 Data Sheet
• Blank paper for drawing
• Drawing and coloring implements
• Computer and ability to project
45–60 minutes
National Aeronautics and Space Administration
Planet Hunters Education Guide 7
PREPARE
• Print enough Scientist Information Sheets so that each group has information about one scientist.
• Print enough copies of the Lesson 1 Data Sheet for each student.
• Print enough copies of the Citizen Science Project Descroptions so that each group has information about
one project. (Alternatively, students could read the about pages online.)
• Familiarize yourself with Zooniverse’s Galaxy Zoo citizen science project (www.galaxyzoo.org) by logging
on and exploring the project. For more detailed information, you may wish to persue the Zookeeping in
Galaxy Zoo teacher guide available at http://bit.ly/1oxPakr
BACKGROUND
What is Citizen Science?
Citizen science is a broad idea that members of the public who do not possess specialized training can partici-
pate in scientific research. Citizen science projects may involve collecting data, analyzing data, or both. A list of
projects is available at the end of the lesson under Additional Resources.
Collecting Data
One of the earliest citizen science projects was the Christmas Bird Count organized by the National Audubon
Society in 1900. For over a hundred years, volunteers have braved the winter weather to count birds resulting
in a data set that provides conservationists with vital information about the long-term trends in bird popula-
tions across North America. The advent of the internet means that you can now upload your Christmas Bird
Count data online, or choose to monitor your local bird population all year round using eBird, an online tool
developed by the Cornell Lab of Ornithology. Volunteers are contributing huge quantities of valuable data that
could not be collected by only a handful of scientists.
Analyzing Data
In addition to making it easier for volunteers to submit data to citizen science projects like eBird, The Great
Sunflower Project and CoCoRaHS (Community Collaborative Rain, Hail & Snow Network), the internet has also
made it possible to do another type of citizen science. Projects like Galaxy Zoo or Foldit require volunteers to
perform an analysis task on large data sets that scientists already have. In the case of Galaxy Zoo volunteers
are asked to classify galaxy images by answering a few simple questions about the shape of the galaxy. The
volunteers do not need to have specialized experience or training to participate.
Too Much Data
Traditionally scientists have done this type of data analysis themselves, however as the amount of data collect-
ed expands, this becomes increasingly impractical. Galaxy Zoo contains images from the Hubble Space Tele-
scope and the Sloan Digital Sky Survey and so far over 1.5 million galaxies have been classified. There are still
many galaxy images left to be classified and the Large Synoptic Survey Telescope, construction of which began
in 2014, will only make matters worse by imaging another 4 billion galaxies! Individual astronomers could never
hope to make a dent in such a massive data set. This problem of too much data is not unique to astronomy:
Seafloor Explorer, a Zooniverse.org project, has over 40 million images of the ocean floor that need to be ana-
lyzed. The two science team members would be unable to answer many interesting research questions if they
did not have volunteers who were willing to identify and measure scallops, fish, sea stars and crustaceans in the
images they have collected from the east coast of North America.
Why Humans Are Better Than Computers
Computers are now able to analyze data and crunch numbers at an astonishing pace, but there are still some
tasks that are better suited to the human brain. In particular humans excel at recognizing patterns, making
National Aeronautics and Space Administration
Planet Hunters Education Guide 8
them particularly adept at identifying faces, objects, words and sounds. Computers are now sometimes being
used to identify faces, but this extremely expensive technology still only works in ideal conditions and generally
fails where lighting is poor or where faces are turned to the side.
Images used for scientific research, for example of galaxies or wildlife, are rarely ideal. Try getting a zebra to
pose for a snapshot, or asking a galaxy to tilt a little to the left! Computers fail to identify them correctly, yet
most humans can identify a zebra, even if only half the animal is visible in a poorly lit image. Many citizen sci-
ence projects depend on the ability of volunteers to recognize patterns in scientific data. Some of the projects,
such as Galaxy Zoo, Snapshot Serengeti or Seafloor Explorer, require volunteers to identify objects in images.
Other projects, such as Whale FM or Bat Detective need people to identify sounds, while Old Weather and An-
cient Lives utilize the human ability to identify words and letters and to decipher hand-written data sources.
Spotting the Unusual In addition to possessing remarkable pattern recognition skills, the human brain is particularly good at spotting
the unusual, unlike computers, which will only identify exactly what they have been asked to. This can lead to
unexpected discoveries, like in the case of the Galaxy Zoo ‘Green Peas.’ Volunteers were able to identify an
entirely new type of galaxy that astronomers didn’t know existed. This galaxy looked more like a star in images,
but had an unusual green tint. Volunteers were able to make a collection of these objects and study them
further; a computer would have ignored them. Another remarkable discovery was made by a school teacher,
Hanny Van Arkel. She noticed a strange “voorwerp,” which is the Dutch for ‘thingy’, next to a galaxy in an im-
age. This turned out to be an entirely new type of galaxy object the likes of which had never been seen before.
Time will tell if unusual discoveries are routinely made by citizen scientists, but many of the science teams who
provide data for analysis are hopeful.
Zooniverse: a collection of citizen science projects
Both Seafloor Explorer and Galaxy Zoo are part of a collection of citizen science projects built by a team of
web developers, designers, educators and scientists known as the Zooniverse. The first project, Galaxy Zoo,
was built in 2008, and they have since then built over 20 projects, with more coming online regularly.
All of the projects built by the Zooniverse are data-analysis projects, though the type of analysis volunteers are
asked to undertake varies depending on the requirements of the science team doing the research. Planet Hunt-
ers asks volunteers to look for dips in light curves taken by the Kepler Space Telescope, whereas Old Weather
requires participants to transcribe ships’ logs. Visit Zooniverse.org for a current list, as new projects often come
online and some projects are retired. Projects can be retired because there is no more data left to be analyzed
or because, as in the case of Galaxy Zoo Supernovae, computers’ technology has improved so that humans are
no longer needed to do the analysis.
What’s In It For Me?
As well as the obvious advantages for scientists, there are benefits for the citizens, allowing them to participate
in research that before was reserved only for the highly trained. It fosters a sense of curiosity in people, engag-
ing them very practically in practicing science that connects them in a very real way in exploring the universe
around them. This experience begins to shift the boundaries for people who do not consider themselves scien-
tists, changing their understanding of what it means to “do science” and what a scientist really is. They experi-
ence that science is for everyone and can be achieved through the asking of questions and observing phenom-
enon. (And for the younger group, citizen science can possibly bring out interest in science as a career.)
ENGAGE (5 – 10 MINUTES)
Note: As a time saver you may choose to have students draw the picture of a scientist ahead of time.
1. Pass out blank paper and drawing utensils to students. Instruct them to draw what they think a scientist
looks like.
2. After they have completed their drawings ask them, what does your scientist look like? What makes them
look like a scientist?
• What are they wearing? [Lab coat? Glasses? Beakers and chemicals?]
• What do they look like? [Male or female?]
EXPLORE (15 – 20 MINUTES)
1. Break the class up into groups of 3 – 4 students. Give each group copies of one of the Scientist Informa-
tion Sheets. You may choose a subset of these scientists depending on time and size of your class. Some
groups may have the same Scientist Information Sheet.
• Have each group read through their Scientist Information Sheet together. Tell them each group will
have one minute to share the information they learn with the rest of the class.
• Have each group summarize their scientist to the class. If more than one group of students reads an
information sheet, allow each group to contribute.
2. Reassemble the small groups and distribute copies of the Lesson 1 Data Sheet to each group. Each group
should discuss and answer the following questions while a note taker writes down answers on the data
sheet:
• What are some ways that all these scientists are similar?
• What are some ways that these scientists are different?
• Describe how scientists ‘do science.’
3. Facilitate a class discussion where groups share their answers; record student ideas on the board.
• Students should identify the following points:
i. All scientists ask questions and collect data to try and answer those questions.
ii. Scientists are interested in studying different topics.
4. Ask the class to share examples of times they have acted like a scientist by asking questions and gathering
information.
Planet Hunters Education Guide 9
National Aeronautics and Space Administration
Planet Hunters Education Guide 10
EXPLAIN (10 – 15 MINUTES)
1. Introduce citizen science being sure to discuss the following points:
• Some scientists have enormous data sets that are too large to be analyzed by individuals.
• Computers are not able to analyze all types of data for scientists. Humans are better at some tasks,
like recognizing shapes or spotting things that are unusual.
• Some scientists need enormous amounts of data to be collected.
• The technology does not always exist to collect the data that scientists need.
• For some projects, websites have been built to allow volunteers to help scientists analyze or collect
data.
2. Introduce the citizen science project Galaxy Zoo to the class. Tell students that this is an example of a citi-
zen science project where professional scientists work with citizen scientists to make discoveries together.
Introduce the following points:
• (Optional) Ask students if anybody know the name of the galaxy that our solar system is par of. [The
Milky Way]
• (Optional) Explain that a galaxy is made up of billions of stars, dust, gas, and other astronomical ob-
jects all held together by gravity. There are billions of galaxies in the universe.
• Galaxy Zoo is an online citizen science project.
• Astronomers working on Galaxy Zoo want to answer questions such as, ‘How do galaxies form?’
• To figure this out, they need to classify galaxies into shapes. They do this by making observations
of images of galaxies. These images are taken with powerful telescopes like the Sloan Digital Sky
Survey.
3. Model how to do a classification on Galaxy Zoo. As a class, do a couple of classifications on Galaxy Zoo
asking students to vote on the answers to the questions being asked. Use the Example button in the classi-
fication interface to find more information about how to answer each question.
4. Facilitate a group discussion including the following points and questions:
• Describe what all scientists do. [Ask questions and collect data/conduct research to answer their
questions.]
• How did the classifications we made in Galaxy Zoo help scientists with asking questions or collecting
data?
National Aeronautics and Space Administration
Planet Hunters Education Guide 11
ELABORATE (15 MINUTES)
1. Distribute information on various citizen science projects (Snapshot Serengeti, Monarch Larva Monitoring
Project, Sunspotters, and the Great Sunflower Project), or have students access the sites online.
2. In their small groups students should identify the following:
• What are scientists trying to learn more about with this citizen science project?
• What kind of data or information are these scientists using in this project?
• Where is the data coming from?
• What are volunteer citizen scientists being asked to do in this project?
• Describe how professional scientists and citizen scientists are working together to answer the ques-
tion(s).
3. Have groups share each of their citizen science projects and create a class composite for the results.
4. Compare and contrast the different projects.
• What is different about these projects? What is similar?
• How might this be helpful to researchers? How is this helpful to citizens?
EVALUATE (5 MINUTES)
1. With what we have learned about scientists, lets return to our drawing of a scientist.
• Would you change your picture of a scientist at all? What do you see as a scientist? Did this lesson
change their understanding of what makes a scientist who they are?
• How would you draw a citizen scientist? Does anything about being a citizen scientist make them
look different from anyone in this classroom?
National Aeronautics and Space Administration
Planet Hunters Education Guide 12
EXTENSION ACTIVITIES
1. Share the blog article of Hanny van Arkel and her Voorwerp, see Voorwerp. Alternatively, there is a sum-
mary of the article below; this could be projected and read together as a class. Discuss the impact that this
citizen had on scientific discovery.
• How was Hanny able to contribute to this discovery?
• How did she begin?
• Was she an expert?
• How would the story be different if Galaxy Zoo hadn’t been created?
• What outcomes might have been possible?
Article Summary
Hanny van Arkel is a school teacher in the Netherlands who gained interest in using Galaxy Zoo, a citizen
science project from Zooniverse.org that classifies galaxies, from one of her favorite bands, Queen. Brian May
from Queen is not only a musician, but also an astronomer. He wrote about Galaxy Zoo and this got Hanny
interested in looking into the citizen science project. When she first started classifying galaxies, she found an
image that had an odd green thing in it. She called it a Voorwerp, which is Dutch for “thing.” She asked the
astronomers about it, but they had never seen anything like it. After careful study of the image, astronomers
confirmed that what Hanny had discovered was a gas cloud that was being affected by the black hole at the
center of the galaxy she was classifying. The black hole must have been a “sloppy eater” earlier in its life, mean-
ing that, “as material falls in, it piles up in a disk outside the Final Plunge; this disk heats up, and various forces
can combine to create huge jets of energy and matter that scream out in opposite directions.” These energetic
jets were slamming into a near by gas cloud causing it to glow green. Even though the jets are no longer visible
the gas cloud (or Voorwerp), “is still glowing, because it takes thin gas a long time to lose its glow, but eventu-
ally it will stop glowing too.” Nothing like this has been seen before. Hanny was not a professional astronomer,
but she was able to make an important contribution to science through Galaxy Zoo.
2. Share with students the outcomes of Galaxy Zoo research from Sloan Digital Sky Survey (http://www.
galaxyzoo.org/#/story), how many images were 150,000 people able to classify in a year. Find the average
number of images viewed in one day. Ask them to estimate how many one person would be able to do in a
day. Thirty people?
• What would be the value of having citizens assist with this part of research? What would that mean
for the scientists involved?
• Look at some of the data from the class discussion to support conversations about how actual scien-
tists may use the citizen scientists’ findings.

National Aeronautics and Space Administration
Planet Hunters Education Guide 13
ADDITIONAL RESOURCES
1. Scientific occupation description:
• http://astroventure.arc.nasa.gov/teachers/fact_sheets.html#generic
2. Story of Hanny’s Voorwerp
• http://blogs.discovermagazine.com/badastronomy/2011/01/11/voorwerp/#.UUiOVaUz3ao
3. Citizen science projects that require data analysis.
• http://blog.eyewire.org/about/ [must create an account to use project]
• http://fold.it/portal/
• https://www.zooniverse.org/
4. Citizen science projects that require data collection.
• http://ebird.org/
• http://www.cocorahs.org/
5. Additional articles about citizen science projects.
• http://www.wired.com/medtech/genetics/magazine/17-05/ff_protein?currentPage=all
• http://news.bbc.co.uk/2/hi/science/nature/6289474.stm
• http://www.npr.org/2013/03/05/173435599/wanna-play-computer-gamers-help-pushfrontier-of-
brain-research
• http://www.scientificamerican.com/citizen-science/
• http://www.nature.com/naturejobs/science/articles/10.1038/nj7444-259a
• http://chronicle.com/article/Crowdsourcing-a-Honey-of-an/65705/
• http://news.yale.edu/2009/07/27/galaxy-zoo-hunters-help-astronomers-discoverrare-green-pea-gal-
axies
National Aeronautics and Space Administration
Planet Hunters Education Guide 14
CITIZEN SCIENCE PROJECT DESCIPTIONS
Snapshot Serengeti This information is adapted from content contained on the Snapshot Serengeti website accessed on 9/24/2014
(http://www.snapshotserengeti.org/ ).
Ecologists are scientists that study how plants, animals, and other organisms interact with each other and their
environment. Ecologists at the University of Minnesota Lion Project want to know more about how animals
in Serengeti National Park interact with each other. Serengeti National Park is a wildlife reserve in Tanzania in
Eastern Africa. It is home to many species of carnivores (meat eaters) including lions and cheetahs. There are
also many species of herbivores (plant eaters) including elephants, gazelles, and giraffes. Lion Project ecolo-
gists want to learn more about how these animals interact with each other.
Snapshot Serengeti is an online citizen science project that helps ecologists learn more about the carnivores
and herbivores living in Serengeti National Park. Hundreds of cameras are set-up around the park. Each camera
is attached to a motion sensor. When an animal moves, the camera takes a picture. Volunteer citizen scientists
look at these pictures on the Snapshot Serengeti website and identify the types, numbers, and behaviors of an-
imals present. We know where each camera is located and when each picture was taken. After volunteers look
at each image the ecologists have a record of where, when, and which animals were present.
National Aeronautics and Space Administration
Planet Hunters Education Guide 15
CITIZEN SCIENCE PROJECT DESCIPTIONS
Monarch Larva Monitoring Project This information is adapted from content contained on the Monarch Larva Monitoring Project website accessed
on 9/24/2014 (http://www.mlmp.org/).
Researchers at the University of Minnesota’s Monarch Larva Monitoring Project study monarch butterflies. They
study how the monarch butterfly population changes over time across North America. To do this, researchers
need information about monarch butterfly eggs and larvae from lots of different places.
There are only a few researchers on the team and they need a lot of data. To collect the necessary amount
of information, they need citizen science volunteers to help. Volunteers make observations of monarch eggs,
larvae, and milkweed plants at over 1000 sites in the United States, Canada, and Mexico. Volunteers make and
record several observations including the size of the site and amount of rain that falls.. They also make detailed
observations about milkweed, the exclusive food source for monarch larvae
After volunteers record their observations, they send their data to the researchers at the Monarch Larva Moni-
toring Project. Volunteers have been collecting and sharing data with the project for several years. This means
that scientists have the data they need to be able to study changes in the monarch butterfly population.
National Aeronautics and Space Administration
Planet Hunters Education Guide 16
CITIZEN SCIENCE PROJECT DESCIPTIONS
Sunspotter This information is adapted from content contained on the Sunspotter project website accessed on 9/25/2014
(http://www.sunspotter.org).
Our star, the Sun, is very active. Solar physicists are scientists who study the sun’s activity. Sunspots are one
example of the Sun’s activity. A sunspot is a dark area that temporarily appears on the Sun’s surface. They are
caused by the Sun’s intense magnetic activity. Even though the Sun is 150 million km (93 million miles) away,
its magnetic activity affects us here on Earth. Eruptions from sunspot groups produce X-Rays and high-energy
particles that can damage satellites orbiting Earth and to the electric grid. This means you’re your cell phone
might not work. X-Rays and high-energy particles also endanger astronauts and aircrafts by exposing them to
radiation.
Solar physicists study sunspots to better understand and predict how the Sun’s magnetic activity affects us on
Earth. They need to compare images of sunspots. Computers are not good at comparing these images so it is
something that people need to do. Sunspotters is website where citizen science volunteers help solar physicists
study how complex sunspots are. Volunteers compare images of sunspots taken by the Solar and Heliospher-
ic Observatory and choose which image is more complex. More than 12,000 volunteers have participated in
Sunspotters.
National Aeronautics and Space Administration
Planet Hunters Education Guide 17
CITIZEN SCIENCE PROJECT DESCIPTIONS
Community Collaborative Rain, Hail and Snow Network (CoCoRaHS) This information is adapted from content contained on the CoCoRaHS project website accessed on 9/25/2014
(http://www.cocorahs.org)
Many scientists need weather data to do their research. Precipitation, or when water falls to the Earth’s surface,
is an important part of weather data. Snow, rain, hail, and sleet are all forms of precipitation. Meteorologists
and hydrologists are examples of scientists who need data about precipitation. Meteorologists are scientists
who study the weather while hydrologists study how water moves across and through Earth’s crust.
Some hydrologists and meteorologists study droughts. A drought is when there is less precipitation over time
than expected. Droughts affect us in many different ways. Farmers’ may experience decreases in how many
crops they can grow. Sometimes this causes food prices to rise. Long droughts may lead to water use restric-
tions. Wildlife may experience food shortages because there isn’t enough water for their food to grow.. Infor-
mation about precipitation over time helps scientists understand and predict drought.
The Community Collaborative Rain, Hail, and Snow Network (CoCoRaHS) is a citizen science project where
volunteers measure and map precipitation rates in their local communities across the United States, Canada,
and Puerto Rico. Volunteers participate in an in-person or online training session to learn how to make detailed
observations of snow, rain, hail, and sleet. They learn to install and use simple tools like rain gauges. After vol-
unteers collect the data, it is submitted to CoCoRaHS and is available for anybody to use. In fact CoCoRaHS is
the largest providers of daily meteorological data that scientists use in their research!
using c
the imp
ortant p
h
think the ob
jects loo
k lik
ob
jects thr
I am a theo
r
Ho
loo
k lik
oft
see
because an
I pa
ques
W theory o
f ho
inf
mo
ther
close t
"e W ques
W c T
. So
metim
es the thing I'm
mo
deling
hasn't been o
bserv
v
Job
T
Dr
en m
ha orm
a
x
writ
I dehen w
heor
. Alis
Nam
e:
w d
o y
e
om
put
.
y close a
y mo
dels p
r
tions
part o
f yom
put
e! Did
the
oug
h t
ou c
t kind o
f da
e in
orking
a
o their s
museum
visit
etical As
itle:
sa Bans
tion w
w
op
lanets"), w
y
tretical as
elesc
Identify o
ne or tw
tions.
help m
e learn mo
r
v
er r
Describ
e wha
er r
op
h
ollect this d
a
od
uc
y mo
dels I c
?
ar
our rw
our o
dsentio
n ttt e g
a
y f
esear
ors, t
tr
outines tha
sics, and I so
lv
ta/inf
ther fr
orm
ther
ch:
. I ga
e
op
es, I use c
e
o q
ues
y
ta
om
e up w
ith need t
o w
ha
orm
a er? I'm
also int
t I'v
?
wn so
lar s esy t
e writt
ther the basic eq
ua
t, which m
eans inssicis
edictio
ns of w
hae p
r t other as
tion d
o y
s
tars. I am trying
t
e see a lot o
f lare those eq
ua
tem f
om
these e
, or d
id the
e find
planets o
rbiting
ar
tions thao
fig
ur
e scientific p
apers so
other as
om
put
t y
tr
tr
ou g
a
orm
ed.
yo
planet s
x
en.
o try t
ed in fi
guring
out ho
y f
ge Jup
ite out ho
er-siz
ound
other s
ou arers and
ma
o b
e c
ther t
t the t
st
orm
elsewher
e trying t
elling them
abo
ut the scienc
t the planetarium
means I also
spend
time int
ono
mers can r
e abo
ut a subject, and
when m
outines t
t a T op
ho t
heor
y
t those m
od
els. I also r
es
sicist a
tretical A
s
t the Aop
hysicis
tions either b
tions tha
t
t do
es:ead o
f ob
serving
elesc o ans
w tho
se lar
tars in spaco
pe d
a
ed y w
ead ab
out m
y mo
dels ar
ta should
et, so
y ww
tent with w
hat wo
nsis
dler P
lanetarium
th t
ono
mers see w
ith t
w w
e can use the
called
w
e and so
meho
ed p
lanets sitting v
o the
ge p
lanets go
t
e (w
e I do
and ans
o fi
nd the ans
o m
od
el wha
er
y hand o
r
elescop
es,
ems and
app
ly it t
t describ
e all
ery er as
ering their
ork. t I
er these
acting w
ith
e finished
I
o
ead scientifi
c pap
ers t
elop
mo
dels and
theories ab
out a p
articular subject and
use
e
ph
W w or
R C
sical da
y
plank
se b
v
think ma
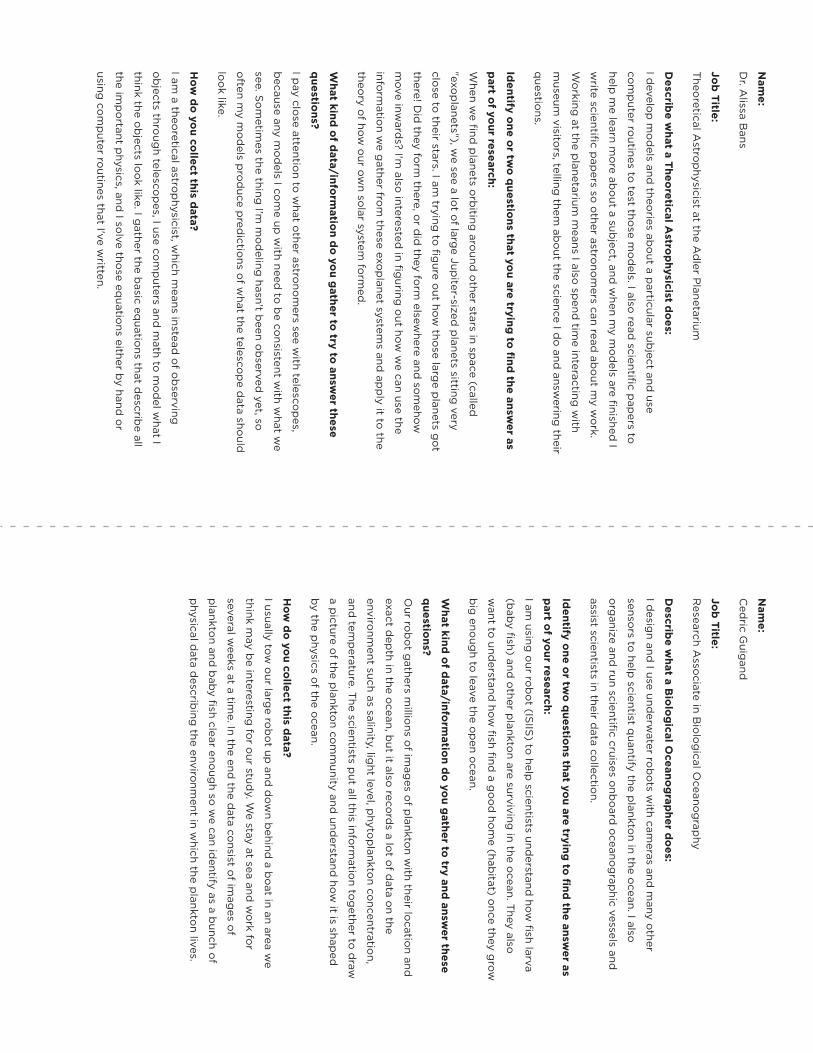
I usually t
How
do
y
y the ph
a pictur
and t
en ex as
er onm
ent such as salinityvir
act dep
th in the oc
Our r
ques
ha
big
enoug
h t
(bab sis
t
ant t
ganiz
esear
Nam
e:on and
bab
al w
part o
f y
sensors t
Job
Title:
o y
ta describ
ing the en
e of the p
lank
aem
per
tionso
u c
ob
ot g
a
eeks a
?
t kind o
f da
o und
ers
I am using
our r
our r
t scientis
y be int
Describ
e wha
edric G
uigand
o help
scientis
ch As
y fish clear eno
ugh so
w
t a time
er
w o
ur lar
Identify o
ne or tw testing
f
ge r
ollect this d
ata
sics of the o
c
turehe scientis
thers millio
ns of im
ages o
f plank
o lea
orm
a
y fish) and
other p
lank
socia. T v
tand hoo
n ct
e the op
en oc
ob
ot (IS
IIS) t
esear
ta/infean, but it also
r
ch:
o q
ues
ts in their dao
r our s
ean.
I desig
n and I use und
erw
?
om
munity and
unders
w fi
sh find
a go
od
hom
e (habita
t
vir
. In the end the d
a
ob
ot up
and d
o
, light le
on ar
tions tha
ta c
ean.
t quantify the p
lank
a
e in Bio
log
ical Oc
v
tion d
o y
er rt
t a Bio
log
ical Oc
onm
ent in which the p
lank
tudy. W
el, ph
ecor
ou g
ata c
e s
e and run scientifi
c cruises onb
oar
yttaonsis
y a
ts put all this inf
wn b
ehind a b
oa
orm
a
on c
to
planktio
n t
ds a lo
t of d
a
t
ther t
tand ho
e surviving in the o
c
o help
scientis
t y
ollectio
n.
eanog
rou ar
t
ob
ots w
ith camer
apher d
oes:
eanog
rts unders
on in the o
c
onc
ta on the
on w
ith their loca
e trying t
d o
c
aphy
t sea and w
aphic vo
rk f
entr
wo
try and ans
eanog
r
t of im
ages o
f
tand ho
as and m
an
t in an ar
t) onc
ean. Theo
n livt
og
ether t a
e the
o fi
nd the ans
es
or
w
ean. I also es.
e can identify as a b
unch of
ea w
w it is shap
ed
o d
r
tion and
y also
y other
e a
tion,
y gro a
w fi
sh larv
w
er these w
er as
sels and
Nam
e:
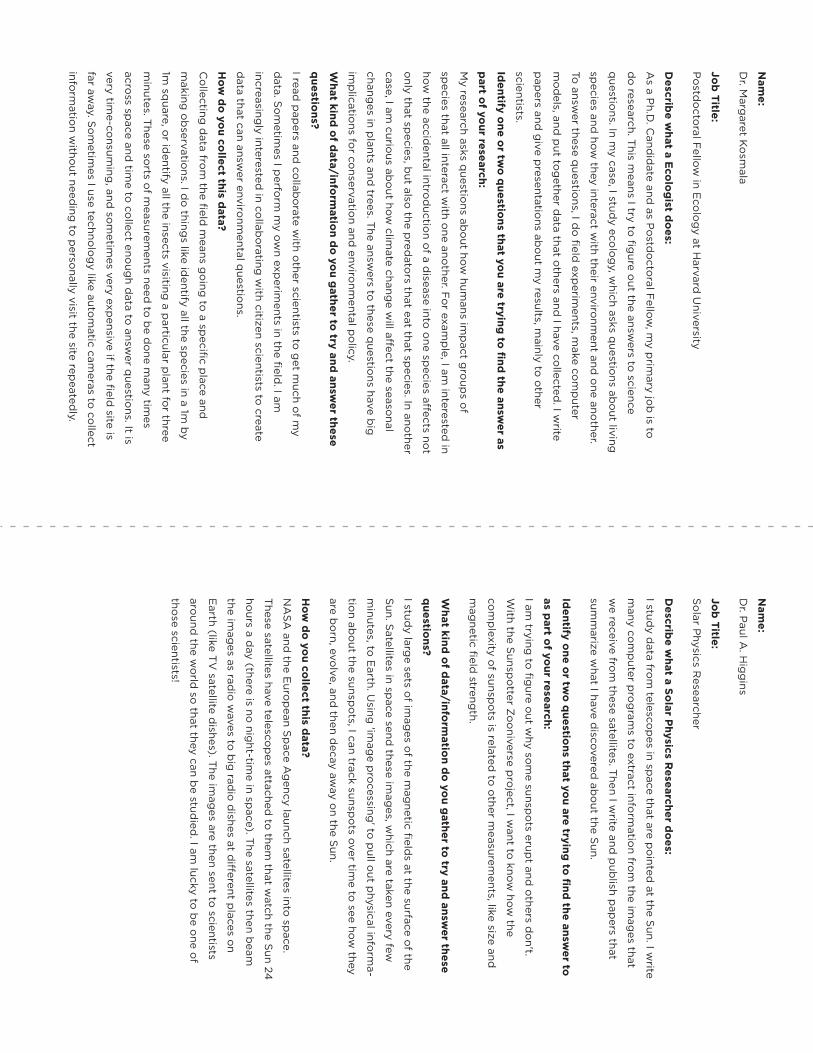
Dr. M
argaret K
osm
ala
Job
Title:
Po
stdo
ctoral F
ellow
in Eco
log
y at Harvard
University
Describ
e what a E
colo
gist d
oes:
As a P
h.D. C
andid
ate and as P
ostd
octo
ral Fello
w, m
y prim
ary job
is to
do
research. This m
eans I try to fi
gure o
ut the answers to
science
questio
ns. In my case, I stud
y ecolo
gy, w
hich asks questio
ns abo
ut living
species and
how
they interact with their enviro
nment and
one ano
ther.
To answ
er these questio
ns, I do
field
experim
ents, make co
mp
uter
mo
dels, and
put to
gether d
ata that others and
I have collected
. I write
pap
ers and g
ive presentatio
ns abo
ut my results, m
ainly to o
ther
scientists.
Identify o
ne or tw
o q
uestions that yo
u are trying to
find
the answer as
part o
f your research:
My research asks q
uestions ab
out ho
w hum
ans imp
act gro
ups o
f
species that all interact w
ith one ano
ther. Fo
r examp
le, I am interested
in
how
the accidental intro
ductio
n of a d
isease into o
ne species aff
ects not
only that sp
ecies, but also
the pred
ators that eat that sp
ecies. In another
case, I am curio
us abo
ut how
climate chang
e will aff
ect the seasonal
changes in p
lants and trees. T
he answers to
these questio
ns have big
imp
lications fo
r conservatio
n and enviro
nmental p
olicy.
What kind
of d
ata/inform
ation d
o yo
u gather to
try and answ
er these
questio
ns?
I read p
apers and
collab
orate w
ith other scientists to
get m
uch of m
y
data. S
om
etimes I p
erform
my o
wn exp
eriments in the fi
eld. I am
increasingly interested
in collab
orating
with citizen scientists to
create
data that can answ
er environm
ental questio
ns.
How
do
you co
llect this data?
Co
llecting d
ata from
the field
means g
oing
to a sp
ecific p
lace and
making
ob
servations. I d
o thing
s like identify all the sp
ecies in a 1m b
y
1m sq
uare, or id
entify all the insects visiting a p
articular plant fo
r three
minutes. T
hese sorts o
f measurem
ents need to
be d
one m
any times
across sp
ace and tim
e to co
llect enoug
h data to
answer q
uestions. It is
very time-co
nsuming
, and so
metim
es very expensive if the fi
eld site is
far away. S
om
etimes I use techno
log
y like autom
atic cameras to
collect
inform
ation w
ithout need
ing to
perso
nally visit the site repeated
ly.
Nam
e:
Dr. P
aul A. H
igg
ins
Job
Title:
So
lar Physics R
esearcher
Describ
e what a So
lar Physics R
esearcher do
es:
I study d
ata from
telescop
es in space that are p
ointed
at the Sun. I w
rite
many co
mp
uter pro
gram
s to extract info
rmatio
n from
the imag
es that
we receive fro
m these satellites. T
hen I write and
pub
lish pap
ers that
summ
arize what I have d
iscovered ab
out the S
un.
Identify o
ne or tw
o q
uestions that yo
u are trying to
find
the answer to
as part o
f your research:
I am trying
to fi
gure o
ut why so
me sunsp
ots erup
t and o
thers do
n't.
With the S
unspo
tter Zo
oniverse p
roject, I w
ant to kno
w ho
w the
com
plexity o
f sunspo
ts is related to
other m
easurements, like size and
mag
netic field
strength.
What kind
of d
ata/inform
ation d
o yo
u gather to
try and answ
er these
questio
ns?
I study larg
e sets of im
ages o
f the mag
netic field
s at the surface of the
Sun. S
atellites in space send
these imag
es, which are taken every few
minutes, to
Earth. U
sing 'im
age p
rocessing
' to p
ull out p
hysical inform
a-
tion ab
out the sunsp
ots, I can track sunsp
ots over tim
e to see ho
w they
are bo
rn, evolve, and
then decay aw
ay on the S
un.
How
do
you co
llect this data?
NA
SA
and the E
urop
ean Sp
ace Ag
ency launch satellites into sp
ace.
These satellites have telesco
pes attached
to them
that watch the S
un 24
hours a d
ay (there is no nig
ht-time in sp
ace). The satellites then b
eam
the imag
es as radio
waves to
big
radio
dishes at d
ifferent p
laces on
Earth (like T
V satellite d
ishes). The im
ages are then sent to
scientists
around
the wo
rld so
that they can be stud
ied. I am
lucky to b
e one o
f
those scientists!
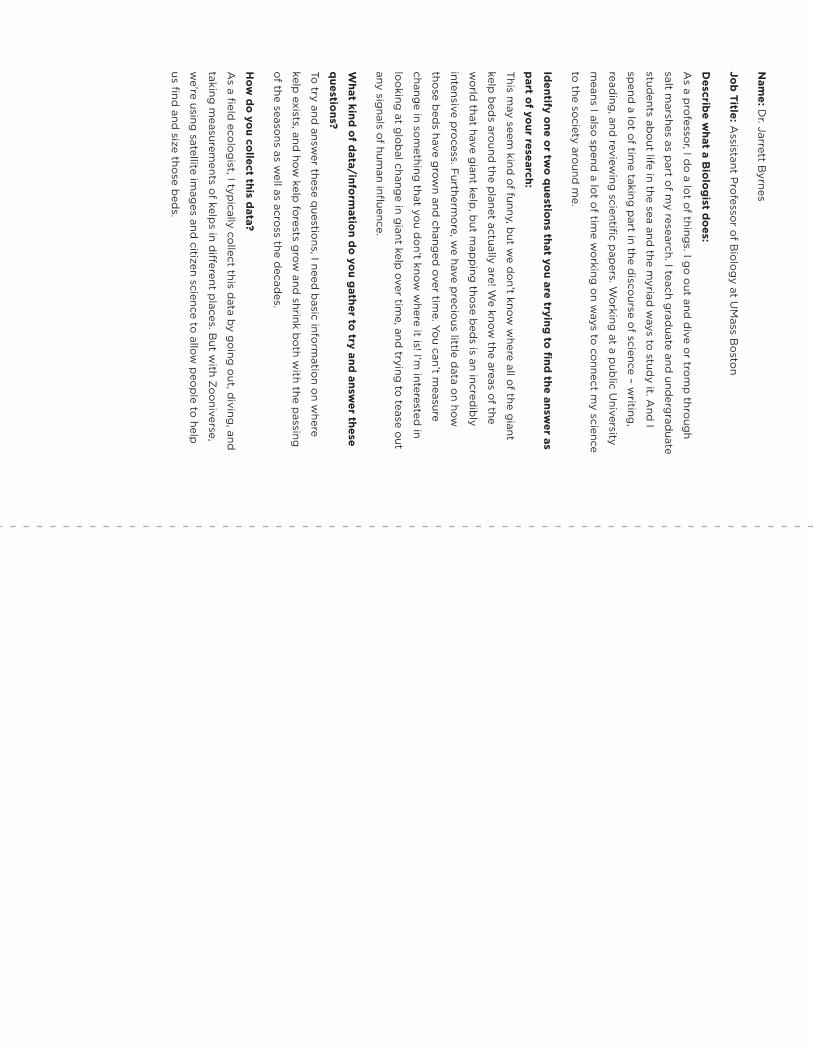
Nam
e: Dr. Jarrett B
yrnes
Job
Title: Assistant P
rofesso
r of B
iolo
gy at U
Mass B
osto
n
Describ
e what a B
iolo
gist d
oes:
As a p
rofesso
r, I do
a lot o
f things. I g
o o
ut and d
ive or tro
mp
throug
h
salt marshes as p
art of m
y research. I teach grad
uate and und
ergrad
uate
students ab
out life in the sea and
the myriad
ways to
study it. A
nd I
spend
a lot o
f time taking
part in the d
iscourse o
f science – writing
,
reading
, and review
ing scientifi
c pap
ers. Wo
rking at a p
ublic U
niversity
means I also
spend
a lot o
f time w
orking
on w
ays to co
nnect my science
to the so
ciety around
me.
Identify o
ne or tw
o q
uestions that yo
u are trying to
find
the answer as
part o
f your research:
This m
ay seem kind
of funny, b
ut we d
on’t kno
w w
here all of the g
iant
kelp b
eds aro
und the p
lanet actually are! We kno
w the areas o
f the
wo
rld that have g
iant kelp, b
ut map
ping
those b
eds is an incred
ibly
intensive pro
cess. Furtherm
ore, w
e have precio
us little data o
n how
those b
eds have g
row
n and chang
ed over tim
e. You can’t m
easure
change in so
mething
that you d
on’t kno
w w
here it is! I’m interested
in
loo
king at g
lob
al change in g
iant kelp over tim
e, and trying
to tease o
ut
any signals o
f human infl
uence.
What kind
of d
ata/inform
ation d
o yo
u gather to
try and answ
er these
questio
ns?
To try and
answer these q
uestions, I need
basic info
rmatio
n on w
here
kelp exists, and
how
kelp fo
rests gro
w and
shrink bo
th with the p
assing
of the seaso
ns as well as acro
ss the decad
es.
How
do
you co
llect this data?
As a fi
eld eco
log
ist, I typically co
llect this data b
y go
ing o
ut, diving
, and
taking m
easurements o
f kelps in d
ifferent p
laces. But w
ith Zo
oniverse,
we’re using
satellite imag
es and citizen science to
allow
peo
ple to
help
us find
and size tho
se bed
s.
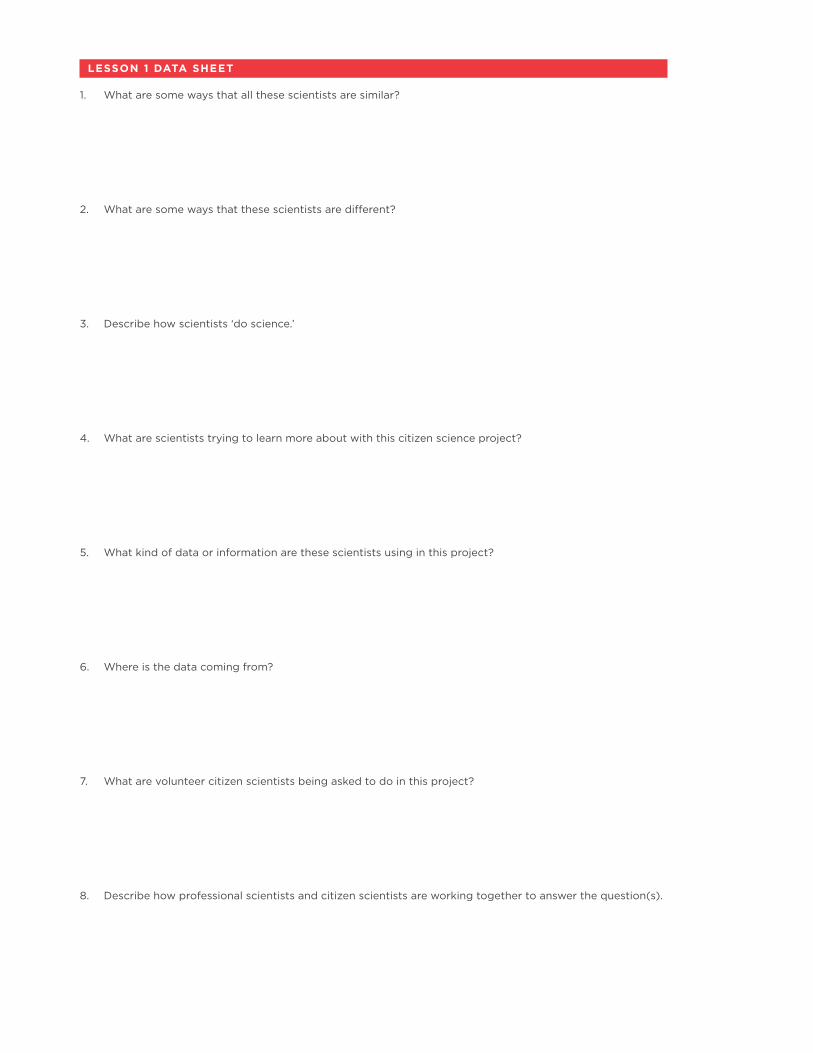
LESSON 1 DATA SHEET
1. What are some ways that all these scientists are similar?
2. What are some ways that these scientists are different?
3. Describe how scientists ‘do science.’
4. What are scientists trying to learn more about with this citizen science project?
5. What kind of data or information are these scientists using in this project?
6. Where is the data coming from?
7. What are volunteer citizen scientists being asked to do in this project?
8. Describe how professional scientists and citizen scientists are working together to answer the question(s).
National Aeronautics and Space Administration
Planet Hunters Education Guide 22
Lesson 2
Life in Our Solar System
OVERVIEW
In this activity, students will participate in a series of deductive activities that will familiarize them with their
own Solar System. Students will explore planetary types, criteria that affect planetary traits, conditions that are
needed for a planet to be habitable, where these conditions exist in our Solar System and how all these things
inform scientists in looking for habitable planets in other stellar systems. Portions of this lesson were adapted
from the Our Place in Space activities produced by the Lunar and Planetary Institute: http://www.lpi.usra.edu/
education/explore/our_place/.
STUDENT PREREQUISITE KNOWLEDGE
Students Should be familiar with:
• The solar system and all of the planets • How life is possible on Earth
OBJECTIVE
Students will be able to:
• Define the “habitable zone” and “exoplanet”
• Identify key features needed to sustain life on a
planet or moon
• Identify criteria for determining the habitable
zone in a stellar system
• Determine which planet or moons in our Solar
System might be able to sustain life
Note: The habitable zone for a star is dependent on its type. In this lesson, we are only focusing on the planets around our star, the Sun. In later lessons, students will explore star types and how that determines the placement of the habitable zone.
CONCEPTS
The habitability of a planet depends on where it is located in its stellar system, existence of a proper atmo-
sphere, sufficient gravity, solid surface (density of the planet) and existence of water.
45–60 minutes
National Aeronautics and Space Administration
Planet Hunters Education Guide 23
STANDARDS
AAAS benchmarks
4A/M3, 4B/M2cd, 11A/M2, 12D/M6**
Common CoreRST 6-8, 1, 2, 7, 8, 9, 10
Next Generations Science Standards Dimensions
• Disciplinary Core Ideas
° ESS1.A, 6-8
° LS2.A, 6-8
• Crosscutting Concepts:
° Patterns
° Cause and Effect
° Scale, Proportion, and Quantity
° System and System Models
° Structure and Function
° Stability and Change
• Science & Engineering
° Asking Questions and Defining Problems
° Analyzing and Interpreting Data
° Engaging in Argument from Evidence
° Obtaining, Evaluating and Communicating Information
MATERIALS
• Solar System Cards (These cards were adapted
from those found in Astrobiology in Your Class-
room, Life on Earth …and elsewhere? Educator
Resource Guide provided by NASA. http://bit.ly/
PHEG2-1 )
• What Makes A World Habitable? sheet (This was
adapted from those found in Astrobiology in
Your Classroom, Life on Earth …and elsewhere?
Educator Resource Guide provided by NASA.
http://bit.ly/PHEG2-1 )
• Investigating Exoplanets sheet
PREPARE
• Print enough copies of the Solar System Cards
so that each student has at least one planet or
other object card and each group has at least
one Earth card.
Note: To print the Solar System cards, center
the image on the sheet to ensure they over lap
properly. Print the front sides first and then feed
the paper back into the printer so that when you
print the back sides they print to the back of
the sheets you have with the front side on them.
Also, you could rearrange the sheets to print 2
sided through a copier.
• Print one copy of What Makes A World Habit-
able? for each student.
• Look up the PlanetQuest site from Jet Propul-
sion Laboratory (http://planetquest.jpl.nasa.gov)
to find the current numbers of candidate and
confirmed planets.
• Print a set of Investigating Exoplanets sheet for
each student.
National Aeronautics and Space Administration
Planet Hunters Education Guide 24
BACKGROUND
Starting Close to Home — Our Solar System
Scientists have long wondered if our Solar System is unique. Could there be planets orbiting around the distant
stars that humans have long observed? Since in the 1990’s astronomers have discovered a myriad of worlds
orbiting stars outside of our Solar System. These planets are called exoplanets. This answer to one of astrono-
my’s oldest questions leads to the increased possibility that perhaps there is life beyond our own planet, Earth.
Astronomers use observations of our Solar System to inform their ideas of what other stellar systems may be
like. Earth is one in a series of planets that are diverse in size, composition and orbital paths. Our system has
eight planets, but only one with life as we know it. What conditions make it possible for Earth to support life?
Why not Venus or Mars? Observing our Solar System stirs many questions about the possibilities there might
be other life in the wider universe, or even in our galaxy. Recent missions to Mars developed out of our curiosity
about the possibilities of life on other planets in our own Solar System. Types of stars are also diverse in size,
brightness and temperature. How do these characteristics factor into whether planets can be found around a
given star? Are only Sun-like stars capable of hosting planets? If those stars have planets, what are the chances
that one could also have life? If there are other stellar systems, can similar conditions to our own be found? Do
they all look and move like ours? What are the possibilities?
Understanding our own Solar System has better informed scientists as to what to look for, what we can expect
to find in a given set of conditions, and when those conditions are just right to support life as it is on Earth.
But, what are those conditions that allow for life to exist on Earth? The most important one is that the condi-
tions are able to support water in its liquid form. Water is the one resource that almost all known forms of life
on Earth, from microbes to mammals, require to flourish. While not all forms of life here depend on water, it is
needed to support the diversity that we experience. As scientists search for other planets, they are using what
they know about Earth-like conditions to look for planets with similar conditions first as a source for life. The
exciting part about discovery is that we may find something completely new that is able to exist in very un-
Earth-like conditions! (If you would like to include lessons about types of life that could exist see the Astrobi-
ology in Your Classroom, Life on Earth …and elsewhere? Educator Resource Guide, link provided in Additional
Resourses.)
Looking for Conditions Supporting Life In looking for planets that could have liquid water on them, scientists look for certain conditions that will sup-
port its presence. First, the elements that water is comprised of, hydrogen and oxygen, need to be present in
sufficient amounts. Second, an atmosphere must be available that not only has these elements as “ingredients,”
but is also the right thickness so that it can insulate the planet, regulating the warmth from the star. Being able
to regulate the star’s warmth will help establish and maintain surface temperatures that allow for water to be
in an accessible liquid state somewhere on the surface, as well as allow the water to be renewed and recycled.
Finally, the surface type and gravity are also important to investigate, as a solid surface with similar gravity to
Earth is required to hold liquid water.
The Habitable Zone
The planet’s distance from the star also plays an important role in regulating temperature. If a planet is too far
from the star, not enough light will reach the planet to allow for surface temperatures to warm to above freez-
ing; too close, and the water would evaporate continually. Finding this range of distance from the star, or zone,
that these conditions could exist is very much like Goldilocks looking for the chair, porridge and bed that were
“just right” for her. This is why the zone that could support life, or habitable zone, is sometimes referred to as
the “Goldilocks zone.” Where that Goldilocks zone is for each star depends on the star’s size and temperature.
National Aeronautics and Space Administration
Planet Hunters Education Guide 25
ENGAGE (10 MINUTES)
1. Facilitate a discussion with the class on what living things (the students, their pets, the ecosystem, etc.)
require to survive. Record what students mention on the board and leave it up for them to reference.
• What do we need to live? [air, liquid water, gravity, solid ground to walk on, food, heat, etc.]
2. Explain to students that there is a certain range of distance around a star that can support the conditions
that are “just right” for water to exist in a liquid state. This range is called the habitable zone.
• What does it mean if something is habitable? Why might calling this distance range the habitable
zone make sense? What would you expect about planets that are found in this zone? What would
you expect to find on a planet located there?
3. Explain that this zone is also known as the Goldilocks zone.
• Why would that name make sense? Where might this idea come from?
EXPLORE (15 MINUTES)
1. Break the class into pairs. Distribute 1 to 2 Solar System Cards to each pair of students, one Earth card to
each group, and What Makes A World Habitable? sheets to each student. Some groups may have the same
cards; this will help them check each other’s work during the class review. The Earth card is to remind
them what makes Earth habitable.
2. Instruct the class to discuss which other planet/moon in our Solar System do they think is most likely to
have life.
• Have them check off “life is likely,” “life is possible,” and “life is impossible” on the sheet.
• Are there any planets that seem incapable of life? In what ways? What conditions might influence
these traits or characteristics?
3. You should go through one of the cards with them (we suggest Mercury, since it has an interesting tem-
perature difference between day and night).
4. Give students 10 minutes to compare.
EXPLAIN (10 MINUTES)
1. Reconvene the class and review the What Makes A World Habitable? sheet.
• Which planets did you find to be likely to have life? Possible to have life? Impossible to have life?
Why?
• What would need to change to make the planet or moon habitable? If it is habitable, what would
make it uninhabitable?
• Which planets are included in the habitable zone of our star? Which planets are not? What would
need to shift for these others to be included?
National Aeronautics and Space Administration
Planet Hunters Education Guide 26
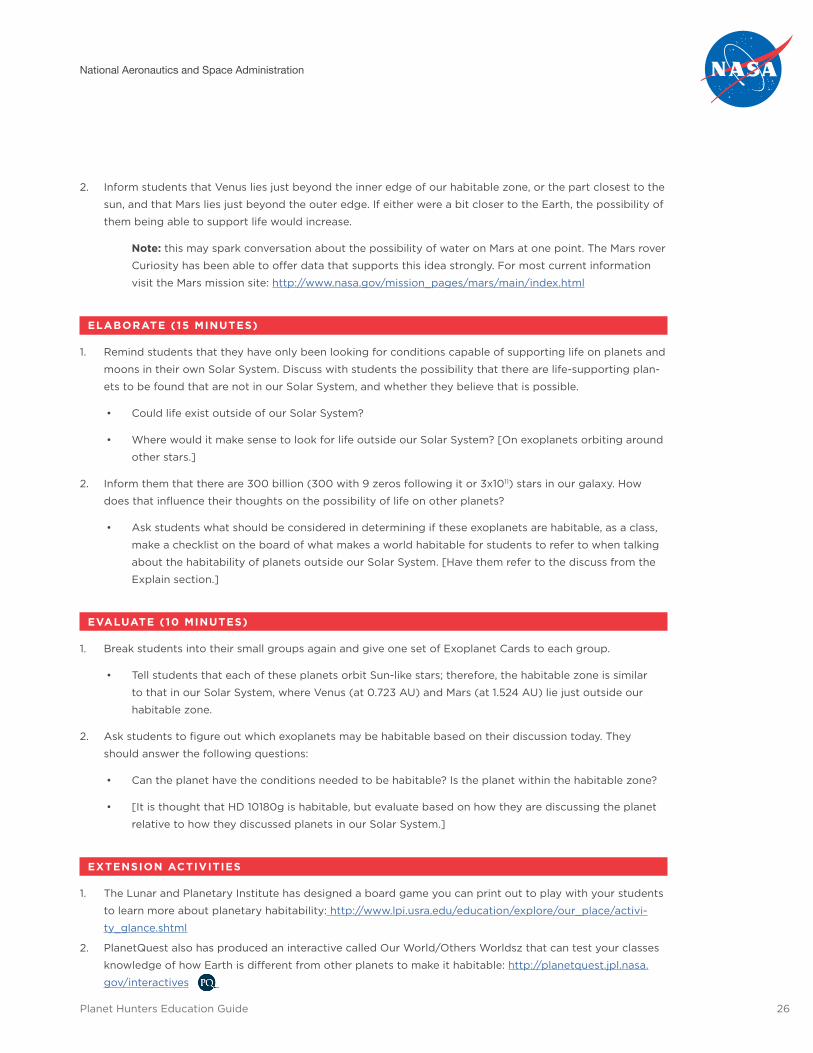
2. Inform students that Venus lies just beyond the inner edge of our habitable zone, or the part closest to the
sun, and that Mars lies just beyond the outer edge. If either were a bit closer to the Earth, the possibility of
them being able to support life would increase.
Note: this may spark conversation about the possibility of water on Mars at one point. The Mars rover
Curiosity has been able to offer data that supports this idea strongly. For most current information
visit the Mars mission site: http://www.nasa.gov/mission_pages/mars/main/index.html
ELABORATE (15 MINUTES)
1. Remind students that they have only been looking for conditions capable of supporting life on planets and
moons in their own Solar System. Discuss with students the possibility that there are life-supporting plan-
ets to be found that are not in our Solar System, and whether they believe that is possible.
• Could life exist outside of our Solar System?
• Where would it make sense to look for life outside our Solar System? [On exoplanets orbiting around
other stars.]
2. Inform them that there are 300 billion (300 with 9 zeros following it or 3x10¹¹) stars in our galaxy. How
does that influence their thoughts on the possibility of life on other planets?
• Ask students what should be considered in determining if these exoplanets are habitable, as a class,
make a checklist on the board of what makes a world habitable for students to refer to when talking
about the habitability of planets outside our Solar System. [Have them refer to the discuss from the
Explain section.]
EVALUATE (10 MINUTES)
1. Break students into their small groups again and give one set of Exoplanet Cards to each group.
• Tell students that each of these planets orbit Sun-like stars; therefore, the habitable zone is similar
to that in our Solar System, where Venus (at 0.723 AU) and Mars (at 1.524 AU) lie just outside our
habitable zone.
2. Ask students to figure out which exoplanets may be habitable based on their discussion today. They
should answer the following questions:
• Can the planet have the conditions needed to be habitable? Is the planet within the habitable zone?
• [It is thought that HD 10180g is habitable, but evaluate based on how they are discussing the planet
relative to how they discussed planets in our Solar System.]
EXTENSION ACTIVITIES
1. The Lunar and Planetary Institute has designed a board game you can print out to play with your students
to learn more about planetary habitability: http://www.lpi.usra.edu/education/explore/our_place/activi-
ty_glance.shtml
2. PlanetQuest also has produced an interactive called Our World/Others Worldsz that can test your classes
knowledge of how Earth is different from other planets to make it habitable: http://planetquest.jpl.nasa.
gov/interactives
National Aeronautics and Space Administration
Planet Hunters Education Guide 27
ADDITIONAL RESOURCES
1. What Makes a World Habitable? Fact sheet from Lunar and Planetary Institute: http://www.lpi.usra.edu/
education/explore/our_place/hab_ref_table.pdf
2. Follow the timeline of exoplanet discovery including different methods using PlanetQuest’s interactive
historic timeline: http://planetquest.jpl.nasa.gov/system/interactable/2/timeline.html
3. Summary of the difference between candidate and confirmed exoplanets: http://planetquest.jpl.nasa.gov/
page/whatsTheDifference
4. Learn more about the Kepler Mission at http://kepler.nasa.gov/
5. For more activities, see the Astrobiology in Your Classroom, Life on Earth …and elsewhere? Educator
Resource Guide provided by NASA: http://astrobiology.nasa.gov/media/medialibrary/2013/10/Astrobiolo-
gy-Educator-Guide-2007.pdf
6. PlanetQuest’s Ways to Die on an Exoplanet: http://planetquest.jpl.nasa.gov/ways-to-die-on-exoplanet
National Aeronautics and Space Administration
Planet Hunters Education Guide 28
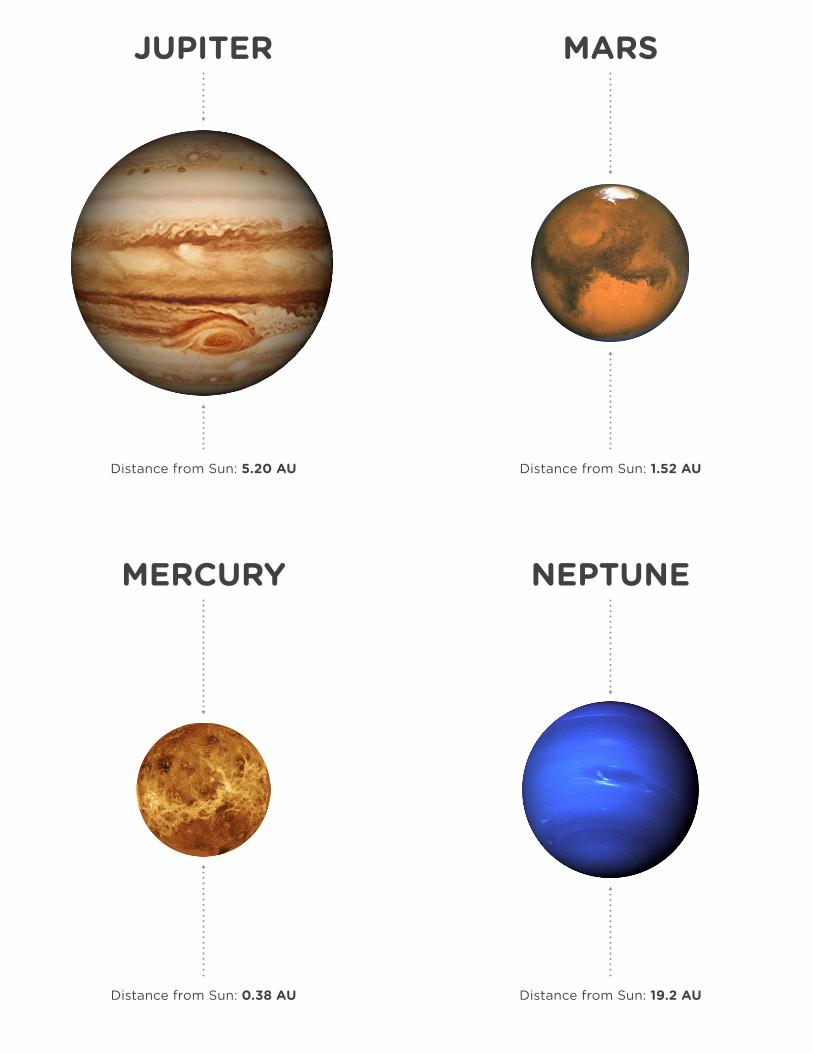
Distance from Sun: 5.20 AU
JUPITER
Distance from Sun: 0.38 AU
MERCURY
Distance from Sun: 1.52 AU
MARS
Distance from Sun: 19.2 AU
NEPTUNE
National Aeronautics and Space Administration
Planet Hunters Education Guide 29
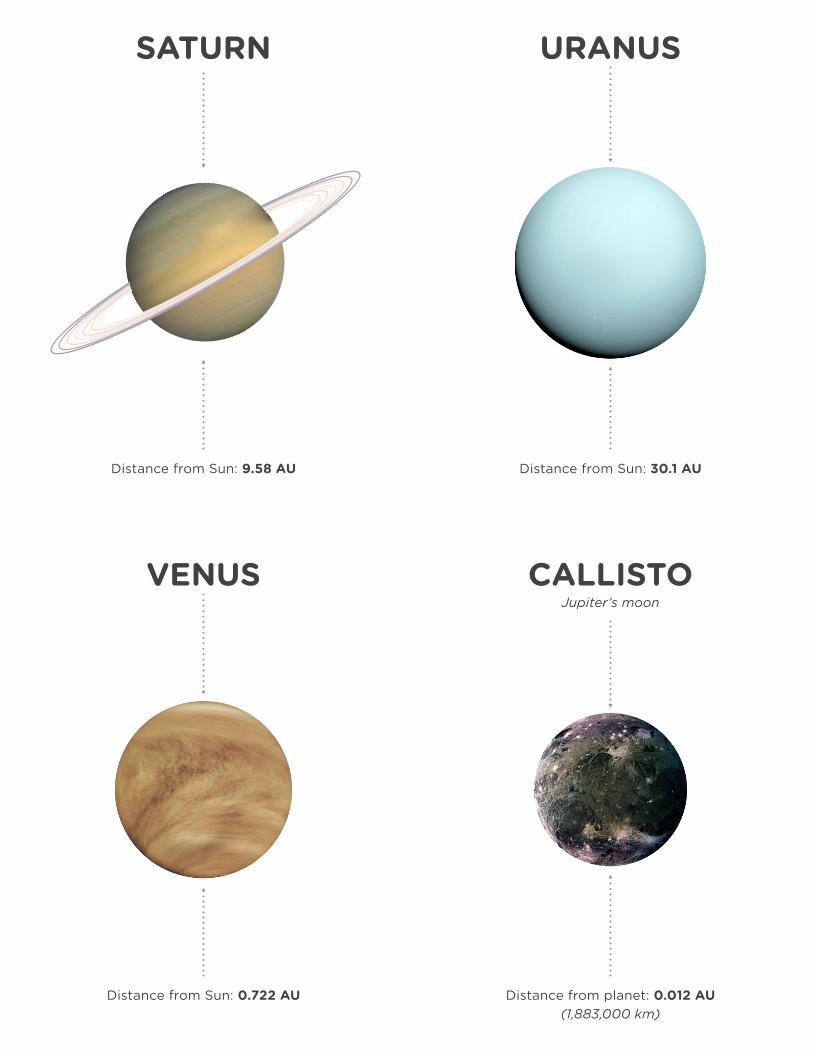
Distance from Sun: 9.58 AU
SATURN
Distance from Sun: 0.722 AU
VENUS
Distance from Sun: 30.1 AU
URANUS
Distance from planet: 0.012 AU(1,883,000 km)
CALLISTOJupiter’s moon
National Aeronautics and Space Administration
Planet Hunters Education Guide 30
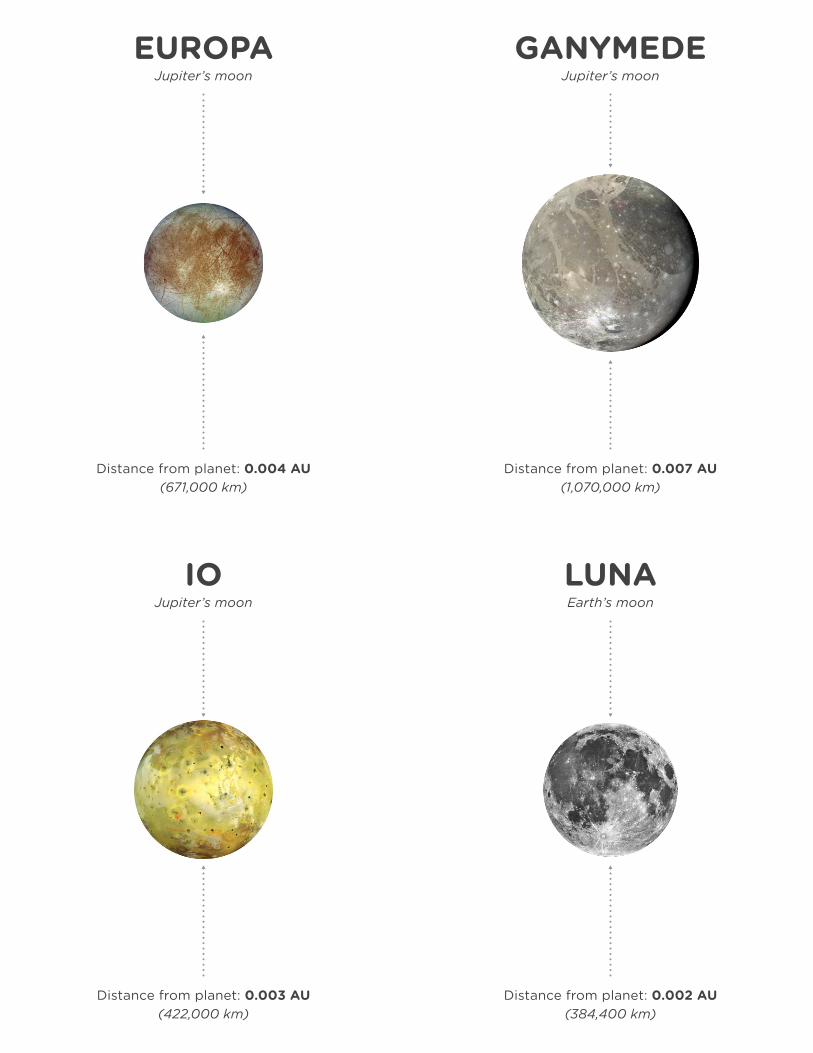
Distance from planet: 0.004 AU(671,000 km)
EUROPAJupiter’s moon
Distance from planet: 0.003 AU(422,000 km)
IOJupiter’s moon
Distance from planet: 0.007 AU(1,070,000 km)
GANYMEDEJupiter’s moon
Distance from planet: 0.002 AU(384,400 km)
LUNAEarth’s moon
National Aeronautics and Space Administration
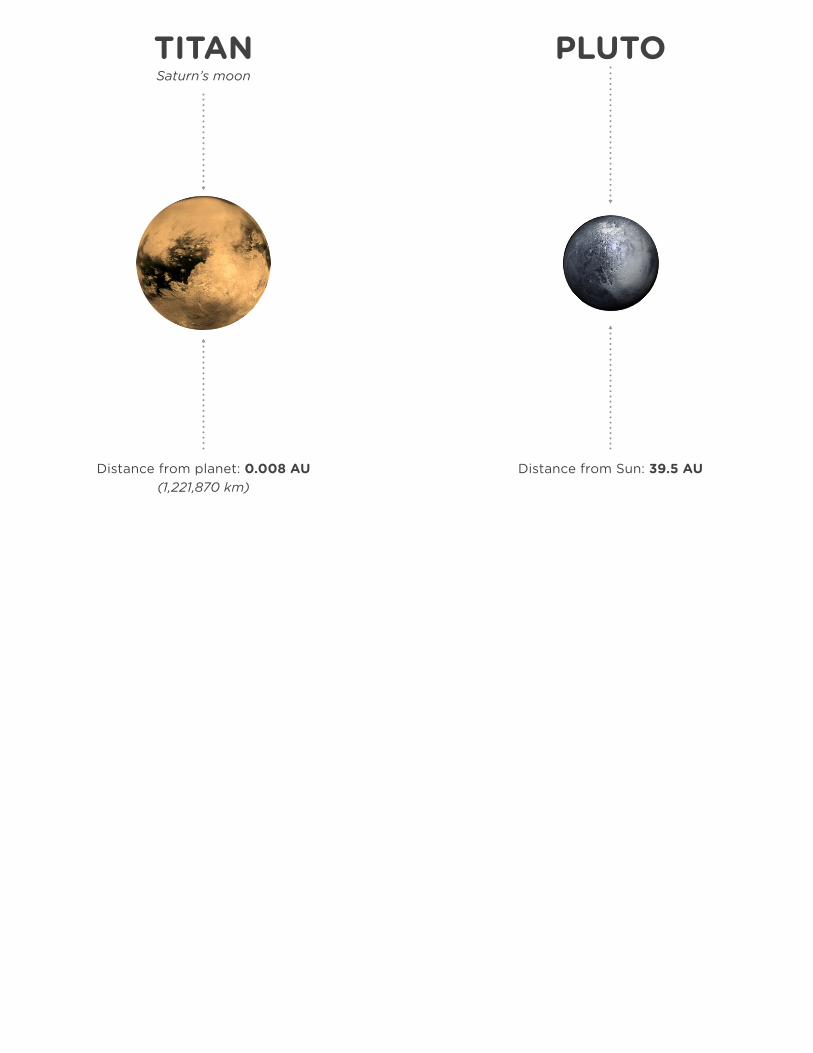
Distance from planet: 0.008 AU(1,221,870 km)
TITANSaturn’s moon
Distance from Sun: 39.5 AU
PLUTO
National Aeronautics and Space Administration
Planet Hunters Education Guide 32
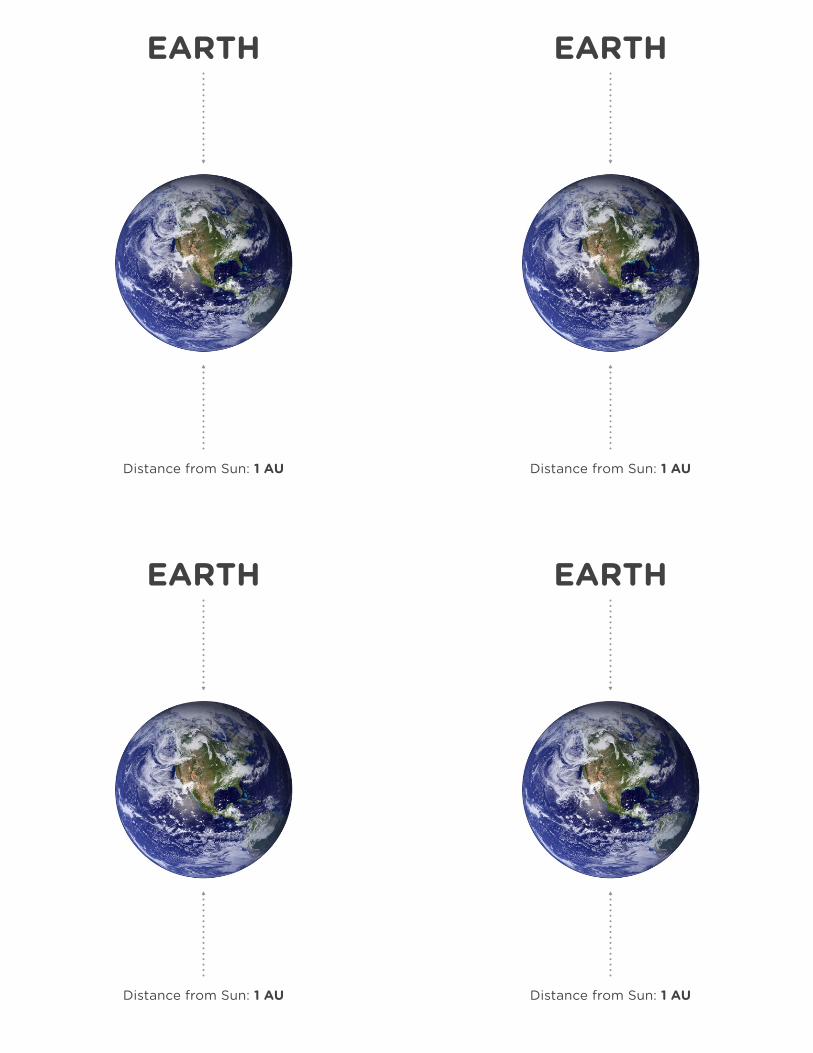
Distance from Sun: 1 AU
EARTH
Distance from Sun: 1 AU
EARTH
Distance from Sun: 1 AU
EARTH
Distance from Sun: 1 AU
EARTH
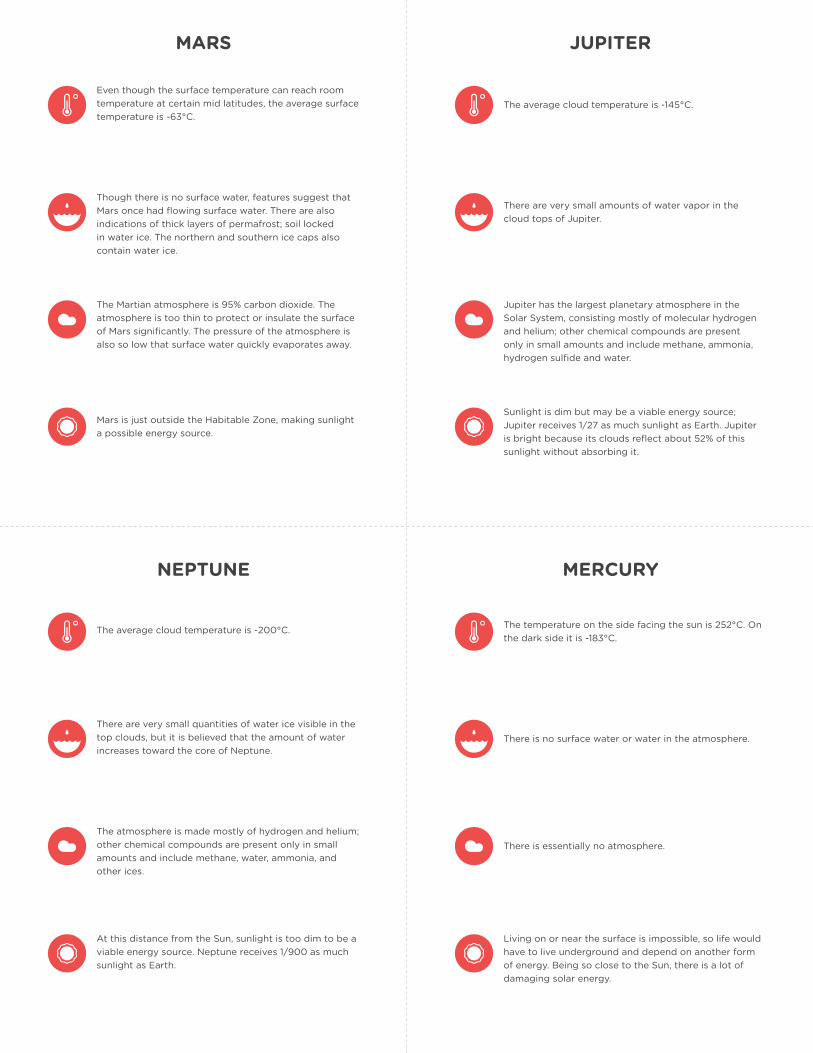
Even though the surface temperature can reach room temperature at certain mid latitudes, the average surface temperature is -63°C.
The average cloud temperature is -200°C.
The average cloud temperature is -145°C.
The temperature on the side facing the sun is 252°C. On the dark side it is -183°C.
Though there is no surface water, features suggest that Mars once had flowing surface water. There are also indications of thick layers of permafrost; soil locked in water ice. The northern and southern ice caps also contain water ice.
There are very small quantities of water ice visible in the top clouds, but it is believed that the amount of water increases toward the core of Neptune.
There are very small amounts of water vapor in the cloud tops of Jupiter.
There is no surface water or water in the atmosphere.
The Martian atmosphere is 95% carbon dioxide. The atmosphere is too thin to protect or insulate the surface of Mars significantly. The pressure of the atmosphere is also so low that surface water quickly evaporates away.
The atmosphere is made mostly of hydrogen and helium; other chemical compounds are present only in small amounts and include methane, water, ammonia, and other ices.
Jupiter has the largest planetary atmosphere in the Solar System, consisting mostly of molecular hydrogen and helium; other chemical compounds are present only in small amounts and include methane, ammonia, hydrogen sulfide and water.
There is essentially no atmosphere.
Mars is just outside the Habitable Zone, making sunlight a possible energy source.
At this distance from the Sun, sunlight is too dim to be a viable energy source. Neptune receives 1/900 as much sunlight as Earth.
Sunlight is dim but may be a viable energy source; Jupiter receives 1/27 as much sunlight as Earth. Jupiter is bright because its clouds reflect about 52% of this sunlight without absorbing it.
Living on or near the surface is impossible, so life would have to live underground and depend on another form of energy. Being so close to the Sun, there is a lot of damaging solar energy.
MARS
NEPTUNE
JUPITER
MERCURY
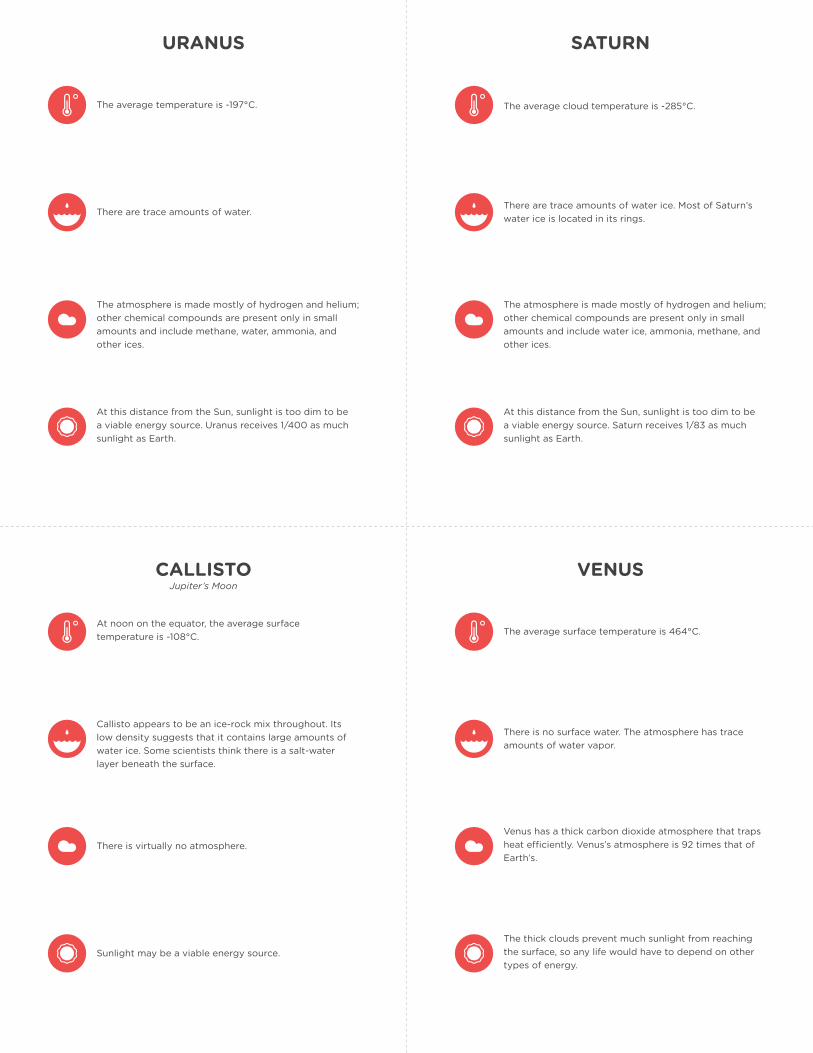
The average temperature is -197°C.
There are trace amounts of water.
The atmosphere is made mostly of hydrogen and helium; other chemical compounds are present only in small amounts and include methane, water, ammonia, and other ices.
At this distance from the Sun, sunlight is too dim to be a viable energy source. Uranus receives 1/400 as much sunlight as Earth.
At noon on the equator, the average surface temperature is -108°C.
Callisto appears to be an ice-rock mix throughout. Its low density suggests that it contains large amounts of water ice. Some scientists think there is a salt-water layer beneath the surface.
There is virtually no atmosphere.
Sunlight may be a viable energy source.
The average cloud temperature is -285°C.
There are trace amounts of water ice. Most of Saturn’s water ice is located in its rings.
The atmosphere is made mostly of hydrogen and helium; other chemical compounds are present only in small amounts and include water ice, ammonia, methane, and other ices.
At this distance from the Sun, sunlight is too dim to be a viable energy source. Saturn receives 1/83 as much sunlight as Earth.
The average surface temperature is 464°C.
There is no surface water. The atmosphere has trace amounts of water vapor.
Venus has a thick carbon dioxide atmosphere that traps heat efficiently. Venus’s atmosphere is 92 times that of Earth’s.
The thick clouds prevent much sunlight from reaching the surface, so any life would have to depend on other types of energy.
URANUS
CALLISTOJupiter’s Moon
SATURN
VENUS
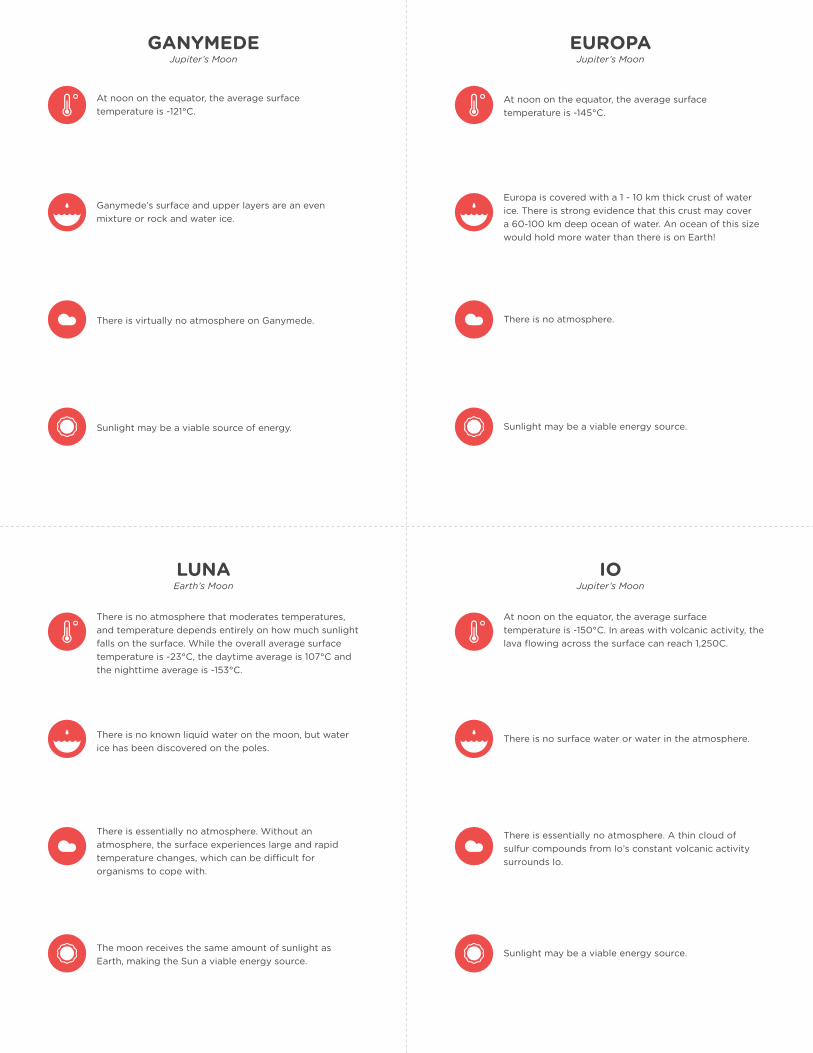
At noon on the equator, the average surface temperature is -121°C.
Ganymede’s surface and upper layers are an even mixture or rock and water ice.
There is virtually no atmosphere on Ganymede.
Sunlight may be a viable source of energy.
There is no atmosphere that moderates temperatures, and temperature depends entirely on how much sunlight falls on the surface. While the overall average surface temperature is -23°C, the daytime average is 107°C and the nighttime average is -153°C.
There is no known liquid water on the moon, but water ice has been discovered on the poles.
There is essentially no atmosphere. Without an atmosphere, the surface experiences large and rapid temperature changes, which can be difficult for organisms to cope with.
The moon receives the same amount of sunlight as Earth, making the Sun a viable energy source.
At noon on the equator, the average surface temperature is -145°C.
Europa is covered with a 1 - 10 km thick crust of water ice. There is strong evidence that this crust may cover a 60-100 km deep ocean of water. An ocean of this size would hold more water than there is on Earth!
There is no atmosphere.
Sunlight may be a viable energy source.
At noon on the equator, the average surface temperature is -150°C. In areas with volcanic activity, the lava flowing across the surface can reach 1,250C.
There is no surface water or water in the atmosphere.
There is essentially no atmosphere. A thin cloud of sulfur compounds from Io’s constant volcanic activity surrounds Io.
Sunlight may be a viable energy source.
GANYMEDEJupiter’s Moon
LUNAEarth’s Moon
EUROPAJupiter’s Moon
IOJupiter’s Moon
National Aeronautics and Space Administration
Planet Hunters Education Guide 36
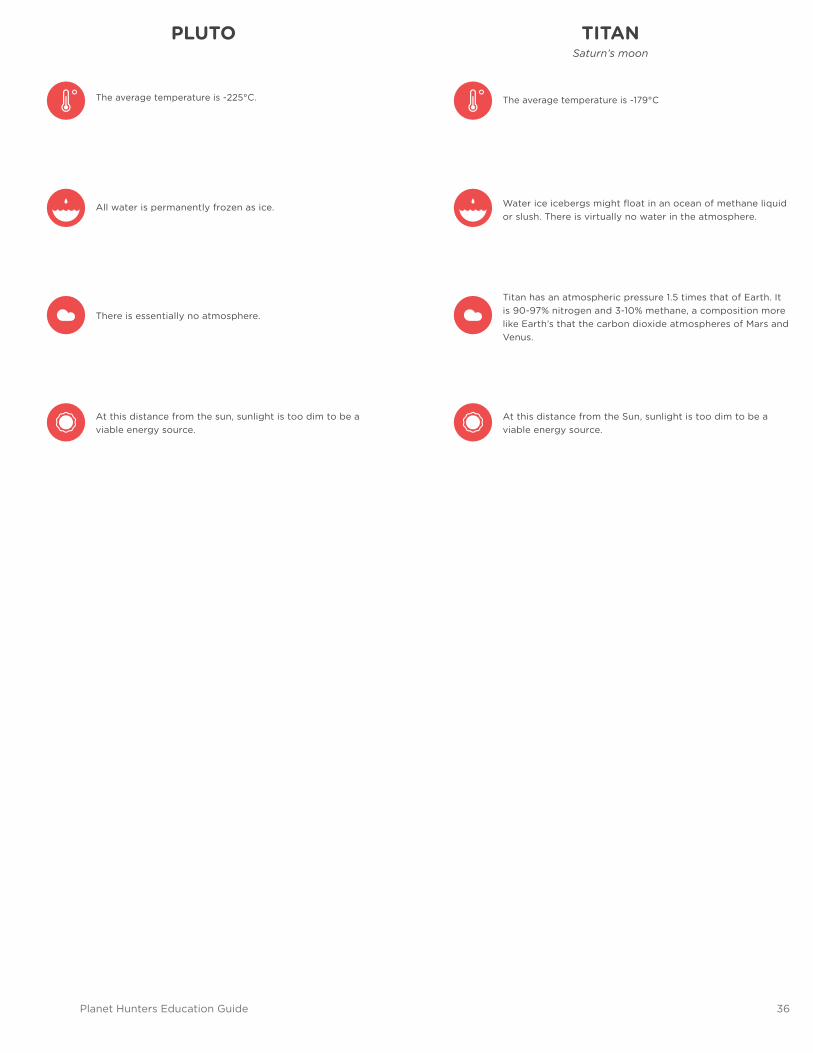
The average temperature is -225°C.
All water is permanently frozen as ice.
There is essentially no atmosphere.
At this distance from the sun, sunlight is too dim to be a viable energy source.
PLUTOSaturn’s moon
The average temperature is -179°C
Water ice icebergs might float in an ocean of methane liquid or slush. There is virtually no water in the atmosphere.
Titan has an atmospheric pressure 1.5 times that of Earth. It is 90-97% nitrogen and 3-10% methane, a composition more like Earth’s that the carbon dioxide atmospheres of Mars and Venus.
At this distance from the Sun, sunlight is too dim to be a viable energy source.
TITAN
National Aeronautics and Space Administration
Planet Hunters Education Guide 37
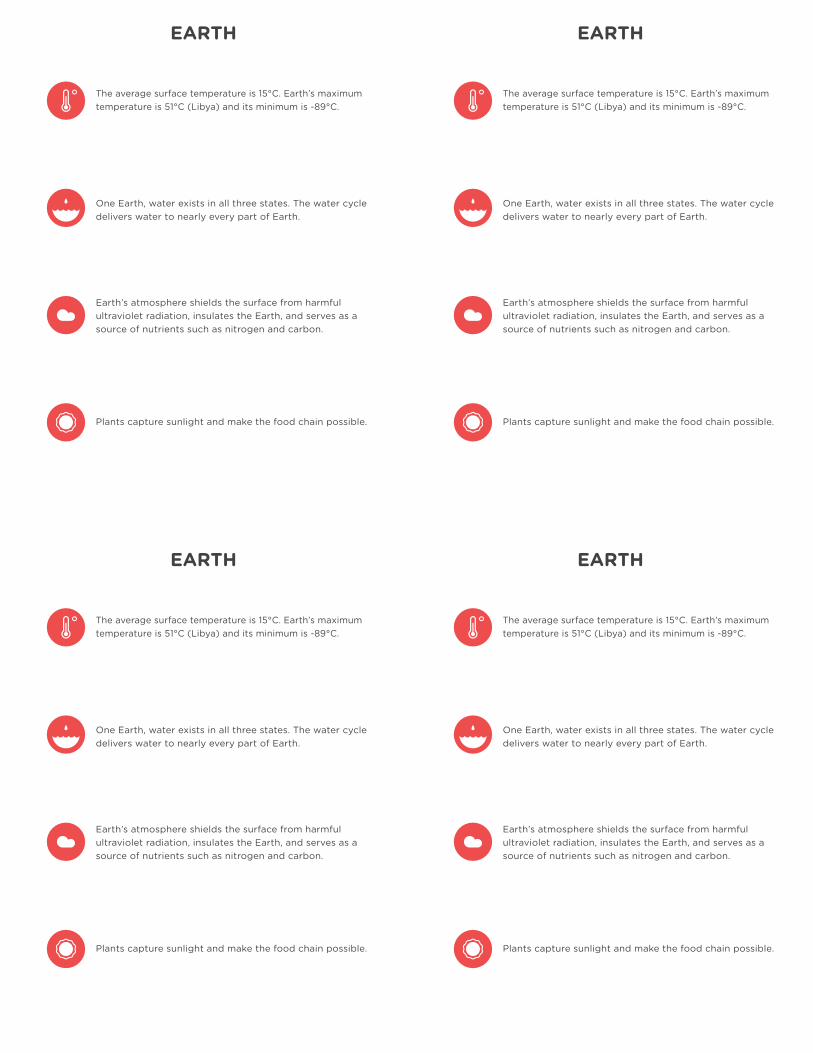
The average surface temperature is 15°C. Earth’s maximum temperature is 51°C (Libya) and its minimum is -89°C.
One Earth, water exists in all three states. The water cycle delivers water to nearly every part of Earth.
Earth’s atmosphere shields the surface from harmful ultraviolet radiation, insulates the Earth, and serves as a source of nutrients such as nitrogen and carbon.
Plants capture sunlight and make the food chain possible.
EARTH
Neptune
Uranus
Saturn
Jupiter
Mars
Earth
Venus
Mercury
Life
is lik
ely
Life
is P
ossib
le
Life
is Im
possib
le
RATIONALEPLANET
NAME
DATE
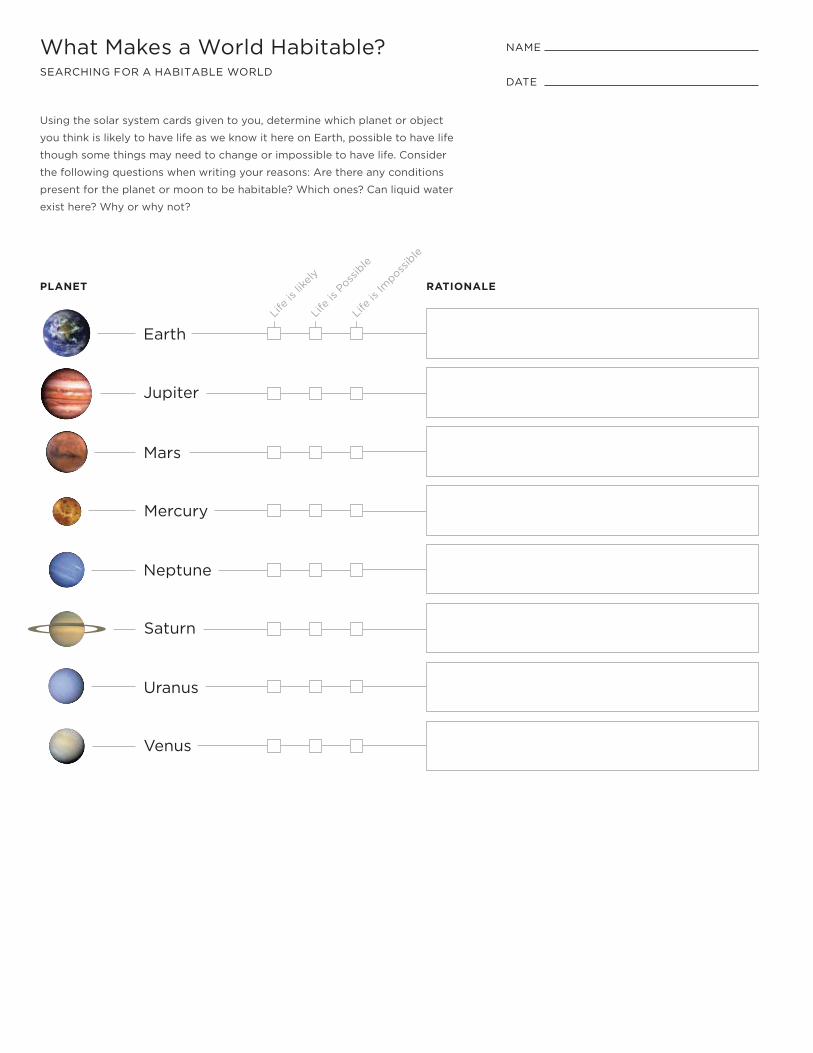
What Makes a World Habitable?SEARCHING FOR A HABITABLE WORLD
Using the solar system cards given to you, determine which planet or object
you think is likely to have life as we know it here on Earth, possible to have life
though some things may need to change or impossible to have life. Consider
the following questions when writing your reasons: Are there any conditions
present for the planet or moon to be habitable? Which ones? Can liquid water
exist here? Why or why not?
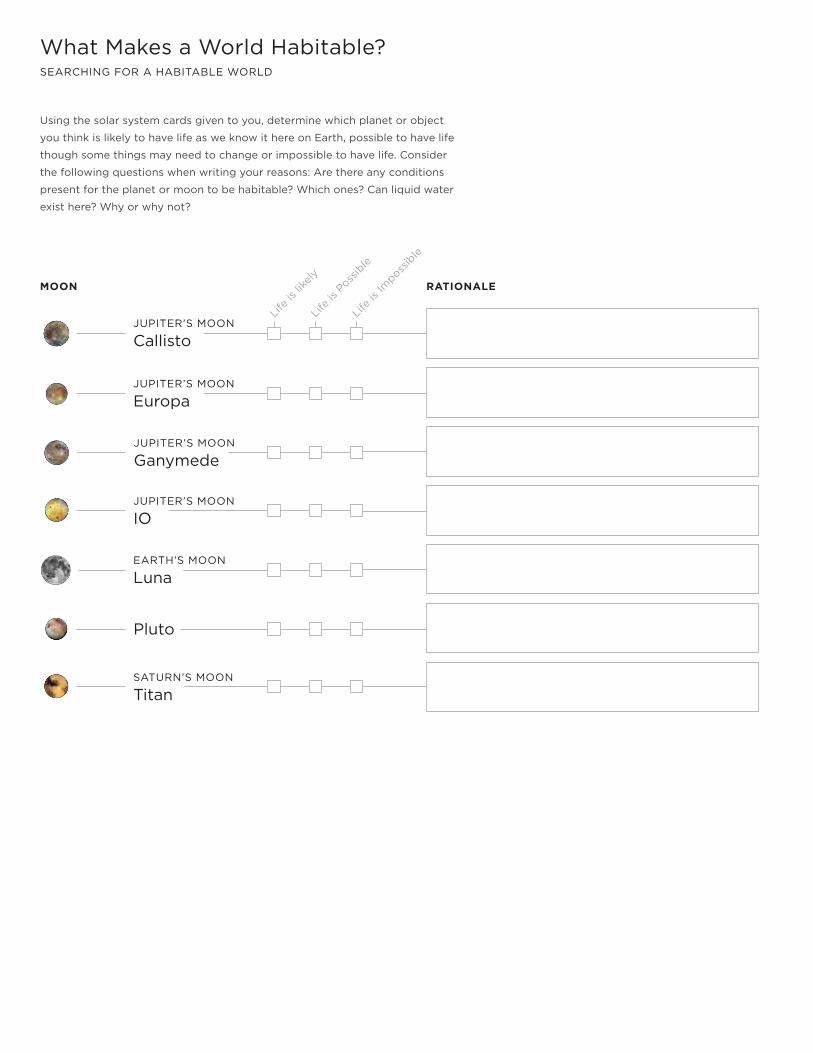
Pluto
SATURN’S MOON
Titan
JUPITER’S MOON
Callisto
JUPITER’S MOON
Ganymede
JUPITER’S MOON
Europa
JUPITER’S MOON
IO
EARTH’S MOON
Luna
Life
is lik
ely
Life
is P
ossib
le
Life
is Im
possib
le
RATIONALEMOON
What Makes a World Habitable?SEARCHING FOR A HABITABLE WORLD
Using the solar system cards given to you, determine which planet or object
you think is likely to have life as we know it here on Earth, possible to have life
though some things may need to change or impossible to have life. Consider
the following questions when writing your reasons: Are there any conditions
present for the planet or moon to be habitable? Which ones? Can liquid water
exist here? Why or why not?
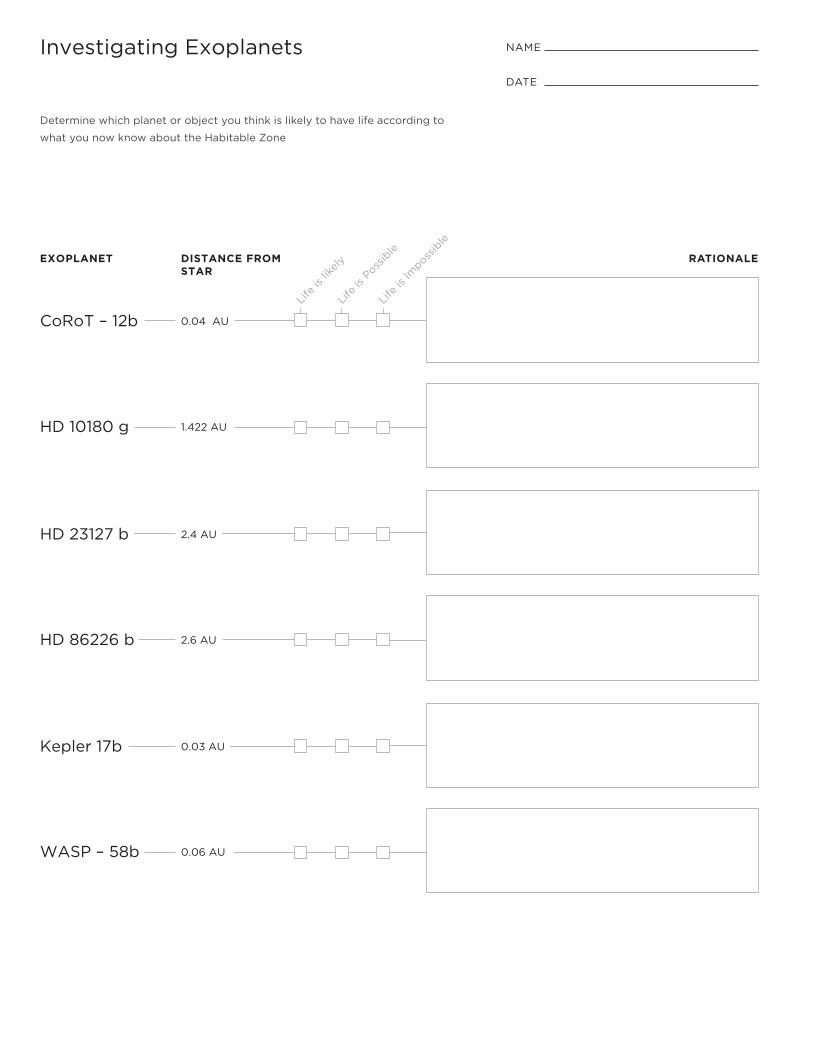
WASP – 58b 0.06 AU
Kepler 17b 0.03 AU
HD 86226 b 2.6 AU
HD 23127 b 2.4 AU
HD 10180 g 1.422 AU
CoRoT – 12b 0.04 AU
Life
is lik
ely
Life
is P
ossib
le
Life
is Im
possib
le
RATIONALE
NAME
DATE
Investigating Exoplanets
Determine which planet or object you think is likely to have life according to
what you now know about the Habitable Zone
EXOPLANET DISTANCE FROMSTAR
National Aeronautics and Space Administration
Planet Hunters Education Guide 41
Lesson 3
Finding the Habitable Zone
OVERVIEW
This activity explores four types of stars and their characteristics, such as color, temperature, size, and lifespan.
These characteristics are then used to determine the conditions for planets around each of them. Next, stu-
dents compare and contrast their results to develop ideas about where it is reasonable to expect that life could
be found outside our own solar system. Portions of this lesson are based on the “Activity 2 – Somewhere in
the Milky Way- Star Types and Lifezones” from the GEMS curriculum resource Messages From Space, available
from Lawrence Hall of Science: www.lhsgems.org
OBJECTIVE
Students will be able to:
• Define the Habitable Zone
• Identify the habitable zone around four “stars”
• Communicate that the size of habitable zones
differs between star types
• Distinguish between various types of stars
STUDENT PREREQUISITE KNOWLEDGE
Students should be familiar with:
• The definition of a star
• The Sun is a star
CONCEPTS
The habitable zone defines the range of orbital distance in which liquid water could exist on a planet. Stars dif-
fer in size, color, and amount of heat measured. The temperature and size of a star determines its lifespan and
where the habitable zone can be found in its system.
STANDARDS
AAAS benchmarks
3A/M2, 4F/M1, 4G/M1, 11B/M1*, 11B/M5**, 11D/M3**,
12D/M8**
Common Core• RST 6-8, 3, 9
• MP2
Next Generations Science Standards Dimensions
• Disciplinary Core Ideas
° ESS1.A, 6-8
° LS2.A, 6-8
• Crosscutting Concepts:
° Patterns
° Cause and Effect
° Scale, Proportion, and Quantity
° System and System Models
° Structure and Function
• Science & Engineering
° Asking Questions and Defining Problems
° Developing and Using Models
° Planning and Carrying Out Investigations
° Analyzing and Interpreting Data
• Constructing Explanations and Designing
Solutions
• Obtaining, Evaluating, and Communicating
Information
45–60 minutes
National Aeronautics and Space Administration
Planet Hunters Education Guide 42
MATERIALS
• Image of stars from Hubble Space Telescope,
HST Jewel Box
• Radiometers (You can make your own http://
www.ehow.com/how_12186568_build-home-
made-radiometer.html)
• Tape
• Meter stick
• Clock with a second hand, or stop watch
• Habitable Zone Chart
• 4 outlet-to-lampholder adapters (available on
Amazon) with power strips, or lamps without
shades
• Red, yellow, blue, and green markers or colored
pencils
• Paper for note taking
• 4 types of standard incandescent light bulbs:
° Red 15-25 W light bulb
° Yellow 60 W light bulb
° White 100 W light bulb
° Blue 200 W light bulb
Note: It may be difficult to find bulbs in these
colors; here are two options for you:
Purchase white incandescent bulbs in the
wattages listed above. Use the v to let stu-
dents know what color and spectral type
each light bulb represents.
° 5-25 W light bulb is the M star
° Yellow 60 W light bulb is the G star
° White 100 W light bulb is the A star
° Blue 200 W light bulb is the O star
Use permanent markers to color white
light bulbs (in the wattages listed above)
red, yellow, and blue. Before screwing the
bulb into the socket, color it well with the
marker. Then, before class, near an open
window and without students in the room
screw in the light bulb and turn it on.
You may notice slight smoking for a few
minutes, but this should soon stop and the
colored bulb will be ready for student use.
Be sure to do this with good ventilation.
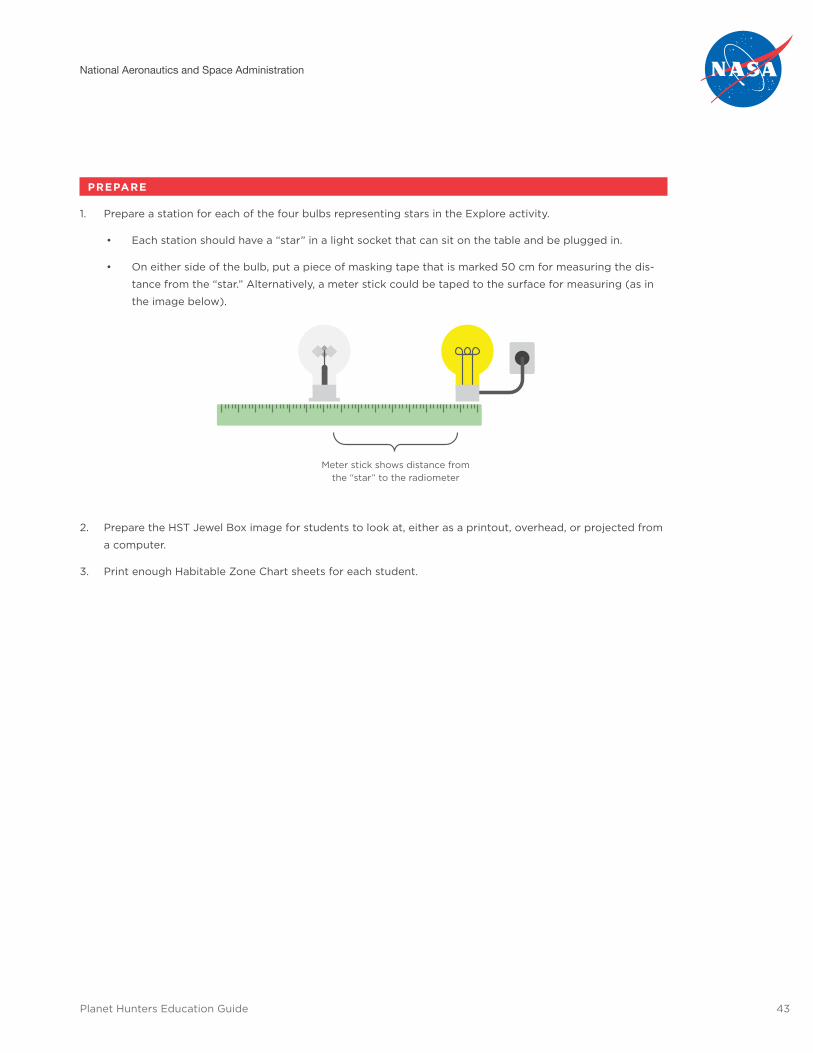
National Aeronautics and Space Administration
Planet Hunters Education Guide 43
PREPARE
1. Prepare a station for each of the four bulbs representing stars in the Explore activity.
• Each station should have a “star” in a light socket that can sit on the table and be plugged in.
• On either side of the bulb, put a piece of masking tape that is marked 50 cm for measuring the dis-
tance from the “star.” Alternatively, a meter stick could be taped to the surface for measuring (as in
the image below).
Meter stick shows distance from the “star” to the radiometer
2. Prepare the HST Jewel Box image for students to look at, either as a printout, overhead, or projected from
a computer.
3. Print enough Habitable Zone Chart sheets for each student.
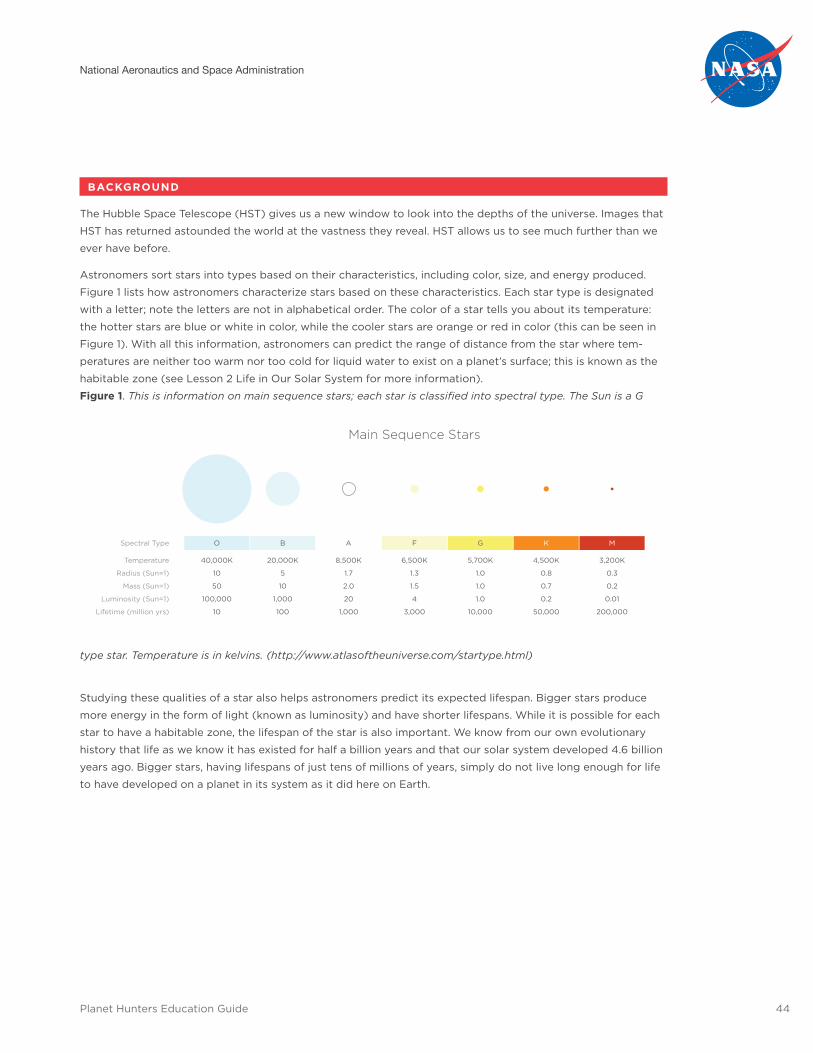
National Aeronautics and Space Administration
Planet Hunters Education Guide 44
BACKGROUND
The Hubble Space Telescope (HST) gives us a new window to look into the depths of the universe. Images that
HST has returned astounded the world at the vastness they reveal. HST allows us to see much further than we
ever have before.
Astronomers sort stars into types based on their characteristics, including color, size, and energy produced.
Figure 1 lists how astronomers characterize stars based on these characteristics. Each star type is designated
with a letter; note the letters are not in alphabetical order. The color of a star tells you about its temperature:
the hotter stars are blue or white in color, while the cooler stars are orange or red in color (this can be seen in
Figure 1). With all this information, astronomers can predict the range of distance from the star where tem-
peratures are neither too warm nor too cold for liquid water to exist on a planet’s surface; this is known as the
habitable zone (see Lesson 2 Life in Our Solar System for more information).
Figure 1. This is information on main sequence stars; each star is classified into spectral type. The Sun is a G
type star. Temperature is in kelvins. (http://www.atlasoftheuniverse.com/startype.html)
Studying these qualities of a star also helps astronomers predict its expected lifespan. Bigger stars produce
more energy in the form of light (known as luminosity) and have shorter lifespans. While it is possible for each
star to have a habitable zone, the lifespan of the star is also important. We know from our own evolutionary
history that life as we know it has existed for half a billion years and that our solar system developed 4.6 billion
years ago. Bigger stars, having lifespans of just tens of millions of years, simply do not live long enough for life
to have developed on a planet in its system as it did here on Earth.
Main Sequence Stars
40,000K
10
50
100,000
10
Spectral Type
Temperature
Radius (Sun=1)
Mass (Sun=1)
Luminosity (Sun=1)
Lifetime (million yrs)
20,000K
5
10
1,000
100
8,500K
1.7
2.0
20
1,000
6,500K
1.3
1.5
4
3,000
5,700K
1.0
1.0
1.0
10,000
4,500K
0.8
0.7
0.2
50,000
O B A F G K M
3,200K
0.3
0.2
0.01
200,000
National Aeronautics and Space Administration
Planet Hunters Education Guide 45
ENGAGE (5 – 10 MINUTES)
1. Have students observe the HST Jewel Box image.
• What do you think this is an image of? What do you observe? Are there differences in the objects in
this image? What differences do you observe?
• Encourage students to respond to each other’s observations. If color comes up, ask what colors the
students see. Why do you think you are seeing different colors? [The stars are different temperatures;
color and temperature are related.]
2. Inform them that it is an image that the Hubble Space Telescope (HST) took of a star-forming region in
space that is 6,400 light years away, or 404 million times the distance from Earth to the Sun.
3. Ask students to recall what role stars play in searching for planets and where the nearest star to us is. [The
distance between the planet and the star determines its habitability. The Sun is the nearest star to Earth.]
Inform them that a star’s characteristics influence the planets that might be found orbiting it and that will
be the focus of today’s lesson.
EXPLORE (20 MINUTES)
1. Break students into four groups. One group per light bulb, or “star”. Inform students that they will observe
the traits of their “star,” including color, brightness, and heat. (Alternately, you could conduct this exercise
without giving the criteria and facilitate student observations to make comparisons that will help them get
to those criteria.)
Note: you most likely will not have stars that represent the size of each star, you could provide the Main
sequence chart of stars from the background section to show the difference in size.
2. Call students’ attention to how the “stars” are set up in each area. Explain that the measuring tool, tape
or meter stick, on the table will help them to find where the habitable zone is for each “star.” Inform them
that they are finding the area that is not too hot and not too cold.
3. To measure heat, students will use 2 methods:
• First, all students will describe the heat they feel with their hands as they slowly move their hand
toward the light bulb and stop about an inch away.
Note: Students should be instructed NOT TO TOUCH the light bulbs since it may burn their hands!
• Second, a group member will move a radiometer along the meter stick or tape you have set up at
each station. Radiometers measure heat [heat is the transfer of energy from a hotter body, the light
bulb, to a cooler one, the air]. Demonstrate the radiometer with the white light bulb, moving it closer
and further away so that students can observe how the radiometer gives feedback, spinning faster as
it gets closer to the “star” and slower as it moves away, stopping when it is too far from the “star” to
detect heat.
i. Why would the heat coming from the star be important to astronomers? What would that
tell scientists about the planets? [The right amount of heat is one factor for liquid water to be
found, which is the foundation of life as we know it.]
ii You may also want to note to your students that they may not be able to count the spins when
the radiometer is closest to the bulb. This will especially be true for the higher watt bulbs.
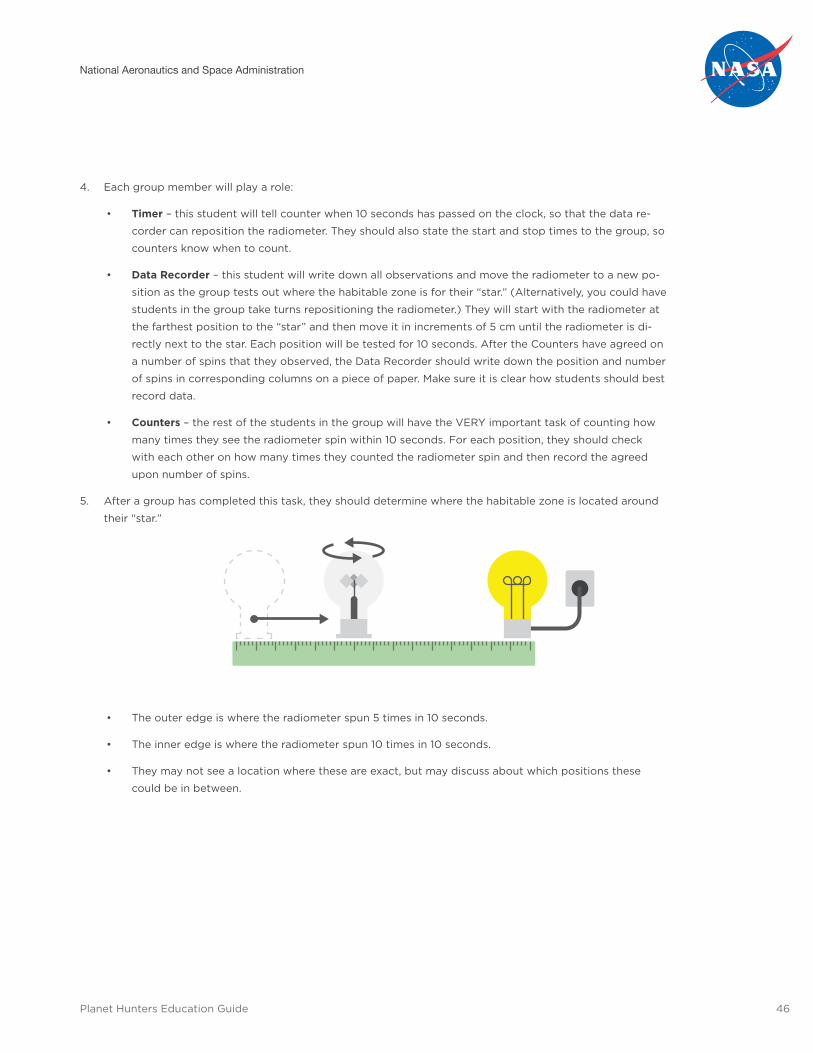
National Aeronautics and Space Administration
Planet Hunters Education Guide 46
4. Each group member will play a role:
• Timer – this student will tell counter when 10 seconds has passed on the clock, so that the data re-
corder can reposition the radiometer. They should also state the start and stop times to the group, so
counters know when to count.
• Data Recorder – this student will write down all observations and move the radiometer to a new po-
sition as the group tests out where the habitable zone is for their “star.” (Alternatively, you could have
students in the group take turns repositioning the radiometer.) They will start with the radiometer at
the farthest position to the “star” and then move it in increments of 5 cm until the radiometer is di-
rectly next to the star. Each position will be tested for 10 seconds. After the Counters have agreed on
a number of spins that they observed, the Data Recorder should write down the position and number
of spins in corresponding columns on a piece of paper. Make sure it is clear how students should best
record data.
• Counters – the rest of the students in the group will have the VERY important task of counting how
many times they see the radiometer spin within 10 seconds. For each position, they should check
with each other on how many times they counted the radiometer spin and then record the agreed
upon number of spins.
5. After a group has completed this task, they should determine where the habitable zone is located around
their “star.”
• The outer edge is where the radiometer spun 5 times in 10 seconds.
• The inner edge is where the radiometer spun 10 times in 10 seconds.
• They may not see a location where these are exact, but may discuss about which positions these
could be in between.
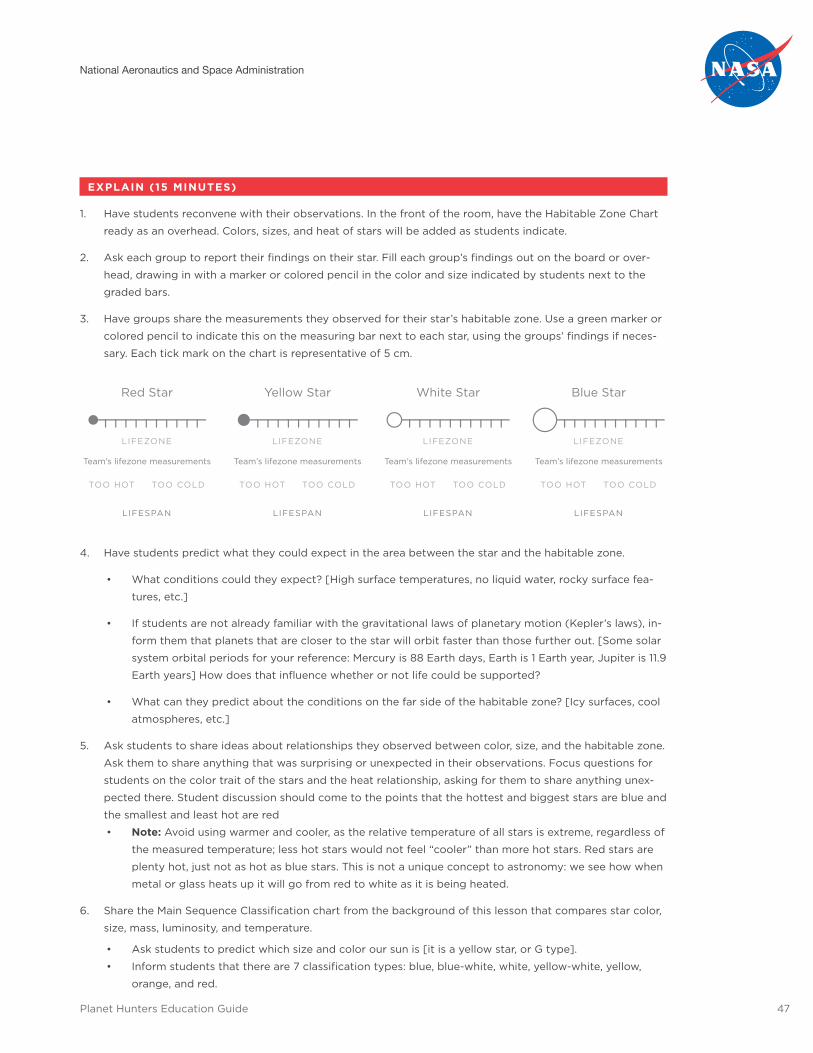
National Aeronautics and Space Administration
Planet Hunters Education Guide 47
EXPLAIN (15 MINUTES)
1. Have students reconvene with their observations. In the front of the room, have the Habitable Zone Chart
ready as an overhead. Colors, sizes, and heat of stars will be added as students indicate.
2. Ask each group to report their findings on their star. Fill each group’s findings out on the board or over-
head, drawing in with a marker or colored pencil in the color and size indicated by students next to the
graded bars.
3. Have groups share the measurements they observed for their star’s habitable zone. Use a green marker or
colored pencil to indicate this on the measuring bar next to each star, using the groups’ findings if neces-
sary. Each tick mark on the chart is representative of 5 cm.
4. Have students predict what they could expect in the area between the star and the habitable zone.
• What conditions could they expect? [High surface temperatures, no liquid water, rocky surface fea-
tures, etc.]
• If students are not already familiar with the gravitational laws of planetary motion (Kepler’s laws), in-
form them that planets that are closer to the star will orbit faster than those further out. [Some solar
system orbital periods for your reference: Mercury is 88 Earth days, Earth is 1 Earth year, Jupiter is 11.9
Earth years] How does that influence whether or not life could be supported?
• What can they predict about the conditions on the far side of the habitable zone? [Icy surfaces, cool
atmospheres, etc.]
5. Ask students to share ideas about relationships they observed between color, size, and the habitable zone.
Ask them to share anything that was surprising or unexpected in their observations. Focus questions for
students on the color trait of the stars and the heat relationship, asking for them to share anything unex-
pected there. Student discussion should come to the points that the hottest and biggest stars are blue and
the smallest and least hot are red
• Note: Avoid using warmer and cooler, as the relative temperature of all stars is extreme, regardless of
the measured temperature; less hot stars would not feel “cooler” than more hot stars. Red stars are
plenty hot, just not as hot as blue stars. This is not a unique concept to astronomy: we see how when
metal or glass heats up it will go from red to white as it is being heated.
6. Share the Main Sequence Classification chart from the background of this lesson that compares star color,
size, mass, luminosity, and temperature.
• Ask students to predict which size and color our sun is [it is a yellow star, or G type].
• Inform students that there are 7 classification types: blue, blue-white, white, yellow-white, yellow,
orange, and red.
LIFEZONE
LIFESPAN
TOO HOT TOO COLD
Red Star
Team’s lifezone measurements
Yellow Star
LIFEZONE
LIFESPAN
TOO HOT TOO COLD
Team’s lifezone measurements
LIFESPAN
TOO HOT TOO COLD
LIFEZONE
Team’s lifezone measurements
White Star
LIFESPAN
TOO HOT TOO COLD
LIFEZONE
Team’s lifezone measurements
Blue Star
National Aeronautics and Space Administration
Planet Hunters Education Guide 48
7. Display or pass around the HST Jewel Box image again. Have students recall what they may have said
about the different colors, or ask them what they think about the colors they see. Ask them to predict and
place where those colors would be in the spectrum of sizes and colors they looked at today. What attri-
butes might the students expect for these stars?
ELABORATE (10 MINUTES)
1. Inform students that the life cycle of stars begin when they emit energy and when they no longer can gen-
erate energy, they die. The lifespan varies between stars. Ask students to predict which star they believe
will live the shortest and the longest. [O star would have the shortest lifetime while M star would have the
longest lifetime. It’s not about getting the correct answer, but about guiding them to understanding this
concept.]
2. Bring all 4 stars together onto a surface where a power strip is available and plug in the lights, but flipping
the toggle switch of the power strip to off. Select a student to be a timer. Announce that 4 new stars have
been born and then flip on the toggle switch to light up all 4 stars. After 10 seconds, unplug the blue star
and have the timer state the time. After 3 min 20 seconds, unplug the white, having timer call the time.
3. Inform students that each second represents 1 million years. Have students calculate how many years that
the white star lived if it went out after 3 min. 20 seconds. [200 million years]
4. Inform the students that the yellow star will live 10 billion years and the red star 100 billion. Have students
calculate how long the lights will have to be on to represent those time scales. [Yellow: 2 hrs 45 min, Red:
28 hrs]
5. Have students share their reactions and thoughts.
• Have them formulate a relationship statement between the color/temperature of the star and its
lifespan.
• Ask if students have ever heard quotes or euphemisms that talk about stars and their lives. It is likely
they may not know these so introduce the phrases to them. [Some examples: “Live fast, die young”
and “biggest and brightest burn fastest”] Have students discuss how these statements relate to what
they observed.
• What might that mean for planets found around blue stars? How might lifespan affect what we might
find in other stars? [For life as we know it, 3.6 billion years ago simple cells developed on Earth; 600
million years ago simple animals lived on Earth; and modern humans have been known to exist for
200,000 years. Earth was created 4.6 billion years ago. It took a billion years for life to develop on
Earth; therefore it is unlikely a star that only lives for 10 million years will be able to have a planet
develop life before it burns out.]
National Aeronautics and Space Administration
Planet Hunters Education Guide 49
EVALUATE (TAKE HOME)
1. Collect student group notes to see their results.
2. Have students write a paragraph explaining how the type of star can tell scientists about what they might
expect to find when looking for planets. Students should include:
• How the star type predicts the distance range of the habitable zone,
• The possibility of life as we know it to develop around those stars, and
• An illustration that supports their statements.
EXTENSION ACTIVITIES
1. Using the luminosities given in the Main Sequence Star chart in the Background section, have students
calculate the inner and outer limit of their habitable zones.
• Inner Limit: this is the inner boundary of the habitable zone in astronomical units (AU)
• Outer limit: this is the outer boundary of the habitable zone in astronomical units (AU)
where L is the absolute luminosity of the star.
ADDITIONAL RESOURCES
1. National Geographic Daily News article, Goldilocks worlds: just right for life?
• http://news.nationalgeographic.com/news/2014/04/140417-exoplanet-interactive/?utm_con-
tent=bufferab3ff&utm_medium=social&utm_source=facebook.com&utm_campaign=buffer#-
close-modal
TP = ri =
P2 =
p1 = d2 – d1
p2 = d3 – d2
(p3 + p2)
= L(1 – A) R2TS
4(1–A)16
2
4a2a2
L1.1
4 2
G(m + M)
p =
14
14
Surface Temp Lesson 3
Lesson 7
Density
Kepler’s Third Law
Orbital Period
a3
ro = L
0.53
Mean orbital period =
V = r3
= 9.88 days(9.88 days + 9.87 days)
2
4
3d =
m
v
TP = ri =
P2 =
p1 = d2 – d1
p2 = d3 – d2
(p3 + p2)
= L(1 – A) R2TS
4(1–A)16
2
4a2a2
L1.1
4 2
G(m + M)
p =
14
14
Surface Temp Lesson 3
Lesson 7
Density
Kepler’s Third Law
Orbital Period
a3
ro = L
0.53
Mean orbital period =
V = r3
= 9.88 days(9.88 days + 9.87 days)
2
4
3d =
m
v
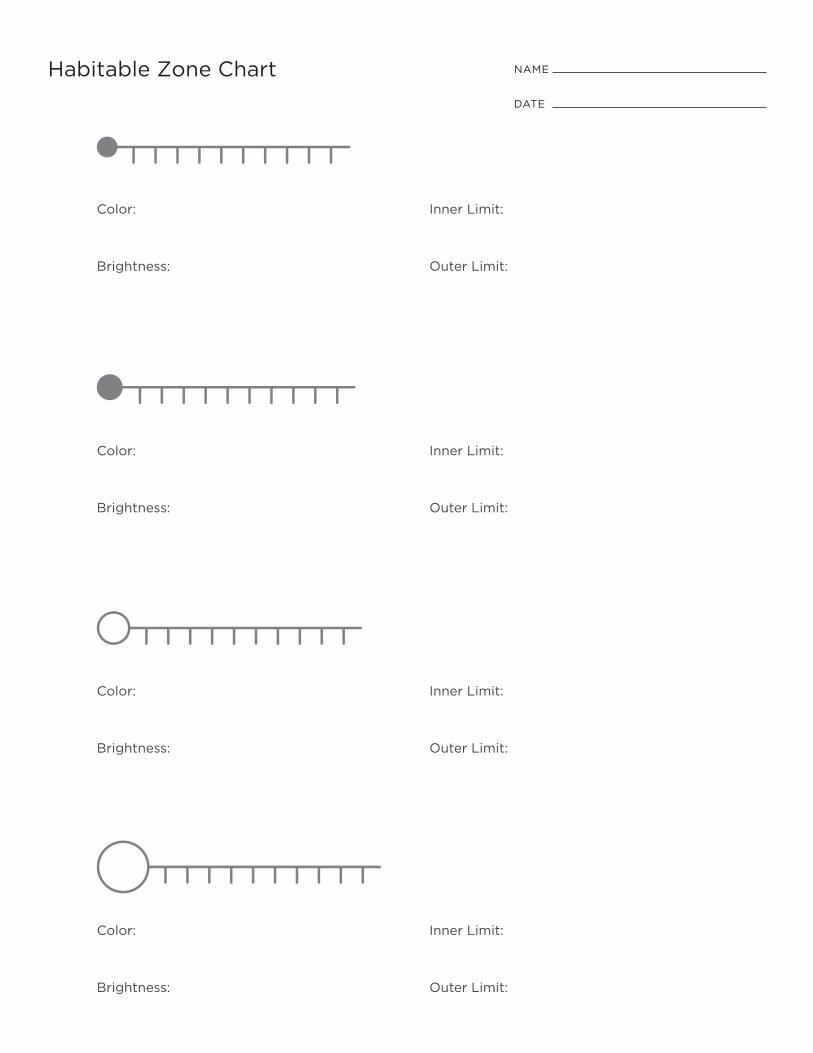
Habitable Zone ChartSEARCHING FOR A HABITABLE WORLD
NAME
DATE
Color:
Brightness:
Inner Limit:
Outer Limit:
Color:
Brightness:
Inner Limit:
Outer Limit:
Color:
Brightness:
Inner Limit:
Outer Limit:
Color:
Brightness:
Inner Limit:
Outer Limit:
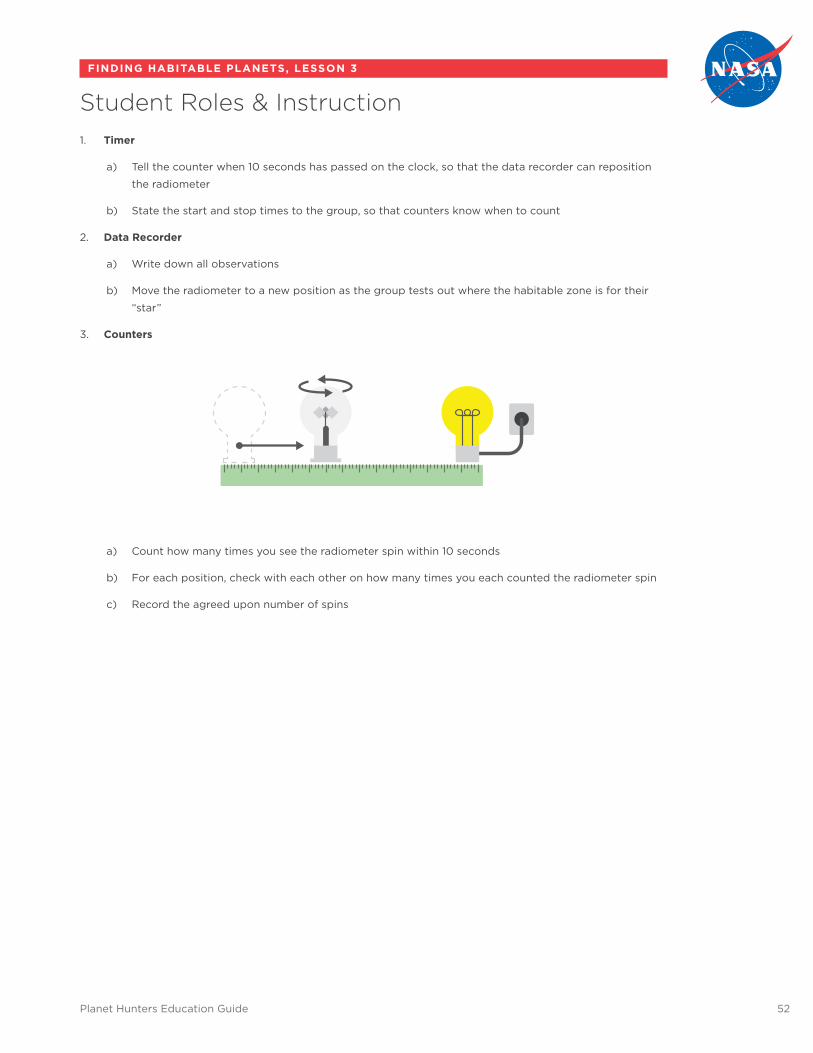
Planet Hunters Education Guide 52
FINDING HABITABLE PLANETS, LESSON 3
Student Roles & Instruction1. Timer
a) Tell the counter when 10 seconds has passed on the clock, so that the data recorder can reposition
the radiometer
b) State the start and stop times to the group, so that counters know when to count
2. Data Recorder
a) Write down all observations
b) Move the radiometer to a new position as the group tests out where the habitable zone is for their
“star”
3. Counters
a) Count how many times you see the radiometer spin within 10 seconds
b) For each position, check with each other on how many times you each counted the radiometer spin
c) Record the agreed upon number of spins
National Aeronautics and Space Administration
Planet Hunters Education Guide 53
Lesson 4
Exoplanet Detection
OVERVIEW
In this lesson, students will first engage in an activity that offers an opportunity to use various methods of
observation to identify an object without being able to directly observe it with their eyes. Next, students will
be asked to research and present to the class one of the direct or indirect methods that scientists use to detect
planets around distant stars. Detection methods covered include transit, Doppler, and direct imaging.
OBJECTIVE
Students will be able to:
• Define candidate exoplanets and confirmed
exoplanets
• Describe different methods of detecting
exoplanets
• Identify that direct imaging is an extremely
difficult process and rarely used by astronomers
• Define what a transit is and how it relates to
detecting planets orbiting stars
STUDENT PREREQUISITE KNOWLEDGE
Students should be familiar with:
• The definition of a star
• The Sun is a star
• The existence of exoplanets
CONCEPTS
Astronomers use both direct and indirect methods of observation to detect exoplanets. These methods include
the transit method, Doppler method, and direct imaging. With current technology direct imaging is very diffi-
cult, but can be used in a few cases.
45–60 minutes
National Aeronautics and Space Administration
Planet Hunters Education Guide 54
STANDARDS
AAAS benchmarks
9B/M3*, 9C/M4*, 11A/M2, 11B/M1*, 11B/M5**, 11D/M3**,
12C/M3*
Common Core• RST 6-8, 3,7,9
• MP2, MP3
Next Generations Science Standards Dimensions
• Disciplinary Core Ideas
° ESS1.A, 6-8, ESS1.B, 6-8, 9-12
° PS2.B, 6-8
• Crosscutting Concepts:
° Patterns
° Cause and Effect
° Scale, Proportion, and Quantity
° System and System Models
° Structure and Function
• Science & Engineering
° Asking Questions and Defining Problems
° Developing and Using Models
° Planning and Carrying Out Investigations
° Analyzing and Interpreting Data
° Using Mathematics and Computational
Thinking
° Engaging in Argument from Evidence
° Obtaining, Evaluating and Communicating
Information
MATERIALS
• Stellar System images
• One light bulb
• One outlet-to-lampholder adapter (available on
Amazon) with power strips, or one lamp without
shade
• One round white paper lantern; these can be
found in multi-packs on Amazon
• 3 different-sized circles to represent planets;
they should be smaller than the lantern. We
used construction paper or cardboard circles
glued to craft sticks.
• Kepler presentation, located on ZooTeach
(http://www.zooteach.org/resources/120)
• Projector and screen
• Detection Methods sheets
• Evaluate Other Systems
PREPARE
• Prepare the Stellar System images to project to
the class.
• Screw the bulb into the light socket and plug in
at front of the room. Students should all be in
front of the light source. Place the white paper
lanterns over the light bulbs.
• Glue each of the circles to a craft stick.
• Look up the current number of candidate and
confirmed planets at http://planetquest.jpl.nasa.
gov
• A darkened room works best for the transit
demonstration.
• Load Kepler presentation to project to the class.
• Print the Detection Methods sheet so that each
small group has a method to research.
• Load Evaluate Other Systems to project to the
class.
National Aeronautics and Space Administration
Planet Hunters Education Guide 55
BACKGROUND
Directly Versus Indirectly Observing Exoplanets
Astronomers have been looking at the stars and wondering about other planets for centuries. Some people
wonder why we cannot simply find planets by looking through a telescope directly at other stars. Stars in our
galaxy are extremely far away; the nearest star to us, other than the Sun, is Proxima Centauri at a distance of
4.35 light years away, or 275,093 times the distance between Earth and the Sun. A good comparison would be
this: if the scale of the Sun were reduced to the size of the period at the end of the last sentence, then Proxima
Centauri would have to be placed 8 miles (or 141 football fields) away. Planets are miniscule in comparison to
the size of stars. At such great distances, it is nearly impossible to detect a planet directly with a telescope.
Direct methods of observation mean that you are able to directly detect the planet: for example, visually.
While direct methods might seem easiest, indirect methods of observing stars have proven more successful in
detecting planets. Indirect methods mean that the astronomer will not observe the planet itself, but rather the
planet’s effects on its host star. As technological advancements are made, astronomers are able to use a variety
of approaches based on the amount of light that a star emits. Because these use only the light from the star,
rather than observing the star itself, these methods are considered indirect methods.
Methods of Indirect Observation – Doppler Method
One indirect detection method, called the Doppler method, uses a star’s spectral “fingerprint.” A star’s gravity
pulls on a planetary body to keep it in orbit. At the same time, the planetary body pulls slightly on the star, like
when two friends join hands and one spins the other around. This gravitational relationship can be observed by
analyzing the star’s light. When a star’s light enters a spectrometer, it is displayed as a spectrum of visible light.
Absorption lines in these spectra can be seen where light from the star is absorbed, creating a type of “finger-
print” for that star. These absorption lines can “shift” or move towards one end of the spectrum or the other as
light readings are taken while planets orbit their stars. When this phenomenon appears, it is an indication that
something is causing the star to move slightly. This shows up as a “wobble” in the light readings, as the absorp-
tion lines shift back and forth between the red and blue ends of the spectrum.
Methods of Indirect Observation – Transit Method
Another indirect approach is to observe changes to the total amount of light from a star. When an object, like a
planet, passes in front of the star, part of the light is blocked; this is called a transit. We also have seen transits
occur with our Sun and other planets in our solar system, such as the recent transits of Venus in 2004 and
2012. Astronomers can measure the amount of light a star is emitting over a period of time and graph it. This
graph is called a light curve. If any starlight is blocked, it appears as a “dip” in the graph. If a dip reappears reg-
ularly over time, this is a good indicator that something is transiting the star, like a planet. A planet will cause
dips in a regular pattern, indicating its orbital period (how long it takes a planet to orbit its star). The length of
time that the light is blocked signifies the velocity of the object. The amount of light that is blocked will specify
the size of the object. Astronomers look for dips in the star’s brightness three times at consistent time intervals
before considering that a planet may be orbiting the star and causing the dips. Detecting more than three dips
makes a stronger case for identifying a planet. In order for this method of detection to work, the object must
pass directly between the observer’s path of sight and the star, meaning that the object’s orbit must be seen
almost straight- or edge-on. Due to this limitation, the transit method will not be able to detect all planets.
National Aeronautics and Space Administration
Planet Hunters Education Guide 56
Direct Imaging of Exoplanets
Developing technology has allowed improvements in being able to directly see a planet orbiting a star. Because
the light coming from the star has such an intense magnitude or brightness, any objects near it, like a planet,
are impossible to see with a telescope alone. Think about trying to see a fly next to a streetlight. Astrono-
mers can either block the light of the star with a disc-shaped attachment to the telescope, or digitally reduce
the amount of light appearing in an image. The disc apparatus is called an occulting disk and works in the
same way as using your hand to block the Sun so you can see in the sky on a bright day. When the starlight
is blocked, objects around it can be better seen. The same thing happens when light is digitally reduced in an
image of the star, or with the use of a shade, called a star shade, that acts like a beach umbrella to shade the
telescope mirrors from the star’s light. When the brightness coming from the star can be reduced, less bright
objects can be observed.
Confirming an Exoplanet Astronomers have found exoplanets orbiting other stars besides our Sun. In fact, thousands of candidate exo-
planets have been detected. When scientists observe a possible exoplanet, it is called a candidate exoplanet.
Candidate exoplanets become confirmed exoplanets once a second type of observation method can be used
to confirm it. Think of it like scientists checking their work. Hundreds of candidate exoplanets have been con-
firmed.
ENGAGE (5–10 MINUTES)
1. Discuss with students how the easiest way to look for things is usually directly, by taking an image and
searching. Thanks to the Hubble Space Telescope (HST) we are able to image more of the universe than
we ever could before.
• Direct imaging to detect planets seems like the easiest way.
• What are some things that you cannot detect with an image? [dim, small, distance objects]
2. Show students the Stellar System images and ask them which star has a planet around it. Have the stu-
dents vote on whether or not each star has a planet(s) around it.
• Why can’t we see them? [the star is too bright to see small objects around it, the star is too far away
to see the small objects around it]
3. Explain to students that direct imaging of exoplanets is VERY difficult. Imaging processes are advancing
and it may be possible to use this as a method in the future, presently this is not a method astronomers
routinely use to detect exoplanets.
National Aeronautics and Space Administration
Planet Hunters Education Guide 57
EXPLORE (15 MINUTES)
1. Show students the following video from the National Science Foundation, Science Behind The News: Ex-
trasolar Planets, that describes the Transit and Doppler methods: http://bit.ly/PHEG4-1
2. Divide students into groups of three or four students. Half of the groups will be learning about the Transit
Method of exoplanet detection and the other half will be learning about the Doppler Method of exoplanet
detection. Give them 10 minutes to do so.
3. Inform them that each group will be given an indirect method used by scientists to detect planets around
stars. Their task is it to come up with a way to explain and demonstrate how their method works to the
rest of the class. Students may be creative in their demonstration, perhaps devising an analogy to explain
how the method works or acting it out. Hand each group a method from the Detection Methods sheet for
what they have to demonstrate to the class.
EXPLAIN (15 MINUTES)
1. Have students present their method to the class. Conduct a discussion about the different methods.
• What are some similarities in these methods? Differences? What special considerations would have
to be taken in using each method? [position relative to the star and distance of the star] Do you see
anything that might be an advantage to a method? Are there any disadvantages that come to mind?
2. Tell students that we’ll now be focusing on the transit method.
• What is needed to be able to use this method? [time and brightness measurements]
3. Give the Kepler presentation to your students.
4. Provide students with the number of candidate and confirmed exoplanets you found on the PlanetQuest
website.
• If all of these candidate and confirmed exoplanets were observed with the transit method, how many
more could be out there? [Many, many more since transits can only be view edge on.]
ELABORATE (15 MINUTES)
1. Arrange the lantern on a table at the front of the class at eye level with students. Be sure to have your
3 different-sized circles handy. You will be showing the students transits of 3 different sized planets as
though the students are the observers on the outside on the edge of the stellar system.
2. Show students your 3 different-sized planets. Discuss what the students might expect to see in the move-
ment of each.
3. Inform students that each circle planet is going to pass between the light (the star) and them (the observ-
er).
4. Darken room and tell students to focus on the light on the surface of the lantern. We want them to notice
the portion of “starlight” being blocked from their view. Be sure to clarify this.
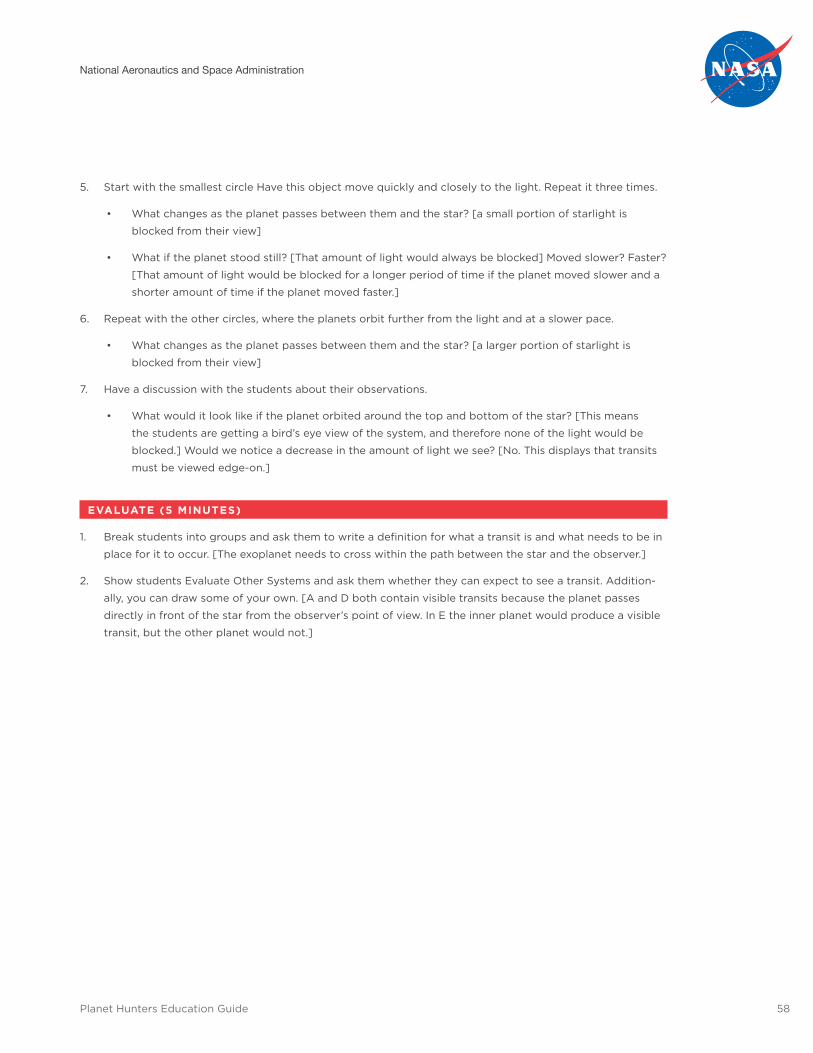
National Aeronautics and Space Administration
Planet Hunters Education Guide 58
5. Start with the smallest circle Have this object move quickly and closely to the light. Repeat it three times.
• What changes as the planet passes between them and the star? [a small portion of starlight is
blocked from their view]
• What if the planet stood still? [That amount of light would always be blocked] Moved slower? Faster?
[That amount of light would be blocked for a longer period of time if the planet moved slower and a
shorter amount of time if the planet moved faster.]
6. Repeat with the other circles, where the planets orbit further from the light and at a slower pace.
• What changes as the planet passes between them and the star? [a larger portion of starlight is
blocked from their view]
7. Have a discussion with the students about their observations.
• What would it look like if the planet orbited around the top and bottom of the star? [This means
the students are getting a bird’s eye view of the system, and therefore none of the light would be
blocked.] Would we notice a decrease in the amount of light we see? [No. This displays that transits
must be viewed edge-on.]
EVALUATE (5 MINUTES)
1. Break students into groups and ask them to write a definition for what a transit is and what needs to be in
place for it to occur. [The exoplanet needs to cross within the path between the star and the observer.]
2. Show students Evaluate Other Systems and ask them whether they can expect to see a transit. Addition-
ally, you can draw some of your own. [A and D both contain visible transits because the planet passes
directly in front of the star from the observer’s point of view. In E the inner planet would produce a visible
transit, but the other planet would not.]
National Aeronautics and Space Administration
Planet Hunters Education Guide 59
EXTENSION ACTIVITES
1. Have students research microlensing as a method of exoplanet detection; this method may also be called
gravitational microlensing.
• How would they compare it to the methods discussed in this lesson?
• Could this work with all stellar systems to detect exoplanets?
• What are its limitations?
ADDITIONAL RESOURCES
1. PlanetQuest also has produced an interactive called 5 Ways to Find a Planet that can allow your class to
explore more ways to find a planet: http://planetquest.jpl.nasa.gov/interactives
2. View a video clip of Neil DeGrasse Tyson explaining about the “wobble” method here: http://www.pbs.org/
wgbh/nova/space/hunt-alien-earths.html
3. Have students use diffraction grading spectroscopes to look at different types of light to see how their
spectra can be visible. http://sdo.gsfc.nasa.gov/
4. Other detection methods are described on the PlanetQuest website: http://planetquest.jpl.nasa.gov/page/
methods
5. Q&Alien video about direct imaging: http://planetquest.jpl.nasa.gov/video/59
6. New Worlds Atlas: http://planetquest.jpl.nasa.gov/newworldsatlas
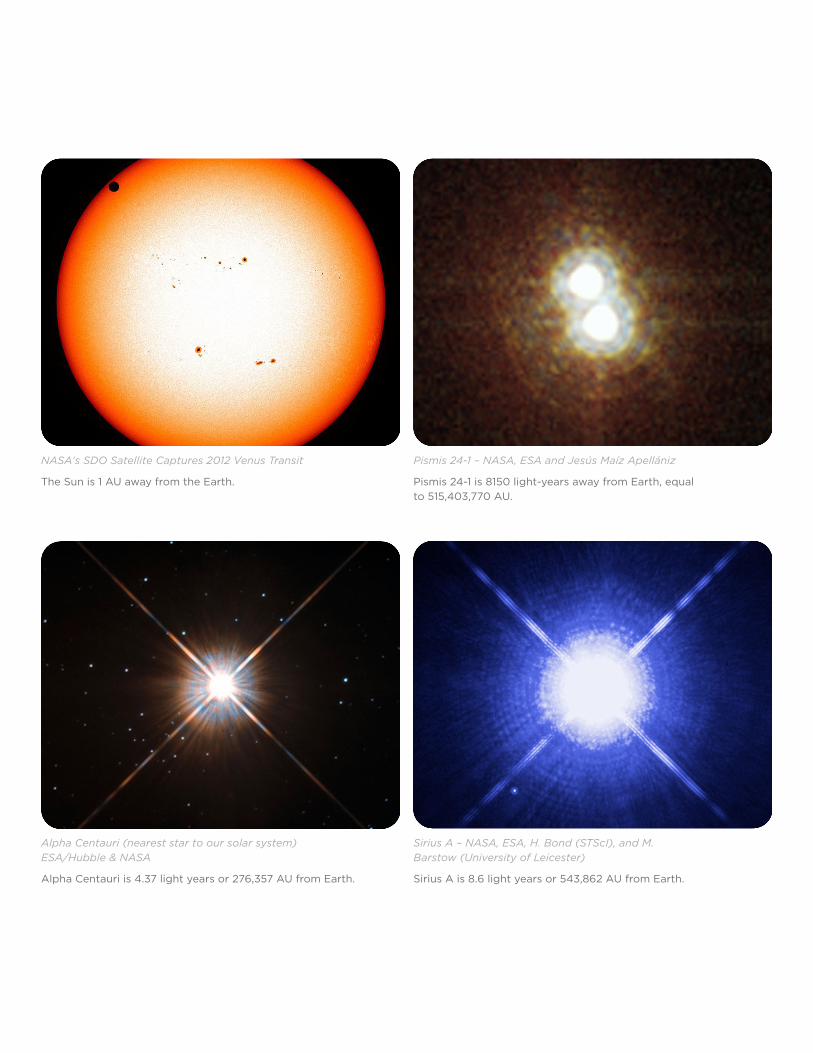
NASA's SDO Satellite Captures 2012 Venus Transit
The Sun is 1 AU away from the Earth.
Pismis 24-1 – NASA, ESA and Jesús Maíz Apellániz
Pismis 24-1 is 8150 light-years away from Earth, equal to 515,403,770 AU.
Alpha Centauri (nearest star to our solar system) ESA/Hubble & NASA
Alpha Centauri is 4.37 light years or 276,357 AU from Earth.
Sirius A – NASA, ESA, H. Bond (STScI), and M.Barstow (University of Leicester)
Sirius A is 8.6 light years or 543,862 AU from Earth.
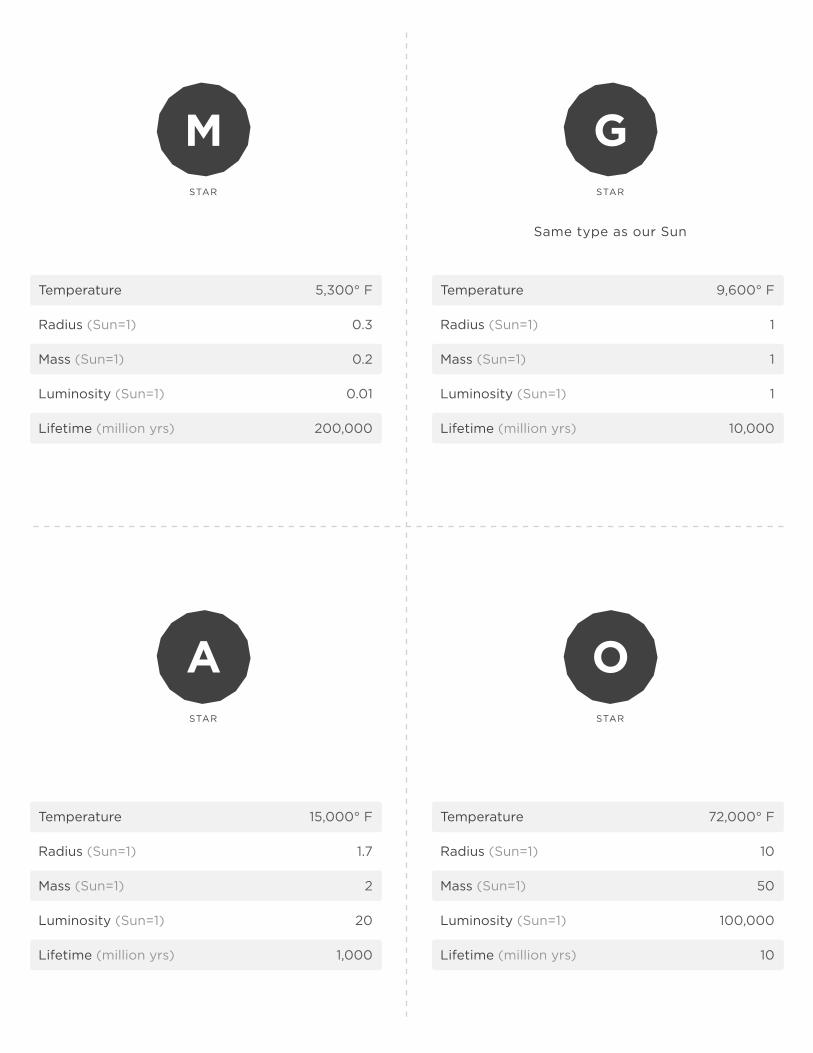
M GSTAR STAR
Same type as our Sun
A OSTAR STAR
Temperature 5,300° F
Radius (Sun=1) 0.3
Mass (Sun=1) 0.2
Luminosity (Sun=1) 0.01
Lifetime (million yrs) 200,000
Temperature 9,600° F
Radius (Sun=1) 1
Mass (Sun=1) 1
Luminosity (Sun=1) 1
Lifetime (million yrs) 10,000
Temperature 15,000° F
Radius (Sun=1) 1.7
Mass (Sun=1) 2
Luminosity (Sun=1) 20
Lifetime (million yrs) 1,000
Temperature 72,000° F
Radius (Sun=1) 10
Mass (Sun=1) 50
Luminosity (Sun=1) 100,000
Lifetime (million yrs) 10
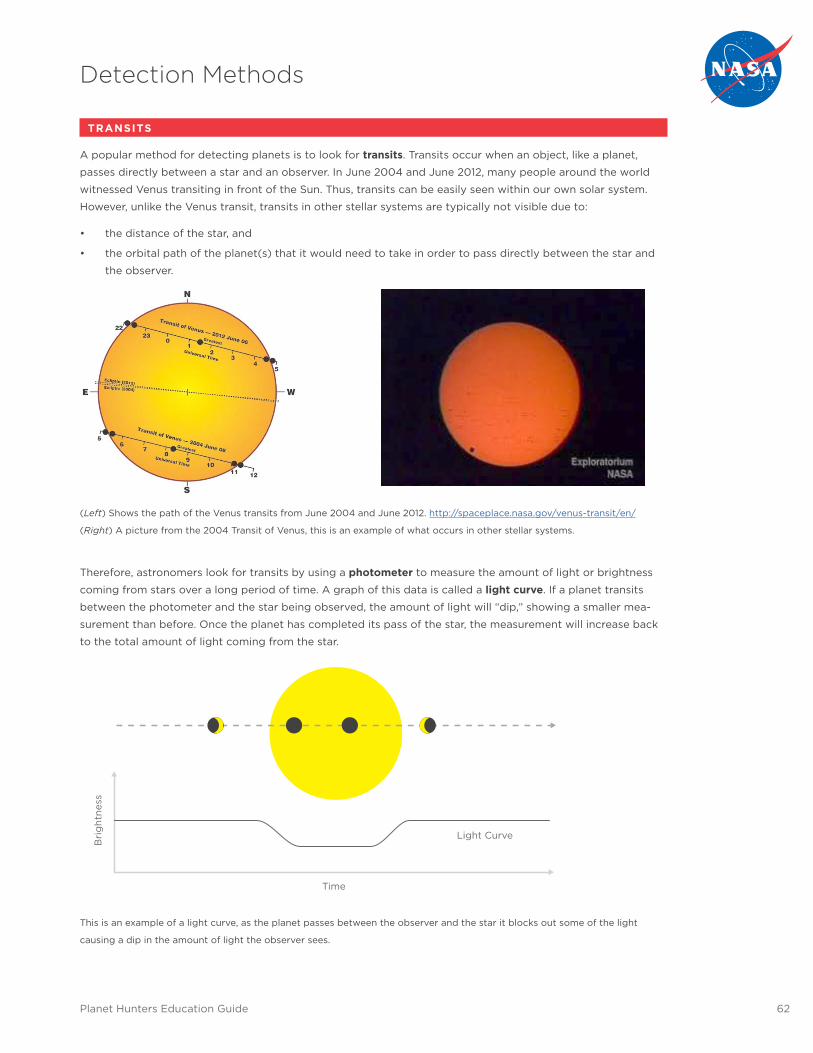
Planet Hunters Education Guide 62
Detection Methods
TRANSITS
A popular method for detecting planets is to look for transits. Transits occur when an object, like a planet,
passes directly between a star and an observer. In June 2004 and June 2012, many people around the world
witnessed Venus transiting in front of the Sun. Thus, transits can be easily seen within our own solar system.
However, unlike the Venus transit, transits in other stellar systems are typically not visible due to:
• the distance of the star, and
• the orbital path of the planet(s) that it would need to take in order to pass directly between the star and
the observer.
(Left) Shows the path of the Venus transits from June 2004 and June 2012. http://spaceplace.nasa.gov/venus-transit/en/
(Right) A picture from the 2004 Transit of Venus, this is an example of what occurs in other stellar systems.
Therefore, astronomers look for transits by using a photometer to measure the amount of light or brightness
coming from stars over a long period of time. A graph of this data is called a light curve. If a planet transits
between the photometer and the star being observed, the amount of light will “dip,” showing a smaller mea-
surement than before. Once the planet has completed its pass of the star, the measurement will increase back
to the total amount of light coming from the star.
This is an example of a light curve, as the planet passes between the observer and the star it blocks out some of the light
causing a dip in the amount of light the observer sees.
Time
Light Curve
Bri
ght
ness
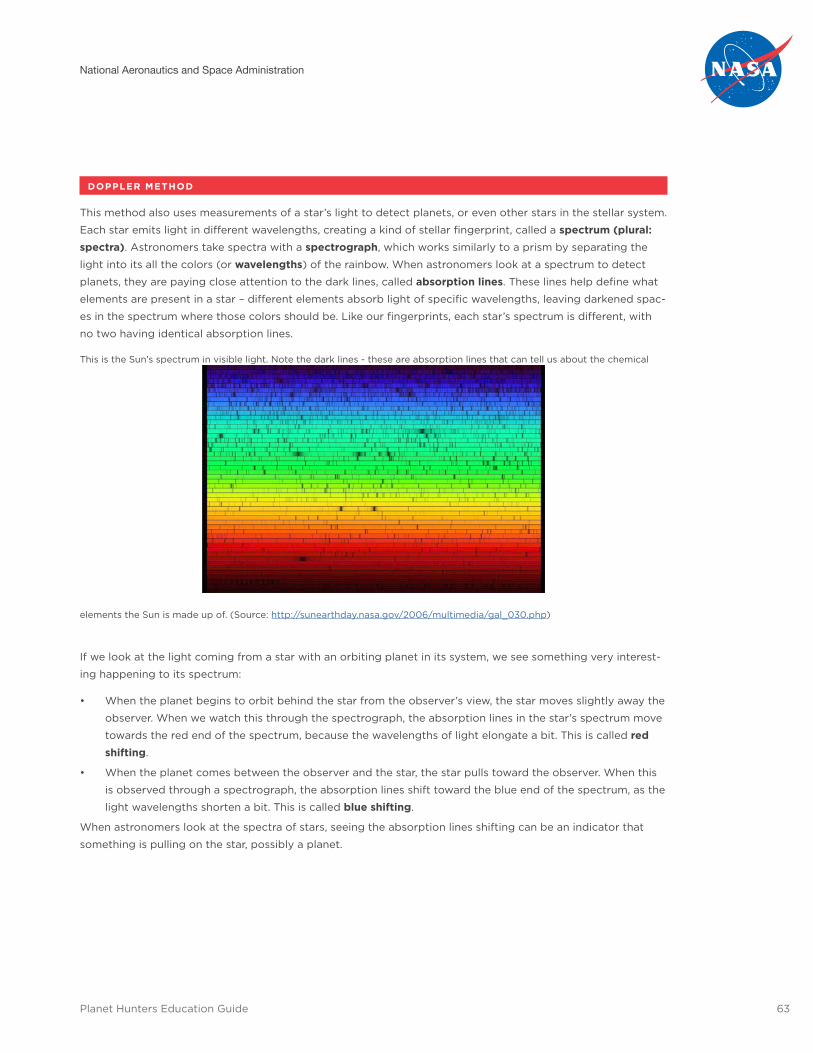
National Aeronautics and Space Administration
Planet Hunters Education Guide 63
DOPPLER METHOD
This method also uses measurements of a star’s light to detect planets, or even other stars in the stellar system.
Each star emits light in different wavelengths, creating a kind of stellar fingerprint, called a spectrum (plural: spectra). Astronomers take spectra with a spectrograph, which works similarly to a prism by separating the
light into its all the colors (or wavelengths) of the rainbow. When astronomers look at a spectrum to detect
planets, they are paying close attention to the dark lines, called absorption lines. These lines help define what
elements are present in a star – different elements absorb light of specific wavelengths, leaving darkened spac-
es in the spectrum where those colors should be. Like our fingerprints, each star’s spectrum is different, with
no two having identical absorption lines.
This is the Sun’s spectrum in visible light. Note the dark lines - these are absorption lines that can tell us about the chemical
elements the Sun is made up of. (Source: http://sunearthday.nasa.gov/2006/multimedia/gal_030.php)
If we look at the light coming from a star with an orbiting planet in its system, we see something very interest-
ing happening to its spectrum:
• When the planet begins to orbit behind the star from the observer’s view, the star moves slightly away the
observer. When we watch this through the spectrograph, the absorption lines in the star’s spectrum move
towards the red end of the spectrum, because the wavelengths of light elongate a bit. This is called red shifting.
• When the planet comes between the observer and the star, the star pulls toward the observer. When this
is observed through a spectrograph, the absorption lines shift toward the blue end of the spectrum, as the
light wavelengths shorten a bit. This is called blue shifting.
When astronomers look at the spectra of stars, seeing the absorption lines shifting can be an indicator that
something is pulling on the star, possibly a planet.
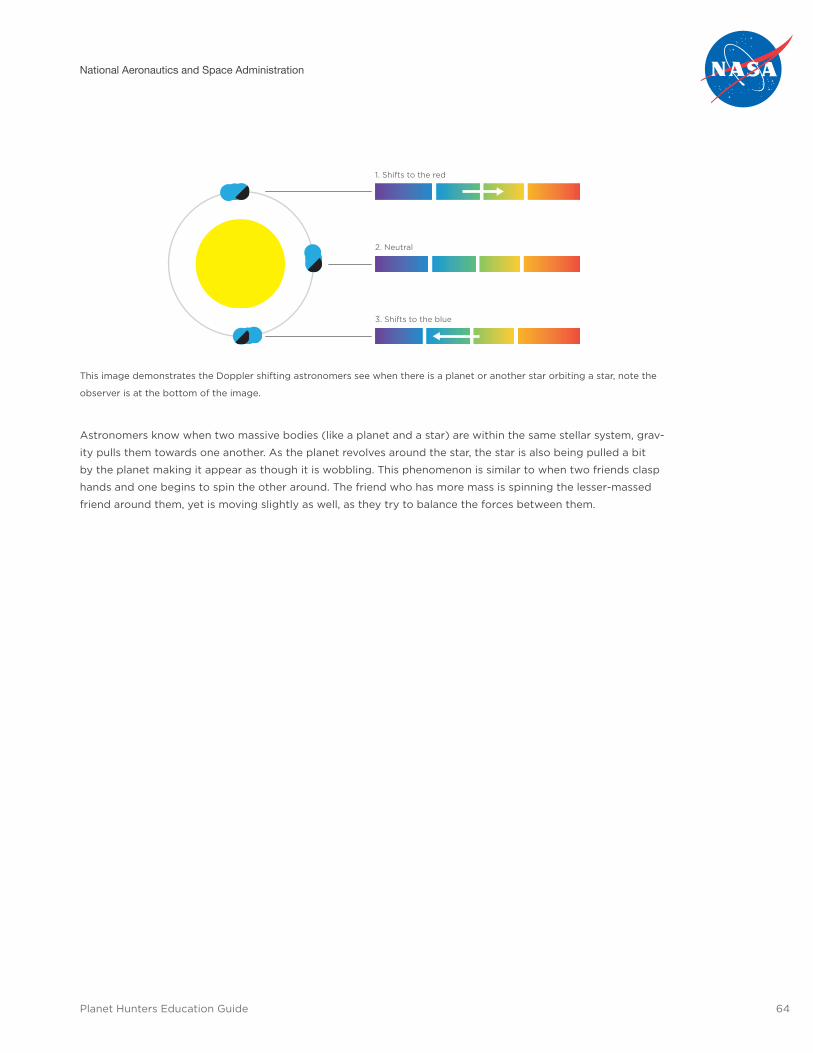
National Aeronautics and Space Administration
Planet Hunters Education Guide 64
This image demonstrates the Doppler shifting astronomers see when there is a planet or another star orbiting a star, note the
observer is at the bottom of the image.
Astronomers know when two massive bodies (like a planet and a star) are within the same stellar system, grav-
ity pulls them towards one another. As the planet revolves around the star, the star is also being pulled a bit
by the planet making it appear as though it is wobbling. This phenomenon is similar to when two friends clasp
hands and one begins to spin the other around. The friend who has more mass is spinning the lesser-massed
friend around them, yet is moving slightly as well, as they try to balance the forces between them.
1. Shifts to the red
2. Neutral
3. Shifts to the blue
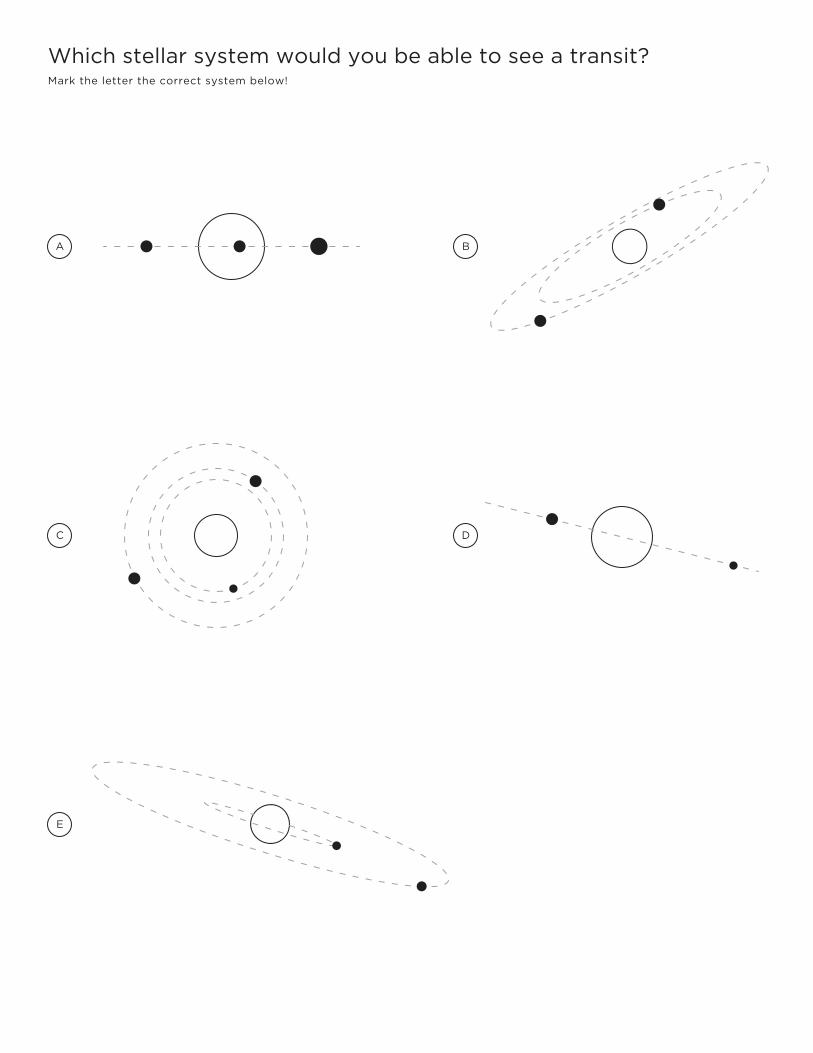
Mark the letter the correct system below!
Planet Hunters Education Guide Activity 3
Which stellar system would you be able to see a transit?
A B
C
E
D
National Aeronautics and Space Administration
Planet Hunters Education Guide 66
Lesson 5
Transit Method
OVERVIEW
In this activity, students will create models of transits and explore how point of observation relates to the abili-
ty to observe a transit. Students will then create models exploring how planet size, distance, and orbital period
affect the amount of light blocked during a transit event. Students will also explore the situations in which a
transit can occur.
OBJECTIVE
Students will be able to:
• Describe a transit
• Describe the conditions for when a transit may
be observed
• Identify how the Kepler Space Telescope is help-
ing scientists find exoplanets
• Design models of transiting planets that demon-
strate planets of varying size, orbital period and
distance from host star
• Describe how a planet’s size and distance from
its star contribute to the appearance of its light
curve
• Create light curve graphs from data collected
from a model of a planet-star system
•
STUDENT PREREQUISITE KNOWLEDGE
Students should be familiar with:
• The existence of exoplanets
• The transit method of exoplanet detection
CONCEPTS
Transits occur when an object moves between an observer and a star; the object causes starlight to be blocked
from the observer’s view. For a transit to be detected, the orbital path of the object must be viewed edge-on.
Kepler’s 3rd Law of Planetary motion states that the orbital period of a planet is directly related to its distance
from its star.
60 minutes
National Aeronautics and Space Administration
Planet Hunters Education Guide 67
STANDARDS
AAAS benchmarks
9B/M3*, 9C/M4*, 11B/M1*, 11B/M4**(BSL), 11B/M5**
Common Core• RST 6-8, 3,7,9
• MP2, MP4
Next Generations Science StandardsPerformance Expectations
• MS-ESS1-2, MS-ESS1-3
Dimensions
• Disciplinary Core Ideas
° ESS1.A, 6-8, ESS1.B, 6-8, 9-12
° PS2.B, 6-8
• Crosscutting Concepts:
° Patterns
° Cause and Effect
° Scale, Proportion, and Quantity
° System and System Models
° Structure and Function
• Science & Engineering
° Developing and Using Models
° Planning and Carrying Out Investigations
° Analyzing and Interpreting Data
° Constructing Explanations and Designing
Solutions
° Engaging in Argument from Evidence
MATERIALS
• Student Instructions sheet
• 5 outlet-to-lampholder adapters (available on
Amazon) with power strips or lamps without
shades
• 5 light bulbs of your choice (you could reuse
materials from Lessons 3 and 4)
• 5 round white paper lanterns, these can be
found in multi-packs on Amazon
• 5 sets of 3 different-sized circles to represent
exoplanets. We used construction paper or
cardboard circles glued to craft sticks. Exoplan-
ets should be smaller than the lantern.
• 15 Craft sticks
• Clock with a second hand, or stopwatches
• Blank paper for students to record observations
PREPARE
• Print enough Student Instruction sheets for each
group.
• Screw the bulbs into the outlet-to-lampholder
adapters and plug them in around the room,
with one positioned for you to demonstrate.
Place the white paper lanterns over the light
bulbs.
• Glue each of the circles to a craft stick.
• Set up each lantern with circles and a timing
device.
• A darkened room works best for this activity.
• Hand out blank paper before class starts.
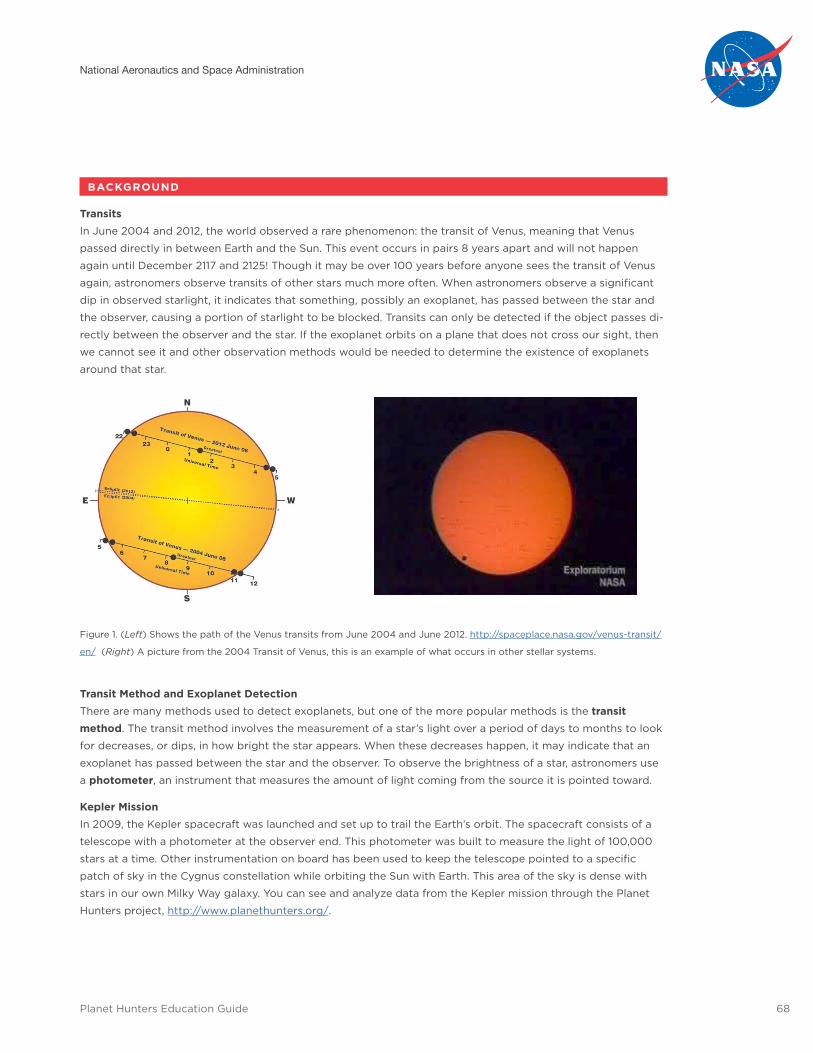
National Aeronautics and Space Administration
Planet Hunters Education Guide 68
BACKGROUND
Transits
In June 2004 and 2012, the world observed a rare phenomenon: the transit of Venus, meaning that Venus
passed directly in between Earth and the Sun. This event occurs in pairs 8 years apart and will not happen
again until December 2117 and 2125! Though it may be over 100 years before anyone sees the transit of Venus
again, astronomers observe transits of other stars much more often. When astronomers observe a significant
dip in observed starlight, it indicates that something, possibly an exoplanet, has passed between the star and
the observer, causing a portion of starlight to be blocked. Transits can only be detected if the object passes di-
rectly between the observer and the star. If the exoplanet orbits on a plane that does not cross our sight, then
we cannot see it and other observation methods would be needed to determine the existence of exoplanets
around that star.
Figure 1. (Left) Shows the path of the Venus transits from June 2004 and June 2012. http://spaceplace.nasa.gov/venus-transit/
en/ (Right) A picture from the 2004 Transit of Venus, this is an example of what occurs in other stellar systems.
Transit Method and Exoplanet Detection
There are many methods used to detect exoplanets, but one of the more popular methods is the transit method. The transit method involves the measurement of a star’s light over a period of days to months to look
for decreases, or dips, in how bright the star appears. When these decreases happen, it may indicate that an
exoplanet has passed between the star and the observer. To observe the brightness of a star, astronomers use
a photometer, an instrument that measures the amount of light coming from the source it is pointed toward.
Kepler Mission
In 2009, the Kepler spacecraft was launched and set up to trail the Earth’s orbit. The spacecraft consists of a
telescope with a photometer at the observer end. This photometer was built to measure the light of 100,000
stars at a time. Other instrumentation on board has been used to keep the telescope pointed to a specific
patch of sky in the Cygnus constellation while orbiting the Sun with Earth. This area of the sky is dense with
stars in our own Milky Way galaxy. You can see and analyze data from the Kepler mission through the Planet
Hunters project, http://www.planethunters.org/.
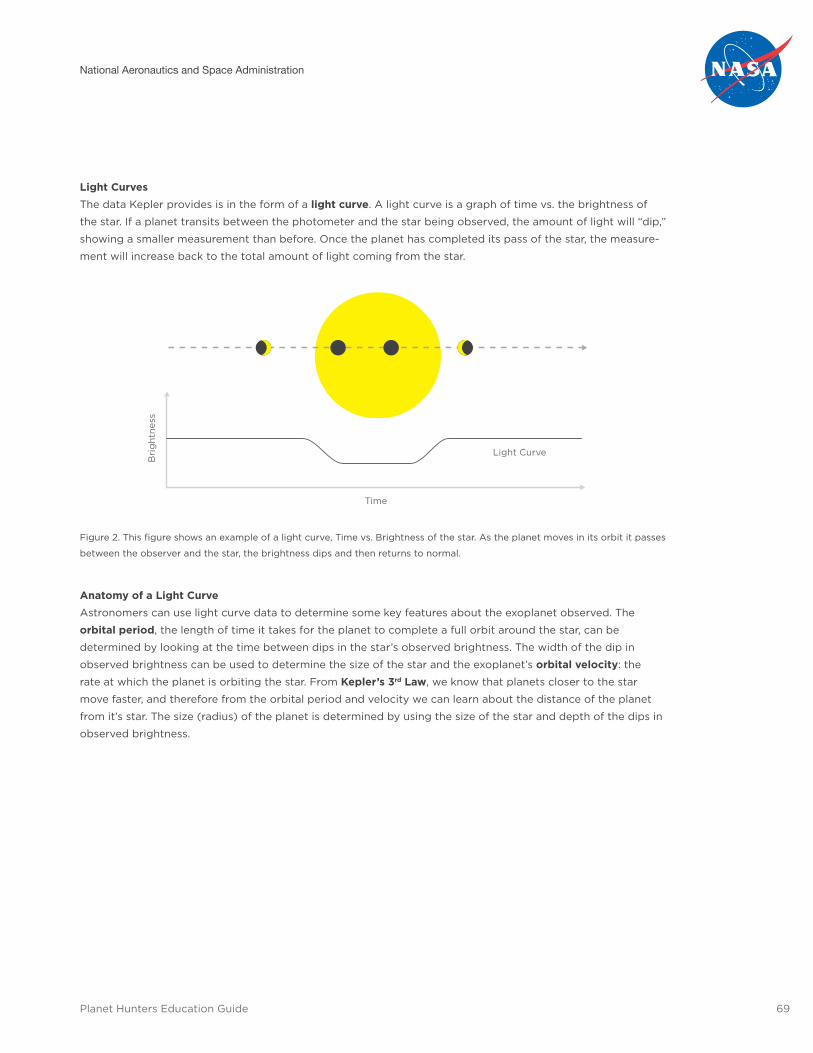
National Aeronautics and Space Administration
Planet Hunters Education Guide 69
Light Curves
The data Kepler provides is in the form of a light curve. A light curve is a graph of time vs. the brightness of
the star. If a planet transits between the photometer and the star being observed, the amount of light will “dip,”
showing a smaller measurement than before. Once the planet has completed its pass of the star, the measure-
ment will increase back to the total amount of light coming from the star.
Figure 2. This figure shows an example of a light curve, Time vs. Brightness of the star. As the planet moves in its orbit it passes
between the observer and the star, the brightness dips and then returns to normal.
Anatomy of a Light Curve
Astronomers can use light curve data to determine some key features about the exoplanet observed. The
orbital period, the length of time it takes for the planet to complete a full orbit around the star, can be
determined by looking at the time between dips in the star’s observed brightness. The width of the dip in
observed brightness can be used to determine the size of the star and the exoplanet’s orbital velocity: the
rate at which the planet is orbiting the star. From Kepler’s 3rd Law, we know that planets closer to the star
move faster, and therefore from the orbital period and velocity we can learn about the distance of the planet
from it’s star. The size (radius) of the planet is determined by using the size of the star and depth of the dips in
observed brightness.
Time
Light Curve
Bri
ght
ness
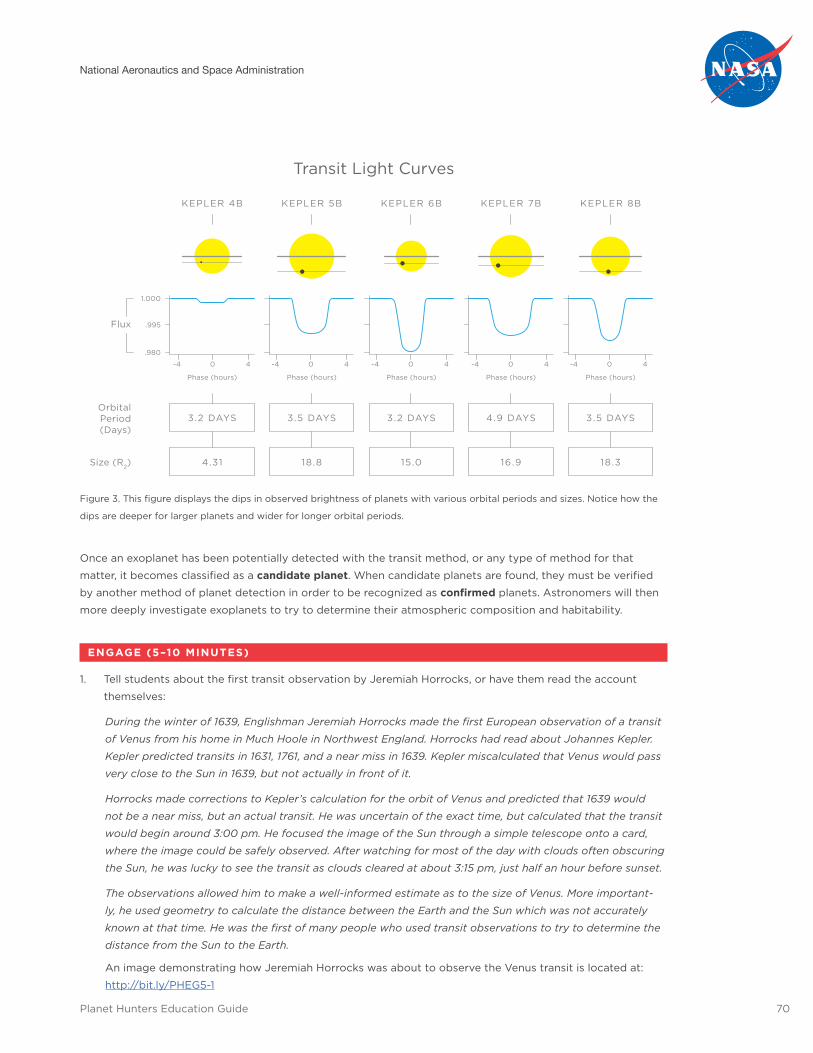
National Aeronautics and Space Administration
Planet Hunters Education Guide 70
Figure 3. This figure displays the dips in observed brightness of planets with various orbital periods and sizes. Notice how the
dips are deeper for larger planets and wider for longer orbital periods.
Once an exoplanet has been potentially detected with the transit method, or any type of method for that
matter, it becomes classified as a candidate planet. When candidate planets are found, they must be verified
by another method of planet detection in order to be recognized as confirmed planets. Astronomers will then
more deeply investigate exoplanets to try to determine their atmospheric composition and habitability.
ENGAGE (5–10 MINUTES)
1. Tell students about the first transit observation by Jeremiah Horrocks, or have them read the account
themselves:
During the winter of 1639, Englishman Jeremiah Horrocks made the first European observation of a transit
of Venus from his home in Much Hoole in Northwest England. Horrocks had read about Johannes Kepler.
Kepler predicted transits in 1631, 1761, and a near miss in 1639. Kepler miscalculated that Venus would pass
very close to the Sun in 1639, but not actually in front of it.
Horrocks made corrections to Kepler’s calculation for the orbit of Venus and predicted that 1639 would
not be a near miss, but an actual transit. He was uncertain of the exact time, but calculated that the transit
would begin around 3:00 pm. He focused the image of the Sun through a simple telescope onto a card,
where the image could be safely observed. After watching for most of the day with clouds often obscuring
the Sun, he was lucky to see the transit as clouds cleared at about 3:15 pm, just half an hour before sunset.
The observations allowed him to make a well-informed estimate as to the size of Venus. More important-
ly, he used geometry to calculate the distance between the Earth and the Sun which was not accurately
known at that time. He was the first of many people who used transit observations to try to determine the
distance from the Sun to the Earth.
An image demonstrating how Jeremiah Horrocks was about to observe the Venus transit is located at:
http://bit.ly/PHEG5-1
KEPLER 4B
Flux
OrbitalPeriod(Days)
Size (R2)
KEPLER 5B KEPLER 6B KEPLER 7B KEPLER 8B
3.2 DAYS 3.5 DAYS 3.2 DAYS 4.9 DAYS 3.5 DAYS
4.31 18.8 15.0 16.9 18.3
Phase (hours)Phase (hours)Phase (hours)Phase (hours)Phase (hours)
1.000
.980
-4 40
.995
-4 40 -4 40 -4 40 -4 40
Transit Light Curves
National Aeronautics and Space Administration
Planet Hunters Education Guide 71
2. Ask students what Johannes Kepler had meant by a near miss.
• What was the key to being able to see the transit of Venus? [It had to pass directly between our ob-
servational view on Earth and the Sun.]
EXPLORE (25 MINUTES)
1. Arrange students around a paper lantern light. Explain to students that the lantern represents a star and
the circles are planets. Students should focus on the light of the surface of the lantern when the planets
pass between them and the star.
2. Demonstrate a transit by moving the large “planet” around the “star,” causing the “planet” to pass in front
of it. Be sure that the star is placed at a height that meets the class’s eye level and that the planet is pass-
ing in front of the middle region of the star.
• Some students may need to adjust their height by standing or crouching. After a show of hands indi-
cates that everyone can see that event, confirm that is what is meant by a transit.
3. Ask students to predict what conditions might affect what we observe in the amount of starlight through-
out a transit.
• Would the transit of Jupiter appear the same as Mercury if we were able to observe them? What
would be different? What conditions would influence changes in the measurement of light or data?
[Size of planet, Distance from star, Orbital period]
4. Divide students into groups of 4-6 for each star station. Each group should decide who will have which
role, and switch places with each other for each test so that everyone gets a chance to observe what is
happening.
• Data recorders – these students will record all observations. They should take notes on what they see
for each test completed.
• Planet mover – this student will move the planets around the star. They will need to try to keep a
steady pace and distance for the planets for each test.
5. Using a circle, have student groups create a model that demonstrates the “planet” transitingthe “star” to
answer the questions:
• How can a planet orbit a star and still be seen from an observer’s point of view?
• Is there a path that a planet could orbit a star that could not be seen by an observer?
i. Is there a way that the transiting planet could be observed without altering the path of the orbit?
What would have to change? [the observer’s location]
ii. Going back to your original transit model, and without changing the orbital path, is there a place
from which the observer would not be able to observe the transit?
National Aeronautics and Space Administration
Planet Hunters Education Guide 72
6. Have student groups model examples of different transit paths.
• Can everyone in the class see them? What needs to happen so they can?
• Alternatively, to save time, you can have student volunteers demonstrate different positional possibil-
ities that the object could orbit the star, and hold a larger group discussion that shares observation
and offers response feedback.
7. Instruct students to now use the materials to create different models that allow them to observe the
effects of changes in the conditions of planet size, orbital period, and distance from the star. Students
should record their results.
• Students could time orbital periods to measure empirically the changes in time.
• Which materials will help you to observe transits of planets of different sizes? How will you change
distance from a star? How will you vary the orbital period?
• Alternatively, to save time, you can have different groups design models to explore one of the condi-
tions apiece and report back to the class.
EXPLAIN (10 MINUTES)
1. Reconvene students and discuss observations.
• What happened when you observed planets of different sizes? [They blocked different amounts of
light.]
• What happened when the distance was changed? Was there a connection to the distance from the
star and orbital period? [The further the planet, the longer the orbital period.]
• How did you create changes in the orbital period?
ELABORATE (15 MINUTES)
1. Show students this video demonstrating a transit and the resulting decrease in starlight: http://bit.ly/
PHEG5-2
2. Explain that the graph in the video is called a light curve. Point out that the x-axis represents time and the
y-axis represents the brightness of the starlight. A star is observed over time and its observed brightness
is recorded in a graph like this. Astronomers can then look for places where light decreases, or dips, in the
light curve. One explanation for dips is that a planet could be transiting the star.
3. Using the lantern again, demonstrate a transit again using the smallest planet, making it last 20 seconds
and orbiting it close to the star (representing the orbital velocity and period of the planet). Choose a stu-
dent to time the transit and mark every five seconds out loud.
4. Ask students to determine a percentage scale that would express how much light was blocked from the
star over a period of time, with 0% being all light is visible and 100% being no light is visible.
• Alternatively, you would preselect percentages for each of the 3 planets and give that information to
students.
National Aeronautics and Space Administration
Planet Hunters Education Guide 73
5. How much light was visible before the planet transited? As it began? In the middle? In the end? Was there
a difference at the beginning and middle, or was it relatively the same?
6. Have students draw a light curve representing the brightness of the star in % (y-axis) and the time in sec-
onds (x-axis).
7. Repeat this again using the medium size planet and making it last 40 seconds and further from the star.
Then again using the large size planet and making it last 60 seconds and further from the star.
8. Have student volunteers draw their graphs on the board for each of the 3 planets. Discuss the differences
they notice between the graphs.
• What does the depth of the light curve tell you about the planet?
• What does the width of the light curve tell you about the planet?
EVALUATE (5 MINUTES)
1. At the bottom of their sheet of light curves, have each student describe what a light curve is. Check that
this meets how you described it to the class.
2. Ask students to evaluate each other’s light curves. You could collect them all and pass random light curves
back or just have students partner up to discuss with each other about their light curves.
3. Collect the light curves from students and check for accuracy. Things to check for:
• They should have drawn a gradual dip to show that only part of the starlight was being blocked at
the beginning and end of the transit.
• They should have marked the y-axis with the percentages and have the point of total transit at the
appropriate y-axis point.
EXTENSION ACTIVITIES
1. Have student return to their groups and draw light curves for examples from the Explore section.
Planet Hunters Education Guide 74
Student Roles & Instruction
ROLES
Data Recorders• Record all observations
• Take notes on what you see for each test completed
Planet Movers• Move the planets around the star
• Try to keep a steady pace and distance for that planet for each test
GUIDING QUESTIONS
Part 1
• How can a planet orbit a star and still be seen from an observer’s point of view?
• Is there a path on which a planet could orbit a star that could not be seen by an observer?
° Is there a way that the transiting planet could be observed, without altering the path of the orbit?
What would have to change?
° Going back to your original transit model, and without changing the orbital path, is there a place
where the observer would not be able to observe the transit?
Part 2
• How do planet size, orbital period, and distance from the star impact the appearance of a transit?
° Which materials will help you to observe transits of planets of different sizes?
° How will you change the distance from star?
° How will you vary the orbital period?
National Aeronautics and Space Administration
Planet Hunters Education Guide 75
Lesson 6
Using Planet Hunters
OVERVIEW
This lesson acquaints students with the Planet Hunters (www.planethunters.org) citizen science project by
researching its goals, learning about the project’s science, and participating in the search for exoplanets. Stu-
dents will watch a video tutorial that explains how the Planet Hunters website works, engage in analyzing light
curves and look for possible transits that might indicate the presence of exoplanets.
STUDENT PREREQUISITE KNOWLEDGE
None
OBJECTIVES
Students will be able to:
• Describe how the Planet Hunters website helps
detect exoplanets through crowdsourcing
• Identify that multiple people look at each light
curve to eliminate human error
CONCEPTS
Planet Hunters is an online citizen science web project that assists scientists with identifying possible exoplanet
transits in light curve data. Crowdsourcing is when many people work together to make a big problem much
more manageable. Multiple people look at each light curve to confirm whether or not more than one person
agrees if a particular dip in the light curve could indicate a transit.
STANDARDS
AAAS Benchmarks: 1B/M1b*, 1C/M1, 1C/M3, 1C/M6*, 3A/M2, 3C/M2*,
Common Core: RST 6-8, 3, 7, 9
Next Generations Science Standards: Dimensions:
• Crosscutting Concepts:
° Patterns
• Science and Engineering Practices
° Analyzing and Interpreting Data
° Using Mathematics and Computational
Thinking
° Obtaining, Evaluating and Communicating
Information
MATERIALS
• Computer access for students in pairs or small
groups
• Zooniverse accounts for each group
° An email is needed for this, but with a sin-
gle Gmail account you may set up multiple
Zooniverse accounts for the whole class.
• Planet Hunters Star ID chart, one per computer
• Confirmed Exoplanet collection: http://talk.
planethunters.org/#/collections/CPHS0000d9
45 – 60 minutes
National Aeronautics and Space Administration
Planet Hunters Education Guide 76
PREPARE
• Print out the Planet Hunter Star ID chart, one per computer.
• Sign up for the appropriate number of Zooniverse accounts, one account per computer.
° To do this you may use one single Gmail address by adding a + after the screen name and then a new
screen name behind it, for example:
If your email address is [email protected], to create a different account you could just add jsmith+-
[email protected] and then change “student1” to “student2” for the next account, and so on. Every-
thing after the + and before the @ is ignored when emailing you, but Zooniverse sees it as a different
email.
• Prepare computers with the Planet Hunters page pulled up, the accounts signed into, and the site ready
for use.
• Students should be evenly divided into groups among the computers.
• Preview the tutorial and tour video on www.planethunters.org. Familiarize yourself with the information
and the site. The tour video can be found in the resources section of the Education tab.
• It is unlikely that students will find a transit during a single session of classifying on Planet Hunters. There-
fore, the Confirmed Exoplanet collection should be provided (you can have it open in another window or
tab of the browser) for each group to give students examples of light curves where confirmed exoplanets
have been seen. Students will need to select a star in the collection to see the light curves from that star.
BACKGROUND
Planet Hunters and the Kepler Mission
Planet Hunters, a project from the Zooniverse, is a citizen science project aimed at locating potential exoplan-
ets orbiting around stars outside of our Solar System. Participants help search through data taken by NASA’s
Kepler spacecraft for possible exoplanet transits. Transits can be observed with decreases in brightness of a
star’s light, which indicates that something, potentially an exoplanet, is blocking part of the starlight as ob-
served by Kepler.
In March 2009, the Kepler spacecraft was launched and set up to trail the Earth’s orbit. The spacecraft consists
of a telescope with a photometer at the observing end. It measures the brightness of 100,000 stars in a patch
of sky located in the Cygnus constellation. This area of the sky is dense with stars in our own Milky Way galaxy.
The Kepler mission data consists of light curves, graphs of time versus brightness of a light source, which are
extended with each data download from the Kepler spacecraft. Therefore Planet Hunters participants can fol-
low one star for years to hunt for exoplanets.
Why Not Computers?
Although computer algorithms exist to search for exoplanet transits in the light curve data, computers have
been shown to have difficulties detecting small differences in data. Therefore, Planet Hunters participants
may be better than computers at finding unusual planetary systems in this type of data because of the human
brain’s outstanding capacity for pattern recognition. The most difficult detections for computer-based searches
are those of smaller planets (since the Kepler photometer may not be sensitive enough to detect exoplanets
blocking out less light than an Earth size object) and planets that orbit far from their star (since they so infre-
quently cross between our line of sight and the star).
National Aeronautics and Space Administration
Planet Hunters Education Guide 77
More than one participant looks at each single light curve to give scientists more accurate results from Planet
Hunters. If 20 people look at a light curve and 14 point out the same dip as being a potential exoplanet transit,
then it is much more likely to be a potential exoplanet.
Exoplanet Discovery
Each star that Kepler looks at is assigned a number unique to it. Planet Hunters gives it a separate number
to keep the identity of the star’s ID protected; this ensures that any efforts that lead to a planetary discovery
can be properly credited by Planet Hunters scientists. All participants involved in the discovery of a candidate
exoplanet are credited for the breakthrough (with their consent). The participants’ user names are noted on the
Planet Hunters website in the Candidate list, and scientists will keep those users up to date on the status of the
potential exoplanet.
ENGAGE (10 MINUTES)
1. Demonstrate the Planet Hunters website for students. Show the class how to register so they can begin
hunting planets. You may want to consider watching the tutorial video found in the drop down menu un-
der Tutorial on the tool bar.
2. Demonstrate where to find the background information about Planet Hunters (it can be found in the Sci-
ence section).
3. Review with students how to expand the time and change-in-brightness axes to look more closely at the
light curve and to reveal more precise information.
4. Show students some examples light curves with transits, from the Confirmed Exoplanet collection.
• Suggested examples are: APH000067z (3.7 day period, dips at days 1, 4.7, 8.4, 12.1, etc. in Q2.3), APH-
00006qb (dip at day 0.2, 10.9, 21.65, 32.3 in Q9.1), and APH00004rl (dip at day 7.25 in Q1.1)
EXPLORE (30 MINUTES)
1. In groups, have students go through the practice tutorial, which begins when you first start classifying on
that account or with a click on the tutorial button when at the classification screen.
2. Have all students put their names on the Planet Hunter Star ID chart at their computer, if you plan to col-
lect it.
3. Encourage students to move on to another light curve when all students in the group agree on whether or
not a transit is seen. This should help them with discussing whether a dip is indeed a transiting exoplanet
and in understanding why multiple people look at each light curve.
4. Inform students that as they work they will need to keep track of the light curves that they analyze,
recording the identification number of the images they look at on the Planet Hunter Star ID chart. If they
classify more than can fit on the sheet they should keep track of the total count of classifications they
make.
• This will help them be able to look them up later to discuss if needed. You can look them up by look-
ing at your user profile page.
5. Ask students to record whether a transit was observed or not and any questions that came up as the
group classified the light curve.
• Remember, finding a transit is rare!
National Aeronautics and Space Administration
Planet Hunters Education Guide 78
6. If students think they have identified a transit, have them record the time of the transits and the average
period between them.
7. If students are getting into their fifth light curve and not seeing a transit, which is highly likely, then pro-
vide the link to the Candidate Exoplanet list for students to mark known transits on their Planet Hunter
Star ID chart
8. Give students time to use the site and record their experiences before reconvening. Request that they re-
cord any questions that came up for them as individuals, or in the group, as they participate in the activity.
EXPLAIN (10 MINUTES)
1. Have students share what they observed and questions that came up for them.
2. Discuss the goals of the Planet Hunters project with the students:
• What do you think are the goals of this project? [One of the goals of Planet Hunters is to explore
the diversity of the terrestrial and giant planet populations and begin to understand the spectrum of
solar systems.]
• Do you think only one person looks at each light curve? Why or why not?
3. Inform students that multiple people look at a single light curve.
• Why do they think this is? [To make the result more accurate; if, say, 14 out of 20 said there was a
potential transit in a lightcurve, then there likely is a potential transit in the image.]
ELABORATE (10 MINUTES)
1. Inform students that the task they did is a form of crowdsourcing; the process of obtaining needed
information or assistance by soliciting contributions from a large group of people (especially from an
online community) rather than from traditional employees or professionals. In the case of Planet Hunters,
crowdsourcing is used to make a big data problem much more manageable with the help of a large group
of people who help to analyze the data.
• Discuss with students how many classifications they did, and then add up what the entire class did in
that class period.
i. Do you think one scientist could get that much done in that amount of time? Why? [Although
scientists may be professionals in the field it is not possible for them to accomplish as much as a
class-sized number of people can in the same amount of time.]
• Discuss how classifying in groups worked. This is meant to connect with the fact that multiple people
look at a single light curve, which brings about more accurate results.
° Did you all agree every time on whether or not there was a transit in an image?
° In this project more than one person looks at a single light curve. Why do you think that is? [This
makes for more accurate results; if 14 out of 20 people say there is a transit then there likely is a
transit.]
EVALUATE (TAKE HOME)
1. Ask students to make a recruitment poster to try to get others interested in participating in Planet
Hunters.
• Why should people get involved in Planet Hunters?
• How can people get involved in Planet Hunters?

National Aeronautics and Space Administration
Planet Hunters Education Guide 79
EXTENSIONS ACTIVITIES
1. Another great citizen project for students to participate in is Disk Detective (http://www.diskdetective.
org/), which gives volunteers a chance to look for young planet-forming stellar systems.
ADDITIONAL RESOURCES
1. NASA Kepler Missions website: http://kepler.nasa.gov/
2. NASA PlanetQuest website: http://planetquest.jpl.nasa.gov/
3. Article from NASA on the Kepler instrumentation failure: http://www.nasa.gov/content/nasa-ends-
attempts-to-fully-recover-kepler-spacecraft-potential-new-missions-considered/#.U3OJBeZdUyA
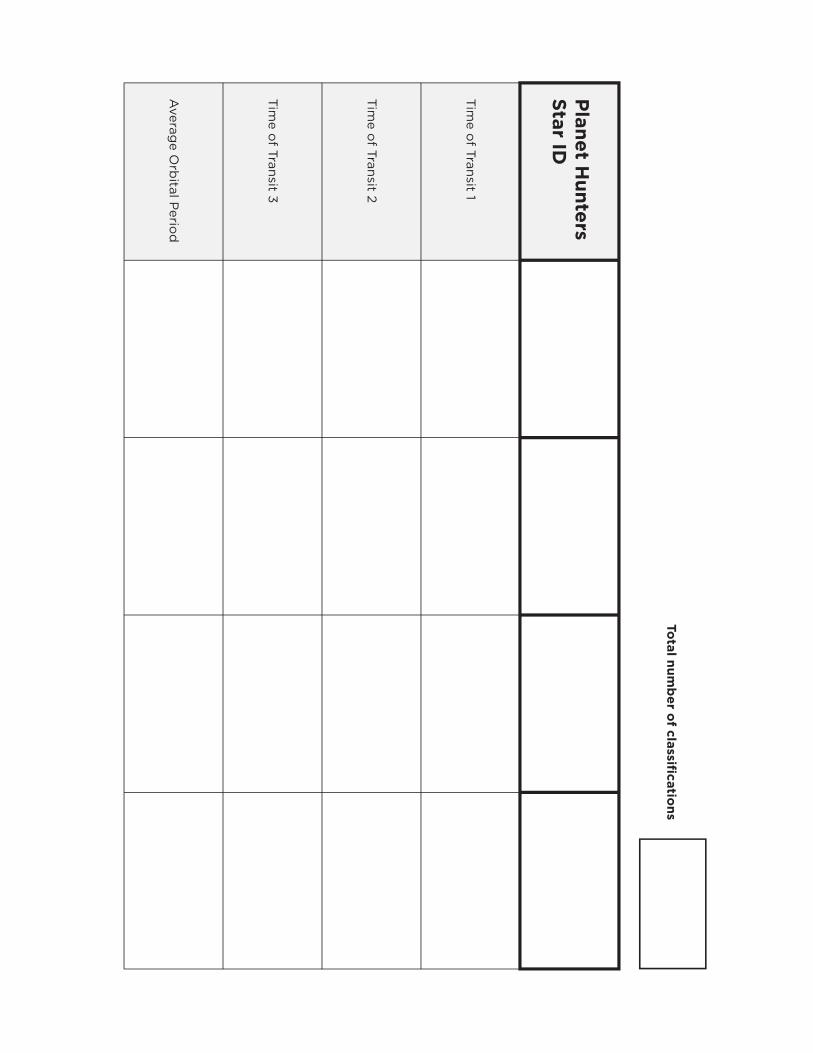
National Aeronautics and Space Administration
Planet Hunters Education Guide 81
Lesson 7
Creating and Interpreting Light Curves
OVERVIEW
In this activity, students will interpret light curves to determine exoplanets’ characteristics, including size,
period, and distance from a star. Students will calculate the orbital period and use it to identify the distance be-
tween the detected planet and the host star using graphs displaying calculations based on Kepler’s Third Law.
STUDENT PREREQUISITE KNOWLEDGE
Students should be familiar with:
• Mathematical averages and reading graphs
• Inferring and synthesizing data from multiple
sources
• (Optional) Kepler’s Laws of Motion
OBJECTIVES
Students will be able to:
• Use light curves to determine an exoplanet’s
size, orbital period, and distance from its star
• Identify the orbital period of a candidate planet
from a light curve
• Determine the orbital distance of a candidate
planet from its host star using a graph of Ke-
pler’s Third Law
CONCEPTS
An exoplanet’s size, orbital period, and distance can be estimated from its transit displayed in the light curve
of its star. Kepler’s third law of planetary motion allows us to determine the distance of the exoplanet from the
star.
STANDARDS
AAAS Benchmarks: 1 C/M6*, 4B/M2cd, 9B/M2*, 9B/M3*, 9C/M4*, 11B/M1*,
11B/M4** (BSL), 11B/M5**, 12C/M3* , 12D/M1, 12D/M2
Common Core:• RST 6-8, 3,7,9
• MP2, MP4
Next Generations Science Standards: Performance Expectations:
• MS-ESS1-2, MS-ESS1-3
• HS-ESS1-4
• MS-PS2-4
Dimensions:
• Disciplinary Core Ideas
° ESS1.A, 6-8, ESS1.B, 6-8, 9-12
° PS2.B, 6-8
• Crosscuttting Concepts
° Patterns
° Cause and Effect
° Scale, Proportion, and Quantity
° System and System Models
° Stability and Change
• Science and Engineering Practices:
° Asking Questions and Defining Problems
° Developing and Using Models
° Planning and Carrying Out Investigations
° Analyzing and Interpreting Data
° Using Mathematics and Computational
Thinking
° Constructing Explanations and Designing
Solutions
45 – 60 minutes
National Aeronautics and Space Administration
Planet Hunters Education Guide 82
MATERIALS
• Tape or meter stick
• Clock with a second hand or stopwatches
• 5 outlet-to-lampholder adapters (available on
Amazon) with power strips or lamps without
shades
• 5 round white paper lanterns (these can be
found in multi-packs on Amazon)
• 5 x 3 different-sized circles to represent exo-
planets. Planets should be smaller than lantern.
We used construction paper or cardboard glued
to craft sticks.
• 5 light meters
° You could use a light meter app on a mobile
device with a camera (there are many free
ones available for both Android and iOS).
° NASA has developed light-graphing soft-
ware for computers using your webcam:
http://kepler.nasa.gov/education/
ModelsandSimulations/lightgrapher/
• Kepler’s Third Law graphs
• Planetary Motion and Light Curves presentation,
located on ZooTeach (http://www.zooteach.org/
resources/121)
• Homework sheets
• Graph paper or printed-out graph paper (See
http://www.printfreegraphpaper.com/)
• Paper, for note taking
PREPARE
• Screw the bulbs into the light sockets and plug
them in around the room, with one positioned
for you to demonstrate. Place the white paper
lanterns over the light bulbs.
• Glue each of the circles to a craft stick.
• Set up each lantern with circles and timing
device.
• A darkened room works best for this activity.
• Print enough Kepler’s Third Law graphs and
Homework sheets for each student.
• Hand out blank paper and graphing paper be-
fore class starts.
BACKGROUND
What Are Light Curves and What Can They Tell Us?
When astronomers want to study a star, they will often measure the light coming from that star with a pho-
tometer and graph it, creating a light curve. Light curves are graphs that show the level of observed brightness
of a light source measured over a period of time. The graph is set up with time as the x-axis and the star’s
observed brightness on the y-axis. Light curves can be used to search for exoplanets transiting across their
host stars by looking for decreases or dips in the brightness of the star. These dips may indicate that an object,
possibly an exoplanet, has passed between the observer and the star (see Figure 1). Sometimes these dips are
a result of a binary star system and the dip is the partner star transiting the observed star. However, binary
stars exhibit transits more erratically, while exoplanets transit fairly predictably. If a transit is spotted in light
curve data three or more times, and the period between the transits is consistent, then this is a good indication
that what is being observed is a candidate exoplanet travelling in front of the star.
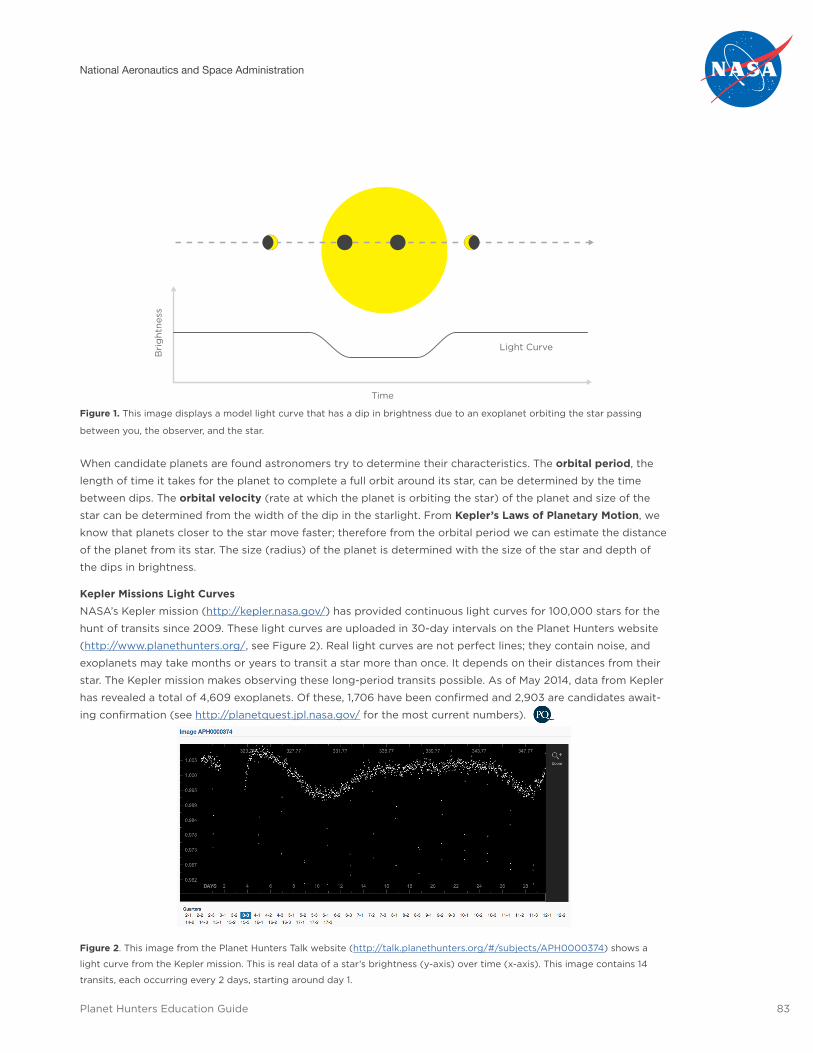
National Aeronautics and Space Administration
Planet Hunters Education Guide 83
Figure 1. This image displays a model light curve that has a dip in brightness due to an exoplanet orbiting the star passing
between you, the observer, and the star.
When candidate planets are found astronomers try to determine their characteristics. The orbital period, the
length of time it takes for the planet to complete a full orbit around its star, can be determined by the time
between dips. The orbital velocity (rate at which the planet is orbiting the star) of the planet and size of the
star can be determined from the width of the dip in the starlight. From Kepler’s Laws of Planetary Motion, we
know that planets closer to the star move faster; therefore from the orbital period we can estimate the distance
of the planet from its star. The size (radius) of the planet is determined with the size of the star and depth of
the dips in brightness.
Kepler Missions Light Curves
NASA’s Kepler mission (http://kepler.nasa.gov/) has provided continuous light curves for 100,000 stars for the
hunt of transits since 2009. These light curves are uploaded in 30-day intervals on the Planet Hunters website
(http://www.planethunters.org/, see Figure 2). Real light curves are not perfect lines; they contain noise, and
exoplanets may take months or years to transit a star more than once. It depends on their distances from their
star. The Kepler mission makes observing these long-period transits possible. As of May 2014, data from Kepler
has revealed a total of 4,609 exoplanets. Of these, 1,706 have been confirmed and 2,903 are candidates await-
ing confirmation (see http://planetquest.jpl.nasa.gov/ for the most current numbers).
Figure 2. This image from the Planet Hunters Talk website (http://talk.planethunters.org/#/subjects/APH0000374) shows a
light curve from the Kepler mission. This is real data of a star’s brightness (y-axis) over time (x-axis). This image contains 14
transits, each occurring every 2 days, starting around day 1.
Time
Light Curve
Bri
ght
ness

National Aeronautics and Space Administration
Planet Hunters Education Guide 84
Determining Size, Period, and Distance from Light Curves
If we look at the drop in brightness of the transit, we can tell the size of the exoplanet. Larger bodies block
more light than smaller bodies. To estimate the exact radius, we would first need to determine the size of the
star and then compare it to the drop in brightness. This will be done in Lesson 8: Calculating Exoplanet Charac-
teristics.
The time lapse between transits, or orbital period, of the exoplanet can be determined from the light curves by
calculating the difference in time between the transits. If the first transit occurs at about 6.9 days, the second
at 16.78 days, and the third at 26.65 days, then by averaging the periods between transits a mean orbital period
is found:
First observed period = 16.78 days – 6.9 days = 9.88 days
Second observed period = 26.65 days – 16.78 = 9.87 days
This candidate planet has an orbital period of 9.88 days. The orbital period not only tells astronomers the
length of the exoplanet’s year, but can also be used to determine the distance the exoplanet is from its host
star. We can estimate the distance from the star using the Kepler’s Third Law graph (see Figure 3). According
to the graph, this planet is about 13.5 million km from its star.
Figure 3. A graph of Kepler’s Third Law of Planetary Motion. Students will use graphs like this to estimate the distance of the
exoplanet from its star. This graph is for a Sun-like star.
TP = ri =
P2 =
p1 = d2 – d1
p2 = d3 – d2
(p3 + p2)
= L(1 – A) R2TS
4(1–A)16
2
4a2a2
L1.1
4 2
G(m + M)
p =
14
14
Surface Temp Lesson 3
Lesson 7
Density
Kepler’s Third Law
Orbital Period
a3
ro = L
0.53
Mean orbital period =
V = r3
= 9.88 days(9.88 days + 9.87 days)
2
4
3d =
m
v
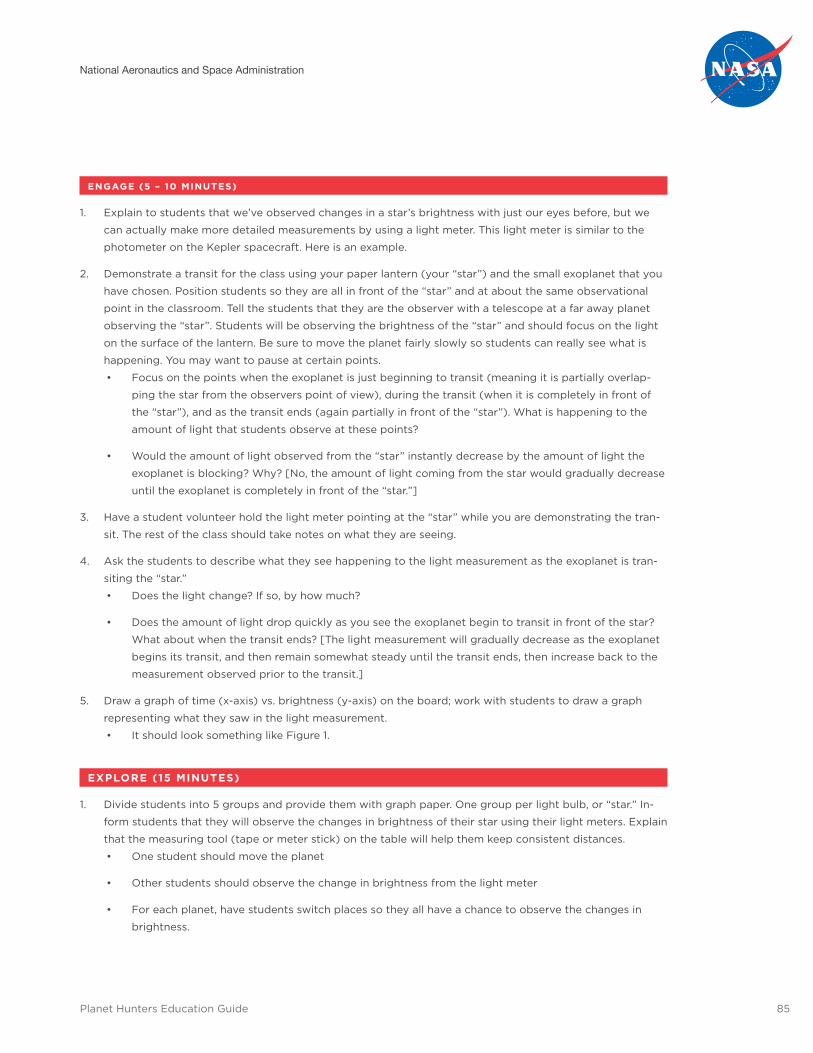
National Aeronautics and Space Administration
Planet Hunters Education Guide 85
ENGAGE (5 – 10 MINUTES)
1. Explain to students that we’ve observed changes in a star’s brightness with just our eyes before, but we
can actually make more detailed measurements by using a light meter. This light meter is similar to the
photometer on the Kepler spacecraft. Here is an example.
2. Demonstrate a transit for the class using your paper lantern (your “star”) and the small exoplanet that you
have chosen. Position students so they are all in front of the “star” and at about the same observational
point in the classroom. Tell the students that they are the observer with a telescope at a far away planet
observing the “star”. Students will be observing the brightness of the “star” and should focus on the light
on the surface of the lantern. Be sure to move the planet fairly slowly so students can really see what is
happening. You may want to pause at certain points.
• Focus on the points when the exoplanet is just beginning to transit (meaning it is partially overlap-
ping the star from the observers point of view), during the transit (when it is completely in front of
the “star”), and as the transit ends (again partially in front of the “star”). What is happening to the
amount of light that students observe at these points?
• Would the amount of light observed from the “star” instantly decrease by the amount of light the
exoplanet is blocking? Why? [No, the amount of light coming from the star would gradually decrease
until the exoplanet is completely in front of the “star.”]
3. Have a student volunteer hold the light meter pointing at the “star” while you are demonstrating the tran-
sit. The rest of the class should take notes on what they are seeing.
4. Ask the students to describe what they see happening to the light measurement as the exoplanet is tran-
siting the “star.”
• Does the light change? If so, by how much?
• Does the amount of light drop quickly as you see the exoplanet begin to transit in front of the star?
What about when the transit ends? [The light measurement will gradually decrease as the exoplanet
begins its transit, and then remain somewhat steady until the transit ends, then increase back to the
measurement observed prior to the transit.]
5. Draw a graph of time (x-axis) vs. brightness (y-axis) on the board; work with students to draw a graph
representing what they saw in the light measurement.
• It should look something like Figure 1.
EXPLORE (15 MINUTES)
1. Divide students into 5 groups and provide them with graph paper. One group per light bulb, or “star.” In-
form students that they will observe the changes in brightness of their star using their light meters. Explain
that the measuring tool (tape or meter stick) on the table will help them keep consistent distances.
• One student should move the planet
• Other students should observe the change in brightness from the light meter
• For each planet, have students switch places so they all have a chance to observe the changes in
brightness.
National Aeronautics and Space Administration
Planet Hunters Education Guide 86
2. First, students will use their 3 different sized planets at the same distance and same speed (the student
holding the planet will need to try to keep a steady speed).
• The students around the meter should draw out light curves for each planet.
• (Before they start) How do they think exoplanet size will impact the light curve?
• (After they complete the task) What difference do they observe in the light curves between the 3
different planets?
3. Second, students will use the smallest planet at the same speed to transit the star at 3 different distances
(10 cm, 20 cm, and 30 cm).
• The students around the meter should draw out light curves for each planet.
• (Before they start) How do they think distance from star will impact the light curve?
• (After they complete the task) What difference do they observe in the light curves between the 3
different distances?
4. Third, students will use the smallest planet at the same distance to transit the star at 3 different speeds
(slow, medium or the same speed they used in the last two steps, and fast)
• The students around the meter should draw out light curves for each planet.
• (Before they start) How do they think orbital speed will impact the light curve?
• (After they complete the task) What difference do they observe in the light curves between the 3
different speeds?
EXPLAIN (15 MINUTES)
1. Bring the students together as a class to discuss their observations:
• How did each of these factors (planet size, distance from star, and rate of orbit) independently affect
the light curves? Compare the light curves.
2. Give Planetary Motion and Light Curves presentation to the class.
• Talking points:
i) (Slide 1) Johannes Kepler developed laws of motion based on how the planets moved in our So-
lar System. These first two laws focuses on how planets orbit around stars and on orbital speed
and period.
ii) (Slide 2) Kepler’s third law relates the orbital period of the planet to the average distance from
the planet (or semi-major axis). For this lesson, they do not need to calculate the result; rather,
graphs will be provided to derive the solution.
3. With Slide 3, the real light curve, discuss with students what they see and can determine with what they
learned from their experiment:
• Is this what you expected a real light curve to look like? Why do you think it is different from the light
curves you drew in your groups?
National Aeronautics and Space Administration
Planet Hunters Education Guide 87
4. With Slide 4, the real light curve from your Background information, discuss with students what they see
and can determine from what they know:
• Do you think you see any transits in this light curve? If so how many?
• What can you determine about this exoplanet from this light curve?
i) Size?
ii) Period?
iii) Distance?
ELABORATE (10 MINUTES)
1. Using their copy of the light curve image from the last slide ask students to mark the times at which each
transit occurs.
2. Have them use these times to calculate the orbital period of the planet.
• First, they need find the orbital periods between each transit.
• Second, they should average them together to find the mean.
3. Now that students have the mean orbital period, give them the Kepler’s Third Law graphs so they can esti-
mate the distance of the planet from its star.
4. Have student volunteers compare their data with the class, you should compare this with the information
in the background.
EVALUATE (5 MINUTES)
1. Give students the Homework sheet and a sheet of graph paper. Do the first problem with them, and then
ask them to take the rest home to work out and return the next class period. We have provided the Home-
work Answers to aid your evaluation.
HOMEWORK ACTIVITIES
1. Show students the Planet Hunters blog, where they can find postings on research that the scientists and
citizen scientists have done on the project: http://planethunting.wordpress.com/
2. Set students up at computers and let them play around with the Exoplanet Transit Simulator (http://astro.
unl.edu/naap/esp/animations/transitSimulator.html) produced by The Astronomy Department at Universi-
ty of Nebraska – Lincoln. Students can check that their hypotheses from class are accurate.
ADDITIONAL ACTIVITIES
1. “What types of variable stars are in the Kepler target field?” http://kepler.nasa.gov/science/about/target-
FieldOfView/stellarVariability/lightcurves/
2. Light curve examples of multi-planet systems - a Planet Hunters participant has written about some of
these in his blog http://planethunting.wordpress.com/2013/02/.
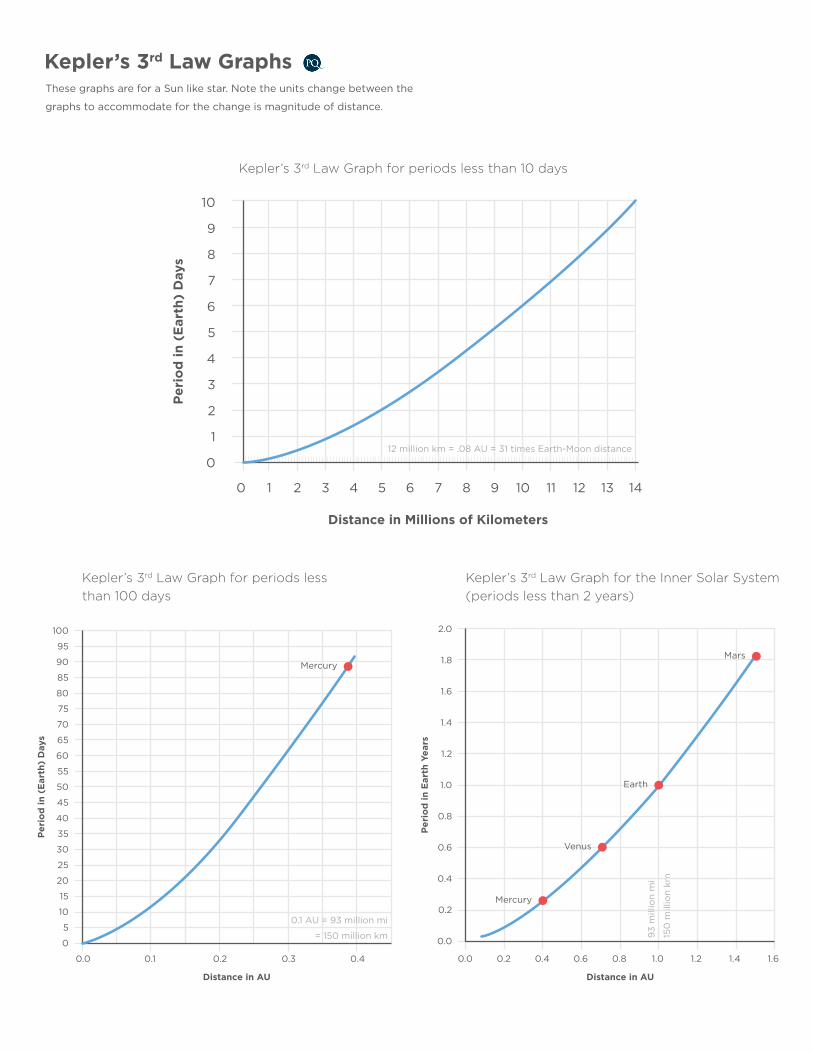
10
9
8
7
6
5
4
3
2
1
0
0 1 2 3 4
12 million km = .08 AU = 31 times Earth-Moon distance
Distance in Millions of Kilometers
Per
iod
in (
Ear
th)
Day
s
5 6 7 8 9 10 11 12 13 14
100
0
5
10
15
20
25
30
35
40
45
50
55
60
65
70
75
80
85
90
95
0.0 0.40.30.2
Distance in AU
0.1 AU = 93 million mi
= 150 million km
Per
iod
in (
Ear
th)
Day
s
0.1
Mercury
0.0
0.0 0.2 0.4 0.6 0.8 1.0 1.2 1.4 1.6
0.2
0.4
0.6
0.8
1.0
1.2
1.4
1.6
1.8
2.0
Distance in AU
93
mill
ion
mi
150
mill
ion
km
Per
iod
in E
arth
Yea
rs
Mars
Earth
Venus
Mercury
Kepler’s 3rd Law GraphsThese graphs are for a Sun like star. Note the units change between the
graphs to accommodate for the change is magnitude of distance.
Kepler’s 3rd Law Graph for periods less than 100 days
Kepler’s 3rd Law Graph for periods less than 10 days
Kepler’s 3rd Law Graph for the Inner Solar System(periods less than 2 years)
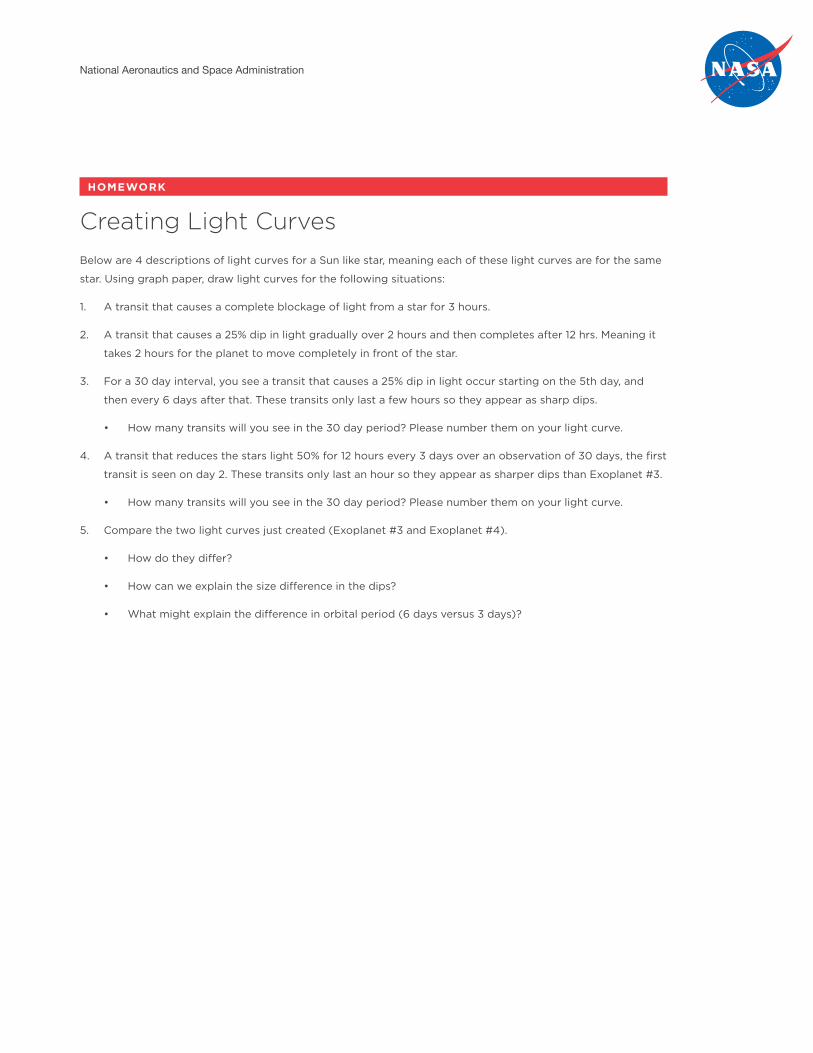
HOMEWORK
Creating Light CurvesBelow are 4 descriptions of light curves for a Sun like star, meaning each of these light curves are for the same
star. Using graph paper, draw light curves for the following situations:
1. A transit that causes a complete blockage of light from a star for 3 hours.
2. A transit that causes a 25% dip in light gradually over 2 hours and then completes after 12 hrs. Meaning it
takes 2 hours for the planet to move completely in front of the star.
3. For a 30 day interval, you see a transit that causes a 25% dip in light occur starting on the 5th day, and
then every 6 days after that. These transits only last a few hours so they appear as sharp dips.
• How many transits will you see in the 30 day period? Please number them on your light curve.
4. A transit that reduces the stars light 50% for 12 hours every 3 days over an observation of 30 days, the first
transit is seen on day 2. These transits only last an hour so they appear as sharper dips than Exoplanet #3.
• How many transits will you see in the 30 day period? Please number them on your light curve.
5. Compare the two light curves just created (Exoplanet #3 and Exoplanet #4).
• How do they differ?
• How can we explain the size difference in the dips?
• What might explain the difference in orbital period (6 days versus 3 days)?
National Aeronautics and Space Administration
Planet Hunters Education Guide 5
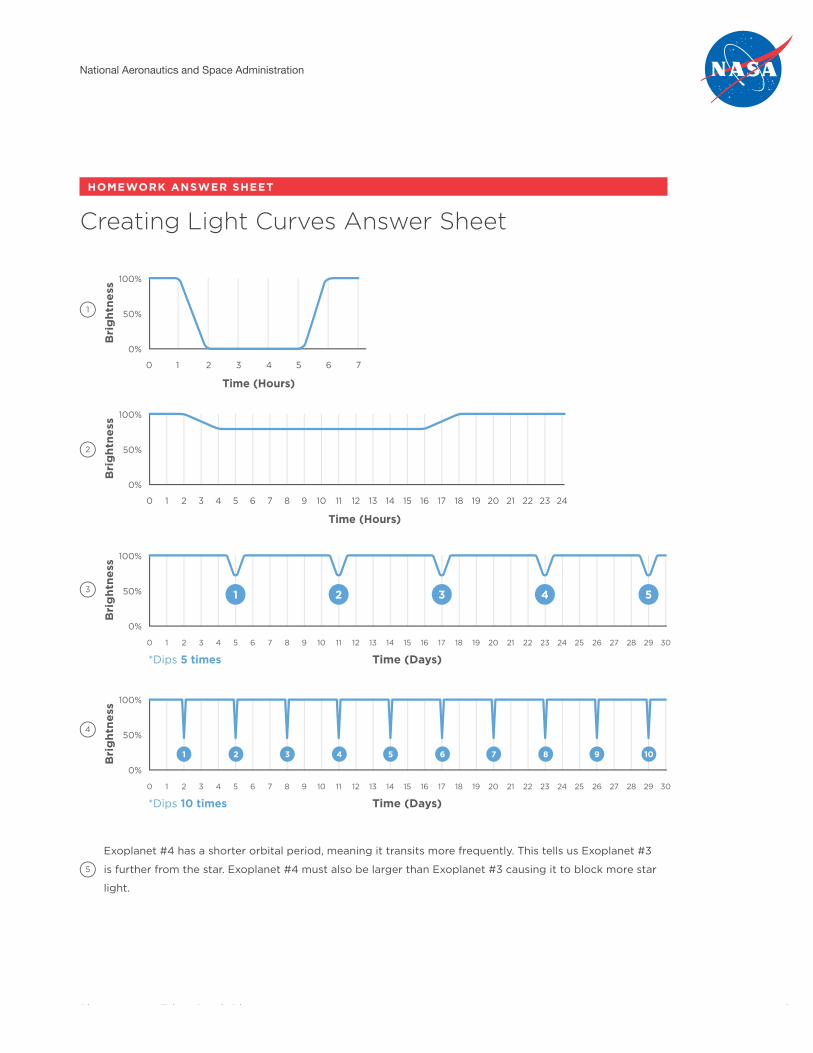
National Aeronautics and Space Administration
Planet Hunters Education Guide 6
HOMEWORK ANSWER SHEET
Creating Light Curves Answer Sheet
Exoplanet #4 has a shorter orbital period, meaning it transits more frequently. This tells us Exoplanet #3
is further from the star. Exoplanet #4 must also be larger than Exoplanet #3 causing it to block more star
light.
National Aeronautics and Space Administration
Planet Hunters Education Guide 91
Lesson 8
Calculating Exoplanet Characteristics
OVERVIEW
In this activity, students will calculate the orbital period, semi-major axis, radius, mass, density and surface
temperature of a candidate exoplanet transiting a star. Students will use light curves from the Planet Hunters
website to perform these functions, by gathering data about the planet candidates and using it to determine
what types of planet they may be. Students will also discuss whether the exoplanet may be habitable.
Note: This level of math may be more appropriate for high school students, but this exercise is important to
understanding how scientists determine exoplanet parameters and is a good extension for gifted or advanced
students. For teachers that do not wish to tackle the math, there is a planetary calculator that can be used in
this lesson.
STUDENT PREREQUISITE KNOWLEDGE
Students should be familiar with:
• Mathematical averages and reading graphs
• Inferring and synthesizing data from multiple
sources
• (Optional) Kepler’s Laws of Motion
• (Optional) Pre-Algebra and Algebra
OBJECTIVES
Students will be able to:
• Acquire data from a light curve for a given
exoplanet
• Calculate the orbital period, semi-major axis,
radius, mass, density and surface temperature of
the transiting exoplanet
• Determine a planet type for the candidate exo-
planets and support it with the calculated data
that is gathered during the activity
CONCEPTS
The orbital period, semi-major axis, radius, mass, density and surface temperature can be estimated using data
from a star’s light curve.
45 – 60 minutes
National Aeronautics and Space Administration
Planet Hunters Education Guide 92
STANDARDS
AAAS Benchmarks: 4A/M3, 4B/M2cd, 9B/M1, 9C/M4*, 12B/M9, 12C/M3*,
12D/M1, 12D/M2, 12D/M6**, 12D/M8**, 12D/M9**, 12D/
M11**
Common Core:• RST 6-8, 3,7,9
• MP2, MP4
Next Generations Science Standards: Performance Expectations:
• MS-ESS1-2, MS-ESS1-3
• HS-ESS1-4
• MS-PS2-4
Dimensions:
• Disciplinary Core Ideas
° ESS1.A, 6-8, ESS1.B, 6-8, 9-12
° PS2.B, 6-8
MATERIALS
• Enough computers for groups of 2-4 students
to use
• Zooniverse accounts for each group
° An email is needed for this, but with a single
Gmail account you may set up multiple
Zooniverse accounts for the whole class.
• Step-by-Step Instructions presentation, located
on ZooTeach (http://www.zooteach.org/
resources/108)
• Equations sheet
• Planetary calculator website: http://www.plan-
ethunters.org/education/calculator
• Planetary Information sheet
• Exoplanet Data sheet
• Calculators (optional)
• Kepler’s Third Law graphs from Lesson 7: Creat-
ing and Interpreting Light Curves (optional)
• Scratch paper, for working out the math
• Crosscuttting Concepts
° Patterns
° Scale, Proportion, and Quantity
° System and System Models
° Stability and Change
• Science and Engineering Practices:
° Asking Questions and Defining Problems
° Developing and Using Models
° Analyzing and Interpreting Data
° Using Mathematics and Computational
Thinking
° Obtaining, Evaluating and Communicating
Information
PREPARE
• Sign up for the appropriate number of
Zooniverse accounts, one account per computer.
• Prepare computers with the Planet Hunters
page pulled up, the accounts signed into, and
ready for use. Also pull up a separate tab or win-
dow with the planetary calculator website.
• Students should be evenly divided into groups
among the computers.
• Preview the tutorial and videos on www.
planethunters.org. Familiarize yourself with the
information and the site.
• Also familiarize yourself with the planetary cal-
culator; notice that there are two parts to it (for
the star’s information and for the exoplanet’s
information).
• Prepare a copy of the Planetary Information and
Exoplanet Data sheets for each student.
• Set up Step-by-Step Instructions presentation to
guide students how to find the data.
• It is recommended that you run through an ex-
ample light curve in collecting data and calcu-
lating values.
National Aeronautics and Space Administration
Planet Hunters Education Guide 93
BACKGROUND
The Wealth of Information from Light Curves
Astronomers can paint quite a detailed picture of exoplanets from observing their transits in light curves.
Orbital period, orbital velocity, distance from star, radius, mass, density, gravity, and surface temperature all
can be estimated from a light curve. Other details, such as atmospheric composition, can be identified with the
addition of other observational techniques to truly determine if the conditions on the planet are right for life to
exist. This information can be used by artists to create images of what these exoplanet systems could possibly
look like. To see examples of artist renderings of exoplanets, visit http://planetquest.jpl.nasa.gov/imagesvideo.
The light curves used for this lesson come from Planet Hunters (www.planethunters.org), which uses Kepler
mission data. For more information on Planet Hunters and the Kepler mission see Lesson 6: Using Planet
Hunters.
Planetary Types
Similar to the planets in our solar system, exoplanets also have differing characteristics. Some of these charac-
teristics are similar to planets in our solar system, such as whether they are rocky or gaseous in their composi-
tion. Others have unique characteristics that are a result of their mass and distance from their host stars. While
there are many classifications for types of planets, the following four are used in this activity:
• Hot Jupiter – A gaseous planet that has a mass similar to Jupiter, but is much closer to its star, creating
very hot surface temperatures.
• Hot Neptune – A gaseous planet that has a mass and characteristics similar to Neptune, but is much closer
to its star, creating high surface temperatures.
• Super-Earth – A gaseous planet that has a mass greater than Earth’s but less than Neptune.
• Exo Earth – A rocky planet with characteristics similar to Earth.
Applying Math to Light Curves
Light curves are plots that show the brightness of the star over time as points. Brightness is the amount of light
measured from an object, and it is therefore a unit-less number. When students find a transit in the light curve,
they will need to gather the following data from the light curve to do the calculations to determine an exoplan-
et’s characteristics:
• The total brightness, which is the brightness measurement just before the transit.
• The transit brightness, which is the brightness measurement at the lowest point in the transit dip. The
brightness is a unit-less number.
• The transit days, the days they notice each transit occurs, this can be determined from the x-axis.
We have designed tools within Planet Hunters to assist students in finding these numbers. Once students have
collected this data they will begin to use the following equations to estimate the characteristics of the transits
found in the light curves. Note: the items are in this order since you need to solve for some values to find oth-
ers and students should use the Star portion of the calculator before solving these. The following equations are
the math behind the exoplanet portion of the calculator.
• Orbital period – to calculate the orbital period students will need to find the number of days between the
transit dates. To do this, take the days each transit occurred and subtract them from one another. Then
find the average of those periods. This was done in Lesson 7: Creating and Interpreting Light Curves. The
units should be in days.
National Aeronautics and Space Administration
Planet Hunters Education Guide 94
First observed period = second day observed−first day observed
Second observed period = third day observed−second day observed
Mean orbital period = (first observed period+second observed period)/2
Note: you may see more or fewer than 3 transits. You want to find the average of all the periods you find. If
you only see one transit, then you cannot find the orbital period.
• Radius – for this you will need to first use the Star portion of the calculator to get the estimated radius of
the star. To calculate radius, students will take the total brightness and transit brightness to find the drop
in brightness.
Drop in Brightness= r2/R2
where r is the radius of the planet and R is the radius of the star. The units should be in kilometers (km)
and Earth radii (rEarth=6378.1 km).
• Mass – this can be estimated based on the size of the planet and its distance from its star.
° If the radius of the exoplanet is less than 6 mEarth then:
m=0.9515r3.1
° If the radius of the exoplanet is equal 6 mEarth and less than 10 mEarth, then:
m=1.7013r2.0383
° If the radius of the exoplanet is equal to or greater than 10 mEarth, then:
m=0.6631r2.4191
The units should be in kilograms (kg) and Earth masses (mEarth=5.976×1024kg).
For the planet types the masses would approximately be:
° Hot Jupiter – 1.90×1027kg=317.8 mEarth
° Hot Neptune – 1.03×1026kg=17.23mEarth
° Super-Earth – 1.90×1027kg=317.8 mEarth
° Exo Earth – 5.976×1024kg=1 mEarth
• Semi-major axis (the distance of the planet from the star) – for this we will use Kepler’s Third Law of
Planetary Motion. There are three ways to solve for this:
° You could use the Kepler’s Third Law graphs from Lesson 7: Creating and Interpreting Light Curves. To
use these graphs students will simply take the orbital period they calculated and find the correspond-
ing semi-major axis value from the line.
° This is the equation for Kepler’s Third Law:
where P is the orbital period, G is the gravitational constant (6.67384×10⁻¹¹m3kg−1s−1), m is the mass
of the planet, M is the mass of the star, and a is the semi-major axis. For this equation, the units need
to match up with those of the gravitational constant, and it is necessary to estimate the mass of the
planet and star first.
° This is an approximation of the previous equation; showing the relationship between the orbital period
and semi-major axis.
p2=a3
where P is the orbital period in Earth years and a is the semi-major axis in astronomical units (AU),
where 1 AU is equal to the distance between Earth and the Sun (149597871 km).
TP = ri =
P2 =
p1 = d2 – d1
p2 = d3 – d2
(p3 + p2)
= L(1 – A) R2TS
4(1–A)16
2
4a2a2
L1.1
4 2
G(m + M)
p =
14
14
Surface Temp Lesson 3
Lesson 7
Density
Kepler’s Third Law
Orbital Period
a3
ro = L
0.53
Mean orbital period =
V = r3
= 9.88 days(9.88 days + 9.87 days)
2
4
3d =
m
v
National Aeronautics and Space Administration
Planet Hunters Education Guide 95
• Density – To calculate the density, you first need to calculate the mass and volume of the exoplanet. The
volume can be calculated with the radius. Density is mass per volume.
The units should be in kilograms per meter cubed, (kg/m3).
• Surface Temperature – to get temperature of the planet’s surface you will need to use the following equa-
tion:
where TP is the surface temperature of the planet, L is the luminosity of the star
L=4 R2 T4
a is the semi-major axis, TS is the temperature of the star, is the Stefan-Boltzmann constant
5.670×10⁻⁸Wm−2k−4
and A is the albedo of the planet which for the types of planets would be:
° Hot Jupiter – A=0.52
° Hot Neptune – A=0.35
° Super-Earth – A=0.39
° Exo Earth – A=0.39
ENGAGE (10 MINUTES)
1. Have students recall the criteria of a planet that determines how transits in a light curve appear. [Size,
distance from star, velocity]
2. What else would they need to know in order to determine if a planet were habitable? [Size, temperature,
gravity, density, whether it lies within the star’s habitable zone, etc.]
3. Inform students that, just like the planets in our solar system, exoplanets can also have differing character-
istics. They can be rocky or gaseous, and may have very diverse properties from those we are familiar with.
4. Provide the Planetary Information sheet and introduce the four types of planets to students.
5. Ask students to draw what they think these planets would look like based on what they know about Jupi-
ter, Neptune, and Earth.
• What does the definition indicate about size? What does the definition tell you about its surface?
Gaseous or rocky? How close should it be to the star compared to the others?
6. After they have drawn these planet types, as a class, discuss what they have drawn.
• Is it unusual to you to see a larger planet so close to a star?
• What else can you imagine would be possible to find as an exoplanet?
• How would you expect their light curves to be different?
TP = ri =
P2 =
p1 = d2 – d1
p2 = d3 – d2
(p3 + p2)
= L(1 – A) R2TS
4(1–A)16
2
4a2a2
L1.1
4 2
G(m + M)
p =
14
14
Surface Temp Lesson 3
Lesson 7
Density
Kepler’s Third Law
Orbital Period
a3
ro = L
0.53
Mean orbital period =
V = r3
= 9.88 days(9.88 days + 9.87 days)
2
4
3d =
m
v
TP = ri =
P2 =
p1 = d2 – d1
p2 = d3 – d2
(p3 + p2)
= L(1 – A) R2TS
4(1–A)16
2
4a2a2
L1.1
4 2
G(m + M)
p =
14
14
Surface Temp Lesson 3
Lesson 7
Density
Kepler’s Third Law
Orbital Period
a3
ro = L
0.53
Mean orbital period =
V = r3
= 9.88 days(9.88 days + 9.87 days)
2
4
3d =
m
v
National Aeronautics and Space Administration
Planet Hunters Education Guide 96
EXPLORE (25 MINUTES)
1. Divide students into groups of 2-4 and place them at computers. Present the Step by Step Instructions to
students. You may want to print the presentation outline for students to have at their computers.
2. Distribute the Exoplanet Data sheet and explain the data to be recorded from a light curve. Let students
know that this data will be used in determining properties of the exoplanet. Have each group evaluate a
different candidate star on the sheet; some groups will have the same star.
• The value found along the points before the transit is called the total brightness. The value found at
the lowest point of the transit curve is called the transit brightness.
• Students should note the time on the x-axis where the brightness is at its lowest (6.9 days), the tran-
sit day.
3. Have students repeat this process for the other transits on the light curve, recording the information on
the sheet in Part 1.
4. Have students use the Star portion of the calculator to solve for information about the star.
5. Have students find the exoplanet characteristic values for the Planet Hunter star IDs they were assigned.
6. If you’re having students calculate values by hand, have them follow the order on the Equations sheet.
After students have found all the values, have them enter information into the Exoplanet portion of the
calculator to check their work.
7. If you’re having students solely use the calculator, they should enter the information into the Exoplanet
portion of the calculator.
8. Make sure each group records these values in the Exoplanet Data sheet for the correct Planet Hunter ID
number.
9. Have student groups share their data and calculated values with the rest of the class, so that everyone has
a filled-in chart.
EXPLAIN (10 MINUTES)
1. Have students compare their Exoplanet Data sheet with the planets in our Solar System on the Planetary
Information sheet.
• Which information on this sheet tells us about the size of the planet? Can we tell whether it is in a
habitable zone? What other information would we need?
• Are there any similarities between the data about the exoplanet candidates and the planets in our
solar system? Any differences?
ELABORATE (5 MINUTES)
1. Have students look at the planetary types and their criteria on the sheet. Have them determine where their
planet candidates fit in.
• What information can you use to support your choices? What did other groups choose for that plan-
et? What evidence is there to support that choice? Does anyone agree with them? Disagree? Why?
National Aeronautics and Space Administration
Planet Hunters Education Guide 97
EVALUATE (10 MINUTES)
1. Have groups design an advertisement addressing why people should visit their planet. They should focus
on the habitable conditions associated with their planet.
2. Have students write 3 sentences about what they learned today and have volunteers share their write-ups.
Collect the brief write-ups to check over for accuracy
EXTENSION ACTIVITIES
1. You could have students also calculate the gravity of their exoplanets to compare with that of Earth’s
9.81m/s2.
2. With access to computers, students can compare the size and mass of their planet to those published by
National Geographic (http://bit.ly/PHEG8-1). Have students hover their mouse over dots where they think
their planet would belong on the graph to see the size and mass of that planet. The same can be done
with the correlation diagram (http://www.openexoplanetcatalogue.com/correlations.html) from Open Exo-
planet Catalogue, but it also includes the semi-major axis.
ADDITIONAL RESOURCES
1. New Worlds Atlas: http://planetquest.jpl.nasa.gov/newworldsatlas
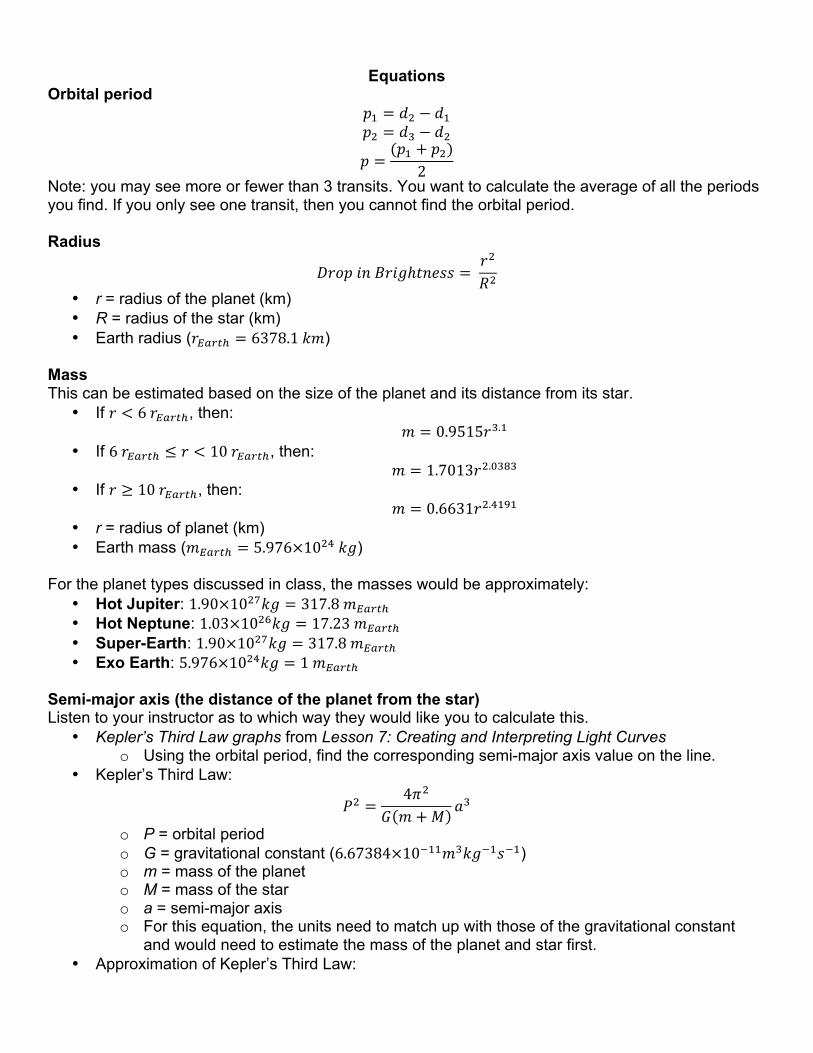
Equations Orbital period
𝑝𝑝! = 𝑑𝑑! − 𝑑𝑑! 𝑝𝑝! = 𝑑𝑑! − 𝑑𝑑!
𝑝𝑝 =(𝑝𝑝! + 𝑝𝑝!)
2 Note: you may see more or fewer than 3 transits. You want to calculate the average of all the periods you find. If you only see one transit, then you cannot find the orbital period. Radius
𝐷𝐷𝐷𝐷𝐷𝐷𝐷𝐷 𝑖𝑖𝑖𝑖 𝐵𝐵𝐵𝐵𝐵𝐵𝐵𝐵ℎ𝑡𝑡𝑡𝑡𝑡𝑡𝑡𝑡𝑡𝑡 = 𝑟𝑟!
𝑅𝑅! • r = radius of the planet (km) • R = radius of the star (km) • Earth radius (𝑟𝑟!"#$! = 6378.1 𝑘𝑘𝑘𝑘)
Mass This can be estimated based on the size of the planet and its distance from its star.
• If 𝑟𝑟 < 6 𝑟𝑟!"#$!, then: 𝑚𝑚 = 0.9515𝑟𝑟!.!
• If 6 𝑟𝑟!"#$! ≤ 𝑟𝑟 < 10 𝑟𝑟!"#$!, then: 𝑚𝑚 = 1.7013𝑟𝑟!.!"#"
• If 𝑟𝑟 ≥ 10 𝑟𝑟!"#$!, then: 𝑚𝑚 = 0.6631𝑟𝑟!.!"#"
• r = radius of planet (km) • Earth mass (𝑚𝑚!"#$! = 5.976×10!" 𝑘𝑘𝑘𝑘)
For the planet types discussed in class, the masses would be approximately:
• Hot Jupiter: 1.90×10!"𝑘𝑘𝑘𝑘 = 317.8 𝑚𝑚!"#$! • Hot Neptune: 1.03×10!"𝑘𝑘𝑘𝑘 = 17.23 𝑚𝑚!"#$! • Super-Earth: 1.90×10!"𝑘𝑘𝑘𝑘 = 317.8 𝑚𝑚!"#$! • Exo Earth: 5.976×10!"𝑘𝑘𝑘𝑘 = 1 𝑚𝑚!"#$!
Semi-major axis (the distance of the planet from the star) Listen to your instructor as to which way they would like you to calculate this.
• Kepler’s Third Law graphs from Lesson 7: Creating and Interpreting Light Curves o Using the orbital period, find the corresponding semi-major axis value on the line.
• Kepler’s Third Law:
𝑃𝑃! =4𝜋𝜋!
𝐺𝐺 𝑚𝑚 +𝑀𝑀 𝑎𝑎!
o P = orbital period o G = gravitational constant (6.67384×10!!!𝑚𝑚!𝑘𝑘𝑘𝑘!!𝑠𝑠!!) o m = mass of the planet o M = mass of the star o a = semi-major axis o For this equation, the units need to match up with those of the gravitational constant
and would need to estimate the mass of the planet and star first. • Approximation of Kepler’s Third Law:
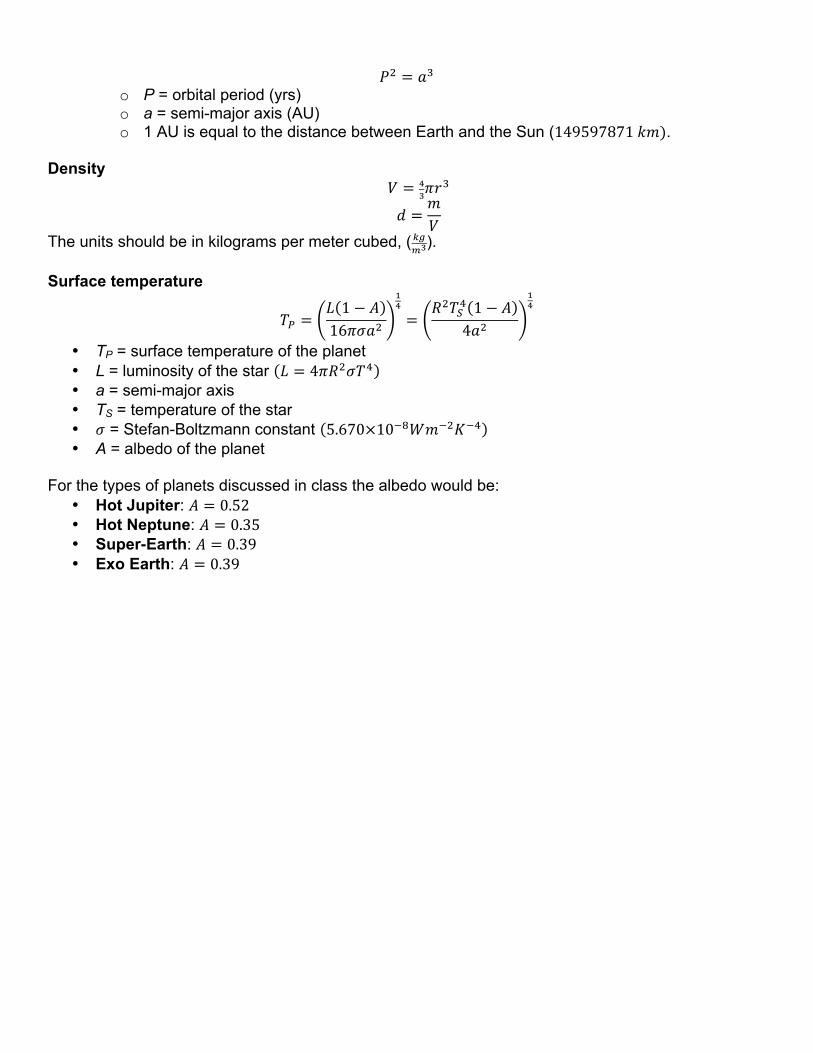
HOMEWORK
Creating Light CurvesBelow are 4 descriptions of light curves for a Sun like star, meaning each of these light curves are for the same
star. Using graph paper, draw light curves for the following situations:
1. A transit that causes a complete blockage of light from a star for 3 hours.
2. A transit that causes a 25% dip in light gradually over 2 hours and then completes after 12 hrs. Meaning it
takes 2 hours for the planet to move completely in front of the star.
3. For a 30 day interval, you see a transit that causes a 25% dip in light occur starting on the 5th day, and
then every 6 days after that. These transits only last a few hours so they appear as sharp dips.
• How many transits will you see in the 30 day period? Please number them on your light curve.
4. A transit that reduces the stars light 50% for 12 hours every 3 days over an observation of 30 days, the first
transit is seen on day 2. These transits only last an hour so they appear as sharper dips than Exoplanet #3.
• How many transits will you see in the 30 day period? Please number them on your light curve.
5. Compare the two light curves just created (Exoplanet #3 and Exoplanet #4).
• How do they differ?
• How can we explain the size difference in the dips?
• What might explain the difference in orbital period (6 days versus 3 days)?
National Aeronautics and Space Administration
Planet Hunters Education Guide 99
𝑃𝑃! = 𝑎𝑎! o P = orbital period (yrs) o a = semi-major axis (AU) o 1 AU is equal to the distance between Earth and the Sun (149597871 𝑘𝑘𝑘𝑘).
Density
𝑉𝑉 = !!𝜋𝜋𝑟𝑟
!
𝑑𝑑 =𝑚𝑚𝑉𝑉
The units should be in kilograms per meter cubed, (!"!!).
Surface temperature
𝑇𝑇! =𝐿𝐿 1− 𝐴𝐴16𝜋𝜋𝜋𝜋𝑎𝑎!
!!
=𝑅𝑅!𝑇𝑇!! 1− 𝐴𝐴
4𝑎𝑎!
!!
• TP = surface temperature of the planet • L = luminosity of the star 𝐿𝐿 = 4𝜋𝜋𝑅𝑅!𝜎𝜎𝑇𝑇! • a = semi-major axis • TS = temperature of the star • 𝜎𝜎 = Stefan-Boltzmann constant 5.670×10!!𝑊𝑊𝑚𝑚!!𝐾𝐾!! • A = albedo of the planet
For the types of planets discussed in class the albedo would be:
• Hot Jupiter: 𝐴𝐴 = 0.52 • Hot Neptune: 𝐴𝐴 = 0.35 • Super-Earth: 𝐴𝐴 = 0.39 • Exo Earth: 𝐴𝐴 = 0.39
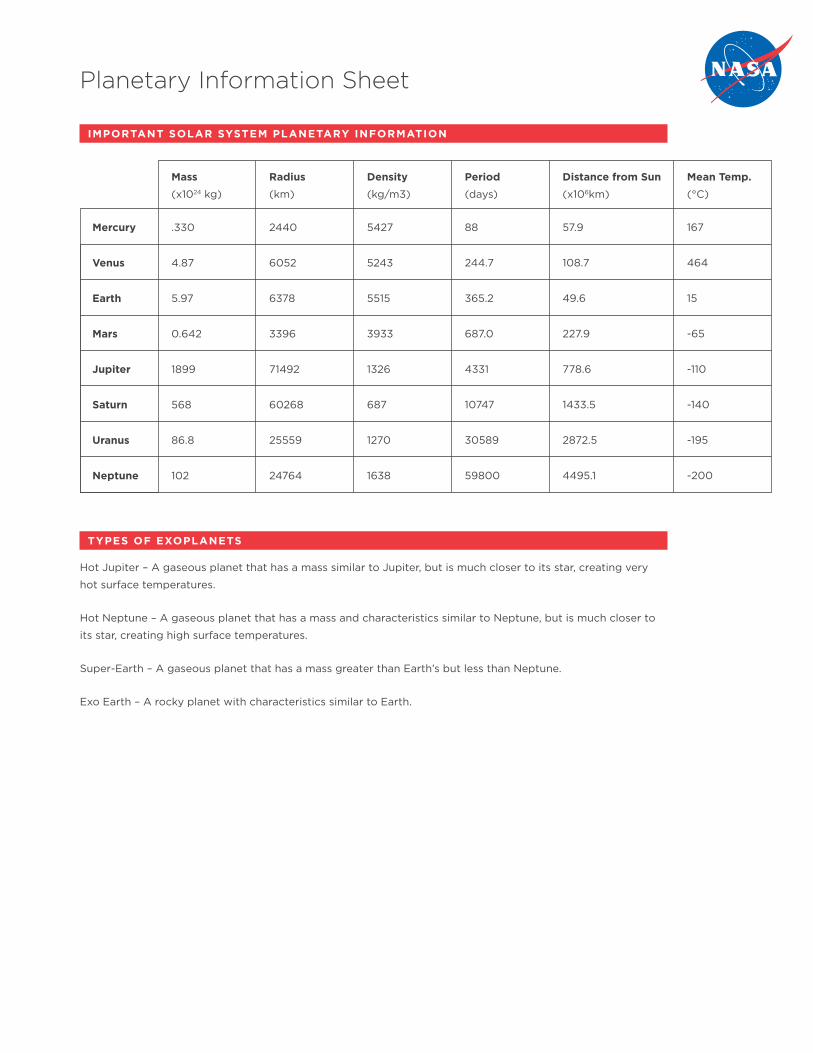
Planetary Information Sheet
IMPORTANT SOLAR SYSTEM PLANETARY INFORMATION
TYPES OF EXOPLANETS
Hot Jupiter – A gaseous planet that has a mass similar to Jupiter, but is much closer to its star, creating very
hot surface temperatures.
Hot Neptune – A gaseous planet that has a mass and characteristics similar to Neptune, but is much closer to
its star, creating high surface temperatures.
Super-Earth – A gaseous planet that has a mass greater than Earth’s but less than Neptune.
Exo Earth – A rocky planet with characteristics similar to Earth.
Mass Radius Density Period Distance from Sun Mean Temp.(x1024 kg) (km) (kg/m3) (days) (x106km) (°C)
Mercury .330 2440 5427 88 57.9 167
Venus 4.87 6052 5243 244.7 108.7 464
Earth 5.97 6378 5515 365.2 49.6 15
Mars 0.642 3396 3933 687.0 227.9 -65
Jupiter 1899 71492 1326 4331 778.6 -110
Saturn 568 60268 687 10747 1433.5 -140
Uranus 86.8 25559 1270 30589 2872.5 -195
Neptune 102 24764 1638 59800 4495.1 -200
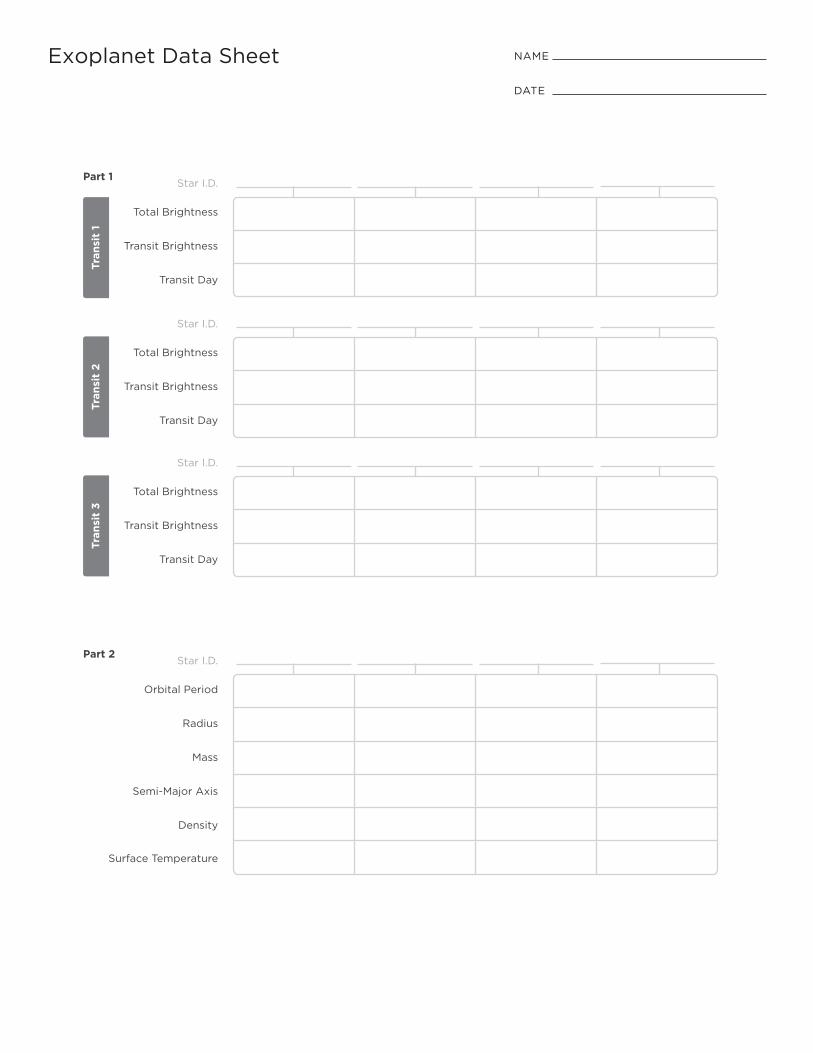
Part 1
Total Brightness
Transit Brightness
Transit Day
Tran
sit
1Tr
ansi
t 2
Tran
sit
3
Part 2
Orbital Period
Radius
Mass
Semi-Major Axis
Density
Surface Temperature
Total Brightness
Transit Brightness
Transit Day
Total Brightness
Star I.D.
Star I.D.
Star I.D.
Star I.D.
Transit Brightness
Transit Day
Exoplanet Data SheetSEARCHING FOR A HABITABLE WORLD
NAME
DATE
National Aeronautics and Space Administration
Planet Hunters Education Guide 102
Lesson 9
Planetary Possibilities
OVERVIEW
In this activity, students will apply information they have learned about the solar system, star types, habitable
zones, and exoplanet systems in previous activities to design and draw a planetary system model of a candi-
date planet. Students will base their designs on exoplanet data from a list of confirmed exoplanets.
STUDENT PREREQUISITE KNOWLEDGE
Students should be familiar with:
• The solar system and all of the planets
• How life is possible on Earth
• The definition of a star
• The Sun is a star
• The existence of exoplanets
OBJECTIVES
Students will be able to:
• Select an exoplanet based on its habitability to
propose an exploratory mission
• Create a planetary model drawing based on
data
• Make a prediction about what type of planet
(e.g. rocky planet, hot Jupiter, etc.) the chosen
exoplanet could be, based on given criteria
• Explain their reasoning for selecting that exo-
planet by presenting their exploratory mission
proposal and model drawing
CONCEPTS
Applying concepts from previous lessons to propose an exploratory mission to a habitable exoplanet.
STANDARDS
AAAS Benchmarks: 1B/M1b*, 3A/M2, 4B/M2cd, 12D/M1, 12D/M2, 12D/
M6**, 12D/M9**
Common Core:• RST 6-8, 1, 7, 8, 9
• MP2, MP3
Next Generations Science Standards: Dimensions:
• Disciplinary Core Ideas
° LS2.A, 6-8
• Crosscutting Concepts:
° Patterns
° Scale, Proportion, and Quantity
° System and System Models
° Structure and Function
• Science and Engineering Practices:
° Planning and Carrying Out Investigations
° Analyzing and Interpreting Data
° Engaging in Argument from Evidence
° Obtaining, Evaluating and Communicating
Information
45 – 60 minutes
National Aeronautics and Space Administration
Planet Hunters Education Guide 103
MATERIALS
• Confirmed Data sheet, or if you did Lesson 8
Calculating Exoplanet Characteristics, your
filled-in Exoplanet Data sheet
• Large sheets of drawing paper
• Drawing compasses, protractors, or create a
strip compass (instructions in Prepare section)
° Push pins if using a strip compass
• Markers, colored pencils and/or crayons
PREPARE
• Prepare copies of the Exoplanet Data sheet
from Lesson 8 or the Confirmed Data sheet from
this lesson.
• Obtain enough drawing and coloring materials
for students to have access to during the lesson.
• Prepare strip compasses if using:
° Cut strips of paper or stiff poster board
5cm x 21cm.
° Glue two strips together on 5cm edge,
creating a 1cm overlap. Note: If using paper,
glue to a piece of poster board to stiffen.
° 1 cm down from a 5cm end, mark a small
circle in the center of the strip. This is
where students will pin the compass to
their drawing surface.
° Continuing down the center of the strip,
mark a dot every centimeter and label each
dot to one side with the correct number,
making a 40cm ruler.
• Print out, or make accessible images of different
planetary types found at the PlanetQuest web-
site for students to use:
° http://planetquest.jpl.nasa.gov/
images?subject=rocky_planet
° http://planetquest.jpl.nasa.gov/
images?subject=gas_giant
° http://planetquest.jpl.nasa.gov/
images?subject=hot_jupiter
° http://planetquest.jpl.nasa.gov/
images?type=artwork
BACKGROUND
For this lesson, you may wish to review the background material of previous lessons.
Using Models
Throughout the lessons, models have been used to explore multiple sets of data to encourage understanding
the concepts as a whole picture. Models allow large phenomena to be made manageable and bring the very
far away, nearer. They help scientists better understand how something works, especially systems. Due to their
size, planetary systems are impossible to study up close. The exoplanet systems that are being discovered
almost daily are too far away to visit. Human beings have not yet been able to travel past their own Moon, let
alone the corners of their own solar system. When models are designed for planetary systems, it allows for the
whole to be seen in context of its parts, which can often reveal new information for the scientist, or inspire new
questions to try to find answers to.
Having students design models offers them many learning opportunities. Designing models allows students to
connect and assimilate different types of knowledge or data to create a whole picture of the concept. Seeing
information in a way other than just text, they can observe how different components affect or complement
each other in a meaningful way. It gives a new way for the data to be understandable. Using models allows for
misconceptions or erroneous thinking to be revealed for the student and offers an opportunity to reassess and
National Aeronautics and Space Administration
Planet Hunters Education Guide 104
correct their understanding. Models also offer students an effective way to communicate their understanding
and knowledge in a multifaceted and connected way.
This lesson offers students the opportunity to connect the many concepts and pieces of data that they have
worked with in this series of lessons to create a model drawing of a stellar system. As exoplanet data and in-
formation on its star becomes more detailed, artists can begin to create images of the possible appearance of
these places beyond our solar system. For examples, visit: http://planetquest.jpl.nasa.gov/imagesvideo
ENGAGE (10 MINUTES)
1. If you have performed the other lessons in this guide, have students review the information they gathered
in previous lessons.
• What information were we able to get from analyzing the transits we saw in light curves? [See your
Exoplanet Data sheet from Lesson 8 Calculating Exoplanet Characteristics]
• What did that data tell us? What information were we also able to determine using that data?
• What relationships between that data allowed us to be able to determine all of that?
• How might we use this data to determine if life as we know it can be sustained on a planet?
2. If this is the only lesson you will be doing, then have students look at the Confirmed Data sheet.
• What does this data tell us about the exoplanet? [if the exoplanet is in the habitable zone of its star,
have an appropriate density for us to stand on, etc.]
• How can this be useful in selecting planets to potentially explore? [We would want to explore planets
that can support life as we know it, so it should have some characteristics similar to Earth.]
EXPLORE (5 MINUTES)
1. If this is the only lesson you will be doing, break students up into small groups with the Earth cards from
Lesson 2: Life in Our Solar System. Ask the students to work in groups to figure out what we know about
Earth and how that impacts how our planet looks.
2. Ask students: what other information would they need in order to fully describe an exoplanet and the
conditions around it?
• What else would you want to be able to tell? [atmosphere, water content, surface features, etc.]
• Think about the other activities we have done; what helped determine the habitability of a planet?
What factors influenced what we could expect to find? What about habitability and the habitable
zone? How does that influence what we would find if we could travel there? What would we need to
consider including it?
EXPLAIN (20 MINUTES)
1. Inform students that they will be selecting one of these planets to propose an exploratory mission to, so
they will need to review the information given for each planet and select the best candidate for investigat-
ing.
National Aeronautics and Space Administration
Planet Hunters Education Guide 105
2. Have students create a list of what information their model and proposal will need to include, such as:
• Type of star: color, size
• Orbital period of candidate planet
• Distance from star the candidate planet orbits at
• Size of planet – this could include diameter and mass
• Type of planet – rocky? Gas?
• Whether it is found in the habitable zone of star
• Where the habitable zone is in the system
3. Ensure that students know how to use the data (on the Confirmed Data sheet or if you did Lesson 8 Calcu-
lating Exoplanet Characteristics, your filled in Exoplanet Data sheet) and the tools available to them to be
able to find all the information they need.
4. Explain that once they select a planet they should develop a presentation outlining what features made
them select that exoplanet to propose a mission to.
• Students could do this using Power Point, poster boards, butcher paper, etc.
ELABORATE (15 MINUTES)
1. Show students artists’ renderings of what data indicates about some of the confirmed planets discovered
by the Kepler mission. (http://bit.ly/PHEG9-1)
2. Ask students to share their thoughts on how the artist was able to create these images. What information
did they need in order to be as accurate as possible?
3. Instruct students to draw a model of what they think their selected exoplanet might look like. Inform
students that their model will need to include a description of what the data tells them about the type of
planet the candidate may be.
4. Display for students the materials that they will be using for this activity.
5. Clarify with students that they understand what needs to be included in their model and how they will
use the data to help them design it. Clarify where creativity is appropriate and where factual accuracy is
needed.
• What they know:
i) Mass
ii) Radius
iii) Surface temperature
iv) Density [tells them about whether it is a gas or rocky planet]
v) Orbital period
vi) Semi-major axis
vii) Habitable zone [tells them if the planet is hot, habitable, or cold]
National Aeronautics and Space Administration
Planet Hunters Education Guide 106
• What they will need to be creative about:
i) Color
ii) Surface features
iii) Atmosphere
iv) Possible moons
• What would be important if you wanted to communicate what the data indicates about the planet
and its system, or show what we would find if we could travel there?
6. Instruct the students on how to use the compass, string compass, or strip compass as necessary.
Note: some candidate planets DO have an elliptical orbit. You may need to discuss with students on how
to compensate for this in their models.
• How could they justify using a circular orbit for this model? What would they need to communicate?
This is an excellent opportunity for students to experience “thinking on their feet” and best practices
when communicating factual evidence correctly.
EVALUATE (10 MINUTES)
1. Have students present their planet models to the rest of the class.
2. Assess models to ensure all required information is included accurately.
EXTENSION ACTIVITIES
1. Inform students that they will be creating scale-model drawings of the candidate planets that they
proposed: both the exoplanet and its orbit. Students unfamiliar with the idea of using scale in modeling
should be given a short lesson on the purpose and importance of scale in designing a model (for an exam-
ple scale activity about the Sun and Earth, see http://bit.ly/PHEG9-2). Students may also need time and
assistance in finding a scale that will work for their system size and paper size.
2. What type of planet would each of those from the data sheets be?
• Hot Jupiter – A gaseous planet that has a mass similar to Jupiter, but is much closer to its star, creat-
ing very hot surface temperatures.
• Hot Neptune – A gaseous planet that has a mass and characteristics similar to Neptune, but is much
closer to its star, creating high surface temperatures.
• Super-Earth – A gaseous planet that has a mass greater than Earth’s but less than Neptune.
• Exo Earth – A rocky planet with characteristics similar to Earth.
3. If you can get computers for your students’ groups, PlanetQuest also has produced an interactive called
Extreme Planet Makeover that allows students to create their planet on a application where they can input
the information they have about the star and planet: http://planetquest.jpl.nasa.gov/interactives
ADDITIONAL RESOURCES
1. The confirmed planets were found on: http://exoplanetarchive.ipac.caltech.edu/cgi-bin/ExoTables/nph-
exotbls?dataset=planets
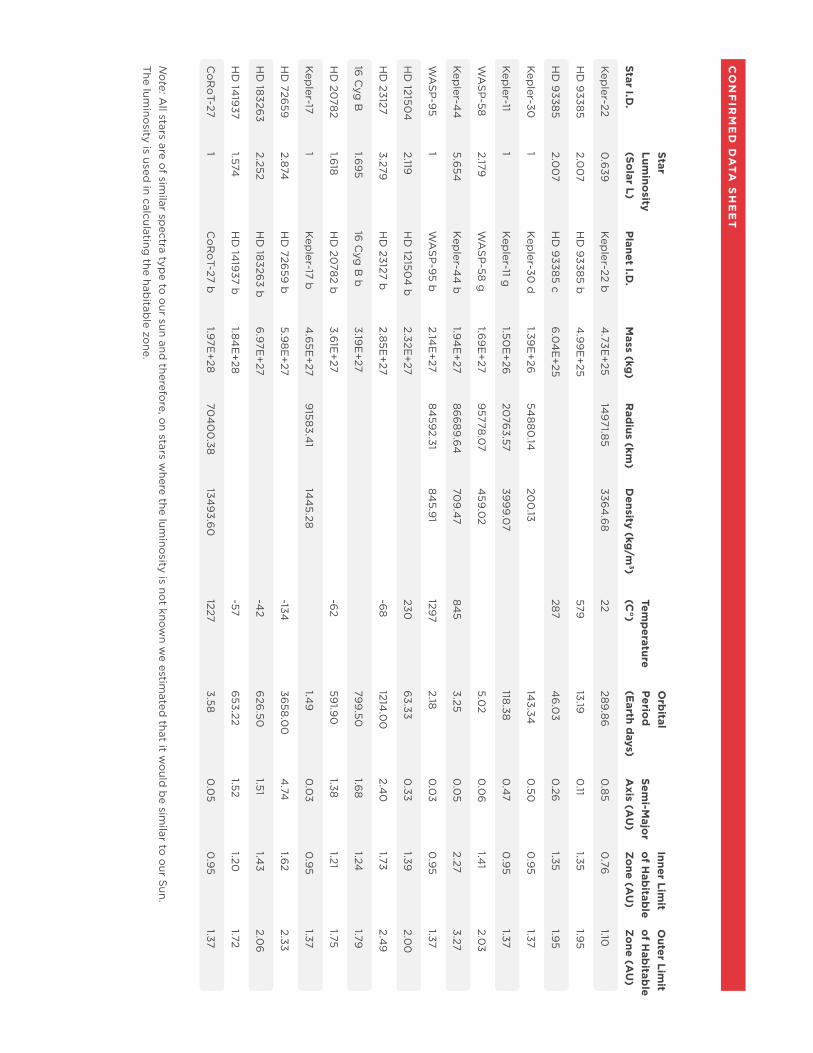
CO
NF
IRM
ED
DA
TA
SH
EE
T
Star O
rbital
Inner Limit
Outer Lim
itLum
inosity
Temp
erature P
eriod
Sem
i-Majo
r o
f Hab
itable
of H
abitab
leStar I.D
.(So
lar L)P
lanet I.D.
Mass (kg
)R
adius (km
)D
ensity (kg/m
3)(C
°)(E
arth days)
Axis (A
U)
Zo
ne (AU
)Z
one (A
U)
Kep
ler-220
.639
Kep
ler-22 b4
.73E+
2514
971.8
5336
4.6
822
289
.86
0.8
50
.761.10
HD
9338
52.0
07
HD
9338
5 b4
.99
E+
25579
13.190
.111.35
1.95
HD
9338
52.0
07
HD
9338
5 c6
.04
E+
2528
74
6.0
30
.261.35
1.95
Kep
ler-301
Kep
ler-30 d
1.39E
+26
548
80
.1420
0.13
143.34
0.50
0.9
51.37
Kep
ler-111
Kep
ler-11 g1.50
E+
2620
763.57
399
9.0
7118
.380
.47
0.9
51.37
WA
SP
-582.179
WA
SP
-58 g
1.69
E+
279
5778.0
74
59.0
25.0
20
.06
1.41
2.03
Kep
ler-44
5.654
Kep
ler-44
b1.9
4E
+27
86
68
9.6
470
9.4
78
45
3.250
.05
2.273.27
WA
SP
-95
1W
AS
P-9
5 b2.14
E+
278
459
2.318
45.9
1129
72.18
0.0
30
.95
1.37
HD
121504
2.119H
D 12150
4 b
2.32E+
27230
63.33
0.33
1.392.0
0
HD
231273.279
HD
23127 b2.8
5E+
27-6
81214
.00
2.40
1.732.4
9
16 C
yg B
1.69
516
Cyg
B b
3.19E
+27
799
.501.6
81.24
1.79
HD
2078
21.6
18H
D 20
782 b
3.61E
+27
-62
591.9
01.38
1.211.75
Kep
ler-171
Kep
ler-17 b4
.65E
+27
9158
3.41
144
5.281.4
90
.03
0.9
51.37
HD
72659
2.874
HD
72659
b5.9
8E
+27
-13436
58.0
04
.741.6
22.33
HD
18326
32.252
HD
18326
3 b6
.97E
+27
-42
626
.501.51
1.43
2.06
HD
1419
371.574
HD
1419
37 b1.8
4E
+28
-576
53.221.52
1.201.72
Co
Ro
T-271
Co
Ro
T-27 b1.9
7E+
2870
40
0.38
1349
3.60
12273.58
0.0
50
.95
1.37
No
te: All stars are o
f similar sp
ectra type to
our sun and
therefore, o
n stars where the lum
inosity is no
t know
n we estim
ated that it w
ould
be sim
ilar to o
ur Sun.
The lum
inosity is used
in calculating the hab
itable zo
ne.
National Aeronautics and Space Administration
GlossaryAbsorption lines
The dark lines in a spectrum corresponding to wavelengths absorbed by elements pres-
ent in gaseous form.
Blueshift When electromagnetic radiation from an object decreases in wavelength, or is shifted to
the blue end of the spectrum, due to motion toward from the observer.
Brightness
The characteristic of light that gives a visual sensation of more or less light.
Candidate planet A planet orbiting a star outside of our solar system, which scientists have observed
using one detection method
Citizen science
Science made possible by utilizing the efforts of volunteers, through crowdsourcing, to
analyze or collect data for scientific research purposes.
Confirmed planet A planet orbiting a star outside of our solar system, which scientists have observed
using a second type of detection method.
Crowdsourcing
When many people work together to make a big problem much more manageable.
Density
The mass per unit of volume of a substance.
Direct observation methods
An observation method in which you are able to directly detect a planet, such as seeing
a planet through a telescope. Direct observation methods are rarely used to detect
exoplanets.
Doppler effect The change in frequency of a wave for an observer due to the motion of its source.
Doppler method
An indirect method of observing exoplanets in which you can observe how a planet’s
gravity causes its star to move or wobble slightly.
Exo Earth
A rocky planet with characteristics similar to Earth.
Exoplanet (Extra Solar Planet) A planet orbiting a star outside of our solar system
Planet Hunters Education Guide 108
National Aeronautics and Space Administration
Goldilocks Zone
Another term for the habitable zone (see Habitable Zone for definition).Habitable Zone
The range of distance from a star at which liquid water could exist on the surface of an
orbiting planet.
Hot Jupiter A gaseous planet that has a mass similar to Jupiter, but is much closer to its star, creat-
ing very hot surface temperatures.
Hot Neptune
A gaseous planet that has a mass and characteristics similar to Neptune, but is much
closer to its star, creating high surface temperatures.
Indirect Observation Methods
An observation method where a planet’s effects on its host star are observed, rather
than the actual planet. The Doppler and transit methods of exoplanet detection are
both indirect.
Kepler’s Laws of Planetary Motion
Johannes Kepler wrote these three scientific laws to describe the motion of planets
around the Sun. They can be used to describe the motion of any satellite around a body.
1. The Law of Orbits: All planets move in elliptical orbits, with the Sun (or star) at one
of the two foci.
2. The Law of Areas: A line that connects a planet to the Sun (or star) sweeps out
equal areas in equal intervals of time.
3. The Law of Periods: The square of the period of any planet is directly proportional
to the cube of the semi major axis of its orbit.
Kepler’s 3rd Law
The square of the period of any planet is proportional to the cube of the semimajor axis
of its orbit. Also known as the Law of Periods.
Light curve
A graph plotting a star’s observed brightness over time.
Luminosity
The total amount of energy emitted by an astronomical object per unit of time.
Magnitude
The logarithmic measure of the brightness of a celestial body measured at a specific
wavelength. Bright stars have a low magnitude value while faint stars havehigher mag-
nitude values.
Mass
A measure of a body’s amount of matter; a numerical measure of its inertia.
Orbital period
The amount of time it takes for a planet to make one full orbit of its star
Planet Hunters Education Guide 109
National Aeronautics and Space Administration
Orbital velocity
The rate at which a planet is orbiting its star
Photometer An instrument that measures the amount of light coming from the source it is pointed
toward. A photometer on the Kepler space telescope is used to detect changes in ob-
served stellar brightness.
Radius
The distance measurement from the center of a sphere or circle to the circumference.
Redshift When electromagnetic radiation from an object increases in wavelength or is shifted to
the red end of the spectrum, due to motion away from the observer.
Semi major axis
The average distance between a planet and its star. This term comes from the fact that
orbits are in the shape of ellipses and half of the longest diameter of an ellipse is called
the semi major axis.
Spectrum (plural: spectra) A band showing the electromagnetic energy produced by separating the light from a
source.
Spectrograph
An instrument for photographing or recording spectra.
Super Earth
A gaseous planet that has a mass greater than Earth but less than Neptune.
Surface temperature
The temperature measured on the surface of an object.
Transit When an object moves between an observer and a star such that the object causes
starlight to be blocked from the observer’s point of view. For a transit to be detected,
the orbital path of the object must be viewed edge on.
Transit method
An indirect method of observing exoplanets in which one observes a decrease in the
amount of light from a star. This decrease in the star’s observed brightness is caused by
an object, like a planet, blocking some of the star’s light as the object passes between
the star and an observer.
Wavelength
The spatial period of a wave; the distance between successive crests of a wave.
Planet Hunters Education Guide 110
National Aeronautics and Space Administration
nasa.gov
Planet Hunters GuideCollaborators
PlanetQuest