pilot study of clustered decentralized wastewater ... study of clustered decentralized wastewater...
TRANSCRIPT
DECENTRALIZED WASTEWATER TREATMENT in the Peconic Estuary Chapter 1 – Page 1 Peconic Green Growth, Inc.
Pilot Study of Clustered Decentralized Wastewater Treatment Systems in the Peconic Estuary
1. Final Report Summary
The East End Towns of Suffolk County, Long Island are at a historic moment in protecting their drinking
water aquifers and the surface water bodies that surround the twin forks. Development pressures,
combined with changes in aquatic environments due to climate change, have challenged an already
fragile marine environment. The County needs to take strong pro-active measures now to protect not
only the ecosystems but also the economy of eastern Long Island. Peconic Green Growth has spent the
last three years developing public awareness and documenting solutions to the problems of excess
nitrogen endangering our drinking waters and impacting the bays where we swim, fish and boat.
The need to protect our water resources, both the groundwater aquifers and the precious surface
waters, has never been more crucial. The collapse of clam, scallop and lobster populations, recurring
impacts on fish survival, and a growing list of impaired water bodies, would indicate that we are at a
tipping point where proactive remediation is necessary to protect our precious water resources.
Clean water resources are essential, but with its dependence upon maritime, agricultural and tourist
industries they are especially important for the East End of Long Island. Scientific and modeling studies
are substantiating the theory that excess nitrogen is a primary factor contributing to water impairment
in marine waters. Growing evidence indicates effluent from onsite wastewater treatment in
groundwater is a leading source of the nitrogen entering the Peconic Estuary.
Within the study area, comprising the Peconic Estuary Watershed in the Towns of East Hampton,
Riverhead, Shelter Island, Southampton and Southold, 92% of the parcels (both developed and vacant)
are not connected to a sewer district, and 69% were developed using onsite wastewater treatment
systems (OWTS). The existing cesspools and septic systems are primary sources of excess nitrogen),
which impact water quality for both groundwater and surface water bodies. The excess nitrogen feeds
harmful algal blooms, which in turn negatively impact shellfish and fish by reducing available dissolved
oxygen, as well as contributing to the acidification of water bodies.
1.1 Scope of the Project
1.1.1 Mapping and Data Analysis
This study, using existing data sets, examines land characteristics and use factors that are indicative of
possible failure due to impacts on the environment from existing onsite wastewater treatment systems
(OWTS). Peconic Green Growth (PGG), together with the GIS Department of the Town of Southampton
(SHGIS), generated 405 maps at both town and hamlet scales to graphically depict conditions of
concern. The maps were valuable as both evaluation and public educational tools. Five towns and forty-
six hamlets/villages were examined (33 mapped). By assigning a point system to conditions of concern,
DECENTRALIZED WASTEWATER TREATMENT in the Peconic Estuary Chapter 1 – Page 2 Peconic Green Growth, Inc.
PGG and SHGIS mapped priority areas and flagged those lots which were suitable for a clustered
approach to wastewater treatment (less than one-half acre in size).
1.1.2 Survey
PGG conducted a survey of over 750 watershed residents, with outreach help from local civic and
homeowner associations, to assess the receptivity to such a change and the associated costs. This survey
was used to gather more specific information about onsite wastewater conditions and to educate the
general public on decentralized wastewater treatment issues. Of the 752 unique responses, 363 were
identified as residing in the Peconic Estuary. Quite a few people did not know which estuary’s watershed
they resided in.
1.1.3 Community Outreach
PGG conducted tailored presentations at twenty-five (25) community meetings to gain the input of local
experts, gather information, and provide public outreach. These included presentations to town boards
and committees, usually at work sessions, and general public meetings. We also made presentations to
civic associations (Orient, East Marion, Jamesport, Southold and Riverhead Rotaries, FRNCA, Southold
Voice, Hampton Bays). PGG also participated with other nonprofits to strategize and promote a clean
water agenda and organized a panel on wastewater issues for the 2013 Suffolk County Planning
Federation annual meeting. In addition, PGG organized two (2) key panels/symposiums:
a. Roundtable: Decentralized Wastewater Regulation and Standards May 22, 2013, Riverhead:
The roundtable successfully gathered regulatory representatives and experts in the field of
wastewater treatment. Twenty-two (22) representatives of state, county and municipal
governments, as well as engineers familiar with decentralized wastewater treatment issues,
gathered to discuss action plans. This conference was intended to provide an opportunity for
brainstorming potential action items and needs. While extensive information was shared, most
regulatory representatives appeared to maintain their respective positions. See Appendix D3 for
more information.
b. Wastewater in Our Waters: SOLUTIONS June 21, 2013, Riverhead:
This all-day symposium included twelve speakers and two panel discussions. A diverse audience
of 160 attendees included representatives from of all levels of government, multi-agency
representation, professionals, civic associations and environmental groups, with strong
participation by Suffolk County – a factor considered crucial. Topics included: 1) Why Should We
Care, discussing environmental issues, water quality status and planning efforts 2) Solutions:
Technology for Decentralized Treatment: including presentations by the Suffolk County
Department of Health Services (SCDHS) on recently approved community systems, and keynote
presentations by Albert Robert Rubin and Ed Clerico, both national experts in wastewater
engineering. The day ended with presentations and panel discussions on Responsible
Management and Financing for Decentralized Wastewater Treatment.
DECENTRALIZED WASTEWATER TREATMENT in the Peconic Estuary Chapter 1 – Page 3 Peconic Green Growth, Inc.
This symposium was organized by PGG and cohosted by the Suffolk County Department of
Economic Development and Planning, The Suffolk County Planning Commission, and the Citizens
Campaign for the Environment. The AIA, Peconic Chapter, offered professional credits for
attendees. The program was considered match for this grant, and LI Sound Study and Long
Island Community Foundation grants. Nine sponsors contributed funds and filming was provided
gratis by SeaTV.
The program brochure, which included a list of websites for reference, is viewable at:
http://peconicgreengrowth.org/wp-content/uploads/2013/06/program-agenda-pub.pdf
Audience interest in the information, references, and lists of action items was reflected in the
demand for every single program brochure available. A two page agenda, press releases, ads,
handouts, minutes, and pictures taken of the event by Sarah Cedar Miller are included in
Appendix D4. Selected presentations where permission for distribution was granted are
available for public viewing at: http://peconicgreengrowth.org/wastewater-in-our-waters-
solutions-a- symposium-on-decentralized-wastewater-treatment/
1.1.4 Engineering
Based on the priorities evident from the GIS mapping, data evaluation, responses from surveyed
communities, and town guidance, PGG and Natural Systems Utilities (NSU) selected three sites for an
initial engineering evaluation of proposed community-wastewater treatment systems. In addition,
Peconic Green Growth worked with Orenco Systems Inc. to beta–test software generating preliminary
cost estimates for a Septic Tank Effluent Pump (STEP) project for East Marion. If all three of the NSU
projects were realized, the estimated nitrogen mitigation is a reduction of 267,062 pounds (133.5 tons)
of nitrogen per year, representing 1.2% of the overall Total Maximum Daily Load (TMDL) groundwater
nitrogen contributions in the Peconic Estuary.
As part of this study, three initial site specific engineering reports for proposed wastewater treatment
projects were generated. Natural Systems Utilities developed the engineering reports and cost
estimates for:
a. Flanders
NSU proposed a new community sewer handling 164,510 gallons per day (gpd) or the equivalent
of 548 dwelling units (DU). This includes the capacity to handle the future wastewater needs of
the 56 vacant residential lots. Ninety-four percent of the lots are nonconforming to the current
minimum lot sizes defined in the Suffolk County Sanitation Code (Article 6 706-605). Due to the
size of the community served and the land constraints for treatment, a low pressure collection
system with grinder pumps and a membrane bioreactor (MBR) are recommended. The
estimated costs are $12.1 million in capital costs ($22,080 per household) and $236,000 in
annual operating expenses, with monthly user fees potentially ranging from $36 to $112,
depending upon funding and subsidy options.
DECENTRALIZED WASTEWATER TREATMENT in the Peconic Estuary Chapter 1 – Page 4 Peconic Green Growth, Inc.
b. North Sea
This proposal, for a new community sewer with a theoretical flow of 53,910 gpd, is designed to
provide service for 163 homes and six vacant lots. Ninety-two percent of the lots are
nonconforming to current minimum lot sizes defined in the Suffolk County Sanitation Code
(Article 6 706-605). A low pressure collection system with grinder pumps is recommended by
NSU, with a natural wastewater treatment system using a recirculating, vegetated gravel filter.
The projected capital costs are $5.7 million ($35,000 per household) with annual operating
expenses of $113,100. Monthly user fees incorporating both capitalization and maintenance
costs would range from $56 to $173, depending upon funding and subsidy options.
c. Aquebogue – Meeting House Creek
This system was designed for the 100 developed lots, all occupied by single-family residences,
with a theoretical flow of 30,000 gpd. Seventy-six percent of the lots are nonconforming to
current minimum lot sizes defined in the Suffolk County Sanitation Code. A low pressure
collection system with grinder pumps is recommended by NSU, with a natural wastewater
treatment system using a recirculating, vegetated gravel filter. The capital cost is estimated at
$3.65 million ($36,500 per household) with annual operating expenses of $106,100. Estimated
monthly user fees would range from $73 to $270, depending upon the degree of subsidy.
PGG worked with Orenco Systems Inc. to develop a rough estimate for the cost of a STEP system for East
Marion for the equivalent of roughly 450 dwelling units (DU). The estimated capital costs, including land
acquisition, are $11.74 million ($26,087 per DU). Estimated monthly operational expenses are $19.35
per DU. Estimated monthly costs per dwelling unit for both capitalization and operational costs ranged
from $42 to $116.
In South Jamesport, PGG with NSU also evaluated a community system for nineteen homes with a
design flow of 5,700 gpd. The cost for a chromoglass system was roughly $450-$600,000, with $50,000
for the collection system. Annual operations and maintenance were assumed to be $17,000. This
translates to up to $34,210 in capital costs per dwelling unit and $895 or $75 per month in just O+M
annual cost. The larger systems referenced above included capital expenses in the estimated monthly
fee, while a small cluster caused the burden of maintenance and operational costs to be borne by too
few homeowners. The resulting financial burden was considered too high by the community to even
pursue this project, especially as a voluntary enhancement.
What is evident, from the cost evaluations above, is that the size of concentrated housing groups helps
lower the capital costs per dwelling unit. Yet even the highest cost at $36,500 is much lower than the
costs for large municipal plants when designed for east end densities, as evidenced by the $47,600 –
$63,500 estimate per dwelling unit equivalent in the SCDPW Flanders study.1 Limiting clusters to areas
that make sense geographically is cost effective and more environmentally benign. The Meeting House
Creek system designed for 100 dwelling units, the upper limit of an intermediate-sized system, had high
O+M costs. We feel that this is the greatest hurdle to the widespread implementation of decentralized,
intermediate-sized, clustered treatment systems. Efforts to select systems with lower operating costs,
use of remote telemetry, and supervision by municipalities or contractors responsible for a significant
DECENTRALIZED WASTEWATER TREATMENT in the Peconic Estuary Chapter 1 – Page 5 Peconic Green Growth, Inc.
number of plants will help lower these costs further. For instance, in Hillsdale an inspector visits the
plant 2-3 times weekly, but is supported by remote telemetry. Based on our survey, to be acceptable to
the public, we need to target monthly charges that are below $50 per month.
In addition to introducing enhanced treatment in clustered formation to densely built neighborhoods,
another cost-effective way to mitigate nitrogen loading is to add secondary and tertiary treatment to
existing large-scaled septic systems. This increases the effectiveness of the infrastructure already in
place. PGG and NSU evaluated such a system for Fishers Island.2 Depending upon the degree of
treatment, enhancements ranging in cost from $10,000 to $15,000 per DU can achieve significant
reductions (50-83%) in nitrogen outflow that achieve equivalent reductions in pounds per year.
1.1.5 Action Items
In order to address decentralized wastewater issues, PGG with feedback from the public, professionals,
research, and symposia, generated a list of twenty action items. These included recommended changes
to regulations, standards, and management practices. While these discussions were a start, PGG felt
time constraints limited this exploration and that more work is needed on these important issues. The
Suffolk County Department of Health Services (SCDHS) has indicated a willingness to work with PGG on
the identification of an approval process for the establishment of community systems in existing
neighborhoods as pilot projects.
1.2 Water Quality Assessments
Excess nitrogen causes algal blooms that in turn reduce dissolved oxygen levels and contribute to the
acidification of the waters, impacting fish and shellfish formation and survival rates. Excess nitrogen also
impacts eel grass survival and weakens the root systems of wetland grasses. Their decline impacts
marine life habitats as well as reduces their usefulness as buffers to the built environment from storm
impacts. In 2013 there were three types of algal blooms occurring in the Peconic Estuary: rust tide, toxic
blue green algae and red tide, a paralytic shellfish poisoning.
The Peconic Estuary (PE) is an estuary of national importance under Section 320 of the Clean Water Act
(amendments 1987). Most of the open waters and bays within the study area have a NYS Department of
Environmental Conservation classification of SA, the highest ranking of water quality and the only one
approved for the harvesting of shellfish for human consumption. These waters have the most protected
status with their impairments tracked through the State in compliance with the Clean Water Act.
Most of the impairments are found in the western portion of the estuary and in the creeks and bays
with shallow water and/or restricted flow. A nitrogen Total Maximum Daily Load TMDL has been
calculated to address low dissolved oxygen in the western section of the estuary. While the impairment
is localized, nitrogen reduction is needed throughout the estuary to achieve reduction goals. Nitrogen
levels exceed maximum levels in the coastal waters lining the north shore and this is mirrored by high
nitrogen loading in groundwater on the North Fork. Nitrogen levels in the Peconic Estuary exceeding the
DECENTRALIZED WASTEWATER TREATMENT in the Peconic Estuary Chapter 1 – Page 6 Peconic Green Growth, Inc.
recommended maximum concentrations levels were detected in the coastal waters along the estuary’s
north shore. This is a reflection of the high levels of nitrogen detected in groundwater on the North
Fork. Despite the fact that onsite wastewater nutrient loading is the major land-based contributor to
nitrogen inputs to the Peconic Estuary, none of the action items included in the TMDL addresses this
issue at its source.
While a reevaluation of water quality in the Peconic Estuary conducted in 2012 found basically a steady-
state condition, there are a number of stations with worsening conditions, pointing to a need to
accelerate mitigation efforts. Continuous monitoring stations document the extremely low dissolved
oxygen levels in the western section. The healthier waters in Orient also display stressed, even chronic
conditions, during late summer and early fall. A study by The Nature Conservancy (TNC)3 estimates that
the contributions of onsite wastewater to nitrogen loading, was underestimated in the TMDL. Instead of
the almost equal relationship of nitrogen and fertilizer loading to groundwater described in the TMDL,
TNC found that onsite systems contributed 7 ½ times the nitrogen load of fertilizer to groundwater in
the Peconic Estuary.
In response to the high nitrogen loading, the County recommends doubling the minimum lot size from a
nominal half-acre (20,000 square feet) to one acre (40,000 SF)4 in order to dilute excess nitrogen loading
being discharged by onsite wastewater systems, especially in Hydrological Zone IV, which covers most of
the East End. This strategy helps protect groundwater from the impacts of future development, but does
not address existing nonconformity issues. It also does not address the more stringent nitrogen levels
recommended by the TMDL (0.4 – 0.45 mg/L) for a healthy marine environment, which are twenty times
more stringent than drinking water standards (10 mg/L).
To accelerate the mitigation of nitrogen, originating from onsite wastewater systems, mitigation goals
need to guide actions. One potential danger is the introduction of a solution that is not adequate
enough to protect marine water quality. While the TMDL suggested overall reductions for existing
development (33% beside impaired waters, and 25% elsewhere), our evaluation finds that this is not
enough to mitigate the source loading coming from individual systems. We assess that 50% reductions
applied to all existing developed lots could mitigate the proportion of nitrogen loading estimated as
originating from the onsite systems. But this does not account for local intensification of use and
densities. On Cape Cod they found that the 50% mitigation provided by enhanced onsite treatment was
not enough in densely developed subwatersheds.
Within a given jurisdiction different sets of requirements may be applied based on location. This can
often lead to a perception of inequality or unfairness. This occurred recently on Shelter Island, where
they were trying to develop three different irrigation strategies based on local aquifer conditions. The
public objected. Now the government is exploring a more evenly applied set of requirements.
We would like to suggest another approach for setting nitrogen mitigation goals; one that can either
stand on its own or be an interim guide. This would apply a 10mg/L discharge/ 75% nitrogen reductions
(or best available technology) for nonconforming lots and a 20 mg/L/50% reduction for all others in the
DECENTRALIZED WASTEWATER TREATMENT in the Peconic Estuary Chapter 1 – Page 7 Peconic Green Growth, Inc.
watershed. As just about every impaired watershed has nonconforming lots in its vicinity, this strategy
should go a long way to addressing both localized and overall nitrogen mitigation goals. It is a simple
rule, easily understood and addresses grandfathered conditions, where nonconforming conditions
negatively impact water quality and tend to be the most problematic.
1.3 Survey of Residents on the East End
PGG conducted a survey of 752 local residents to help identify potential issues and obtain more detailed
data relative to onsite wastewater systems. Forty-eight percent of the survey respondents lived in the
target Peconic Estuary. While most people knew where on their lot their onsite wastewater systems
were, 20% in the Peconic Estuary had never had their septic tanks pumped out. Thirty-six percent had
no idea when they should pump out their system. Sixty-one percent had homes built before 1973, so
their systems were likely to be cesspools. Positive interest in alternative treatment of wastewater
outweighed negativity, with many people remaining open to exploring the options, but without
embracing them. Forty-five percent were willing to pay at least $500 per year for enhanced systems,
but 73.8% (PE) felt that subsidies by the larger community or government were appropriate and only
6.6% felt that the costs should be borne solely by the individual household.
A more qualitative understanding of public receptivity was sensed through the cooperation of civic and
home owner groups. The majority were tentatively cooperative. Communities that rely on individual
wells for drinking water or experience shallow depths to groundwater are more likely to care about
onsite wastewater contamination and consider volunteer enhancements to wastewater treatment. The
issue is more abstract for communities on higher ground with sandy soils, as the impact of excess
nitrogen loading does not have the same visceral impact on quality of life or on the functioning of
personal onsite wastewater treatment systems. Public awareness and scientific verification are
instrumental to increasing understanding of these issues. It will probably require regulation and/or
government-imposed projects to rectify conditions in some of these communities. A continued three-
prong effort is needed: improved science-based documentation, new government standards and
oversight, and increased public awareness resulting in demand.
1.4 Town and Hamlet Characteristics in the Peconic Estuary Watershed
Various conditions affecting nitrogen loading were mapped by PGG and the Town of Southampton GIS
department. Maps depicting water quality impairments, depth to groundwater, flood/SLOSH zones, soil
drainage class, soil septic absorption, lot size/density, influence zones measured by groundwater travel
times, and priorities were generated. PGG revised their previously developed methodology by adding
three evaluation measures: 1) horizontal impacts of sea level rise, 2) data evaluation on
nonconformance due to lot size, and 3) setback clearance from all structures to inform site selection
criteria for collected systems when targeting pilot projects. The depth-to-groundwater and horizontal
inundation maps also helped scope resiliency issues due to climate change. From the GIS files, a myriad
of data queries were conducted and summarized.

DECENTRALIZED WASTEWATER TREATMENT in the Peconic Estuary Chapter 1 – Page 8 Peconic Green Growth, Inc.
- Thirty-four percent of the buildings larger than 450 SF in the Peconic Estuary lie on lots with
shallow depths to groundwater (less than thirteen feet), with the town of Riverhead being the
most vulnerable with 45.2%. The associated onsite wastewater systems on lots with shallow
depths to groundwater are expected to eventually fail due to rising groundwater tables caused
by climate change. These lots will not have the required clearances to nitrify effluent. Pathogens
dispersed from cesspools will be more likely to enter groundwater, posing a potential health
hazard.
- Within the Peconic Estuary, 12% of buildings are in flood zones, 5% are in the 100-year flood
plain or VE zone, and 33% are in SLOSH zones (storm surge). The hamlet of Southold has the
most exposure with 670 buildings located in flood zones and 1,577 in SLOSH zones.
- Fifty-four percent of the buildings in the Peconic Estuary are on soils considered very limited for
the treatment of onsite wastewater. East Hampton tops the towns, with 76.1% being on very
limited soils. Forty-four percent of the buildings in the Peconic Estuary are on soils that drain
excessively, with the town of Southampton being the highest at 70%. The latter condition tends
not to impact actual system function, but does transport wastewater too quickly to
groundwater, increasing contamination levels, as there is not enough time for natural soil-based
processing to occur.
- Due to the historic nature the hamlets of the East End, many parcels are nonconforming to the
current statute, with 19,392 or 45% of all developed lots being less than the 20,000 SF minimum
(a nominal half-acre). Of these, 7,162 or 18% are less than one-quarter acre in size. An
additional 6,693 are vacant parcels in the Peconic Estuary that are less than 20,000 SF,
representing 11.6% of all lots. There are an additional 2,172 developed lots that are
nonconforming to Zones III, V, or VI as they are sized between 20,000 SF and less than 40,000 SF
(nominal one acre), with 740 vacant lots exhibiting the same nonconformance, increasing the
percent of nonconforming lots by 5%, for a total of 50%. This number is conservative as it does
not include those nonconforming lots less than 40,000 SF that rely on individual wells for
drinking water supplies. In addition to the lots currently nonconforming, there are another
10,238 developed lots and 1,859 vacant lots sized between 20,000 SF and 40,000SF in Zone IV. If
one were to consider both nonconforming lots under existing code and those that will be
nonconforming if regulations are changed to increase the minimum lot size for Zone IV as has
been proposed, the total nonconformance would be 70.9% (54.9% developed and 16% vacant)
of all parcels. This calculation does not identify any lot that may have been preserved.
- Historic development using small lots is compatible with current smart growth concepts where
density supports the sustainable goals of walkable communities. Higher densities alone cannot
create sustainable communities unless the natural carrying capacities of the land are also
respected. Proper wastewater treatment meeting local environmental goals will go a long way
to ensuring that these historic hamlets become sustainable on multiple fronts.
DECENTRALIZED WASTEWATER TREATMENT in the Peconic Estuary Chapter 1 – Page 9 Peconic Green Growth, Inc.
- Forty-seven percent of all buildings greater than 450 SF in the Peconic Estuary are sited over
groundwater that only takes zero to two years to reach surface waters. In other words, we have
a chance to have a positive impact on water quality if we act promptly, one that can accrue
benefits relatively quickly compared to other locations.
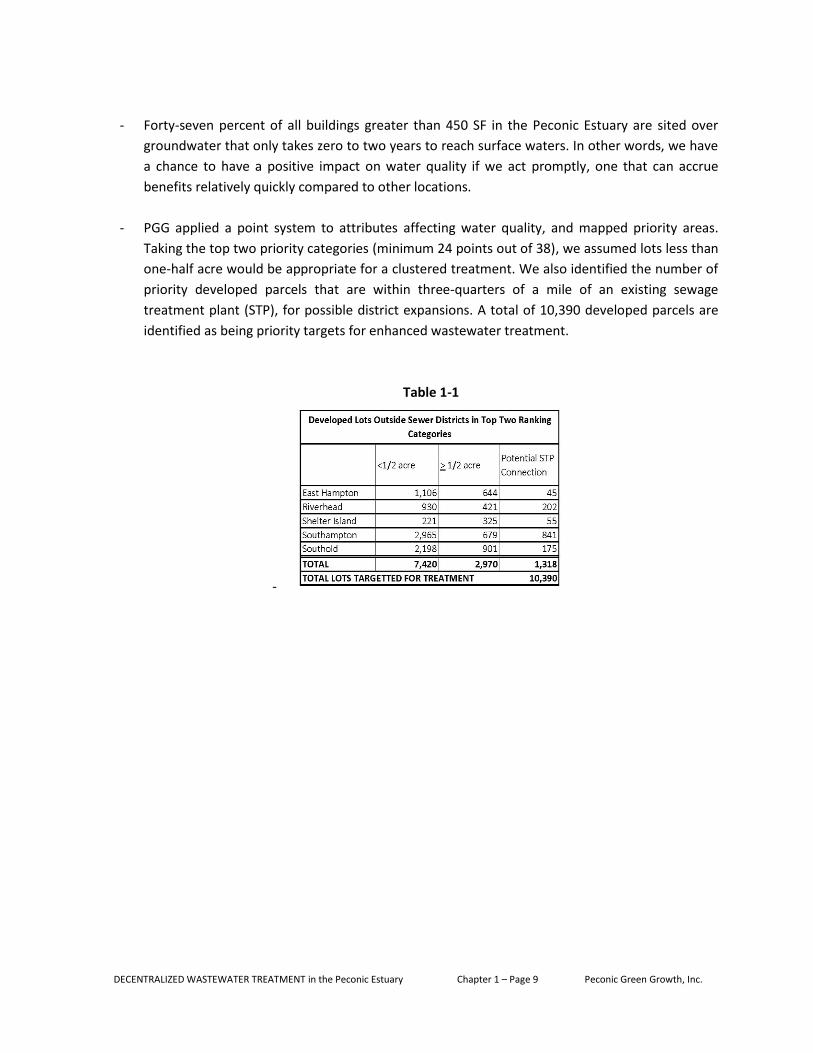
- PGG applied a point system to attributes affecting water quality, and mapped priority areas.
Taking the top two priority categories (minimum 24 points out of 38), we assumed lots less than
one-half acre would be appropriate for a clustered treatment. We also identified the number of
priority developed parcels that are within three-quarters of a mile of an existing sewage
treatment plant (STP), for possible district expansions. A total of 10,390 developed parcels are
identified as being priority targets for enhanced wastewater treatment.
Table 1-1
-
DECENTRALIZED WASTEWATER TREATMENT in the Peconic Estuary Chapter 1 – Page 10 Peconic Green Growth, Inc.
1.5 Local Conditions
The local character varies greatly by hamlet, as does the relationship of development to adjacent water
bodies. Based on the mapping, we feel that three approaches to enhanced treatment are needed in the
estuary:
- Expansion of municipal sewer districts
- Decentralized, clustered systems
- Enhanced onsite systems
We believe that the expansion of existing districts or introduction of new, large-scaled plants is needed
in the following locations:
1. The Village of Sag Harbor, in both the Southampton Town and East Hampton Town segments
(with immediate priority being given to the Southampton section)
2. Extension of the Riverhead sewage treatment plant (STP) to include nearby densely built
neighborhoods
a. Area on lower Mill Road, including Glenwood Village, a mobile home park.
b. Area bordered by Route 25, Route 48 including Phillips Street to the South.
c. Area along and to the north of Hubbard Avenue east of Route 25, extending to Zion
Street. This includes another trailer park.
3. Extension of the Greenport STP
a. To the east and west of the district as currently proposed by Greenport
b. Add to the district in the Long Island Sound watershed area to balance Peconic Estuary
loading and to ensure maximum use of the plant if it is possible to respect
comprehensive mass loading to the LI Sound.
c. Further expansion east, possibly as far as Maple Lane
4. Southold – the area is densely populated and very vulnerable to flooding
5. South Jamesport, Jamesport, and Aquebogue coastal regions along the Peconic Estuary
The following areas can benefit from intermediate-sized and small larger-scaled systems
1. Orient – particularly the historic village
2. East Marion – the areas around Marion Lake and Gull Pond
3. Cutchogue – the four areas around Haywater Cove
4. New Suffolk
5. Meeting House Creek as described in chapter 10
6. Riverside (already being considered as part of a redevelopment plan)
7. Flanders: area west of Reeves Bay, north of Route 24
8. Flanders: peninsula between Reeves and Goose Creek, north of Route 24
9. North Sea: five sections, including the one explored in chapter 8
10. Noyak: from Burkeshire Drive to Jermaine Avenue in the high priority districts, possibly combine
with a sewer district for Sag Harbor
11. Springs: Area northeast of Three Mile Harbor
12. Springs: Area northwest of Accabonac Harbor
DECENTRALIZED WASTEWATER TREATMENT in the Peconic Estuary Chapter 1 – Page 11 Peconic Green Growth, Inc.
13. Montauk: the areas west and south of Lake Montauk
There are other areas where small clusters might make sense, but their size is relatively small
compared to the ones listed above.
The remaining lots should at minimum pursue 50% nitrogen reductions to onsite treatment, with
increased mitigation for all nonconforming lots.
1.4 Regulation and Management
There is an urgent need for governments to reexamine current regulations, reevaluate standard
oversight roles, and to consider a more proactive stance relative to the management of wastewater
treatment. At issue is how to bring about necessary improvements where the benefits are less readily
obvious on an individual basis, but dire in terms of regional future sustainability, survival (food),
economics, and quality of life. Government needs to protect water quality with the long view, while
devising methods to fairly assess impacts, pay for priority infrastructure, and expend funds wisely and
efficiently.
1.4.1 Reexamine goals and regulations, considering these suggestions:
New Standards
- Define nitrogen impairment numerically
- Increase the minimum sized lot to 40,000 SF throughout the county for new development and
even higher in certain watersheds
- Incorporate mass loading maximums, not just flow concentrations in all regulations and
standards for groundwater discharge
The two principle measurements of nitrogen are flow and total pounds of nitrogen. Current
regulations regarding development densities are based on nitrogen flow rates which impact
drinking water. The evaluation does not take in consideration total pounds of nitrogen, which is
a critical factor influencing the impacts of nitrogen loading on marine environments.
Revised carrying capacities need to be considered for both flow and total poundage, especially
when adjacent to sensitive watershed areas. As an example, sewage treatment plants with
outflow to TMDL waters have pound limitations as well as flow maximums. Applying this revised
standard for a carrying capacity defined by total pounds of nitrogen per area, applicable to
existing onsite systems, would greatly improve marine health. Planning departments that have
eschewed any kind of wastewater treatment due to a fear of unfettered development would
then have a tool to define limits to development appropriate to the context, even when
enhanced treatment is provided.
DECENTRALIZED WASTEWATER TREATMENT in the Peconic Estuary Chapter 1 – Page 12 Peconic Green Growth, Inc.
- Do not allow cesspools to be installed, even for systems installed prior to 1973.
Applications:
- Adjust maximum flow concentrations to reflect environmental sensitivities of marine waters in
each specified area
- Link zoning to water quality and TMDL goals, while recognizing contextual character and smart
growth concepts. Master plans should incorporate nitrogen loading maximums and transfers
within their programs.
- Understand the impacts of seasonal fluctuations in occupancy on water quality
- Adopt mitigation goals tied to mapped or definable conditions and use
- Cease issuing variances for parcels adjacent to surface water
- Develop a program to phase-out grandfathered conditions and/or require mitigation
- Expand the number of acceptable systems and technologies for both clustered and onsite
treatment, including nonproprietary, passive, leaching field and reuse solutions
1.4.2 Management
Traditionally sewer districts are tied to physical infrastructure. Instead PGG is advocating
wastewater treatment districts or watershed strategy districts that are as large or inclusive as
possible, whether they are county-wide, watershed-wide, town-wide, or hamlet based. Nitrogen
mitigation has varying degrees of need – and a universal approach will not be the most cost-
effective way of addressing the problem. Instead subsidies will be needed to realize and implement
projects where the impact is most significant. Also, varied strategies, combining onsite with
community systems and sewer district expansions, can then be managed coherently by a single
oversight agency.
Priorities include:
- Adopt appropriate oversight management models and systems for:
Testing water quality
Inspecting systems
Certification (i.e.: inspectors, designers, installers, haulers, etc.)
Maintenance protocols
Inventory
Performance evaluation
Accessibility and transparency of information
DECENTRALIZED WASTEWATER TREATMENT in the Peconic Estuary Chapter 1 – Page 13 Peconic Green Growth, Inc.
- Establish the preferred Responsible Management Entity for the operation of enhanced systems
- Develop districts that are larger than the actual infrastructure proposed, so that shared costs
and benefits would be a benefit to a greater population
- Establish funding mechanisms to enable people to install enhanced systems in a socially
equitable manner
- Protect the viability of system operations and fair share of costs from the negative impacts of
delinquent payments
- Establish priorities based on environmental need
- Provide the staffing and resources necessary to carry out the work plan
1.4.3 Ownership Models
Both Town and County governments need to assess the implications of ownership models on quality
of operation and cost. Should the government own or manage facilities? Should quasi-government
authorities be empowered? Are private cooperatives and nonprofits to be allowed to own and
operate facilities? Is a public/private partnership option viable?
1.4.4 Cost to the Household
The federal Environmental Protection Agency (EPA) recommends that a household spend no more
than 2% of its income on wastewater and water costs. If one evaluates a 2% maximum for the
lowest median household income of the eastern towns, $1,269 is the highest annual cost that
should be considered. We suggest basing the 2% cap on per capita income as a starting point, which
would protect families with single sources of income. That calculation yields a maximum of $531
per year. A fund to support families below a certain income threshold should be considered to
protect the most vulnerable and gain full participation.
1.4.5 Cost/Benefit Analysis
While overall protection of the aquifer in Suffolk County is needed, subwatershed goals may be
variable. Size of watershed, density of development, shape and size of the receiving water bodies,
soils, and depths to groundwater all impact nitrogen concentrations. Also, mitigation goals may
differ according to overlapping TMDL’s and impairment of water quality.
This would mean that the cost per pound of nitrogen mitigated is a viable method of evaluation.
Using this, standard figures for nitrogen influent, effluent, and attenuation are necessary. Since the
basic infrastructure is already in place, adding secondary and tertiary treatment to existing large-
scaled systems can be cost effective. But, costs per pound should not be the only controlling factor.
Areas relying on individual wells for drinking water, neighborhoods with a predominance of
DECENTRALIZED WASTEWATER TREATMENT in the Peconic Estuary Chapter 1 – Page 14 Peconic Green Growth, Inc.
cesspools, and communities with a high number of nonconforming lots/systems should be
prioritized for projects, as multiple environmental issues may be addressed with a single project.
1.5 Conclusions
We strongly believe that a shift in how decentralized wastewater treatment is managed at both the
County and Town levels is needed. Applying a range of strategies based on efficacy and environmental
conditions will achieve cost efficiencies and greater water quality benefits in both aquifers and surface
water bodies. Government agencies need more flexible frameworks to better manage a range of
options. Multiple solutions should be allowed within a given program. Oversight of onsite, clustered and
conventional sewer districts should be integrated. Since nitrogen mitigation will have local variation in
target goals, rather than universal standards, subsidy may be needed for project realization in those
areas that will have the greatest impact on watershed water quality in the Peconic Estuary.
Treatment of specifically targeted projects, usually those in denser communities close to the coast, may
be the most cost effective way of meeting TMDL goals. Home owners and developers will not voluntarily
take on the extra cost and maintenance burdens of enhanced systems without incentives or regulatory
directives. The home owners in communities that may have the highest need for mitigation, such as
older communities with small lot sizes, may not have the financial resources to carry the burden of
needed improvements.
Suffolk County found itself in an untenable position in 2012 when the only intermediately sized
wastewater system approved for implementation was found to exceed maximum levels of
contaminants. The county responded by both amending oversight and expanding the types of pre-
approved systems. Suffolk County is also open to pilot installations of alternative systems with proven
track records. As a rule, community systems are only installed for new developments that exceed
Sanitary Code density restrictions. Yet proper placement of these systems is especially relevant for
existing neighborhoods, particularly on the East End of Long Island where densities are relatively low
and cannot support the cost of large central sewers.
The advantage of the community-based, intermediate-sized systems is that they can obtain a higher
degree of treatment than the enhanced onsite systems for individual residences. More frequent
professional oversight will ensure proper function. Community systems can upgrade a whole
neighborhood simultaneously, thereby increasing the likelihood of noticeable water quality
improvements. Clustered systems are also more easily adaptable to improved technology. The collective
system is local enough that recharge is to local watershed groundwater, avoiding the withdrawal of
water from sub-watersheds. Disadvantages include the need for pumps and power, finding appropriate
sites for collective treatment, the lengthy process for regulatory approvals, and potentially higher
maintenance costs.
There are a number of locations in the study area where community systems are appropriate for
consideration. Enhanced treatment is needed throughout the estuary, defining a simultaneous need for
DECENTRALIZED WASTEWATER TREATMENT in the Peconic Estuary Chapter 1 – Page 15 Peconic Green Growth, Inc.
improved onsite systems as well. Community systems can be an effective treatment option in
neighborhoods where isolated clusters of mid to high densities exist -- a land use pattern typical for the
historic hamlets and vacation communities found on the East End.
In conclusion, community systems for the treatment of decentralized wastewater are viable options.
They appear to be more cost effective if the area treated is dense and of a minimum size. The higher
level of treatment attainable with community systems translates to cost efficiencies when mitigation
goals are set in total pounds of nitrogen. It will take significant changes in community awareness,
government policies and regulations and management to make these improvements actually begin to
happen.
1 Suffolk County Department of Public Works, Flanders Riverside Corridor Sewering Feasibility Study, CP8192,
Revised August 2013, P. ES-7. (Note: range depends upon the assumption of equivalent Dwelling Units (DU)
using either 300 gpd or 225 gpd.)
2 Berry, Glynis and Natural Systems Utilities, Plan for Decentralized Wastewater Treatment, North Fork (NY),
Peconic Green Growth, Peconic Green Growth,, Inc., Long Island Sound Futures Fund, NFWL/Legacy Grant
Project ID: 1401.12.033406, 2014, Ch. 6.
3 Lloyd, Stephen, Nitrogen Load Modeling to Forty-three Subwatersheds of the Peconic Estuary, The Nature
Conservancy in partnership with the Peconic Estuary Program, 2014.
4 Suffolk County Department of Health Services (SCDHS) prepared by CDM, Suffolk County Comprehensive Water
Resources Management Plan (SCCWRMP), August 2010 Draft, 3-127ff.