pilot environmental sustainability index - sedacsedac.ciesin.columbia.edu/es/esi/esi_00.pdf ·...
TRANSCRIPT
Pilot EnvironmentalSustainability Index
An Initiative of theGlobal Leaders for Tomorrow Environment Task Force,
World Economic Forum
Annual Meeting 2000Davos, Switzerland
In collaboration with Yale Center for Environmental Law and Policy (YCELP)Yale University
Center for International Earth Science Information Network (CIESIN)Columbia University
Global Leaders for Tomorrow Environment Task Force
Chair:Kim Samuel-Johnson Canada
Project Director:Daniel C. Esty USA
Members:
Matthew J. Cadbury United Kingdom
Carlos E. Cisneros Venezuela
Colin Coleman South Africa
Francisco Gutierrez Campos Paraguay
Molly Harriss-Olson USA
Dominique-Henri Freiche France
George M. Kailis Australia
Shiv Vikram Khemka India
Christopher B. Leptos Australia
Patrick Odier Switzerland
Paul Saffo USA
Pilot EnvironmentalSustainability Index
An Initiative of the Global Leaders for Tomorrow Environment Task Force,
World Economic Forum
TABLE OF CONTENTS
Executive Summary 4
The Need for an Environmental Sustainability Index 5
The Path Ahead 5
How the Prototype was Constructed 5
Preliminary Analysis of Pilot Environmental Sustainability Index 6
Conclusions 12
Methodological Appendix 20

Report cover is printed on 100% recycled paper/100% office waste paper.Report interior is printed on 100% recycled paper/minimum 50% postconsumer waste paper.
3
This report is the result of collaboration amongthe Global Leaders for Tomorrow (GLT)Environment Task Force, the Yale Center for Lawand Environmental Policy (YCELP) and theColumbia University Center for InternationalEarth Science Information Network (CIESIN).
The GLT team was led by Kim Samuel-Johnson.The Environment Task Force members (listed onthe inside cover) benefited from the participationof a number of experts in environmental sustain-ability and indicators who attended a workshopin New Haven, Connecticut on September 30-October 1, 1999, including Alan AtKisson,Christian P. Avérous, Peter Cornelius, KirkHamilton, Allen Hammond, Theodore Heintz, KaiLee, William Nordhaus, Gus Speth, AndreasSturm, Phillip Toyne, and Claas van der Linde.
The YCELP team was led by Daniel C. Esty; otherteam members include Jennifer Daniels, ElizabethJenkins, Lisa Max, and Brian Fletcher.
The CIESIN team was led by Marc A. Levy; otherteam members include Deborah Balk, Bob Chen,Alex de Sherbinin, Francesca Pozzi and AntoinetteWannebo. Additional assistance is gratefullyacknowledged from Janice Aitchison (ColumbiaEarth Institute Office of External Relations), JenMulvey, Ed Ortiz, Carrie Keneally, FrancescoFiondella and Melanie Brickman. Tom Parrisprovided very helpful advice.
Copyright ©2000 Yale Center for Environmental Law and Policy
Global Leaders for TomorrowWorld Economic Forum91-93 route de la Capite1223 Cologny/GenevaSwitzerland(41-22) 869-1212Fax (41-22) [email protected]
Center for InternationalEarth Science InformationNetwork (CIESIN)Columbia UniversityPO Box 100061 Route 9WPalisades, NY 10964USA(1-914) 365-8988Fax (1-914) [email protected]
Yale Center for EnvironmentalLaw and Policy250 Prospect StreetNew Haven, CT 06511USA(1-203) 203 432-3123Fax (1-203) [email protected]/envirocenter
Pilot Environmental Sustainability Index
An Initiative of the Global Leaders for Tomorrow Environment Task Force,
World Economic Forum
January 31, 2000
4
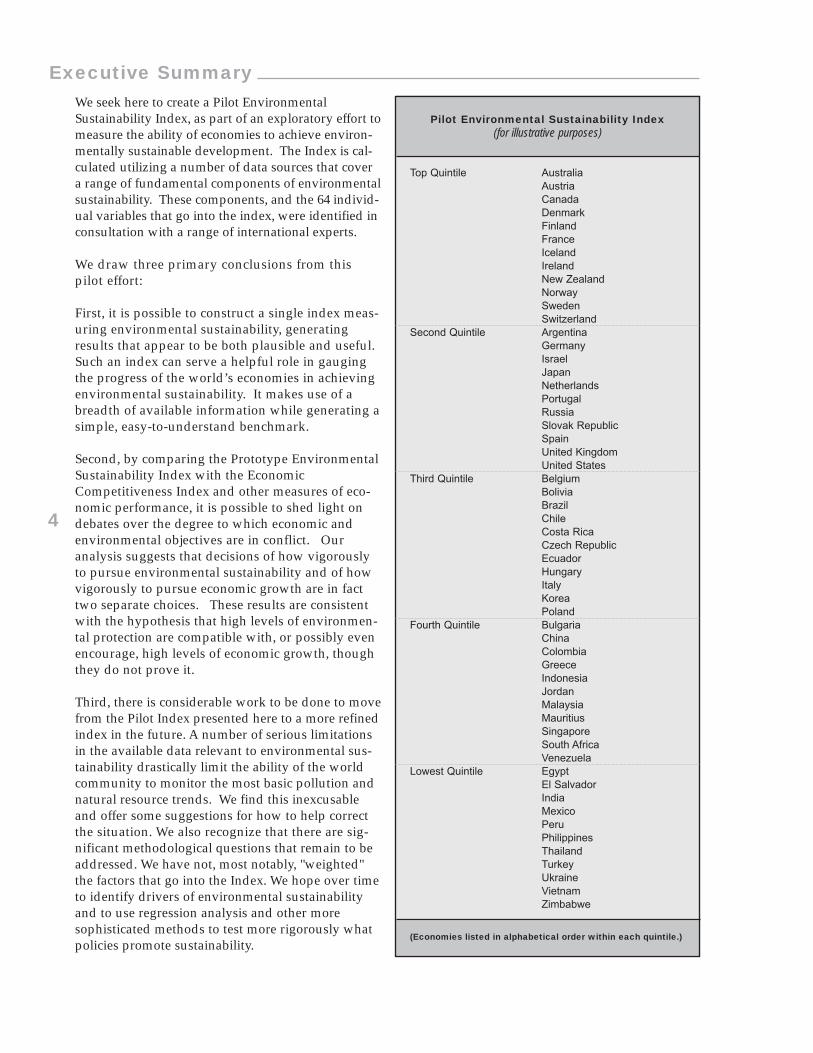
Pilot Environmental Sustainability Index (for illustrative purposes)
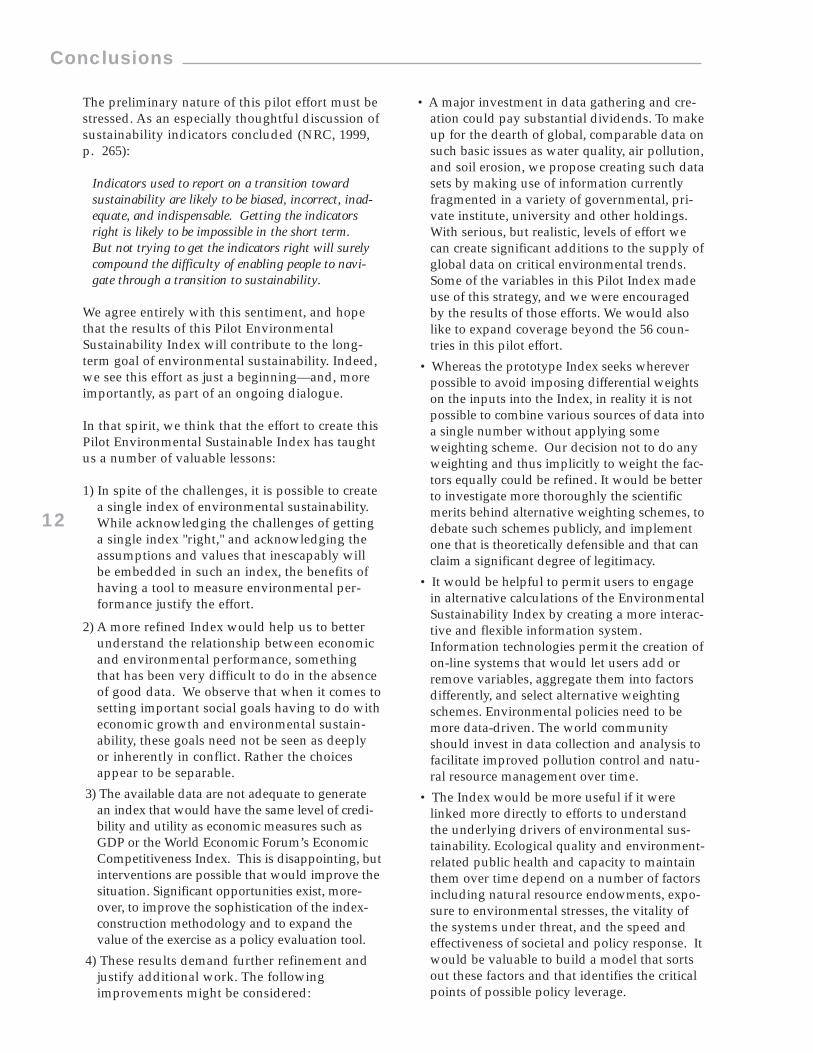
Top Quintile AustraliaAustriaCanadaDenmarkFinlandFranceIcelandIrelandNew ZealandNorwaySwedenSwitzerland
Second Quintile ArgentinaGermanyIsraelJapanNetherlandsPortugalRussiaSlovak RepublicSpainUnited KingdomUnited States
Third Quintile BelgiumBoliviaBrazilChileCosta RicaCzech RepublicEcuadorHungaryItalyKoreaPoland
Fourth Quintile BulgariaChinaColombiaGreeceIndonesiaJordanMalaysiaMauritiusSingaporeSouth AfricaVenezuela
Lowest Quintile EgyptEl SalvadorIndiaMexicoPeruPhilippinesThailandTurkeyUkraineVietnamZimbabwe
(Economies listed in alphabetical order within each quintile.)
We seek here to create a Pilot EnvironmentalSustainability Index, as part of an exploratory effort tomeasure the ability of economies to achieve environ-mentally sustainable development. The Index is cal-culated utilizing a number of data sources that covera range of fundamental components of environmentalsustainability. These components, and the 64 individ-ual variables that go into the index, were identified inconsultation with a range of international experts.
We draw three primary conclusions from thispilot effort:
First, it is possible to construct a single index meas-uring environmental sustainability, generatingresults that appear to be both plausible and useful.Such an index can serve a helpful role in gaugingthe progress of the world’s economies in achievingenvironmental sustainability. It makes use of abreadth of available information while generating asimple, easy-to-understand benchmark.
Second, by comparing the Prototype EnvironmentalSustainability Index with the EconomicCompetitiveness Index and other measures of eco-nomic performance, it is possible to shed light ondebates over the degree to which economic andenvironmental objectives are in conflict. Ouranalysis suggests that decisions of how vigorouslyto pursue environmental sustainability and of howvigorously to pursue economic growth are in facttwo separate choices. These results are consistentwith the hypothesis that high levels of environmen-tal protection are compatible with, or possibly evenencourage, high levels of economic growth, thoughthey do not prove it.
Third, there is considerable work to be done to movefrom the Pilot Index presented here to a more refinedindex in the future. A number of serious limitationsin the available data relevant to environmental sus-tainability drastically limit the ability of the worldcommunity to monitor the most basic pollution andnatural resource trends. We find this inexcusableand offer some suggestions for how to help correctthe situation. We also recognize that there are sig-nificant methodological questions that remain to beaddressed. We have not, most notably, "weighted"the factors that go into the Index. We hope over timeto identify drivers of environmental sustainabilityand to use regression analysis and other moresophisticated methods to test more rigorously whatpolicies promote sustainability.
Executive Summary
5
This Pilot Environmental Sustainability Index willbe refined in the months and years ahead. Thisprototype unveiled here is meant to stimulate adebate and dialogue over what constitutes envi-ronmental sustainability, how to measure the con-cept, what data are needed and where they can befound (or developed), what should count as goodperformance, how to weight different componentsof environmental sustainability, what methodolo-gy should be pursued in constructing an index,and what policy choices drive sustainability.
We hope that future work will enable us to makethe Index more sophisticated and reliable—and
permit us to isolate the "drivers" of environmentalsustainability. In this regard, we plan to evolvetoward the model provided by the WorldEconomic Forum’s Global Competitiveness Indexand to employ advanced statistical techniques,including regression analysis, to help further ourunderstanding of the individual roles of naturalendowments, pollution and resource stresses,public health and social conditions, culturalnorms and preferences, as well as policy choicesin determining the environmental sustainability ofparticular economies. This exercise, requiring sys-tematic unpacking and analysis of the concept ofenvironmental sustainability, has just begun.
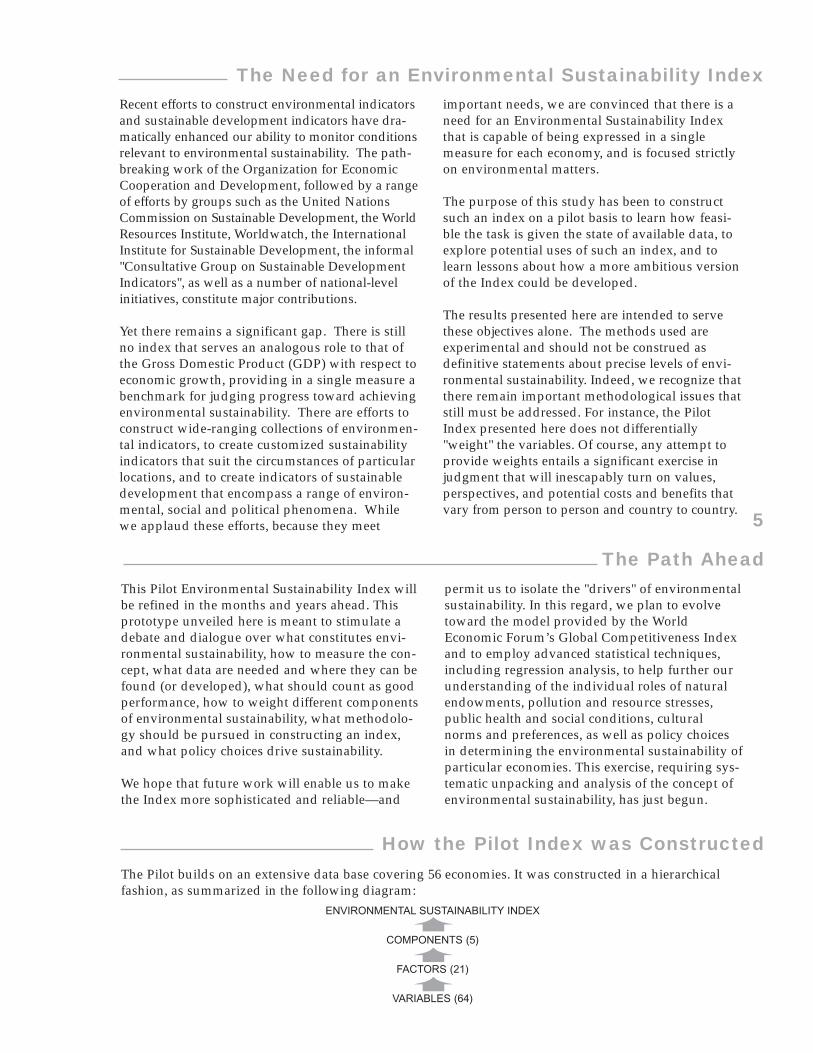
The Pilot builds on an extensive data base covering 56 economies. It was constructed in a hierarchicalfashion, as summarized in the following diagram:
ENVIRONMENTAL SUSTAINABILITY INDEX
COMPONENTS (5)
FACTORS (21)
VARIABLES (64)
Recent efforts to construct environmental indicatorsand sustainable development indicators have dra-matically enhanced our ability to monitor conditionsrelevant to environmental sustainability. The path-breaking work of the Organization for EconomicCooperation and Development, followed by a rangeof efforts by groups such as the United NationsCommission on Sustainable Development, the WorldResources Institute, Worldwatch, the InternationalInstitute for Sustainable Development, the informal"Consultative Group on Sustainable DevelopmentIndicators", as well as a number of national-levelinitiatives, constitute major contributions.
Yet there remains a significant gap. There is stillno index that serves an analogous role to that ofthe Gross Domestic Product (GDP) with respect toeconomic growth, providing in a single measure abenchmark for judging progress toward achievingenvironmental sustainability. There are efforts toconstruct wide-ranging collections of environmen-tal indicators, to create customized sustainabilityindicators that suit the circumstances of particularlocations, and to create indicators of sustainabledevelopment that encompass a range of environ-mental, social and political phenomena. Whilewe applaud these efforts, because they meet
important needs, we are convinced that there is aneed for an Environmental Sustainability Indexthat is capable of being expressed in a singlemeasure for each economy, and is focused strictlyon environmental matters.
The purpose of this study has been to constructsuch an index on a pilot basis to learn how feasi-ble the task is given the state of available data, toexplore potential uses of such an index, and tolearn lessons about how a more ambitious versionof the Index could be developed.
The results presented here are intended to servethese objectives alone. The methods used areexperimental and should not be construed asdefinitive statements about precise levels of envi-ronmental sustainability. Indeed, we recognize thatthere remain important methodological issues thatstill must be addressed. For instance, the PilotIndex presented here does not differentially"weight" the variables. Of course, any attempt toprovide weights entails a significant exercise injudgment that will inescapably turn on values,perspectives, and potential costs and benefits thatvary from person to person and country to country.
The Need for an Environmental Sustainability Index
The Path Ahead
How the Pilot Index was Constructed
➨➨➨
6
The five components were derived from a carefulanalytic exercise aimed at systematically identifyingthe factors that comprise environmental sustainabili-ty consistent with recent scholarship. The compo-nents describe the current environmental systems;stresses to those systems; the vulnerability of humanpopulations to environmental disturbances and dis-asters; the social and institutional capacity torespond to environmental problems (including gov-ernance systems); and global stewardship, or thedegree to which an economy behaves responsibly
with respect to other economies (through its con-sumption patterns and efforts to manage commonenvironmental problems). This scheme has much incommon with the widely used "pressure-state-response" framework, but seeks to be more compre-hensive in scope by adding components on vulnera-bility and global stewardship; these are especiallyimportant when one moves from "environmental"indicators to "environmental sustainability" indica-tors. In the table that follows, we spell out theunderlying logic for these components.
These components consist of a number of factorsconsidered to constitute the most fundamentalbuilding blocks of each component. A total of 21such factors were identified. For each factor,
variables were identified to serve as measures. Adetailed listing of the factors and variables—including the theoretical foundation for theinclusion of each variable—is included in Table 6.
The results of the prototype Index are summarizedin Table 5. We stress that there is no foolproofway to validate such a measure, and that thereforethese results should be used as intended only:to facilitate an exploration into the methods usedand to foster debate about how to improve theIndex.
The results for the Pilot EnvironmentalSustainability Index appear intuitively plausible,although there are some anomalies that are dis-cussed below.
One of our motivations in creating the Index wasto test whether it could shed light on the debateover the relationship between economic growthand environmental protection. To do so we plottedthe Index against two measures of economic per-formance, economic growth rates between 1993-1998and the 1999 Economic Competitiveness Index.The results appear in Figures 1-4.
Table 1. Components of the Pilot Environmental Sustainability Index
COMPONENT LOGIC
Environmental Systems An economy is environmentally sustainable to the extent that its vital environmental systems aremaintained at healthy levels, and to the extent to which levels are improving rather than deteriorating.
Environmental Stresses An economy is environmentally sustainable if the levels of anthropogenic stress are low enoughand Risks to engender no demonstrable harm to its environmental systems.
Human Vulnerability to An economy is environmentally sustainable to the extent that people and social systems are not Environmental Impacts vulnerable (in the way of health impacts, economic losses, and so on) to environmental disturbances;
becoming less vulnerable is a sign that an economy is on a track to greater sustainability.
Social and Institutional An economy is environmentally sustainable to the extent that it has in place political institutionsCapacity and underlying social patterns of skills, attitudes and networks that foster effective responses to
environmental challenges.
Global Stewardship An economy is environmentally sustainable if it cooperates with other countries to manage common environmental problems, and if it reduces negative environmental impacts on other countries to levels that cause no serious harm.
Preliminary Analysis of Pilot Environmental Sustainability Index
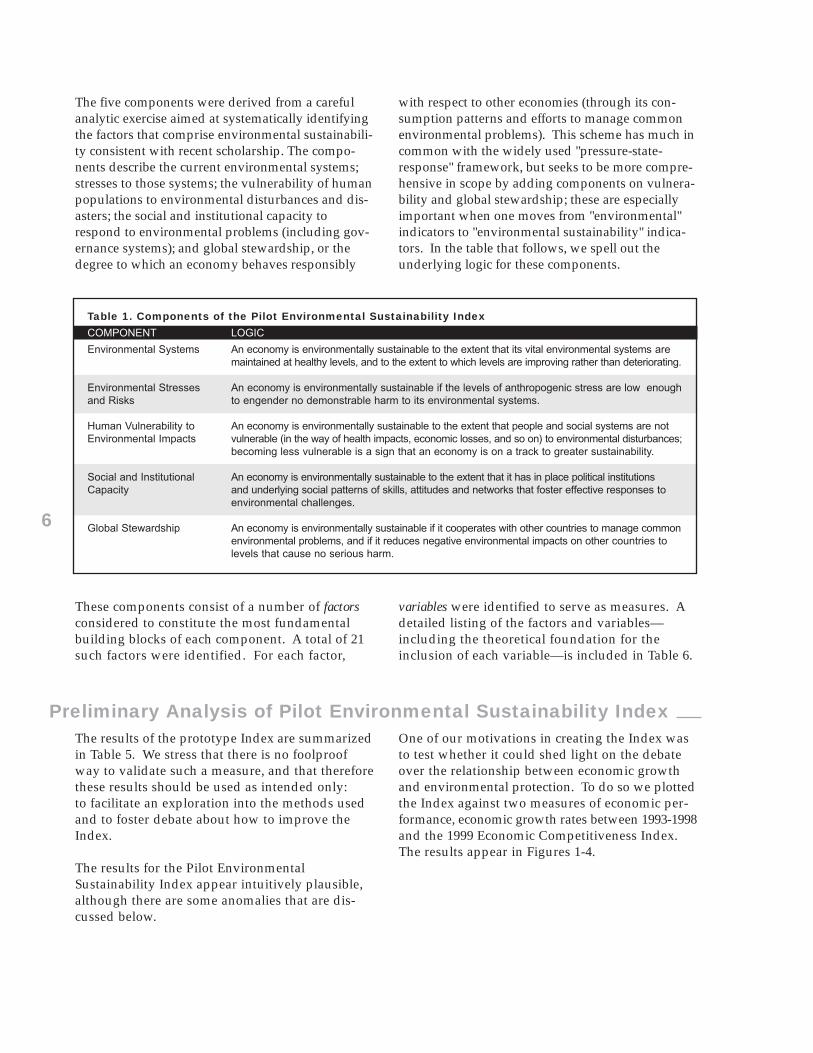
7Figure 1 suggests that there is no clear relation-ship between a country’s observed economicgrowth rate and its Pilot EnvironmentalSustainability Index. Some economies have
grown fast and have low EnvironmentalSustainability measures; other fast growers havehigh Environmental Sustainability scores.
Relationship between Environmental Sustainability and
Economic Growth, 1993-1998
GDP Growth Rate, 1993-1998
1050-5-10-15
Environmental Sustainability Index
80
70
60
50
40
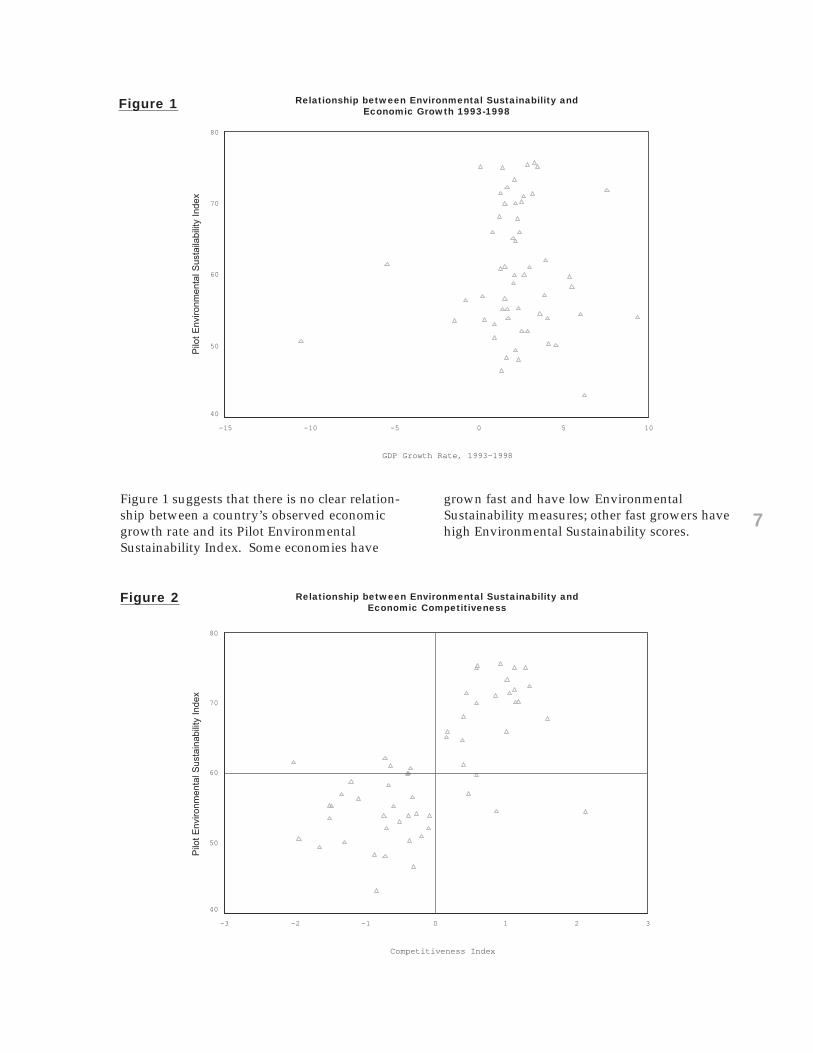
Relationship between Environmental Sustainability andEconomic Competitiveness
Competitiveness Index
3210-1-2-3
Environmental Sustainability Index
80
70
60
50
40
Figure 1
Figure 2 Relationship between Environmental Sustainability andEconomic Competitiveness
Pilo
t E
nviro
nmen
tal S
usta
inab
ility
Ind
exP
ilot
Env
ironm
enta
l Sus
taila
bilit
y In
dex
Relationship between Environmental Sustainability andEconomic Growth 1993-1998
8
Environmental Sustainability and Economic Competitiveness: (for illustrative purposes only)
The upper right quadrant
Competitiveness Index
1.81.61.41.21.0.8.6.4.20.0
Pilot Environmental Sustainability Index
78
76
74
72
70
68
66
64
62
60
United States
United Kingdom
Switzerland
Sweden
Spain
Portugal
Norway
New Zealand
Netherlands
Japan
Israel
Ireland
Iceland
Germany
France
Finland
Denmark
Canada
Belgium
Austria
Australia
Environmental Sustainability and Economic Competitiveness: (for illustrative purposes only)
The Lower Left Quadrant
Competitiveness Index
0.0-.5-1.0-1.5-2.0
Pilot Environmental Sustainability Index 70
60
50
40
Zimbabwe
Vietnam
Venezuela
Ukraine
Turkey Thailand
South Africa
Poland
Philippines
PeruMexico
Mauritius
Jordan
Indonesia
India
Greece
El SalvadorEgypt
Ecuador
Czech Republic
Costa Rica
ColombiaChina
Bulgaria
Brazil
Bolivia
Figure 3
Figure 4
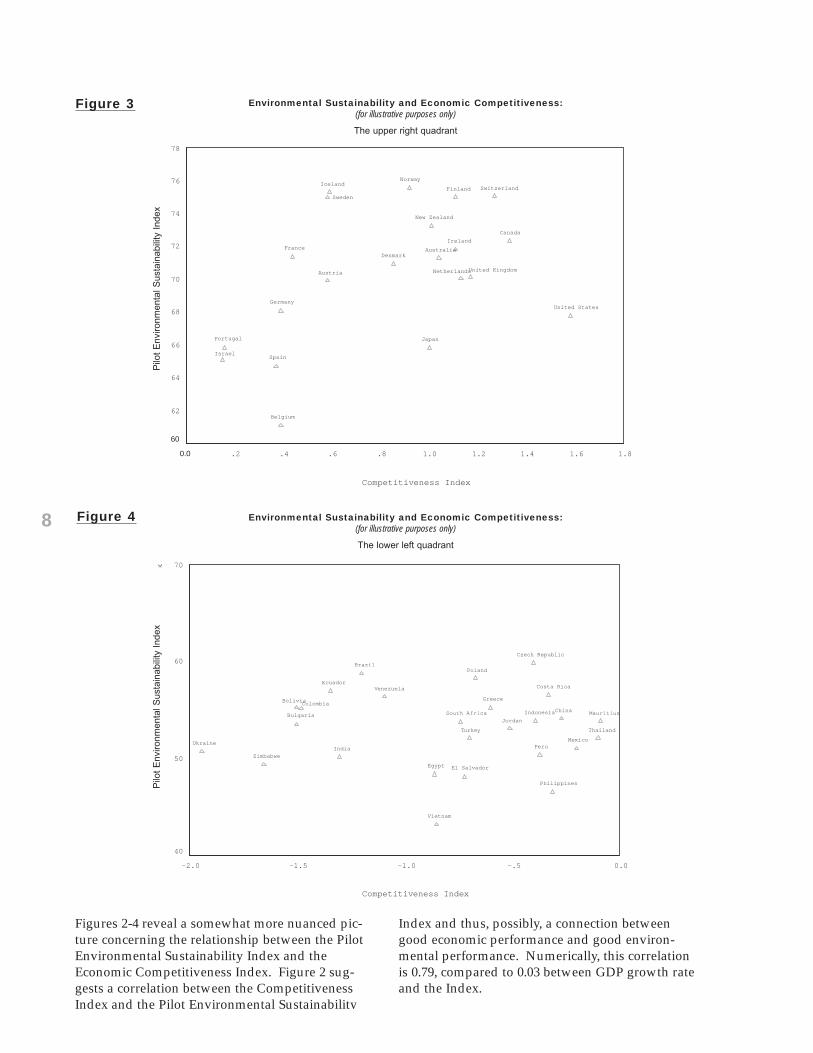
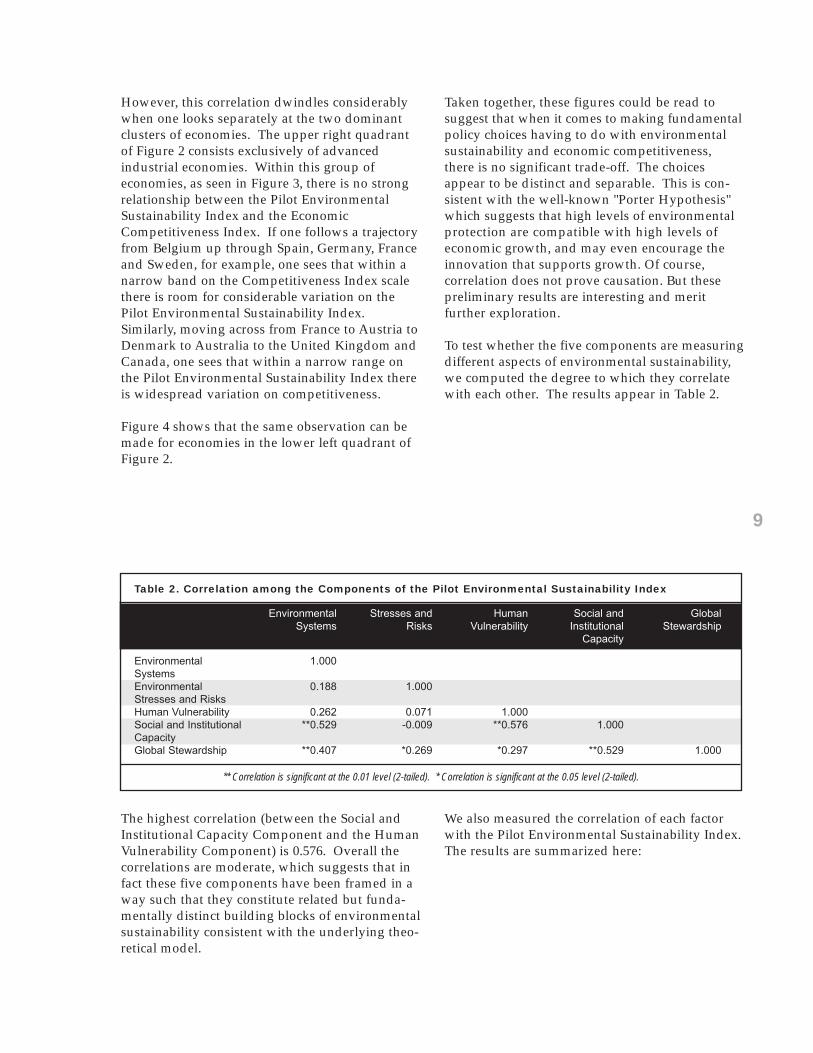
Figures 2-4 reveal a somewhat more nuanced pic-ture concerning the relationship between the PilotEnvironmental Sustainability Index and theEconomic Competitiveness Index. Figure 2 sug-gests a correlation between the CompetitivenessIndex and the Pilot Environmental Sustainability
Index and thus, possibly, a connection betweengood economic performance and good environ-mental performance. Numerically, this correlationis 0.79, compared to 0.03 between GDP growth rateand the Index.
Pilo
t E
nviro
nmen
tal S
usta
inab
ility
Ind
ex
Environmental Sustainability and Economic Competitiveness:(for illustrative purposes only)
The upper right quadrant
Pilo
t E
nviro
nmen
tal S
usta
inab
ility
Ind
ex
Environmental Sustainability and Economic Competitiveness:(for illustrative purposes only)
The lower left quadrant
9
However, this correlation dwindles considerablywhen one looks separately at the two dominantclusters of economies. The upper right quadrantof Figure 2 consists exclusively of advancedindustrial economies. Within this group ofeconomies, as seen in Figure 3, there is no strongrelationship between the Pilot EnvironmentalSustainability Index and the EconomicCompetitiveness Index. If one follows a trajectoryfrom Belgium up through Spain, Germany, Franceand Sweden, for example, one sees that within anarrow band on the Competitiveness Index scalethere is room for considerable variation on thePilot Environmental Sustainability Index.Similarly, moving across from France to Austria toDenmark to Australia to the United Kingdom andCanada, one sees that within a narrow range onthe Pilot Environmental Sustainability Index thereis widespread variation on competitiveness.
Figure 4 shows that the same observation can bemade for economies in the lower left quadrant ofFigure 2.
Taken together, these figures could be read tosuggest that when it comes to making fundamentalpolicy choices having to do with environmentalsustainability and economic competitiveness,there is no significant trade-off. The choicesappear to be distinct and separable. This is con-sistent with the well-known "Porter Hypothesis"which suggests that high levels of environmentalprotection are compatible with high levels ofeconomic growth, and may even encourage theinnovation that supports growth. Of course, correlation does not prove causation. But thesepreliminary results are interesting and merit further exploration.
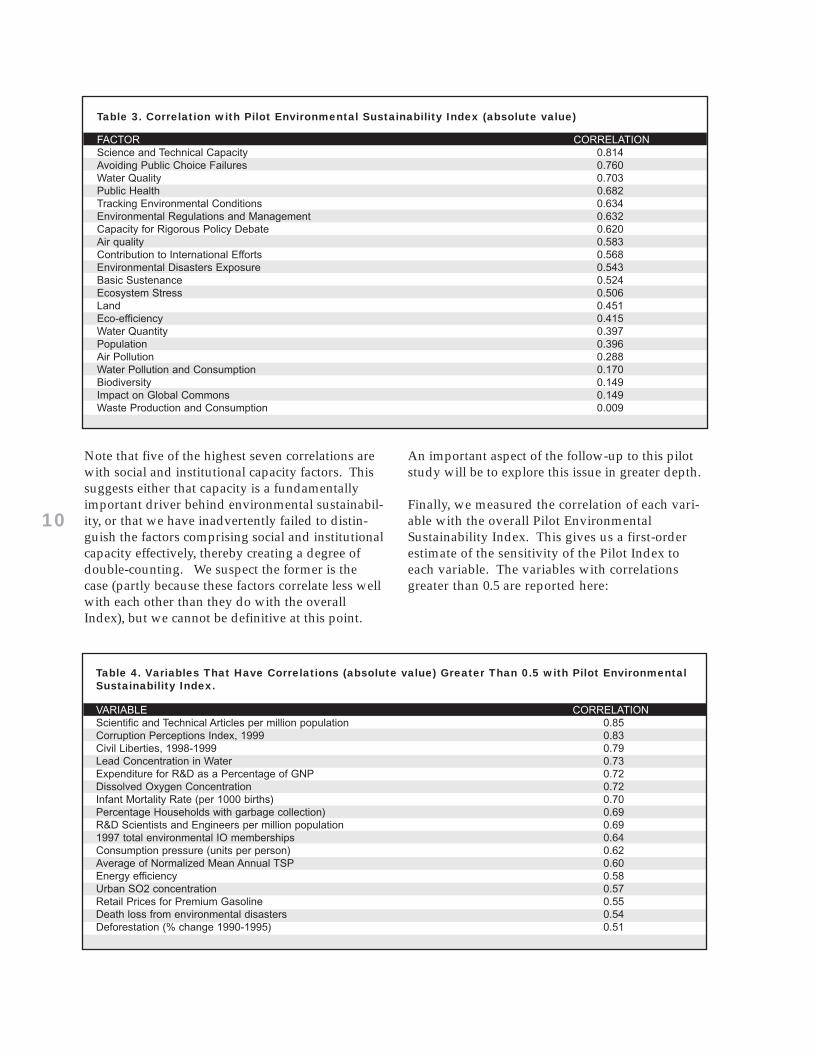
To test whether the five components are measuringdifferent aspects of environmental sustainability,we computed the degree to which they correlatewith each other. The results appear in Table 2.
The highest correlation (between the Social andInstitutional Capacity Component and the HumanVulnerability Component) is 0.576. Overall thecorrelations are moderate, which suggests that infact these five components have been framed in away such that they constitute related but funda-mentally distinct building blocks of environmentalsustainability consistent with the underlying theo-retical model.
We also measured the correlation of each factorwith the Pilot Environmental Sustainability Index.The results are summarized here:
Table 2. Correlation among the Components of the Pilot Environmental Sustainability Index
Environmental Stresses and Human Social and Global Systems Risks Vulnerability Institutional Stewardship
Capacity
Environmental 1.000SystemsEnvironmental 0.188 1.000Stresses and RisksHuman Vulnerability 0.262 0.071 1.000Social and Institutional **0.529 -0.009 **0.576 1.000CapacityGlobal Stewardship **0.407 *0.269 *0.297 **0.529 1.000
** Correlation is significant at the 0.01 level (2-tailed). * Correlation is significant at the 0.05 level (2-tailed).
10
Table 3. Correlation with Pilot Environmental Sustainability Index (absolute value)
FACTOR CORRELATIONScience and Technical Capacity 0.814Avoiding Public Choice Failures 0.760Water Quality 0.703Public Health 0.682Tracking Environmental Conditions 0.634Environmental Regulations and Management 0.632Capacity for Rigorous Policy Debate 0.620Air quality 0.583Contribution to International Efforts 0.568Environmental Disasters Exposure 0.543Basic Sustenance 0.524Ecosystem Stress 0.506Land 0.451Eco-efficiency 0.415Water Quantity 0.397Population 0.396Air Pollution 0.288Water Pollution and Consumption 0.170Biodiversity 0.149Impact on Global Commons 0.149Waste Production and Consumption 0.009
Table 4. Variables That Have Correlations (absolute value) Greater Than 0.5 with Pilot EnvironmentalSustainability Index.
VARIABLE CORRELATIONScientific and Technical Articles per million population 0.85Corruption Perceptions Index, 1999 0.83Civil Liberties, 1998-1999 0.79Lead Concentration in Water 0.73Expenditure for R&D as a Percentage of GNP 0.72Dissolved Oxygen Concentration 0.72Infant Mortality Rate (per 1000 births) 0.70Percentage Households with garbage collection) 0.69R&D Scientists and Engineers per million population 0.691997 total environmental IO memberships 0.64Consumption pressure (units per person) 0.62Average of Normalized Mean Annual TSP 0.60Energy efficiency 0.58Urban SO2 concentration 0.57Retail Prices for Premium Gasoline 0.55Death loss from environmental disasters 0.54Deforestation (% change 1990-1995) 0.51
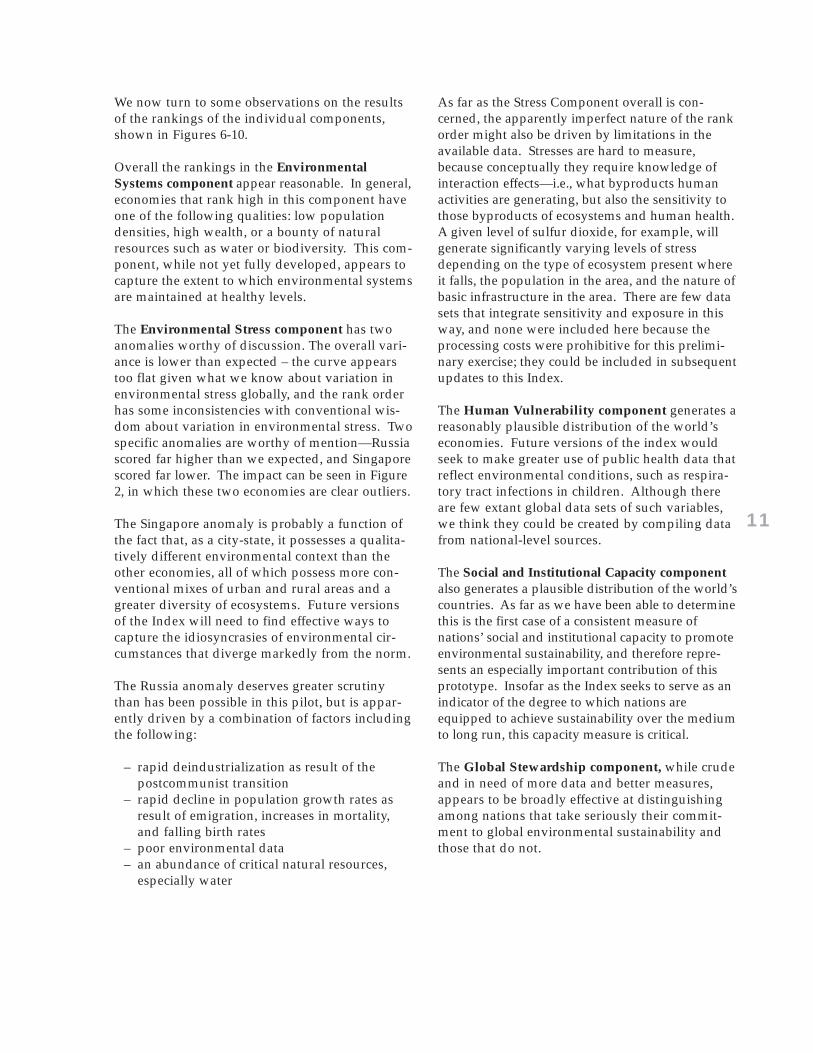
Note that five of the highest seven correlations arewith social and institutional capacity factors. Thissuggests either that capacity is a fundamentallyimportant driver behind environmental sustainabil-ity, or that we have inadvertently failed to distin-guish the factors comprising social and institutionalcapacity effectively, thereby creating a degree ofdouble-counting. We suspect the former is thecase (partly because these factors correlate less wellwith each other than they do with the overallIndex), but we cannot be definitive at this point.
An important aspect of the follow-up to this pilotstudy will be to explore this issue in greater depth.
Finally, we measured the correlation of each vari-able with the overall Pilot EnvironmentalSustainability Index. This gives us a first-orderestimate of the sensitivity of the Pilot Index toeach variable. The variables with correlationsgreater than 0.5 are reported here:
11
We now turn to some observations on the resultsof the rankings of the individual components,shown in Figures 6-10.
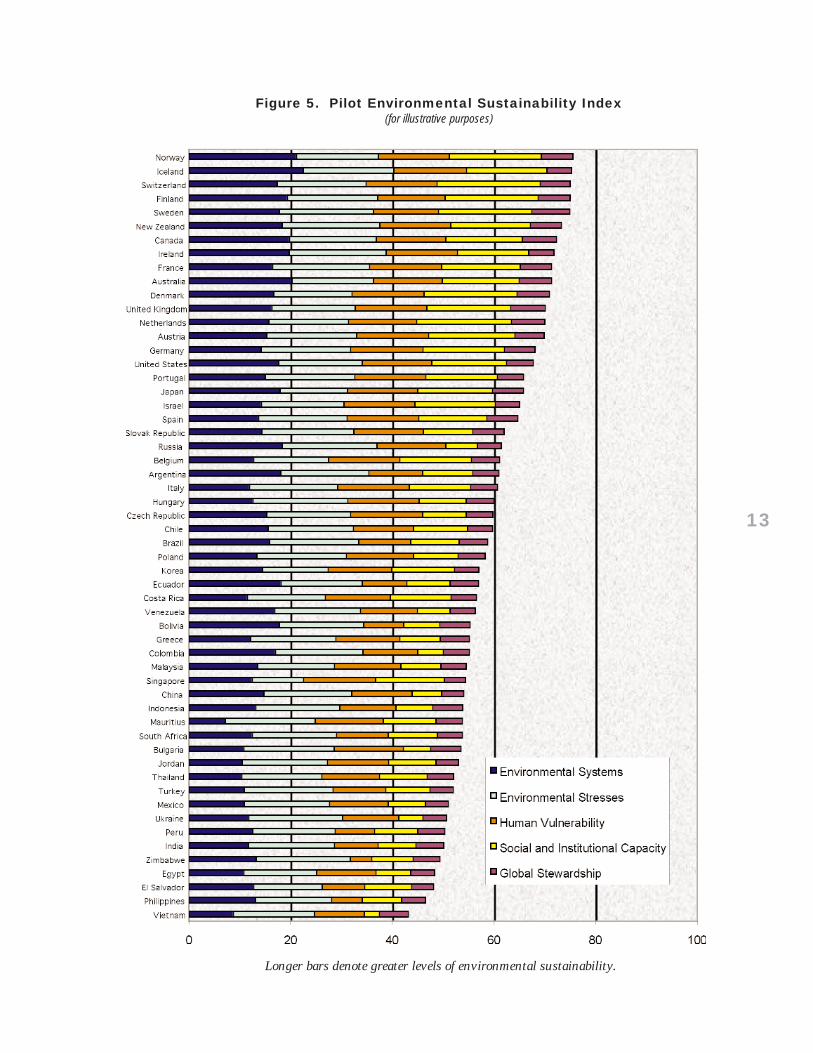
Overall the rankings in the EnvironmentalSystems component appear reasonable. In general,economies that rank high in this component haveone of the following qualities: low populationdensities, high wealth, or a bounty of naturalresources such as water or biodiversity. This com-ponent, while not yet fully developed, appears tocapture the extent to which environmental systemsare maintained at healthy levels.
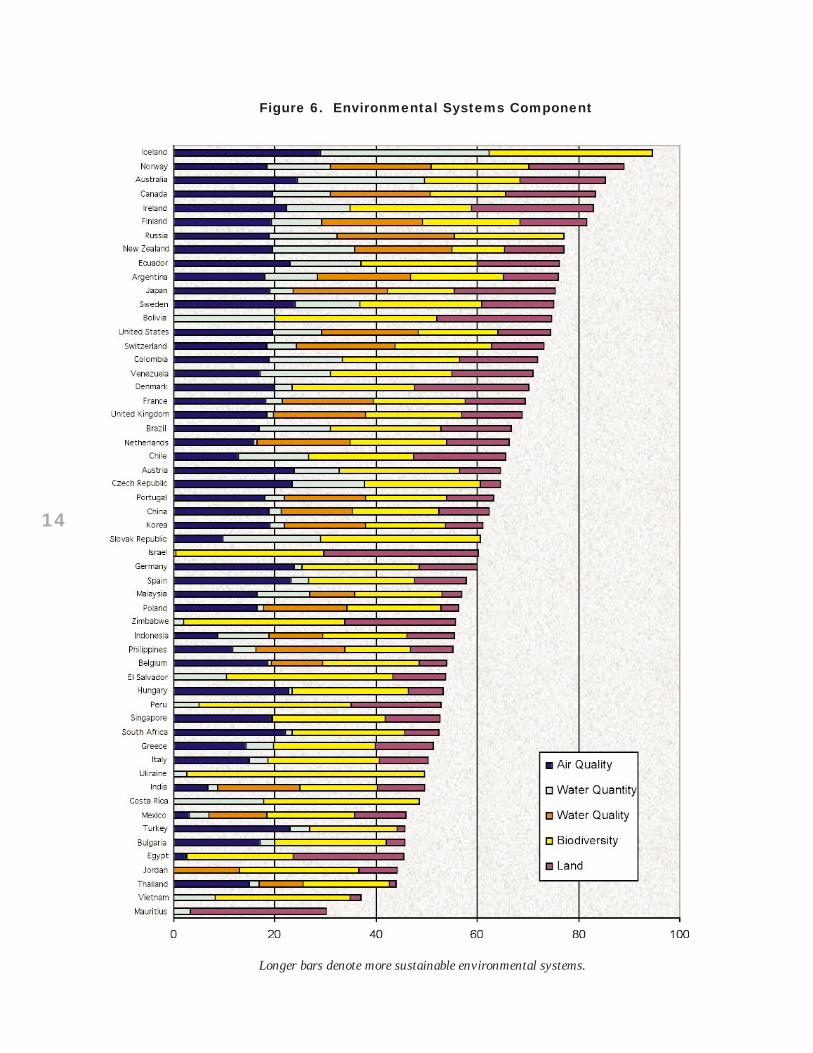
The Environmental Stress component has twoanomalies worthy of discussion. The overall vari-ance is lower than expected – the curve appearstoo flat given what we know about variation inenvironmental stress globally, and the rank orderhas some inconsistencies with conventional wis-dom about variation in environmental stress. Twospecific anomalies are worthy of mention—Russiascored far higher than we expected, and Singaporescored far lower. The impact can be seen in Figure2, in which these two economies are clear outliers.
The Singapore anomaly is probably a function ofthe fact that, as a city-state, it possesses a qualita-tively different environmental context than theother economies, all of which possess more con-ventional mixes of urban and rural areas and agreater diversity of ecosystems. Future versionsof the Index will need to find effective ways tocapture the idiosyncrasies of environmental cir-cumstances that diverge markedly from the norm.
The Russia anomaly deserves greater scrutinythan has been possible in this pilot, but is appar-ently driven by a combination of factors includingthe following:
– rapid deindustrialization as result of the postcommunist transition
– rapid decline in population growth rates as result of emigration, increases in mortality, and falling birth rates
– poor environmental data– an abundance of critical natural resources,
especially water
As far as the Stress Component overall is con-cerned, the apparently imperfect nature of the rankorder might also be driven by limitations in theavailable data. Stresses are hard to measure,because conceptually they require knowledge ofinteraction effects—i.e., what byproducts humanactivities are generating, but also the sensitivity tothose byproducts of ecosystems and human health.A given level of sulfur dioxide, for example, willgenerate significantly varying levels of stressdepending on the type of ecosystem present whereit falls, the population in the area, and the nature ofbasic infrastructure in the area. There are few datasets that integrate sensitivity and exposure in thisway, and none were included here because theprocessing costs were prohibitive for this prelimi-nary exercise; they could be included in subsequentupdates to this Index.
The Human Vulnerability component generates areasonably plausible distribution of the world’seconomies. Future versions of the index wouldseek to make greater use of public health data thatreflect environmental conditions, such as respira-tory tract infections in children. Although thereare few extant global data sets of such variables,we think they could be created by compiling datafrom national-level sources.
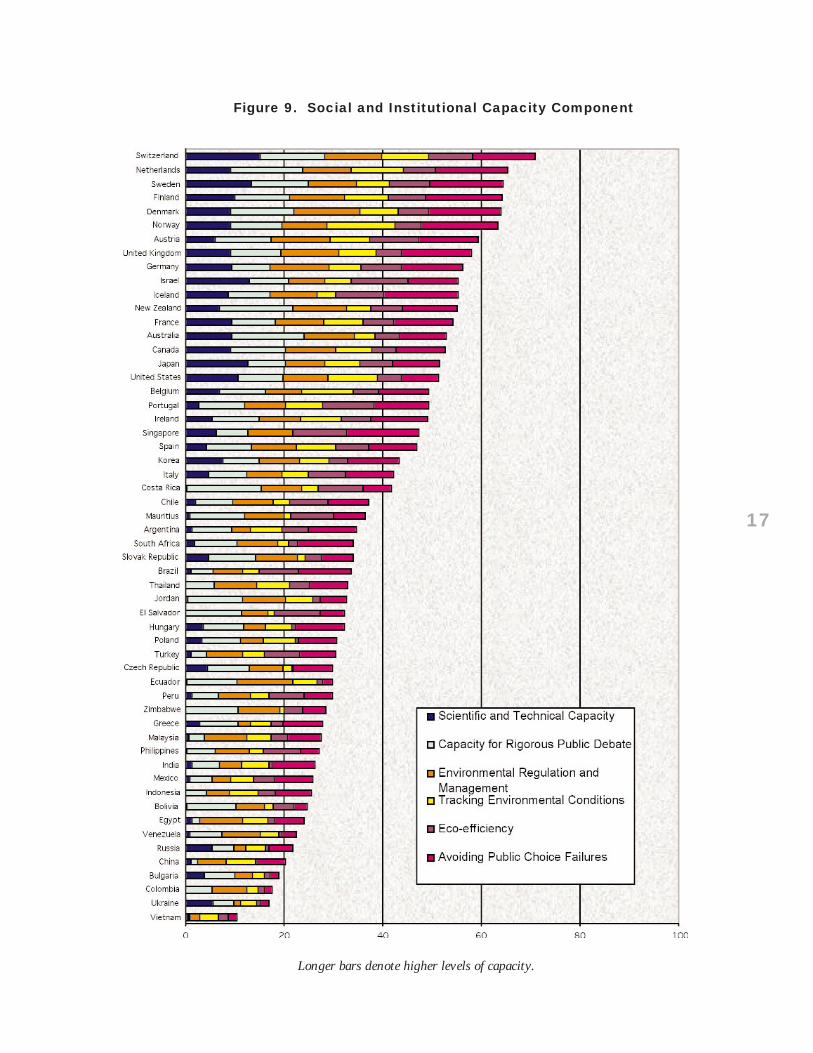
The Social and Institutional Capacity componentalso generates a plausible distribution of the world’scountries. As far as we have been able to determinethis is the first case of a consistent measure ofnations’ social and institutional capacity to promoteenvironmental sustainability, and therefore repre-sents an especially important contribution of thisprototype. Insofar as the Index seeks to serve as anindicator of the degree to which nations areequipped to achieve sustainability over the mediumto long run, this capacity measure is critical.
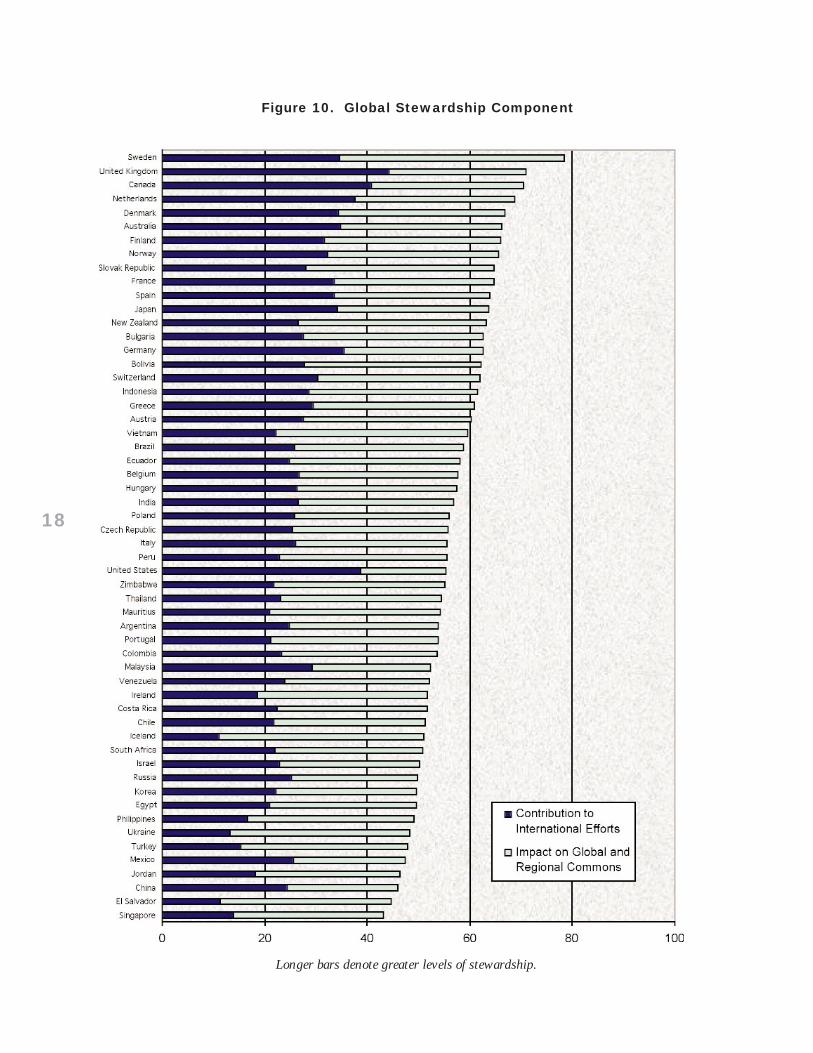
The Global Stewardship component, while crudeand in need of more data and better measures,appears to be broadly effective at distinguishingamong nations that take seriously their commit-ment to global environmental sustainability andthose that do not.
12
The preliminary nature of this pilot effort must bestressed. As an especially thoughtful discussion ofsustainability indicators concluded (NRC, 1999,p. 265):
Indicators used to report on a transition towardsustainability are likely to be biased, incorrect, inad-equate, and indispensable. Getting the indicatorsright is likely to be impossible in the short term.But not trying to get the indicators right will surelycompound the difficulty of enabling people to navi-gate through a transition to sustainability.
We agree entirely with this sentiment, and hopethat the results of this Pilot EnvironmentalSustainability Index will contribute to the long-term goal of environmental sustainability. Indeed,we see this effort as just a beginning—and, moreimportantly, as part of an ongoing dialogue.
In that spirit, we think that the effort to create thisPilot Environmental Sustainable Index has taughtus a number of valuable lessons:
1) In spite of the challenges, it is possible to createa single index of environmental sustainability.While acknowledging the challenges of gettinga single index "right," and acknowledging theassumptions and values that inescapably willbe embedded in such an index, the benefits ofhaving a tool to measure environmental per-formance justify the effort.
2) A more refined Index would help us to betterunderstand the relationship between economicand environmental performance, somethingthat has been very difficult to do in the absenceof good data. We observe that when it comes tosetting important social goals having to do witheconomic growth and environmental sustain-ability, these goals need not be seen as deeplyor inherently in conflict. Rather the choicesappear to be separable.
3) The available data are not adequate to generatean index that would have the same level of credi-bility and utility as economic measures such asGDP or the World Economic Forum’s EconomicCompetitiveness Index. This is disappointing, butinterventions are possible that would improve thesituation. Significant opportunities exist, more-over, to improve the sophistication of the index-construction methodology and to expand thevalue of the exercise as a policy evaluation tool.
4) These results demand further refinement andjustify additional work. The followingimprovements might be considered:
• A major investment in data gathering and cre-ation could pay substantial dividends. To makeup for the dearth of global, comparable data onsuch basic issues as water quality, air pollution,and soil erosion, we propose creating such datasets by making use of information currentlyfragmented in a variety of governmental, pri-vate institute, university and other holdings.With serious, but realistic, levels of effort wecan create significant additions to the supply ofglobal data on critical environmental trends.Some of the variables in this Pilot Index madeuse of this strategy, and we were encouragedby the results of those efforts. We would alsolike to expand coverage beyond the 56 coun-tries in this pilot effort.
• Whereas the prototype Index seeks whereverpossible to avoid imposing differential weightson the inputs into the Index, in reality it is notpossible to combine various sources of data intoa single number without applying someweighting scheme. Our decision not to do anyweighting and thus implicitly to weight the fac-tors equally could be refined. It would be betterto investigate more thoroughly the scientificmerits behind alternative weighting schemes, todebate such schemes publicly, and implementone that is theoretically defensible and that canclaim a significant degree of legitimacy.
• It would be helpful to permit users to engagein alternative calculations of the EnvironmentalSustainability Index by creating a more interac-tive and flexible information system.Information technologies permit the creation ofon-line systems that would let users add orremove variables, aggregate them into factorsdifferently, and select alternative weightingschemes. Environmental policies need to bemore data-driven. The world communityshould invest in data collection and analysis tofacilitate improved pollution control and natu-ral resource management over time.
• The Index would be more useful if it werelinked more directly to efforts to understandthe underlying drivers of environmental sus-tainability. Ecological quality and environment-related public health and capacity to maintainthem over time depend on a number of factorsincluding natural resource endowments, expo-sure to environmental stresses, the vitality ofthe systems under threat, and the speed andeffectiveness of societal and policy response. Itwould be valuable to build a model that sortsout these factors and that identifies the criticalpoints of possible policy leverage.
Conclusions
13
Figure 5. Pilot Environmental Sustainability Index(for illustrative purposes)
Longer bars denote greater levels of environmental sustainability.
14
Figure 6. Environmental Systems Component
Longer bars denote more sustainable environmental systems.
15
Figure 7. Environmental Stresses Component
Longer bars denote lower levels of environmental stress.
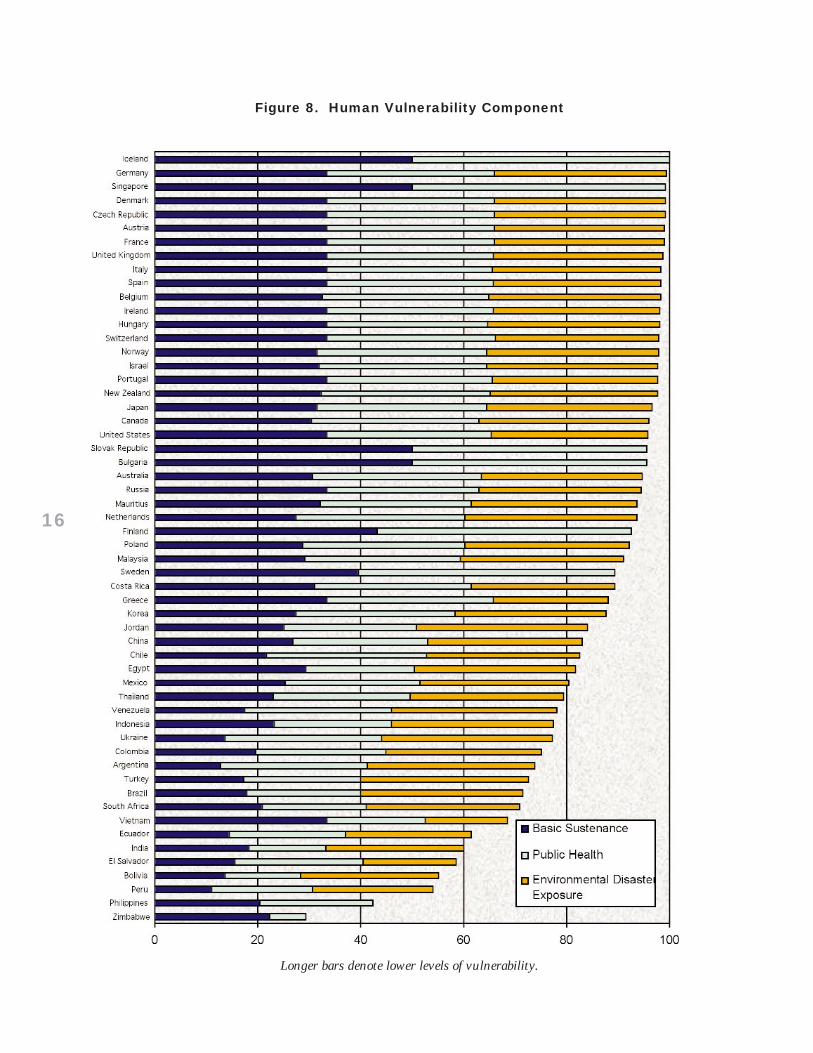
16
Figure 8. Human Vulnerability Component
Longer bars denote lower levels of vulnerability.
17
Figure 9. Social and Institutional Capacity Component
Longer bars denote higher levels of capacity.
18
Figure 10. Global Stewardship Component
Longer bars denote greater levels of stewardship.
19
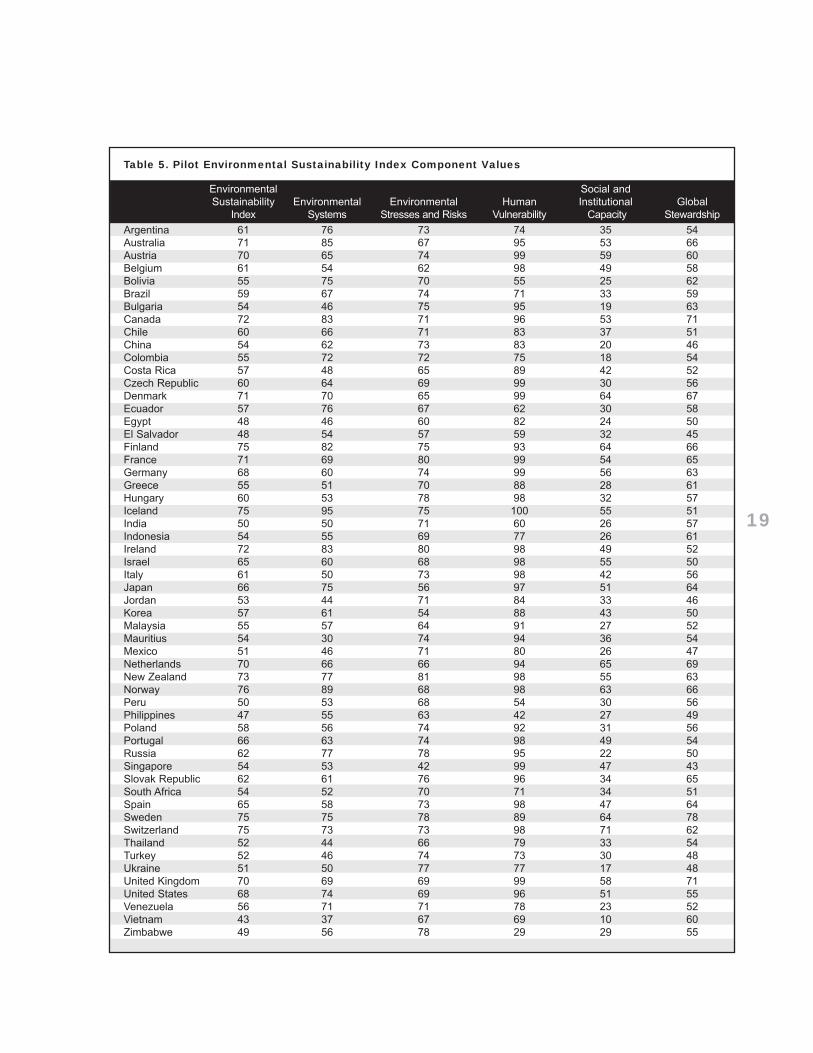
Table 5. Pilot Environmental Sustainability Index Component Values
Environmental Social and Sustainability Environmental Environmental Human Institutional Global
Index Systems Stresses and Risks Vulnerability Capacity Stewardship
Argentina 61 76 73 74 35 54Australia 71 85 67 95 53 66Austria 70 65 74 99 59 60Belgium 61 54 62 98 49 58Bolivia 55 75 70 55 25 62Brazil 59 67 74 71 33 59Bulgaria 54 46 75 95 19 63Canada 72 83 71 96 53 71Chile 60 66 71 83 37 51China 54 62 73 83 20 46Colombia 55 72 72 75 18 54Costa Rica 57 48 65 89 42 52Czech Republic 60 64 69 99 30 56Denmark 71 70 65 99 64 67Ecuador 57 76 67 62 30 58Egypt 48 46 60 82 24 50El Salvador 48 54 57 59 32 45Finland 75 82 75 93 64 66France 71 69 80 99 54 65Germany 68 60 74 99 56 63Greece 55 51 70 88 28 61Hungary 60 53 78 98 32 57Iceland 75 95 75 100 55 51India 50 50 71 60 26 57Indonesia 54 55 69 77 26 61Ireland 72 83 80 98 49 52Israel 65 60 68 98 55 50Italy 61 50 73 98 42 56Japan 66 75 56 97 51 64Jordan 53 44 71 84 33 46Korea 57 61 54 88 43 50Malaysia 55 57 64 91 27 52Mauritius 54 30 74 94 36 54Mexico 51 46 71 80 26 47Netherlands 70 66 66 94 65 69New Zealand 73 77 81 98 55 63Norway 76 89 68 98 63 66Peru 50 53 68 54 30 56Philippines 47 55 63 42 27 49Poland 58 56 74 92 31 56Portugal 66 63 74 98 49 54Russia 62 77 78 95 22 50Singapore 54 53 42 99 47 43Slovak Republic 62 61 76 96 34 65South Africa 54 52 70 71 34 51Spain 65 58 73 98 47 64Sweden 75 75 78 89 64 78Switzerland 75 73 73 98 71 62Thailand 52 44 66 79 33 54Turkey 52 46 74 73 30 48Ukraine 51 50 77 77 17 48United Kingdom 70 69 69 99 58 71United States 68 74 69 96 51 55Venezuela 56 71 71 78 23 52Vietnam 43 37 67 69 10 60Zimbabwe 49 56 78 29 29 55
20
For every variable in our data set we created a nor-malized range and scaled values from 0 (low sustain-ability) to 100 (high sustainability). We have not triedto define a true or definitive "sustainability" thresh-old. Each country was assigned a score from 0 to 100depending on where it fell along the continuum forthat particular variable. In a few instances a scientifi-cally defensible cap was applied to the original val-ues beyond which all economies received 0 or 100.
Once the variables were scaled they were assembledinto composite scores for the factor in which theywere located, assigning equal weights to each vari-able. For the purposes of illustration, we calculatedcomponent scores for each economy by combiningthe factor scores, again assigning equal weight.
The Environmental Sustainability Index value foreach economy is simply the average value for the21 factors. (We average the factors instead of thecomponents because the components vary in theirnumber of factors, and we wished to avoidweighting some factors more than others).
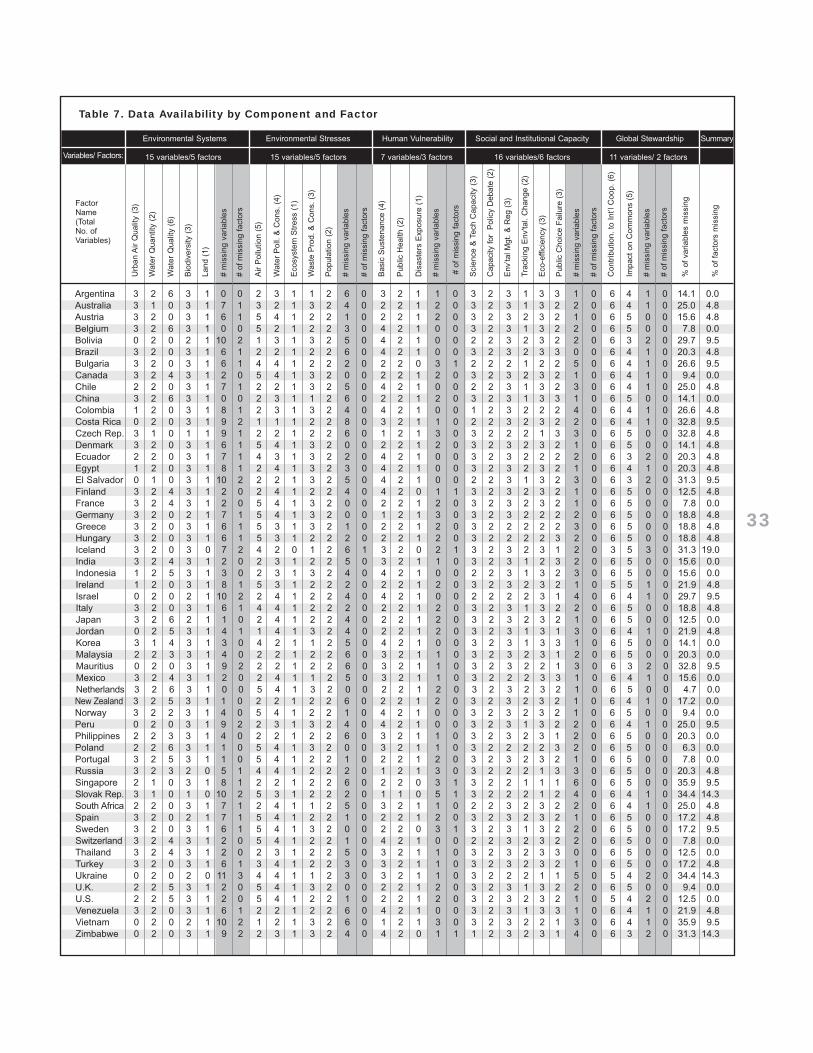
A number of variables are not available for eacheconomy. The distribution of missing variables issummarized in the appendix. Because the Indexis calculated by averaging variables, all measuredin the same 0-100 scale, the simplest way to handlemissing values was simply to average the variablesfor which we did have measures. Filling the datagaps is an important future task. Some combina-tion of new data development, extrapolation, anddefining proxies will be necessary.
Three economies (Hong Kong, Luxembourg,Taiwan) were excluded from the prototypebecause they were missing more than half thevariables. A subsequent version of this Indexcould reintroduce these jurisdictions by makinguse of data available from alternative sources. Itwould also be valuable, as the data coverage per-mits, to include additional countries, eventuallycovering all nations in the world.
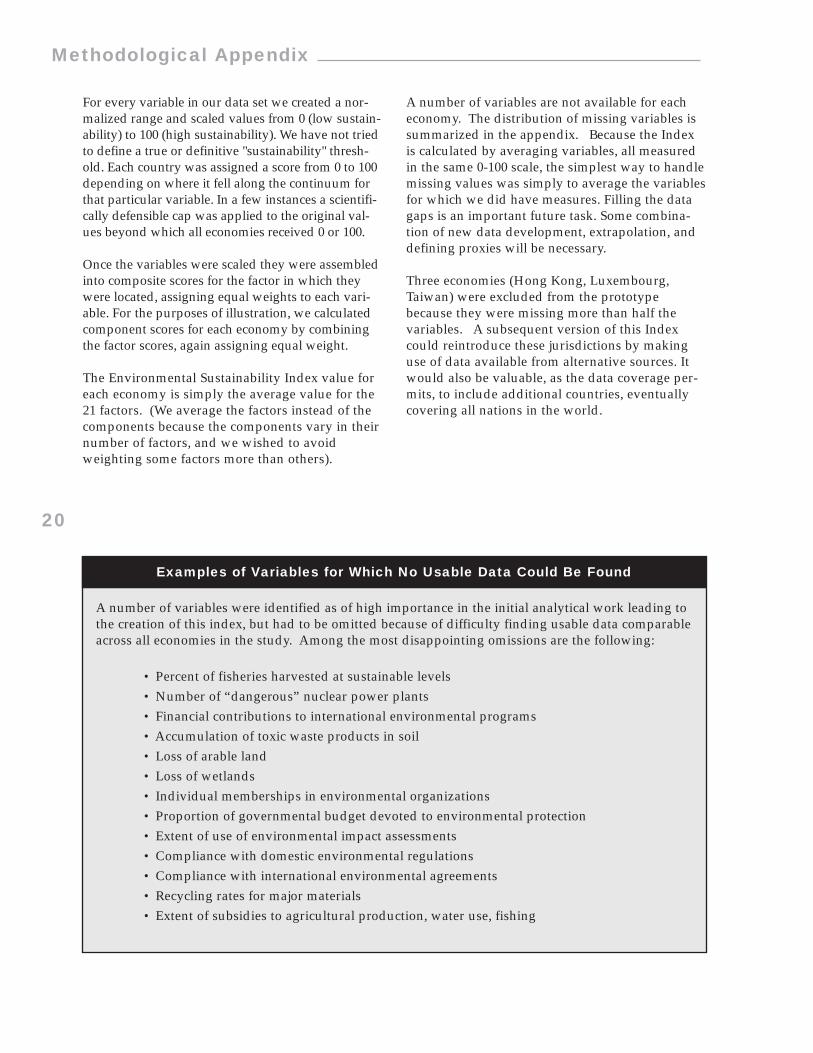
Examples of Variables for Which No Usable Data Could Be Found
A number of variables were identified as of high importance in the initial analytical work leading tothe creation of this index, but had to be omitted because of difficulty finding usable data comparableacross all economies in the study. Among the most disappointing omissions are the following:
• Percent of fisheries harvested at sustainable levels• Number of “dangerous” nuclear power plants• Financial contributions to international environmental programs• Accumulation of toxic waste products in soil• Loss of arable land• Loss of wetlands• Individual memberships in environmental organizations• Proportion of governmental budget devoted to environmental protection• Extent of use of environmental impact assessments• Compliance with domestic environmental regulations• Compliance with international environmental agreements• Recycling rates for major materials• Extent of subsidies to agricultural production, water use, fishing
Methodological Appendix
Examples of Variables for Which No Usable Data Could Be Found
21
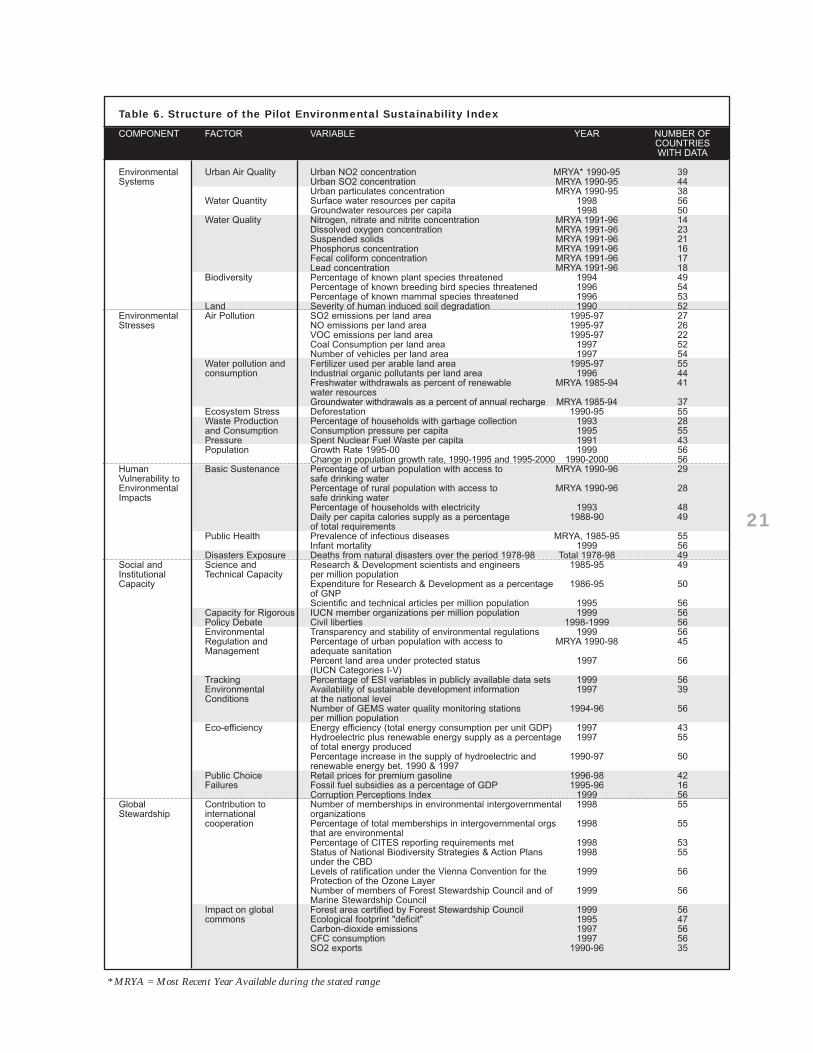
Table 6. Structure of the Pilot Environmental Sustainability Index
COMPONENT FACTOR VARIABLE YEAR NUMBER OF COUNTRIESWITH DATA
Environmental Urban Air Quality Urban NO2 concentration MRYA* 1990-95 39Systems Urban SO2 concentration MRYA 1990-95 44
Urban particulates concentration MRYA 1990-95 38Water Quantity Surface water resources per capita 1998 56
Groundwater resources per capita 1998 50Water Quality Nitrogen, nitrate and nitrite concentration MRYA 1991-96 14
Dissolved oxygen concentration MRYA 1991-96 23Suspended solids MRYA 1991-96 21Phosphorus concentration MRYA 1991-96 16Fecal coliform concentration MRYA 1991-96 17Lead concentration MRYA 1991-96 18
Biodiversity Percentage of known plant species threatened 1994 49Percentage of known breeding bird species threatened 1996 54Percentage of known mammal species threatened 1996 53
Land Severity of human induced soil degradation 1990 52Environmental Air Pollution SO2 emissions per land area 1995-97 27Stresses NO emissions per land area 1995-97 26
VOC emissions per land area 1995-97 22Coal Consumption per land area 1997 52Number of vehicles per land area 1997 54
Water pollution and Fertilizer used per arable land area 1995-97 55consumption Industrial organic pollutants per land area 1996 44
Freshwater withdrawals as percent of renewable MRYA 1985-94 41water resourcesGroundwater withdrawals as a percent of annual recharge MRYA 1985-94 37
Ecosystem Stress Deforestation 1990-95 55Waste Production Percentage of households with garbage collection 1993 28and Consumption Consumption pressure per capita 1995 55Pressure Spent Nuclear Fuel Waste per capita 1991 43Population Growth Rate 1995-00 1999 56
Change in population growth rate, 1990-1995 and 1995-2000 1990-2000 56Human Basic Sustenance Percentage of urban population with access to MRYA 1990-96 29Vulnerability to safe drinking waterEnvironmental Percentage of rural population with access to MRYA 1990-96 28Impacts safe drinking water
Percentage of households with electricity 1993 48Daily per capita calories supply as a percentage 1988-90 49of total requirements
Public Health Prevalence of infectious diseases MRYA, 1985-95 55Infant mortality 1999 56
Disasters Exposure Deaths from natural disasters over the period 1978-98 Total 1978-98 49Social and Science and Research & Development scientists and engineers 1985-95 49Institutional Technical Capacity per million populationCapacity Expenditure for Research & Development as a percentage 1986-95 50
of GNPScientific and technical articles per million population 1995 56
Capacity for Rigorous IUCN member organizations per million population 1999 56Policy Debate Civil liberties 1998-1999 56Environmental Transparency and stability of environmental regulations 1999 56Regulation and Percentage of urban population with access to MRYA 1990-98 45Management adequate sanitation
Percent land area under protected status 1997 56(IUCN Categories I-V)
Tracking Percentage of ESI variables in publicly available data sets 1999 56Environmental Availability of sustainable development information 1997 39Conditions at the national level
Number of GEMS water quality monitoring stations 1994-96 56per million population
Eco-efficiency Energy efficiency (total energy consumption per unit GDP) 1997 43Hydroelectric plus renewable energy supply as a percentage 1997 55of total energy producedPercentage increase in the supply of hydroelectric and 1990-97 50renewable energy bet. 1990 & 1997
Public Choice Retail prices for premium gasoline 1996-98 42Failures Fossil fuel subsidies as a percentage of GDP 1995-96 16
Corruption Perceptions Index 1999 56Global Contribution to Number of memberships in environmental intergovernmental 1998 55Stewardship international organizations
cooperation Percentage of total memberships in intergovernmental orgs 1998 55that are environmentalPercentage of CITES reporting requirements met 1998 53Status of National Biodiversity Strategies & Action Plans 1998 55under the CBDLevels of ratification under the Vienna Convention for the 1999 56Protection of the Ozone LayerNumber of members of Forest Stewardship Council and of 1999 56Marine Stewardship Council
Impact on global Forest area certified by Forest Stewardship Council 1999 56commons Ecological footprint "deficit" 1995 47
Carbon-dioxide emissions 1997 56CFC consumption 1997 56SO2 exports 1990-96 35
* MRYA = Most Recent Year Available during the stated range
22
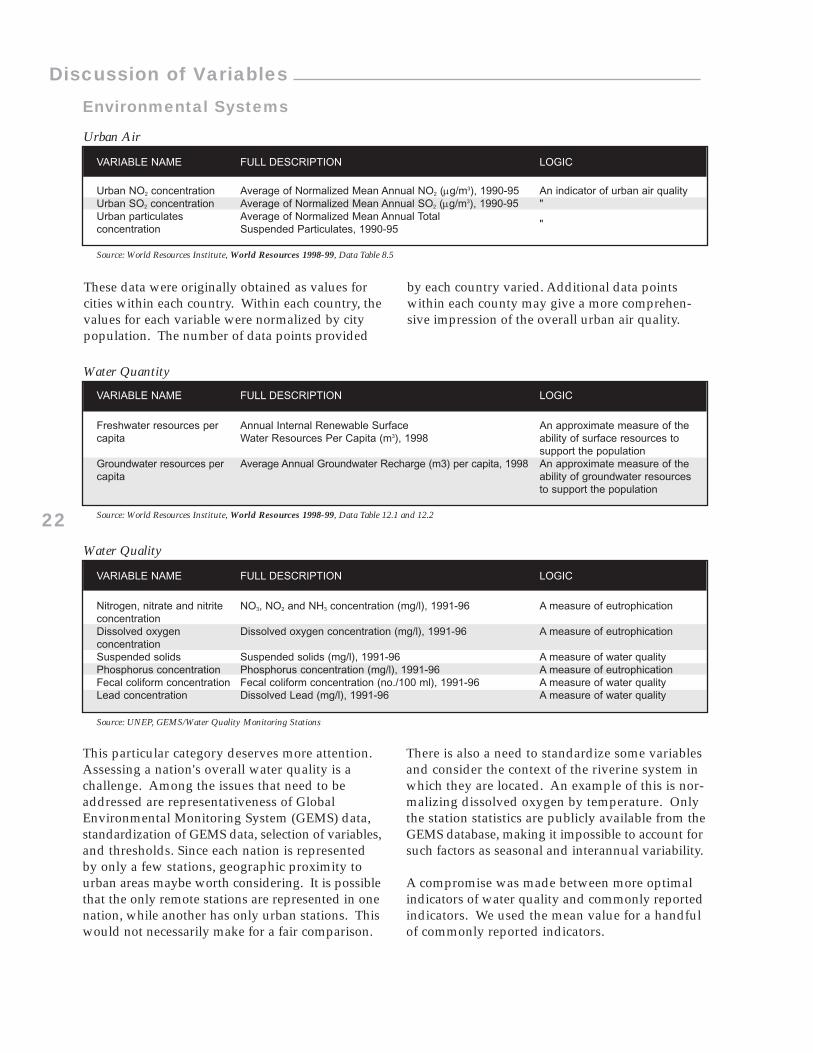
These data were originally obtained as values forcities within each country. Within each country, thevalues for each variable were normalized by citypopulation. The number of data points provided
by each country varied. Additional data pointswithin each county may give a more comprehen-sive impression of the overall urban air quality.
Urban Air
Source: World Resources Institute, World Resources 1998-99, Data Table 8.5
VARIABLE NAME FULL DESCRIPTION LOGIC
Urban NO2 concentration Average of Normalized Mean Annual NO2 (µg/m3), 1990-95 An indicator of urban air qualityUrban SO2 concentration Average of Normalized Mean Annual SO2 (µg/m3), 1990-95 "Urban particulates Average of Normalized Mean Annual Total concentration Suspended Particulates, 1990-95 "
Water Quality
Source: UNEP, GEMS/Water Quality Monitoring Stations
VARIABLE NAME FULL DESCRIPTION LOGIC
Nitrogen, nitrate and nitrite NO3, NO2 and NH3 concentration (mg/l), 1991-96 A measure of eutrophicationconcentrationDissolved oxygen Dissolved oxygen concentration (mg/l), 1991-96 A measure of eutrophicationconcentrationSuspended solids Suspended solids (mg/l), 1991-96 A measure of water qualityPhosphorus concentration Phosphorus concentration (mg/l), 1991-96 A measure of eutrophicationFecal coliform concentration Fecal coliform concentration (no./100 ml), 1991-96 A measure of water qualityLead concentration Dissolved Lead (mg/l), 1991-96 A measure of water quality
This particular category deserves more attention.Assessing a nation's overall water quality is achallenge. Among the issues that need to beaddressed are representativeness of GlobalEnvironmental Monitoring System (GEMS) data,standardization of GEMS data, selection of variables,and thresholds. Since each nation is representedby only a few stations, geographic proximity tourban areas maybe worth considering. It is possiblethat the only remote stations are represented in onenation, while another has only urban stations. Thiswould not necessarily make for a fair comparison.
There is also a need to standardize some variablesand consider the context of the riverine system inwhich they are located. An example of this is nor-malizing dissolved oxygen by temperature. Onlythe station statistics are publicly available from theGEMS database, making it impossible to account forsuch factors as seasonal and interannual variability.
A compromise was made between more optimalindicators of water quality and commonly reportedindicators. We used the mean value for a handfulof commonly reported indicators.
Water Quantity
Source: World Resources Institute, World Resources 1998-99, Data Table 12.1 and 12.2
VARIABLE NAME FULL DESCRIPTION LOGIC
Freshwater resources per Annual Internal Renewable Surface An approximate measure of the capita Water Resources Per Capita (m3), 1998 ability of surface resources to
support the populationGroundwater resources per Average Annual Groundwater Recharge (m3) per capita, 1998 An approximate measure of thecapita ability of groundwater resources
to support the population
Discussion of Variables
Environmental Systems
23
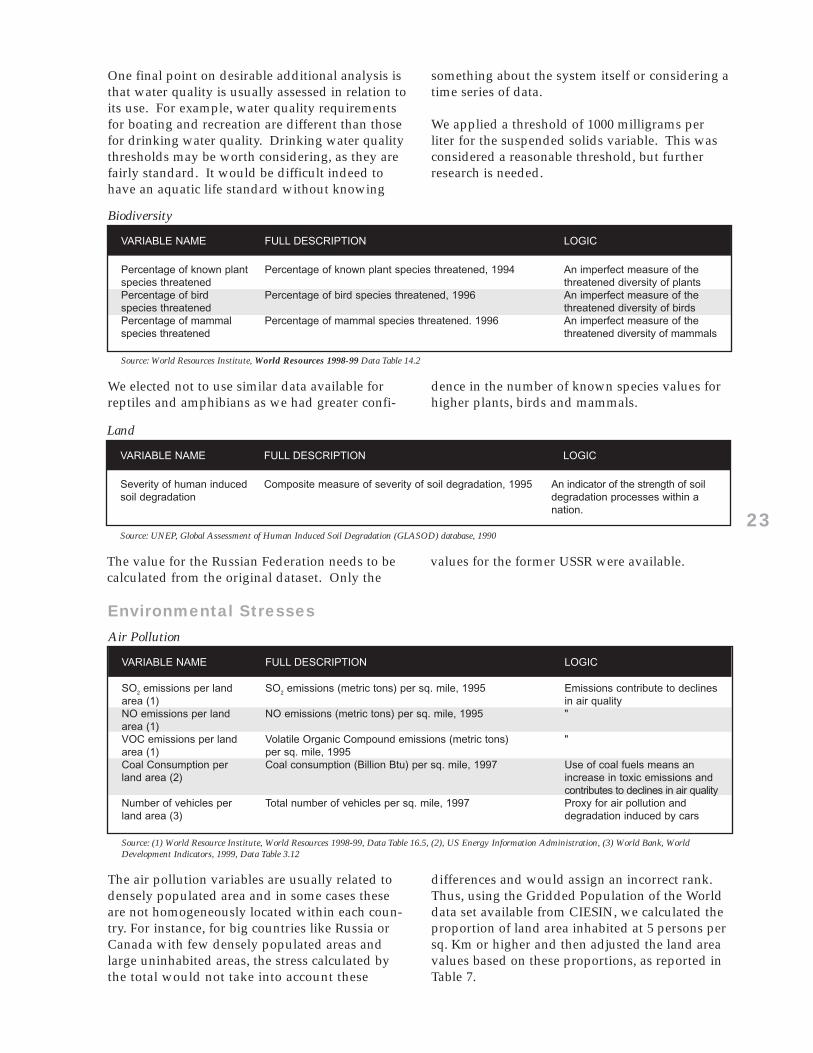
One final point on desirable additional analysis isthat water quality is usually assessed in relation toits use. For example, water quality requirementsfor boating and recreation are different than thosefor drinking water quality. Drinking water qualitythresholds may be worth considering, as they arefairly standard. It would be difficult indeed tohave an aquatic life standard without knowing
something about the system itself or considering atime series of data.
We applied a threshold of 1000 milligrams perliter for the suspended solids variable. This wasconsidered a reasonable threshold, but furtherresearch is needed.
We elected not to use similar data available forreptiles and amphibians as we had greater confi-
dence in the number of known species values forhigher plants, birds and mammals.
Biodiversity
Source: World Resources Institute, World Resources 1998-99 Data Table 14.2
VARIABLE NAME FULL DESCRIPTION LOGIC
Percentage of known plant Percentage of known plant species threatened, 1994 An imperfect measure of the species threatened threatened diversity of plantsPercentage of bird Percentage of bird species threatened, 1996 An imperfect measure of the species threatened threatened diversity of birdsPercentage of mammal Percentage of mammal species threatened. 1996 An imperfect measure of the species threatened threatened diversity of mammals
The value for the Russian Federation needs to becalculated from the original dataset. Only the
values for the former USSR were available.
Source: UNEP, Global Assessment of Human Induced Soil Degradation (GLASOD) database, 1990
Land
VARIABLE NAME FULL DESCRIPTION LOGIC
Severity of human induced Composite measure of severity of soil degradation, 1995 An indicator of the strength of soilsoil degradation degradation processes within a
nation.
Air Pollution
Source: (1) World Resource Institute, World Resources 1998-99, Data Table 16.5, (2), US Energy Information Administration, (3) World Bank, WorldDevelopment Indicators, 1999, Data Table 3.12
VARIABLE NAME FULL DESCRIPTION LOGIC
SO2 emissions per land SO2 emissions (metric tons) per sq. mile, 1995 Emissions contribute to declinesarea (1) in air qualityNO emissions per land NO emissions (metric tons) per sq. mile, 1995 "area (1)VOC emissions per land Volatile Organic Compound emissions (metric tons) "area (1) per sq. mile, 1995Coal Consumption per Coal consumption (Billion Btu) per sq. mile, 1997 Use of coal fuels means an land area (2) increase in toxic emissions and
contributes to declines in air qualityNumber of vehicles per Total number of vehicles per sq. mile, 1997 Proxy for air pollution and land area (3) degradation induced by cars
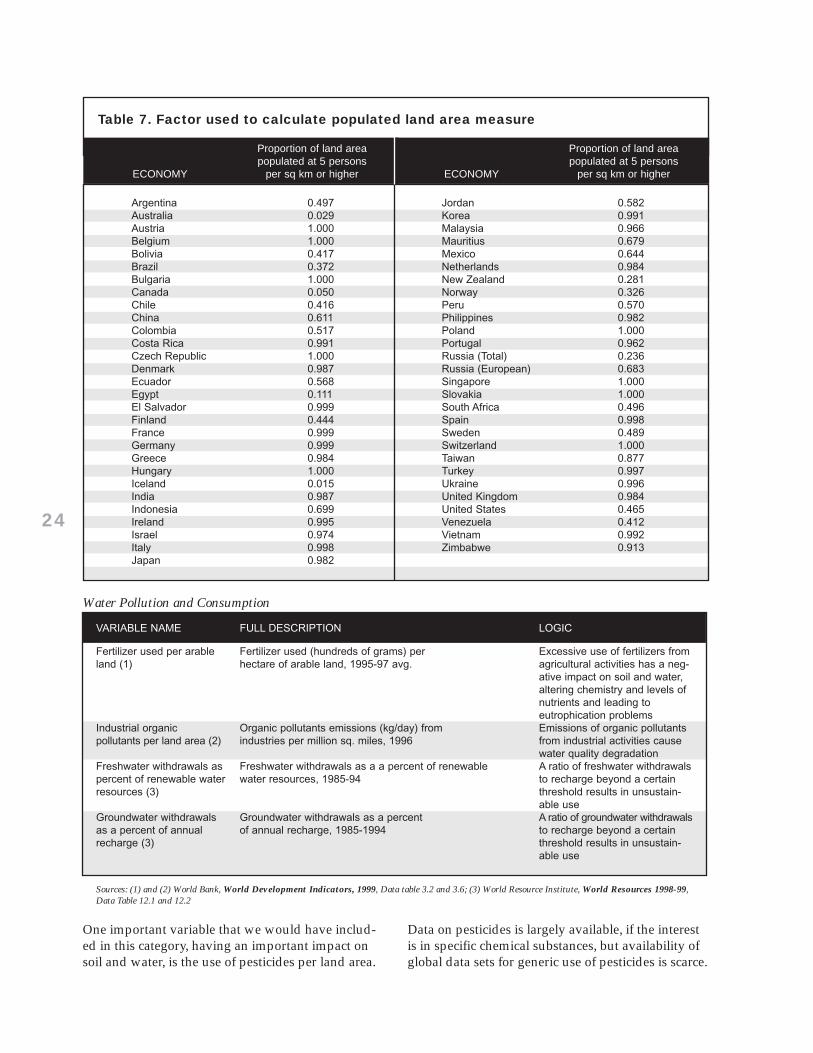
The air pollution variables are usually related todensely populated area and in some cases theseare not homogeneously located within each coun-try. For instance, for big countries like Russia orCanada with few densely populated areas andlarge uninhabited areas, the stress calculated bythe total would not take into account these
differences and would assign an incorrect rank.Thus, using the Gridded Population of the Worlddata set available from CIESIN, we calculated theproportion of land area inhabited at 5 persons persq. Km or higher and then adjusted the land areavalues based on these proportions, as reported inTable 7.
Environmental Stresses
24
Argentina 0.497Australia 0.029Austria 1.000Belgium 1.000Bolivia 0.417Brazil 0.372Bulgaria 1.000Canada 0.050Chile 0.416China 0.611Colombia 0.517Costa Rica 0.991Czech Republic 1.000Denmark 0.987Ecuador 0.568Egypt 0.111El Salvador 0.999Finland 0.444France 0.999Germany 0.999Greece 0.984Hungary 1.000Iceland 0.015India 0.987Indonesia 0.699Ireland 0.995Israel 0.974Italy 0.998Japan 0.982
Jordan 0.582Korea 0.991Malaysia 0.966Mauritius 0.679Mexico 0.644Netherlands 0.984New Zealand 0.281Norway 0.326Peru 0.570Philippines 0.982Poland 1.000Portugal 0.962Russia (Total) 0.236Russia (European) 0.683Singapore 1.000Slovakia 1.000South Africa 0.496Spain 0.998Sweden 0.489Switzerland 1.000Taiwan 0.877Turkey 0.997Ukraine 0.996United Kingdom 0.984United States 0.465Venezuela 0.412Vietnam 0.992Zimbabwe 0.913
Table 7. Factor used to calculate populated land area measure
Proportion of land area populated at 5 persons
ECONOMY per sq km or higher
Proportion of land area populated at 5 persons
ECONOMY per sq km or higher
Water Pollution and Consumption
Sources: (1) and (2) World Bank, World Development Indicators, 1999, Data table 3.2 and 3.6; (3) World Resource Institute, World Resources 1998-99,Data Table 12.1 and 12.2
VARIABLE NAME FULL DESCRIPTION LOGIC
Fertilizer used per arable Fertilizer used (hundreds of grams) per Excessive use of fertilizers fromland (1) hectare of arable land, 1995-97 avg. agricultural activities has a neg-
ative impact on soil and water, altering chemistry and levels of nutrients and leading to eutrophication problems
Industrial organic Organic pollutants emissions (kg/day) from Emissions of organic pollutantspollutants per land area (2) industries per million sq. miles, 1996 from industrial activities cause
water quality degradationFreshwater withdrawals as Freshwater withdrawals as a a percent of renewable A ratio of freshwater withdrawals percent of renewable water water resources, 1985-94 to recharge beyond a certainresources (3) threshold results in unsustain-
able use Groundwater withdrawals Groundwater withdrawals as a percent A ratio of groundwater withdrawalsas a percent of annual of annual recharge, 1985-1994 to recharge beyond a certainrecharge (3) threshold results in unsustain-
able use
One important variable that we would have includ-ed in this category, having an important impact onsoil and water, is the use of pesticides per land area.
Data on pesticides is largely available, if the interestis in specific chemical substances, but availability ofglobal data sets for generic use of pesticides is scarce.
25
Waste Production and Consumption Pressure
Sources: (1) World Resource Institute, World Resources 1998-99, Data Table 9.3, (2) WWF, Living Planet Report 1998, (3) OECD Energy-EnvironmentIndicators, ENV Monograph No.79, p. 32
VARIABLE NAME FULL DESCRIPTION LOGIC
Percent of households with Percent of households with garbage collection, 1993 This represents a proxy forgarbage collection (1) waste disposalConsumption pressure per Consumption Pressure Index (units per person), 1995 High level of consumption capita (2) pressure means high stress to the
environment, in terms of resources depletion and emissions
Spent nuclear fuel waste Spent nuclear fuel arisings per capita Nuclear waste requires,per capita (3) (kg HM/ 1000 inhabitants), 1991 processing, transport, and stor-
age, all of which pose a threat to humans and ecosystems
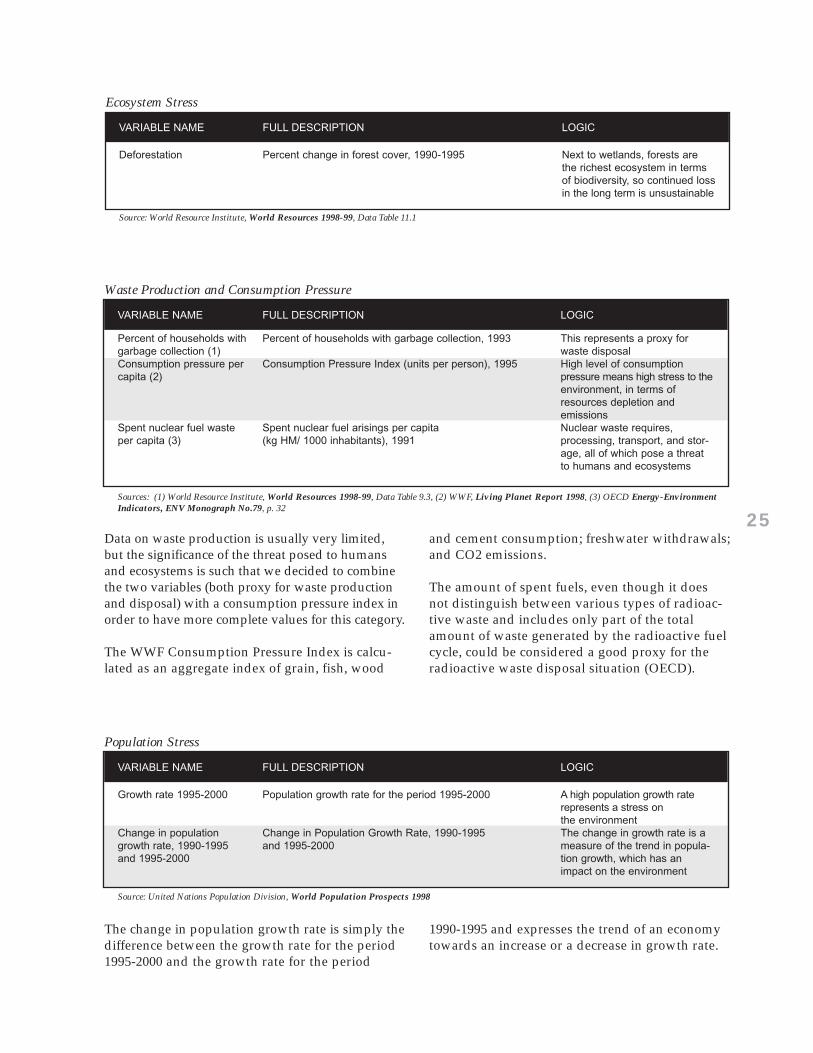
Data on waste production is usually very limited,but the significance of the threat posed to humansand ecosystems is such that we decided to combinethe two variables (both proxy for waste productionand disposal) with a consumption pressure index inorder to have more complete values for this category.
The WWF Consumption Pressure Index is calcu-lated as an aggregate index of grain, fish, wood
and cement consumption; freshwater withdrawals;and CO2 emissions.
The amount of spent fuels, even though it doesnot distinguish between various types of radioac-tive waste and includes only part of the totalamount of waste generated by the radioactive fuelcycle, could be considered a good proxy for theradioactive waste disposal situation (OECD).
Population Stress
Source: United Nations Population Division, World Population Prospects 1998
VARIABLE NAME FULL DESCRIPTION LOGIC
Growth rate 1995-2000 Population growth rate for the period 1995-2000 A high population growth rate represents a stress on the environment
Change in population Change in Population Growth Rate, 1990-1995 The change in growth rate is a growth rate, 1990-1995 and 1995-2000 measure of the trend in popula-and 1995-2000 tion growth, which has an
impact on the environment
The change in population growth rate is simply thedifference between the growth rate for the period1995-2000 and the growth rate for the period
1990-1995 and expresses the trend of an economytowards an increase or a decrease in growth rate.
Source: World Resource Institute, World Resources 1998-99, Data Table 11.1
Ecosystem Stress
VARIABLE NAME FULL DESCRIPTION LOGIC
Deforestation Percent change in forest cover, 1990-1995 Next to wetlands, forests are the richest ecosystem in terms of biodiversity, so continued lossin the long term is unsustainable
26
Basic Sustenance
Source: (1) and (2) World Resources Institute, World Resources 1998-99, Data Table 7.4, (3) World Resources Institute, World Resources 1998-99, DataTable 9.3, (4) World Resources Institute, World Resources 1998-99, Data Table 8.1
VARIABLE NAME FULL DESCRIPTION LOGIC
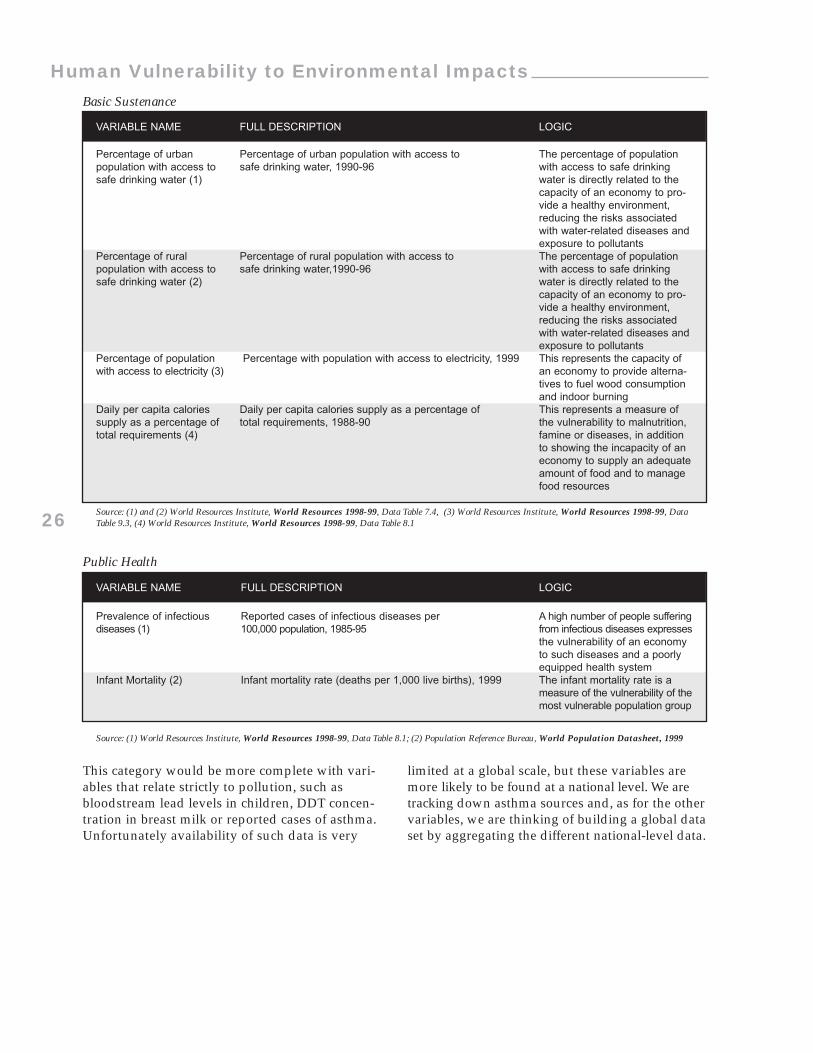
Percentage of urban Percentage of urban population with access to The percentage of populationpopulation with access to safe drinking water, 1990-96 with access to safe drinkingsafe drinking water (1) water is directly related to the
capacity of an economy to pro-vide a healthy environment, reducing the risks associated with water-related diseases andexposure to pollutants
Percentage of rural Percentage of rural population with access to The percentage of population population with access to safe drinking water,1990-96 with access to safe drinkingsafe drinking water (2) water is directly related to the
capacity of an economy to pro-vide a healthy environment, reducing the risks associated with water-related diseases andexposure to pollutants
Percentage of population Percentage with population with access to electricity, 1999 This represents the capacity ofwith access to electricity (3) an economy to provide alterna-
tives to fuel wood consumption and indoor burning
Daily per capita calories Daily per capita calories supply as a percentage of This represents a measure of supply as a percentage of total requirements, 1988-90 the vulnerability to malnutrition,total requirements (4) famine or diseases, in addition
to showing the incapacity of an economy to supply an adequateamount of food and to manage food resources
Human Vulnerability to Environmental Impacts
Public Health
Source: (1) World Resources Institute, World Resources 1998-99, Data Table 8.1; (2) Population Reference Bureau, World Population Datasheet, 1999
VARIABLE NAME FULL DESCRIPTION LOGIC
Prevalence of infectious Reported cases of infectious diseases per A high number of people sufferingdiseases (1) 100,000 population, 1985-95 from infectious diseases expresses
the vulnerability of an economy to such diseases and a poorly equipped health system
Infant Mortality (2) Infant mortality rate (deaths per 1,000 live births), 1999 The infant mortality rate is a measure of the vulnerability of themost vulnerable population group
This category would be more complete with vari-ables that relate strictly to pollution, such asbloodstream lead levels in children, DDT concen-tration in breast milk or reported cases of asthma.Unfortunately availability of such data is very
limited at a global scale, but these variables aremore likely to be found at a national level. We aretracking down asthma sources and, as for the othervariables, we are thinking of building a global dataset by aggregating the different national-level data.
27
Scientific and Technical Capacity
Source: (1) and (2) UNESCO, Statistical Yearbook 1998, Table 5.1; (3) National Science Board, Science and Engineering Indicators 1998, Appendix Table5-49.
VARIABLE NAME FULL DESCRIPTION LOGIC
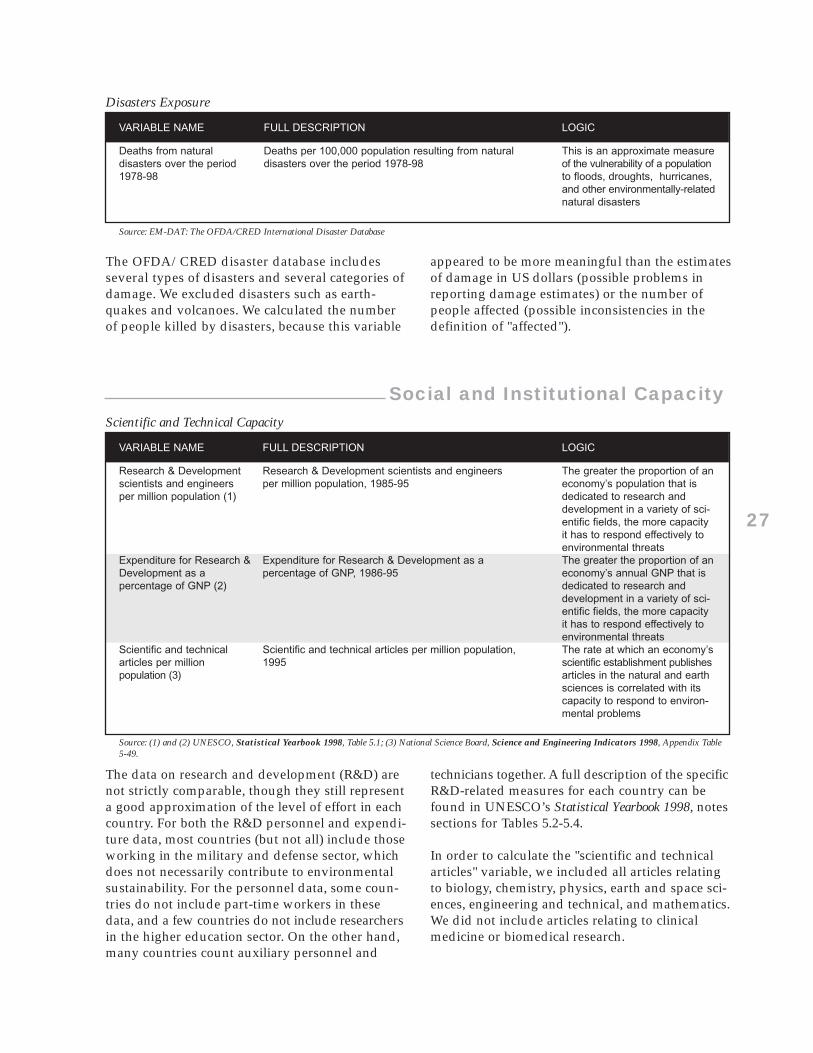
Research & Development Research & Development scientists and engineers The greater the proportion of anscientists and engineers per million population, 1985-95 economy’s population that isper million population (1) dedicated to research and
development in a variety of sci-entific fields, the more capacity it has to respond effectively to environmental threats
Expenditure for Research & Expenditure for Research & Development as a The greater the proportion of anDevelopment as a percentage of GNP, 1986-95 economy’s annual GNP that ispercentage of GNP (2) dedicated to research and
development in a variety of sci-entific fields, the more capacity it has to respond effectively to environmental threats
Scientific and technical Scientific and technical articles per million population, The rate at which an economy’sarticles per million 1995 scientific establishment publishespopulation (3) articles in the natural and earth
sciences is correlated with its capacity to respond to environ-mental problems
Social and Institutional Capacity
Disasters Exposure
Source: EM-DAT: The OFDA/CRED International Disaster Database
VARIABLE NAME FULL DESCRIPTION LOGIC
Deaths from natural Deaths per 100,000 population resulting from natural This is an approximate measuredisasters over the period disasters over the period 1978-98 of the vulnerability of a population1978-98 to floods, droughts, hurricanes,
and other environmentally-relatednatural disasters
The OFDA/CRED disaster database includesseveral types of disasters and several categories ofdamage. We excluded disasters such as earth-quakes and volcanoes. We calculated the numberof people killed by disasters, because this variable
appeared to be more meaningful than the estimatesof damage in US dollars (possible problems inreporting damage estimates) or the number ofpeople affected (possible inconsistencies in thedefinition of "affected").
The data on research and development (R&D) arenot strictly comparable, though they still representa good approximation of the level of effort in eachcountry. For both the R&D personnel and expendi-ture data, most countries (but not all) include thoseworking in the military and defense sector, whichdoes not necessarily contribute to environmentalsustainability. For the personnel data, some coun-tries do not include part-time workers in thesedata, and a few countries do not include researchersin the higher education sector. On the other hand,many countries count auxiliary personnel and
technicians together. A full description of the specificR&D-related measures for each country can befound in UNESCO’s Statistical Yearbook 1998, notessections for Tables 5.2-5.4.
In order to calculate the "scientific and technicalarticles" variable, we included all articles relatingto biology, chemistry, physics, earth and space sci-ences, engineering and technical, and mathematics.We did not include articles relating to clinicalmedicine or biomedical research.
28
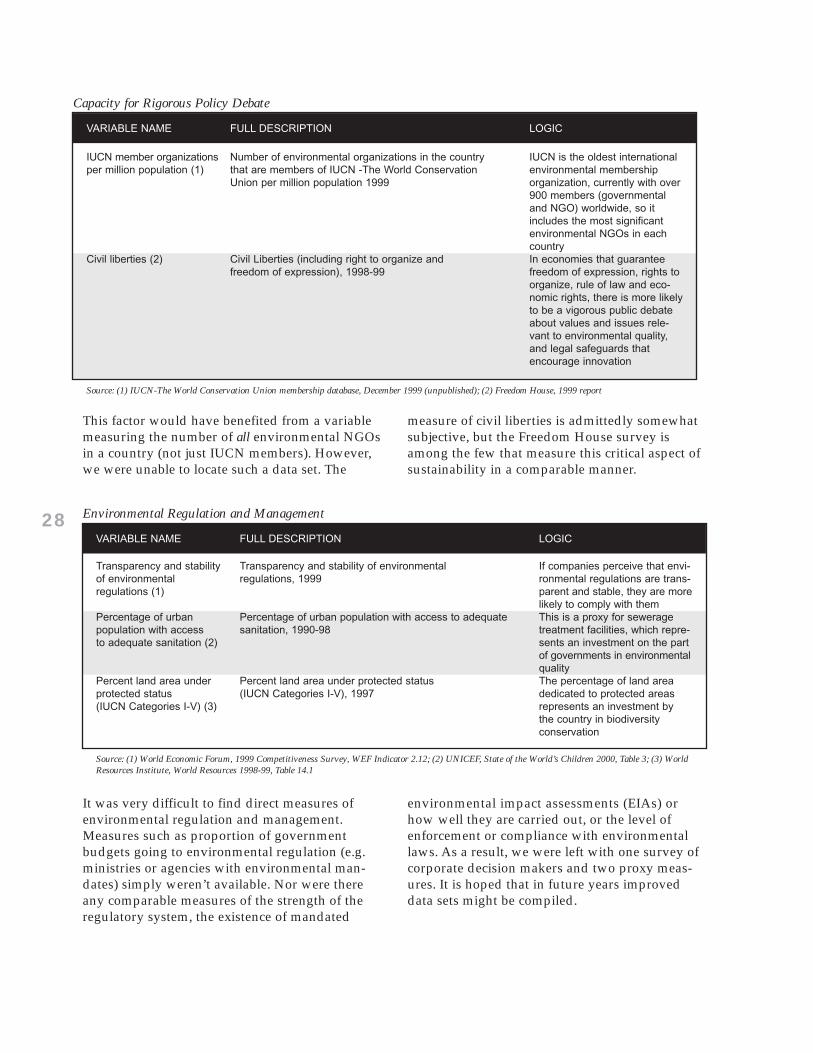
Capacity for Rigorous Policy Debate
Source: (1) IUCN-The World Conservation Union membership database, December 1999 (unpublished); (2) Freedom House, 1999 report
VARIABLE NAME FULL DESCRIPTION LOGIC
IUCN member organizations Number of environmental organizations in the country IUCN is the oldest international per million population (1) that are members of IUCN -The World Conservation environmental membership
Union per million population 1999 organization, currently with over 900 members (governmental and NGO) worldwide, so it includes the most significant environmental NGOs in each country
Civil liberties (2) Civil Liberties (including right to organize and In economies that guaranteefreedom of expression), 1998-99 freedom of expression, rights to
organize, rule of law and eco-nomic rights, there is more likelyto be a vigorous public debate about values and issues rele-vant to environmental quality, and legal safeguards that encourage innovation
This factor would have benefited from a variablemeasuring the number of all environmental NGOsin a country (not just IUCN members). However,we were unable to locate such a data set. The
measure of civil liberties is admittedly somewhatsubjective, but the Freedom House survey isamong the few that measure this critical aspect ofsustainability in a comparable manner.
Environmental Regulation and Management
Source: (1) World Economic Forum, 1999 Competitiveness Survey, WEF Indicator 2.12; (2) UNICEF, State of the World’s Children 2000, Table 3; (3) WorldResources Institute, World Resources 1998-99, Table 14.1
VARIABLE NAME FULL DESCRIPTION LOGIC
Transparency and stability Transparency and stability of environmental If companies perceive that envi-of environmental regulations, 1999 ronmental regulations are trans-regulations (1) parent and stable, they are more
likely to comply with themPercentage of urban Percentage of urban population with access to adequate This is a proxy for sewerage population with access sanitation, 1990-98 treatment facilities, which repre-to adequate sanitation (2) sents an investment on the part
of governments in environmentalquality
Percent land area under Percent land area under protected status The percentage of land areaprotected status (IUCN Categories I-V), 1997 dedicated to protected areas (IUCN Categories I-V) (3) represents an investment by
the country in biodiversity conservation
It was very difficult to find direct measures ofenvironmental regulation and management.Measures such as proportion of governmentbudgets going to environmental regulation (e.g.ministries or agencies with environmental man-dates) simply weren’t available. Nor were thereany comparable measures of the strength of theregulatory system, the existence of mandated
environmental impact assessments (EIAs) orhow well they are carried out, or the level ofenforcement or compliance with environmentallaws. As a result, we were left with one survey ofcorporate decision makers and two proxy meas-ures. It is hoped that in future years improveddata sets might be compiled.
29
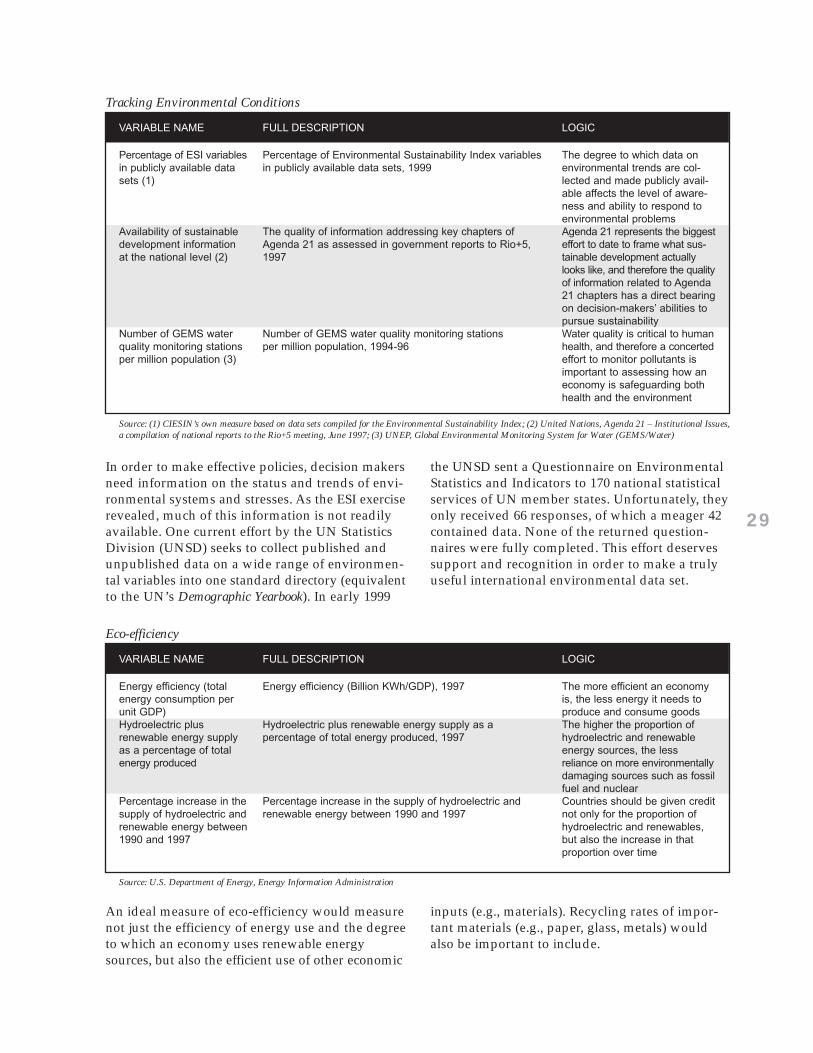
Tracking Environmental Conditions
Source: (1) CIESIN’s own measure based on data sets compiled for the Environmental Sustainability Index; (2) United Nations, Agenda 21 – Institutional Issues,a compilation of national reports to the Rio+5 meeting, June 1997; (3) UNEP, Global Environmental Monitoring System for Water (GEMS/Water)
VARIABLE NAME FULL DESCRIPTION LOGIC
Percentage of ESI variables Percentage of Environmental Sustainability Index variables The degree to which data onin publicly available data in publicly available data sets, 1999 environmental trends are col-sets (1) lected and made publicly avail-
able affects the level of aware-ness and ability to respond to environmental problems
Availability of sustainable The quality of information addressing key chapters of Agenda 21 represents the biggest development information Agenda 21 as assessed in government reports to Rio+5, effort to date to frame what sus-at the national level (2) 1997 tainable development actually
looks like, and therefore the qualityof information related to Agenda 21 chapters has a direct bearingon decision-makers’ abilities to pursue sustainability
Number of GEMS water Number of GEMS water quality monitoring stations Water quality is critical to human quality monitoring stations per million population, 1994-96 health, and therefore a concertedper million population (3) effort to monitor pollutants is
important to assessing how an economy is safeguarding both health and the environment
In order to make effective policies, decision makersneed information on the status and trends of envi-ronmental systems and stresses. As the ESI exerciserevealed, much of this information is not readilyavailable. One current effort by the UN StatisticsDivision (UNSD) seeks to collect published andunpublished data on a wide range of environmen-tal variables into one standard directory (equivalentto the UN’s Demographic Yearbook). In early 1999
the UNSD sent a Questionnaire on EnvironmentalStatistics and Indicators to 170 national statisticalservices of UN member states. Unfortunately, theyonly received 66 responses, of which a meager 42contained data. None of the returned question-naires were fully completed. This effort deservessupport and recognition in order to make a trulyuseful international environmental data set.
Eco-efficiency
Source: U.S. Department of Energy, Energy Information Administration
VARIABLE NAME FULL DESCRIPTION LOGIC
Energy efficiency (total Energy efficiency (Billion KWh/GDP), 1997 The more efficient an economy energy consumption per is, the less energy it needs tounit GDP) produce and consume goodsHydroelectric plus Hydroelectric plus renewable energy supply as a The higher the proportion ofrenewable energy supply percentage of total energy produced, 1997 hydroelectric and renewableas a percentage of total energy sources, the lessenergy produced reliance on more environmentally
damaging sources such as fossilfuel and nuclear
Percentage increase in the Percentage increase in the supply of hydroelectric and Countries should be given credit supply of hydroelectric and renewable energy between 1990 and 1997 not only for the proportion of renewable energy between hydroelectric and renewables,1990 and 1997 but also the increase in that
proportion over time
An ideal measure of eco-efficiency would measurenot just the efficiency of energy use and the degreeto which an economy uses renewable energysources, but also the efficient use of other economic
inputs (e.g., materials). Recycling rates of impor-tant materials (e.g., paper, glass, metals) wouldalso be important to include.
30
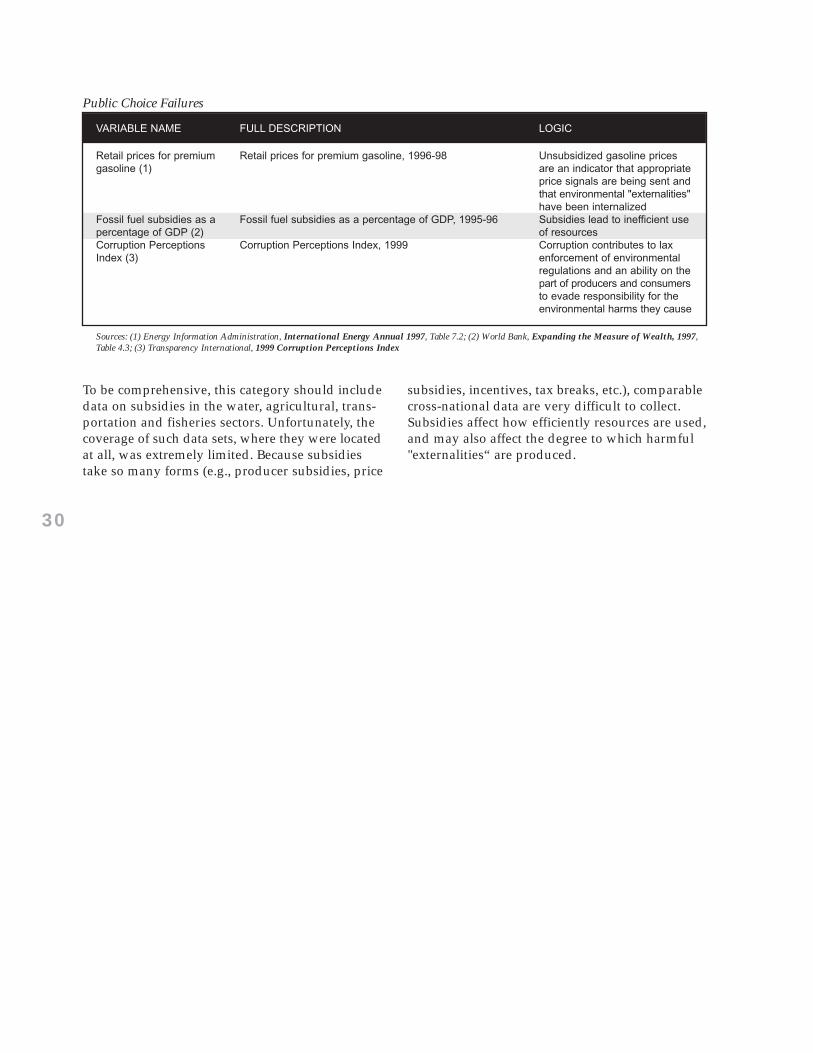
Public Choice Failures
Sources: (1) Energy Information Administration, International Energy Annual 1997, Table 7.2; (2) World Bank, Expanding the Measure of Wealth, 1997,Table 4.3; (3) Transparency International, 1999 Corruption Perceptions Index
VARIABLE NAME FULL DESCRIPTION LOGIC
Retail prices for premium Retail prices for premium gasoline, 1996-98 Unsubsidized gasoline pricesgasoline (1) are an indicator that appropriate
price signals are being sent andthat environmental "externalities"have been internalized
Fossil fuel subsidies as a Fossil fuel subsidies as a percentage of GDP, 1995-96 Subsidies lead to inefficient usepercentage of GDP (2) of resourcesCorruption Perceptions Corruption Perceptions Index, 1999 Corruption contributes to lax Index (3) enforcement of environmental
regulations and an ability on the part of producers and consumersto evade responsibility for the environmental harms they cause
To be comprehensive, this category should includedata on subsidies in the water, agricultural, trans-portation and fisheries sectors. Unfortunately, thecoverage of such data sets, where they were locatedat all, was extremely limited. Because subsidiestake so many forms (e.g., producer subsidies, price
subsidies, incentives, tax breaks, etc.), comparablecross-national data are very difficult to collect.Subsidies affect how efficiently resources are used,and may also affect the degree to which harmful"externalities“ are produced.
31
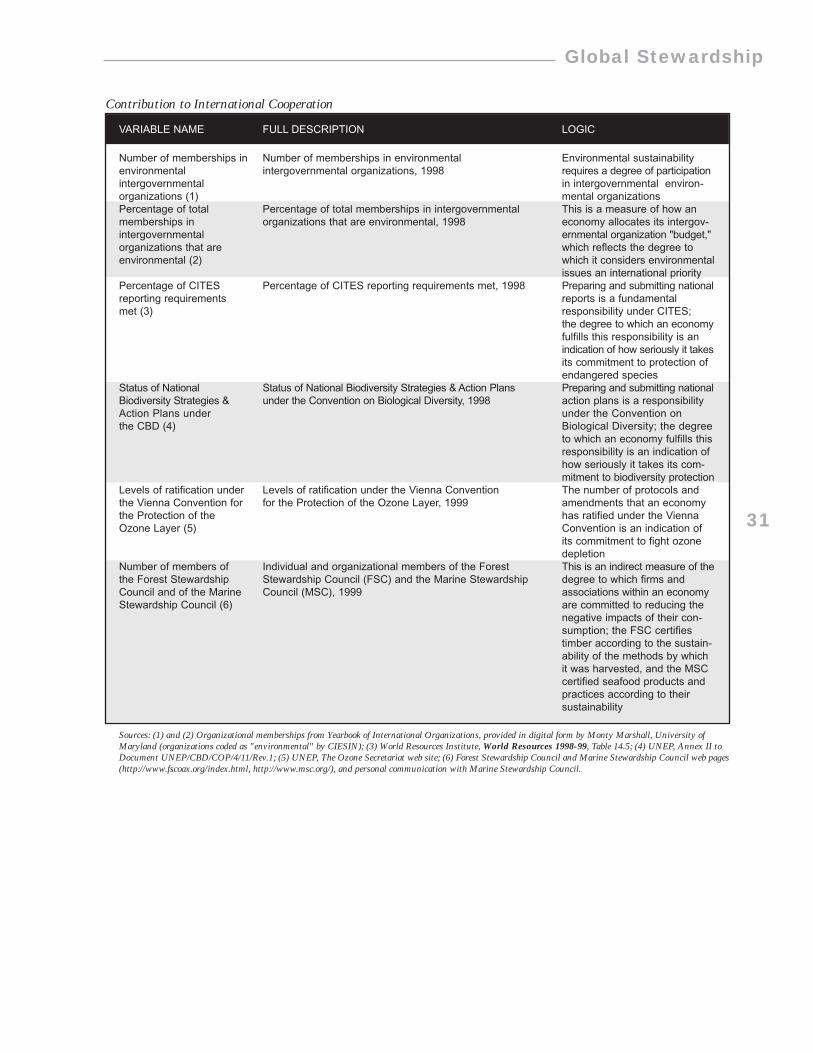
Global Stewardship
Contribution to International Cooperation
Sources: (1) and (2) Organizational memberships from Yearbook of International Organizations, provided in digital form by Monty Marshall, University ofMaryland (organizations coded as "environmental" by CIESIN); (3) World Resources Institute, World Resources 1998-99, Table 14.5; (4) UNEP, Annex II toDocument UNEP/CBD/COP/4/11/Rev.1; (5) UNEP, The Ozone Secretariat web site; (6) Forest Stewardship Council and Marine Stewardship Council web pages(http://www.fscoax.org/index.html, http://www.msc.org/), and personal communication with Marine Stewardship Council.
VARIABLE NAME FULL DESCRIPTION LOGIC
Number of memberships in Number of memberships in environmental Environmental sustainabilityenvironmental intergovernmental organizations, 1998 requires a degree of participation intergovernmental in intergovernmental environ-organizations (1) mental organizationsPercentage of total Percentage of total memberships in intergovernmental This is a measure of how anmemberships in organizations that are environmental, 1998 economy allocates its intergov-intergovernmental ernmental organization "budget," organizations that are which reflects the degree to environmental (2) which it considers environmental
issues an international priorityPercentage of CITES Percentage of CITES reporting requirements met, 1998 Preparing and submitting national reporting requirements reports is a fundamental met (3) responsibility under CITES;
the degree to which an economyfulfills this responsibility is an indication of how seriously it takesits commitment to protection of endangered species
Status of National Status of National Biodiversity Strategies & Action Plans Preparing and submitting national Biodiversity Strategies & under the Convention on Biological Diversity, 1998 action plans is a responsibility Action Plans under under the Convention on the CBD (4) Biological Diversity; the degree
to which an economy fulfills thisresponsibility is an indication of how seriously it takes its com-mitment to biodiversity protection
Levels of ratification under Levels of ratification under the Vienna Convention The number of protocols andthe Vienna Convention for for the Protection of the Ozone Layer, 1999 amendments that an economythe Protection of the has ratified under the ViennaOzone Layer (5) Convention is an indication of
its commitment to fight ozone depletion
Number of members of Individual and organizational members of the Forest This is an indirect measure of thethe Forest Stewardship Stewardship Council (FSC) and the Marine Stewardship degree to which firms and Council and of the Marine Council (MSC), 1999 associations within an economyStewardship Council (6) are committed to reducing the
negative impacts of their con-sumption; the FSC certifies timber according to the sustain-ability of the methods by which it was harvested, and the MSC certified seafood products and practices according to their sustainability
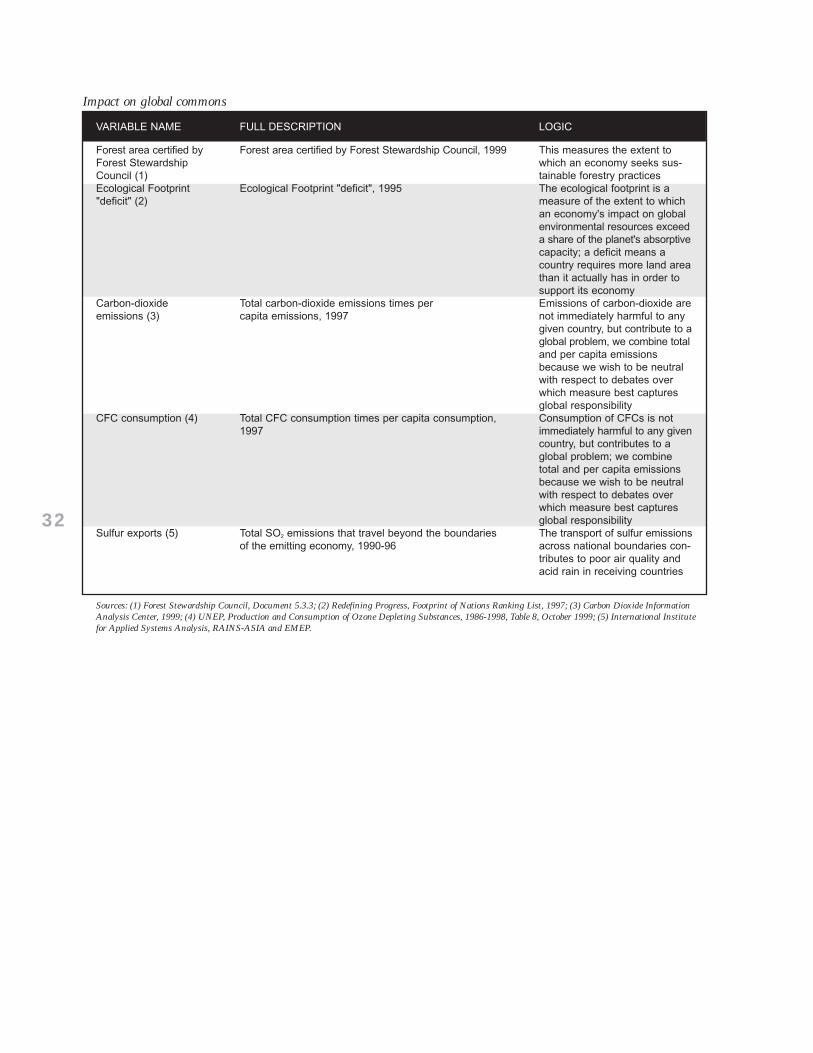
32
Impact on global commons
Sources: (1) Forest Stewardship Council, Document 5.3.3; (2) Redefining Progress, Footprint of Nations Ranking List, 1997; (3) Carbon Dioxide InformationAnalysis Center, 1999; (4) UNEP, Production and Consumption of Ozone Depleting Substances, 1986-1998, Table 8, October 1999; (5) International Institutefor Applied Systems Analysis, RAINS-ASIA and EMEP.
VARIABLE NAME FULL DESCRIPTION LOGIC
Forest area certified by Forest area certified by Forest Stewardship Council, 1999 This measures the extent to Forest Stewardship which an economy seeks sus-Council (1) tainable forestry practicesEcological Footprint Ecological Footprint "deficit", 1995 The ecological footprint is a"deficit" (2) measure of the extent to which
an economy's impact on global environmental resources exceeda share of the planet's absorptivecapacity; a deficit means a country requires more land areathan it actually has in order to support its economy
Carbon-dioxide Total carbon-dioxide emissions times per Emissions of carbon-dioxide are emissions (3) capita emissions, 1997 not immediately harmful to any
given country, but contribute to aglobal problem, we combine totaland per capita emissions because we wish to be neutral with respect to debates over which measure best captures global responsibility
CFC consumption (4) Total CFC consumption times per capita consumption, Consumption of CFCs is not 1997 immediately harmful to any given
country, but contributes to a global problem; we combine total and per capita emissions because we wish to be neutral with respect to debates over which measure best captures global responsibility
Sulfur exports (5) Total SO2 emissions that travel beyond the boundaries The transport of sulfur emissions of the emitting economy, 1990-96 across national boundaries con-
tributes to poor air quality and acid rain in receiving countries
33
Urb
an A
ir Q
ualit
y (3
)
Wat
er Q
uant
ity (
2)
Wat
er Q
ualit
y (6
)
Bio
dive
rsity
(3)
Land
(1)
# m
issi
ng v
aria
bles
# of
mis
sing
fac
tors
Air
Pol
lutio
n (5
)
Wat
er P
oll.
& C
ons.
(4)
Eco
syst
em S
tres
s (1
)
Was
te P
rod.
& C
ons.
(3)
Pop
ulat
ion
(2)
# m
issi
ng v
aria
bles
# of
mis
sing
fac
tors
Bas
ic S
uste
nanc
e (4
)
Pub
lic H
ealth
(2)
Dis
aste
rs E
xpos
ure
(1)
# m
issi
ng v
aria
bles
# of
mis
sing
fac
tors
Sci
ence
& T
ech
Cap
acity
(3)
Cap
acity
for
P
olic
y D
ebat
e (2
)
Env
’tal M
gt.
& R
eg (
3)
Tra
ckin
g E
nv'ta
l. C
hang
e (2
)
Eco
-effi
cien
cy (
3)
Pub
lic C
hoic
e F
ailu
re (
3)
# m
issi
ng v
aria
bles
# of
mis
sing
fac
tors
Con
trib
utio
n. t
o In
t’l C
oop.
(6)
Impa
ct o
n C
omm
ons
(5)
# m
issi
ng v
aria
bles
# of
mis
sing
fac
tors
% o
f va
riabl
es m
issi
ng
% o
f fa
ctor
s m
issi
ng
FactorName(Total No. ofVariables)
Table 7. Data Availability by Component and Factor
Argentina 3 2 6 3 1 0 0 2 3 1 1 2 6 0 3 2 1 1 0 3 2 3 1 3 3 1 0 6 4 1 0 14.1 0.0Australia 3 1 0 3 1 7 1 3 2 1 3 2 4 0 2 2 1 2 0 3 2 3 1 3 2 2 0 6 4 1 0 25.0 4.8Austria 3 2 0 3 1 6 1 5 4 1 2 2 1 0 2 2 1 2 0 3 2 3 2 3 2 1 0 6 5 0 0 15.6 4.8Belgium 3 2 6 3 1 0 0 5 2 1 2 2 3 0 4 2 1 0 0 3 2 3 1 3 2 2 0 6 5 0 0 7.8 0.0Bolivia 0 2 0 2 1 10 2 1 3 1 3 2 5 0 4 2 1 0 0 2 2 3 2 3 2 2 0 6 3 2 0 29.7 9.5Brazil 3 2 0 3 1 6 1 2 2 1 2 2 6 0 4 2 1 0 0 3 2 3 2 3 3 0 0 6 4 1 0 20.3 4.8Bulgaria 3 2 0 3 1 6 1 4 4 1 2 2 2 0 2 2 0 3 1 2 2 2 1 2 2 5 0 6 4 1 0 26.6 9.5Canada 3 2 4 3 1 2 0 5 4 1 3 2 0 0 2 2 1 2 0 3 2 3 2 3 2 1 0 6 4 1 0 9.4 0.0Chile 2 2 0 3 1 7 1 2 2 1 3 2 5 0 4 2 1 0 0 2 2 3 1 3 2 3 0 6 4 1 0 25.0 4.8China 3 2 6 3 1 0 0 2 3 1 1 2 6 0 2 2 1 2 0 3 2 3 1 3 3 1 0 6 5 0 0 14.1 0.0Colombia 1 2 0 3 1 8 1 2 3 1 3 2 4 0 4 2 1 0 0 1 2 3 2 2 2 4 0 6 4 1 0 26.6 4.8Costa Rica 0 2 0 3 1 9 2 1 1 1 2 2 8 0 3 2 1 1 0 2 2 3 2 3 2 2 0 6 4 1 0 32.8 9.5Czech Rep. 3 1 0 1 1 9 1 2 2 1 2 2 6 0 1 2 1 3 0 3 2 2 2 1 3 3 0 6 5 0 0 32.8 4.8Denmark 3 2 0 3 1 6 1 5 4 1 3 2 0 0 2 2 1 2 0 3 2 3 2 3 2 1 0 6 5 0 0 14.1 4.8Ecuador 2 2 0 3 1 7 1 4 3 1 3 2 2 0 4 2 1 0 0 3 2 3 2 2 2 2 0 6 3 2 0 20.3 4.8Egypt 1 2 0 3 1 8 1 2 4 1 3 2 3 0 4 2 1 0 0 3 2 3 2 3 2 1 0 6 4 1 0 20.3 4.8El Salvador 0 1 0 3 1 10 2 2 2 1 3 2 5 0 4 2 1 0 0 2 2 3 1 3 2 3 0 6 3 2 0 31.3 9.5Finland 3 2 4 3 1 2 0 2 4 1 2 2 4 0 4 2 0 1 1 3 2 3 2 3 2 1 0 6 5 0 0 12.5 4.8France 3 2 4 3 1 2 0 5 4 1 3 2 0 0 2 2 1 2 0 3 2 3 2 3 2 1 0 6 5 0 0 7.8 0.0Germany 3 2 0 2 1 7 1 5 4 1 3 2 0 0 1 2 1 3 0 3 2 3 2 2 2 2 0 6 5 0 0 18.8 4.8Greece 3 2 0 3 1 6 1 5 3 1 3 2 1 0 2 2 1 2 0 3 2 2 2 2 2 3 0 6 5 0 0 18.8 4.8Hungary 3 2 0 3 1 6 1 5 3 1 2 2 2 0 2 2 1 2 0 3 2 2 2 2 3 2 0 6 5 0 0 18.8 4.8Iceland 3 2 0 3 0 7 2 4 2 0 1 2 6 1 3 2 0 2 1 3 2 3 2 3 1 2 0 3 5 3 0 31.3 19.0India 3 2 4 3 1 2 0 2 3 1 2 2 5 0 3 2 1 1 0 3 2 3 1 2 3 2 0 6 5 0 0 15.6 0.0Indonesia 1 2 5 3 1 3 0 2 3 1 3 2 4 0 4 2 1 0 0 2 2 3 1 3 2 3 0 6 5 0 0 15.6 0.0Ireland 1 2 0 3 1 8 1 5 3 1 2 2 2 0 2 2 1 2 0 3 2 3 2 3 2 1 0 5 5 1 0 21.9 4.8Israel 0 2 0 2 1 10 2 2 4 1 2 2 4 0 4 2 1 0 0 2 2 2 2 3 1 4 0 6 4 1 0 29.7 9.5Italy 3 2 0 3 1 6 1 4 4 1 2 2 2 0 2 2 1 2 0 3 2 3 1 3 2 2 0 6 5 0 0 18.8 4.8Japan 3 2 6 2 1 1 0 2 4 1 2 2 4 0 2 2 1 2 0 3 2 3 2 3 2 1 0 6 5 0 0 12.5 0.0Jordan 0 2 5 3 1 4 1 1 4 1 3 2 4 0 2 2 1 2 0 3 2 3 1 3 1 3 0 6 4 1 0 21.9 4.8Korea 3 1 4 3 1 3 0 4 2 1 1 2 5 0 4 2 1 0 0 3 2 3 1 3 3 1 0 6 5 0 0 14.1 0.0Malaysia 2 2 3 3 1 4 0 2 2 1 2 2 6 0 3 2 1 1 0 3 2 3 2 3 1 2 0 6 5 0 0 20.3 0.0Mauritius 0 2 0 3 1 9 2 2 2 1 2 2 6 0 3 2 1 1 0 3 2 3 2 2 1 3 0 6 3 2 0 32.8 9.5Mexico 3 2 4 3 1 2 0 2 4 1 1 2 5 0 3 2 1 1 0 3 2 2 2 3 3 1 0 6 4 1 0 15.6 0.0Netherlands 3 2 6 3 1 0 0 5 4 1 3 2 0 0 2 2 1 2 0 3 2 3 2 3 2 1 0 6 5 0 0 4.7 0.0New Zealand 3 2 5 3 1 1 0 2 2 1 2 2 6 0 2 2 1 2 0 3 2 3 2 3 2 1 0 6 4 1 0 17.2 0.0Norway 3 2 2 3 1 4 0 5 4 1 2 2 1 0 4 2 1 0 0 3 2 3 2 3 2 1 0 6 5 0 0 9.4 0.0Peru 0 2 0 3 1 9 2 2 3 1 3 2 4 0 4 2 1 0 0 3 2 3 1 3 2 2 0 6 4 1 0 25.0 9.5Philippines 2 2 3 3 1 4 0 2 2 1 2 2 6 0 3 2 1 1 0 3 2 3 2 3 1 2 0 6 5 0 0 20.3 0.0Poland 2 2 6 3 1 1 0 5 4 1 3 2 0 0 3 2 1 1 0 3 2 2 2 2 3 2 0 6 5 0 0 6.3 0.0Portugal 3 2 5 3 1 1 0 5 4 1 2 2 1 0 2 2 1 2 0 3 2 3 2 3 2 1 0 6 5 0 0 7.8 0.0Russia 3 2 3 2 0 5 1 4 4 1 2 2 2 0 1 2 1 3 0 3 2 2 2 1 3 3 0 6 5 0 0 20.3 4.8Singapore 2 1 0 3 1 8 1 2 2 1 2 2 6 0 2 2 0 3 1 3 2 2 1 1 1 6 0 6 5 0 0 35.9 9.5Slovak Rep. 3 1 0 1 0 10 2 5 3 1 2 2 2 0 1 1 0 5 1 3 2 2 2 1 2 4 0 6 4 1 0 34.4 14.3South Africa 2 2 0 3 1 7 1 2 4 1 1 2 5 0 3 2 1 1 0 2 2 3 2 3 2 2 0 6 4 1 0 25.0 4.8Spain 3 2 0 2 1 7 1 5 4 1 2 2 1 0 2 2 1 2 0 3 2 3 2 3 2 1 0 6 5 0 0 17.2 4.8Sweden 3 2 0 3 1 6 1 5 4 1 3 2 0 0 2 2 0 3 1 3 2 3 1 3 2 2 0 6 5 0 0 17.2 9.5Switzerland 3 2 4 3 1 2 0 5 4 1 2 2 1 0 4 2 1 0 0 2 2 3 2 3 2 2 0 6 5 0 0 7.8 0.0Thailand 3 2 4 3 1 2 0 2 3 1 2 2 5 0 3 2 1 1 0 3 2 3 2 3 3 0 0 6 5 0 0 12.5 0.0Turkey 3 2 0 3 1 6 1 3 4 1 2 2 3 0 3 2 1 1 0 3 2 3 2 3 2 1 0 6 5 0 0 17.2 4.8Ukraine 0 2 0 2 0 11 3 4 4 1 1 2 3 0 3 2 1 1 0 3 2 2 2 1 1 5 0 5 4 2 0 34.4 14.3U.K. 2 2 5 3 1 2 0 5 4 1 3 2 0 0 2 2 1 2 0 3 2 3 1 3 2 2 0 6 5 0 0 9.4 0.0U.S. 2 2 5 3 1 2 0 5 4 1 2 2 1 0 2 2 1 2 0 3 2 3 2 3 2 1 0 5 4 2 0 12.5 0.0Venezuela 3 2 0 3 1 6 1 2 2 1 2 2 6 0 4 2 1 0 0 3 2 3 1 3 3 1 0 6 4 1 0 21.9 4.8Vietnam 0 2 0 2 1 10 2 1 2 1 3 2 6 0 1 2 1 3 0 3 2 3 2 2 1 3 0 6 4 1 0 35.9 9.5Zimbabwe 0 2 0 3 1 9 2 2 3 1 3 2 4 0 4 2 0 1 1 1 2 3 2 3 1 4 0 6 3 2 0 31.3 14.3
Variables/ Factors:
Environmental Systems Environmental Stresses Human Vulnerability Social and Institutional Capacity Global Stewardship Summary
15 variables/5 factors 15 variables/5 factors 7 variables/3 factors 16 variables/6 factors 11 variables/ 2 factors
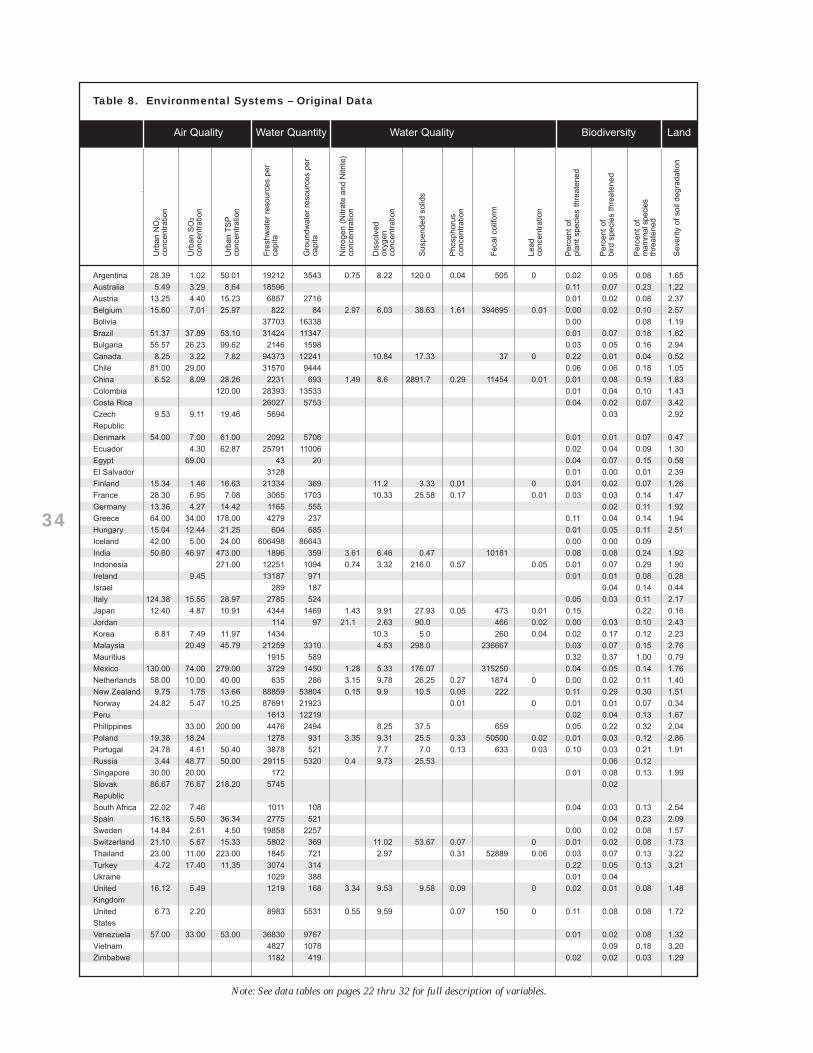
34
Urb
an N
O2
conc
entr
atio
n
Urb
an S
O2
conc
entr
atio
n
Urb
an T
SP
conc
entr
atio
n
Fre
shw
ater
res
ourc
es p
erca
pita
Gro
undw
ater
res
ourc
es p
erca
pita
Nitr
ogen
(N
itrat
e an
d N
itrite
) co
ncen
trat
ion
Dis
solv
ed
oxyg
en
conc
entr
atio
n
Sus
pend
ed s
olid
s
Pho
spho
rus
conc
entr
atio
n
Fec
al c
olifo
rm
Lead
co
ncen
trat
ion
Per
cent
of
plan
t sp
ecie
s th
reat
ened
Per
cent
of
bird
spe
cies
thr
eate
ned
Per
cent
of
mam
mal
spe
cies
thre
aten
ed
Sev
erity
of
soil
degr
adat
ion
Table 8. Environmental Systems – Original Data
.
Argentina 28.39 1.02 50.01 19212 3543 0.75 8.22 120.0 0.04 505 0 0.02 0.05 0.08 1.65
Australia 5.49 3.29 8.64 18596 0.11 0.07 0.23 1.22
Austria 13.25 4.40 15.23 6857 2716 0.01 0.02 0.08 2.37
Belgium 15.60 7.01 25.97 822 84 2.97 6.03 38.63 1.61 394695 0.01 0.00 0.02 0.10 2.57
Bolivia 37703 16338 0.00 0.08 1.19
Brazil 51.37 37.89 53.10 31424 11347 0.01 0.07 0.18 1.62
Bulgaria 55.57 26.23 99.62 2146 1598 0.03 0.05 0.16 2.94
Canada 8.25 3.22 7.82 94373 12241 10.84 17.33 37 0 0.22 0.01 0.04 0.52
Chile 81.00 29.00 31570 9444 0.06 0.06 0.18 1.05
China 6.52 8.09 28.26 2231 693 1.49 8.6 2891.7 0.29 11454 0.01 0.01 0.08 0.19 1.83
Colombia 120.00 28393 13533 0.01 0.04 0.10 1.43
Costa Rica 26027 5753 0.04 0.02 0.07 3.42
Czech 9.53 9.11 19.46 5694 0.03 2.92
Republic
Denmark 54.00 7.00 61.00 2092 5706 0.01 0.01 0.07 0.47
Ecuador 4.30 62.87 25791 11006 0.02 0.04 0.09 1.30
Egypt 69.00 43 20 0.04 0.07 0.15 0.58
El Salvador 3128 0.01 0.00 0.01 2.39
Finland 15.34 1.46 16.63 21334 369 11.2 3.33 0.01 0 0.01 0.02 0.07 1.26
France 28.30 6.95 7.08 3065 1703 10.33 25.58 0.17 0.01 0.03 0.03 0.14 1.47
Germany 13.36 4.27 14.42 1165 555 0.02 0.11 1.92
Greece 64.00 34.00 178.00 4279 237 0.11 0.04 0.14 1.94
Hungary 15.04 12.44 21.25 604 685 0.01 0.05 0.11 2.51
Iceland 42.00 5.00 24.00 606498 86643 0.00 0.00 0.09
India 50.60 46.97 473.00 1896 359 3.61 6.46 0.47 10181 0.08 0.08 0.24 1.92
Indonesia 271.00 12251 1094 0.74 3.32 216.0 0.57 0.05 0.01 0.07 0.29 1.90
Ireland 9.45 13187 971 0.01 0.01 0.08 0.28
Israel 289 187 0.04 0.14 0.44
Italy 124.38 15.55 28.97 2785 524 0.05 0.03 0.11 2.17
Japan 12.40 4.87 10.91 4344 1469 1.43 9.91 27.93 0.05 473 0.01 0.15 0.22 0.16
Jordan 114 97 21.1 2.63 90.0 466 0.02 0.00 0.03 0.10 2.43
Korea 8.81 7.49 11.97 1434 10.3 5.0 260 0.04 0.02 0.17 0.12 2.23
Malaysia 20.49 45.79 21259 3310 4.53 298.0 236667 0.03 0.07 0.15 2.76
Mauritius 1915 589 0.32 0.37 1.00 0.79
Mexico 130.00 74.00 279.00 3729 1450 1.28 5.33 176.07 315250 0.04 0.05 0.14 1.76
Netherlands 58.00 10.00 40.00 635 286 3.15 9.78 26.25 0.27 1874 0 0.00 0.02 0.11 1.40
New Zealand 9.75 1.75 13.66 88859 53804 0.15 9.9 10.5 0.05 222 0.11 0.29 0.30 1.51
Norway 24.82 5.47 10.25 87691 21923 0.01 0 0.01 0.01 0.07 0.34
Peru 1613 12219 0.02 0.04 0.13 1.67
Philippines 33.00 200.00 4476 2494 8.25 37.5 659 0.05 0.22 0.32 2.04
Poland 19.38 18.24 1278 931 3.35 9.31 25.5 0.33 50500 0.02 0.01 0.03 0.12 2.86
Portugal 24.78 4.61 50.40 3878 521 7.7 7.0 0.13 633 0.03 0.10 0.03 0.21 1.91
Russia 3.44 48.77 50.00 29115 5320 0.4 9.73 25.53 0.06 0.12
Singapore 30.00 20.00 172 0.01 0.08 0.13 1.99
Slovak 86.67 76.67 218.20 5745 0.02
Republic
South Africa 22.02 7.46 1011 108 0.04 0.03 0.13 2.54
Spain 16.18 5.50 36.34 2775 521 0.04 0.23 2.09
Sweden 14.84 2.61 4.50 19858 2257 0.00 0.02 0.08 1.57
Switzerland 21.10 5.67 15.33 5802 369 11.02 53.67 0.07 0 0.01 0.02 0.08 1.73
Thailand 23.00 11.00 223.00 1845 721 2.97 0.31 52889 0.06 0.03 0.07 0.13 3.22
Turkey 4.72 17.40 11.35 3074 314 0.22 0.05 0.13 3.21
Ukraine 1029 388 0.01 0.04
United 16.12 5.49 1219 168 3.34 9.53 9.58 0.09 0 0.02 0.01 0.08 1.48
Kingdom
United 6.73 2.20 8983 5531 0.55 9.59 0.07 150 0 0.11 0.08 0.08 1.72
States
Venezuela 57.00 33.00 53.00 36830 9767 0.01 0.02 0.08 1.32
Vietnam 4827 1078 0.09 0.18 3.20
Zimbabwe 1182 419 0.02 0.02 0.03 1.29
Air Quality Water Quantity BiodiversityWater Quality Land
Note: See data tables on pages 22 thru 32 for full description of variables.
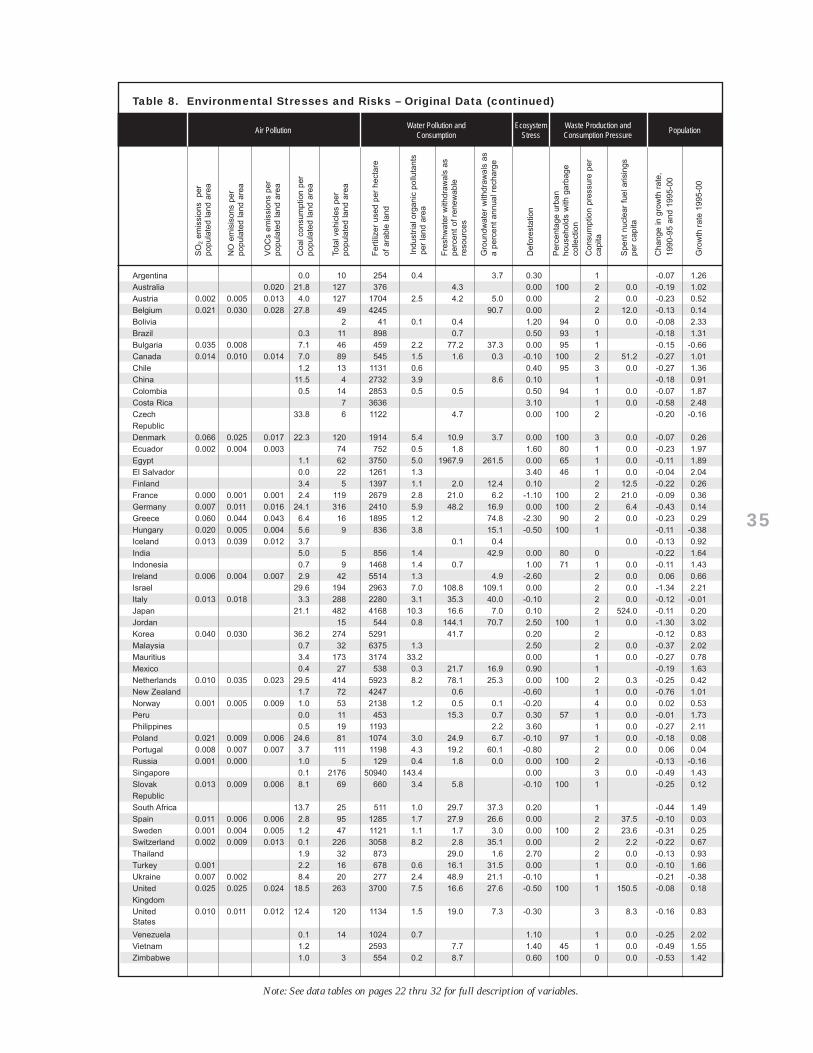
35
Table 8. Environmental Stresses and Risks – Original Data (continued)
Argentina 0.0 10 254 0.4 3.7 0.30 1 -0.07 1.26
Australia 0.020 21.8 127 376 4.3 0.00 100 2 0.0 -0.19 1.02
Austria 0.002 0.005 0.013 4.0 127 1704 2.5 4.2 5.0 0.00 2 0.0 -0.23 0.52
Belgium 0.021 0.030 0.028 27.8 49 4245 90.7 0.00 2 12.0 -0.13 0.14
Bolivia 2 41 0.1 0.4 1.20 94 0 0.0 -0.08 2.33
Brazil 0.3 11 898 0.7 0.50 93 1 -0.18 1.31
Bulgaria 0.035 0.008 7.1 46 459 2.2 77.2 37.3 0.00 95 1 -0.15 -0.66
Canada 0.014 0.010 0.014 7.0 89 545 1.5 1.6 0.3 -0.10 100 2 51.2 -0.27 1.01
Chile 1.2 13 1131 0.6 0.40 95 3 0.0 -0.27 1.36
China 11.5 4 2732 3.9 8.6 0.10 1 -0.18 0.91
Colombia 0.5 14 2853 0.5 0.5 0.50 94 1 0.0 -0.07 1.87
Costa Rica 7 3636 3.10 1 0.0 -0.58 2.48
Czech 33.8 6 1122 4.7 0.00 100 2 -0.20 -0.16
Republic
Denmark 0.066 0.025 0.017 22.3 120 1914 5.4 10.9 3.7 0.00 100 3 0.0 -0.07 0.26
Ecuador 0.002 0.004 0.003 74 752 0.5 1.8 1.60 80 1 0.0 -0.23 1.97
Egypt 1.1 62 3750 5.0 1967.9 261.5 0.00 65 1 0.0 -0.11 1.89
El Salvador 0.0 22 1261 1.3 3.40 46 1 0.0 -0.04 2.04
Finland 3.4 5 1397 1.1 2.0 12.4 0.10 2 12.5 -0.22 0.26
France 0.000 0.001 0.001 2.4 119 2679 2.8 21.0 6.2 -1.10 100 2 21.0 -0.09 0.36
Germany 0.007 0.011 0.016 24.1 316 2410 5.9 48.2 16.9 0.00 100 2 6.4 -0.43 0.14
Greece 0.060 0.044 0.043 6.4 16 1895 1.2 74.8 -2.30 90 2 0.0 -0.23 0.29
Hungary 0.020 0.005 0.004 5.6 9 836 3.8 15.1 -0.50 100 1 -0.11 -0.38
Iceland 0.013 0.039 0.012 3.7 0.1 0.4 0.0 -0.13 0.92
India 5.0 5 856 1.4 42.9 0.00 80 0 -0.22 1.64
Indonesia 0.7 9 1468 1.4 0.7 1.00 71 1 0.0 -0.11 1.43
Ireland 0.006 0.004 0.007 2.9 42 5514 1.3 4.9 -2.60 2 0.0 0.06 0.66
Israel 29.6 194 2963 7.0 108.8 109.1 0.00 2 0.0 -1.34 2.21
Italy 0.013 0.018 3.3 288 2280 3.1 35.3 40.0 -0.10 2 0.0 -0.12 -0.01
Japan 21.1 482 4168 10.3 16.6 7.0 0.10 2 524.0 -0.11 0.20
Jordan 15 544 0.8 144.1 70.7 2.50 100 1 0.0 -1.30 3.02
Korea 0.040 0.030 36.2 274 5291 41.7 0.20 2 -0.12 0.83
Malaysia 0.7 32 6375 1.3 2.50 2 0.0 -0.37 2.02
Mauritius 3.4 173 3174 33.2 0.00 1 0.0 -0.27 0.78
Mexico 0.4 27 538 0.3 21.7 16.9 0.90 1 -0.19 1.63
Netherlands 0.010 0.035 0.023 29.5 414 5923 8.2 78.1 25.3 0.00 100 2 0.3 -0.25 0.42
New Zealand 1.7 72 4247 0.6 -0.60 1 0.0 -0.76 1.01
Norway 0.001 0.005 0.009 1.0 53 2138 1.2 0.5 0.1 -0.20 4 0.0 0.02 0.53
Peru 0.0 11 453 15.3 0.7 0.30 57 1 0.0 -0.01 1.73
Philippines 0.5 19 1193 2.2 3.60 1 0.0 -0.27 2.11
Poland 0.021 0.009 0.006 24.6 81 1074 3.0 24.9 6.7 -0.10 97 1 0.0 -0.18 0.08
Portugal 0.008 0.007 0.007 3.7 111 1198 4.3 19.2 60.1 -0.80 2 0.0 0.06 0.04
Russia 0.001 0.000 1.0 5 129 0.4 1.8 0.0 0.00 100 2 -0.13 -0.16
Singapore 0.1 2176 50940 143.4 0.00 3 0.0 -0.49 1.43
Slovak 0.013 0.009 0.006 8.1 69 660 3.4 5.8 -0.10 100 1 -0.25 0.12
Republic
South Africa 13.7 25 511 1.0 29.7 37.3 0.20 1 -0.44 1.49
Spain 0.011 0.006 0.006 2.8 95 1285 1.7 27.9 26.6 0.00 2 37.5 -0.10 0.03
Sweden 0.001 0.004 0.005 1.2 47 1121 1.1 1.7 3.0 0.00 100 2 23.6 -0.31 0.25
Switzerland 0.002 0.009 0.013 0.1 226 3058 8.2 2.8 35.1 0.00 2 2.2 -0.22 0.67
Thailand 1.9 32 873 29.0 1.6 2.70 2 0.0 -0.13 0.93
Turkey 0.001 2.2 16 678 0.6 16.1 31.5 0.00 1 0.0 -0.10 1.66
Ukraine 0.007 0.002 8.4 20 277 2.4 48.9 21.1 -0.10 1 -0.21 -0.38
United 0.025 0.025 0.024 18.5 263 3700 7.5 16.6 27.6 -0.50 100 1 150.5 -0.08 0.18
Kingdom
United 0.010 0.011 0.012 12.4 120 1134 1.5 19.0 7.3 -0.30 3 8.3 -0.16 0.83States
Venezuela 0.1 14 1024 0.7 1.10 1 0.0 -0.25 2.02
Vietnam 1.2 2593 7.7 1.40 45 1 0.0 -0.49 1.55
Zimbabwe 1.0 3 554 0.2 8.7 0.60 100 0 0.0 -0.53 1.42
SO
2em
issi
ons
per
po
pula
ted
land
are
a
NO
em
isis
ons
per
popu
late
d la
nd a
rea
VO
Cs
emis
sion
s pe
rpo
pula
ted
land
are
a
Coa
l con
sum
ptio
n pe
r po
pula
ted
land
are
a
Tota
l veh
icle
s pe
r po
pula
ted
land
are
a
Fer
tiliz
er u
sed
per
hect
are
of a
rabl
e la
nd
Indu
stria
l org
anic
pol
luta
nts
per
land
are
a
Fre
shw
ater
with
draw
als
aspe
rcen
t of
ren
ewab
lere
sour
ces
Gro
undw
ater
with
draw
als
asa
perc
ent
annu
al r
echa
rge
Def
ores
tatio
n
Per
cent
age
urba
n ho
useh
olds
with
gar
bage
co
llect
ion
Con
sum
ptio
n pr
essu
re p
erca
pita
Spe
nt n
ucle
ar f
uel a
risin
gspe
r ca
pita
Cha
nge
in g
row
th r
ate,
1990
-95
and
1995
-00
Gro
wth
rat
e 19
95-0
0
EcosystemStress
Waste Production andConsumption Pressure
PopulationWater Pollution and
ConsumptionAir Pollution
Note: See data tables on pages 22 thru 32 for full description of variables.
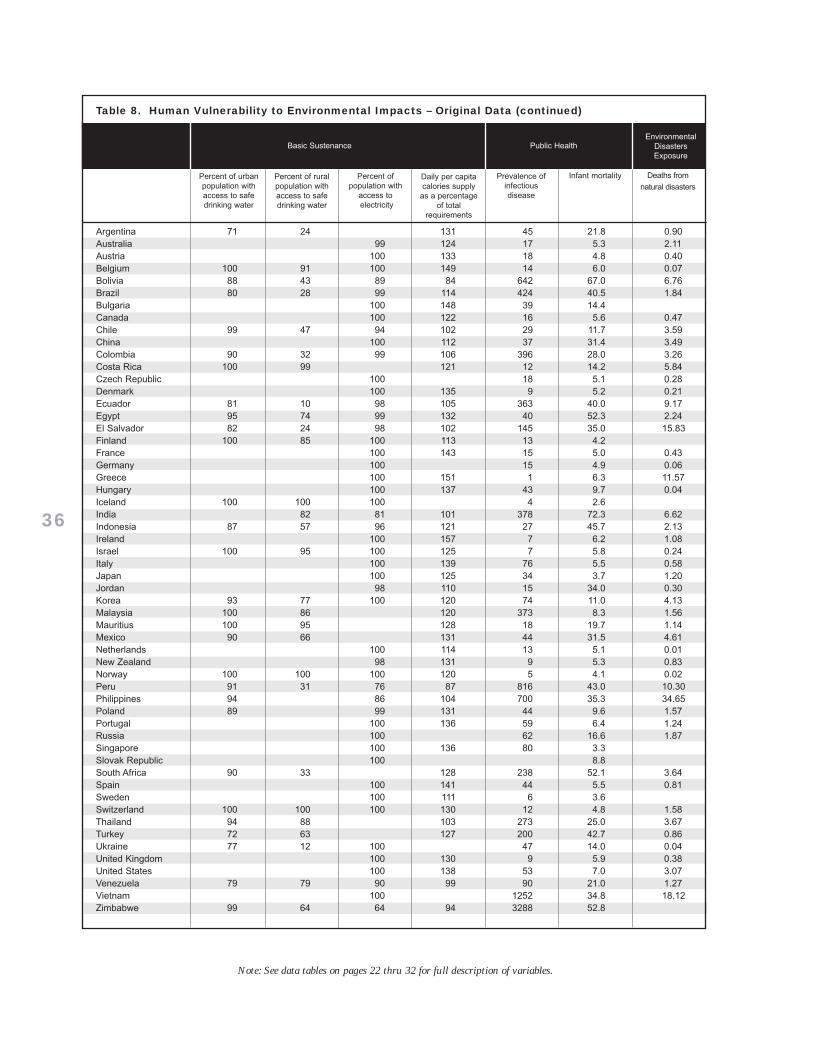
36
Deaths from
natural disasters
Infant mortalityPrevalence ofinfectious disease
Daily per capitacalories supply
as a percentageof total
requirements
Percent of population with
access toelectricity
Percent of ruralpopulation withaccess to safedrinking water
Percent of urban population withaccess to safedrinking water
Table 8. Human Vulnerability to Environmental Impacts – Original Data (continued)
Basic Sustenance Public Health
Argentina 71 24 131 45 21.8 0.90Australia 99 124 17 5.3 2.11Austria 100 133 18 4.8 0.40Belgium 100 91 100 149 14 6.0 0.07Bolivia 88 43 89 84 642 67.0 6.76Brazil 80 28 99 114 424 40.5 1.84 Bulgaria 100 148 39 14.4Canada 100 122 16 5.6 0.47Chile 99 47 94 102 29 11.7 3.59China 100 112 37 31.4 3.49Colombia 90 32 99 106 396 28.0 3.26Costa Rica 100 99 121 12 14.2 5.84Czech Republic 100 18 5.1 0.28Denmark 100 135 9 5.2 0.21Ecuador 81 10 98 105 363 40.0 9.17Egypt 95 74 99 132 40 52.3 2.24El Salvador 82 24 98 102 145 35.0 15.83Finland 100 85 100 113 13 4.2France 100 143 15 5.0 0.43Germany 100 15 4.9 0.06Greece 100 151 1 6.3 11.57Hungary 100 137 43 9.7 0.04Iceland 100 100 100 4 2.6India 82 81 101 378 72.3 6.62Indonesia 87 57 96 121 27 45.7 2.13Ireland 100 157 7 6.2 1.08Israel 100 95 100 125 7 5.8 0.24Italy 100 139 76 5.5 0.58Japan 100 125 34 3.7 1.20Jordan 98 110 15 34.0 0.30Korea 93 77 100 120 74 11.0 4.13Malaysia 100 86 120 373 8.3 1.56Mauritius 100 95 128 18 19.7 1.14Mexico 90 66 131 44 31.5 4.61Netherlands 100 114 13 5.1 0.01New Zealand 98 131 9 5.3 0.83Norway 100 100 100 120 5 4.1 0.02Peru 91 31 76 87 816 43.0 10.30Philippines 94 86 104 700 35.3 34.65Poland 89 99 131 44 9.6 1.57Portugal 100 136 59 6.4 1.24Russia 100 62 16.6 1.87Singapore 100 136 80 3.3Slovak Republic 100 8.8South Africa 90 33 128 238 52.1 3.64Spain 100 141 44 5.5 0.81Sweden 100 111 6 3.6Switzerland 100 100 100 130 12 4.8 1.58Thailand 94 88 103 273 25.0 3.67Turkey 72 63 127 200 42.7 0.86Ukraine 77 12 100 47 14.0 0.04United Kingdom 100 130 9 5.9 0.38United States 100 138 53 7.0 3.07Venezuela 79 79 90 99 90 21.0 1.27Vietnam 100 1252 34.8 18.12Zimbabwe 99 64 64 94 3288 52.8
EnvironmentalDisastersExposure
Note: See data tables on pages 22 thru 32 for full description of variables.
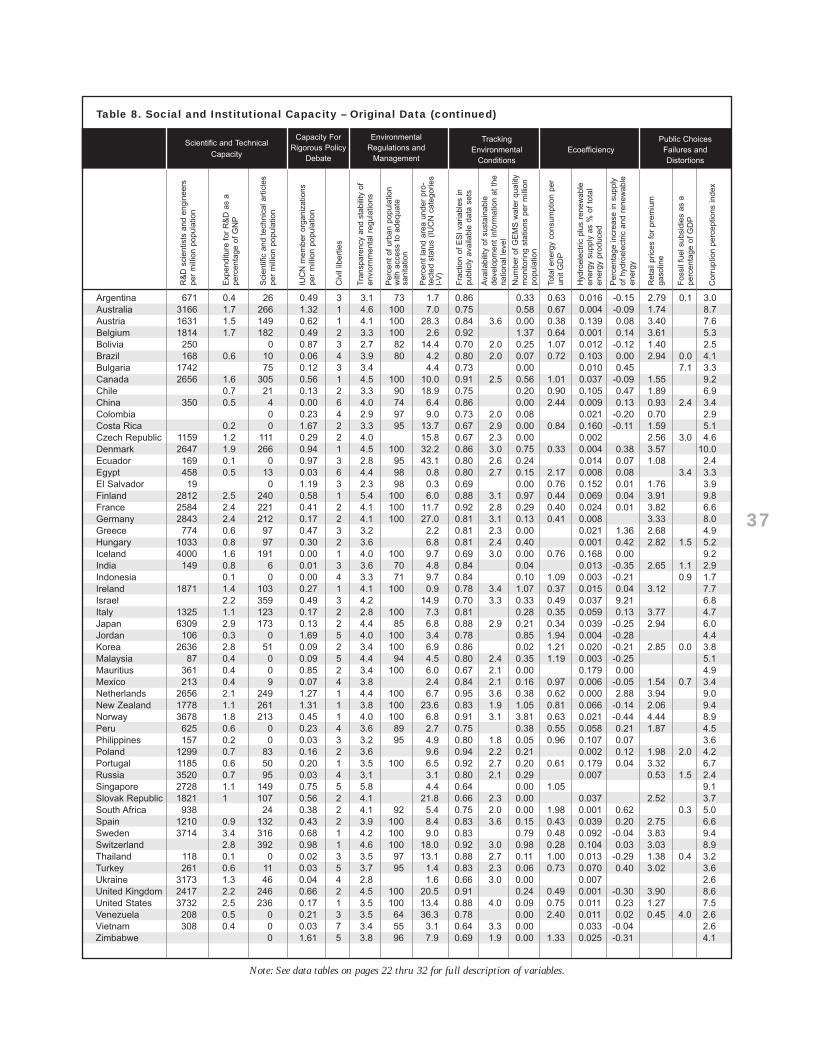
37
R&
D s
cien
tists
and
eng
inee
rspe
r m
illio
n po
pula
tion
Exp
endi
ture
for
R&
D a
s a
perc
enta
ge o
f G
NP
Sci
entif
ic a
nd t
echn
ical
art
icle
spe
r m
illio
n po
pula
tion
IUC
N m
embe
r or
gani
zatio
nspe
r m
illio
n po
pula
tion
Civ
il lib
ertie
s
Tra
nspa
renc
y an
d st
abili
ty o
fen
vior
nmen
tal r
egul
atio
ns
Per
cent
of
urba
n po
pula
tion
with
acc
ess
to a
dequ
ate
sani
tatio
n
Per
cent
land
are
a un
der
pro-
tect
ed s
tatu
s (I
UC
N c
ateg
orie
sI-
V)
Fra
ctio
n of
ES
I va
riabl
es in
publ
icly
ava
ilabl
e da
ta s
ets
Ava
ilabi
lity
of s
usta
inab
lede
velo
pmen
t in
form
atio
n at
the
natio
nal l
evel
Num
ber
of G
EM
S w
ater
qua
lity
mon
itorin
g st
atio
ns p
er m
illio
npo
pula
tion
Tota
l ene
rgy
cons
umpt
ion
per
unit
GD
P
Hyd
roel
ectr
ic p
lus
rene
wab
leen
ergy
sup
ply
as %
of
tota
len
ergy
pro
duce
d
Per
cent
age
incr
ease
in s
uppl
yof
hyd
roel
ectr
ic a
nd r
enew
able
ener
gy
Ret
ail p
rices
for
pre
miu
m
gaso
line
Fos
sil f
uel s
ubsi
dies
as
a pe
rcen
tage
of
GD
P
Cor
rupt
ion
perc
eptio
ns in
dex
Note: See data tables on pages 22 thru 32 for full description of variables.
Scientific and Technical
Capacity
Capacity ForRigorous Policy
Debate
EnvironmentalRegulations and
Management
TrackingEnvironmental
ConditionsEcoefficiency
Public ChoicesFailures andDistortions
Table 8. Social and Institutional Capacity – Original Data (continued)
Argentina 671 0.4 26 0.49 3 3.1 73 1.7 0.86 0.33 0.63 0.016 -0.15 2.79 0.1 3.0Australia 3166 1.7 266 1.32 1 4.6 100 7.0 0.75 0.58 0.67 0.004 -0.09 1.74 8.7Austria 1631 1.5 149 0.62 1 4.1 100 28.3 0.84 3.6 0.00 0.38 0.139 0.08 3.40 7.6Belgium 1814 1.7 182 0.49 2 3.3 100 2.6 0.92 1.37 0.64 0.001 0.14 3.61 5.3Bolivia 250 0 0.87 3 2.7 82 14.4 0.70 2.0 0.25 1.07 0.012 -0.12 1.40 2.5Brazil 168 0.6 10 0.06 4 3.9 80 4.2 0.80 2.0 0.07 0.72 0.103 0.00 2.94 0.0 4.1Bulgaria 1742 75 0.12 3 3.4 4.4 0.73 0.00 0.010 0.45 7.1 3.3Canada 2656 1.6 305 0.56 1 4.5 100 10.0 0.91 2.5 0.56 1.01 0.037 -0.09 1.55 9.2Chile 0.7 21 0.13 2 3.3 90 18.9 0.75 0.20 0.90 0.105 0.47 1.89 6.9China 350 0.5 4 0.00 6 4.0 74 6.4 0.86 0.00 2.44 0.009 0.13 0.93 2.4 3.4Colombia 0 0.23 4 2.9 97 9.0 0.73 2.0 0.08 0.021 -0.20 0.70 2.9Costa Rica 0.2 0 1.67 2 3.3 95 13.7 0.67 2.9 0.00 0.84 0.160 -0.11 1.59 5.1Czech Republic 1159 1.2 111 0.29 2 4.0 15.8 0.67 2.3 0.00 0.002 2.56 3.0 4.6Denmark 2647 1.9 266 0.94 1 4.5 100 32.2 0.86 3.0 0.75 0.33 0.004 0.38 3.57 10.0Ecuador 169 0.1 0 0.97 3 2.8 95 43.1 0.80 2.6 0.24 0.014 0.07 1.08 2.4Egypt 458 0.5 13 0.03 6 4.4 98 0.8 0.80 2.7 0.15 2.17 0.008 0.08 3.4 3.3El Salvador 19 0 1.19 3 2.3 98 0.3 0.69 0.00 0.76 0.152 0.01 1.76 3.9Finland 2812 2.5 240 0.58 1 5.4 100 6.0 0.88 3.1 0.97 0.44 0.069 0.04 3.91 9.8France 2584 2.4 221 0.41 2 4.1 100 11.7 0.92 2.8 0.29 0.40 0.024 0.01 3.82 6.6Germany 2843 2.4 212 0.17 2 4.1 100 27.0 0.81 3.1 0.13 0.41 0.008 3.33 8.0Greece 774 0.6 97 0.47 3 3.2 2.2 0.81 2.3 0.00 0.021 1.36 2.68 4.9Hungary 1033 0.8 97 0.30 2 3.6 6.8 0.81 2.4 0.40 0.001 0.42 2.82 1.5 5.2Iceland 4000 1.6 191 0.00 1 4.0 100 9.7 0.69 3.0 0.00 0.76 0.168 0.00 9.2India 149 0.8 6 0.01 3 3.6 70 4.8 0.84 0.04 0.013 -0.35 2.65 1.1 2.9Indonesia 0.1 0 0.00 4 3.3 71 9.7 0.84 0.10 1.09 0.003 -0.21 0.9 1.7Ireland 1871 1.4 103 0.27 1 4.1 100 0.9 0.78 3.4 1.07 0.37 0.015 0.04 3.12 7.7Israel 2.2 359 0.49 3 4.2 14.9 0.70 3.3 0.33 0.49 0.037 9.21 6.8Italy 1325 1.1 123 0.17 2 2.8 100 7.3 0.81 0.28 0.35 0.059 0.13 3.77 4.7Japan 6309 2.9 173 0.13 2 4.4 85 6.8 0.88 2.9 0.21 0.34 0.039 -0.25 2.94 6.0Jordan 106 0.3 0 1.69 5 4.0 100 3.4 0.78 0.85 1.94 0.004 -0.28 4.4Korea 2636 2.8 51 0.09 2 3.4 100 6.9 0.86 0.02 1.21 0.020 -0.21 2.85 0.0 3.8Malaysia 87 0.4 0 0.09 5 4.4 94 4.5 0.80 2.4 0.35 1.19 0.003 -0.25 5.1Mauritius 361 0.4 0 0.85 2 3.4 100 6.0 0.67 2.1 0.00 0.179 0.00 4.9Mexico 213 0.4 9 0.07 4 3.8 2.4 0.84 2.1 0.16 0.97 0.006 -0.05 1.54 0.7 3.4Netherlands 2656 2.1 249 1.27 1 4.4 100 6.7 0.95 3.6 0.38 0.62 0.000 2.88 3.94 9.0New Zealand 1778 1.1 261 1.31 1 3.8 100 23.6 0.83 1.9 1.05 0.81 0.066 -0.14 2.06 9.4Norway 3678 1.8 213 0.45 1 4.0 100 6.8 0.91 3.1 3.81 0.63 0.021 -0.44 4.44 8.9Peru 625 0.6 0 0.23 4 3.6 89 2.7 0.75 0.38 0.55 0.058 0.21 1.87 4.5Philippines 157 0.2 0 0.03 3 3.2 95 4.9 0.80 1.8 0.05 0.96 0.107 0.07 3.6Poland 1299 0.7 83 0.16 2 3.6 9.6 0.94 2.2 0.21 0.002 0.12 1.98 2.0 4.2Portugal 1185 0.6 50 0.20 1 3.5 100 6.5 0.92 2.7 0.20 0.61 0.179 0.04 3.32 6.7Russia 3520 0.7 95 0.03 4 3.1 3.1 0.80 2.1 0.29 0.007 0.53 1.5 2.4Singapore 2728 1.1 149 0.75 5 5.8 4.4 0.64 0.00 1.05 9.1Slovak Republic 1821 1 107 0.56 2 4.1 21.8 0.66 2.3 0.00 0.037 2.52 3.7South Africa 938 24 0.38 2 4.1 92 5.4 0.75 2.0 0.00 1.98 0.001 0.62 0.3 5.0Spain 1210 0.9 132 0.43 2 3.9 100 8.4 0.83 3.6 0.15 0.43 0.039 0.20 2.75 6.6Sweden 3714 3.4 316 0.68 1 4.2 100 9.0 0.83 0.79 0.48 0.092 -0.04 3.83 9.4Switzerland 2.8 392 0.98 1 4.6 100 18.0 0.92 3.0 0.98 0.28 0.104 0.03 3.03 8.9Thailand 118 0.1 0 0.02 3 3.5 97 13.1 0.88 2.7 0.11 1.00 0.013 -0.29 1.38 0.4 3.2Turkey 261 0.6 11 0.03 5 3.7 95 1.4 0.83 2.3 0.06 0.73 0.070 0.40 3.02 3.6Ukraine 3173 1.3 46 0.04 4 2.8 1.6 0.66 3.0 0.00 0.007 2.6United Kingdom 2417 2.2 246 0.66 2 4.5 100 20.5 0.91 0.24 0.49 0.001 -0.30 3.90 8.6United States 3732 2.5 236 0.17 1 3.5 100 13.4 0.88 4.0 0.09 0.75 0.011 0.23 1.27 7.5Venezuela 208 0.5 0 0.21 3 3.5 64 36.3 0.78 0.00 2.40 0.011 0.02 0.45 4.0 2.6Vietnam 308 0.4 0 0.03 7 3.4 55 3.1 0.64 3.3 0.00 0.033 -0.04 2.6Zimbabwe 0 1.61 5 3.8 96 7.9 0.69 1.9 0.00 1.33 0.025 -0.31 4.1
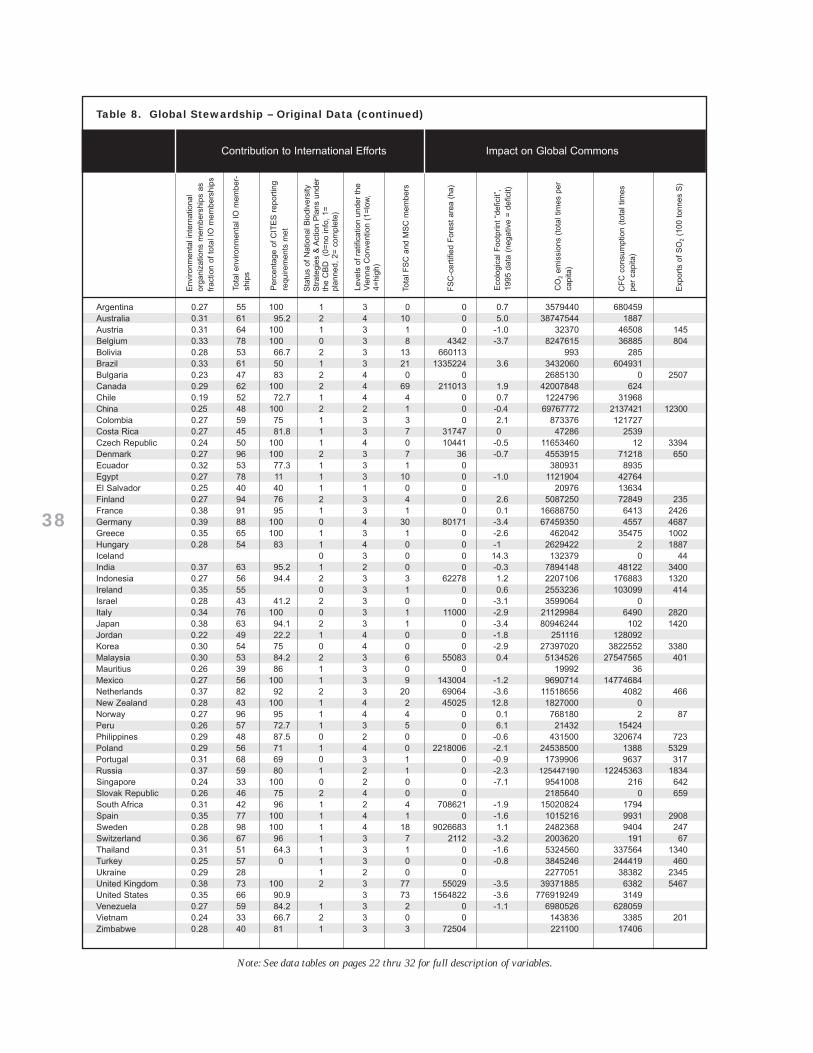
38
Env
ironm
enta
l int
erna
tiona
lor
gani
zatio
ns m
embe
rshi
ps a
sfr
actio
n of
tot
al I
O m
embe
rshi
ps
Tota
l env
ironm
enta
l IO
mem
ber-
ship
s
Per
cent
age
of C
ITE
S r
epor
ting
requ
irem
ents
met
Sta
tus
of N
atio
nal B
iodi
vers
ityS
trat
egie
s &
Act
ion
Pla
ns u
nder
the
CB
D
(0=
no in
fo,
1=pl
anne
d, 2
= c
ompl
ete)
Leve
ls o
f ra
tific
atio
n un
der
the
Vie
nna
Con
vent
ion
(1=
low
,4=
high
)
Tota
l FS
C a
nd M
SC
mem
bers
FS
C-c
ertif
ied
For
est
area
(ha
)
Eco
logi
cal F
ootp
rint
“def
icit”
,19
95 d
ata
(neg
ativ
e =
def
icit)
CO
2em
issi
ons
(tot
al t
imes
per
capi
ta)
CF
C c
onsu
mpt
ion
(tot
al t
imes
per
capi
ta)
Exp
orts
of
SO
2(1
00 t
onne
s S
)
Table 8. Global Stewardship – Original Data (continued)
Contribution to International Efforts Impact on Global Commons
Argentina 0.27 55 100 1 3 0 0 0.7 3579440 680459Australia 0.31 61 95.2 2 4 10 0 5.0 38747544 1887Austria 0.31 64 100 1 3 1 0 -1.0 32370 46508 145Belgium 0.33 78 100 0 3 8 4342 -3.7 8247615 36885 804Bolivia 0.28 53 66.7 2 3 13 660113 993 285Brazil 0.33 61 50 1 3 21 1335224 3.6 3432060 604931Bulgaria 0.23 47 83 2 4 0 0 2685130 0 2507Canada 0.29 62 100 2 4 69 211013 1.9 42007848 624Chile 0.19 52 72.7 1 4 4 0 0.7 1224796 31968China 0.25 48 100 2 2 1 0 -0.4 69767772 2137421 12300Colombia 0.27 59 75 1 3 3 0 2.1 873376 121727Costa Rica 0.27 45 81.8 1 3 7 31747 0 47286 2539Czech Republic 0.24 50 100 1 4 0 10441 -0.5 11653460 12 3394Denmark 0.27 96 100 2 3 7 36 -0.7 4553915 71218 650Ecuador 0.32 53 77.3 1 3 1 0 380931 8935Egypt 0.27 78 11 1 3 10 0 -1.0 1121904 42764El Salvador 0.25 40 40 1 1 0 0 20976 13634Finland 0.27 94 76 2 3 4 0 2.6 5087250 72849 235France 0.38 91 95 1 3 1 0 0.1 16688750 6413 2426Germany 0.39 88 100 0 4 30 80171 -3.4 67459350 4557 4687Greece 0.35 65 100 1 3 1 0 -2.6 462042 35475 1002Hungary 0.28 54 83 1 4 0 0 -1 2629422 2 1887Iceland 0 3 0 0 14.3 132379 0 44India 0.37 63 95.2 1 2 0 0 -0.3 7894148 48122 3400Indonesia 0.27 56 94.4 2 3 3 62278 1.2 2207106 176883 1320Ireland 0.35 55 0 3 1 0 0.6 2553236 103099 414Israel 0.28 43 41.2 2 3 0 0 -3.1 3599064 0Italy 0.34 76 100 0 3 1 11000 -2.9 21129984 6490 2820Japan 0.38 63 94.1 2 3 1 0 -3.4 80946244 102 1420Jordan 0.22 49 22.2 1 4 0 0 -1.8 251116 128092Korea 0.30 54 75 0 4 0 0 -2.9 27397020 3822552 3380Malaysia 0.30 53 84.2 2 3 6 55083 0.4 5134526 27547565 401Mauritius 0.26 39 86 1 3 0 0 19992 36Mexico 0.27 56 100 1 3 9 143004 -1.2 9690714 14774684Netherlands 0.37 82 92 2 3 20 69064 -3.6 11518656 4082 466New Zealand 0.28 43 100 1 4 2 45025 12.8 1827000 0Norway 0.27 96 95 1 4 4 0 0.1 768180 2 87Peru 0.26 57 72.7 1 3 5 0 6.1 21432 15424Philippines 0.29 48 87.5 0 2 0 0 -0.6 431500 320674 723Poland 0.29 56 71 1 4 0 2218006 -2.1 24538500 1388 5329Portugal 0.31 68 69 0 3 1 0 -0.9 1739906 9637 317Russia 0.37 59 80 1 2 1 0 -2.3 125447190 12245363 1834Singapore 0.24 33 100 0 2 0 0 -7.1 9541008 216 642Slovak Republic 0.26 46 75 2 4 0 0 2185640 0 659South Africa 0.31 42 96 1 2 4 708621 -1.9 15020824 1794Spain 0.35 77 100 1 4 1 0 -1.6 1015216 9931 2908Sweden 0.28 98 100 1 4 18 9026683 1.1 2482368 9404 247Switzerland 0.36 67 96 1 3 7 2112 -3.2 2003620 191 67Thailand 0.31 51 64.3 1 3 1 0 -1.6 5324560 337564 1340Turkey 0.25 57 0 1 3 0 0 -0.8 3845246 244419 460Ukraine 0.29 28 1 2 0 0 2277051 38382 2345United Kingdom 0.38 73 100 2 3 77 55029 -3.5 39371885 6382 5467United States 0.35 66 90.9 3 73 1564822 -3.6 776919249 3149Venezuela 0.27 59 84.2 1 3 2 0 -1.1 6980526 628059Vietnam 0.24 33 66.7 2 3 0 0 143836 3385 201Zimbabwe 0.28 40 81 1 3 3 72504 221100 17406
Note: See data tables on pages 22 thru 32 for full description of variables.
39
EMEP (Cooperative Programme for Monitoring andEvaluation of the Long-Range Transmission of AirPollutants in Europe), 1998.http://www.emep.int/fluxes.html.
European Environment Agency (EEA), Europe’s Environment:The Dobrís Assessment. Luxembourg: Office for OfficialPublications of the European Communities, 1995.
Forest Stewardship Council (FSC), Forests Certified by FSC-Accredited Certification Bodies, Document 5.3.3.http://www.fscoax.org/html/5-3-3.html, 1999.
Freedom House, Civil Liberties 1998-99. http://www.freedomhouse.org/survey99/, 1999.
International Institute for Applied Systems Analysis (IIASA),RAINS-ASIA: An assessment model for air pollution in Asia.http://www.iiasa.ac.at/~rains/asia/, 1995.
National Research Council (NRC), Our Common Journey: Atransition toward sustainability. Washington: NationalAcademy Press, 1999.
National Science Board, Science and Engineering Indicators –1998. Arlington, VA: National Science Foundation (NSF), 1998.
Office of U.S. Foreign Disaster Assistance (OFDA) andCenter for Research on the Epidemiology of Disasters (CRED),EM-DAT: The OFDA/CRED International Disaster Database.http://www.md.ucl.ac.be/cred/, 1998.
Organisation for Economic Co-operation and Development(OECD), The State of the Environment. Paris: OECD, 1991.
Organisation for Economic Co-operation and Development(OECD), ENV Monograph No. 79: Indicators for the integrationof environmental concerns into energy policies. Paris: OECD,1993.
Population Reference Bureau (PRB), World Population DataSheet 1999. Washington: PRB, 1999.
Redefining Progress, Footprint of Nations Ranking List.http://www.rprogress.org/resources/nip/ef/ef_nations_table_acres.html, 1995.
Transparency International, 1999 Corruption Perceptions Index.http://www.transparency.org/documents/index.html#cpi, 1999.
Union of International Associations (UIA), Yearbook ofInternational Organizations. Brussels:UIA, 1999.
United Nations, Agenda 21-Institutional Issues.http://www.un.org/esa/agenda21/natlinfo/agenda21/issue/inst.htm#info.
United Nations Children’s Fund, (UNICEF), State of theWorld’s Children 2000. http://www.unicef.org/sowc00/.
United Nations Educational, Scientific and CulturalOrganization (UNESCO), Statistical Yearbook 1998, Paris:UNESCO, 1998.
United Nations Environment Programme (UNEP), GlobalEnvironmental Outlook. New York: Oxford University Press,1997.
United Nations Environment Programme (UNEP), GlobalEnvironmental Monitoring System/Water Quality MonitoringStations. http://www.cciw.ca/gems/summary94.
United Nations Environment Programme (UNEP), Productionand Consumption of Ozone Depleting Substances 1986-1998.http://www.unep.org/ozone/DataReport99.htm, 1999.
United Nations Environment Programme (UNEP), GlobalAssessment of Human Induced Soil Degradation (GLASOD):A user’s guide to the global digital database.UNEP/GRID, 1991.
United Nations Environment Programme (UNEP) andNetherlands’ National Institute of Public Health and theEnvironment (RIVM), Data Issues of Global EnvironmentalReporting. Experiences from GEO-2000. RIVM Report402001013, Bilthoven, Netherlands, 1999.
United Nations, World Population Prospects: The 1998Revision. New York: United Nations, 1998.
U.S. Energy Information Administration, Data for 1980-1997, http://www.eia.doe.gov.
U.S. Intragency Working Group on Sustainable DevelopmentIndicators, Sustainable Development in the United States: AnExperimental Set of Indicators. Washington: U.S. IntragencyWorking Group on Sustainable Development Indicators, 1998.
World Bank, Expanding the Measure of Wealth: Indicators ofenvironmentally sustainable development. Washington: TheWorld Bank, 1997.
World Bank, World Development Indicators 1997.Washington: The World Bank, 1997.
World Bank, World Development Indicators 1999.Washington: The World Bank, 1999.
World Economic Forum, 1999 Global Competitiveness Reportof the World Economic Forum. Geneva: WEF, 1999.
World Resources Institute (WRI), World Resources 1998-99:A Guide to the Global Environment. New York: OxfordUniversity Press, 1998.
World Wide Fund for Nature (WWF), Living Planet Report1998. Gland, Switzerland: WWF, 1998.
References
ˇ ˇ