pillar 3 and regulatory disclosures 4q18 - credit suisse...pillar 3 and regulatory disclosures 4q18...
TRANSCRIPT
Credit Suisse Group AG
Pillar 3 and regu la tory disclosures
4Q18

For purposes of this report, unless the context otherwise requires, the terms “Credit Suisse,” the “Group,” “we,” “us” and “our” mean Credit Suisse Group AG and its consolidated subsidiaries. The business of Credit Suisse AG, the direct bank subsidiary of the Group, is substantially similar to the Group, and we use these terms to refer to both when the subject is the same or substantially similar. We use the term the “Bank” when we are only referring to Credit Suisse AG and its consolidated subsidiaries.
Abbreviations are explained in the List of abbreviations in the back of this report.
Publications referenced in this report, whether via website links or otherwise, are not incorporated into this report.
In various tables, use of “–” indicates not meaningful or not applicable.

1Pillar 3 and regulatory disclosures 4Q18
2 Introduction
4 Swiss capital requirements
6 Overview of risk management
7 Risk-weighted assets
8 Linkagesbetweenfinancialstatements and regulatory exposures
12 Credit risk
44 Counterparty credit risk
54 Securitization
60 Market risk
64 Interest rate risk in the banking book
66 Additional regulatory disclosures
73 List of abbreviations
74 Cautionary statement regarding forward-looking information
Pillar 3 and regulatory disclosures 4Q18Credit Suisse Group AG
2 Introduction
Introduction
GeneralThis report as of December 31, 2018 for the Group is based on the revised Circular 2016/1 “Disclosure – banks” (FINMA circu-lar) issued by the Swiss Financial Market Supervisory Authority FINMA (FINMA) on July 16, 2018. The revised FINMA circular includes the implementation of the revised Pillar 3 disclosure requirements issued by the Basel Committee on Banking Super-vision (BCBS) in March 2017 and requires banks to gradu-ally implement the new requirements from December 31, 2018 onwards.
This report is produced and published quarterly, in accordance with FINMA requirements. The reporting frequency for each dis-closure requirement is either annual, semi-annual or quarterly. This document should be read in conjunction with the Pillar 3 and regulatory disclosures – Credit Suisse Group AG 2Q18 and 3Q18 and the Credit Suisse Annual Report 2018, which includes impor-tant information on regulatory capital, risk management (specific references have been made herein to these documents) and regulatory developments and proposals.
The highest consolidated entity in the Group to which the FINMA circular applies is Credit Suisse Group.
These disclosures were verified and approved internally in line with our board-approved policy on disclosure controls and pro-cedures. The level of internal control processes for these dis-closures is similar to those applied to the Group’s quarterly and annual financial reports. This report has not been audited by the Group’s external auditors.
For certain prescribed table formats where line items have zero balances, such line items have not been presented.
Other regulatory disclosuresIn connection with the implementation of Basel III, certain regula-tory disclosures for the Group and certain of its subsidiaries are required. The Group’s Pillar 3 disclosure, regulatory disclosures,
additional information on capital instruments, including the main features of regulatory capital instruments and total loss-absorbing capacity (TLAC)-eligible instruments that form part of the eligible capital base and TLAC resources, G-SIB financial indicators, reconciliation requirements, leverage ratios and certain liquidity disclosures as well as regulatory disclosures for subsidiaries can be found on our website.
> Refer to credit-suisse.com/regulatorydisclosures for additional information.
Regulatory developmentsIn December 2018, BCBS published the finalized Pillar 3 dis-closure requirements. These requirements, together with the updates published in January 2015 and March 2017, complete the Pillar 3 framework. The revised framework covers three ele-ments. The first element, to be implemented by January 1, 2022, relates to revisions and additions arising from the finalization of the Basel III regulatory reforms in 2017. This element includes revised disclosure regarding credit risk, operational risk, the lever-age ratio and credit valuation adjustment (CVA) risk, risk-weighted assets (RWA) as calculated by the bank’s internal models as compared to the standardized approaches and an overview of risk management, RWA and key prudential metrics. As a second ele-ment, the updated framework sets out new disclosure require-ments on asset encumbrance designed to provide a preliminary overview of the extent to which a bank’s assets remain available to creditors in the event of an insolvency. As a third element, the revised framework introduces new disclosure requirements relating to constraints on capital distributions, when required by national supervisors at the jurisdictional level. The second and third elements must be implemented by end-2020.
Location of disclosuresThis report provides the Pillar 3 and regulatory disclosures required by the FINMA circular for the Group to the extent that these disclosures are not included in the Credit Suisse Annual Report 2018 or in the regulatory disclosures on our website.
> Refer to “Annual Report” under credit-suisse.com/ar for disclosures included in the Credit Suisse Annual Report 2018.

3Introduction
Location of disclosures
FINMA disclosure requirements Location Page number
Overview of risk management, key prudential metrics and risk-weighted assets
Key prudential metrics [Table KM1] Qualitative disclosures: “Treasury, Risk, Balance sheet and Off-balance sheet” 117 – 136
Risk management approach [Table OVA] “Risk management oversight” 143 – 147 “Risk appetite framework” 147 – 150 “Risk coverage and management” 150 – 180
Overview of risk-weighted assets [Table OV1] Qualitative disclosures: “Risk-weighted assets” 131 – 133
Linkages between financial statements and regulatory exposures
Valuation process [Table LIA] “Fair valuations” 70 “Critical accounting estimates – Fair value” 107 “Note 35 – Financial instruments” 359 – 363
Composition of capital and TLAC
Differences in basis of consolidation [Table CC2] List of significant subsidiaries and associated entities:
“Note 40 – Significant subsidiaries and equity method investments” 400 – 402 Changes in scope of consolidation:
“Note 3 – Business developments, significant shareholders and subsequent events” 288
Main features of regulatory capital instruments Refer to “Capital instruments” under
and TLAC-eligible instruments [Table CCA] credit-suisse.com/regulatorydisclosures 1
Macroprudential supervisor measures
Disclosure of G-SIBs indicators [Table GSIB1] Refer to “G-SIB Indicators” under credit-suisse.com/regulatorydisclosures 1
Credit risk
General qualitative information [Table CRA] “Credit risk” 158 – 161
Additional disclosure related to credit quality “Note 1 – Summary of significant accounting policies” 279 – 281 of assets [Table CRB a), b), c) and d)] “Note 19 – Loans, allowance for loan losses and credit quality” 300 – 306
Qualitative disclosure requirements related to credit “Derivative instruments” 178 – 180 risk mitigation techniques [Table CRC a)]: Netting “Note 1 – Summary of significant accounting policies” 277 – 278 “Note 27 – Offsetting of financial assets and financial liabilities” 313 – 316
Counterparty credit risk
Qualitative disclosure requirements [Table CCRA] Transaction rating, credit limits and provisioning: “Credit risk” 158 – 161 Effect of a credit rating downgrade: “Credit ratings” 120 – 121
Securitization
Qualitative disclosure requirements [Table SECA] “Note 34 – Transfers of financial assets and variable interest entities” 349 – 358
Market risk
Qualitative disclosure requirements [Table MRA] “Market risk” 155 – 158 “Market risk review” 170 – 173 “Note 1 – Summary of significant accounting policies” 277 – 278 “Note 32 – Derivatives and hedging activities” 339 – 342
Leverage metrics
Qualitative disclosures [Table LR2] “Leverage metrics” 134 “Swiss metrics” 135 – 136
Liquidity coverage ratio
Liquidity risk management [Table LIQA] “Liquidity and funding management” 114 – 121
Liquidity Coverage Ratio [Table LIQ1] Qualitative disclosures: “Liquidity metrics” 116 – 117
Corporate Governance
Corporate Governance [Appendix 5] “Corporate Governance” 188 – 230
Remuneration
Remuneration policy [Table REMA] “Compensation” 232 – 263
Remuneration awarded during the financial Senior management: “Executive Board compensation for 2018” 241 – 250 year [table REM1] / Special payments [table REM2] /
Deferred remuneration [table REM3] Other material risk takers: “Group compensation” 255 – 263
Operational risk
Qualitative disclosures [Table ORA] “Operational risk regulatory capital measurement” 165
Special duties of disclosure for systemically important financial institutions and stand-alone banks
List and qualification of alleviations granted [Appendix 4] “FINMA Decrees” 124
1 The disclosure will be available by the end of April 2019.

4 Swiss capital requirements
Swiss capital requirements
FINMA requires the Group to fully comply with the special requirements for systemically important financial institutions oper-ating internationally. The following tables show the Swiss capital and leverage requirements and metrics as required by FINMA.
> Refer to “Swiss requirements” (pages 123 to 126) and “Swiss metrics” (pages 135 to 136) in III – Treasury, Risk, Balance sheet and Off-balance sheet – Capital management – Regulatory framework in the Credit Suisse Annual Report 2018 for further information on general Swiss requirements and the related metrics.
Swiss capital requirements and metrics Phase-in Look-through
in % in %
end of 4Q18 CHF million of RWA CHF million of RWA
Swiss risk-weighted assets
Swiss risk-weighted assets 285,193 – 285,193 –
Risk-based capital requirements (going-concern) based on Swiss capital ratios
Total 37,439 13.128 41,547 14.568
of which CET1: minimum 15,400 5.4 12,834 4.5
of which CET1: buffer 11,579 4.06 15,686 5.5
of which CET1: countercyclical buffers 763 0.268 763 0.268
of which additional tier 1: minimum 7,415 2.6 9,982 3.5
of which additional tier 1: buffer 2,282 0.8 2,282 0.8
Swiss eligible capital (going-concern)
Swiss CET1 capital and additional tier 1 capital 1 49,443 17.337 45,935 16.107
of which CET1 capital 2 35,719 12.525 35,719 12.525
of which additional tier 1 high-trigger capital instruments 5,615 1.969 5,615 1.969
of which additional tier 1 low-trigger capital instruments 3 4,601 1.613 4,601 1.613
of which tier 2 low-trigger capital instruments 4 3,508 1.23 – –
Risk-based requirement for additional total loss-absorbing capacity (gone-concern) based on Swiss capital ratios
Total according to size and market share (going-concern requirements) 25,382 5 8.9 5 40,783 14.3
Reductions due to rebates in accordance with article 133 of the CAO (4,061) (1.424) (6,525) (2.288)
Reductions due to the holding of additional instruments in the form of convertible capital
in accordance with Art. 132 para 4 CAO 0 0.0 (1,754) (0.615)
Total, net 21,321 7.476 32,504 11.397
Eligible additional total loss-absorbing capacity (gone-concern)
Total 35,678 12.51 37,909 13.292
of which tier 2 low-trigger capital instruments 509 0.178 4,017 1.409
of which non-Basel III-compliant tier 2 capital 1,277 6 0.448 – –
of which bail-in instruments 33,892 11.884 33,892 11.884
Rounding differences may occur.1 Excludes tier 1 capital which is used to fulfill gone-concern requirements.2 Excludes CET1 capital which is used to fulfill gone-concern requirements.3 If issued before July 1, 2016, such capital instruments qualify as additional tier 1 high-trigger capital instruments until their first call date according to the transitional Swiss “Too Big to
Fail” rules.4 If issued before July 1, 2016, such capital instruments qualify as additional tier 1 high-trigger capital instruments no later than December 31, 2019 according to the transitional Swiss
“Too Big to Fail” rules.5 Consists of a base requirement of 8.18%, or CHF 23,329 million, and a surcharge of 0.72%, or CHF 2,053 million.6 Non-Basel III-compliant tier 1/2 capital instruments are subject to phase-out requirements. The amount includes the amortization component of CHF 586 million and the unamortized
component of CHF 691 million.
5Swiss capital requirements
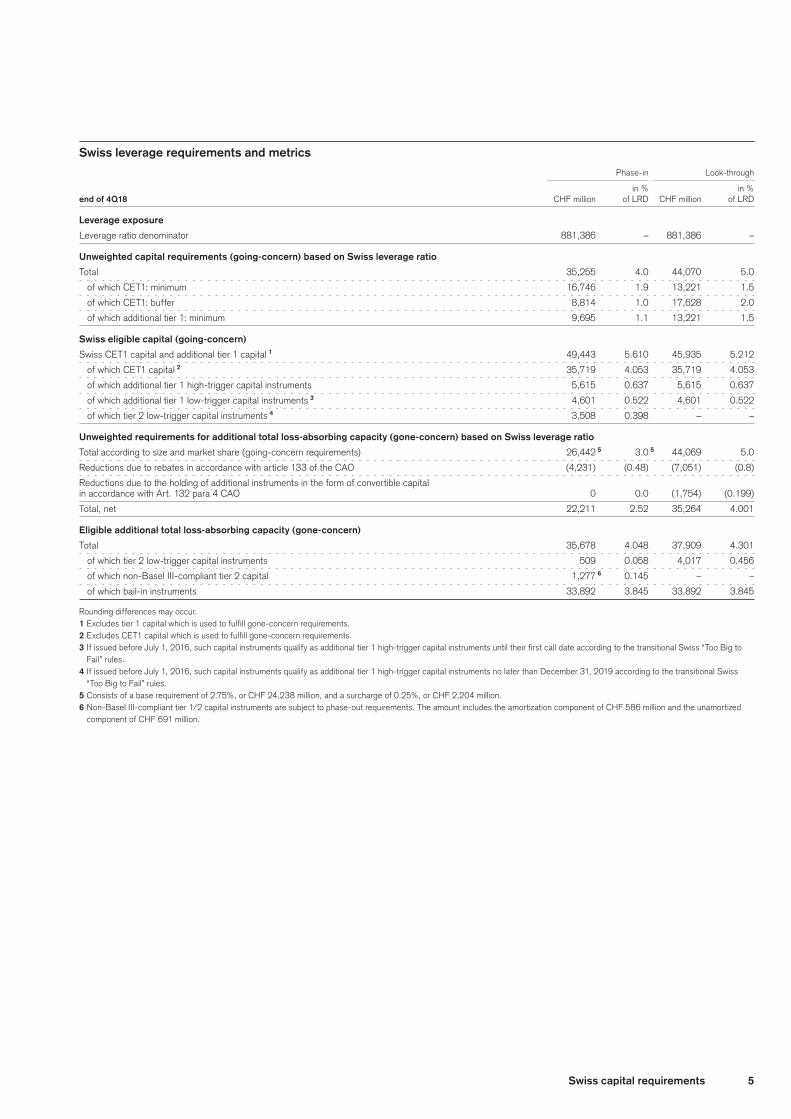
Swiss leverage requirements and metrics Phase-in Look-through
in % in %
end of 4Q18 CHF million of LRD CHF million of LRD
Leverage exposure
Leverage ratio denominator 881,386 – 881,386 –
Unweighted capital requirements (going-concern) based on Swiss leverage ratio
Total 35,255 4.0 44,070 5.0
of which CET1: minimum 16,746 1.9 13,221 1.5
of which CET1: buffer 8,814 1.0 17,628 2.0
of which additional tier 1: minimum 9,695 1.1 13,221 1.5
Swiss eligible capital (going-concern)
Swiss CET1 capital and additional tier 1 capital 1 49,443 5.610 45,935 5.212
of which CET1 capital 2 35,719 4.053 35,719 4.053
of which additional tier 1 high-trigger capital instruments 5,615 0.637 5,615 0.637
of which additional tier 1 low-trigger capital instruments 3 4,601 0.522 4,601 0.522
of which tier 2 low-trigger capital instruments 4 3,508 0.398 – –
Unweighted requirements for additional total loss-absorbing capacity (gone-concern) based on Swiss leverage ratio
Total according to size and market share (going-concern requirements) 26,442 5 3.0 5 44,069 5.0
Reductions due to rebates in accordance with article 133 of the CAO (4,231) (0.48) (7,051) (0.8)
Reductions due to the holding of additional instruments in the form of convertible capital
in accordance with Art. 132 para 4 CAO 0 0.0 (1,754) (0.199)
Total, net 22,211 2.52 35,264 4.001
Eligible additional total loss-absorbing capacity (gone-concern)
Total 35,678 4.048 37,909 4.301
of which tier 2 low-trigger capital instruments 509 0.058 4,017 0.456
of which non-Basel III-compliant tier 2 capital 1,277 6 0.145 – –
of which bail-in instruments 33,892 3.845 33,892 3.845
Rounding differences may occur.1 Excludes tier 1 capital which is used to fulfill gone-concern requirements.2 Excludes CET1 capital which is used to fulfill gone-concern requirements.3 If issued before July 1, 2016, such capital instruments qualify as additional tier 1 high-trigger capital instruments until their first call date according to the transitional Swiss “Too Big to
Fail” rules.4 If issued before July 1, 2016, such capital instruments qualify as additional tier 1 high-trigger capital instruments no later than December 31, 2019 according to the transitional Swiss
“Too Big to Fail” rules.5 Consists of a base requirement of 2.75%, or CHF 24,238 million, and a surcharge of 0.25%, or CHF 2,204 million.6 Non-Basel III-compliant tier 1/2 capital instruments are subject to phase-out requirements. The amount includes the amortization component of CHF 586 million and the unamortized
component of CHF 691 million.
6 Overview of risk management
Overview of risk management
GeneralFundamental to our business is the prudent taking of risk in line with our strategic priorities. The primary objectives of risk man-agement are to protect our financial strength and reputation, while ensuring that capital is well deployed to support business activities. Our risk management framework is based on transpar-ency, management accountability and independent oversight. Risk management is an integral part of our business planning process with strong involvement of senior management and the Board of Directors. Risk measurement models are reviewed by the Model Risk Management team, an independent validation function, and regularly presented to and approved by the relevant oversight committee.
> Refer to “Risk management oversight” (pages 143 to 147), “Risk appetite framework” (pages 147 to 150) and “Risk coverage and management” (pages 150 to 180) in III – Treasury, Risk, Balance sheet and Off-balance sheet – Risk management in the Credit Suisse Annual Report 2018 for information on risk management oversight including risk culture, risk governance, risk orga-nization, risk types, risk appetite, risk limits, stress testing and strategies/pro-cesses to manage, hedge and mitigate risks.
Risk reportingRisk reporting is performed regularly and there are numerous internal control procedures in place, in particular the standard operating procedures, risk and control assessment and indepen-dent report review. These ensure the reporting and measurement systems are up to date and are working as intended. They cover: validation and authorization of risk measurement data, status summary reports, data reconciliation, independent checks/valida-tion and error reports to capture any failings. Senior management and the Board of Directors are informed about key risk metrics, including Value-at-Risk (VaR), Economic Risk Capital (ERC), key risks and top exposures with the monthly Group Risk Report.
Key risksThe Group is exposed to several key banking risks such as:p Credit risk (refer to section “Credit risk” on pages 12 to 43);p Counterparty credit risk (refer to section “Counterparty credit
risk” on pages 44 to 53);p Securitization risk (refer to section “Securitization risk” on
pages 54 to 59);p Market risk (refer to section “Market risk” on pages 60 to 63);p Interest rate risk in the banking book (refer to section “Interest
rate risk in the banking book” on pages 64 to 65); andp Operational risk.
> Refer to “Operational risk regulatory capital measurement” (page 165) in III – Treasury, Risk, Balance sheet and Off-balance sheet – Risk management – Risk coverage and management in the Credit Suisse Annual Report 2018 for information on operational risk.
The Basel framework describes a range of options for deter-mining the capital requirements in order to provide banks and supervisors the ability to select approaches that are most appro-priate for their operations and their financial market infrastruc-ture. In general, Credit Suisse has adopted the most advanced approaches, which align with the way risk is internally managed and provide the greatest risk sensitivity.
7Risk-weighted assets
Risk-weighted assets
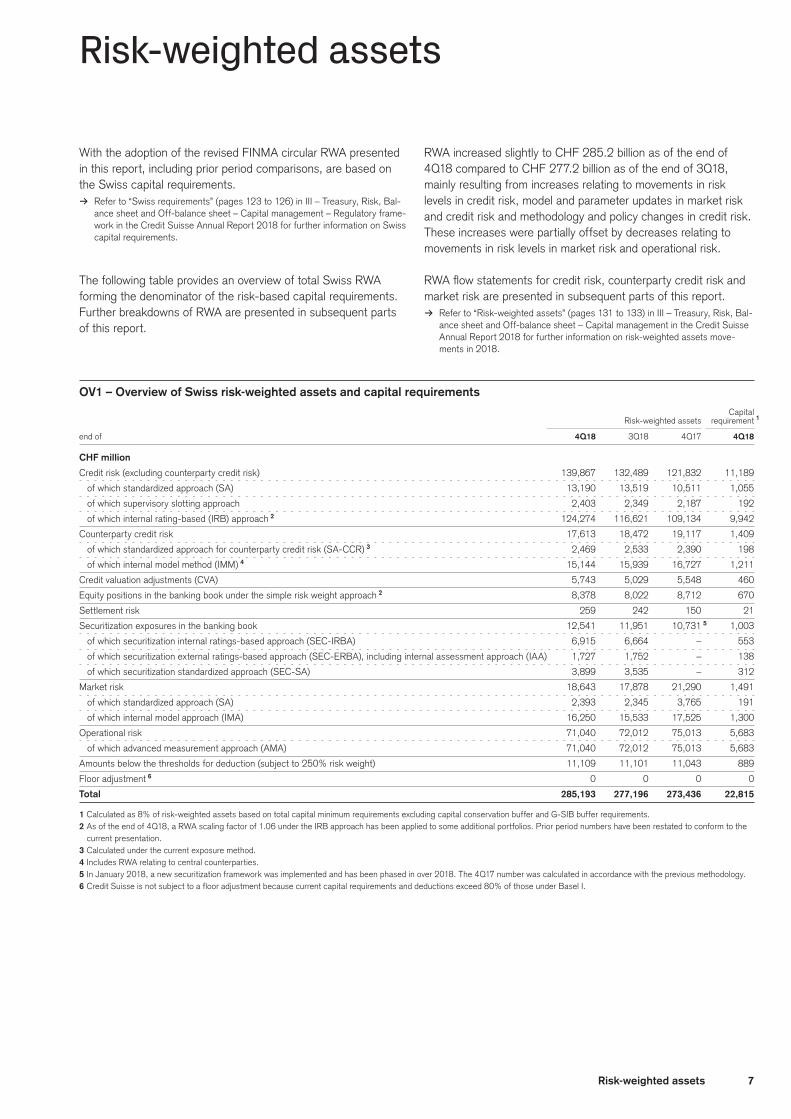
With the adoption of the revised FINMA circular RWA presented in this report, including prior period comparisons, are based on the Swiss capital requirements.
> Refer to “Swiss requirements” (pages 123 to 126) in III – Treasury, Risk, Bal-ance sheet and Off-balance sheet – Capital management – Regulatory frame-work in the Credit Suisse Annual Report 2018 for further information on Swiss capital requirements.
The following table provides an overview of total Swiss RWA forming the denominator of the risk-based capital requirements. Further breakdowns of RWA are presented in subsequent parts of this report.
RWA increased slightly to CHF 285.2 billion as of the end of 4Q18 compared to CHF 277.2 billion as of the end of 3Q18, mainly resulting from increases relating to movements in risk levels in credit risk, model and parameter updates in market risk and credit risk and methodology and policy changes in credit risk. These increases were partially offset by decreases relating to movements in risk levels in market risk and operational risk.
RWA flow statements for credit risk, counterparty credit risk and market risk are presented in subsequent parts of this report.
> Refer to “Risk-weighted assets” (pages 131 to 133) in III – Treasury, Risk, Bal-ance sheet and Off-balance sheet – Capital management in the Credit Suisse Annual Report 2018 for further information on risk-weighted assets move-ments in 2018.
OV1 – Overview of Swiss risk-weighted assets and capital requirements
Capital Risk-weighted assets requirement 1
end of 4Q18 3Q18 4Q17 4Q18
CHF million
Credit risk (excluding counterparty credit risk) 139,867 132,489 121,832 11,189
of which standardized approach (SA) 13,190 13,519 10,511 1,055
of which supervisory slotting approach 2,403 2,349 2,187 192
of which internal rating-based (IRB) approach 2 124,274 116,621 109,134 9,942
Counterparty credit risk 17,613 18,472 19,117 1,409
of which standardized approach for counterparty credit risk (SA-CCR) 3 2,469 2,533 2,390 198
of which internal model method (IMM) 4 15,144 15,939 16,727 1,211
Credit valuation adjustments (CVA) 5,743 5,029 5,548 460
Equity positions in the banking book under the simple risk weight approach 2 8,378 8,022 8,712 670
Settlement risk 259 242 150 21
Securitization exposures in the banking book 12,541 11,951 10,731 5 1,003
of which securitization internal ratings-based approach (SEC-IRBA) 6,915 6,664 – 553
of which securitization external ratings-based approach (SEC-ERBA), including internal assessment approach (IAA) 1,727 1,752 – 138
of which securitization standardized approach (SEC-SA) 3,899 3,535 – 312
Market risk 18,643 17,878 21,290 1,491
of which standardized approach (SA) 2,393 2,345 3,765 191
of which internal model approach (IMA) 16,250 15,533 17,525 1,300
Operational risk 71,040 72,012 75,013 5,683
of which advanced measurement approach (AMA) 71,040 72,012 75,013 5,683
Amounts below the thresholds for deduction (subject to 250% risk weight) 11,109 11,101 11,043 889
Floor adjustment 6 0 0 0 0
Total 285,193 277,196 273,436 22,815
1 Calculated as 8% of risk-weighted assets based on total capital minimum requirements excluding capital conservation buffer and G-SIB buffer requirements.2 As of the end of 4Q18, a RWA scaling factor of 1.06 under the IRB approach has been applied to some additional portfolios. Prior period numbers have been restated to conform to the
current presentation.3 Calculated under the current exposure method.4 Includes RWA relating to central counterparties.5 In January 2018, a new securitization framework was implemented and has been phased in over 2018. The 4Q17 number was calculated in accordance with the previous methodology.6 Credit Suisse is not subject to a floor adjustment because current capital requirements and deductions exceed 80% of those under Basel I.
8 Linkagesbetweenfinancialstatementsandregulatoryexposures
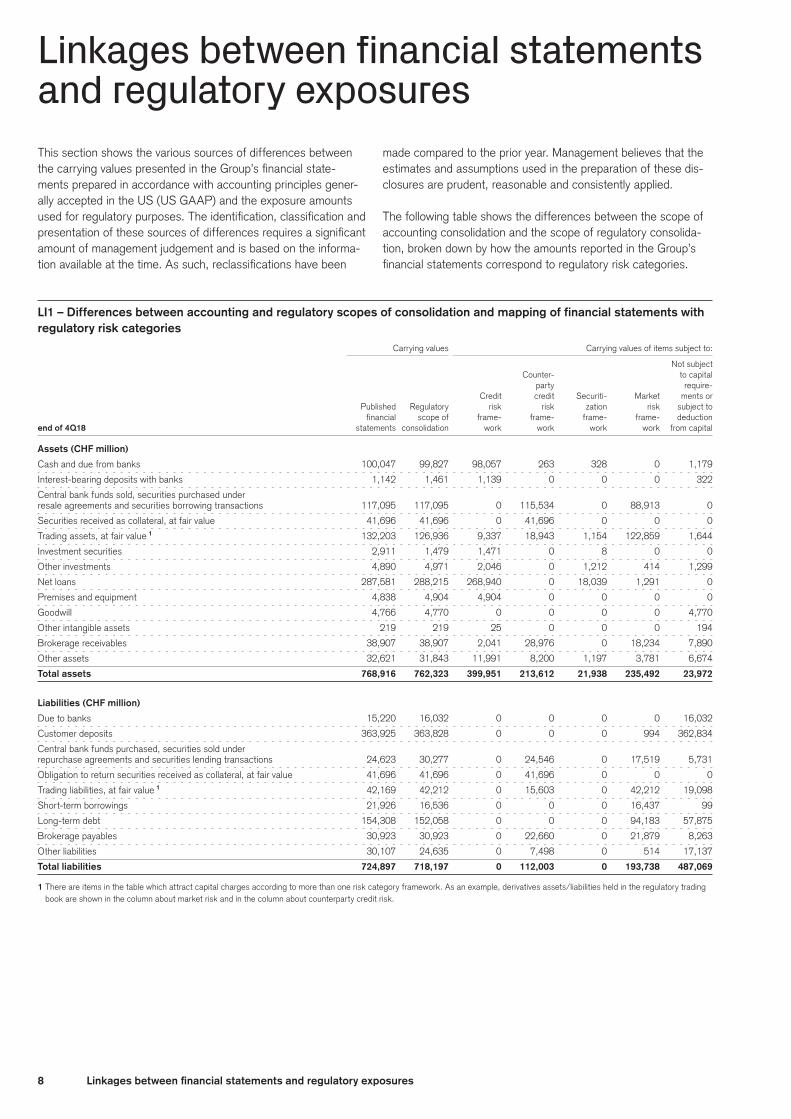
Linkages between financial statements and regulatory exposuresThis section shows the various sources of differences between the carrying values presented in the Group’s financial state-ments prepared in accordance with accounting principles gener-ally accepted in the US (US GAAP) and the exposure amounts used for regulatory purposes. The identification, classification and presentation of these sources of differences requires a significant amount of management judgement and is based on the informa-tion available at the time. As such, reclassifications have been
made compared to the prior year. Management believes that the estimates and assumptions used in the preparation of these dis-closures are prudent, reasonable and consistently applied.
The following table shows the differences between the scope of accounting consolidation and the scope of regulatory consolida-tion, broken down by how the amounts reported in the Group’s financial statements correspond to regulatory risk categories.
LI1 – Differences between accounting and regulatory scopes of consolidation and mapping of financial statements with regulatory risk categories Carrying values Carrying values of items subject to:
Not subject Counter- to capital party require-
Credit credit Securiti- Market ments or Published Regulatory risk risk zation risk subject to
financial scope of frame- frame- frame- frame- deduction
end of 4Q18 statements consolidation work work work work from capital
Assets (CHF million)
Cash and due from banks 100,047 99,827 98,057 263 328 0 1,179
Interest-bearing deposits with banks 1,142 1,461 1,139 0 0 0 322
Central bank funds sold, securities purchased under
resale agreements and securities borrowing transactions 117,095 117,095 0 115,534 0 88,913 0
Securities received as collateral, at fair value 41,696 41,696 0 41,696 0 0 0
Trading assets, at fair value 1 132,203 126,936 9,337 18,943 1,154 122,859 1,644
Investment securities 2,911 1,479 1,471 0 8 0 0
Other investments 4,890 4,971 2,046 0 1,212 414 1,299
Net loans 287,581 288,215 268,940 0 18,039 1,291 0
Premises and equipment 4,838 4,904 4,904 0 0 0 0
Goodwill 4,766 4,770 0 0 0 0 4,770
Other intangible assets 219 219 25 0 0 0 194
Brokerage receivables 38,907 38,907 2,041 28,976 0 18,234 7,890
Other assets 32,621 31,843 11,991 8,200 1,197 3,781 6,674
Total assets 768,916 762,323 399,951 213,612 21,938 235,492 23,972
Liabilities (CHF million)
Due to banks 15,220 16,032 0 0 0 0 16,032
Customer deposits 363,925 363,828 0 0 0 994 362,834
Central bank funds purchased, securities sold under
repurchase agreements and securities lending transactions 24,623 30,277 0 24,546 0 17,519 5,731
Obligation to return securities received as collateral, at fair value 41,696 41,696 0 41,696 0 0 0
Trading liabilities, at fair value 1 42,169 42,212 0 15,603 0 42,212 19,098
Short-term borrowings 21,926 16,536 0 0 0 16,437 99
Long-term debt 154,308 152,058 0 0 0 94,183 57,875
Brokerage payables 30,923 30,923 0 22,660 0 21,879 8,263
Other liabilities 30,107 24,635 0 7,498 0 514 17,137
Total liabilities 724,897 718,197 0 112,003 0 193,738 487,069
1 There are items in the table which attract capital charges according to more than one risk category framework. As an example, derivatives assets/liabilities held in the regulatory trading book are shown in the column about market risk and in the column about counterparty credit risk.
9Linkagesbetweenfinancialstatementsandregulatoryexposures
LI1 – Differences between accounting and regulatory scopes of consolidation and mapping of financial statements with regulatory risk categories (continued) Carrying values Carrying values of items subject to:
Not subject Counter- to capital party require-
Credit credit Securiti- Market ments or Published Regulatory risk risk zation risk subject to
financial scope of frame- frame- frame- frame- deduction
end of 4Q17 statements consolidation work work work work from capital
Assets (CHF million)
Cash and due from banks 109,815 109,457 107,477 239 0 0 1,768
Interest-bearing deposits with banks 726 1,146 723 0 0 0 423
Central bank funds sold, securities purchased under
resale agreements and securities borrowing transactions 115,346 108,325 0 108,325 0 0 0
Securities received as collateral, at fair value 38,074 38,074 0 38,008 0 0 66
Trading assets, at fair value 1 156,334 150,812 9,139 19,327 1,127 139,150 290
Investment securities 2,191 1,810 1,766 0 19 0 25
Other investments 5,964 5,799 3,160 105 441 867 1,226
Net loans 279,149 279,859 258,135 0 20,508 1,391 0
Premises and equipment 4,686 4,752 4,752 0 0 0 0
Goodwill 4,742 4,747 0 0 0 0 4,747
Other intangible assets 223 223 1 0 0 0 222
Brokerage receivables 46,968 46,968 2,686 28,546 0 29,869 12,911
Other assets 32,071 31,167 10,204 6,137 837 11,007 8,642
Total assets 796,289 783,139 398,043 200,687 22,932 182,284 30,320
Liabilities (CHF million)
Due to banks 15,413 16,004 0 0 0 0 16,004
Customer deposits 361,162 361,255 0 0 0 0 361,255
Central bank funds purchased, securities sold under
repurchase agreements and securities lending transactions 26,496 26,496 0 26,554 0 0 0
Obligation to return securities received as collateral, at fair value 38,074 38,074 0 38,008 0 0 66
Trading liabilities, at fair value 1 39,119 39,161 0 12,568 0 39,161 0
Short-term borrowings 25,889 19,293 0 0 0 11,010 8,283
Long-term debt 173,032 171,989 0 0 0 51,464 120,525
Brokerage payables 43,303 43,303 0 26,728 0 0 16,575
Other liabilities 31,612 25,451 412 8,670 0 0 16,369
Total liabilities 754,100 741,026 412 112,528 0 101,635 539,077
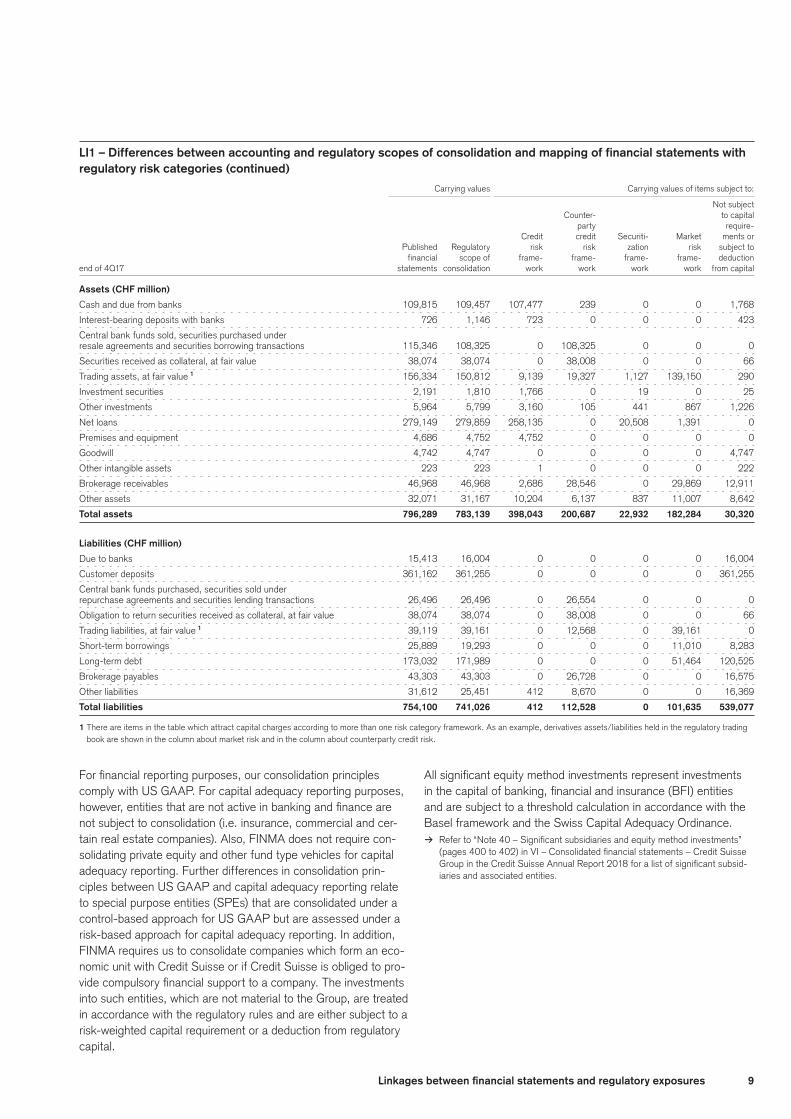
1 There are items in the table which attract capital charges according to more than one risk category framework. As an example, derivatives assets/liabilities held in the regulatory trading book are shown in the column about market risk and in the column about counterparty credit risk.
For financial reporting purposes, our consolidation principles comply with US GAAP. For capital adequacy reporting purposes, however, entities that are not active in banking and finance are not subject to consolidation (i.e. insurance, commercial and cer-tain real estate companies). Also, FINMA does not require con-solidating private equity and other fund type vehicles for capital adequacy reporting. Further differences in consolidation prin-ciples between US GAAP and capital adequacy reporting relate to special purpose entities (SPEs) that are consolidated under a control-based approach for US GAAP but are assessed under a risk-based approach for capital adequacy reporting. In addition, FINMA requires us to consolidate companies which form an eco-nomic unit with Credit Suisse or if Credit Suisse is obliged to pro-vide compulsory financial support to a company. The investments into such entities, which are not material to the Group, are treated in accordance with the regulatory rules and are either subject to a risk-weighted capital requirement or a deduction from regulatory capital.
All significant equity method investments represent investments in the capital of banking, financial and insurance (BFI) entities and are subject to a threshold calculation in accordance with the Basel framework and the Swiss Capital Adequacy Ordinance.
> Refer to “Note 40 – Significant subsidiaries and equity method investments” (pages 400 to 402) in VI – Consolidated financial statements – Credit Suisse Group in the Credit Suisse Annual Report 2018 for a list of significant subsid-iaries and associated entities.
10 Linkagesbetweenfinancialstatementsandregulatoryexposures
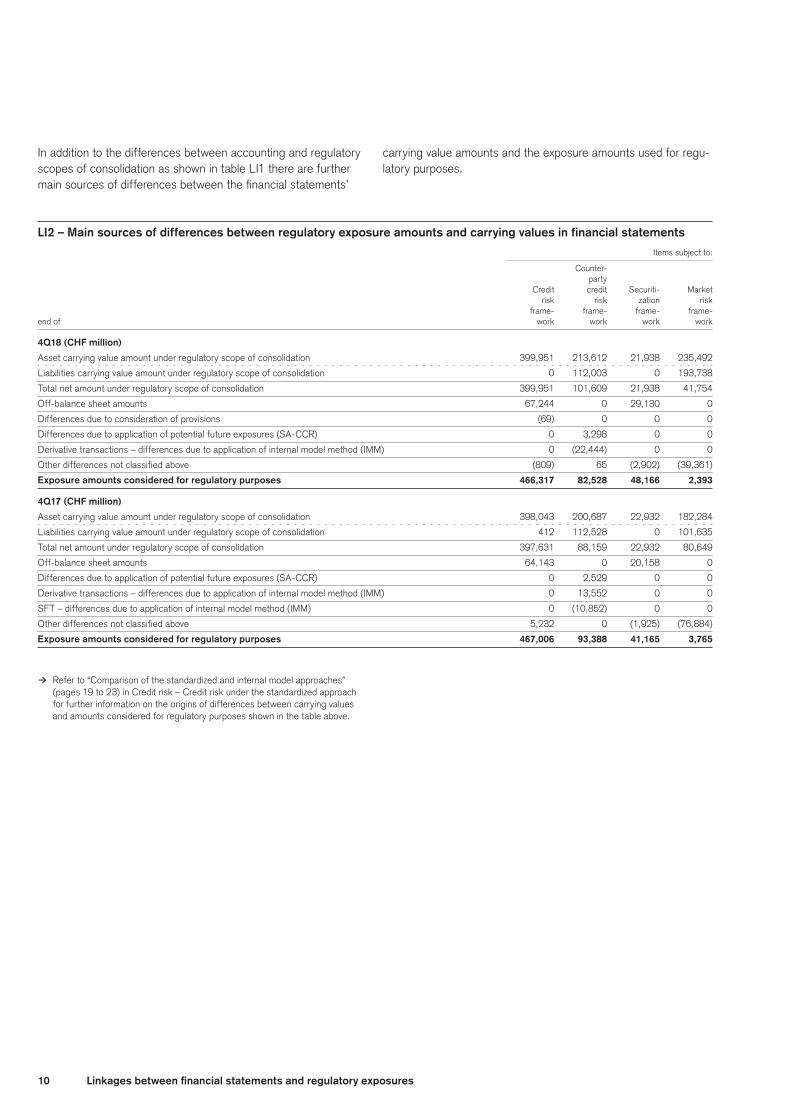
In addition to the differences between accounting and regulatory scopes of consolidation as shown in table LI1 there are further main sources of differences between the financial statements’
carrying value amounts and the exposure amounts used for regu-latory purposes.
LI2 – Main sources of differences between regulatory exposure amounts and carrying values in financial statements Items subject to:
Counter-
party
Credit credit Securiti- Market risk risk zation risk
frame- frame- frame- frame-
end of work work work work
4Q18 (CHF million)
Asset carrying value amount under regulatory scope of consolidation 399,951 213,612 21,938 235,492
Liabilities carrying value amount under regulatory scope of consolidation 0 112,003 0 193,738
Total net amount under regulatory scope of consolidation 399,951 101,609 21,938 41,754
Off-balance sheet amounts 67,244 0 29,130 0
Differences due to consideration of provisions (69) 0 0 0
Differences due to application of potential future exposures (SA-CCR) 0 3,298 0 0
Derivative transactions – differences due to application of internal model method (IMM) 0 (22,444) 0 0
Other differences not classified above (809) 65 (2,902) (39,361)
Exposure amounts considered for regulatory purposes 466,317 82,528 48,166 2,393
4Q17 (CHF million)
Asset carrying value amount under regulatory scope of consolidation 398,043 200,687 22,932 182,284
Liabilities carrying value amount under regulatory scope of consolidation 412 112,528 0 101,635
Total net amount under regulatory scope of consolidation 397,631 88,159 22,932 80,649
Off-balance sheet amounts 64,143 0 20,158 0
Differences due to application of potential future exposures (SA-CCR) 0 2,529 0 0
Derivative transactions – differences due to application of internal model method (IMM) 0 13,552 0 0
SFT – differences due to application of internal model method (IMM) 0 (10,852) 0 0
Other differences not classified above 5,232 0 (1,925) (76,884)
Exposure amounts considered for regulatory purposes 467,006 93,388 41,165 3,765
> Refer to “Comparison of the standardized and internal model approaches” (pages 19 to 23) in Credit risk – Credit risk under the standardized approach for further information on the origins of differences between carrying values and amounts considered for regulatory purposes shown in the table above.
11Linkagesbetweenfinancialstatementsandregulatoryexposures
Valuation processThe Basel capital adequacy framework and the Swiss regulation provide guidance for systems and controls, valuation methodolo-gies and valuation adjustments and reserves to provide prudent and reliable valuation estimates.
Financial instruments in the trading book are carried at fair value. The fair value of the majority of these financial instruments is marked to market based on quoted prices in active markets or observable inputs. Additionally, the Group holds financial instru-ments which are marked to models where the determination of fair values requires subjective assessment and varying degrees of judgment depending on liquidity, concentration, pricing assump-tions and the risks affecting the specific instrument.
Control processes are applied to ensure that the reported fair values of the financial instruments, including those derived from pricing models, are appropriate and determined on a reasonable basis. These control processes include approval of new instru-ments, timely review of profit and loss, risk monitoring, price veri-fication procedures and validation of models used to estimate the fair value. These functions are managed by senior management and personnel with relevant expertise, independent of the trading and investment functions.
In particular, the price verification function is performed by Prod-uct Control, independent from the trading and investment func-tions, reporting directly to the Chief Financial Officer, a member of the Executive Board.
The valuation process is governed by separate policies and pro-cedures. To arrive at fair values, the following type of valuation adjustments are typically considered and regularly assessed for appropriateness: model, parameter, credit and exit-risk-related adjustments.
Management believes it complies with the relevant valuation guid-ance and that the estimates and assumptions used in valuation of financial instruments are prudent, reasonable and consistently applied.
> Refer to “Fair valuations” (page 70) in II – Operating and financial review – Credit Suisse – Other information, to “Fair value” (page 107) in II – Operating and financial review – Critical accounting estimates and to “Note 35 – Finan-cial instruments” (pages 359 to 363) in VI – Consolidated financial statements – Credit Suisse Group in the Credit Suisse Annual Report 2018 for further information on fair value.
12 Credit risk
Credit risk
GeneralThis section covers credit risk as defined by the Basel framework. Counterparty credit risk, including those that are in the bank-ing book for regulatory purposes, and all positions subject to the securitization framework are presented in separate sections.
> Refer to “Counterparty credit risk” (pages 44 to 53) for further information on the capital requirements relating to counterparty credit risk.
> Refer to “Securitization” (pages 54 to 59) for further information on the securi-tization framework.
The Basel framework permits banks to choose between two broad methodologies in calculating their capital requirements for credit risk: the standardized approach or the internal ratings-based (IRB) approach. Off-balance-sheet items are converted into credit exposure equivalents through the use of credit conver-sion factors (CCF).
The reported credit risk arises from the execution of the groups business strategy through the divisions, and is predominantly driven by cash and balances with central banks, loans and com-mitments provided to corporate and institutional clients, and loans to private clients including residential mortgages and lending against financial collateral.
Risk management objectives and policies for credit risk > Refer to “Credit risk” (pages 158 to 161) in III – Treasury, Risk, Balance sheet
and Off-balance sheet – Risk management – Risk coverage and management in the Credit Suisse Annual Report 2018 for information on risk manage-ment objectives and policies for credit risk, including our credit risk profile, the setting of credit risk limits, the structure and organization of credit risk management.
Credit risk reportingCredit risk is subject to daily monitoring and reporting, and is gov-erned by internal policies & procedures and a framework of limits and controls. The groups credit risk exposure is subject to formal monthly reporting through the Group Risk Report which provides summary information in relation to the credit risk portfolio com-position, rating profile, and the largest single name loans and commitments. The Group Risk Report also provides qualitative commentary on key credit risk matters and developments, and is discussed at Board of Directors Risk Committee and distributed to the Board of Directors and Executive Board members.
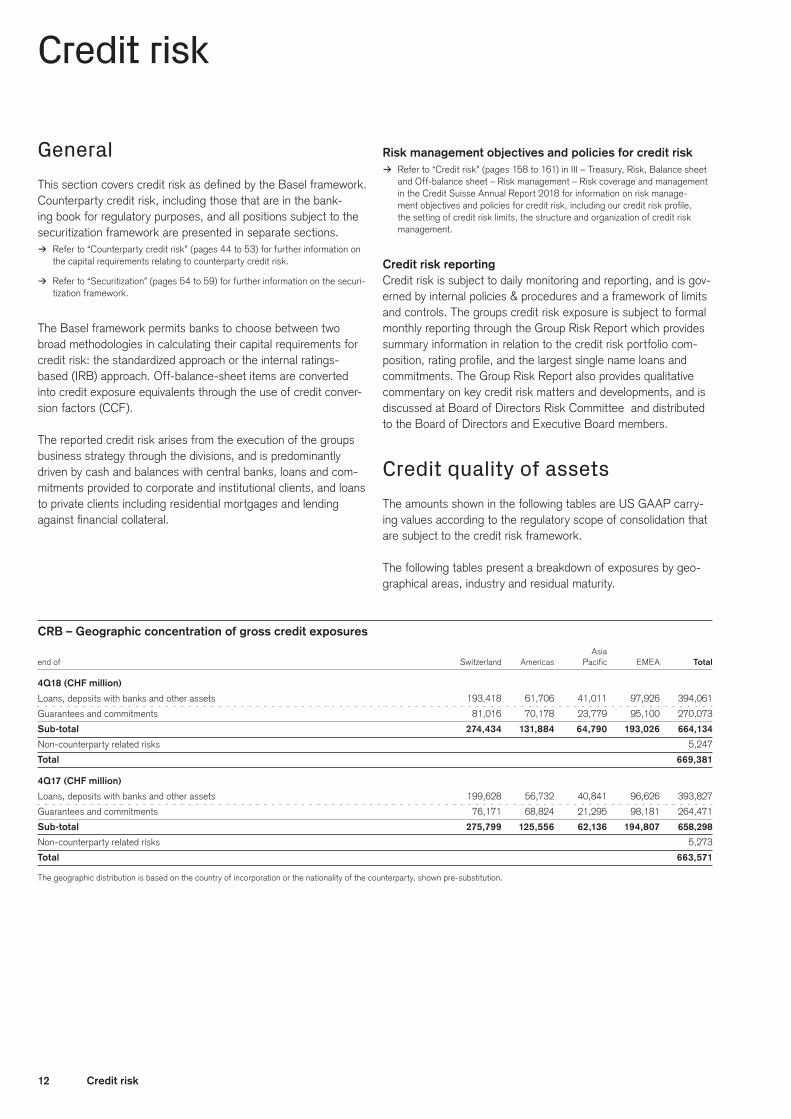
Credit quality of assetsThe amounts shown in the following tables are US GAAP carry-ing values according to the regulatory scope of consolidation that are subject to the credit risk framework.
The following tables present a breakdown of exposures by geo-graphical areas, industry and residual maturity.
CRB – Geographic concentration of gross credit exposures Asia
end of Switzerland Americas Pacific EMEA Total
4Q18 (CHF million)
Loans, deposits with banks and other assets 193,418 61,706 41,011 97,926 394,061
Guarantees and commitments 81,016 70,178 23,779 95,100 270,073
Sub-total 274,434 131,884 64,790 193,026 664,134
Non-counterparty related risks 5,247
Total 669,381
4Q17 (CHF million)
Loans, deposits with banks and other assets 199,628 56,732 40,841 96,626 393,827
Guarantees and commitments 76,171 68,824 21,295 98,181 264,471
Sub-total 275,799 125,556 62,136 194,807 658,298
Non-counterparty related risks 5,273
Total 663,571
The geographic distribution is based on the country of incorporation or the nationality of the counterparty, shown pre-substitution.

13Credit risk
CRB – Industry concentration of gross credit exposures Financial Public
end of institutions Commercial Consumer authorities Total
4Q18 (CHF million)
Loans, deposits with banks and other assets 13,822 137,841 143,625 98,773 394,061
Guarantees and commitments 5,268 194,060 66,419 4,326 270,073
Sub-total 19,090 331,901 210,044 103,099 664,134
Non-counterparty related risks 5,247
Total 669,381
4Q17 (CHF million)
Loans, deposits with banks and other assets 10,133 130,877 141,236 111,581 393,827
Guarantees and commitments 10,058 184,385 65,853 4,175 264,471
Sub-total 20,191 315,262 207,089 115,756 658,298
Non-counterparty related risks 5,273
Total 663,571
Exposures are shown pre-substitution.
CRB – Remaining contractual maturity of gross credit exposures within within
end of 1 year 1 1-5 years Thereafter Total
4Q18 (CHF million)
Loans, deposits with banks and other assets 168,266 174,337 51,458 394,061
Guarantees and commitments 198,280 64,387 7,406 270,073
Sub-total 366,546 238,724 58,864 664,134
Non-counterparty related risks 5,247
Total 669,381
4Q17 (CHF million)
Loans, deposits with banks and other assets 175,155 168,315 50,357 393,827
Guarantees and commitments 188,490 66,979 9,002 264,471
Sub-total 363,645 235,294 59,359 658,298
Non-counterparty related risks 5,273
Total 663,571
1 Includes positions without agreed residual contractual maturity.
14 Credit risk
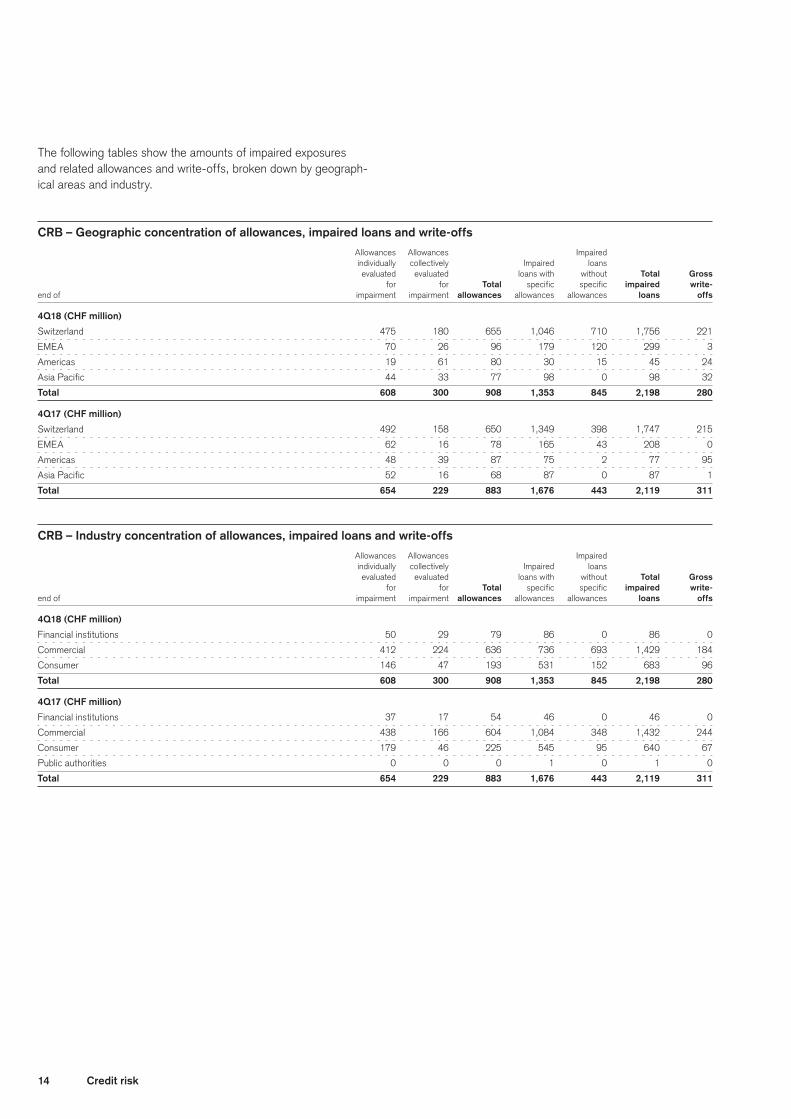
The following tables show the amounts of impaired exposures and related allowances and write-offs, broken down by geograph-ical areas and industry.
CRB – Geographic concentration of allowances, impaired loans and write-offs Allowances Allowances Impaired
individually collectively Impaired loans
evaluated evaluated loans with without Total Gross
for for Total specific specific impaired write-
end of impairment impairment allowances allowances allowances loans offs
4Q18 (CHF million)
Switzerland 475 180 655 1,046 710 1,756 221
EMEA 70 26 96 179 120 299 3
Americas 19 61 80 30 15 45 24
Asia Pacific 44 33 77 98 0 98 32
Total 608 300 908 1,353 845 2,198 280
4Q17 (CHF million)
Switzerland 492 158 650 1,349 398 1,747 215
EMEA 62 16 78 165 43 208 0
Americas 48 39 87 75 2 77 95
Asia Pacific 52 16 68 87 0 87 1
Total 654 229 883 1,676 443 2,119 311
CRB – Industry concentration of allowances, impaired loans and write-offs Allowances Allowances Impaired
individually collectively Impaired loans
evaluated evaluated loans with without Total Gross
for for Total specific specific impaired write-
end of impairment impairment allowances allowances allowances loans offs
4Q18 (CHF million)
Financial institutions 50 29 79 86 0 86 0
Commercial 412 224 636 736 693 1,429 184
Consumer 146 47 193 531 152 683 96
Total 608 300 908 1,353 845 2,198 280
4Q17 (CHF million)
Financial institutions 37 17 54 46 0 46 0
Commercial 438 166 604 1,084 348 1,432 244
Consumer 179 46 225 545 95 640 67
Public authorities 0 0 0 1 0 1 0
Total 654 229 883 1,676 443 2,119 311
15Credit risk
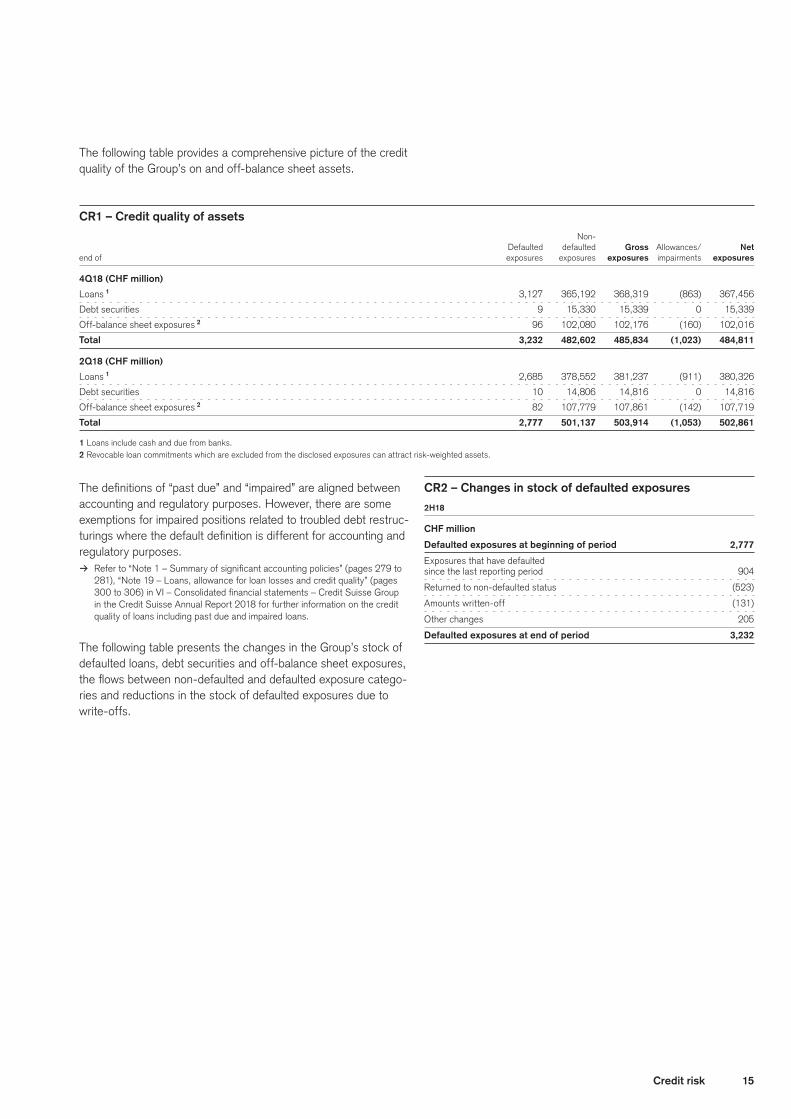
The following table provides a comprehensive picture of the credit quality of the Group’s on and off-balance sheet assets.
CR1 – Credit quality of assets Non-
Defaulted defaulted Gross Allowances/ Net
end of exposures exposures exposures impairments exposures
4Q18 (CHF million)
Loans 1 3,127 365,192 368,319 (863) 367,456
Debt securities 9 15,330 15,339 0 15,339
Off-balance sheet exposures 2 96 102,080 102,176 (160) 102,016
Total 3,232 482,602 485,834 (1,023) 484,811
2Q18 (CHF million)
Loans 1 2,685 378,552 381,237 (911) 380,326
Debt securities 10 14,806 14,816 0 14,816
Off-balance sheet exposures 2 82 107,779 107,861 (142) 107,719
Total 2,777 501,137 503,914 (1,053) 502,861
1 Loans include cash and due from banks.2 Revocable loan commitments which are excluded from the disclosed exposures can attract risk-weighted assets.
The definitions of “past due” and “impaired” are aligned between accounting and regulatory purposes. However, there are some exemptions for impaired positions related to troubled debt restruc-turings where the default definition is different for accounting and regulatory purposes.
> Refer to “Note 1 – Summary of significant accounting policies” (pages 279 to 281), “Note 19 – Loans, allowance for loan losses and credit quality” (pages 300 to 306) in VI – Consolidated financial statements – Credit Suisse Group in the Credit Suisse Annual Report 2018 for further information on the credit quality of loans including past due and impaired loans.
The following table presents the changes in the Group’s stock of defaulted loans, debt securities and off-balance sheet exposures, the flows between non-defaulted and defaulted exposure catego-ries and reductions in the stock of defaulted exposures due to write-offs.
CR2 – Changes in stock of defaulted exposures
2H18
CHF million
Defaulted exposures at beginning of period 2,777
Exposures that have defaulted
since the last reporting period 904
Returned to non-defaulted status (523)
Amounts written-off (131)
Other changes 205
Defaulted exposures at end of period 3,232

16 Credit risk
The following table shows the aging analysis of accounting past-due exposures.
CRB – Aging analysis of accounting past-due exposures
Current Past due
Up to 31 – 60 61 – 90 More than
end of 30 days days days 90 days Total Total
4Q18 (CHF million)
Financial institutions 12,871 107 19 3 45 174 13,045
Commercial 104,361 461 101 83 861 1,506 105,867
Consumer 153,107 528 65 45 519 1,157 154,264
Public authorities 1,173 13 0 0 0 13 1,186
Gross loans held at amortized cost 271,512 1,109 185 131 1,425 2,850 274,362
Gross loans held at fair value 14,873
Gross loans 289,235
4Q17 (CHF million)
Financial institutions 8,935 335 2 2 44 383 9,318
Commercial 100,836 484 54 216 593 1,347 102,183
Consumer 151,699 504 79 58 469 1,110 152,809
Public authorities 1,198 1 0 0 1 2 1,200
Gross loans held at amortized cost 262,668 1,324 135 276 1,107 2,842 265,510
Gross loans held at fair value 15,307
Gross loans 280,817
Loans that are modified in a troubled debt restructuring are reported as restructured loans. Generally, restructured loans would have been considered impaired and an associated allow-ance for loan losses would have been established prior to the restructuring. As of December 31, 2018, CHF 189 million were reported as restructured loans.
> Refer to “Note 19 – Loans, allowance for loan losses and credit quality” (page 306) in VI – Consolidated financial statements – Credit Suisse Group in the Credit Suisse Annual Report 2018 for further information on restructured exposure.
Credit risk mitigationCredit Suisse actively mitigates credit exposure through use of legal netting agreements, security over supporting financial and non-financial collateral or financial guarantees, and through the use of credit hedging techniques (primarily credit default swaps (CDS)). The recognition of credit risk mitigation (CRM) against exposures is governed by a robust set of policies and processes that ensure enforceability and effectiveness.
Netting > Refer to “Derivative instruments” (pages 178 to 180) in III – Treasury, Risk,
Balance sheet and Off-balance sheet – Risk management – Risk review and results and to “Note 1 – Summary of significant accounting policies” (pages 277 to 278) in VI – Consolidated financial statements – Credit Suisse Group in the Credit Suisse Annual Report 2018 for information on policies and proce-dures for on- and off-balance sheet netting.
> Refer to “Note 27 – Offsetting of financial assets and financial liabilities” (pages 313 to 316) in VI – Consolidated financial statements – Credit Suisse Group in the Credit Suisse Annual Report 2018 for further information on the offsetting of derivatives, reverse repurchase and repurchase agreements, and securities lending and borrowing transactions.
Collateral valuation and managementThe policies and processes for collateral valuation and manage-ment are driven by:p a legal document framework that is bilaterally agreed with our
clients;p a collateral management risk framework enforcing transpar-
ency through self-assessment and management reporting; and p any prevailing regulatory terms which must be complied with.
For exposures collateralized by financial collateral (e.g. market-able securities), collateral valuations are performed on a daily basis and any requirement for additional collateral (e.g. frequency and process for margin calls) is governed by the legal documen-tation. The market prices used for daily collateral valuation are a combination of internal pricing sources, as well as market prices sourced from trading platforms and external service providers where appropriate.
For exposures collateralized by non-financial collateral (e.g. real estate, ships, aircraft), valuations are performed at the time of credit approval and periodically thereafter depending on the type of collateral and the loan-to-value (LTV) ratio in accordance with documented internal policies and controls. Valuations are based on a combination of internal and external reference price sources.

17Credit risk
Primary types of collateral The primary types of collateral are described below.Collateral securing foreign exchange transactions and over-the-counter (OTC) trading activities primarily includes:p Cash and US Treasury instruments; andp G-10 government securities.
Collateral securing loan transactions primarily includes:p Financial collateral pledged against loans collateralized by
securities of clients of the private, corporate and institutional banking businesses (primarily cash and marketable securities);
p Real estate property for mortgages, mainly residential, but also multi-family buildings, offices and commercial properties; and
p Other types of lending collateral, such as accounts receivable, inventory, plant and equipment.
Concentrations within risk mitigationCredit Suisse, primarily through its Global Markets division, is an active participant in the credit derivatives market and trades with a variety of market participants, principally commercial and investment banks. Credit derivatives are primarily used to mitigate investment grade credit exposures. Where required or practicable, these trades are cleared through central counterparties (CCP), reducing the potential risk against individual CRM providers.
As a result of a strong domestic franchise, Credit Suisse has a significant volume of residential mortgage lending in Switzerland and a resultant concentration of residential real estate collateral. Credit Suisse has clear underwriting standards with regard to mortgage lending and ensures that the composition of the real estate portfolio is subject to ongoing monitoring, periodic revalua-tion, and assessment of the geographical and borrower composi-tion of the portfolio.
Credit Suisse provides loan facilities to private clients against financial collateral such as cash and marketable securities (e.g. equities, bonds, or funds). The financial collateral portfolio within risk mitigation is generally diversified and the portfolio is subject to ongoing monitoring and reporting to identify any concentra-tions. which may result in lower LTV ratios or other mitigating actions.
> Refer to “Credit risk review” (pages 178 to 180) in III – Treasury, Risk, Balance sheet and Off-balance sheet – Risk management – Risk review and results in the Credit Suisse Annual Report 2018 for further information on credit deriva-tives, including a breakdown by rating class.
CRM techniques – overviewThe following table presents the extent of use of CRM techniques.
CR3 – CRM techniques Net exposures Exposures secured by
Partially
or fully Financial Credit
end of Unsecured secured Total Collateral guarantees derivatives
4Q18 (CHF million)
Loans 1 142,286 225,170 367,456 189,518 6,676 216
Debt securities 15,148 191 15,339 191 0 0
Total 157,434 225,361 382,795 189,709 6,676 216
of which defaulted 1,154 1,544 2,698 1,137 162 0
2Q18 (CHF million)
Loans 1 152,054 228,272 380,326 193,468 5,299 264
Debt securities 14,633 183 14,816 183 0 0
Total 166,687 228,455 395,142 193,651 5,299 264
of which defaulted 1,028 1,163 2,191 876 122 0
Excludes non-financial collateral which is used to reduce the capital requirements for investment banking businesses, and therefore the net exposures are classified as unsecured.1 Loans include cash and due from banks.

18 Credit risk
Credit risk under the standardized approach
GeneralUnder the standardized approach, risk weights are determined either according to credit ratings provided by recognized external credit assessment institutions (ECAI) or, for unrated exposures, by using the applicable regulatory risk weights. Less than 10% of
our credit risk exposures are determined using the standardized approach.
Credit risk exposure and CRM effectsThe following table illustrates the effect of CRM (comprehen-sive and simple approach) on the standardized approach capital requirements’ calculations. RWA density provides a synthetic metric on riskiness of each portfolio.
CR4 – Credit risk exposure and CRM effects Exposures pre-CCF and CRM Exposures post-CCF and CRM
On-balance Off-balance On-balance Off-balance RWA
end of sheet sheet Total sheet sheet Total RWA density
4Q18 (CHF million, except where indicated)
Sovereigns 14,083 0 14,083 14,083 0 14,083 301 2%
Institutions – Banks and securities dealer 453 526 979 453 263 716 143 20%
Corporates 714 0 714 714 0 714 639 89%
Retail 1,037 114 1,151 1,037 114 1,151 1,052 91%
Other exposures 12,290 2,125 14,415 12,269 2,121 14,390 11,055 77%
of which non-counterparty related assets 5,247 0 5,247 5,247 0 5,247 5,247 100%
Total 28,577 2,765 31,342 28,556 2,498 31,054 13,190 42%
2Q18 (CHF million, except where indicated)
Sovereigns 14,373 0 14,373 14,373 0 14,373 279 2%
Institutions – Banks and securities dealer 175 544 719 175 272 447 92 20%
Corporates 1,017 0 1,017 1,017 0 1,017 940 92%
Retail 329 79 408 329 79 408 355 87%
Other exposures 12,356 1,877 14,233 12,329 1,876 14,205 11,212 79%
of which non-counterparty related assets 5,273 0 5,273 5,273 0 5,273 5,273 100%
Total 28,250 2,500 30,750 28,223 2,227 30,450 12,878 42%
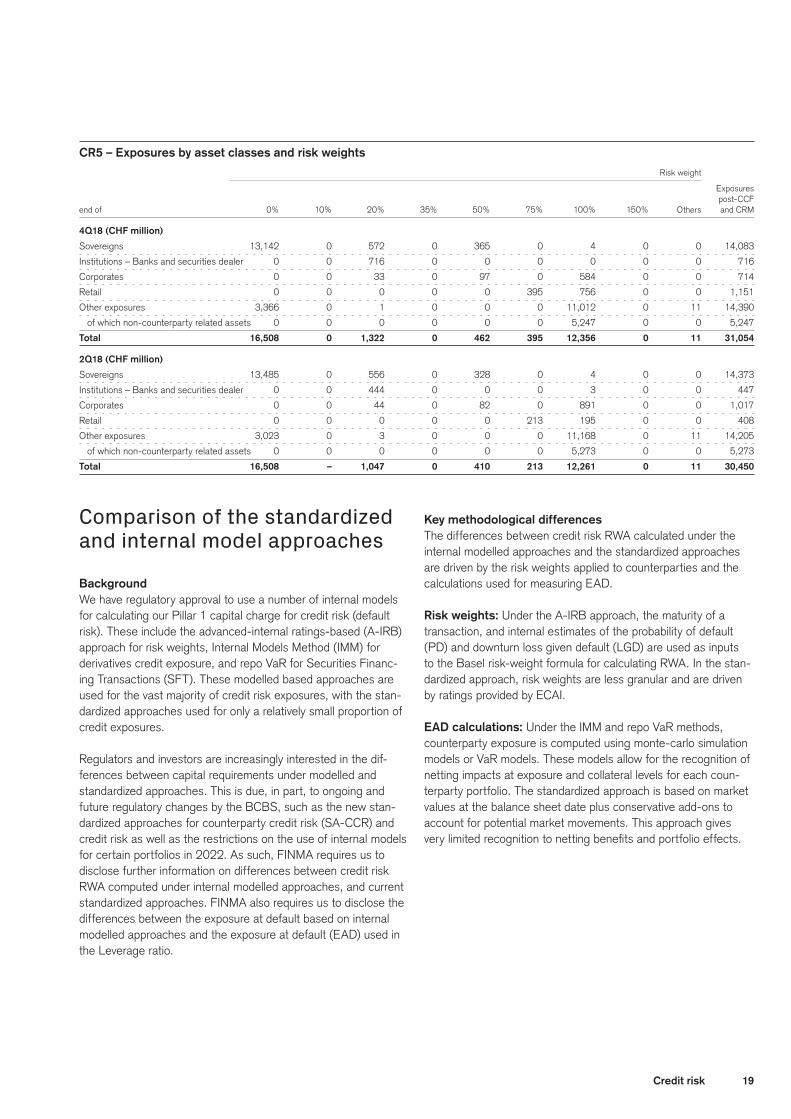
Exposures by asset classes and risk weightsThe following table presents the breakdown of credit exposures under the standardized approach by asset class and risk weight, which correspond to the riskiness attributed to the exposure according to the standardized approach.
19Credit risk
CR5 – Exposures by asset classes and risk weights Risk weight
Exposures
post-CCF
end of 0% 10% 20% 35% 50% 75% 100% 150% Others and CRM
4Q18 (CHF million)
Sovereigns 13,142 0 572 0 365 0 4 0 0 14,083
Institutions – Banks and securities dealer 0 0 716 0 0 0 0 0 0 716
Corporates 0 0 33 0 97 0 584 0 0 714
Retail 0 0 0 0 0 395 756 0 0 1,151
Other exposures 3,366 0 1 0 0 0 11,012 0 11 14,390
of which non-counterparty related assets 0 0 0 0 0 0 5,247 0 0 5,247
Total 16,508 0 1,322 0 462 395 12,356 0 11 31,054
2Q18 (CHF million)
Sovereigns 13,485 0 556 0 328 0 4 0 0 14,373
Institutions – Banks and securities dealer 0 0 444 0 0 0 3 0 0 447
Corporates 0 0 44 0 82 0 891 0 0 1,017
Retail 0 0 0 0 0 213 195 0 0 408
Other exposures 3,023 0 3 0 0 0 11,168 0 11 14,205
of which non-counterparty related assets 0 0 0 0 0 0 5,273 0 0 5,273
Total 16,508 – 1,047 0 410 213 12,261 0 11 30,450
Comparison of the standardized and internal model approaches
BackgroundWe have regulatory approval to use a number of internal models for calculating our Pillar 1 capital charge for credit risk (default risk). These include the advanced-internal ratings-based (A-IRB) approach for risk weights, Internal Models Method (IMM) for derivatives credit exposure, and repo VaR for Securities Financ-ing Transactions (SFT). These modelled based approaches are used for the vast majority of credit risk exposures, with the stan-dardized approaches used for only a relatively small proportion of credit exposures.
Regulators and investors are increasingly interested in the dif-ferences between capital requirements under modelled and standardized approaches. This is due, in part, to ongoing and future regulatory changes by the BCBS, such as the new stan-dardized approaches for counterparty credit risk (SA-CCR) and credit risk as well as the restrictions on the use of internal models for certain portfolios in 2022. As such, FINMA requires us to disclose further information on differences between credit risk RWA computed under internal modelled approaches, and current standardized approaches. FINMA also requires us to disclose the differences between the exposure at default based on internal modelled approaches and the exposure at default (EAD) used in the Leverage ratio.
Key methodological differences The differences between credit risk RWA calculated under the internal modelled approaches and the standardized approaches are driven by the risk weights applied to counterparties and the calculations used for measuring EAD.
Risk weights: Under the A-IRB approach, the maturity of a transaction, and internal estimates of the probability of default (PD) and downturn loss given default (LGD) are used as inputs to the Basel risk-weight formula for calculating RWA. In the stan-dardized approach, risk weights are less granular and are driven by ratings provided by ECAI.
EAD calculations: Under the IMM and repo VaR methods, counterparty exposure is computed using monte-carlo simulation models or VaR models. These models allow for the recognition of netting impacts at exposure and collateral levels for each coun-terparty portfolio. The standardized approach is based on market values at the balance sheet date plus conservative add-ons to account for potential market movements. This approach gives very limited recognition to netting benefits and portfolio effects.

20 Credit risk
Risk weight by maturity
0%
5%
10%
15%
20%
25%
30%
0 1 2 3 4 5 6
Ris
k W
eigh
t (R
W)
Maturity (in Years)
A-IRB, AA-rated corporate, senior unsecured
A-IRB, AA-rated corporate, senior secured
Standardized Approach: AA-rated corporate
The following table provides a summary of the key conceptual dif-ferences between the internal models approach and the current standardized approach.
Key differences between the standardized approach and the internal model approach Standardized approach Internal model approach Key impact
EAD for Current Exposure Method is simplistic Internal Models Method (IMM) For large diversified derivatives portfolios,
derivatives (market value and add-on): allows Monte-Carlo simulation to standardized EAD is higher than model EAD. BCBS to replace it with SA-CCR in 2020. estimate exposure.
No differentiation between margined and Ability to net and offset risk factors within the Impact applies across all asset classes. unmargined transactions. portfolio (i.e. diversification).
Differentiates add-ons by five exposure Application of multiplier on IMM exposure
types and three maturity buckets only. estimate.
Limited ability to net. Variability in holding period applied to collateralized
transactions, reflecting liquidity risks.
Risk Reliance on ECAIs: where no rating is Reliance on internal ratings where each Model approach produces lower RWA
weighting available a 100% risk weight is applied (i.e. for counterparty/transaction receives a rating. for high quality short-term transactions. most small and medium size enterprises and funds).
Crude risk weight differentiation with 4 key weights: Granular risk sensitive risk weights differentiation Standardized approach produces lower RWA
20%, 50%, 100%, 150% (and 0% for AAA via individual PDs and LGDs. for non-investment grade and long-term
sovereigns; 35%, 75% or 100% for mortgages; transactions. 75% or 100% for retail).
No differentiation for transaction features. LGD captures transaction quality features Impact relevant across all asset classes. incl. collateralization.
Application of a 1.06 scaling factor.
Risk Limited recognition of risk mitigation. Risk mitigation recognized via Standardized approach RWA
mitigation risk sensitive LGD or EAD. higher than model approach RWA for most collaterals.
Restricted list of eligible collateral. Wider variety of collateral types eligible. Impact particularly relevant for lombard lending and securities financing transactions.
Conservative and crude regulatory haircuts. Repo VaR allows use of VaR models
to estimate exposure and collateral for
securities financing transactions.
Approach permits full diversification
and netting across all collateral types.
Maturity No differentiation for maturity of transactions, No internal modelling of maturity. Model approach produces lower RWA
in risk except for interbank exposures in a coarse for high quality short-term transactions.
weight manner.
Regulatory risk-weighted assets function
considers maturity: the longer the maturity
the higher the risk weight
(see chart “Risk weight by maturity”).
The following chart shows standardized risk weights, and model based (A-IRB) risk weights for loans of varying maturity. The graphs are plotted for a AA-rated corporate senior unsecured loan with a LGD of 45% (consistent with Foundation-IRB, F-IRB), and a AA-rated corporate senior secured loan with a LGD of 36%. The graphs show that standardized risk weights are not sensitive to maturity, whereas A-IRB risk weights are sensitive to maturity. In particular, under A-IRB, lower maturity loans receive lower risk weights reflecting an increased likelihood of repayment for loans with a shorter maturity.
21Credit risk
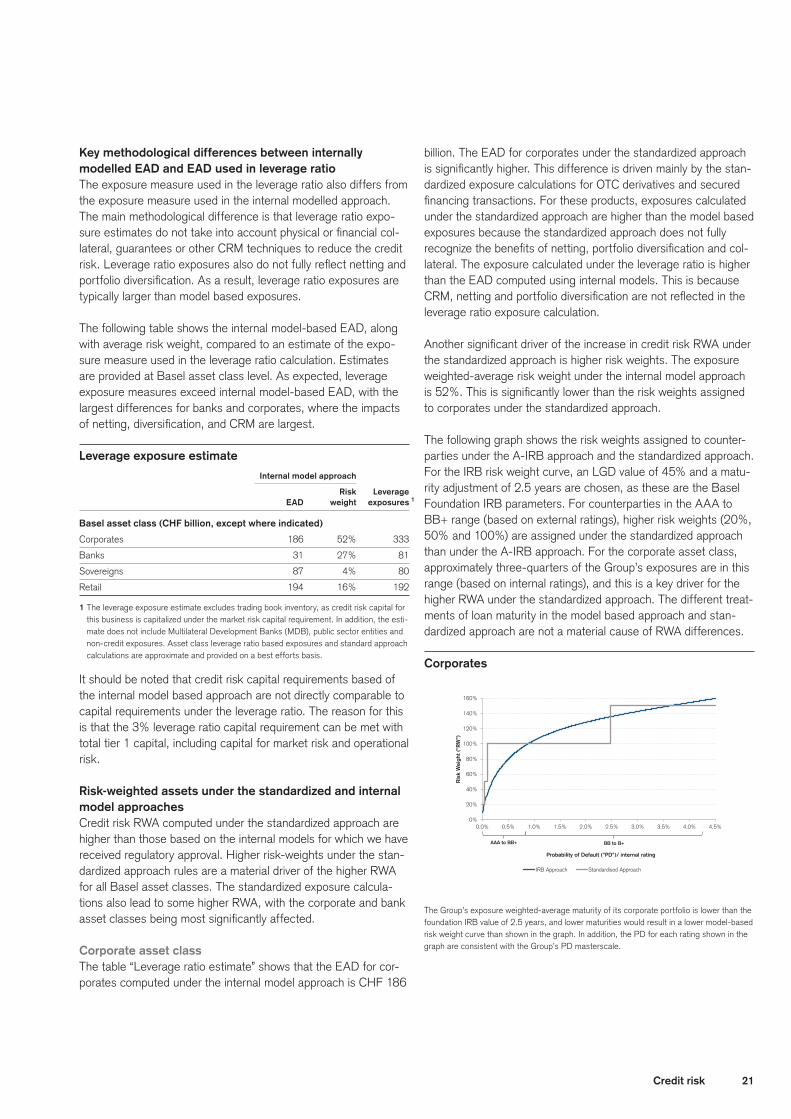
Corporates
0%
20%
40%
60%
80%
100%
120%
140%
160%
0.0% 0.5% 1.0% 1.5% 2.0% 2.5% 3.0% 3.5% 4.0% 4.5%
Ris
k W
eigh
t ("
RW
")
Probability of Default ("PD")/ internal rating
Corporates
IRB Approach Standardised Approach
AAA to BB+ BB to B+
Key methodological differences between internally modelled EAD and EAD used in leverage ratioThe exposure measure used in the leverage ratio also differs from the exposure measure used in the internal modelled approach. The main methodological difference is that leverage ratio expo-sure estimates do not take into account physical or financial col-lateral, guarantees or other CRM techniques to reduce the credit risk. Leverage ratio exposures also do not fully reflect netting and portfolio diversification. As a result, leverage ratio exposures are typically larger than model based exposures.
The following table shows the internal model-based EAD, along with average risk weight, compared to an estimate of the expo-sure measure used in the leverage ratio calculation. Estimates are provided at Basel asset class level. As expected, leverage exposure measures exceed internal model-based EAD, with the largest differences for banks and corporates, where the impacts of netting, diversification, and CRM are largest.
Leverage exposure estimate Internal model approach
Risk Leverage
EAD weight exposures 1
Basel asset class (CHF billion, except where indicated)
Corporates 186 52% 333
Banks 31 27% 81
Sovereigns 87 4% 80
Retail 194 16% 192
1 The leverage exposure estimate excludes trading book inventory, as credit risk capital for this business is capitalized under the market risk capital requirement. In addition, the esti-mate does not include Multilateral Development Banks (MDB), public sector entities and non-credit exposures. Asset class leverage ratio based exposures and standard approach calculations are approximate and provided on a best efforts basis.
It should be noted that credit risk capital requirements based of the internal model based approach are not directly comparable to capital requirements under the leverage ratio. The reason for this is that the 3% leverage ratio capital requirement can be met with total tier 1 capital, including capital for market risk and operational risk.
Risk-weighted assets under the standardized and internal model approaches Credit risk RWA computed under the standardized approach are higher than those based on the internal models for which we have received regulatory approval. Higher risk-weights under the stan-dardized approach rules are a material driver of the higher RWA for all Basel asset classes. The standardized exposure calcula-tions also lead to some higher RWA, with the corporate and bank asset classes being most significantly affected.
Corporate asset classThe table “Leverage ratio estimate” shows that the EAD for cor-porates computed under the internal model approach is CHF 186
billion. The EAD for corporates under the standardized approach is significantly higher. This difference is driven mainly by the stan-dardized exposure calculations for OTC derivatives and secured financing transactions. For these products, exposures calculated under the standardized approach are higher than the model based exposures because the standardized approach does not fully recognize the benefits of netting, portfolio diversification and col-lateral. The exposure calculated under the leverage ratio is higher than the EAD computed using internal models. This is because CRM, netting and portfolio diversification are not reflected in the leverage ratio exposure calculation.
Another significant driver of the increase in credit risk RWA under the standardized approach is higher risk weights. The exposure weighted-average risk weight under the internal model approach is 52%. This is significantly lower than the risk weights assigned to corporates under the standardized approach.
The following graph shows the risk weights assigned to counter-parties under the A-IRB approach and the standardized approach. For the IRB risk weight curve, an LGD value of 45% and a matu-rity adjustment of 2.5 years are chosen, as these are the Basel Foundation IRB parameters. For counterparties in the AAA to BB+ range (based on external ratings), higher risk weights (20%, 50% and 100%) are assigned under the standardized approach than under the A-IRB approach. For the corporate asset class, approximately three-quarters of the Group’s exposures are in this range (based on internal ratings), and this is a key driver for the higher RWA under the standardized approach. The different treat-ments of loan maturity in the model based approach and stan-dardized approach are not a material cause of RWA differences.
The Group’s exposure weighted-average maturity of its corporate portfolio is lower than the foundation IRB value of 2.5 years, and lower maturities would result in a lower model-based risk weight curve than shown in the graph. In addition, the PD for each rating shown in the graph are consistent with the Group’s PD masterscale.
22 Credit risk
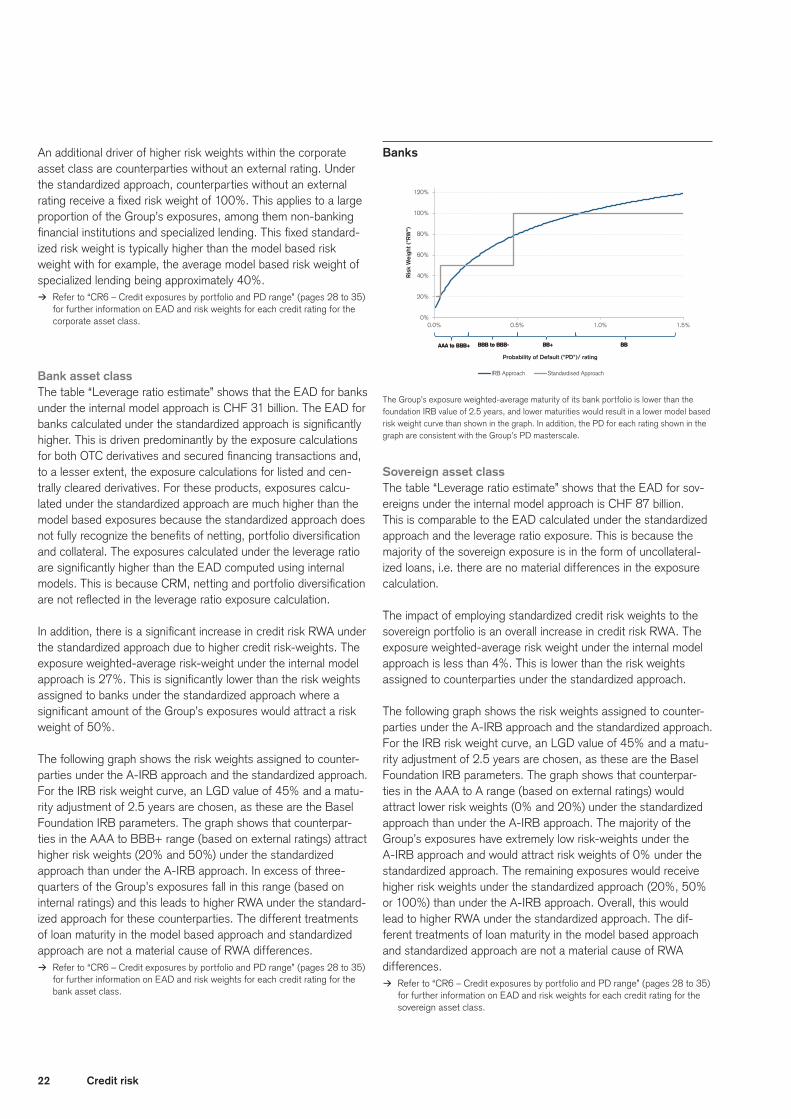
Banks
0%
20%
40%
60%
80%
100%
120%
0.0% 0.5% 1.0% 1.5%
Ris
k W
eigh
t ("
RW
")
Probability of Default ("PD")/ rating
Banks
IRB Approach Standardised Approach
AAA to BBB+ BB+ BBB to BBB- BB AAA to BBB+ BB+ BBB to BBB- BB
An additional driver of higher risk weights within the corporate asset class are counterparties without an external rating. Under the standardized approach, counterparties without an external rating receive a fixed risk weight of 100%. This applies to a large proportion of the Group’s exposures, among them non-banking financial institutions and specialized lending. This fixed standard-ized risk weight is typically higher than the model based risk weight with for example, the average model based risk weight of specialized lending being approximately 40%.
> Refer to “CR6 – Credit exposures by portfolio and PD range” (pages 28 to 35) for further information on EAD and risk weights for each credit rating for the corporate asset class.
Bank asset classThe table “Leverage ratio estimate” shows that the EAD for banks under the internal model approach is CHF 31 billion. The EAD for banks calculated under the standardized approach is significantly higher. This is driven predominantly by the exposure calculations for both OTC derivatives and secured financing transactions and, to a lesser extent, the exposure calculations for listed and cen-trally cleared derivatives. For these products, exposures calcu-lated under the standardized approach are much higher than the model based exposures because the standardized approach does not fully recognize the benefits of netting, portfolio diversification and collateral. The exposures calculated under the leverage ratio are significantly higher than the EAD computed using internal models. This is because CRM, netting and portfolio diversification are not reflected in the leverage ratio exposure calculation.
In addition, there is a significant increase in credit risk RWA under the standardized approach due to higher credit risk-weights. The exposure weighted-average risk-weight under the internal model approach is 27%. This is significantly lower than the risk weights assigned to banks under the standardized approach where a significant amount of the Group’s exposures would attract a risk weight of 50%.
The following graph shows the risk weights assigned to counter-parties under the A-IRB approach and the standardized approach. For the IRB risk weight curve, an LGD value of 45% and a matu-rity adjustment of 2.5 years are chosen, as these are the Basel Foundation IRB parameters. The graph shows that counterpar-ties in the AAA to BBB+ range (based on external ratings) attract higher risk weights (20% and 50%) under the standardized approach than under the A-IRB approach. In excess of three-quarters of the Group’s exposures fall in this range (based on internal ratings) and this leads to higher RWA under the standard-ized approach for these counterparties. The different treatments of loan maturity in the model based approach and standardized approach are not a material cause of RWA differences.
> Refer to “CR6 – Credit exposures by portfolio and PD range” (pages 28 to 35) for further information on EAD and risk weights for each credit rating for the bank asset class.
The Group’s exposure weighted-average maturity of its bank portfolio is lower than the foundation IRB value of 2.5 years, and lower maturities would result in a lower model based risk weight curve than shown in the graph. In addition, the PD for each rating shown in the graph are consistent with the Group’s PD masterscale.
Sovereign asset classThe table “Leverage ratio estimate” shows that the EAD for sov-ereigns under the internal model approach is CHF 87 billion. This is comparable to the EAD calculated under the standardized approach and the leverage ratio exposure. This is because the majority of the sovereign exposure is in the form of uncollateral-ized loans, i.e. there are no material differences in the exposure calculation.
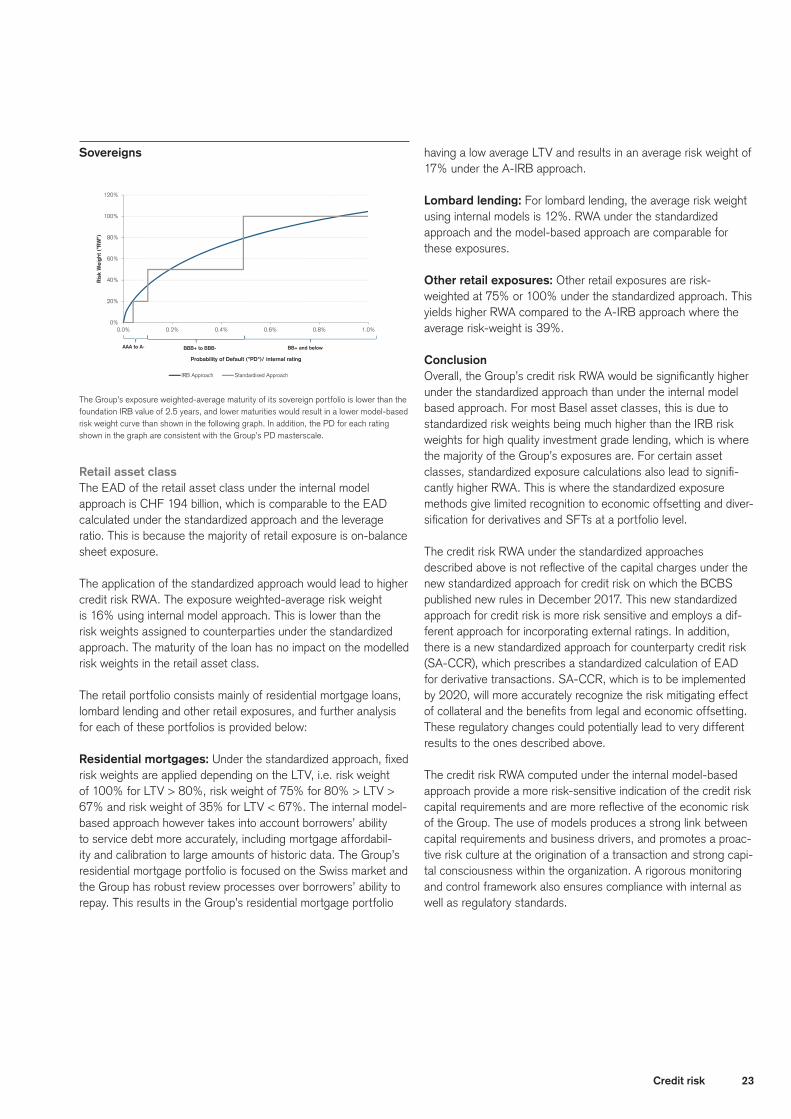
The impact of employing standardized credit risk weights to the sovereign portfolio is an overall increase in credit risk RWA. The exposure weighted-average risk weight under the internal model approach is less than 4%. This is lower than the risk weights assigned to counterparties under the standardized approach.
The following graph shows the risk weights assigned to counter-parties under the A-IRB approach and the standardized approach. For the IRB risk weight curve, an LGD value of 45% and a matu-rity adjustment of 2.5 years are chosen, as these are the Basel Foundation IRB parameters. The graph shows that counterpar-ties in the AAA to A range (based on external ratings) would attract lower risk weights (0% and 20%) under the standardized approach than under the A-IRB approach. The majority of the Group’s exposures have extremely low risk-weights under the A-IRB approach and would attract risk weights of 0% under the standardized approach. The remaining exposures would receive higher risk weights under the standardized approach (20%, 50% or 100%) than under the A-IRB approach. Overall, this would lead to higher RWA under the standardized approach. The dif-ferent treatments of loan maturity in the model based approach and standardized approach are not a material cause of RWA differences.
> Refer to “CR6 – Credit exposures by portfolio and PD range” (pages 28 to 35) for further information on EAD and risk weights for each credit rating for the sovereign asset class.
23Credit risk
Sovereigns
0%
20%
40%
60%
80%
100%
120%
0.0% 0.2% 0.4% 0.6% 0.8% 1.0%
Ris
k W
eigh
t ("
RW
")
Probability of Default ("PD")/ internal rating
Sovereigns
IRB Approach Standardised Approach
AAA to A- BBB+ to BBB- BB+ and below
The Group’s exposure weighted-average maturity of its sovereign portfolio is lower than the foundation IRB value of 2.5 years, and lower maturities would result in a lower model-based risk weight curve than shown in the following graph. In addition, the PD for each rating shown in the graph are consistent with the Group’s PD masterscale.
Retail asset classThe EAD of the retail asset class under the internal model approach is CHF 194 billion, which is comparable to the EAD calculated under the standardized approach and the leverage ratio. This is because the majority of retail exposure is on-balance sheet exposure.
The application of the standardized approach would lead to higher credit risk RWA. The exposure weighted-average risk weight is 16% using internal model approach. This is lower than the risk weights assigned to counterparties under the standardized approach. The maturity of the loan has no impact on the modelled risk weights in the retail asset class.
The retail portfolio consists mainly of residential mortgage loans, lombard lending and other retail exposures, and further analysis for each of these portfolios is provided below:
Residential mortgages: Under the standardized approach, fixed risk weights are applied depending on the LTV, i.e. risk weight of 100% for LTV > 80%, risk weight of 75% for 80% > LTV > 67% and risk weight of 35% for LTV < 67%. The internal model-based approach however takes into account borrowers’ ability to service debt more accurately, including mortgage affordabil-ity and calibration to large amounts of historic data. The Group’s residential mortgage portfolio is focused on the Swiss market and the Group has robust review processes over borrowers’ ability to repay. This results in the Group’s residential mortgage portfolio
having a low average LTV and results in an average risk weight of 17% under the A-IRB approach.
Lombard lending: For lombard lending, the average risk weight using internal models is 12%. RWA under the standardized approach and the model-based approach are comparable for these exposures.
Other retail exposures: Other retail exposures are risk-weighted at 75% or 100% under the standardized approach. This yields higher RWA compared to the A-IRB approach where the average risk-weight is 39%.
ConclusionOverall, the Group’s credit risk RWA would be significantly higher under the standardized approach than under the internal model based approach. For most Basel asset classes, this is due to standardized risk weights being much higher than the IRB risk weights for high quality investment grade lending, which is where the majority of the Group’s exposures are. For certain asset classes, standardized exposure calculations also lead to signifi-cantly higher RWA. This is where the standardized exposure methods give limited recognition to economic offsetting and diver-sification for derivatives and SFTs at a portfolio level.
The credit risk RWA under the standardized approaches described above is not reflective of the capital charges under the new standardized approach for credit risk on which the BCBS published new rules in December 2017. This new standardized approach for credit risk is more risk sensitive and employs a dif-ferent approach for incorporating external ratings. In addition, there is a new standardized approach for counterparty credit risk (SA-CCR), which prescribes a standardized calculation of EAD for derivative transactions. SA-CCR, which is to be implemented by 2020, will more accurately recognize the risk mitigating effect of collateral and the benefits from legal and economic offsetting. These regulatory changes could potentially lead to very different results to the ones described above.
The credit risk RWA computed under the internal model-based approach provide a more risk-sensitive indication of the credit risk capital requirements and are more reflective of the economic risk of the Group. The use of models produces a strong link between capital requirements and business drivers, and promotes a proac-tive risk culture at the origination of a transaction and strong capi-tal consciousness within the organization. A rigorous monitoring and control framework also ensures compliance with internal as well as regulatory standards.

24 Credit risk
Credit risk under internal risk-based approaches
GeneralUnder the IRB approach, risk weights are determined by using internal risk parameters and applying an asset value correlation multiplier uplift where exposures are to financial institutions meet-ing regulatory defined criteria. We have received approval from FINMA to use, and have fully implemented, the A-IRB approach whereby we provide our own estimates for PD, LGD and EAD.
PD parameters capture the risk of a counterparty defaulting over a one-year time horizon. PD estimates are mainly derived from models tailored to the specific business of the respective obligor. The models are calibrated to the long run average of annual inter-nal or external default rates where applicable. For portfolios with a small number of empirical defaults, low default portfolio tech-niques are used.
LGD parameters consider seniority, collateral, counterparty indus-try and in certain cases fair value markdowns. LGD estimates are mainly based on an empirical analysis of historical loss rates. To reflect time value of money, recovered amounts on defaulted obligations are discounted to the time of default and to account for potential adverse outcomes in a downturn environment, final parameters are chosen such as they reflect periods where eco-nomic downturns have been observed and/or where increased losses manifested. For portfolios with low amount of statistical values available conservative values are chosen based on proxy analysis and expert judgement. For much of the private, corporate and institutional banking businesses loan portfolio, the LGD is pri-marily dependent upon the type and amount of collateral pledged. The credit approval and collateral monitoring process are based on LTV limits. For mortgages (residential or commercial), recovery rates are differentiated by type of property.
EAD is either derived from balance sheet values or by using models. EAD for a non-defaulted facility is an estimate of the expected exposure upon default of the obligor. Estimates are derived based on a CCF approach using default-weighted aver-ages of historical realized conversion factors on defaulted loans by facility type. Estimates are calibrated to capture negative oper-ating environment effects. To comply with regulatory guidance in deriving individual observed CCF values as basis for the estima-tion are floored at zero, i.e. it is assumed that drawn exposure can never become lower in the run to default.
> Refer to “Credit risk” (pages 158 to 161) in III – Treasury, Risk, Balance sheet and Off-balance sheet – Risk management – Risk coverage and management in the Credit Suisse Annual Report 2018 for further information on PD and LGD.
Risk weights are calculated using either the PD/LGD approach or the supervisory risk weights approach for certain types of special-ized lending.
Reporting related to credit risk models > Refer to “Model validation” (pages 25 to 26), “Use of internal ratings” (page
27) and “Credit Risk Review” (page 27) for further information on the scope and main content of the reporting related to credit risk models.
Rating modelsThe majority of the credit rating models used in Credit Suisse are developed internally by Credit Analytics, a specialized unit in Credit Risk Management. These models are independently vali-dated by Model Risk Management team prior to use in the Basel III regulatory capital calculation, and thereafter on a regular basis. Credit Suisse also uses models purchased from recognized data and model providers (e.g. credit rating agencies). These models are owned by Credit Analytics and are validated internally and fol-low the same governance process as models developed internally.
All new or material changes to rating models are subject to a robust governance process. Post development and validation of a rating model or model change, the model is taken through a num-ber of committees where model developers, validators and users of the models discuss the technical and regulatory aspects of the model. The relevant committees opine on the information pro-vided and decide to either approve or reject the model or model change. The ultimate decision making committee is the Risk Pro-cesses & Standards Committee (RPSC). The responsible Execu-tive Board Member for the RPSC is the Chief Risk Officer. The RPSC sub-group responsible for credit risk models is the Credit Methodology Steering Committee (CMSC). RPSC or CMSC also review and monitor the continued use of existing models on an annual basis.
The following table provides an overview of the main PD and LGD models used by Credit Suisse. It reflects the portfolio seg-mentation from a credit risk model point of view, showing the RWA, type and number of the most significant models, and the loss period available for model development by portfolio. As the table follows an internal risk segmentation and captures the most significant models only, these figures do not match regulatory asset class or other A-IRB based segmentation.
Some of the portfolios shown in the table sum up multiple rating models. The distinction criteria determining which model applies, differs from portfolio to portfolio. Corporates, banks and non-banking financial institutions are split by turnover and geography. For funds, the distinction criteria is the different form of funds e.g. mutual-, hedge-funds etc., whereas for income producing real estate (IPRE), it is corporate vs. private counterparties. The distinction criteria for Sovereign is global governments vs. Swiss Canton vs. local governments (e.g. cities).

25Credit risk
CRE – Main PD and LGD models used by Credit Suisse PD LGD
Risk-
weighted Number
assets (in of years No. of No. of
Portfolio Asset class CHF billion) loss data models Model comment models Model comment
Statistical and hybrid models using
e.g. industry and counterparty
segmentation, collateral types and
amounts, seniority and other
transaction specific factors with
granularity enhancements by public
research and expert judgement
Corporates Corporates, 46 >15 years 2 Statistical scorecards using e.g. 3
retail balance sheet, profit & loss data and
qualitative factors
Banks and Banks, 9 >30 years 5 Statistical scorecard and constrained
other corporates expert judgement using e.g. balance
financial sheet, profit & loss data and
institutions qualitative factors
Funds Corporates 10 >10 years 5 Statistical scorecards using e.g. net
asset value, volatility of returns and
qualitative factors
Statistical model using e.g.
counterparty segmentation,
collateral types and amounts
Residential Retail 11 >10 years 1 Statistical scorecard using e.g. 1
mortgages LTV, affordability, assets
and qualitative factors
Income Specialized 18 >10 years 2 Statistical scorecards using e.g.
producing lending, retail LTV, debt service coverage
real estate and qualitative factors
Commodity Corporates, 3 >10 years 1 Statistical scorecard using e.g.
traders specialized lending volume, liquidity and duration of
financed commodity transactions
Sovereign Sovereign, 3 >10 years 1 Statistical scorecards 1 Statistical models using e.g. industry corporates using e.g. GDP, financials and and counterparty segmentation, qualitative factors seniority and other transaction specific factors
Ship Specialized 3 >10 years 1 Simulation model using e.g. freight 1 Simulation model using e.g. freight finance lending rates, time charter agreements, rates, time charter agreements, operational expenses and debt operational expenses and debt service coverage service coverage
Lombard, Retail 15 >10 years 1 Merton type model using e.g. 1 Merton type model using e.g. Securities LTV, collateral volatility and LTV, collateral volatility and
Borrowing & counterparty attributes counterparty attributes
Lending
Model developmentThe techniques to develop models are carefully selected by Credit Analytics to meet industry standards in the banking industry as well as regulatory requirements. The models are developed to exhibit “through-the-cycle” characteristics, reflecting a PD in a 12 month period across the credit cycle.
All models have clearly defined model owners who have primary responsibility for development, enhancement, review, mainte-nance and documentation. The models have to pass statistical performance tests, where feasible, followed by usability tests by designated Credit Risk Management experts to proceed to formal approval and implementation. The development process of a new model is thoroughly documented and foresees a separate sched-ule for model updates.
The level of calibration of the models is based on a range of inputs, including internal and external benchmarks where avail-able. Additionally, the calibration process ensures that the esti-mated calibration level accounts for variations of default rates through the economic cycle and that the underlying data contains a representative mix of economic states. Conservatism is incor-porated in the model development process to compensate for any known or suspected limitations and uncertainties.
Model validationModel validation for risk capital models is performed by the Model Risk Management function. Model governance is subject to clear and objective internal standards as outlined in the Model Risk Management policy and the Model Validation Policy. The gover-nance framework ensures a consistent and meaningful approach for the validation of models in scope across the bank. All models whose outputs fall into the scope of the Basel internal model framework are subject to full independent validation. Externally developed models are subject to the same governance and vali-dation standards as internal models.
The governance process requires each in scope model to be validated and approved before go-live; the same process is fol-lowed for material changes to an existing model. Existing models are subject to an ongoing governance process which requires each model to be periodically validated and the performance to be monitored annually. The validation process is a comprehensive quantitative and qualitative assessment with goals that include: p to confirm that the model remains conceptually sound and the
model design is suitable for its intended purpose;p to verify that the assumptions are still valid and weaknesses
and limitations are known and mitigated;p to determine that the model outputs are accurate compared to
realized outcome;
26 Credit risk
p to establish whether the model is accepted by the users and used as intended with appropriate data governance;
p to check whether a model is implemented correctly;p to ensure that the model is fully transparent and sufficiently
documented.
To meet these goals, models are validated against a series of quantitative and qualitative criteria. Quantitative analyses may include a review of model performance (comparison of model output against realized outcome), calibration accuracy against the longest time series available, assessment of a model’s ability to rank order risk and performance against available benchmarks. Qualitative assessment typically includes a review of the appro-priateness of the key model assumptions, the identification of the model limitations and their mitigation, and ensuring appropri-ate model use. The modeling approach is re-assessed in light of developments in the academic literature and industry practice.
Results and conclusions are presented to senior risk management including the RPSC; shortcomings and required improvements identified during validation must be remediated within an agreed deadline. The Model Risk Management function is independent of model developers and users and has the final say on the content of each validation report.
Model governance at Credit Suisse follows the “three lines of defense” principle. Model developers and owners provide the first line of defense, Model Risk Management the second line, and Internal Audit the third line of defense. Organization independence ensures that these functions are able to provide appropriate over-sight. For Credit Risk models, the development and validation functions are independent up to the Chief Risk Officer (Executive Board level). Internal Audit has fully independent reporting into the Chair of the Board of Directors Audit Committee.
Stress testing of parametersThe potential biases in PD estimates in unusual market condi-tions are accounted for by the use of long run average estimates. Credit Suisse additionally uses stress-testing when back-testing PD models. When predefined thresholds are breached during back-testing, a review of the calibration level is undertaken. For LGD/CCF calibration stress testing is applied in defining Down-turn LGD/CCF values, reflecting potentially increased losses dur-ing stressed periods.
Descriptions of the rating processesAll counterparties that Credit Suisse is exposed to are assigned an internal credit rating. The rating is assigned at the time of initial credit approval and subsequently reviewed and updated regularly. Where available, Credit Risk Management employs rating models relative to the counterparty type that incorporate qualitative and quantitative factors. Expert judgement may further be applied through a well governed model override process in the assign-ment of a credit rating or PD, which measures the counterparty’s risk of default over a one-year period.
Corporates (excluding corporates managed on the Swiss platform), banks and sovereigns (primarily in the investment banking businesses)Where used, rating models are an integral part of the rating process. To ensure all relevant information is considered when rating a counterparty, experienced credit officers complement the outputs from the models with other relevant information not otherwise captured via a robust model-override framework. Other relevant information may include, but is not limited to peer analy-sis, industry comparisons, external ratings and research and the judgment of credit experts. This analysis emphasizes a forward looking approach, concentrating on economic trends and financial fundamentals. Where rating models are not used the assignment of credit ratings is based on a well-established expert judgment based process which captures key factors specific to the type of counterparty.
For structured and asset finance deals, the approach is more quantitative. The focus is on the performance of the underlying assets, which represent the collateral of the deal. The ultimate rating is dependent upon the expected performance of the under-lying assets and the level of credit enhancement of the specific transaction. Additionally, a review of the originator and/or servicer is performed. External ratings and research (rating agency and/or fixed income and equity), where available, are incorporated into the rating justification, as is any available market information (e.g., bond spreads, equity performance).
Transaction ratings are based on the analysis and evaluation of both quantitative and qualitative factors. The specific factors ana-lyzed include seniority, industry and collateral.
Corporates managed on the Swiss platform, mortgages and other retail (primarily in the private, corporate and institutional banking businesses) For corporates managed on the Swiss platform and mortgage lending, the PD is calculated directly by proprietary statisti-cal rating models, which are based on internally compiled data comprising both quantitative factors (primarily LTV ratio and the borrower’s income level for mortgage lending and balance sheet information for corporates) and qualitative factors (e.g., credit histories from credit reporting bureaus, management quality). In this case, an equivalent rating is assigned for reporting purposes, based on the PD band associated with each rating. Collateral loans (margin lending), which form the largest part of “Other retail”, is also following an individual PD and LGD approach. This approach is already rolled out for loans booked on the Swiss plat-form and for the majority of international locations; the remaining international locations follow a pool PD and pool LGD approach. Both approaches are calibrated to historical loss experience. Most of the collateral loans are loans collateralized by securities.
The internal rating grades are mapped to the Credit Suisse Inter-nal Masterscale. The PDs assigned to each rating grade are reflected in the following table.
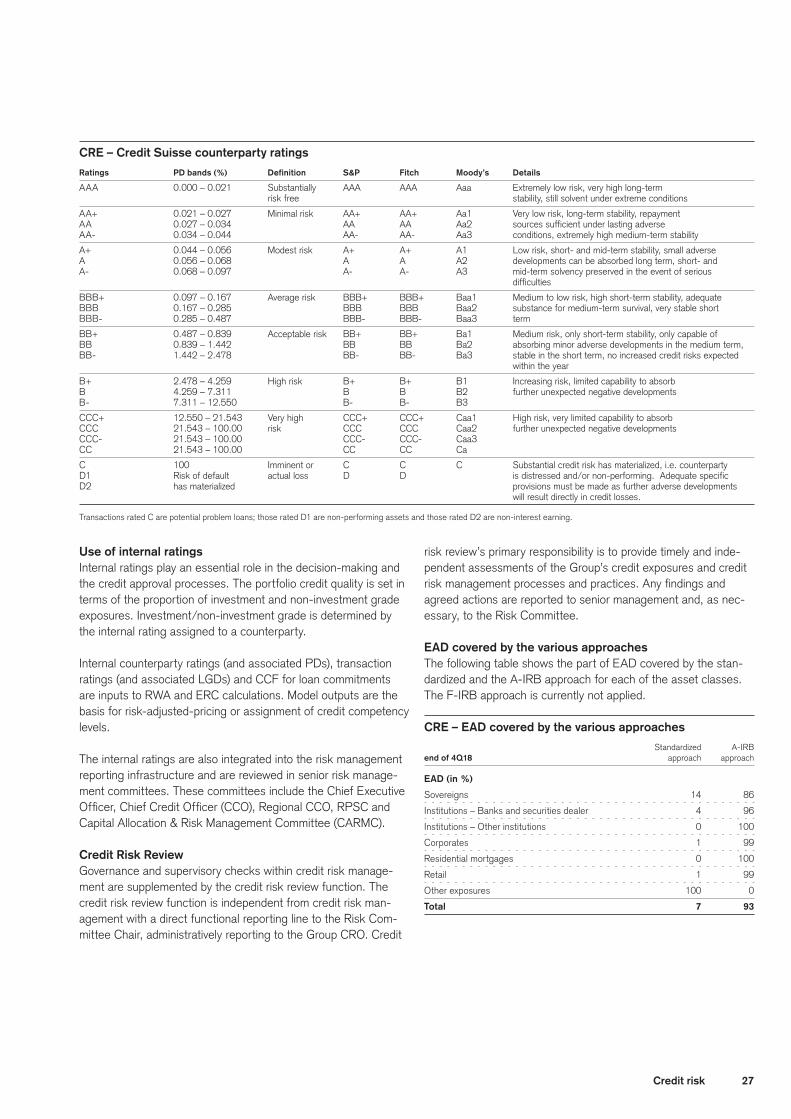
27Credit risk
CRE – Credit Suisse counterparty ratings
Ratings PD bands (%) Definition S&P Fitch Moody’s Details
AAA 0.000 – 0.021 Substantially AAA AAA Aaa Extremely low risk, very high long-term
risk free stability, still solvent under extreme conditions
AA+ 0.021 – 0.027 Minimal risk AA+ AA+ Aa1 Very low risk, long-term stability, repayment
AA 0.027 – 0.034 AA AA Aa2 sources sufficient under lasting adverse
AA- 0.034 – 0.044 AA- AA- Aa3 conditions, extremely high medium-term stability
A+ 0.044 – 0.056 Modest risk A+ A+ A1 Low risk, short- and mid-term stability, small adverse
A 0.056 – 0.068 A A A2 developments can be absorbed long term, short- and
A- 0.068 – 0.097 A- A- A3 mid-term solvency preserved in the event of serious difficulties
BBB+ 0.097 – 0.167 Average risk BBB+ BBB+ Baa1 Medium to low risk, high short-term stability, adequate
BBB 0.167 – 0.285 BBB BBB Baa2 substance for medium-term survival, very stable short
BBB- 0.285 – 0.487 BBB- BBB- Baa3 term
BB+ 0.487 – 0.839 Acceptable risk BB+ BB+ Ba1 Medium risk, only short-term stability, only capable of
BB 0.839 – 1.442 BB BB Ba2 absorbing minor adverse developments in the medium term,
BB- 1.442 – 2.478 BB- BB- Ba3 stable in the short term, no increased credit risks expected within the year
B+ 2.478 – 4.259 High risk B+ B+ B1 Increasing risk, limited capability to absorb
B 4.259 – 7.311 B B B2 further unexpected negative developments
B- 7.311 – 12.550 B- B- B3
CCC+ 12.550 – 21.543 Very high CCC+ CCC+ Caa1 High risk, very limited capability to absorb
CCC 21.543 – 100.00 risk CCC CCC Caa2 further unexpected negative developments
CCC- 21.543 – 100.00 CCC- CCC- Caa3
CC 21.543 – 100.00 CC CC Ca
C 100 Imminent or C C C Substantial credit risk has materialized, i.e. counterparty
D1 Risk of default actual loss D D is distressed and/or non-performing. Adequate specific
D2 has materialized provisions must be made as further adverse developments will result directly in credit losses.
Transactions rated C are potential problem loans; those rated D1 are non-performing assets and those rated D2 are non-interest earning.
Use of internal ratingsInternal ratings play an essential role in the decision-making and the credit approval processes. The portfolio credit quality is set in terms of the proportion of investment and non-investment grade exposures. Investment/non-investment grade is determined by the internal rating assigned to a counterparty.
Internal counterparty ratings (and associated PDs), transaction ratings (and associated LGDs) and CCF for loan commitments are inputs to RWA and ERC calculations. Model outputs are the basis for risk-adjusted-pricing or assignment of credit competency levels.
The internal ratings are also integrated into the risk management reporting infrastructure and are reviewed in senior risk manage-ment committees. These committees include the Chief Executive Officer, Chief Credit Officer (CCO), Regional CCO, RPSC and Capital Allocation & Risk Management Committee (CARMC).
Credit Risk ReviewGovernance and supervisory checks within credit risk manage-ment are supplemented by the credit risk review function. The credit risk review function is independent from credit risk man-agement with a direct functional reporting line to the Risk Com-mittee Chair, administratively reporting to the Group CRO. Credit
risk review’s primary responsibility is to provide timely and inde-pendent assessments of the Group’s credit exposures and credit risk management processes and practices. Any findings and agreed actions are reported to senior management and, as nec-essary, to the Risk Committee.
EAD covered by the various approachesThe following table shows the part of EAD covered by the stan-dardized and the A-IRB approach for each of the asset classes. The F-IRB approach is currently not applied.
CRE – EAD covered by the various approaches Standardized A-IRB
end of 4Q18 approach approach
EAD (in %)
Sovereigns 14 86
Institutions – Banks and securities dealer 4 96
Institutions – Other institutions 0 100
Corporates 1 99
Residential mortgages 0 100
Retail 1 99
Other exposures 100 0
Total 7 93
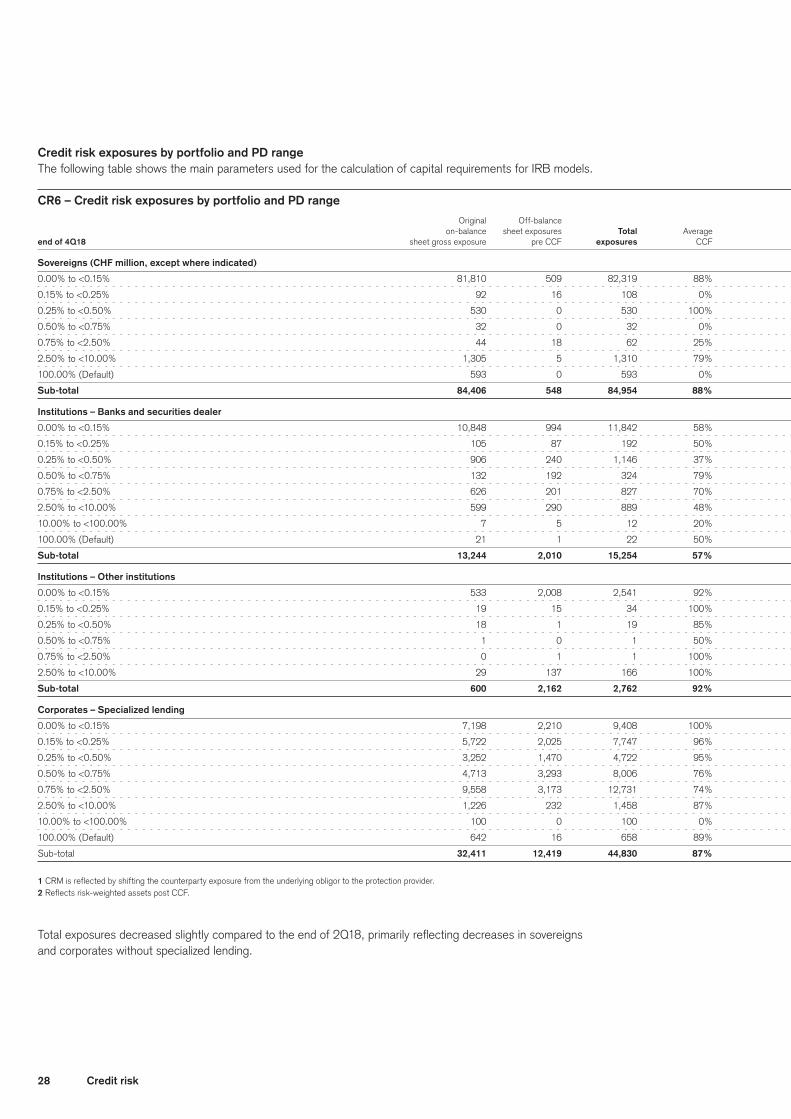
28 Credit risk
Credit risk exposures by portfolio and PD rangeThe following table shows the main parameters used for the calculation of capital requirements for IRB models.
CR6 – Credit risk exposures by portfolio and PD range Original Off-balance EAD post- Number Average
on-balance sheet exposures Total Average CRM and Average of Average maturity RWA Expected
end of 4Q18 sheet gross exposure pre CCF exposures CCF post-CCF 1 PD obligors LGD (years) RWA 2 density loss Provisions
Sovereigns (CHF million, except where indicated)
0.00% to <0.15% 81,810 509 82,319 88% 82,440 0.02% 68 4% 1.2 1,048 1% 1 –
0.15% to <0.25% 92 16 108 0% 92 0.22% 9 51% 3.0 59 63% 0 –
0.25% to <0.50% 530 0 530 100% 406 0.37% 7 51% 1.4 233 57% 1 –
0.50% to <0.75% 32 0 32 0% 32 0.64% 24 42% 4.9 34 106% 0 –
0.75% to <2.50% 44 18 62 25% 48 1.40% 11 42% 1.0 41 87% 0 –
2.50% to <10.00% 1,305 5 1,310 79% 358 6.45% 24 51% 2.6 713 199% 13 –
100.00% (Default) 593 0 593 0% 346 100.00% 2 58% 3.8 367 106% 0 –
Sub-total 84,406 548 84,954 88% 83,722 0.47% 145 5% 1.2 2,495 3% 15 0
Institutions – Banks and securities dealer
0.00% to <0.15% 10,848 994 11,842 58% 12,870 0.06% 711 55% 0.6 2,014 16% 4 –
0.15% to <0.25% 105 87 192 50% 320 0.22% 82 49% 1.2 153 48% 0 –
0.25% to <0.50% 906 240 1,146 37% 980 0.37% 165 54% 1.4 645 66% 2 –
0.50% to <0.75% 132 192 324 79% 226 0.60% 107 47% 0.6 166 73% 1 –
0.75% to <2.50% 626 201 827 70% 626 1.25% 228 56% 0.8 620 99% 3 –
2.50% to <10.00% 599 290 889 48% 487 4.92% 116 51% 0.8 764 157% 13 –
10.00% to <100.00% 7 5 12 20% 8 16.44% 6 53% 0.2 21 255% 1 –
100.00% (Default) 21 1 22 50% 22 100.00% 7 55% 1.5 23 106% 34 –
Sub-total 13,244 2,010 15,254 57% 15,539 0.44% 1,422 54% 0.7 4,406 28% 58 34
Institutions – Other institutions
0.00% to <0.15% 533 2,008 2,541 92% 1,079 0.04% 428 43% 1.8 156 14% 0 –
0.15% to <0.25% 19 15 34 100% 23 0.21% 21 36% 1.9 9 40% 0 –
0.25% to <0.50% 18 1 19 85% 19 0.36% 11 49% 2.1 13 69% 0 –
0.50% to <0.75% 1 0 1 50% 1 0.58% 53 47% 1.2 1 72% 0 –
0.75% to <2.50% 0 1 1 100% 1 1.03% 19 41% 1.8 0 82% 0 –
2.50% to <10.00% 29 137 166 100% 48 5.08% 4 9% 4.9 17 36% 0 –
Sub-total 600 2,162 2,762 92% 1,171 0.26% 536 42% 1.9 196 17% 0 0
Corporates – Specialized lending
0.00% to <0.15% 7,198 2,210 9,408 100% 8,073 0.06% 854 28% 2.1 1,603 20% 1 –
0.15% to <0.25% 5,722 2,025 7,747 96% 6,608 0.22% 748 28% 2.3 2,455 37% 4 –
0.25% to <0.50% 3,252 1,470 4,722 95% 3,902 0.37% 559 28% 2.1 1,872 48% 4 –
0.50% to <0.75% 4,713 3,293 8,006 76% 5,839 0.58% 407 21% 2.0 2,141 37% 7 –
0.75% to <2.50% 9,558 3,173 12,731 74% 10,602 1.33% 792 18% 2.7 4,784 45% 25 –
2.50% to <10.00% 1,226 232 1,458 87% 1,315 4.59% 93 17% 3.0 776 59% 10 –
10.00% to <100.00% 100 0 100 0% 100 14.08% 4 18% 3.7 89 89% 3 –
100.00% (Default) 642 16 658 89% 559 100.00% 45 17% 2.7 593 106% 90 –
Sub-total 32,411 12,419 44,830 87% 36,998 2.27% 3,502 24% 2.3 14,313 39% 144 90
1 CRM is reflected by shifting the counterparty exposure from the underlying obligor to the protection provider.2 Reflects risk-weighted assets post CCF.
Total exposures decreased slightly compared to the end of 2Q18, primarily reflecting decreases in sovereigns and corporates without specialized lending.

29Credit risk
Credit risk exposures by portfolio and PD rangeThe following table shows the main parameters used for the calculation of capital requirements for IRB models.
CR6 – Credit risk exposures by portfolio and PD range Original Off-balance EAD post- Number Average
on-balance sheet exposures Total Average CRM and Average of Average maturity RWA Expected
end of 4Q18 sheet gross exposure pre CCF exposures CCF post-CCF 1 PD obligors LGD (years) RWA 2 density loss Provisions
Sovereigns (CHF million, except where indicated)
0.00% to <0.15% 81,810 509 82,319 88% 82,440 0.02% 68 4% 1.2 1,048 1% 1 –
0.15% to <0.25% 92 16 108 0% 92 0.22% 9 51% 3.0 59 63% 0 –
0.25% to <0.50% 530 0 530 100% 406 0.37% 7 51% 1.4 233 57% 1 –
0.50% to <0.75% 32 0 32 0% 32 0.64% 24 42% 4.9 34 106% 0 –
0.75% to <2.50% 44 18 62 25% 48 1.40% 11 42% 1.0 41 87% 0 –
2.50% to <10.00% 1,305 5 1,310 79% 358 6.45% 24 51% 2.6 713 199% 13 –
100.00% (Default) 593 0 593 0% 346 100.00% 2 58% 3.8 367 106% 0 –
Sub-total 84,406 548 84,954 88% 83,722 0.47% 145 5% 1.2 2,495 3% 15 0
Institutions – Banks and securities dealer
0.00% to <0.15% 10,848 994 11,842 58% 12,870 0.06% 711 55% 0.6 2,014 16% 4 –
0.15% to <0.25% 105 87 192 50% 320 0.22% 82 49% 1.2 153 48% 0 –
0.25% to <0.50% 906 240 1,146 37% 980 0.37% 165 54% 1.4 645 66% 2 –
0.50% to <0.75% 132 192 324 79% 226 0.60% 107 47% 0.6 166 73% 1 –
0.75% to <2.50% 626 201 827 70% 626 1.25% 228 56% 0.8 620 99% 3 –
2.50% to <10.00% 599 290 889 48% 487 4.92% 116 51% 0.8 764 157% 13 –
10.00% to <100.00% 7 5 12 20% 8 16.44% 6 53% 0.2 21 255% 1 –
100.00% (Default) 21 1 22 50% 22 100.00% 7 55% 1.5 23 106% 34 –
Sub-total 13,244 2,010 15,254 57% 15,539 0.44% 1,422 54% 0.7 4,406 28% 58 34
Institutions – Other institutions
0.00% to <0.15% 533 2,008 2,541 92% 1,079 0.04% 428 43% 1.8 156 14% 0 –
0.15% to <0.25% 19 15 34 100% 23 0.21% 21 36% 1.9 9 40% 0 –
0.25% to <0.50% 18 1 19 85% 19 0.36% 11 49% 2.1 13 69% 0 –
0.50% to <0.75% 1 0 1 50% 1 0.58% 53 47% 1.2 1 72% 0 –
0.75% to <2.50% 0 1 1 100% 1 1.03% 19 41% 1.8 0 82% 0 –
2.50% to <10.00% 29 137 166 100% 48 5.08% 4 9% 4.9 17 36% 0 –
Sub-total 600 2,162 2,762 92% 1,171 0.26% 536 42% 1.9 196 17% 0 0
Corporates – Specialized lending
0.00% to <0.15% 7,198 2,210 9,408 100% 8,073 0.06% 854 28% 2.1 1,603 20% 1 –
0.15% to <0.25% 5,722 2,025 7,747 96% 6,608 0.22% 748 28% 2.3 2,455 37% 4 –
0.25% to <0.50% 3,252 1,470 4,722 95% 3,902 0.37% 559 28% 2.1 1,872 48% 4 –
0.50% to <0.75% 4,713 3,293 8,006 76% 5,839 0.58% 407 21% 2.0 2,141 37% 7 –
0.75% to <2.50% 9,558 3,173 12,731 74% 10,602 1.33% 792 18% 2.7 4,784 45% 25 –
2.50% to <10.00% 1,226 232 1,458 87% 1,315 4.59% 93 17% 3.0 776 59% 10 –
10.00% to <100.00% 100 0 100 0% 100 14.08% 4 18% 3.7 89 89% 3 –
100.00% (Default) 642 16 658 89% 559 100.00% 45 17% 2.7 593 106% 90 –
Sub-total 32,411 12,419 44,830 87% 36,998 2.27% 3,502 24% 2.3 14,313 39% 144 90
1 CRM is reflected by shifting the counterparty exposure from the underlying obligor to the protection provider.2 Reflects risk-weighted assets post CCF.
Total exposures decreased slightly compared to the end of 2Q18, primarily reflecting decreases in sovereigns and corporates without specialized lending.
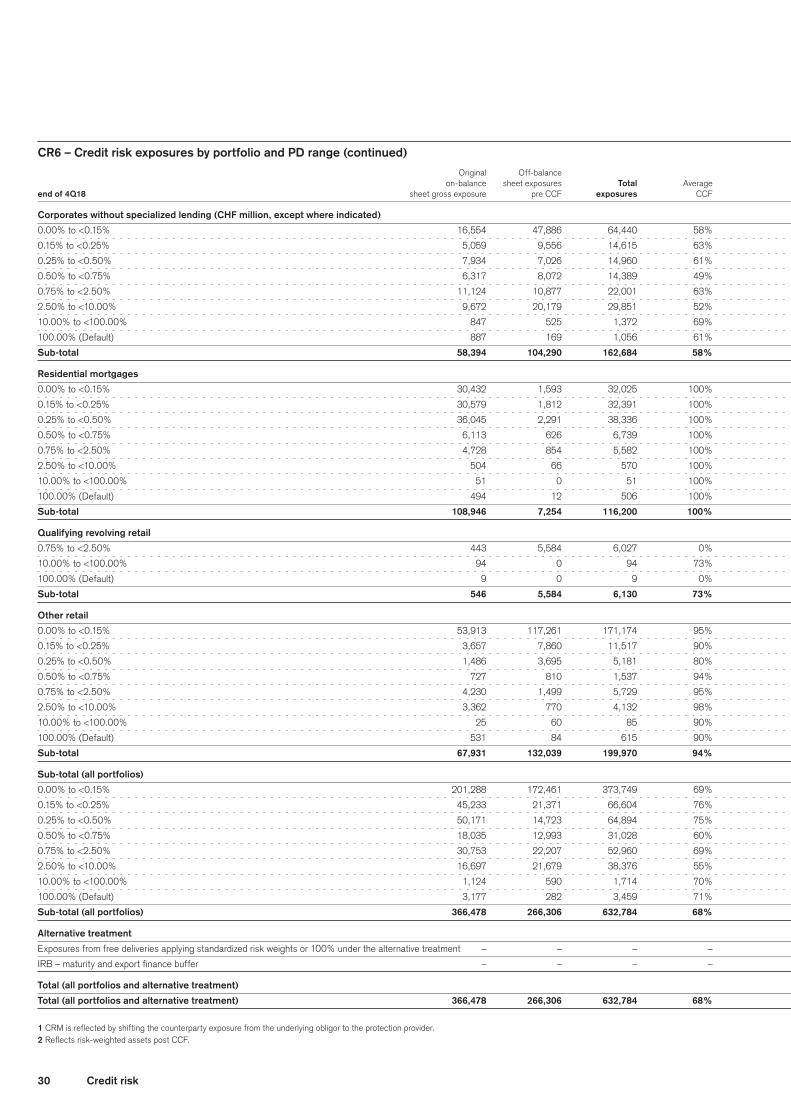
30 Credit risk
CR6 – Credit risk exposures by portfolio and PD range (continued) Original Off-balance EAD post- Number Average
on-balance sheet exposures Total Average CRM and Average of Average maturity RWA Expected
end of 4Q18 sheet gross exposure pre CCF exposures CCF post-CCF 1 PD obligors LGD (years) RWA 2 density loss Provisions
Corporates without specialized lending (CHF million, except where indicated)
0.00% to <0.15% 16,554 47,886 64,440 58% 41,471 0.07% 2,885 41% 2.4 9,591 23% 11 –
0.15% to <0.25% 5,059 9,556 14,615 63% 8,447 0.21% 1,267 38% 2.5 3,603 43% 7 –
0.25% to <0.50% 7,934 7,026 14,960 61% 10,688 0.37% 1,759 39% 2.6 5,896 55% 15 –
0.50% to <0.75% 6,317 8,072 14,389 49% 9,200 0.62% 1,352 41% 2.3 6,415 70% 23 –
0.75% to <2.50% 11,124 10,877 22,001 63% 15,490 1.51% 2,958 41% 2.5 15,304 99% 90 –
2.50% to <10.00% 9,672 20,179 29,851 52% 15,192 5.54% 2,428 35% 2.8 26,759 176% 297 –
10.00% to <100.00% 847 525 1,372 69% 928 17.41% 85 28% 2.6 1,835 198% 43 –
100.00% (Default) 887 169 1,056 61% 734 100.00% 209 38% 1.9 767 104% 291 –
Sub-total 58,394 104,290 162,684 58% 102,150 2.06% 12,943 39% 2.5 70,170 69% 777 309
Residential mortgages
0.00% to <0.15% 30,432 1,593 32,025 100% 31,955 0.08% 46,406 15% 2.8 2,139 7% 4 –
0.15% to <0.25% 30,579 1,812 32,391 100% 31,284 0.18% 40,134 15% 2.8 3,940 13% 9 –
0.25% to <0.50% 36,045 2,291 38,336 100% 37,069 0.31% 48,313 15% 2.9 6,749 18% 17 –
0.50% to <0.75% 6,113 626 6,739 100% 5,425 0.59% 6,757 17% 2.6 1,776 33% 6 –
0.75% to <2.50% 4,728 854 5,582 100% 4,992 1.24% 6,803 18% 2.5 2,725 55% 11 –
2.50% to <10.00% 504 66 570 100% 509 4.42% 844 18% 2.3 575 113% 4 –
10.00% to <100.00% 51 0 51 100% 51 17.83% 69 19% 1.9 112 219% 2 –
100.00% (Default) 494 12 506 100% 478 100.00% 269 17% 1.7 507 106% 25 –
Sub-total 108,946 7,254 116,200 100% 111,763 0.72% 149,595 15% 2.8 18,523 17% 78 25
Qualifying revolving retail
0.75% to <2.50% 443 5,584 6,027 0% 589 1.30% 808,274 50% 1.0 146 25% 4 –
10.00% to <100.00% 94 0 94 73% 95 25.00% 93,274 35% 0.2 100 105% 8 –
100.00% (Default) 9 0 9 0% 4 100.00% 343 35% 0.2 4 106% 5 –
Sub-total 546 5,584 6,130 73% 688 5.14% 901,891 48% 0.9 250 36% 17 5
Other retail
0.00% to <0.15% 53,913 117,261 171,174 95% 62,468 0.04% 49,894 63% 1.4 5,260 8% 18 –
0.15% to <0.25% 3,657 7,860 11,517 90% 4,426 0.19% 3,589 42% 1.4 753 17% 3 –
0.25% to <0.50% 1,486 3,695 5,181 80% 2,038 0.36% 5,612 31% 1.4 397 19% 2 –
0.50% to <0.75% 727 810 1,537 94% 890 0.61% 11,640 40% 1.3 301 34% 2 –
0.75% to <2.50% 4,230 1,499 5,729 95% 4,481 1.62% 80,595 44% 2.3 2,493 56% 31 –
2.50% to <10.00% 3,362 770 4,132 98% 3,666 5.19% 85,017 40% 2.7 2,278 62% 76 –
10.00% to <100.00% 25 60 85 90% 38 14.02% 260 53% 1.9 39 102% 3 –
100.00% (Default) 531 84 615 90% 389 100.00% 5,582 70% 1.5 412 106% 177 –
Sub-total 67,931 132,039 199,970 94% 78,396 0.90% 242,189 58% 1.5 11,933 15% 312 177
Sub-total (all portfolios)
0.00% to <0.15% 201,288 172,461 373,749 69% 240,356 0.05% 101,246 31% 1.7 21,811 9% 39 –
0.15% to <0.25% 45,233 21,371 66,604 76% 51,200 0.19% 45,850 23% 2.6 10,972 21% 23 –
0.25% to <0.50% 50,171 14,723 64,894 75% 55,102 0.33% 56,426 22% 2.7 15,805 29% 41 –
0.50% to <0.75% 18,035 12,993 31,028 60% 21,613 0.60% 20,340 30% 2.2 10,834 50% 39 –
0.75% to <2.50% 30,753 22,207 52,960 69% 36,829 1.43% 899,680 32% 2.5 26,113 71% 164 –
2.50% to <10.00% 16,697 21,679 38,376 55% 21,575 5.40% 88,526 35% 2.7 31,882 148% 413 –
10.00% to <100.00% 1,124 590 1,714 70% 1,220 17.63% 93,698 28% 2.4 2,196 180% 60 –
100.00% (Default) 3,177 282 3,459 71% 2,532 100.00% 6,457 37% 2.2 2,673 106% 622 –
Sub-total (all portfolios) 366,478 266,306 632,784 68% 430,427 1.15% 1,312,223 29% 2.1 122,286 28% 1,401 640
Alternative treatment
Exposures from free deliveries applying standardized risk weights or 100% under the alternative treatment – – – – 29 – – – – 16 – – –
IRB – maturity and export finance buffer – – – – – – – – – 1,972 – – –
Total (all portfolios and alternative treatment)
Total (all portfolios and alternative treatment) 366,478 266,306 632,784 68% 430,456 1.15% 1,312,223 29% 2.1 124,274 28% 1,401 640
1 CRM is reflected by shifting the counterparty exposure from the underlying obligor to the protection provider.2 Reflects risk-weighted assets post CCF.
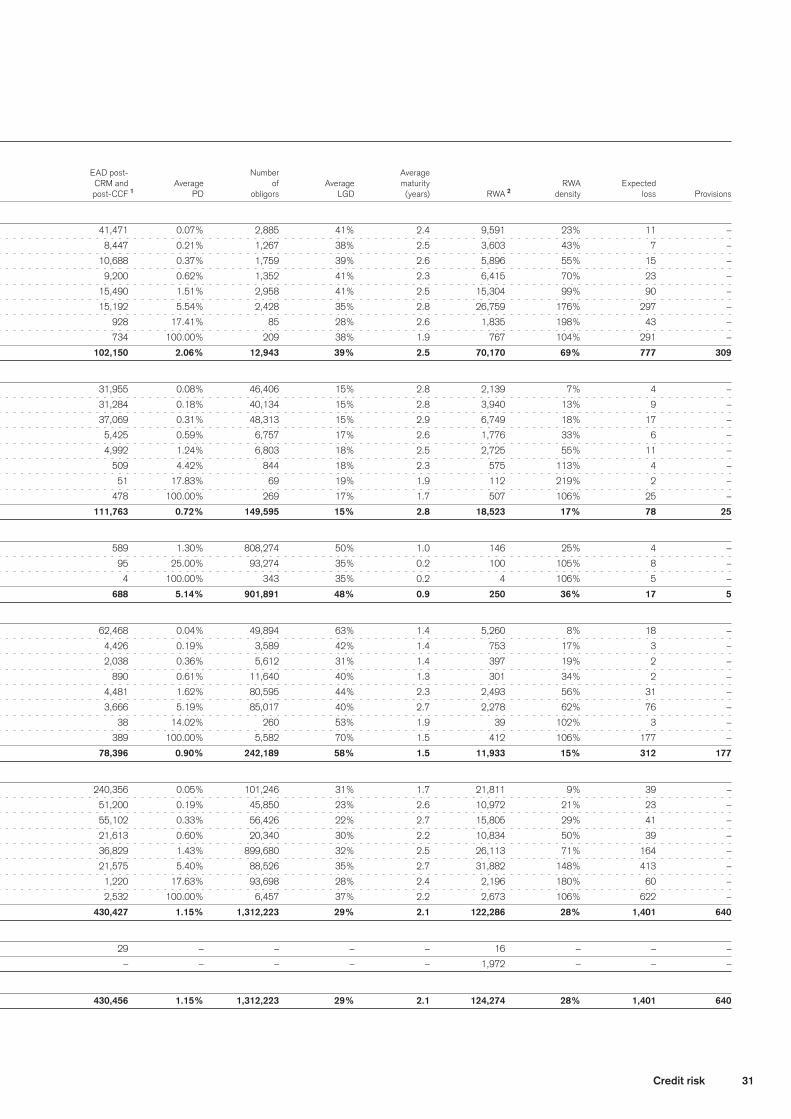
31Credit risk
CR6 – Credit risk exposures by portfolio and PD range (continued) Original Off-balance EAD post- Number Average
on-balance sheet exposures Total Average CRM and Average of Average maturity RWA Expected
end of 4Q18 sheet gross exposure pre CCF exposures CCF post-CCF 1 PD obligors LGD (years) RWA 2 density loss Provisions
Corporates without specialized lending (CHF million, except where indicated)
0.00% to <0.15% 16,554 47,886 64,440 58% 41,471 0.07% 2,885 41% 2.4 9,591 23% 11 –
0.15% to <0.25% 5,059 9,556 14,615 63% 8,447 0.21% 1,267 38% 2.5 3,603 43% 7 –
0.25% to <0.50% 7,934 7,026 14,960 61% 10,688 0.37% 1,759 39% 2.6 5,896 55% 15 –
0.50% to <0.75% 6,317 8,072 14,389 49% 9,200 0.62% 1,352 41% 2.3 6,415 70% 23 –
0.75% to <2.50% 11,124 10,877 22,001 63% 15,490 1.51% 2,958 41% 2.5 15,304 99% 90 –
2.50% to <10.00% 9,672 20,179 29,851 52% 15,192 5.54% 2,428 35% 2.8 26,759 176% 297 –
10.00% to <100.00% 847 525 1,372 69% 928 17.41% 85 28% 2.6 1,835 198% 43 –
100.00% (Default) 887 169 1,056 61% 734 100.00% 209 38% 1.9 767 104% 291 –
Sub-total 58,394 104,290 162,684 58% 102,150 2.06% 12,943 39% 2.5 70,170 69% 777 309
Residential mortgages
0.00% to <0.15% 30,432 1,593 32,025 100% 31,955 0.08% 46,406 15% 2.8 2,139 7% 4 –
0.15% to <0.25% 30,579 1,812 32,391 100% 31,284 0.18% 40,134 15% 2.8 3,940 13% 9 –
0.25% to <0.50% 36,045 2,291 38,336 100% 37,069 0.31% 48,313 15% 2.9 6,749 18% 17 –
0.50% to <0.75% 6,113 626 6,739 100% 5,425 0.59% 6,757 17% 2.6 1,776 33% 6 –
0.75% to <2.50% 4,728 854 5,582 100% 4,992 1.24% 6,803 18% 2.5 2,725 55% 11 –
2.50% to <10.00% 504 66 570 100% 509 4.42% 844 18% 2.3 575 113% 4 –
10.00% to <100.00% 51 0 51 100% 51 17.83% 69 19% 1.9 112 219% 2 –
100.00% (Default) 494 12 506 100% 478 100.00% 269 17% 1.7 507 106% 25 –
Sub-total 108,946 7,254 116,200 100% 111,763 0.72% 149,595 15% 2.8 18,523 17% 78 25
Qualifying revolving retail
0.75% to <2.50% 443 5,584 6,027 0% 589 1.30% 808,274 50% 1.0 146 25% 4 –
10.00% to <100.00% 94 0 94 73% 95 25.00% 93,274 35% 0.2 100 105% 8 –
100.00% (Default) 9 0 9 0% 4 100.00% 343 35% 0.2 4 106% 5 –
Sub-total 546 5,584 6,130 73% 688 5.14% 901,891 48% 0.9 250 36% 17 5
Other retail
0.00% to <0.15% 53,913 117,261 171,174 95% 62,468 0.04% 49,894 63% 1.4 5,260 8% 18 –
0.15% to <0.25% 3,657 7,860 11,517 90% 4,426 0.19% 3,589 42% 1.4 753 17% 3 –
0.25% to <0.50% 1,486 3,695 5,181 80% 2,038 0.36% 5,612 31% 1.4 397 19% 2 –
0.50% to <0.75% 727 810 1,537 94% 890 0.61% 11,640 40% 1.3 301 34% 2 –
0.75% to <2.50% 4,230 1,499 5,729 95% 4,481 1.62% 80,595 44% 2.3 2,493 56% 31 –
2.50% to <10.00% 3,362 770 4,132 98% 3,666 5.19% 85,017 40% 2.7 2,278 62% 76 –
10.00% to <100.00% 25 60 85 90% 38 14.02% 260 53% 1.9 39 102% 3 –
100.00% (Default) 531 84 615 90% 389 100.00% 5,582 70% 1.5 412 106% 177 –
Sub-total 67,931 132,039 199,970 94% 78,396 0.90% 242,189 58% 1.5 11,933 15% 312 177
Sub-total (all portfolios)
0.00% to <0.15% 201,288 172,461 373,749 69% 240,356 0.05% 101,246 31% 1.7 21,811 9% 39 –
0.15% to <0.25% 45,233 21,371 66,604 76% 51,200 0.19% 45,850 23% 2.6 10,972 21% 23 –
0.25% to <0.50% 50,171 14,723 64,894 75% 55,102 0.33% 56,426 22% 2.7 15,805 29% 41 –
0.50% to <0.75% 18,035 12,993 31,028 60% 21,613 0.60% 20,340 30% 2.2 10,834 50% 39 –
0.75% to <2.50% 30,753 22,207 52,960 69% 36,829 1.43% 899,680 32% 2.5 26,113 71% 164 –
2.50% to <10.00% 16,697 21,679 38,376 55% 21,575 5.40% 88,526 35% 2.7 31,882 148% 413 –
10.00% to <100.00% 1,124 590 1,714 70% 1,220 17.63% 93,698 28% 2.4 2,196 180% 60 –
100.00% (Default) 3,177 282 3,459 71% 2,532 100.00% 6,457 37% 2.2 2,673 106% 622 –
Sub-total (all portfolios) 366,478 266,306 632,784 68% 430,427 1.15% 1,312,223 29% 2.1 122,286 28% 1,401 640
Alternative treatment
Exposures from free deliveries applying standardized risk weights or 100% under the alternative treatment – – – – 29 – – – – 16 – – –
IRB – maturity and export finance buffer – – – – – – – – – 1,972 – – –
Total (all portfolios and alternative treatment)
Total (all portfolios and alternative treatment) 366,478 266,306 632,784 68% 430,456 1.15% 1,312,223 29% 2.1 124,274 28% 1,401 640
1 CRM is reflected by shifting the counterparty exposure from the underlying obligor to the protection provider.2 Reflects risk-weighted assets post CCF.
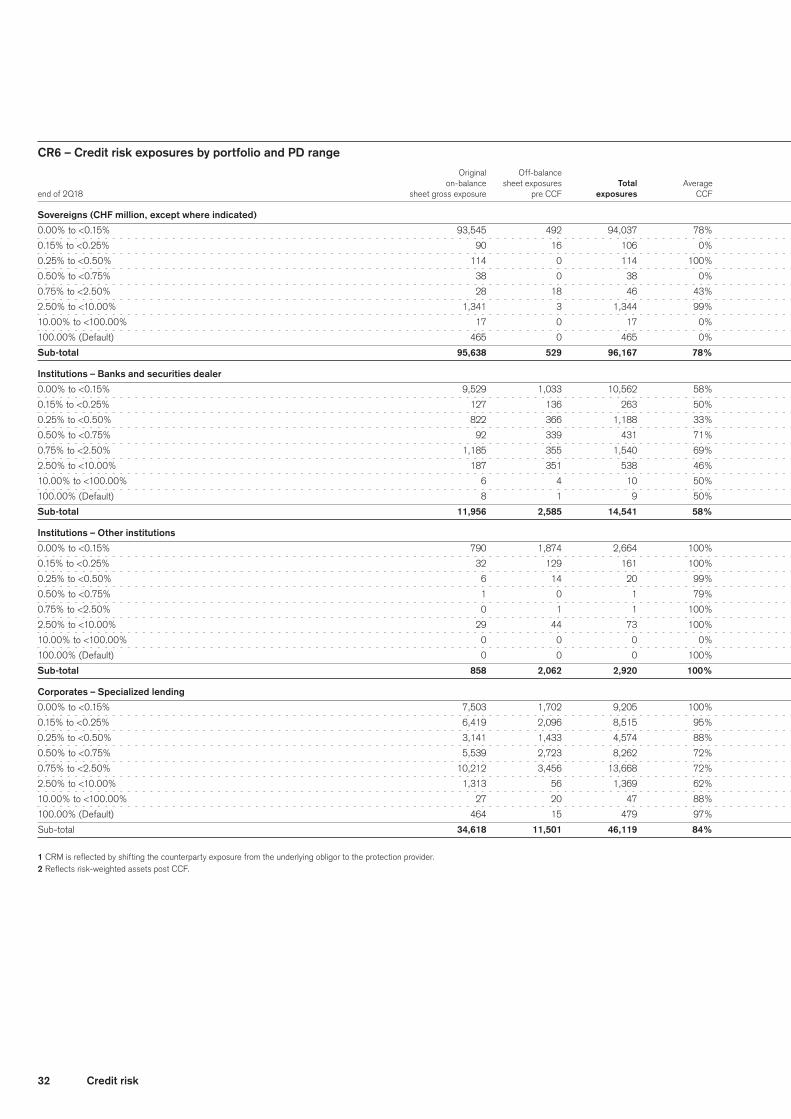
32 Credit risk
CR6 – Credit risk exposures by portfolio and PD range Original Off-balance EAD post- Number Average
on-balance sheet exposures Total Average CRM and Average of Average maturity RWA Expected
end of 2Q18 sheet gross exposure pre CCF exposures CCF post-CCF 1 PD obligors LGD (years) RWA 2 density loss Provisions
Sovereigns (CHF million, except where indicated)
0.00% to <0.15% 93,545 492 94,037 78% 94,326 0.02% 74 3% 1.2 930 1% 1 –
0.15% to <0.25% 90 16 106 0% 90 0.22% 8 51% 2.9 55 62% 0 –
0.25% to <0.50% 114 0 114 100% 114 0.37% 9 48% 1.3 61 53% 0 –
0.50% to <0.75% 38 0 38 0% 38 0.64% 17 42% 5.0 40 105% 0 –
0.75% to <2.50% 28 18 46 43% 34 1.16% 19 41% 1.2 27 80% 0 –
2.50% to <10.00% 1,341 3 1,344 99% 388 6.47% 28 51% 2.7 767 197% 13 –
10.00% to <100.00% 17 0 17 0% 17 16.44% 1 58% 1.0 49 289% 2 –
100.00% (Default) 465 0 465 0% 366 100.00% 3 58% 3.6 388 106% 0 –
Sub-total 95,638 529 96,167 78% 95,373 0.44% 159 4% 1.2 2,317 2% 16 0
Institutions – Banks and securities dealer
0.00% to <0.15% 9,529 1,033 10,562 58% 11,652 0.06% 599 55% 0.5 1,700 15% 3 –
0.15% to <0.25% 127 136 263 50% 396 0.22% 70 49% 1.1 184 46% 0 –
0.25% to <0.50% 822 366 1,188 33% 932 0.37% 160 56% 1.3 628 67% 2 –
0.50% to <0.75% 92 339 431 71% 221 0.61% 106 44% 0.7 150 68% 1 –
0.75% to <2.50% 1,185 355 1,540 69% 1,293 1.17% 239 50% 0.6 1,164 90% 6 –
2.50% to <10.00% 187 351 538 46% 131 7.34% 95 48% 1.5 259 197% 5 –
10.00% to <100.00% 6 4 10 50% 8 17.17% 10 52% 0.5 20 257% 1 –
100.00% (Default) 8 1 9 50% 9 100.00% 9 46% 2.8 9 106% 35 –
Sub-total 11,956 2,585 14,541 58% 14,642 0.32% 1,288 54% 0.6 4,114 28% 53 35
Institutions – Other institutions
0.00% to <0.15% 790 1,874 2,664 100% 1,189 0.05% 381 40% 2.7 213 18% 0 –
0.15% to <0.25% 32 129 161 100% 63 0.18% 64 40% 1.5 21 33% 0 –
0.25% to <0.50% 6 14 20 99% 13 0.37% 17 44% 1.7 7 53% 0 –
0.50% to <0.75% 1 0 1 79% 6 0.58% 74 68% 1.1 7 118% 0 –
0.75% to <2.50% 0 1 1 100% 0 1.02% 18 40% 1.4 0 72% 0 –
2.50% to <10.00% 29 44 73 100% 48 5.08% 5 9% 5.1 17 36% 0 –
10.00% to <100.00% 0 0 0 0% 0 0.00% 0 0% 0.0 0 0% 0 –
100.00% (Default) 0 0 0 100% 0 100.00% 1 44% 1.0 0 106% 0 –
Sub-total 858 2,062 2,920 100% 1,319 0.28% 560 39% 2.7 265 20% 0 0
Corporates – Specialized lending
0.00% to <0.15% 7,503 1,702 9,205 100% 8,144 0.06% 823 29% 2.2 1,590 20% 1 –
0.15% to <0.25% 6,419 2,096 8,515 95% 7,374 0.21% 795 28% 2.4 2,570 35% 4 –
0.25% to <0.50% 3,141 1,433 4,574 88% 3,705 0.37% 494 30% 2.1 1,843 50% 4 –
0.50% to <0.75% 5,539 2,723 8,262 72% 6,430 0.58% 416 24% 2.1 2,594 40% 9 –
0.75% to <2.50% 10,212 3,456 13,668 72% 11,281 1.26% 786 18% 2.8 4,747 42% 26 –
2.50% to <10.00% 1,313 56 1,369 62% 1,329 4.31% 88 12% 3.6 568 43% 8 –
10.00% to <100.00% 27 20 47 88% 37 17.64% 9 21% 2.8 46 125% 1 –
100.00% (Default) 464 15 479 97% 471 100.00% 36 20% 1.7 499 106% 123 –
Sub-total 34,618 11,501 46,119 84% 38,771 1.93% 3,447 24% 2.4 14,457 37% 176 123
1 CRM is reflected by shifting the counterparty exposure from the underlying obligor to the protection provider.2 Reflects risk-weighted assets post CCF.
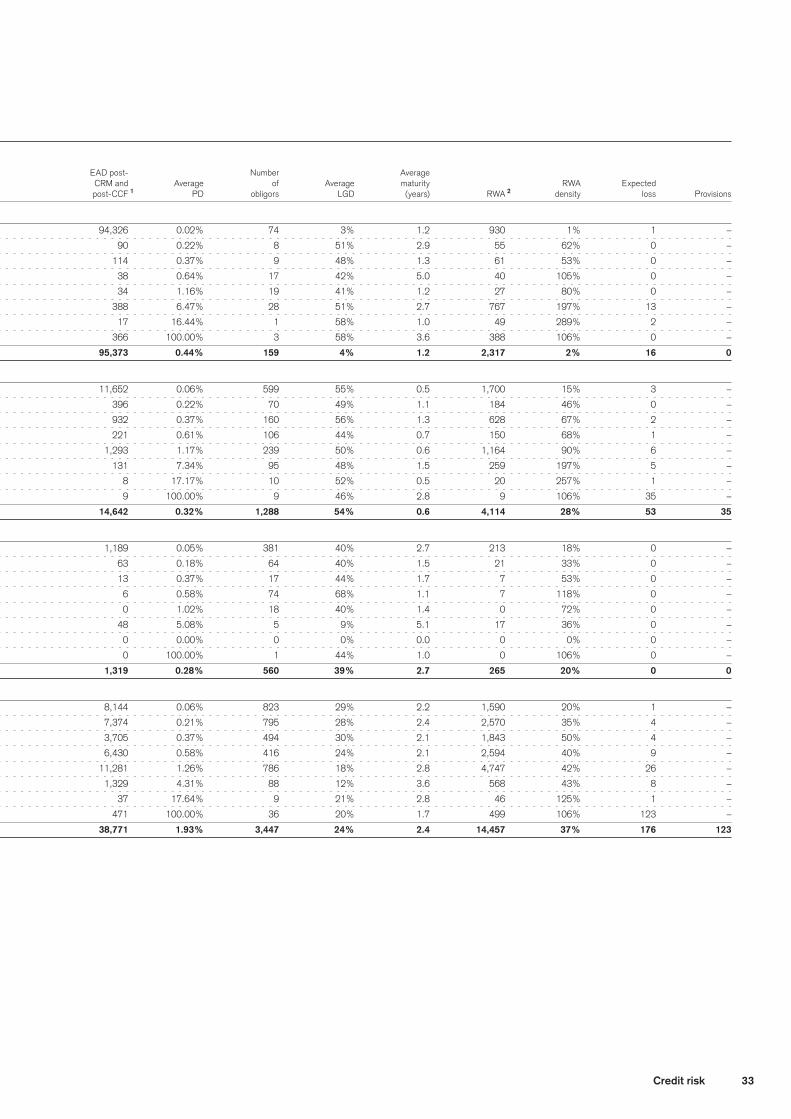
33Credit risk
CR6 – Credit risk exposures by portfolio and PD range Original Off-balance EAD post- Number Average
on-balance sheet exposures Total Average CRM and Average of Average maturity RWA Expected
end of 2Q18 sheet gross exposure pre CCF exposures CCF post-CCF 1 PD obligors LGD (years) RWA 2 density loss Provisions
Sovereigns (CHF million, except where indicated)
0.00% to <0.15% 93,545 492 94,037 78% 94,326 0.02% 74 3% 1.2 930 1% 1 –
0.15% to <0.25% 90 16 106 0% 90 0.22% 8 51% 2.9 55 62% 0 –
0.25% to <0.50% 114 0 114 100% 114 0.37% 9 48% 1.3 61 53% 0 –
0.50% to <0.75% 38 0 38 0% 38 0.64% 17 42% 5.0 40 105% 0 –
0.75% to <2.50% 28 18 46 43% 34 1.16% 19 41% 1.2 27 80% 0 –
2.50% to <10.00% 1,341 3 1,344 99% 388 6.47% 28 51% 2.7 767 197% 13 –
10.00% to <100.00% 17 0 17 0% 17 16.44% 1 58% 1.0 49 289% 2 –
100.00% (Default) 465 0 465 0% 366 100.00% 3 58% 3.6 388 106% 0 –
Sub-total 95,638 529 96,167 78% 95,373 0.44% 159 4% 1.2 2,317 2% 16 0
Institutions – Banks and securities dealer
0.00% to <0.15% 9,529 1,033 10,562 58% 11,652 0.06% 599 55% 0.5 1,700 15% 3 –
0.15% to <0.25% 127 136 263 50% 396 0.22% 70 49% 1.1 184 46% 0 –
0.25% to <0.50% 822 366 1,188 33% 932 0.37% 160 56% 1.3 628 67% 2 –
0.50% to <0.75% 92 339 431 71% 221 0.61% 106 44% 0.7 150 68% 1 –
0.75% to <2.50% 1,185 355 1,540 69% 1,293 1.17% 239 50% 0.6 1,164 90% 6 –
2.50% to <10.00% 187 351 538 46% 131 7.34% 95 48% 1.5 259 197% 5 –
10.00% to <100.00% 6 4 10 50% 8 17.17% 10 52% 0.5 20 257% 1 –
100.00% (Default) 8 1 9 50% 9 100.00% 9 46% 2.8 9 106% 35 –
Sub-total 11,956 2,585 14,541 58% 14,642 0.32% 1,288 54% 0.6 4,114 28% 53 35
Institutions – Other institutions
0.00% to <0.15% 790 1,874 2,664 100% 1,189 0.05% 381 40% 2.7 213 18% 0 –
0.15% to <0.25% 32 129 161 100% 63 0.18% 64 40% 1.5 21 33% 0 –
0.25% to <0.50% 6 14 20 99% 13 0.37% 17 44% 1.7 7 53% 0 –
0.50% to <0.75% 1 0 1 79% 6 0.58% 74 68% 1.1 7 118% 0 –
0.75% to <2.50% 0 1 1 100% 0 1.02% 18 40% 1.4 0 72% 0 –
2.50% to <10.00% 29 44 73 100% 48 5.08% 5 9% 5.1 17 36% 0 –
10.00% to <100.00% 0 0 0 0% 0 0.00% 0 0% 0.0 0 0% 0 –
100.00% (Default) 0 0 0 100% 0 100.00% 1 44% 1.0 0 106% 0 –
Sub-total 858 2,062 2,920 100% 1,319 0.28% 560 39% 2.7 265 20% 0 0
Corporates – Specialized lending
0.00% to <0.15% 7,503 1,702 9,205 100% 8,144 0.06% 823 29% 2.2 1,590 20% 1 –
0.15% to <0.25% 6,419 2,096 8,515 95% 7,374 0.21% 795 28% 2.4 2,570 35% 4 –
0.25% to <0.50% 3,141 1,433 4,574 88% 3,705 0.37% 494 30% 2.1 1,843 50% 4 –
0.50% to <0.75% 5,539 2,723 8,262 72% 6,430 0.58% 416 24% 2.1 2,594 40% 9 –
0.75% to <2.50% 10,212 3,456 13,668 72% 11,281 1.26% 786 18% 2.8 4,747 42% 26 –
2.50% to <10.00% 1,313 56 1,369 62% 1,329 4.31% 88 12% 3.6 568 43% 8 –
10.00% to <100.00% 27 20 47 88% 37 17.64% 9 21% 2.8 46 125% 1 –
100.00% (Default) 464 15 479 97% 471 100.00% 36 20% 1.7 499 106% 123 –
Sub-total 34,618 11,501 46,119 84% 38,771 1.93% 3,447 24% 2.4 14,457 37% 176 123
1 CRM is reflected by shifting the counterparty exposure from the underlying obligor to the protection provider.2 Reflects risk-weighted assets post CCF.

34 Credit risk
CR6 – Credit risk exposures by portfolio and PD range (continued) Original Off-balance EAD post- Number Average
on-balance sheet exposures Total Average CRM and Average of Average maturity RWA Expected
end of 2Q18 sheet gross exposure pre CCF exposures CCF post-CCF 1 PD obligors LGD (years) RWA 2 density loss Provisions
Corporates without specialized lending (CHF million, except where indicated)
0.00% to <0.15% 16,928 53,472 70,400 58% 44,677 0.07% 2,832 41% 2.4 9,927 22% 12 –
0.15% to <0.25% 7,738 11,708 19,446 68% 11,976 0.21% 1,760 40% 2.1 4,622 39% 10 –
0.25% to <0.50% 6,035 12,698 18,733 54% 10,998 0.37% 1,276 37% 2.4 5,823 53% 15 –
0.50% to <0.75% 5,394 5,469 10,863 62% 7,259 0.60% 1,404 42% 2.5 5,313 73% 18 –
0.75% to <2.50% 11,764 9,955 21,719 65% 15,372 1.45% 2,999 39% 2.6 14,967 97% 79 –
2.50% to <10.00% 6,721 18,816 25,537 51% 11,497 5.62% 2,250 35% 2.9 20,623 179% 234 –
10.00% to <100.00% 781 451 1,232 56% 842 20.03% 136 25% 2.6 1,787 212% 41 –
100.00% (Default) 652 156 808 76% 736 100.00% 201 44% 2.2 780 106% 289 –
Sub-total 56,013 112,725 168,738 58% 103,357 1.85% 12,858 40% 2.5 63,842 62% 698 307
Residential mortgages
0.00% to <0.15% 32,145 1,738 33,883 100% 32,246 0.08% 43,073 15% 2.9 2,051 6% 4 –
0.15% to <0.25% 48,601 2,706 51,307 100% 49,713 0.20% 69,916 15% 3.0 6,487 13% 16 –
0.25% to <0.50% 17,742 1,680 19,422 100% 18,309 0.35% 20,670 17% 2.8 3,723 20% 11 –
0.50% to <0.75% 5,403 654 6,057 100% 5,537 0.58% 7,773 17% 2.7 1,720 31% 5 –
0.75% to <2.50% 4,311 735 5,046 100% 4,495 1.22% 7,250 17% 2.6 2,308 51% 9 –
2.50% to <10.00% 462 38 500 100% 464 4.57% 715 15% 2.3 467 101% 3 –
10.00% to <100.00% 40 0 40 100% 41 17.67% 62 21% 1.8 89 219% 1 –
100.00% (Default) 433 10 443 100% 442 100.00% 277 17% 1.7 468 106% 31 –
Sub-total 109,137 7,561 116,698 100% 111,247 0.67% 149,736 15% 2.9 17,313 16% 80 31
Qualifying revolving retail
0.75% to <2.50% 474 5,660 6,134 0% 502 1.30% 801,319 50% 1.0 124 25% 3 –
10.00% to <100.00% 98 0 98 50% 98 25.00% 84,100 35% 0.2 104 105% 9 –
100.00% (Default) 3 0 3 0% 3 100.00% 274 35% 0.2 3 106% 4 –
Sub-total 575 5,660 6,235 50% 603 5.61% 885,693 47% 0.9 231 38% 16 4
Other retail
0.00% to <0.15% 57,025 118,694 175,719 95% 65,786 0.04% 49,733 63% 1.4 5,340 8% 17 –
0.15% to <0.25% 2,541 7,779 10,320 87% 3,354 0.19% 5,104 37% 1.2 507 15% 2 –
0.25% to <0.50% 1,263 2,883 4,146 79% 1,654 0.37% 4,182 33% 1.7 352 21% 2 –
0.50% to <0.75% 553 745 1,298 90% 728 0.58% 11,895 44% 1.2 262 36% 2 –
0.75% to <2.50% 5,388 1,805 7,193 95% 5,678 1.63% 81,210 41% 1.9 2,950 52% 37 –
2.50% to <10.00% 3,615 624 4,239 95% 3,756 5.08% 85,402 43% 2.7 2,622 70% 82 –
10.00% to <100.00% 70 30 100 100% 82 16.11% 325 49% 1.7 84 103% 6 –
100.00% (Default) 243 30 273 96% 183 100.00% 5,880 74% 1.7 195 106% 185 –
Sub-total 70,698 132,590 203,288 94% 81,221 0.64% 243,731 58% 1.5 12,312 15% 333 183
Sub-total (all portfolios)
0.00% to <0.15% 217,465 179,005 396,470 68% 258,020 0.04% 97,515 30% 1.7 21,751 8% 38 –
0.15% to <0.25% 65,548 24,570 90,118 78% 72,966 0.20% 77,717 21% 2.7 14,446 20% 32 –
0.25% to <0.50% 29,123 19,074 48,197 62% 35,725 0.36% 26,808 26% 2.5 12,437 35% 34 –
0.50% to <0.75% 17,020 9,930 26,950 68% 20,219 0.59% 21,685 30% 2.4 10,086 50% 35 –
0.75% to <2.50% 33,362 21,985 55,347 69% 38,655 1.38% 893,840 31% 2.5 26,287 68% 160 –
2.50% to <10.00% 13,668 19,932 33,600 52% 17,613 5.41% 88,583 35% 2.9 25,323 144% 345 –
10.00% to <100.00% 1,039 505 1,544 60% 1,125 19.94% 84,643 28% 2.3 2,179 194% 61 –
100.00% (Default) 2,268 212 2,480 82% 2,210 100.00% 6,681 38% 2.2 2,342 106% 667 –
Sub-total (all portfolios) 379,493 275,213 654,706 67% 446,533 0.99% 1,297,472 29% 2.1 114,851 26% 1,372 683
Alternative treatment
Exposures from free deliveries applying standardized risk weights or 100% under the alternative treatment – – – – 113 – – – – 99 – – –
IRB – maturity and export finance buffer – – – – – – – – – 959 – – –
Total (all portfolios and alternative treatment)
Total (all portfolios and alternative treatment) 379,493 275,213 654,706 67% 446,646 0.99% 1,297,472 29% 2.1 115,909 26% 1,372 683
1 CRM is reflected by shifting the counterparty exposure from the underlying obligor to the protection provider.2 Reflects risk-weighted assets post CCF.
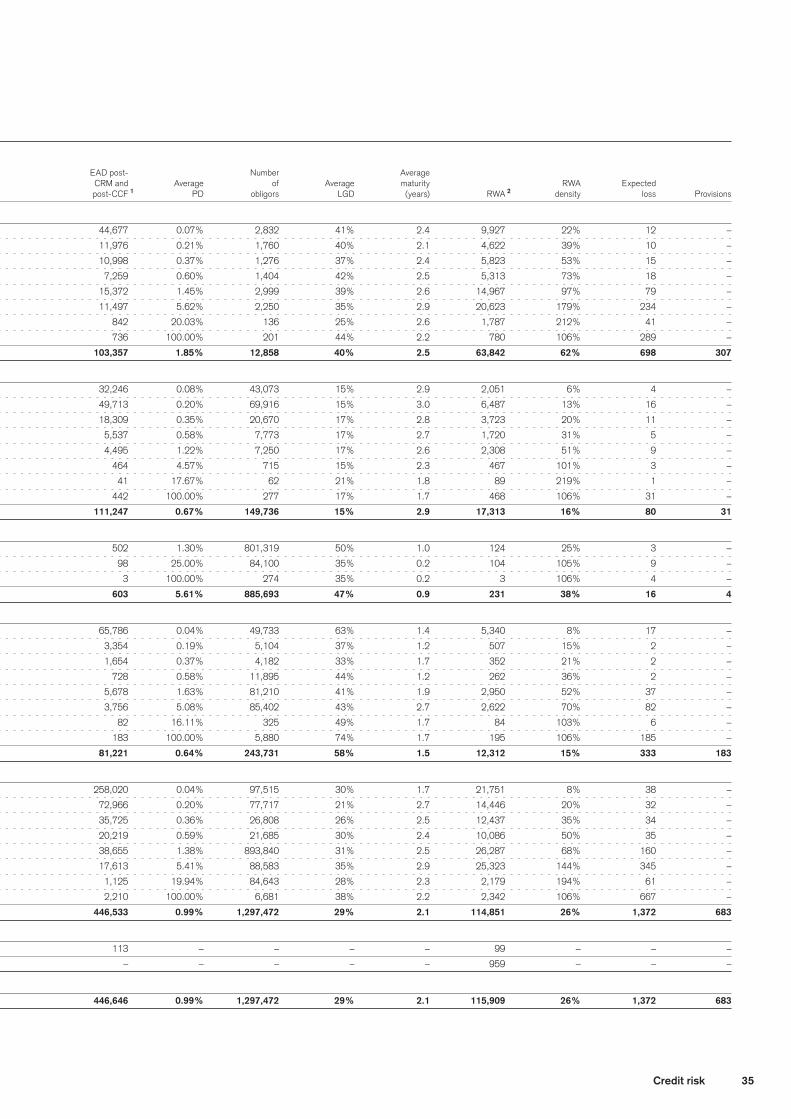
35Credit risk
CR6 – Credit risk exposures by portfolio and PD range (continued) Original Off-balance EAD post- Number Average
on-balance sheet exposures Total Average CRM and Average of Average maturity RWA Expected
end of 2Q18 sheet gross exposure pre CCF exposures CCF post-CCF 1 PD obligors LGD (years) RWA 2 density loss Provisions
Corporates without specialized lending (CHF million, except where indicated)
0.00% to <0.15% 16,928 53,472 70,400 58% 44,677 0.07% 2,832 41% 2.4 9,927 22% 12 –
0.15% to <0.25% 7,738 11,708 19,446 68% 11,976 0.21% 1,760 40% 2.1 4,622 39% 10 –
0.25% to <0.50% 6,035 12,698 18,733 54% 10,998 0.37% 1,276 37% 2.4 5,823 53% 15 –
0.50% to <0.75% 5,394 5,469 10,863 62% 7,259 0.60% 1,404 42% 2.5 5,313 73% 18 –
0.75% to <2.50% 11,764 9,955 21,719 65% 15,372 1.45% 2,999 39% 2.6 14,967 97% 79 –
2.50% to <10.00% 6,721 18,816 25,537 51% 11,497 5.62% 2,250 35% 2.9 20,623 179% 234 –
10.00% to <100.00% 781 451 1,232 56% 842 20.03% 136 25% 2.6 1,787 212% 41 –
100.00% (Default) 652 156 808 76% 736 100.00% 201 44% 2.2 780 106% 289 –
Sub-total 56,013 112,725 168,738 58% 103,357 1.85% 12,858 40% 2.5 63,842 62% 698 307
Residential mortgages
0.00% to <0.15% 32,145 1,738 33,883 100% 32,246 0.08% 43,073 15% 2.9 2,051 6% 4 –
0.15% to <0.25% 48,601 2,706 51,307 100% 49,713 0.20% 69,916 15% 3.0 6,487 13% 16 –
0.25% to <0.50% 17,742 1,680 19,422 100% 18,309 0.35% 20,670 17% 2.8 3,723 20% 11 –
0.50% to <0.75% 5,403 654 6,057 100% 5,537 0.58% 7,773 17% 2.7 1,720 31% 5 –
0.75% to <2.50% 4,311 735 5,046 100% 4,495 1.22% 7,250 17% 2.6 2,308 51% 9 –
2.50% to <10.00% 462 38 500 100% 464 4.57% 715 15% 2.3 467 101% 3 –
10.00% to <100.00% 40 0 40 100% 41 17.67% 62 21% 1.8 89 219% 1 –
100.00% (Default) 433 10 443 100% 442 100.00% 277 17% 1.7 468 106% 31 –
Sub-total 109,137 7,561 116,698 100% 111,247 0.67% 149,736 15% 2.9 17,313 16% 80 31
Qualifying revolving retail
0.75% to <2.50% 474 5,660 6,134 0% 502 1.30% 801,319 50% 1.0 124 25% 3 –
10.00% to <100.00% 98 0 98 50% 98 25.00% 84,100 35% 0.2 104 105% 9 –
100.00% (Default) 3 0 3 0% 3 100.00% 274 35% 0.2 3 106% 4 –
Sub-total 575 5,660 6,235 50% 603 5.61% 885,693 47% 0.9 231 38% 16 4
Other retail
0.00% to <0.15% 57,025 118,694 175,719 95% 65,786 0.04% 49,733 63% 1.4 5,340 8% 17 –
0.15% to <0.25% 2,541 7,779 10,320 87% 3,354 0.19% 5,104 37% 1.2 507 15% 2 –
0.25% to <0.50% 1,263 2,883 4,146 79% 1,654 0.37% 4,182 33% 1.7 352 21% 2 –
0.50% to <0.75% 553 745 1,298 90% 728 0.58% 11,895 44% 1.2 262 36% 2 –
0.75% to <2.50% 5,388 1,805 7,193 95% 5,678 1.63% 81,210 41% 1.9 2,950 52% 37 –
2.50% to <10.00% 3,615 624 4,239 95% 3,756 5.08% 85,402 43% 2.7 2,622 70% 82 –
10.00% to <100.00% 70 30 100 100% 82 16.11% 325 49% 1.7 84 103% 6 –
100.00% (Default) 243 30 273 96% 183 100.00% 5,880 74% 1.7 195 106% 185 –
Sub-total 70,698 132,590 203,288 94% 81,221 0.64% 243,731 58% 1.5 12,312 15% 333 183
Sub-total (all portfolios)
0.00% to <0.15% 217,465 179,005 396,470 68% 258,020 0.04% 97,515 30% 1.7 21,751 8% 38 –
0.15% to <0.25% 65,548 24,570 90,118 78% 72,966 0.20% 77,717 21% 2.7 14,446 20% 32 –
0.25% to <0.50% 29,123 19,074 48,197 62% 35,725 0.36% 26,808 26% 2.5 12,437 35% 34 –
0.50% to <0.75% 17,020 9,930 26,950 68% 20,219 0.59% 21,685 30% 2.4 10,086 50% 35 –
0.75% to <2.50% 33,362 21,985 55,347 69% 38,655 1.38% 893,840 31% 2.5 26,287 68% 160 –
2.50% to <10.00% 13,668 19,932 33,600 52% 17,613 5.41% 88,583 35% 2.9 25,323 144% 345 –
10.00% to <100.00% 1,039 505 1,544 60% 1,125 19.94% 84,643 28% 2.3 2,179 194% 61 –
100.00% (Default) 2,268 212 2,480 82% 2,210 100.00% 6,681 38% 2.2 2,342 106% 667 –
Sub-total (all portfolios) 379,493 275,213 654,706 67% 446,533 0.99% 1,297,472 29% 2.1 114,851 26% 1,372 683
Alternative treatment
Exposures from free deliveries applying standardized risk weights or 100% under the alternative treatment – – – – 113 – – – – 99 – – –
IRB – maturity and export finance buffer – – – – – – – – – 959 – – –
Total (all portfolios and alternative treatment)
Total (all portfolios and alternative treatment) 379,493 275,213 654,706 67% 446,646 0.99% 1,297,472 29% 2.1 115,909 26% 1,372 683
1 CRM is reflected by shifting the counterparty exposure from the underlying obligor to the protection provider.2 Reflects risk-weighted assets post CCF.

36 Credit risk
Effect of credit derivatives used as CRM techniques on risk-weighted assetsThe following table shows the effect of credit derivatives used as CRM techniques on the IRB approach capital requirements’ calculations.
CR7 – Effect on risk-weighted assets of credit derivatives used as CRM techniques 4Q18 2Q18
Pre-credit Pre-credit
derivatives Actual derivatives Actual
end of RWA RWA RWA RWA
CHF million
Sovereigns – A-IRB 2,496 2,496 2,377 2,317
Institutions – Banks and securities dealers – A-IRB 4,501 4,410 4,282 4,119
Institutions – Other institutions – A-IRB 196 196 265 265
Corporates – Specialized lending – A-IRB 16,716 16,716 16,022 16,022
Corporates without specialized lending – A-IRB 71,136 70,181 65,157 63,934
Residential mortgages 18,523 18,523 17,313 17,313
Qualifying revolving retail 250 250 231 231
Other retail 11,933 11,933 12,312 12,312
Total 125,751 124,705 117,959 116,513
For exposures covered by recognized credit derivatives, the sub-stitution approach is applied. Hence, the risk weight of the obligor is substituted with the risk-weight of the protection provider.
RWAflowstatementsofcreditriskexposuresunderIRBThe following table presents the definitions of the RWA flow statements components for credit risk and CCR.
Definition of risk-weighted assets movement components related to credit risk and CCR
Description Definition
Asset size Represents changes arising in the ordinary course of business (including new businesses)
Asset quality/Credit quality of counterparties Represents changes in average risk weighting across credit risk classes
Model and parameter updates Represents movements arising from updates to models and recalibrations of parameters and internal changes impacting how exposures are treated
Methodology and policy changes Represents movements due to methodology changes in calculations driven by regulatory policy changes, including both revisions to existing regulations and new regulations
Acquisitions and disposals Represents changes in book sizes due to acquisitions and disposals of entities
Foreign exchange impact Represents changes in exchange rates of the transaction currencies compared to the Swiss franc
Other Represents changes that cannot be attributed to any other category
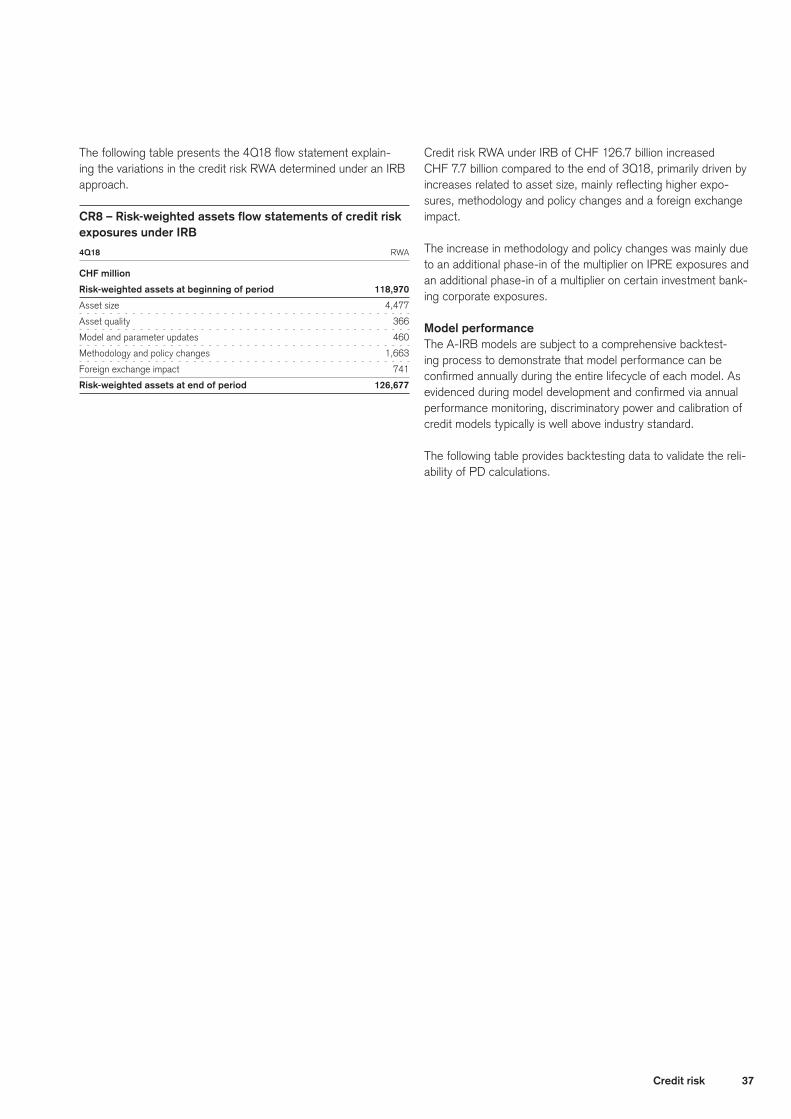
37Credit risk
The following table presents the 4Q18 flow statement explain-ing the variations in the credit risk RWA determined under an IRB approach.
CR8 – Risk-weighted assets flow statements of credit risk exposures under IRB
4Q18 RWA
CHF million
Risk-weighted assets at beginning of period 118,970
Asset size 4,477
Asset quality 366
Model and parameter updates 460
Methodology and policy changes 1,663
Foreign exchange impact 741
Risk-weighted assets at end of period 126,677
Credit risk RWA under IRB of CHF 126.7 billion increased CHF 7.7 billion compared to the end of 3Q18, primarily driven by increases related to asset size, mainly reflecting higher expo-sures, methodology and policy changes and a foreign exchange impact.
The increase in methodology and policy changes was mainly due to an additional phase-in of the multiplier on IPRE exposures and an additional phase-in of a multiplier on certain investment bank-ing corporate exposures.
Model performanceThe A-IRB models are subject to a comprehensive backtest-ing process to demonstrate that model performance can be confirmed annually during the entire lifecycle of each model. As evidenced during model development and confirmed via annual performance monitoring, discriminatory power and calibration of credit models typically is well above industry standard.
The following table provides backtesting data to validate the reli-ability of PD calculations.

38 Credit risk
CR9 – Backtesting of PD per portfolio Number of obligors
of which:
new Average
Arithmetic defaulted historical average End of Defaulted obligors annual Master scale Master scale Master scale Weighted PD by previous End of obligors in in the default from CRM S&P from CRM Fitch from CRM Moody average PD obligors 1 year the year the year 2 year 2 rate 2
Sovereigns
0.00% to <0.15% AAA to BBB+ AAA to BBB+ Aaa to Baa1 0.02% 0.03% 71 68 0 0 0.04%
0.15% to <0.25% BBB+ to BBB BBB+ to BBB Baa1 to Baa2 0.22% 0.21% 10 9 0 0 0.00%
0.25% to <0.50% BBB to BB+ BBB to BB+ Baa2 to Ba1 0.37% 0.37% 8 7 0 0 0.00%
0.50% to <0.75% BB+ BB+ Ba1 0.64% 0.60% 21 24 0 0 0.00%
0.75% to <2.50% BB+ to B+ BB+ to B+ Ba1 to B1 1.40% 1.46% 20 11 0 0 0.00%
2.50% to <10.00% B+ to B- B+ to B- B1 to B3 6.45% 5.71% 26 24 0 0 1.15%
10.00% to <100.00% B- to CCC B- to CCC B3 to Caa2 0.00% 0.00% 0 0 0 0 5.94%
Institutions – Banks and securities dealer
0.00% to <0.15% AAA to BBB+ AAA to BBB+ Aaa to Baa1 0.06% 0.07% 623 711 0 0 0.04%
0.15% to <0.25% BBB+ to BBB BBB+ to BBB Baa1 to Baa2 0.22% 0.22% 85 82 0 0 0.04%
0.25% to <0.50% BBB to BB+ BBB to BB+ Baa2 to Ba1 0.37% 0.37% 153 165 0 0 0.27%
0.50% to <0.75% BB+ BB+ Ba1 0.60% 0.60% 114 107 0 0 0.13%
0.75% to <2.50% BB+ to B+ BB+ to B+ Ba1 to B1 1.25% 1.25% 238 228 1 0 0.11%
2.50% to <10.00% B+ to B- B+ to B- B1 to B3 4.92% 5.03% 102 116 2 0 0.53%
10.00% to <100.00% B- to CCC B- to CCC B3 to Caa2 16.44% 18.63% 4 6 0 0 2.13%
Institutions – Other institutions
0.00% to <0.15% AAA to BBB+ AAA to BBB+ Aaa to Baa1 0.04% 0.05% 338 428 0 0 0.00%
0.15% to <0.25% BBB+ to BBB BBB+ to BBB Baa1 to Baa2 0.21% 0.20% 102 21 0 0 0.00%
0.25% to <0.50% BBB to BB+ BBB to BB+ Baa2 to Ba1 0.36% 0.37% 26 11 0 0 0.00%
0.50% to <0.75% BB+ BB+ Ba1 0.58% 0.58% 82 53 0 0 0.08%
0.75% to <2.50% BB+ to B+ BB+ to B+ Ba1 to B1 1.03% 1.28% 25 19 0 0 0.00%
2.50% to <10.00% B+ to B- B+ to B- B1 to B3 5.08% 4.26% 5 4 – – –
Corporates – Specialized lending
0.00% to <0.15% AAA to BBB+ AAA to BBB+ Aaa to Baa1 0.06% 0.06% 810 854 0 0 0.02%
0.15% to <0.25% BBB+ to BBB BBB+ to BBB Baa1 to Baa2 0.22% 0.20% 816 748 0 0 0.03%
0.25% to <0.50% BBB to BB+ BBB to BB+ Baa2 to Ba1 0.37% 0.37% 528 559 0 0 0.03%
0.50% to <0.75% BB+ BB+ Ba1 0.58% 0.60% 412 407 1 0 0.19%
0.75% to <2.50% BB+ to B+ BB+ to B+ Ba1 to B1 1.33% 1.33% 779 792 6 0 0.35%
2.50% to <10.00% B+ to B- B+ to B- B1 to B3 4.59% 4.31% 122 93 13 0 4.03%
10.00% to <100.00% B- to CCC B- to CCC B3 to Caa2 14.08% 14.85% 2 4 0 0 21.07%
1 The number of obligors used in the calculation is based on the transactional-based approach.2 Reflects risk data where prudential portfolios are not captured and which only covers the time period until end of previous year. Accordingly for these columns approximations are
required. Further, fast defaults are in tendency understated since capturing of fast defaults is not available for all clients in risk data. Underlying default rates are determined on client level, i.e. a client can have more than one transaction/credit.
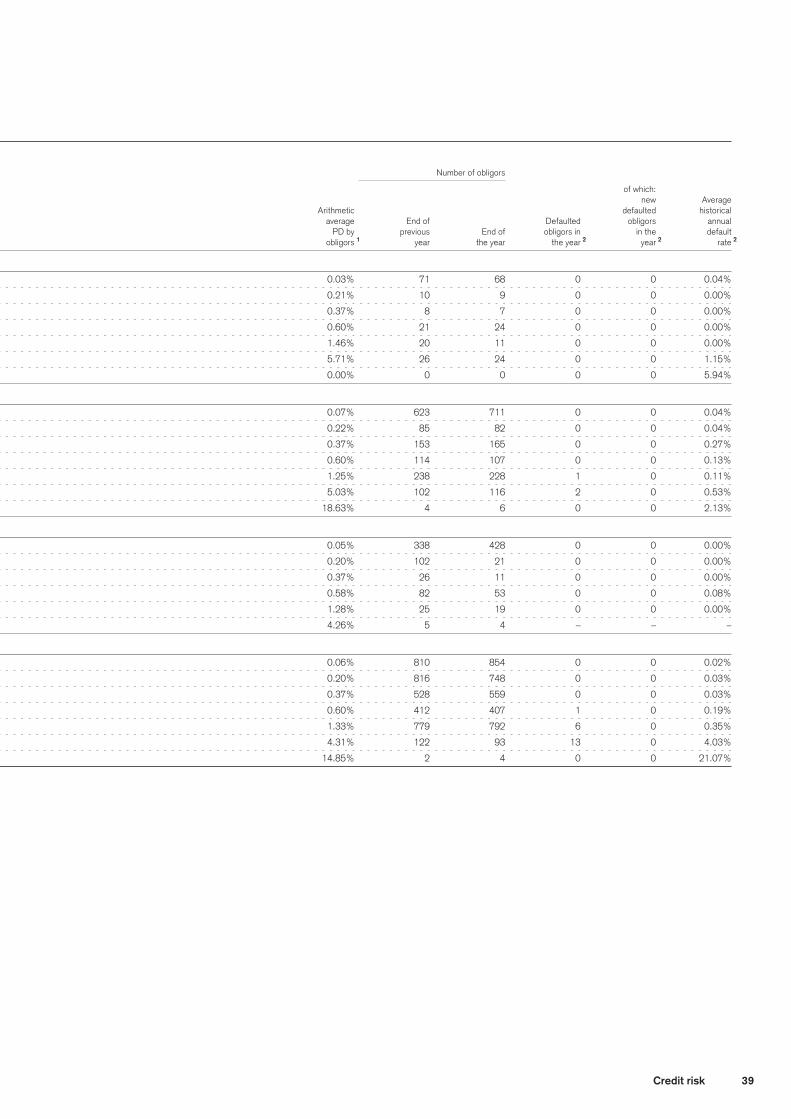
39Credit risk
CR9 – Backtesting of PD per portfolio Number of obligors
of which:
new Average
Arithmetic defaulted historical average End of Defaulted obligors annual Master scale Master scale Master scale Weighted PD by previous End of obligors in in the default from CRM S&P from CRM Fitch from CRM Moody average PD obligors 1 year the year the year 2 year 2 rate 2
Sovereigns
0.00% to <0.15% AAA to BBB+ AAA to BBB+ Aaa to Baa1 0.02% 0.03% 71 68 0 0 0.04%
0.15% to <0.25% BBB+ to BBB BBB+ to BBB Baa1 to Baa2 0.22% 0.21% 10 9 0 0 0.00%
0.25% to <0.50% BBB to BB+ BBB to BB+ Baa2 to Ba1 0.37% 0.37% 8 7 0 0 0.00%
0.50% to <0.75% BB+ BB+ Ba1 0.64% 0.60% 21 24 0 0 0.00%
0.75% to <2.50% BB+ to B+ BB+ to B+ Ba1 to B1 1.40% 1.46% 20 11 0 0 0.00%
2.50% to <10.00% B+ to B- B+ to B- B1 to B3 6.45% 5.71% 26 24 0 0 1.15%
10.00% to <100.00% B- to CCC B- to CCC B3 to Caa2 0.00% 0.00% 0 0 0 0 5.94%
Institutions – Banks and securities dealer
0.00% to <0.15% AAA to BBB+ AAA to BBB+ Aaa to Baa1 0.06% 0.07% 623 711 0 0 0.04%
0.15% to <0.25% BBB+ to BBB BBB+ to BBB Baa1 to Baa2 0.22% 0.22% 85 82 0 0 0.04%
0.25% to <0.50% BBB to BB+ BBB to BB+ Baa2 to Ba1 0.37% 0.37% 153 165 0 0 0.27%
0.50% to <0.75% BB+ BB+ Ba1 0.60% 0.60% 114 107 0 0 0.13%
0.75% to <2.50% BB+ to B+ BB+ to B+ Ba1 to B1 1.25% 1.25% 238 228 1 0 0.11%
2.50% to <10.00% B+ to B- B+ to B- B1 to B3 4.92% 5.03% 102 116 2 0 0.53%
10.00% to <100.00% B- to CCC B- to CCC B3 to Caa2 16.44% 18.63% 4 6 0 0 2.13%
Institutions – Other institutions
0.00% to <0.15% AAA to BBB+ AAA to BBB+ Aaa to Baa1 0.04% 0.05% 338 428 0 0 0.00%
0.15% to <0.25% BBB+ to BBB BBB+ to BBB Baa1 to Baa2 0.21% 0.20% 102 21 0 0 0.00%
0.25% to <0.50% BBB to BB+ BBB to BB+ Baa2 to Ba1 0.36% 0.37% 26 11 0 0 0.00%
0.50% to <0.75% BB+ BB+ Ba1 0.58% 0.58% 82 53 0 0 0.08%
0.75% to <2.50% BB+ to B+ BB+ to B+ Ba1 to B1 1.03% 1.28% 25 19 0 0 0.00%
2.50% to <10.00% B+ to B- B+ to B- B1 to B3 5.08% 4.26% 5 4 – – –
Corporates – Specialized lending
0.00% to <0.15% AAA to BBB+ AAA to BBB+ Aaa to Baa1 0.06% 0.06% 810 854 0 0 0.02%
0.15% to <0.25% BBB+ to BBB BBB+ to BBB Baa1 to Baa2 0.22% 0.20% 816 748 0 0 0.03%
0.25% to <0.50% BBB to BB+ BBB to BB+ Baa2 to Ba1 0.37% 0.37% 528 559 0 0 0.03%
0.50% to <0.75% BB+ BB+ Ba1 0.58% 0.60% 412 407 1 0 0.19%
0.75% to <2.50% BB+ to B+ BB+ to B+ Ba1 to B1 1.33% 1.33% 779 792 6 0 0.35%
2.50% to <10.00% B+ to B- B+ to B- B1 to B3 4.59% 4.31% 122 93 13 0 4.03%
10.00% to <100.00% B- to CCC B- to CCC B3 to Caa2 14.08% 14.85% 2 4 0 0 21.07%
1 The number of obligors used in the calculation is based on the transactional-based approach.2 Reflects risk data where prudential portfolios are not captured and which only covers the time period until end of previous year. Accordingly for these columns approximations are
required. Further, fast defaults are in tendency understated since capturing of fast defaults is not available for all clients in risk data. Underlying default rates are determined on client level, i.e. a client can have more than one transaction/credit.
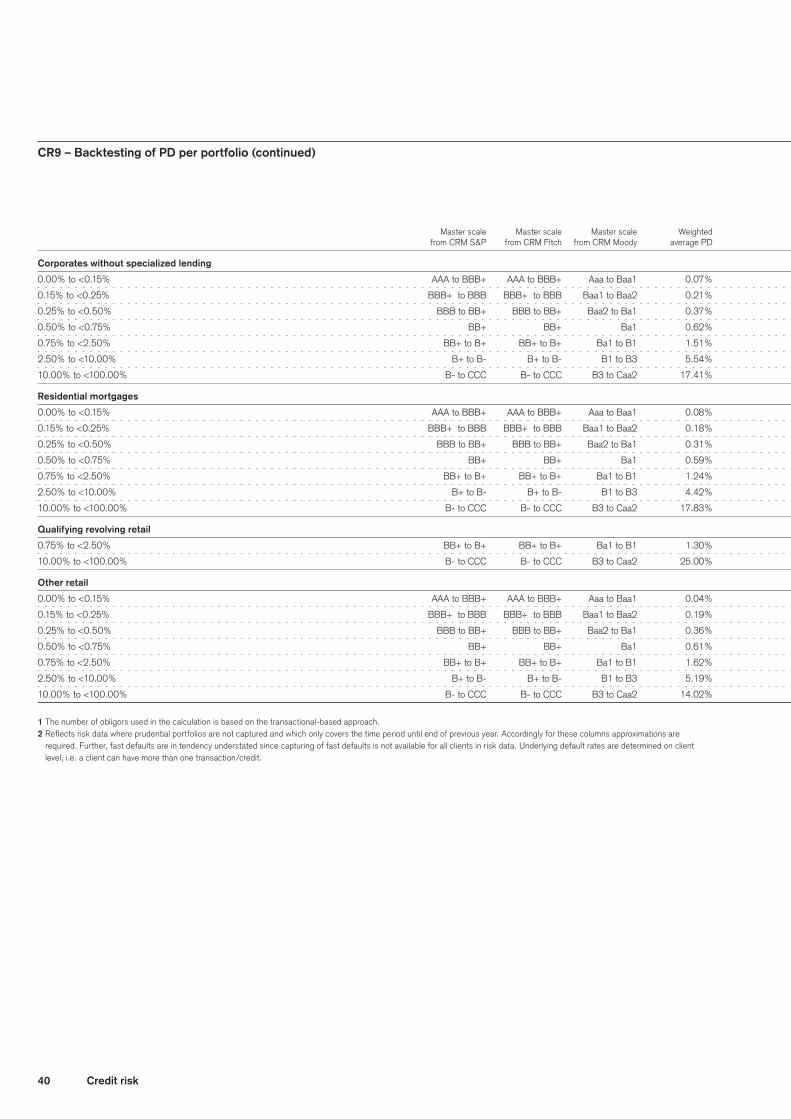
40 Credit risk
CR9 – Backtesting of PD per portfolio (continued) Number of obligors
of which:
new Average
Arithmetic defaulted historical average End of Defaulted obligors annual Master scale Master scale Master scale Weighted PD by previous End of obligors in in the default from CRM S&P from CRM Fitch from CRM Moody average PD obligors 1 year the year the year 2 year 2 rate 2
Corporates without specialized lending
0.00% to <0.15% AAA to BBB+ AAA to BBB+ Aaa to Baa1 0.07% 0.07% 2,724 2,885 0 0 0.02%
0.15% to <0.25% BBB+ to BBB BBB+ to BBB Baa1 to Baa2 0.21% 0.21% 1,706 1,267 1 0 0.08%
0.25% to <0.50% BBB to BB+ BBB to BB+ Baa2 to Ba1 0.37% 0.37% 1,297 1,759 1 0 0.11%
0.50% to <0.75% BB+ BB+ Ba1 0.62% 0.63% 1,353 1,352 2 0 0.25%
0.75% to <2.50% BB+ to B+ BB+ to B+ Ba1 to B1 1.51% 1.31% 2,705 2,958 16 1 0.56%
2.50% to <10.00% B+ to B- B+ to B- B1 to B3 5.54% 4.13% 1,923 2,428 31 1 1.71%
10.00% to <100.00% B- to CCC B- to CCC B3 to Caa2 17.41% 20.01% 100 85 6 0 11.89%
Residential mortgages
0.00% to <0.15% AAA to BBB+ AAA to BBB+ Aaa to Baa1 0.08% 0.08% 42,771 46,406 7 0 0.02%
0.15% to <0.25% BBB+ to BBB BBB+ to BBB Baa1 to Baa2 0.18% 0.18% 69,443 40,134 16 3 0.02%
0.25% to <0.50% BBB to BB+ BBB to BB+ Baa2 to Ba1 0.31% 0.31% 20,747 48,313 10 0 0.06%
0.50% to <0.75% BB+ BB+ Ba1 0.59% 0.60% 7,969 6,757 8 1 0.14%
0.75% to <2.50% BB+ to B+ BB+ to B+ Ba1 to B1 1.24% 1.29% 7,472 6,803 14 1 0.28%
2.50% to <10.00% B+ to B- B+ to B- B1 to B3 4.42% 4.45% 800 844 19 2 3.50%
10.00% to <100.00% B- to CCC B- to CCC B3 to Caa2 17.83% 17.33% 80 69 11 0 19.09%
Qualifying revolving retail
0.75% to <2.50% BB+ to B+ BB+ to B+ Ba1 to B1 1.30% 1.30% 788,602 808,274 5,438 0 1.07%
10.00% to <100.00% B- to CCC B- to CCC B3 to Caa2 25.00% 25.00% 96,906 93,274 20,346 0 22.77%
Other retail
0.00% to <0.15% AAA to BBB+ AAA to BBB+ Aaa to Baa1 0.04% 0.04% 49,560 49,894 0 0 0.06%
0.15% to <0.25% BBB+ to BBB BBB+ to BBB Baa1 to Baa2 0.19% 0.19% 5,040 3,589 0 0 0.40%
0.25% to <0.50% BBB to BB+ BBB to BB+ Baa2 to Ba1 0.36% 0.36% 4,339 5,612 55 0 0.98%
0.50% to <0.75% BB+ BB+ Ba1 0.61% 0.59% 11,947 11,640 0 0 0.00%
0.75% to <2.50% BB+ to B+ BB+ to B+ Ba1 to B1 1.62% 1.64% 78,724 80,595 522 0 0.49%
2.50% to <10.00% B+ to B- B+ to B- B1 to B3 5.19% 5.43% 85,657 85,017 2,771 217 3.87%
10.00% to <100.00% B- to CCC B- to CCC B3 to Caa2 14.02% 17.76% 283 260 – – –
1 The number of obligors used in the calculation is based on the transactional-based approach.2 Reflects risk data where prudential portfolios are not captured and which only covers the time period until end of previous year. Accordingly for these columns approximations are
required. Further, fast defaults are in tendency understated since capturing of fast defaults is not available for all clients in risk data. Underlying default rates are determined on client level, i.e. a client can have more than one transaction/credit.

41Credit risk
CR9 – Backtesting of PD per portfolio (continued) Number of obligors
of which:
new Average
Arithmetic defaulted historical average End of Defaulted obligors annual Master scale Master scale Master scale Weighted PD by previous End of obligors in in the default from CRM S&P from CRM Fitch from CRM Moody average PD obligors 1 year the year the year 2 year 2 rate 2
Corporates without specialized lending
0.00% to <0.15% AAA to BBB+ AAA to BBB+ Aaa to Baa1 0.07% 0.07% 2,724 2,885 0 0 0.02%
0.15% to <0.25% BBB+ to BBB BBB+ to BBB Baa1 to Baa2 0.21% 0.21% 1,706 1,267 1 0 0.08%
0.25% to <0.50% BBB to BB+ BBB to BB+ Baa2 to Ba1 0.37% 0.37% 1,297 1,759 1 0 0.11%
0.50% to <0.75% BB+ BB+ Ba1 0.62% 0.63% 1,353 1,352 2 0 0.25%
0.75% to <2.50% BB+ to B+ BB+ to B+ Ba1 to B1 1.51% 1.31% 2,705 2,958 16 1 0.56%
2.50% to <10.00% B+ to B- B+ to B- B1 to B3 5.54% 4.13% 1,923 2,428 31 1 1.71%
10.00% to <100.00% B- to CCC B- to CCC B3 to Caa2 17.41% 20.01% 100 85 6 0 11.89%
Residential mortgages
0.00% to <0.15% AAA to BBB+ AAA to BBB+ Aaa to Baa1 0.08% 0.08% 42,771 46,406 7 0 0.02%
0.15% to <0.25% BBB+ to BBB BBB+ to BBB Baa1 to Baa2 0.18% 0.18% 69,443 40,134 16 3 0.02%
0.25% to <0.50% BBB to BB+ BBB to BB+ Baa2 to Ba1 0.31% 0.31% 20,747 48,313 10 0 0.06%
0.50% to <0.75% BB+ BB+ Ba1 0.59% 0.60% 7,969 6,757 8 1 0.14%
0.75% to <2.50% BB+ to B+ BB+ to B+ Ba1 to B1 1.24% 1.29% 7,472 6,803 14 1 0.28%
2.50% to <10.00% B+ to B- B+ to B- B1 to B3 4.42% 4.45% 800 844 19 2 3.50%
10.00% to <100.00% B- to CCC B- to CCC B3 to Caa2 17.83% 17.33% 80 69 11 0 19.09%
Qualifying revolving retail
0.75% to <2.50% BB+ to B+ BB+ to B+ Ba1 to B1 1.30% 1.30% 788,602 808,274 5,438 0 1.07%
10.00% to <100.00% B- to CCC B- to CCC B3 to Caa2 25.00% 25.00% 96,906 93,274 20,346 0 22.77%
Other retail
0.00% to <0.15% AAA to BBB+ AAA to BBB+ Aaa to Baa1 0.04% 0.04% 49,560 49,894 0 0 0.06%
0.15% to <0.25% BBB+ to BBB BBB+ to BBB Baa1 to Baa2 0.19% 0.19% 5,040 3,589 0 0 0.40%
0.25% to <0.50% BBB to BB+ BBB to BB+ Baa2 to Ba1 0.36% 0.36% 4,339 5,612 55 0 0.98%
0.50% to <0.75% BB+ BB+ Ba1 0.61% 0.59% 11,947 11,640 0 0 0.00%
0.75% to <2.50% BB+ to B+ BB+ to B+ Ba1 to B1 1.62% 1.64% 78,724 80,595 522 0 0.49%
2.50% to <10.00% B+ to B- B+ to B- B1 to B3 5.19% 5.43% 85,657 85,017 2,771 217 3.87%
10.00% to <100.00% B- to CCC B- to CCC B3 to Caa2 14.02% 17.76% 283 260 – – –
1 The number of obligors used in the calculation is based on the transactional-based approach.2 Reflects risk data where prudential portfolios are not captured and which only covers the time period until end of previous year. Accordingly for these columns approximations are
required. Further, fast defaults are in tendency understated since capturing of fast defaults is not available for all clients in risk data. Underlying default rates are determined on client level, i.e. a client can have more than one transaction/credit.

42 Credit risk
Specialized lending and equities under the simple risk-weight methodSpecialized lendingThe following tables show the carrying values, exposure amounts and RWA for the Group’s specialized lending.
CR10 – Specialized lending On- Off-
balance balance
sheet sheet Risk Exposure Expected
end of 4Q18 Remaining maturity amount amount weight amount 1 RWA losses
Other than high-volatility commercial real estate (CHF million, except where indicated)
Regulatory categories
Strong Less than 2.5 years 156 123 50% 223 118 0
Equal to or more than 2.5 years 318 892 70% 808 600 3
Good Less than 2.5 years 835 31 70% 852 632 3
Equal to or more than 2.5 years 294 219 90% 414 395 3
Satisfactory 88 156 115% 2 174 212 5
Weak 60 0 250% 60 160 5
Default 36 0 – 36 – 18
Total 1,787 1,421 – 2,567 2,117 37
High-volatility commercial real estate (CHF million, except where indicated)
Regulatory categories
Good Equal to or more than 2.5 years 157 110 120% 217 276 1
Satisfactory 7 1 140% 7 10 0
Default 35 0 – 35 0 0
Total 199 111 – 259 286 1
end of 2Q18
Other than high-volatility commercial real estate (CHF million, except where indicated)
Regulatory categories
Strong Less than 2.5 years 195 332 50% 344 182 0
Equal to or more than 2.5 years 167 593 70% 249 185 1
Good Less than 2.5 years 92 91 70% 518 384 2
Equal to or more than 2.5 years 172 178 90% 292 278 2
Satisfactory 116 157 115% 2 187 228 5
Weak 49 28 250% 65 171 5
Default 183 0 – 0 – 35
Total 974 1,379 – 1,655 1,428 50
High-volatility commercial real estate (CHF million, except where indicated)
Regulatory categories
Good Equal to or more than 2.5 years 130 17 120% 107 135 0
Default 13 0 – 13 0 7
Total 143 17 – 120 135 7
1 Includes project finance, object finance, commodities finance and IPRE.2 For a portion of the exposure, a risk weight of 120% is applied.
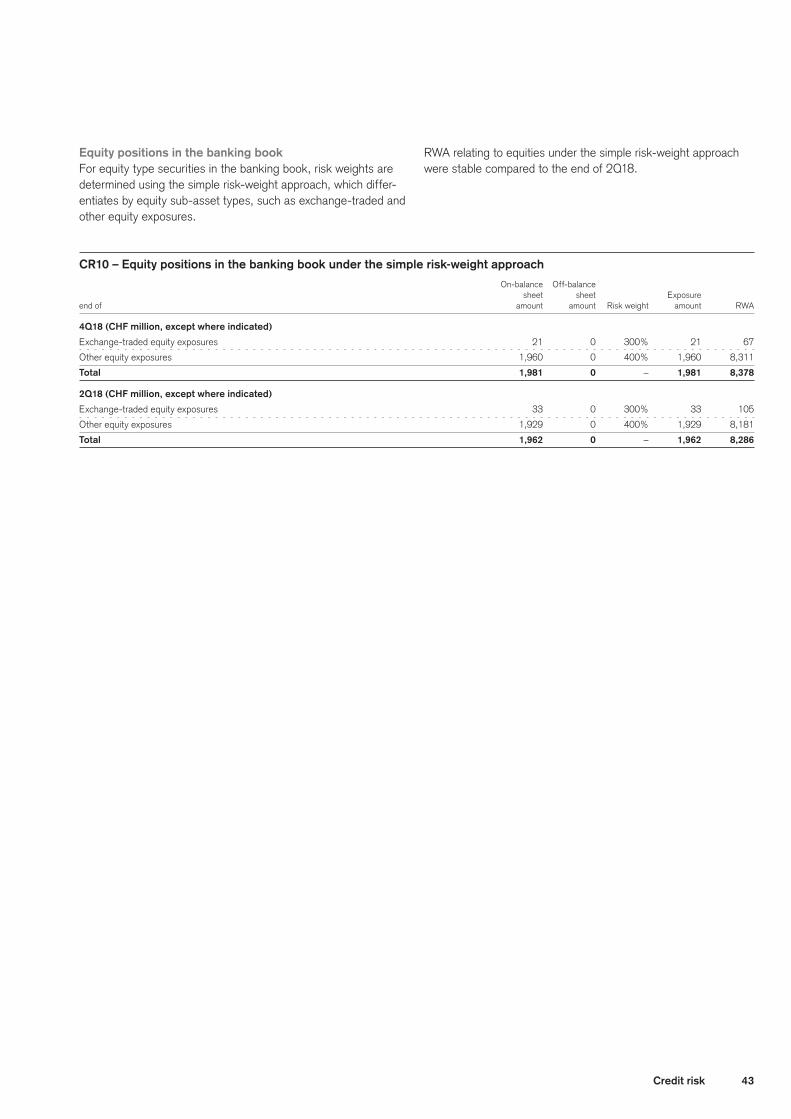
43Credit risk
Equity positions in the banking bookFor equity type securities in the banking book, risk weights are determined using the simple risk-weight approach, which differ-entiates by equity sub-asset types, such as exchange-traded and other equity exposures.
RWA relating to equities under the simple risk-weight approach were stable compared to the end of 2Q18.
CR10 – Equity positions in the banking book under the simple risk-weight approach On-balance Off-balance
sheet sheet Exposure
end of amount amount Risk weight amount RWA
4Q18 (CHF million, except where indicated)
Exchange-traded equity exposures 21 0 300% 21 67
Other equity exposures 1,960 0 400% 1,960 8,311
Total 1,981 0 – 1,981 8,378
2Q18 (CHF million, except where indicated)
Exchange-traded equity exposures 33 0 300% 33 105
Other equity exposures 1,929 0 400% 1,929 8,181
Total 1,962 0 – 1,962 8,286
44 Counterparty credit risk
Counterparty credit risk
GeneralCounterparty exposureCounterparty credit risk (CCR) arises from OTC and exchange-traded derivatives, and SFTs such as repurchase agreements, securities lending and borrowing and other similar products. CCR exposures depend on the value of underlying market factors (e.g., interest rates and foreign exchange rates), which can be volatile and are therefore uncertain in nature and change over time.
Credit Suisse has received approval from FINMA to use the IMM for measuring CCR for the majority of the derivative and secured financing exposures using Potential Exposure metric.
> Refer to “Credit risk” (pages 158 to 161) in III – Treasury, Risk, Balance sheet and Off-balance sheet – Risk management – Risk coverage and management in the Credit Suisse Annual Report 2018 for further information on coun-terparty credit risk, including transaction rating, credit approval process and provisioning.
> Refer to “Credit risk reporting” (page 12) in Credit risk – General for informa-tion on our counterparty risk reporting.
Credit limitsAll credit exposure is approved, either through approval of an individual transaction/facility (e.g., lending facilities), or under a system of credit limits (e.g., OTC derivatives). Credit exposure is monitored daily to ensure it does not exceed the approved credit limit. Credit limits are set either on a potential exposure basis or on a notional exposure basis. Moreover, these limits are ulti-mately governed by the Group Risk Appetite Framework. Poten-tial exposure means the possible future value that would be lost upon default of the counterparty on a particular future date, and is taken as a high percentile of a distribution of possible expo-sures computed by the internal exposure models. Secondary debt inventory positions are subject to separate limits that are set at the issuer level.
> Refer to “Credit risk” (pages 158 to 161) in III – Treasury, Risk, Balance sheet and Off-balance sheet – Risk management – Risk coverage and management in the Credit Suisse Annual Report 2018 for further information on credit limits.
Central counterparties riskThe Basel III framework provides specific requirements for expo-sures the Group has to CCPs arising from OTC derivatives, exchange-traded derivative transactions and SFTs. Exposures to CCPs which are considered to be qualifying CCPs by the regula-tor will receive a preferential capital treatment compared to expo-sures to non-qualifying CCPs.
The Group can incur exposure to CCPs as either a clearing member, or clearing through another member. Qualifying CCPs are expected to be subject to best-practice risk management, and sound regulation and oversight to ensure that they reduce risk, both for their participants and for the financial system. Most CCPs are benchmarked against standards issued by the Commit-tee on Payment and Settlement Systems and the Technical Com-mittee of the International Organization of Securities Commis-sions, herein collectively referred to as “CPSS-IOSCO”.
The exposures to CCP (represented as “Central counterparties (CCP) risks”) consist of trade exposure, default fund exposure and contingent exposure based on trade replacement due to a clearing member default. Trade exposure represents the current and potential future exposure of the clearing member (or a client) to a CCP arising from the underlying transaction and the initial margin posted to the CCP. Default fund exposure represents existing and potential future additional contributions to a CCPs default fund. Credit Risk Management performs credit assess-ment and annual review of the risk profile of CCPs as counter-parties including an assessment of qualitative and quantitative factors. As part of its assessment, Credit Risk Management conducts periodic due diligence and in conjunction with General Counsel will make a determination whether (i) the CCP is a quali-fying CCP and (ii) the collateral posted is considered bankruptcy remote The determinations are subject to CRM guidelines and include a review of collateral bankruptcy remoteness and verifica-tion that CCP collateral positions are held in custody with enti-ties that employ account segregation and safekeeping proce-dures with internal controls that fully protect these securities. The determination is made in the context of “Authorization of CCP” (European Market Infrastructure Regulation (EMIR), Article 14) and “Third Countries” (EMIR, Article 25). This information will be appropriately reflected in the risk weightings within the capital calculations.
The Group monitors its daily exposure to the CCP as part of its ongoing limit and exposure monitoring process.
> Refer to “Credit risk” (page 12) for further information.
Credit valuation adjustment riskCVA is a regulatory capital charge designed to capture the risk associated with potential mark-to-market losses associated with the deterioration in the creditworthiness of a counterparty.
Under Basel III, banks are required to calculate capital charges for CVA under either the Standardized CVA approach or the Advanced CVA approach (ACVA). The CVA rules stipulate that where banks have permission to use market risk VaR and coun-terparty risk IMM, they are to use the ACVA unless their regulator decides otherwise. FINMA has confirmed that the ACVA should be used for both IMM and non-IMM exposures.
The regulatory CVA capital charge applies to all counterparty exposures arising from OTC derivatives, excluding those with CCP. Exposures arising from SFT are not required to be included in the CVA charge unless they could give rise to a material loss. FINMA has confirmed that Credit Suisse can exclude these expo-sures from the regulatory capital charge.
Guarantees and other risk mitigants > Refer to “Credit risk mitigation” (pages 16 to 17) in Credit risk for further infor-
mation on policies relating to guarantees and other risk mitigants.

45Counterparty credit risk
Wrong-way exposureWrong-way risk arises when Credit Suisse enters into a finan-cial transaction in which exposure is adversely correlated to the creditworthiness of the counterparty. In a wrong-way situation, the exposure to the counterparty increases while the counter-party’s financial condition and its ability to pay on the transaction diminishes.
Exposure adjusted risk calculationRegulatory guidance distinguishes two types of wrong-way risk, general and specific:p General wrong-way risk arises when the probability of default
of counterparties is positively correlated with general market risk factors.
p Specific wrong-way risk arises when the exposure to a par-ticular counterparty is positively correlated with the probability of default of the counterparty due to the nature of the transac-tions with the counterparty.
Capturing wrong-way risk requires checking if there is a legal relationship or a correlation between the trade/collateral and the counterparty.
The management of wrong-way risk is integrated within Credit Suisse’s overall credit risk assessment approach and is subject to a framework for identification and treatment of wrong-way risk, which includes multiple processes, methodologies, governance, reporting, review and escalation. A conservative treatment for the purpose of calculating exposure profiles is applied to material trades with wrong-way risk features. The wrong-way risk frame-work applies to OTC, SFTs, loans and centrally cleared trades.
In instances where a material wrong-way risk has been identi-fied, limit utilization and default capital are accordingly adjusted through more conservative exposure calculations. These adjust-ments cover both transactions and collateral and form part of the daily credit exposure calculation process, resulting in a higher uti-lization of the counterparty credit limit.
Regular reporting of wrong-way risk at both the individual trade and portfolio level allows wrong-way risk to be identified and corrective actions taken by Credit Risk Management. The Front Office is responsible as a first line of defense for identifying and escalating trades that could potentially give rise to wrong-way risk. Any material wrong-way risk at portfolio or trade level would be escalated to senior Credit Risk Management executives and risk committees.
Effect of a credit rating downgradeOn a daily basis, we monitor the level of incremental collateral that would be required by derivative counterparties in the event of a Credit Suisse ratings downgrade. Collateral triggers are maintained by our collateral management department and vary by counterparty.
> Refer to “Credit ratings” (pages 120 to 121) in III – Treasury, Risk, Balance sheet and Off-balance sheet – Liquidity and funding management – Funding management in the Credit Suisse Annual Report 2018 for further information on the effect of a one, two or three notch downgrade as of December 31, 2018.
The impact of downgrades in the Bank’s long-term debt ratings are considered in the stress assumptions used to determine the conservative funding profile of our balance sheet and would not be material to our liquidity and funding needs.
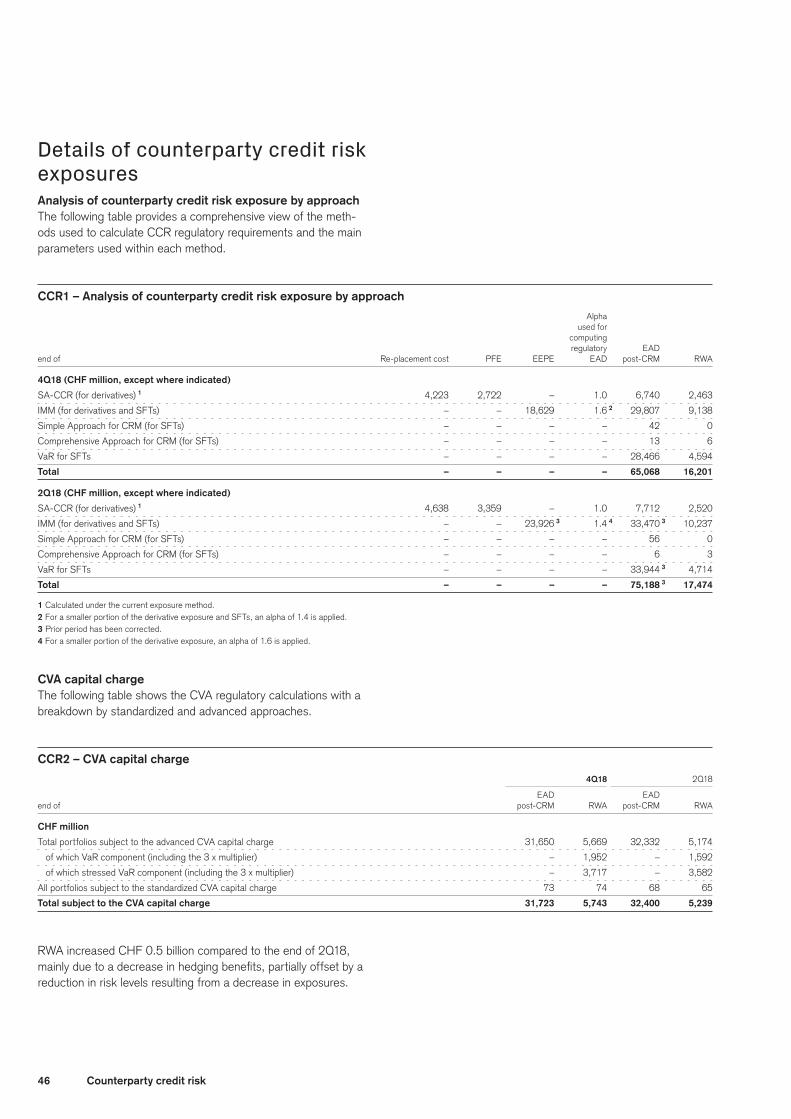
46 Counterparty credit risk
Details of counterparty credit risk exposuresAnalysis of counterparty credit risk exposure by approachThe following table provides a comprehensive view of the meth-ods used to calculate CCR regulatory requirements and the main parameters used within each method.
CCR1 – Analysis of counterparty credit risk exposure by approach Alpha
used for
computing
regulatory EAD
end of Re-placement cost PFE EEPE EAD post-CRM RWA
4Q18 (CHF million, except where indicated)
SA-CCR (for derivatives) 1 4,223 2,722 – 1.0 6,740 2,463
IMM (for derivatives and SFTs) – – 18,629 1.6 2 29,807 9,138
Simple Approach for CRM (for SFTs) – – – – 42 0
Comprehensive Approach for CRM (for SFTs) – – – – 13 6
VaR for SFTs – – – – 28,466 4,594
Total – – – – 65,068 16,201
2Q18 (CHF million, except where indicated)
SA-CCR (for derivatives) 1 4,638 3,359 – 1.0 7,712 2,520
IMM (for derivatives and SFTs) – – 23,926 3 1.4 4 33,470 3 10,237
Simple Approach for CRM (for SFTs) – – – – 56 0
Comprehensive Approach for CRM (for SFTs) – – – – 6 3
VaR for SFTs – – – – 33,944 3 4,714
Total – – – – 75,188 3 17,474
1 Calculated under the current exposure method.2 For a smaller portion of the derivative exposure and SFTs, an alpha of 1.4 is applied.3 Prior period has been corrected.4 For a smaller portion of the derivative exposure, an alpha of 1.6 is applied.
CVA capital chargeThe following table shows the CVA regulatory calculations with a breakdown by standardized and advanced approaches.
CCR2 – CVA capital charge 4Q18 2Q18
EAD EAD
end of post-CRM RWA post-CRM RWA
CHF million
Total portfolios subject to the advanced CVA capital charge 31,650 5,669 32,332 5,174
of which VaR component (including the 3 x multiplier) – 1,952 – 1,592
of which stressed VaR component (including the 3 x multiplier) – 3,717 – 3,582
All portfolios subject to the standardized CVA capital charge 73 74 68 65
Total subject to the CVA capital charge 31,723 5,743 32,400 5,239
RWA increased CHF 0.5 billion compared to the end of 2Q18, mainly due to a decrease in hedging benefits, partially offset by a reduction in risk levels resulting from a decrease in exposures.
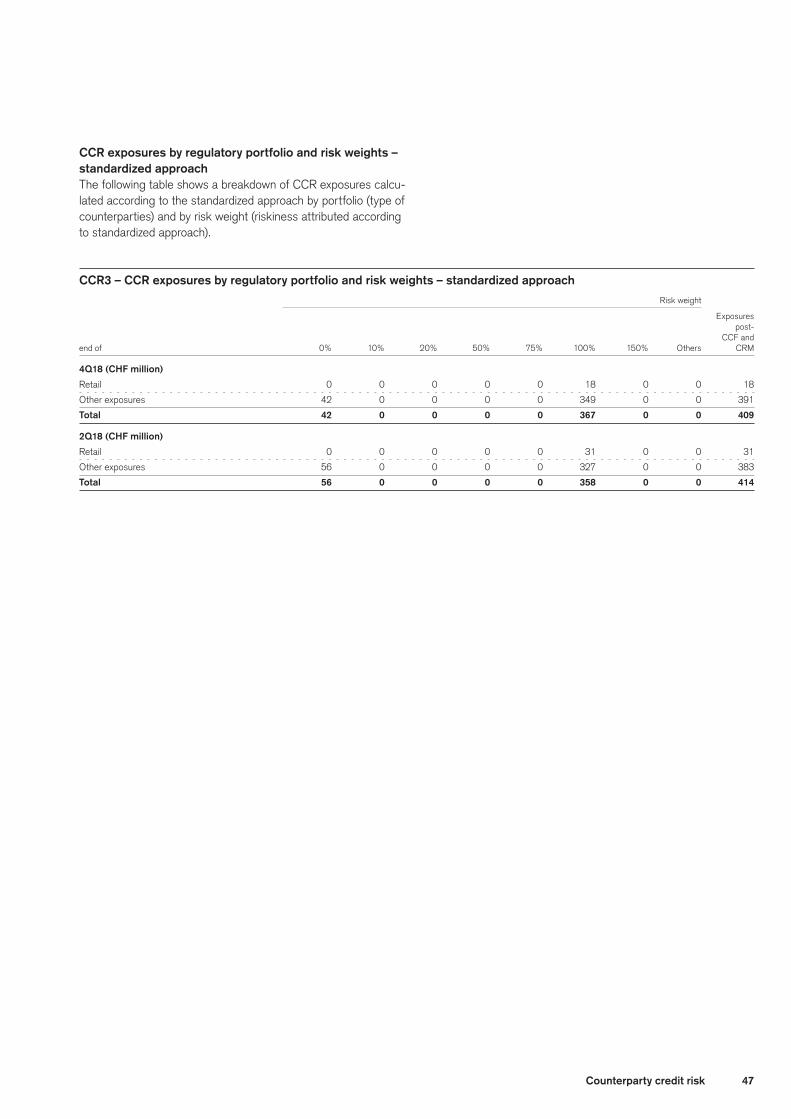
47Counterparty credit risk
CCR exposures by regulatory portfolio and risk weights – standardized approachThe following table shows a breakdown of CCR exposures calcu-lated according to the standardized approach by portfolio (type of counterparties) and by risk weight (riskiness attributed according to standardized approach).
CCR3 – CCR exposures by regulatory portfolio and risk weights – standardized approach Risk weight
Exposures
post-
CCF and
end of 0% 10% 20% 50% 75% 100% 150% Others CRM
4Q18 (CHF million)
Retail 0 0 0 0 0 18 0 0 18
Other exposures 42 0 0 0 0 349 0 0 391
Total 42 0 0 0 0 367 0 0 409
2Q18 (CHF million)
Retail 0 0 0 0 0 31 0 0 31
Other exposures 56 0 0 0 0 327 0 0 383
Total 56 0 0 0 0 358 0 0 414
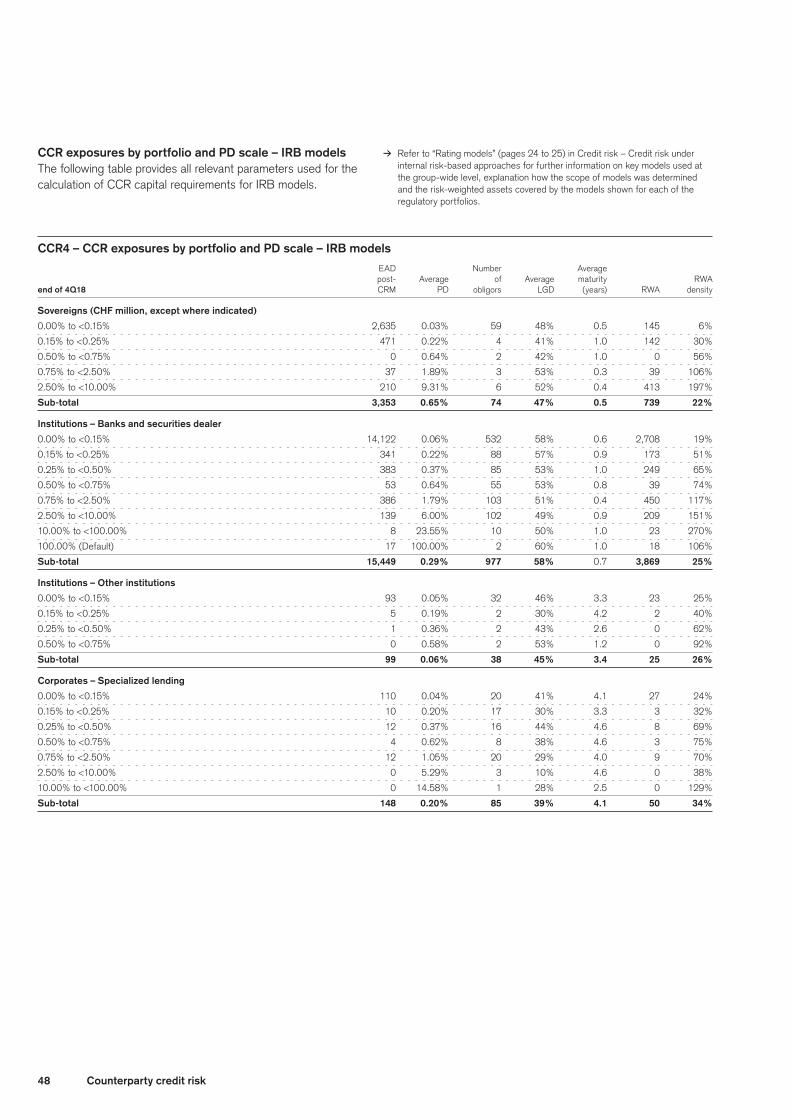
48 Counterparty credit risk
CCR exposures by portfolio and PD scale – IRB modelsThe following table provides all relevant parameters used for the calculation of CCR capital requirements for IRB models.
> Refer to “Rating models” (pages 24 to 25) in Credit risk – Credit risk under internal risk-based approaches for further information on key models used at the group-wide level, explanation how the scope of models was determined and the risk-weighted assets covered by the models shown for each of the regulatory portfolios.
CCR4 – CCR exposures by portfolio and PD scale – IRB models EAD Number Average
post- Average of Average maturity RWA
end of 4Q18 CRM PD obligors LGD (years) RWA density
Sovereigns (CHF million, except where indicated)
0.00% to <0.15% 2,635 0.03% 59 48% 0.5 145 6%
0.15% to <0.25% 471 0.22% 4 41% 1.0 142 30%
0.50% to <0.75% 0 0.64% 2 42% 1.0 0 56%
0.75% to <2.50% 37 1.89% 3 53% 0.3 39 106%
2.50% to <10.00% 210 9.31% 6 52% 0.4 413 197%
Sub-total 3,353 0.65% 74 47% 0.5 739 22%
Institutions – Banks and securities dealer
0.00% to <0.15% 14,122 0.06% 532 58% 0.6 2,708 19%
0.15% to <0.25% 341 0.22% 88 57% 0.9 173 51%
0.25% to <0.50% 383 0.37% 85 53% 1.0 249 65%
0.50% to <0.75% 53 0.64% 55 53% 0.8 39 74%
0.75% to <2.50% 386 1.79% 103 51% 0.4 450 117%
2.50% to <10.00% 139 6.00% 102 49% 0.9 209 151%
10.00% to <100.00% 8 23.55% 10 50% 1.0 23 270%
100.00% (Default) 17 100.00% 2 60% 1.0 18 106%
Sub-total 15,449 0.29% 977 58% 0.7 3,869 25%
Institutions – Other institutions
0.00% to <0.15% 93 0.05% 32 46% 3.3 23 25%
0.15% to <0.25% 5 0.19% 2 30% 4.2 2 40%
0.25% to <0.50% 1 0.36% 2 43% 2.6 0 62%
0.50% to <0.75% 0 0.58% 2 53% 1.2 0 92%
Sub-total 99 0.06% 38 45% 3.4 25 26%
Corporates – Specialized lending
0.00% to <0.15% 110 0.04% 20 41% 4.1 27 24%
0.15% to <0.25% 10 0.20% 17 30% 3.3 3 32%
0.25% to <0.50% 12 0.37% 16 44% 4.6 8 69%
0.50% to <0.75% 4 0.62% 8 38% 4.6 3 75%
0.75% to <2.50% 12 1.05% 20 29% 4.0 9 70%
2.50% to <10.00% 0 5.29% 3 10% 4.6 0 38%
10.00% to <100.00% 0 14.58% 1 28% 2.5 0 129%
Sub-total 148 0.20% 85 39% 4.1 50 34%

49Counterparty credit risk
CCR4 – CCR exposures by portfolio and PD scale – IRB models (continued) EAD Number Average
post- Average of Average maturity RWA
end of 4Q18 CRM PD obligors LGD (years) RWA density
Corporates without specialized lending (CHF million, except where indicated)
0.00% to <0.15% 36,995 0.05% 10,508 50% 0.6 4,128 11%
0.15% to <0.25% 1,606 0.22% 1,162 46% 1.5 662 41%
0.25% to <0.50% 936 0.37% 594 56% 1.4 650 69%
0.50% to <0.75% 681 0.64% 470 56% 1.1 600 88%
0.75% to <2.50% 1,272 1.44% 1,247 70% 1.1 2,071 163%
2.50% to <10.00% 1,081 4.67% 1,837 53% 0.9 2,457 227%
10.00% to <100.00% 18 27.70% 8 41% 1.3 51 279%
100.00% (Default) 30 100.00% 7 53% 1.0 32 106%
Sub-total 42,619 0.31% 15,833 51% 0.7 10,651 25%
Other retail
0.00% to <0.15% 2,453 0.07% 1,730 58% 1.0 325 13%
0.15% to <0.25% 182 0.19% 303 33% 1.7 24 13%
0.25% to <0.50% 54 0.35% 262 29% 1.6 10 18%
0.50% to <0.75% 167 0.58% 696 50% 1.2 68 41%
0.75% to <2.50% 100 1.41% 130 38% 1.0 42 42%
2.50% to <10.00% 2 4.16% 39 43% 1.3 1 66%
10.00% to <100.00% 2 20.28% 2 19% 5.0 1 46%
100.00% (Default) 7 100.00% 3 100% 1.0 8 106%
Sub-total 2,967 0.41% 3,165 55% 1.0 479 16%
Sub-total (all portfolios)
0.00% to <0.15% 56,408 0.05% 12,881 52% 0.6 7,356 13%
0.15% to <0.25% 2,615 0.22% 1,576 45% 1.4 1,006 38%
0.25% to <0.50% 1,386 0.37% 959 54% 1.3 917 66%
0.50% to <0.75% 905 0.63% 1,233 55% 1.1 710 79%
0.75% to <2.50% 1,807 1.52% 1,503 63% 0.9 2,611 144%
2.50% to <10.00% 1,432 5.48% 1,987 53% 0.8 3,080 215%
10.00% to <100.00% 28 25.99% 21 42% 1.4 75 262%
100.00% (Default) 54 100.00% 12 61% 1.0 58 106%
Sub-total (all portfolios) 64,635 0.33% 20,172 52% 0.7 15,813 24%
Alternative treatment
Exposures from free deliveries applying standardized risk weights
or 100% under the alternative treatment – – – – – 0 –
Total (all portfolios and alternative treatment)
Total (all portfolios and alternative treatment) 64,635 0.33% 20,172 52% 0.7 15,813 24%
EAD post-CRM decreased CHF 10.1 billion compared to the end of 2Q18, reflecting lower OTC derivatives exposures primarily in corporates without specialized lending, banks and securities deal-ers and sovereigns.
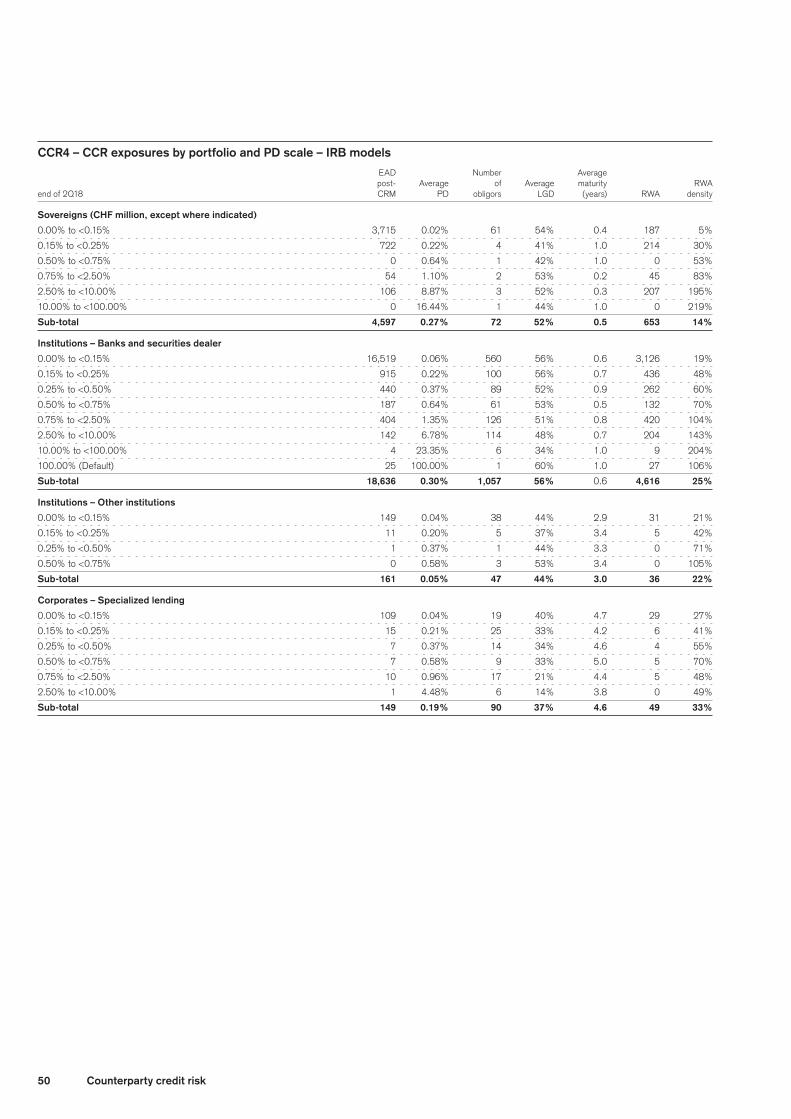
50 Counterparty credit risk
CCR4 – CCR exposures by portfolio and PD scale – IRB models EAD Number Average
post- Average of Average maturity RWA
end of 2Q18 CRM PD obligors LGD (years) RWA density
Sovereigns (CHF million, except where indicated)
0.00% to <0.15% 3,715 0.02% 61 54% 0.4 187 5%
0.15% to <0.25% 722 0.22% 4 41% 1.0 214 30%
0.50% to <0.75% 0 0.64% 1 42% 1.0 0 53%
0.75% to <2.50% 54 1.10% 2 53% 0.2 45 83%
2.50% to <10.00% 106 8.87% 3 52% 0.3 207 195%
10.00% to <100.00% 0 16.44% 1 44% 1.0 0 219%
Sub-total 4,597 0.27% 72 52% 0.5 653 14%
Institutions – Banks and securities dealer
0.00% to <0.15% 16,519 0.06% 560 56% 0.6 3,126 19%
0.15% to <0.25% 915 0.22% 100 56% 0.7 436 48%
0.25% to <0.50% 440 0.37% 89 52% 0.9 262 60%
0.50% to <0.75% 187 0.64% 61 53% 0.5 132 70%
0.75% to <2.50% 404 1.35% 126 51% 0.8 420 104%
2.50% to <10.00% 142 6.78% 114 48% 0.7 204 143%
10.00% to <100.00% 4 23.35% 6 34% 1.0 9 204%
100.00% (Default) 25 100.00% 1 60% 1.0 27 106%
Sub-total 18,636 0.30% 1,057 56% 0.6 4,616 25%
Institutions – Other institutions
0.00% to <0.15% 149 0.04% 38 44% 2.9 31 21%
0.15% to <0.25% 11 0.20% 5 37% 3.4 5 42%
0.25% to <0.50% 1 0.37% 1 44% 3.3 0 71%
0.50% to <0.75% 0 0.58% 3 53% 3.4 0 105%
Sub-total 161 0.05% 47 44% 3.0 36 22%
Corporates – Specialized lending
0.00% to <0.15% 109 0.04% 19 40% 4.7 29 27%
0.15% to <0.25% 15 0.21% 25 33% 4.2 6 41%
0.25% to <0.50% 7 0.37% 14 34% 4.6 4 55%
0.50% to <0.75% 7 0.58% 9 33% 5.0 5 70%
0.75% to <2.50% 10 0.96% 17 21% 4.4 5 48%
2.50% to <10.00% 1 4.48% 6 14% 3.8 0 49%
Sub-total 149 0.19% 90 37% 4.6 49 33%

51Counterparty credit risk
CCR4 – CCR exposures by portfolio and PD scale – IRB models (continued) EAD Number Average
post- Average of Average maturity RWA
end of 2Q18 CRM PD obligors LGD (years) RWA density
Corporates without specialized lending (CHF million, except where indicated)
0.00% to <0.15% 42,227 0.05% 11,620 51% 0.6 4,501 11%
0.15% to <0.25% 1,712 0.21% 1,207 45% 1.7 727 42%
0.25% to <0.50% 781 0.37% 557 56% 1.8 582 74%
0.50% to <0.75% 652 0.63% 519 62% 1.2 671 103%
0.75% to <2.50% 1,082 1.50% 1,411 69% 1.1 1,909 176%
2.50% to <10.00% 1,230 4.29% 2,079 57% 0.9 2,840 231%
10.00% to <100.00% 24 27.99% 16 52% 1.0 106 448%
100.00% (Default) 4 100.00% 6 53% 2.2 4 106%
Sub-total 47,712 0.23% 17,415 52% 0.7 11,340 24%
Other retail
0.00% to <0.15% 3,143 0.07% 1,877 49% 0.9 323 10%
0.15% to <0.25% 241 0.18% 383 21% 1.5 21 9%
0.25% to <0.50% 45 0.37% 254 23% 1.7 7 14%
0.50% to <0.75% 14 0.58% 922 27% 2.2 3 22%
0.75% to <2.50% 58 0.96% 146 50% 1.4 30 52%
2.50% to <10.00% 19 4.06% 35 33% 1.1 10 51%
10.00% to <100.00% 2 19.26% 6 16% 5.0 1 38%
100.00% (Default) 0 100.00% 1 53% 1.0 0 107%
Sub-total 3,522 0.12% 3,624 47% 0.9 395 11%
Sub-total (all portfolios)
0.00% to <0.15% 65,862 0.05% 14,175 52% 0.6 8,197 12%
0.15% to <0.25% 3,616 0.21% 1,724 45% 1.3 1,409 39%
0.25% to <0.50% 1,274 0.37% 915 53% 1.5 855 67%
0.50% to <0.75% 860 0.63% 1,515 59% 1.1 811 94%
0.75% to <2.50% 1,608 1.42% 1,702 63% 1.0 2,409 150%
2.50% to <10.00% 1,498 4.85% 2,237 56% 0.9 3,261 218%
10.00% to <100.00% 30 26.84% 29 47% 1.2 116 391%
100.00% (Default) 29 100.00% 8 59% 1.2 31 106%
Sub-total (all portfolios) 74,777 0.25% 22,305 52% 0.7 17,089 23%
Alternative treatment
Exposures from free deliveries applying standardized risk weights
or 100% under the alternative treatment – – – – – 0 –
Total (all portfolios and alternative treatment)
Total (all portfolios and alternative treatment) 74,777 0.25% 22,305 52% 0.7 17,089 23%
Composition of collateral for CCR exposureThe following table shows a breakdown of all types of collat-eral posted or received by banks to support or reduce the CCR exposures related to derivative transactions or to SFTs, including transactions cleared through a CCP. For disclosure purposes, the SFT collateral values are presented as the market value of the collateral without regulatory or contractual haircuts.
By their nature, various components of the SFT business do not attract haircuts on a trade-by-trade basis, and as such a contrac-tual haircut cannot be uniformly derived for the entire collateral population.
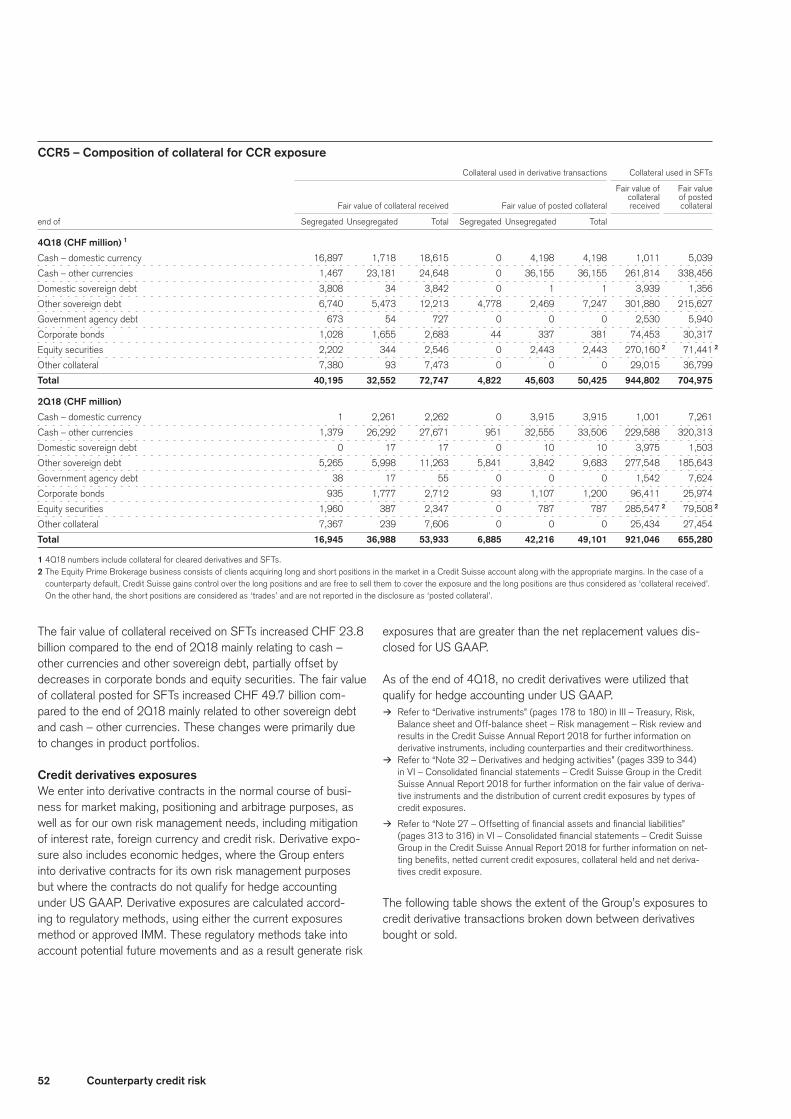
52 Counterparty credit risk
CCR5 – Composition of collateral for CCR exposure Collateral used in derivative transactions Collateral used in SFTs
Fair value of Fair value collateral of posted Fair value of collateral received Fair value of posted collateral received collateral
end of Segregated Unsegregated Total Segregated Unsegregated Total
4Q18 (CHF million) 1
Cash – domestic currency 16,897 1,718 18,615 0 4,198 4,198 1,011 5,039
Cash – other currencies 1,467 23,181 24,648 0 36,155 36,155 261,814 338,456
Domestic sovereign debt 3,808 34 3,842 0 1 1 3,939 1,356
Other sovereign debt 6,740 5,473 12,213 4,778 2,469 7,247 301,880 215,627
Government agency debt 673 54 727 0 0 0 2,530 5,940
Corporate bonds 1,028 1,655 2,683 44 337 381 74,453 30,317
Equity securities 2,202 344 2,546 0 2,443 2,443 270,160 2 71,441 2
Other collateral 7,380 93 7,473 0 0 0 29,015 36,799
Total 40,195 32,552 72,747 4,822 45,603 50,425 944,802 704,975
2Q18 (CHF million)
Cash – domestic currency 1 2,261 2,262 0 3,915 3,915 1,001 7,261
Cash – other currencies 1,379 26,292 27,671 951 32,555 33,506 229,588 320,313
Domestic sovereign debt 0 17 17 0 10 10 3,975 1,503
Other sovereign debt 5,265 5,998 11,263 5,841 3,842 9,683 277,548 185,643
Government agency debt 38 17 55 0 0 0 1,542 7,624
Corporate bonds 935 1,777 2,712 93 1,107 1,200 96,411 25,974
Equity securities 1,960 387 2,347 0 787 787 285,547 2 79,508 2
Other collateral 7,367 239 7,606 0 0 0 25,434 27,454
Total 16,945 36,988 53,933 6,885 42,216 49,101 921,046 655,280
1 4Q18 numbers include collateral for cleared derivatives and SFTs.2 The Equity Prime Brokerage business consists of clients acquiring long and short positions in the market in a Credit Suisse account along with the appropriate margins. In the case of a
counterparty default, Credit Suisse gains control over the long positions and are free to sell them to cover the exposure and the long positions are thus considered as ‘collateral received’. On the other hand, the short positions are considered as ‘trades’ and are not reported in the disclosure as ‘posted collateral’.
The fair value of collateral received on SFTs increased CHF 23.8 billion compared to the end of 2Q18 mainly relating to cash – other currencies and other sovereign debt, partially offset by decreases in corporate bonds and equity securities. The fair value of collateral posted for SFTs increased CHF 49.7 billion com-pared to the end of 2Q18 mainly related to other sovereign debt and cash – other currencies. These changes were primarily due to changes in product portfolios.
Credit derivatives exposuresWe enter into derivative contracts in the normal course of busi-ness for market making, positioning and arbitrage purposes, as well as for our own risk management needs, including mitigation of interest rate, foreign currency and credit risk. Derivative expo-sure also includes economic hedges, where the Group enters into derivative contracts for its own risk management purposes but where the contracts do not qualify for hedge accounting under US GAAP. Derivative exposures are calculated accord-ing to regulatory methods, using either the current exposures method or approved IMM. These regulatory methods take into account potential future movements and as a result generate risk
exposures that are greater than the net replacement values dis-closed for US GAAP.
As of the end of 4Q18, no credit derivatives were utilized that qualify for hedge accounting under US GAAP.
> Refer to “Derivative instruments” (pages 178 to 180) in III – Treasury, Risk, Balance sheet and Off-balance sheet – Risk management – Risk review and results in the Credit Suisse Annual Report 2018 for further information on derivative instruments, including counterparties and their creditworthiness.
> Refer to “Note 32 – Derivatives and hedging activities” (pages 339 to 344) in VI – Consolidated financial statements – Credit Suisse Group in the Credit Suisse Annual Report 2018 for further information on the fair value of deriva-tive instruments and the distribution of current credit exposures by types of credit exposures.
> Refer to “Note 27 – Offsetting of financial assets and financial liabilities” (pages 313 to 316) in VI – Consolidated financial statements – Credit Suisse Group in the Credit Suisse Annual Report 2018 for further information on net-ting benefits, netted current credit exposures, collateral held and net deriva-tives credit exposure.
The following table shows the extent of the Group’s exposures to credit derivative transactions broken down between derivatives bought or sold.

53Counterparty credit risk
CCR6 – Credit derivatives exposures 4Q18 2Q18
Protection Protection Protection Protection
end of bought sold bought sold
Notionals (CHF billion)
Single-name CDS 96.4 72.3 99.4 75.5
Index CDS 112.4 106.0 104.9 96.3
Total return swaps 4.5 5.2 5.1 5.1
Credit options 0.6 0.0 0.9 0.0
Other credit derivatives 48.7 23.3 56.8 18.6
of which credit default swaptions 48.7 23.3 56.8 18.6
Total notionals 262.6 206.8 267.1 195.5
Fair values (CHF billion)
Positive fair value (asset) 3.3 2.1 2.7 4.0
Negative fair value (liability) 3.8 2.8 5.7 2.4
Protection bought decreased CHF 4.5 billion compared to the end of 2Q18 primarily relating to credit default swaptions and sin-gle-name CDS, partially offset by increases in index CDS. Pro-tection sold increased CHF 12.1 billion compared to the end of 2Q18 primarily relating to index CDS and credit default swaptions, partially offset by decreases in single-name CDS.
> Refer to “Note 32 – Derivatives and hedging activities” (pages 343 to 344) in VI – Consolidated financial statements – Credit Suisse Group in the Credit Suisse Annual Report 2018 for further information on credit protection bought and credit protection sold.
RWAflowstatementsofCCRexposuresunderIMMThe following table presents the 4Q18 flow statement explain-ing changes in CCR RWA determined under the IMM for CCR (derivatives and SFTs).
CCR7 – Risk-weighted assets flow statements of CCR exposures under IMM
4Q18 RWA
CHF million
Risk-weighted assets at beginning of period 14,713 1
Asset size (856)
Credit quality of counterparties 125
Model and parameter updates 128
Methodology and policy changes 33
Foreign exchange impact (57)
Risk-weighted assets at end of period 14,086
1 Prior period number has been corrected.
CCR RWA under IMM of CHF 14.1 billion decreased 4% com-pared to the end of 3Q18, primarily driven by decreases relating to asset size due to reductions in exposures.
> Refer to “RWA flow statements of credit risk exposures under IRB” (page 36) in Credit risk for the definitions of the RWA flow statements components.
Exposures to central counterpartiesThe following table provides a comprehensive picture of the Group’s exposure to CCPs.
CCR8 – Exposures to central counterparties 4Q18 2Q18
EAD EAD
(post-CRM) RWA (post-CRM) RWA
CHF million
Exposures to QCCPs (total) – 1,294 – 1,737
Exposures for trades at QCCPs 16,200 323 18,327 591
of which OTC derivatives 5,516 110 7,184 144
of which exchange-traded
derivatives 9,768 195 10,355 431
of which SFTs 916 18 788 16
Segregated initial margin 303 – 60 –
Non-segregated initial margin 1,163 25 0 0
Pre-funded default fund
contributions 2,937 946 4,274 1 1,146
Exposures to non-QCCPs (total) – 118 – 62
Exposures for trades at
non-QCCPs 97 97 41 44
of which exchange-traded
derivatives 0 0 0 3
of which SFTs 97 97 41 41
Pre-funded default fund
contributions 6 21 6 1 18
Exposures associated with initial margin have been subsumed within disclosures under “Exposures for trades” where they are not separately identifiable due to EAD using IMM.1 Prior period numbers have been restated to include EAD (post-CRM) values for pre-
funded default fund contributions.

54 Securitization
Securitization
GeneralThe following disclosures, which also considers the “Industry good practice guidelines on Pillar 3 disclosure requirements for securitization”, refer to traditional and synthetic securitizations held in the banking and trading book and regulatory capital on these exposures calculated according to the Basel framework for securitizations.
> Refer to “Note 34 – Transfers of financial assets and variable interest entities” (pages 349 to 358) in VI – Consolidated financial statements – Credit Suisse Group in the Credit Suisse Annual Report 2018 for further information on securitization, the various roles, the use of SPEs, the involvement of the Group in consolidated and non-consolidated SPEs, the accounting policies for securi-tization activities and methods and key assumptions applied in valuing positions retained/purchased and gains/losses relating to RMBS and CMBS securitiza-tion activity in 2018.
A traditional securitization is a structure where an underlying pool of assets is sold to an SPE which pays for the assets by issuing tranched securities collateralized by the underlying asset pool. A synthetic securitization is a tranched structure where the credit risk of an underlying pool of assets is transferred, in whole or in part, through the use of credit derivatives or guarantees that may serve to hedge the credit risk of the portfolio. Many synthetic securitizations are not accounted for as securitizations under US GAAP. In both traditional and synthetic securitizations, risk is dependent on the seniority of the retained interest and the perfor-mance of the underlying asset pool.
Roles and activities in connection with securitization
Securitization in the banking bookThe Group is active in various roles in connection with securiti-zation, including originator, investor and sponsor. As originator, the Group creates or purchases financial assets (e.g., commer-cial mortgages or corporate loans) and then securitizes them in a traditional or synthetic transaction that achieves significant risk transfer to third party investors. The Group acts as liquidity provider to Alpine Securitization Ltd. (Alpine), a multi-seller com-mercial paper conduit administered by Credit Suisse and also provides liquidity to a couple of Asset Backed Commercial Paper programs managed by third party administrators.
In addition, the Group invests in securitization-related products created by third parties.
The Group has both securitization and re-securitization transac-tions in the banking book referencing different types of underlying assets including real estate loans (commercial and residential).
Securitization in the trading bookWithin its mortgage business there are four key roles that the Group undertakes within securitization markets: issuer, under-writer, market maker and financing counterparty. The Group holds one of the top trading franchises in market making in all major securitized product types and is a top issuer and underwriter in the re-securitization market in the US as well as being one of the
top underwriters in asset-backed securities (ABS) securitization in the US. In addition the Group also has a relatively small correla-tion trading portfolio.
The Group’s key objective in relation to trading book securitization is to meet clients’ investment and divestment needs by making markets in securitized products across all major collateral types, including residential mortgages, commercial mortgages, asset finance (i.e. auto loans, credit card receivables, etc.) and corpo-rate loans. The Group focuses on opportunities to intermediate transfers of risk between sellers and buyers.
The Group is also active in new issue securitization and re-securi-tization. The Group’s Securitized Products Finance team provides short-term secured warehouse financing to clients who originate credit card, auto loan, and other receivables, and the Group sells asset-backed securities collateralized by these receivables to pro-vide its clients long-term financing that matches the lives of their assets.
At times, the Group purchases loans and bonds for the purpose of securitization and sells these assets to SPEs which in turn issue new securities. Re-securitizations of previously issued mort-gage-backed securities (typically RMBS) securities occur when certificates issued out of an existing securitization vehicle are sold into a newly created and separate securitization vehicle.
Risks assumed and retained
Key risks retained while securities or loans remain in inventory are related to the performance of the underlying assets (residen-tial real estate loans, commercial loans, credit card loans, etc.). These risks are summarized in the securitization pool level attri-butes: PD of underlying loans (default rate), the severity of loss and prepayment speeds. The transactions may also be exposed to general market risk, credit spread and counterparty credit risk.
The Group maintains models for both government-guaranteed and private label mortgage products. These models project the above risk drivers based on market interest rates and volatility as well as macro-economic variables such as housing price index, projected GDP and inflation, unemployment etc.
In its role as a market maker, the Group actively trades in and out of positions. Both Front Office and Risk Management continu-ously monitor liquidity risk as reflected in trading spreads and trading volumes. To address liquidity concerns a specific set of limits on the size of aged positions are in place for the securitized positions we hold.
The Group classifies securities within the transactions by the nature of the collateral (residential, commercial, ABS, CLOs, etc.) and the seniority each security has in the capital structure (i.e. senior, mezzanine, subordinate etc.), which in turn will be reflected in the transaction risk assessment. Risk Management monitors portfolio composition by capital structure and collateral

55Securitization
type on a daily basis with subordinate exposure and each collat-eral type subject to separate risk limits and risk flags. In addition, the Group’s internal risk methodology is designed such that risk charges are based on the place the particular security holds in the capital structure, the less senior the bond the higher the risk charges.
For re-securitization risk, the Group’s risk management models take a ‘look through’ approach where they model the behavior of the underlying securities or constituent counterparties based on their own particular collateral and then transmit that to the re-securitized position. No additional risk factors are considered within the re-securitization portfolios in addition to those identified and measured within securitization risk.
With respect to both the wind-down corporate correlation trading portfolio and the on-going transactions the key risks that need to be managed includes default risk, counterparty credit risk, corre-lation risk and cross effects between spread and correlation. The impacts of liquidity risk for securitization products is embedded within the firm’s historical simulation model through the incorpo-ration of market data from stressed periods, and in the scenario framework through the calibration of price shocks to the same period.
Both correlation and first-to-default are valued using a correla-tion model which uses the market implied correlation and detailed market data such as constituent spread term structure and con-stituent recovery. The risks embedded in securitization and re-securitizations are similar and include spread risk, recovery risk, default risk and correlation risk. The risks for different seniority of tranches will be reflected in the tranche price sensitivities to each constituent in the pools. The complexity of the correlation portfo-lio’s risk lies in the level of convexity and cross risk inherent, for example, the risks to large spread moves and the risks to spread and correlation moving together. The risk limit framework is care-fully designed to address the key risks for the correlation trading portfolio.
Monitoring of changes in credit and market risk of securitization exposures
The Group has in place a comprehensive risk management process whereby the Front Office and Risk Management work together to monitor positions and position changes, portfolio structure and trading activity and calculate a set of risk measures on a daily basis using risk sensitivities and exposures.
For the mortgage business the Group also uses monthly remit-tance reports (available from public sources) to get up to date information on collateral performance (delinquencies, defaults, pre-payment etc.). Monthly or quarterly reports (sourced directly from the originator or sponsor of the securitization) are used to monitor performance of most banking book securitizations.
Risk Management has also put in place a set of key risk limits for the purpose of managing the Group’s risk appetite framework in relation to securitizations/re-securitizations. These limits will cover exposure measures, risk sensitivities, VaR and capital measures with the majority monitored on a daily basis. In addition within the Group’s risk management framework an extensive scenario analysis framework is in place whereby all underlying risk factors are stressed to determine portfolio sensitivity.
Re-securitized products in the mortgage business go through the same risk management process but looking through the struc-tures with the focus on the risk of the underlying securities or constituent names.
Retained banking book exposures for mortgage, ABS, CMBS and collateralized debt obligation (CDO) transactions are risk managed on the same basis as similar trading book transactions.
Risk mitigation
In addition to the strict exposure limits noted above, the Group uses a number of different risk mitigation approaches to manage risk appetite for its securitization and re-securitization exposures. Where true counterparty credit risk exposure is identified for a particular transaction, there is a requirement for it to be approved through normal credit risk management processes with collateral taken as required. The Group also may use various proxies includ-ing corporate single name and index hedges and equity hedges to mitigate the price and spread risks to which it is exposed. Hedging decisions are made by the trading desk based on cur-rent market conditions and will be made in consultation with Risk Management. Every trade has a trading mandate where unusual and material trades require approval under the Group’s Pre-Trade Approval governance process. International investment banks are the main counterparties to the hedges that are used across these business areas.
Affiliatedentities
In the normal course of business it is possible for the Group’s managed separate account portfolios and the Group’s controlled investment entities, such as mutual funds, fund of funds, private equity funds and other fund linked products to invest in the secu-rities issued by other vehicles sponsored by the Group engaged in securitization and re-securitization activities. To address potential conflicts, standards governing investments in affiliated products and funds have been adopted.
Regulatory capital treatment of securitization structures
Banking book securitizationFor banking book securitizations, the regulatory capital require-ments are calculated since January 2018 with the following approaches: the Securitization Internal Ratings-Based Approach

56 Securitization
(SEC-IRBA), the Securitization External Ratings-Based Approach (SEC-ERBA), or the Securitization Standardized Approach (SEC-SA). External ratings used in regulatory capital calculations for securitization risk exposures in the banking book are obtained from Fitch, Moody’s, Standard & Poor’s or Dominion Bond Rating Service.
Trading book securitizationWe use the standardized measurement method (SMM) which is based on the ratings-based approach (RBA) and the supervisory formula approach (SFA) for securitization purposes and other supervisory approaches for trading book securitization positions covering the approach for nth-to-default products and portfolios covered by the weighted average risk weight approach.
Securitization exposures in the banking bookSecuritization exposures in the banking book where the Group acts as originator increased CHF 2.8 billion compared to the end of 2Q18, primarily relating to new CDO/CLO securitizations.
Securitization exposures in the banking book where the Group acts as sponsor increased CHF 5.6 billion while securitization exposures in the banking book where the Group acts as investor decreased CHF 3.8 billion compared to the end of 2Q18. These movements were primarily related to the transfer of Alpine facili-ties from the banking book where the Group acts as investor to the banking book where the Group acts as sponsor.
SEC1 – Securitization exposures in the banking book Bank acts as originator Bank acts as sponsor Bank acts as investor
end of Traditional Synthetic Total Traditional Synthetic Total Traditional Synthetic Total
4Q18 (CHF million)
Commercial mortgages 10 0 10 0 0 0 0 0 0
Residential mortgages 44 0 44 0 0 0 309 0 309
CDO/CLO 3,314 29,586 32,900 200 50 250 2,775 296 3,071
Other ABS 2 0 2 5,617 0 5,617 5,963 0 5,963
Total 3,370 29,586 32,956 5,817 50 5,867 9,047 296 9,343
2Q18 (CHF million)
Commercial mortgages 10 0 10 0 0 0 0 0 0
Residential mortgages 478 0 478 0 0 0 223 0 223
CDO/CLO 4,155 25,271 29,426 149 71 220 2,692 297 2,989
Other ABS 200 0 200 0 0 0 9,947 0 9,947
Total 4,843 25,271 30,114 149 71 220 12,862 297 13,159

57Securitization
Securitization exposures in the trading book
SEC2 – Securitization exposures in the trading book Bank acts as originator Bank acts as sponsor Bank acts as investor
end of Traditional Synthetic Total Traditional Synthetic Total Traditional Synthetic Total
4Q18 (CHF million)
Commercial mortgages 86 0 86 0 0 0 1,439 887 2,326
Residential mortgages 42 0 42 0 0 0 2,483 40 2,523
Other ABS 1 0 1 0 0 0 630 139 769
CDO/CLO 4 0 4 0 0 0 462 482 944
Total 133 0 133 0 0 0 5,014 1,548 6,562
2Q18 (CHF million)
Commercial mortgages 94 0 94 0 0 0 1,932 717 2,649
Residential mortgages 403 0 403 0 0 0 3,213 108 3,321
Other ABS 1 0 1 0 0 0 755 128 883
CDO/CLO 3 0 3 0 0 0 302 409 711
Total 501 0 501 0 0 0 6,202 1,362 7,564
Securitization exposures in the trading book where the Group acts as originator decreased CHF 0.4 billion compared to the end of 2Q18. The decrease was primarily related to a wind-down of residential mortgages.
Securitization exposures in the trading book where the Group acts as investor decreased CHF 1.0 billion compared to the end of 2Q18. The decrease was primarily related to a wind-down of positions and the partial sell-off of exposures with various counterparties.
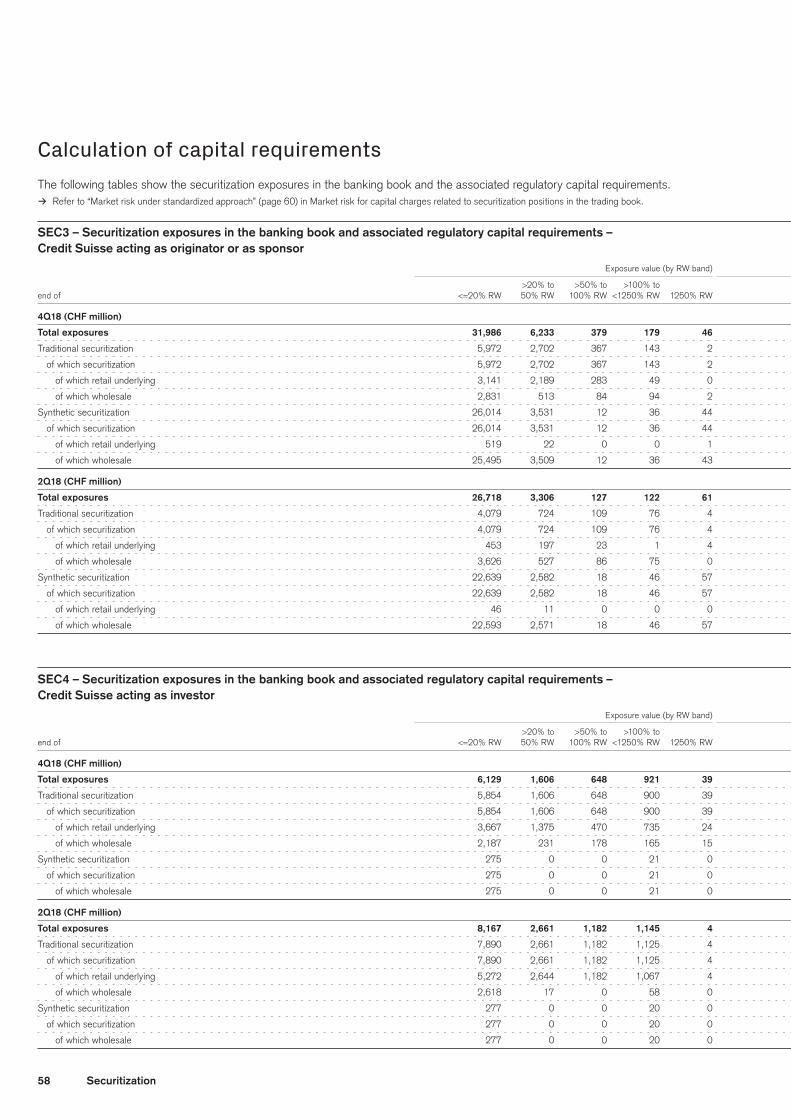
58 Securitization
Calculation of capital requirementsThe following tables show the securitization exposures in the banking book and the associated regulatory capital requirements.
> Refer to “Market risk under standardized approach” (page 60) in Market risk for capital charges related to securitization positions in the trading book.
SEC3 – Securitization exposures in the banking book and associated regulatory capital requirements – Credit Suisse acting as originator or as sponsor Exposure value (by RW band) Exposure value (by regulatory approach) RWA (by regulatory approach) Capital charge after cap
>20% to >50% to >100% to
end of <=20% RW 50% RW 100% RW <1250% RW 1250% RW SEC-IRBA SEC-ERBA SEC-SA 1250% RW SEC-IRBA SEC-ERBA SEC-SA 1250% RW SEC-IRBA SEC-ERBA SEC-SA 1250% RW
4Q18 (CHF million)
Total exposures 31,986 6,233 379 179 46 33,059 1,441 4,277 46 6,304 1,036 991 573 504 83 79 46
Traditional securitization 5,972 2,702 367 143 2 3,497 1,441 4,247 2 692 1,036 976 24 55 83 78 2
of which securitization 5,972 2,702 367 143 2 3,497 1,441 4,247 2 692 1,036 976 24 55 83 78 2
of which retail underlying 3,141 2,189 283 49 0 184 1,241 4,237 0 69 586 960 0 5 47 77 0
of which wholesale 2,831 513 84 94 2 3,313 200 10 2 623 450 16 24 50 36 1 2
Synthetic securitization 26,014 3,531 12 36 44 29,562 0 30 44 5,612 0 15 549 449 0 1 44
of which securitization 26,014 3,531 12 36 44 29,562 0 30 44 5,612 0 15 549 449 0 1 44
of which retail underlying 519 22 0 0 1 541 0 0 1 83 0 0 9 7 0 0 1
of which wholesale 25,495 3,509 12 36 43 29,021 0 30 43 5,529 0 15 540 442 0 1 43
2Q18 (CHF million)
Total exposures 26,718 3,306 127 122 61 29,426 628 278 2 5,131 497 509 30 410 40 41 2
Traditional securitization 4,079 724 109 76 4 4,155 627 207 2 749 478 103 30 60 39 8 2
of which securitization 4,079 724 109 76 4 4,155 627 207 2 749 478 103 30 60 39 8 2
of which retail underlying 453 197 23 1 4 0 478 197 2 0 126 87 30 0 10 7 2
of which wholesale 3,626 527 86 75 0 4,155 149 10 0 749 352 16 0 60 29 1 0
Synthetic securitization 22,639 2,582 18 46 57 25,271 1 71 0 4,382 19 406 0 350 1 33 0
of which securitization 22,639 2,582 18 46 57 25,271 1 71 0 4,382 19 406 0 350 1 33 0
of which retail underlying 46 11 0 0 0 57 0 0 0 (686) 0 0 0 (55) 0 0 0
of which wholesale 22,593 2,571 18 46 57 25,214 1 71 0 5,068 19 406 0 405 1 33 0
SEC4 – Securitization exposures in the banking book and associated regulatory capital requirements – Credit Suisse acting as investor Exposure value (by RW band) Exposure value (by regulatory approach) RWA (by regulatory approach) Capital charge after cap
>20% to >50% to >100% to
end of <=20% RW 50% RW 100% RW <1250% RW 1250% RW SEC-IRBA SEC-ERBA SEC-SA 1250% RW SEC-IRBA SEC-ERBA SEC-SA 1250% RW SEC-IRBA SEC-ERBA SEC-SA 1250% RW
4Q18 (CHF million)
Total exposures 6,129 1,606 648 921 39 1,786 942 6,576 39 313 386 2,457 481 25 31 196 39
Traditional securitization 5,854 1,606 648 900 39 1,786 646 6,576 39 313 333 2,457 481 25 27 196 39
of which securitization 5,854 1,606 648 900 39 1,786 646 6,576 39 313 333 2,457 481 25 27 196 39
of which retail underlying 3,667 1,375 470 735 24 0 646 5,602 24 0 333 1,979 298 0 27 158 24
of which wholesale 2,187 231 178 165 15 1,786 0 974 15 313 0 478 183 25 0 38 15
Synthetic securitization 275 0 0 21 0 0 296 0 0 0 53 0 0 0 4 0 0
of which securitization 275 0 0 21 0 0 296 0 0 0 53 0 0 0 4 0 0
of which wholesale 275 0 0 21 0 0 296 0 0 0 53 0 0 0 4 0 0
2Q18 (CHF million)
Total exposures 8,167 2,661 1,182 1,145 4 2,602 3,120 7,437 0 573 1,228 2,807 0 46 98 225 0
Traditional securitization 7,890 2,661 1,182 1,125 4 2,602 2,823 7,437 0 573 1,176 2,807 0 46 94 225 0
of which securitization 7,890 2,661 1,182 1,125 4 2,602 2,823 7,437 0 573 1,176 2,807 0 46 94 225 0
of which retail underlying 5,272 2,644 1,182 1,067 4 188 2,823 7,159 0 70 1,176 2,709 0 6 94 217 0
of which wholesale 2,618 17 0 58 0 2,414 0 278 0 503 0 98 0 40 0 8 0
Synthetic securitization 277 0 0 20 0 0 297 0 0 0 52 0 0 0 4 0 0
of which securitization 277 0 0 20 0 0 297 0 0 0 52 0 0 0 4 0 0
of which wholesale 277 0 0 20 0 0 297 0 0 0 52 0 0 0 4 0 0
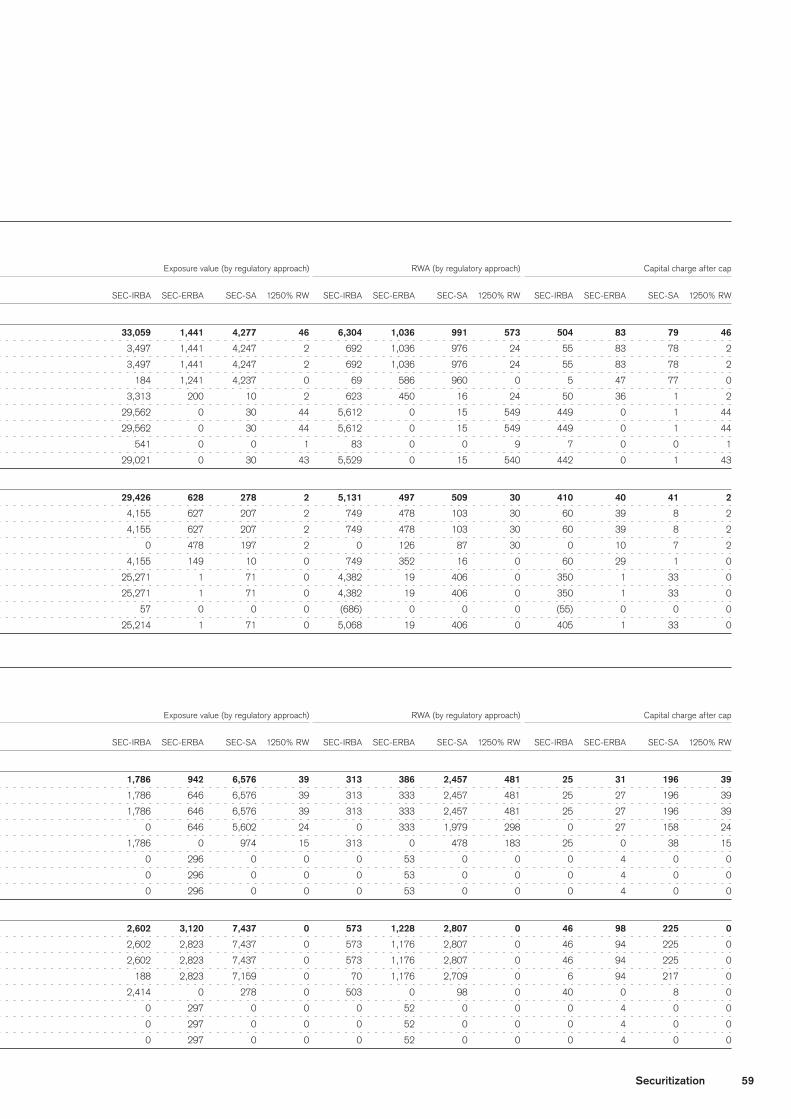
59Securitization
Calculation of capital requirementsThe following tables show the securitization exposures in the banking book and the associated regulatory capital requirements.
> Refer to “Market risk under standardized approach” (page 60) in Market risk for capital charges related to securitization positions in the trading book.
SEC3 – Securitization exposures in the banking book and associated regulatory capital requirements – Credit Suisse acting as originator or as sponsor Exposure value (by RW band) Exposure value (by regulatory approach) RWA (by regulatory approach) Capital charge after cap
>20% to >50% to >100% to
end of <=20% RW 50% RW 100% RW <1250% RW 1250% RW SEC-IRBA SEC-ERBA SEC-SA 1250% RW SEC-IRBA SEC-ERBA SEC-SA 1250% RW SEC-IRBA SEC-ERBA SEC-SA 1250% RW
4Q18 (CHF million)
Total exposures 31,986 6,233 379 179 46 33,059 1,441 4,277 46 6,304 1,036 991 573 504 83 79 46
Traditional securitization 5,972 2,702 367 143 2 3,497 1,441 4,247 2 692 1,036 976 24 55 83 78 2
of which securitization 5,972 2,702 367 143 2 3,497 1,441 4,247 2 692 1,036 976 24 55 83 78 2
of which retail underlying 3,141 2,189 283 49 0 184 1,241 4,237 0 69 586 960 0 5 47 77 0
of which wholesale 2,831 513 84 94 2 3,313 200 10 2 623 450 16 24 50 36 1 2
Synthetic securitization 26,014 3,531 12 36 44 29,562 0 30 44 5,612 0 15 549 449 0 1 44
of which securitization 26,014 3,531 12 36 44 29,562 0 30 44 5,612 0 15 549 449 0 1 44
of which retail underlying 519 22 0 0 1 541 0 0 1 83 0 0 9 7 0 0 1
of which wholesale 25,495 3,509 12 36 43 29,021 0 30 43 5,529 0 15 540 442 0 1 43
2Q18 (CHF million)
Total exposures 26,718 3,306 127 122 61 29,426 628 278 2 5,131 497 509 30 410 40 41 2
Traditional securitization 4,079 724 109 76 4 4,155 627 207 2 749 478 103 30 60 39 8 2
of which securitization 4,079 724 109 76 4 4,155 627 207 2 749 478 103 30 60 39 8 2
of which retail underlying 453 197 23 1 4 0 478 197 2 0 126 87 30 0 10 7 2
of which wholesale 3,626 527 86 75 0 4,155 149 10 0 749 352 16 0 60 29 1 0
Synthetic securitization 22,639 2,582 18 46 57 25,271 1 71 0 4,382 19 406 0 350 1 33 0
of which securitization 22,639 2,582 18 46 57 25,271 1 71 0 4,382 19 406 0 350 1 33 0
of which retail underlying 46 11 0 0 0 57 0 0 0 (686) 0 0 0 (55) 0 0 0
of which wholesale 22,593 2,571 18 46 57 25,214 1 71 0 5,068 19 406 0 405 1 33 0
SEC4 – Securitization exposures in the banking book and associated regulatory capital requirements – Credit Suisse acting as investor Exposure value (by RW band) Exposure value (by regulatory approach) RWA (by regulatory approach) Capital charge after cap
>20% to >50% to >100% to
end of <=20% RW 50% RW 100% RW <1250% RW 1250% RW SEC-IRBA SEC-ERBA SEC-SA 1250% RW SEC-IRBA SEC-ERBA SEC-SA 1250% RW SEC-IRBA SEC-ERBA SEC-SA 1250% RW
4Q18 (CHF million)
Total exposures 6,129 1,606 648 921 39 1,786 942 6,576 39 313 386 2,457 481 25 31 196 39
Traditional securitization 5,854 1,606 648 900 39 1,786 646 6,576 39 313 333 2,457 481 25 27 196 39
of which securitization 5,854 1,606 648 900 39 1,786 646 6,576 39 313 333 2,457 481 25 27 196 39
of which retail underlying 3,667 1,375 470 735 24 0 646 5,602 24 0 333 1,979 298 0 27 158 24
of which wholesale 2,187 231 178 165 15 1,786 0 974 15 313 0 478 183 25 0 38 15
Synthetic securitization 275 0 0 21 0 0 296 0 0 0 53 0 0 0 4 0 0
of which securitization 275 0 0 21 0 0 296 0 0 0 53 0 0 0 4 0 0
of which wholesale 275 0 0 21 0 0 296 0 0 0 53 0 0 0 4 0 0
2Q18 (CHF million)
Total exposures 8,167 2,661 1,182 1,145 4 2,602 3,120 7,437 0 573 1,228 2,807 0 46 98 225 0
Traditional securitization 7,890 2,661 1,182 1,125 4 2,602 2,823 7,437 0 573 1,176 2,807 0 46 94 225 0
of which securitization 7,890 2,661 1,182 1,125 4 2,602 2,823 7,437 0 573 1,176 2,807 0 46 94 225 0
of which retail underlying 5,272 2,644 1,182 1,067 4 188 2,823 7,159 0 70 1,176 2,709 0 6 94 217 0
of which wholesale 2,618 17 0 58 0 2,414 0 278 0 503 0 98 0 40 0 8 0
Synthetic securitization 277 0 0 20 0 0 297 0 0 0 52 0 0 0 4 0 0
of which securitization 277 0 0 20 0 0 297 0 0 0 52 0 0 0 4 0 0
of which wholesale 277 0 0 20 0 0 297 0 0 0 52 0 0 0 4 0 0

60 Market risk
Market risk
GeneralWe use the advanced approach for calculating the market risk capital requirements for the majority of our market risk exposures. The percentage of RWA covered by internal models as of Decem-ber 31, 2018 was 87%. In line with regulatory requirements, the SMM is used for the specific risk of securitization exposures.
> Refer to “Regulatory capital treatment of securitization structures” (pages 55 to 56) in Securitization – General for further information on the standardized measurement method and other supervisory approaches.
Risk management objectives and policies for market risk
> Refer to “Market risk” (pages 155 to 158) in III – Treasury, Risk, Balance sheet and Off-balance sheet – Risk management – Risk coverage and management in the Credit Suisse Annual Report 2018 for information on our risk manage-ment objectives and policies for market risk.
> Refer to “Note 1 – Summary of significant accounting policies” (pages 277 to 278) and “Note 32 – Derivatives and hedging activities” (pages 339 to 342) in VI – Consolidated financial statements – Credit Suisse Group in the Credit Suisse Annual Report 2018 for further information on policies for hedging risk and strategies/processes for monitoring the continuing effectiveness of hedges.
Market risk reporting
Market risk reporting is performed daily and there are docu-mented internal control procedures. Senior management and the Board of Directors are informed about key market risk metrics, including VaR, ERC, key risks and top exposures with the monthly Group Risk Report.
Market risk under standardized approachThe following table shows the components of the capital require-ment under the standardized approach for market risk.
MR1 – Market risk under standardized approach
end of 4Q18 2Q18
Risk-weighted assets (CHF million)
Options
Securitization 2,393 2,490
Total risk-weighted assets 2,393 2,490
Market risk under internal model approachGeneral
The market risk internal model approach (IMA) framework includes regulatory VaR, stressed VaR, risks not in VaR (RNIV) and Incremental Risk Charge (IRC). RNIV includes certain stressed RNIV. In 2014 Comprehensive Risk Measure was dis-continued due to the small size of the correlation trading portfolio. We now use the standard rules for this portfolio.
The following table shows the main characteristics of the different models.
MRB – Internal model approach – overview Regulatory VaR Stressed VaR IRC
Method applied Historical simulation Historical simulation Portfolio loss
simulation
Data set 2 years 1 Year –
Holding period 10 days (overlapping) 10 days (overlapping) One-year liquidity horizon
Confidence level 99% 99% 99.9%
Population Regulatory trading book Regulatory trading book Regulatory trading book
(where applicable, foreign (where applicable, foreign subject to issuer default exchange and commodity exchange and commodity and migration risk
risks in the regulatory risks in the regulatory (excl. securitizations and
banking book are added) banking book are added) correlation trades)

61Market risk
The following table shows a breakdown of RWA covered by each of the models.
MRB – IMA – Risk-weighted assets
end of 4Q18 CHF billion in %
Risk-weighted assets
Regulatory VaR 3.5 21
Stressed VaR 5.8 35
RNIV 5.9 36
IRC 1.1 7
Total risk-weighted assets 16.3 100
Regulatory VaR, stressed VaR and risks not in VaR
The regulatory VaR and stressed VaR models cover primarily the activities of Credit Suisse’s business units that are held within trading books. The model is predominantly based on historical simulation and includes risk factors covering equity, currency, interest rate, commodity and credit market risks. The model is also used to capture foreign exchange and commodity risk within banking books where required by the regulator.
In addition to the regulatory VaR and stressed VaR models Credit Suisse operates a RNIV framework. This is applied to the same activities as the VaR/stressed VaR model but covers risks that are not included in the model due e.g. to lack of historical data or other model constraints. The purpose of the RNIV framework is to ensure that capital is held to meet all risks which are not cap-tured, or not captured adequately, by the firm’s VaR and stressed VaR models. These include, but are not limited to risk fac-tors such as cross-risks, basis risks and higher-order risks. The RNIV framework is also intended to cover event risks that could adversely affect the relevant business.
The objective of Credit Suisse is to ensure the greatest consis-tency possible between the model used for Group and that used for subsidiaries and other legal entities. The model used in all instances is based on the same historical simulation approach but precise configuration and inclusion of risk factors may differ due to a variety of factors. These include timing differences in receiv-ing the necessary regulatory approvals (in which case the differ-ences may be temporary) or different supervisory requirements or interpretations (in which case the differences may be expected to remain).
The Group model is used for Credit Suisse AG (consolidated and parent company), Credit Suisse (Schweiz) AG, Neue Aargauer Bank AG and Credit Suisse (Hong Kong) Ltd. The model used for Credit Suisse Holdings (USA), Credit Suisse Capital LLC, Credit Suisse International and Credit Suisse Securities (Europe) Limited is similar but is based on a straight percentile rather than expected shortfall.
The main approach of the model is to use historical simulation. This is a generally accepted approach to regulatory VaR. The
stressed VaR model is based on an observation period of 1 year and relates to a period of significant financial stress. The market data in the model is updated on an at least weekly basis (some current rates/spreads required by the model are updated on a daily basis). Expected shortfall is the preferred tail measure where permitted and is calibrated to be equivalent to a 99% confidence level.
The risk management VaR model for the Group is similar to the regulatory VaR model with a few differences. Certain positions excluded from regulatory and stressed VaR can be included for risk management purposes, such as specific risk from securitiza-tion positions and certain banking book exposures. The holding period for risk management VaR is 1 day. The tail measure for risk management is calibrated to be equivalent to a 98% confi-dence level rather than the regulatory 99%.
The regulatory VaR model for the Group and its entities uses a two-year lookback window and an exponential weighting scheme is applied. The exponential weighting is applied to the profits and losses (P&L) vector prior to computing the tail estimate and the weighting is calibrated subject to constraints imposed by the regulations. The model does not use scaled 1-day returns but actual 10 day overlapping returns. The return methodology (e.g. absolute, proportional or another functional form) is documented and varies by risk type and it is reviewed on a periodic basis. The P&L vectors are generated using a variety of approaches; Taylor Series approximation, revaluation ladders and grids as well as full revaluation, depending on the complexity and linearity of the underlying risks.
The stressed VaR model for the Group and its entities uses an actual 10 day return calculated over a 1 year historical observa-tion period with no exponential weighting applied, except of Credit Suisse Holdings (USA) where stressed VaR uses regulatory VaR time weighting parameters. The underlying risk factors are simu-lated using the same approaches as for regulatory VaR. The 1 year period of stress is assessed on a monthly basis by calculat-ing stressed VaR for different alternative 1 year periods for recent portfolios.
The model is an integrated approach to general and specific risk. Where regression approaches are used a residual component may be aggregated with the pure historical simulation approach using a Gaussian assumption (zero correlation). Alternative approaches to aggregation including RNIV may be used where the zero correlation assumption cannot be justified.
The performance of our internal models is regularly monitored and discussed at internal risk governance committees which review the regulatory backtesting results in addition to internal metrics of model performance. Position information flowing into the VaR model is reviewed daily, historical market data is reviewed before going live on a weekly basis, and model parameters are reviewed regularly.
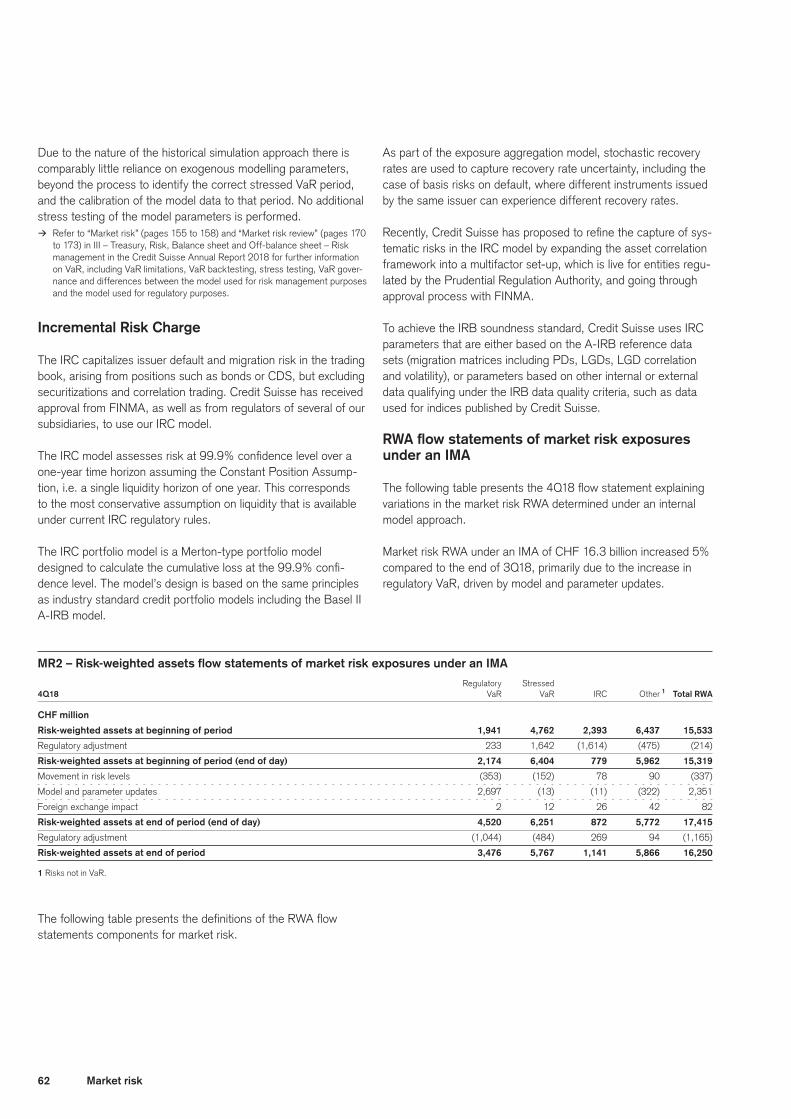
62 Market risk
Due to the nature of the historical simulation approach there is comparably little reliance on exogenous modelling parameters, beyond the process to identify the correct stressed VaR period, and the calibration of the model data to that period. No additional stress testing of the model parameters is performed.
> Refer to “Market risk” (pages 155 to 158) and “Market risk review” (pages 170 to 173) in III – Treasury, Risk, Balance sheet and Off-balance sheet – Risk management in the Credit Suisse Annual Report 2018 for further information on VaR, including VaR limitations, VaR backtesting, stress testing, VaR gover-nance and differences between the model used for risk management purposes and the model used for regulatory purposes.
Incremental Risk Charge
The IRC capitalizes issuer default and migration risk in the trading book, arising from positions such as bonds or CDS, but excluding securitizations and correlation trading. Credit Suisse has received approval from FINMA, as well as from regulators of several of our subsidiaries, to use our IRC model.
The IRC model assesses risk at 99.9% confidence level over a one-year time horizon assuming the Constant Position Assump-tion, i.e. a single liquidity horizon of one year. This corresponds to the most conservative assumption on liquidity that is available under current IRC regulatory rules.
The IRC portfolio model is a Merton-type portfolio model designed to calculate the cumulative loss at the 99.9% confi-dence level. The model’s design is based on the same principles as industry standard credit portfolio models including the Basel II A-IRB model.
As part of the exposure aggregation model, stochastic recovery rates are used to capture recovery rate uncertainty, including the case of basis risks on default, where different instruments issued by the same issuer can experience different recovery rates.
Recently, Credit Suisse has proposed to refine the capture of sys-tematic risks in the IRC model by expanding the asset correlation framework into a multifactor set-up, which is live for entities regu-lated by the Prudential Regulation Authority, and going through approval process with FINMA.
To achieve the IRB soundness standard, Credit Suisse uses IRC parameters that are either based on the A-IRB reference data sets (migration matrices including PDs, LGDs, LGD correlation and volatility), or parameters based on other internal or external data qualifying under the IRB data quality criteria, such as data used for indices published by Credit Suisse.
RWAflowstatementsofmarketriskexposuresunder an IMA
The following table presents the 4Q18 flow statement explaining variations in the market risk RWA determined under an internal model approach.
Market risk RWA under an IMA of CHF 16.3 billion increased 5% compared to the end of 3Q18, primarily due to the increase in regulatory VaR, driven by model and parameter updates.
MR2 – Risk-weighted assets flow statements of market risk exposures under an IMA Regulatory Stressed
4Q18 VaR VaR IRC Other 1 Total RWA
CHF million
Risk-weighted assets at beginning of period 1,941 4,762 2,393 6,437 15,533
Regulatory adjustment 233 1,642 (1,614) (475) (214)
Risk-weighted assets at beginning of period (end of day) 2,174 6,404 779 5,962 15,319
Movement in risk levels (353) (152) 78 90 (337)
Model and parameter updates 2,697 (13) (11) (322) 2,351
Foreign exchange impact 2 12 26 42 82
Risk-weighted assets at end of period (end of day) 4,520 6,251 872 5,772 17,415
Regulatory adjustment (1,044) (484) 269 94 (1,165)
Risk-weighted assets at end of period 3,476 5,767 1,141 5,866 16,250
1 Risks not in VaR.
The following table presents the definitions of the RWA flow statements components for market risk.
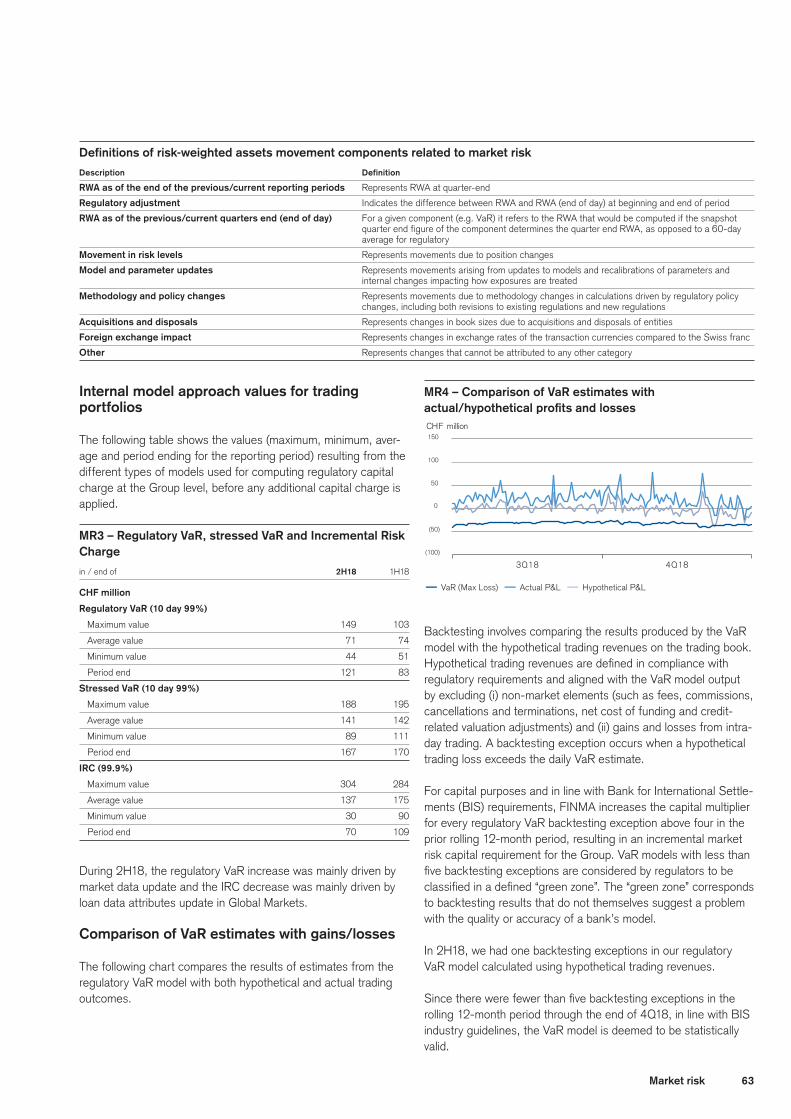
63Market risk
MR4 – Comparison of VaR estimates with actual/hypotheticalprofitsandlosses
j VaR (Max Loss) j Actual P&L j Hypothetical P&L
CHF million
(100)
(50)
0
50
100
150
3Q18 4Q18
Definitions of risk-weighted assets movement components related to market risk
Description Definition
RWA as of the end of the previous/current reporting periods Represents RWA at quarter-end
Regulatory adjustment Indicates the difference between RWA and RWA (end of day) at beginning and end of period
RWA as of the previous/current quarters end (end of day) For a given component (e.g. VaR) it refers to the RWA that would be computed if the snapshot quarter end figure of the component determines the quarter end RWA, as opposed to a 60-day average for regulatory
Movement in risk levels Represents movements due to position changes
Model and parameter updates Represents movements arising from updates to models and recalibrations of parameters and internal changes impacting how exposures are treated
Methodology and policy changes Represents movements due to methodology changes in calculations driven by regulatory policy changes, including both revisions to existing regulations and new regulations
Acquisitions and disposals Represents changes in book sizes due to acquisitions and disposals of entities
Foreign exchange impact Represents changes in exchange rates of the transaction currencies compared to the Swiss franc
Other Represents changes that cannot be attributed to any other category
Internal model approach values for trading portfolios
The following table shows the values (maximum, minimum, aver-age and period ending for the reporting period) resulting from the different types of models used for computing regulatory capital charge at the Group level, before any additional capital charge is applied.
MR3 – Regulatory VaR, stressed VaR and Incremental Risk Charge
in / end of 2H18 1H18
CHF million
Regulatory VaR (10 day 99%)
Maximum value 149 103
Average value 71 74
Minimum value 44 51
Period end 121 83
Stressed VaR (10 day 99%)
Maximum value 188 195
Average value 141 142
Minimum value 89 111
Period end 167 170
IRC (99.9%)
Maximum value 304 284
Average value 137 175
Minimum value 30 90
Period end 70 109
During 2H18, the regulatory VaR increase was mainly driven by market data update and the IRC decrease was mainly driven by loan data attributes update in Global Markets.
Comparison of VaR estimates with gains/losses
The following chart compares the results of estimates from the regulatory VaR model with both hypothetical and actual trading outcomes.
Backtesting involves comparing the results produced by the VaR model with the hypothetical trading revenues on the trading book. Hypothetical trading revenues are defined in compliance with regulatory requirements and aligned with the VaR model output by excluding (i) non-market elements (such as fees, commissions, cancellations and terminations, net cost of funding and credit-related valuation adjustments) and (ii) gains and losses from intra-day trading. A backtesting exception occurs when a hypothetical trading loss exceeds the daily VaR estimate.
For capital purposes and in line with Bank for International Settle-ments (BIS) requirements, FINMA increases the capital multiplier for every regulatory VaR backtesting exception above four in the prior rolling 12-month period, resulting in an incremental market risk capital requirement for the Group. VaR models with less than five backtesting exceptions are considered by regulators to be classified in a defined “green zone”. The “green zone” corresponds to backtesting results that do not themselves suggest a problem with the quality or accuracy of a bank’s model.
In 2H18, we had one backtesting exceptions in our regulatory VaR model calculated using hypothetical trading revenues.
Since there were fewer than five backtesting exceptions in the rolling 12-month period through the end of 4Q18, in line with BIS industry guidelines, the VaR model is deemed to be statistically valid.

64 Interest rate risk in the banking book
Interest rate risk in the banking book
OverviewThe Group monitors and manages interest rate risk in the bank-ing book by established systems, processes and controls. Risk sensitivity figures are provided to estimate the impact of changes in interest rates, which is one of the primary ways in which these risks are assessed for risk management purposes. In addition, Risk Division confirms that the economic impacts of adverse par-allel shifts in interest rates of 200 basis points are significantly below the threshold of 20% of eligible regulatory capital used by the regulator to identify banks that potentially run excessive levels of banking book interest rate risk. Given the low level of interest rate risk in the banking book, the Group does not have any regu-latory requirement to hold capital against this risk.
Major sources of interest rate risk in the banking bookThe interest rate risk exposures in the non-trading positions (syn-onymously used to the term “banking book”) mainly arise from the retail/private banking activities, the positioning strategy with respect to our replicated non-interest bearing assets and liabilities (including the equity balance) and the outstanding capital instru-ments. The vast majority of interest rate risk in the banking book is managed on a portfolio basis.
The interest rate risk from retail/private banking activities results from the transactions with repricing maturities that either are or are not contractually determined. For most parts of the latter, such as variable rate mortgages and some types of deposits, which do not have a direct link to market rates in their repricing behavior, it is more suitable to manage them on a portfolio basis rather than on individual trade level. The interest rate risk associ-ated with these products, referred to as non-maturing products, is estimated using the methodology of replicating portfolios: Based on the historical and expected behavior of interest rates and vol-ume of these products it assigns the position balance associ-ated with a non-maturing banking product to time bands that are presumed to reflect their empirical repricing maturities. The methodology is based, where reasonably possible, on the prin-ciple of finding a stable relationship between the changes of client rates of the non-maturing products and an underlying investment or funding portfolio. These allocations to time bands can then be used to evaluate the products’ interest rate sensitivity. The struc-ture and parameters of the replicating portfolios are reviewed periodically to ensure continued relevance of the portfolios in light of changing market conditions and client behavior.
Changing market rates give rise to changes in the fair values of the outstanding capital instruments that have been issued for funding of the bank. To some extent, on an individual basis, this risk is being mitigated by using swaps to replace fixed payment obligations into floating ones. In addition to these transactions on individual basis, the residual interest rate risk is also managed holistically by Treasury.
Governance of models and limitsThe majority of interest rate risk in the banking book is managed centrally within approved limits using hedging instruments such as interest rate swaps. The Board of Directors defines the risk appetite, i.e. a set of risk limits, for the Group on an annual basis. Limits to the divisions are governed by the CARMC; the divisional Risk Management Committees may assign limits on more granu-lar levels for entities, businesses, books, collections of books. The models used for measuring risk are reviewed and approved by the RPSC, where the frequency depends on the criticality of the model. Operational decisions on the use of the models (e.g. in terms of maximum tenor and allocation of tranches to the time bands in the replicating portfolios) is governed by the CARMC. For interest rate risk in the banking book, Risk Department is responsible for monitoring the limit usage and escalating potential limit breaches.
Risk measurementThe risks associated with the non-trading interest rate-sensitive portfolios are measured using a range of tools, including the fol-lowing key metrics:p Interest rate sensitivity (DV01): Expresses the linear approxi-
mation of the impact on a portfolio’s fair value resulting from a one basis point (0.01%) parallel shift in yield curves, where the approximation tends to be closer to the true change in the portfolio’s fair value for smaller parallel shifts in the yield curve. The DV01 is a transparent and intuitive indicator of linear directional interest rate risk exposure, which does not rely on statistical inference.
p Economic value scenario analysis: Expresses the impact of a pre-defined scenario (e.g. instantaneous changes in interest rates) on a portfolio’s fair value. This metric does not rely on statistical inference.
p Net interest income (NII) analysis: The NII risk measures are used to assess the change in the NII over a specified time horizon compared to the NII base line scenario. The NII risk measures can be based on either constant or dynamic balance sheet assumptions.
The first two measures listed above focus on the impact on an economic value basis, taking into account the present value of all future cash flows associated with the current positions. More spe-cifically, the metrics estimate the impact on the economic value of the current portfolio, ignoring dynamic aspects such as the time schedule of how changes in economic value materialize in accounting P&L (since most non-trading books are not marked-to-market) and the development of the portfolio over time. These two measures are complemented by considering an Earnings-at-Risk approach to interest rate risk: For the major part of the banking books, this is accomplished by simulating the develop-ment of the NII over several years using scenarios of potential changes of the yield curves and product volumes. This scenario analysis also takes into account the earnings impact originating
65Interest rate risk in the banking book
from fluctuations in short term interest rates, which are regarded as riskless when analyzing the impact on economic value.
Monitoring and reviewThe limits and flags defined by books, collections of books, busi-nesses or legal entities relating to interest rate risk in the banking book are monitored by Risk Department at least on a monthly basis (if deemed necessary or suitable, the monitoring may be as frequent as daily), by using the metrics and methodologies outlined above. In case of breaches, this is escalated to the limit-setting body. The Group assesses compliance with regulatory requirements regarding appropriate levels of non-trading interest rate risk by estimating the economic impact of adverse 200 basis point parallel shifts in yield curves and adverse interest rate shifts
and then relating those impacts to the total eligible regulatory capital. Consistent with regulatory requirements, Risk Division ensures that the economic value impact of this analysis is below the threshold of 20% of eligible regulatory capital in which case there are no requirements to hold additional capital. This analysis is performed for the Group and major legal entities, including the Bank, on a monthly basis.
Risk profile > Refer to “Banking book” (pages 172 to 173) in III – Treasury, Risk, Balance
sheet and Off-balance sheet – Risk management – Risk review and results in the Credit Suisse Annual Report 2018 for information on the impact of a one basis point parallel increase of the yield curves and an adverse 200 basis point move in yield curves on the fair value of interest rate-sensitive banking book positions.

66 Additional regulatory disclosures
Additional regulatory disclosures
Composition of capitalCredit Suisse is a systemically important financial institution.
> Refer to “Swiss capital requirements” (pages 4 to 5) for the systemically impor-tant financial institution view.
The following required tables provide details on the composition of Swiss regulatory capital including common equity tier 1 (CET1) capital, additional tier 1 capital and tier 2 capital as if the Group was not a systemically important financial institution.
CC1 – Composition of regulatory capital
end of
4Q18 Amounts Reference 1
Swiss CET1 capital (CHF million)
1 Directly issued qualifying common share (and equivalent for non-joint stock companies) capital plus related stock surplus 34,990 1
2 Retained earnings 26,943 2
3 Accumulated other comprehensive income (and other reserves) 2 (18,011) 3
6 CET1 capital before regulatory adjustments 43,922
8 Goodwill, net of tax (4,762) 4
9 Other intangible assets (excluding mortgage servicing rights), net of tax (47) 5
10 Deferred tax assets that rely on future profitability (excluding temporary differences), net of tax (1,647) 6
11 Cash flow hedge reserve 64
12 Shortfall of provisions to expected losses (461)
14 Gains/(losses) due to changes in own credit on fair-valued liabilities 804
15 Defined-benefit pension assets (1,374) 7
16 Investments in own shares (32)
21 Deferred tax assets arising from temporary differences (amount above 10% threshold, net of tax) 0 8
26b National specific regulatory adjustments (748)
28 Total regulatory adjustments to CET1 capital (8,203)
29 CET1 capital 35,719
30 Directly issued qualifying additional tier 1 instruments plus related stock surplus 3 10,237
32 of which classified as liabilities under applicable accounting standards 10,237 9
36 Additional tier 1 capital before regulatory adjustments 10,237
37 Investments in own additional tier 1 instruments (21)
43 Total regulatory adjustments to additional tier 1 capital (21)
44 Additional tier 1 capital 10,216
Swiss tier 1 capital (CHF million)
45 Tier 1 capital 45,935
Swiss tier 2 capital (CHF million)
46 Directly issued qualifying tier 2 instruments plus related stock surplus 4 3,512 10
47 Directly issued capital instruments subject to phase-out from tier 2 capital 691 11
51 Tier 2 capital before regulatory adjustments 4,203
52 Investments in own tier 2 instruments and other TLAC liabilities (4)
57 Total regulatory adjustments to tier 2 capital (4)
58 Tier 2 capital 4,199
Swiss eligible capital (CHF million)
59 Total eligible capital 50,134
1 Refer to the balance sheet under regulatory scope of consolidation in the table “CC2 – Reconciliation of regulatory capital to balance sheet”. Only material items are referenced to the balance sheet.
2 Includes treasury shares.3 Consists of high-trigger and low-trigger capital instruments. Of this amount, CHF 5.6 billion consists of capital instruments with a capital ratio write-down trigger of 7% and CHF 4.6 bil-
lion consists of capital instruments with a capital ratio write-down trigger of 5.125%.4 Consists of low-trigger capital instruments with a capital ratio write-down trigger of 5%.

67Additional regulatory disclosures
CC1 – Composition of regulatory capital (continued)
end of
4Q18 Amounts Reference 1
Swiss risk-weighted assets (CHF million)
60 Risk-weighted assets 285,193
Swiss risk-based capital ratios as a percentage of risk-weighted assets (%)
61 CET1 capital ratio 12.5
62 Tier 1 capital ratio 16.1
63 Total capital ratio 17.6
BIS CET1 buffer requirements (%) 2
64 Total BIS CET buffer requirement 3.09
65 of which capital conservation buffer 3 1.875
66 of which extended countercyclical buffer 0.09
67 of which progressive buffer for G-SIB and/or D-SIB 3 1.125
68 CET1 capital available after meeting the bank’s minimum capital requirements 4 8.0
Amounts below the thresholds for deduction (before risk weighting) (CHF million)
72 Non-significant investments in the capital and other TLAC liabilities of other financial entities 2,498
73 Significant investments in the common stock of financial entities 816
74 Mortgage servicing rights, net of tax 135
75 Deferred tax assets arising from temporary differences, net of tax 3,492
Applicable caps on the inclusion of provisions in tier 2 (CHF million)
77 Cap on inclusion of provisions in tier 2 under standardized approach 92
79 Cap for inclusion of provisions in tier 2 under internal ratings-based approach 894
Capital instruments subject to phase-out arrangements (CHF million)
84 Current cap on tier 2 instruments subject to phase-out arrangements 691
1 Refer to the balance sheet under regulatory scope of consolidation in the table “CC2 – Reconciliation of regulatory capital to balance sheet”. Only material items are referenced to the balance sheet.
2 CET1 buffer requirements are based on BIS requirements as a percentage of Swiss risk-weighted assets.3 Reflects the phase-in requirement.4 Reflects the CET1 capital ratio of 12.5%, less the BIS minimum CET1 ratio requirement of 4.5%.
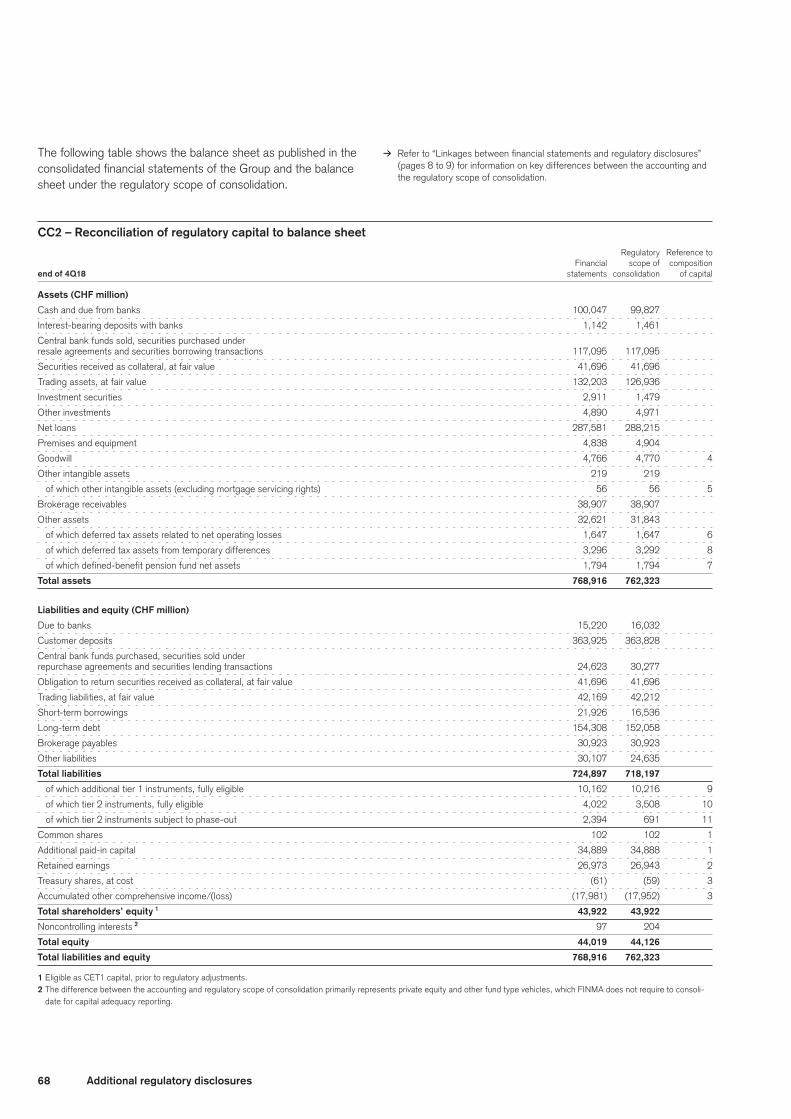
68 Additional regulatory disclosures
The following table shows the balance sheet as published in the consolidated financial statements of the Group and the balance sheet under the regulatory scope of consolidation.
> Refer to “Linkages between financial statements and regulatory disclosures” (pages 8 to 9) for information on key differences between the accounting and the regulatory scope of consolidation.
CC2 – Reconciliation of regulatory capital to balance sheet Regulatory Reference to
Financial scope of composition
end of 4Q18 statements consolidation of capital
Assets (CHF million)
Cash and due from banks 100,047 99,827
Interest-bearing deposits with banks 1,142 1,461
Central bank funds sold, securities purchased under
resale agreements and securities borrowing transactions 117,095 117,095
Securities received as collateral, at fair value 41,696 41,696
Trading assets, at fair value 132,203 126,936
Investment securities 2,911 1,479
Other investments 4,890 4,971
Net loans 287,581 288,215
Premises and equipment 4,838 4,904
Goodwill 4,766 4,770 4
Other intangible assets 219 219
of which other intangible assets (excluding mortgage servicing rights) 56 56 5
Brokerage receivables 38,907 38,907
Other assets 32,621 31,843
of which deferred tax assets related to net operating losses 1,647 1,647 6
of which deferred tax assets from temporary differences 3,296 3,292 8
of which defined-benefit pension fund net assets 1,794 1,794 7
Total assets 768,916 762,323
Liabilities and equity (CHF million)
Due to banks 15,220 16,032
Customer deposits 363,925 363,828
Central bank funds purchased, securities sold under
repurchase agreements and securities lending transactions 24,623 30,277
Obligation to return securities received as collateral, at fair value 41,696 41,696
Trading liabilities, at fair value 42,169 42,212
Short-term borrowings 21,926 16,536
Long-term debt 154,308 152,058
Brokerage payables 30,923 30,923
Other liabilities 30,107 24,635
Total liabilities 724,897 718,197
of which additional tier 1 instruments, fully eligible 10,162 10,216 9
of which tier 2 instruments, fully eligible 4,022 3,508 10
of which tier 2 instruments subject to phase-out 2,394 691 11
Common shares 102 102 1
Additional paid-in capital 34,889 34,888 1
Retained earnings 26,973 26,943 2
Treasury shares, at cost (61) (59) 3
Accumulated other comprehensive income/(loss) (17,981) (17,952) 3
Total shareholders’ equity 1 43,922 43,922
Noncontrolling interests 2 97 204
Total equity 44,019 44,126
Total liabilities and equity 768,916 762,323
1 Eligible as CET1 capital, prior to regulatory adjustments.2 The difference between the accounting and regulatory scope of consolidation primarily represents private equity and other fund type vehicles, which FINMA does not require to consoli-
date for capital adequacy reporting.
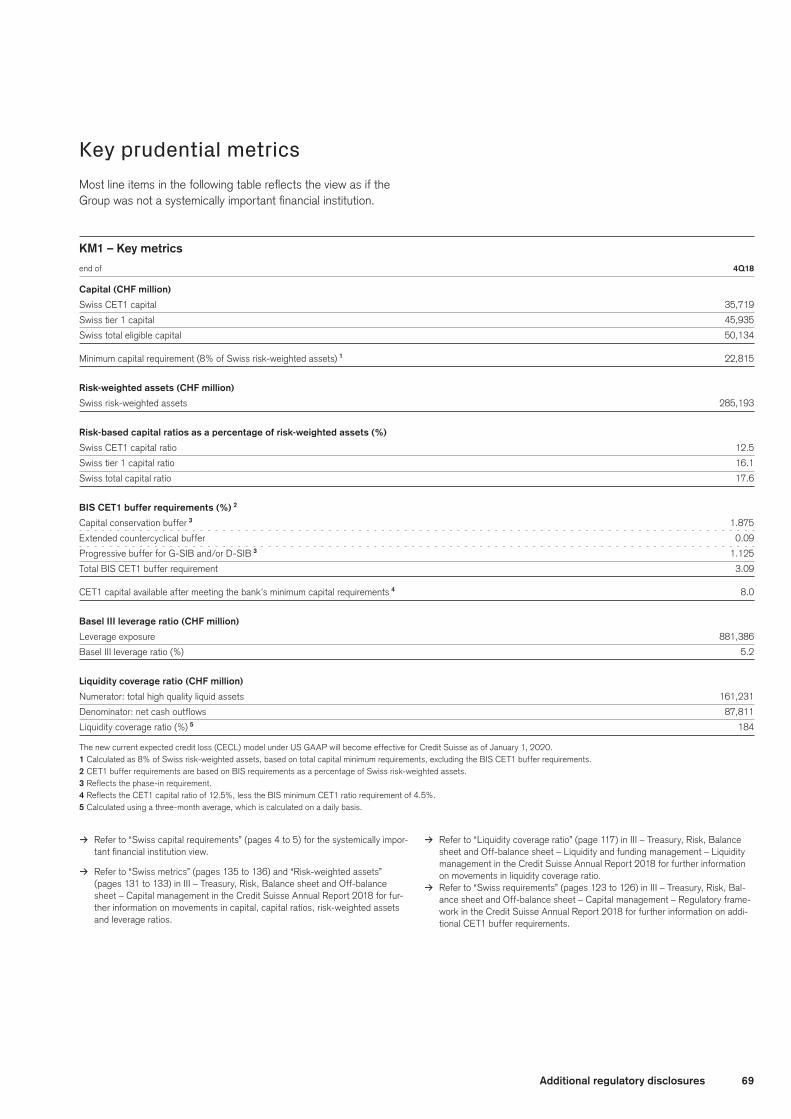
69Additional regulatory disclosures
Key prudential metricsMost line items in the following table reflects the view as if the Group was not a systemically important financial institution.
KM1 – Key metrics
end of 4Q18
Capital (CHF million)
Swiss CET1 capital 35,719
Swiss tier 1 capital 45,935
Swiss total eligible capital 50,134
Minimum capital requirement (8% of Swiss risk-weighted assets) 1 22,815
Risk-weighted assets (CHF million)
Swiss risk-weighted assets 285,193
Risk-based capital ratios as a percentage of risk-weighted assets (%)
Swiss CET1 capital ratio 12.5
Swiss tier 1 capital ratio 16.1
Swiss total capital ratio 17.6
BIS CET1 buffer requirements (%) 2
Capital conservation buffer 3 1.875
Extended countercyclical buffer 0.09
Progressive buffer for G-SIB and/or D-SIB 3 1.125
Total BIS CET1 buffer requirement 3.09
CET1 capital available after meeting the bank’s minimum capital requirements 4 8.0
Basel III leverage ratio (CHF million)
Leverage exposure 881,386
Basel III leverage ratio (%) 5.2
Liquidity coverage ratio (CHF million)
Numerator: total high quality liquid assets 161,231
Denominator: net cash outflows 87,811
Liquidity coverage ratio (%) 5 184
The new current expected credit loss (CECL) model under US GAAP will become effective for Credit Suisse as of January 1, 2020.1 Calculated as 8% of Swiss risk-weighted assets, based on total capital minimum requirements, excluding the BIS CET1 buffer requirements.2 CET1 buffer requirements are based on BIS requirements as a percentage of Swiss risk-weighted assets.3 Reflects the phase-in requirement.4 Reflects the CET1 capital ratio of 12.5%, less the BIS minimum CET1 ratio requirement of 4.5%.5 Calculated using a three-month average, which is calculated on a daily basis.
> Refer to “Swiss capital requirements” (pages 4 to 5) for the systemically impor-tant financial institution view.
> Refer to “Swiss metrics” (pages 135 to 136) and “Risk-weighted assets” (pages 131 to 133) in III – Treasury, Risk, Balance sheet and Off-balance sheet – Capital management in the Credit Suisse Annual Report 2018 for fur-ther information on movements in capital, capital ratios, risk-weighted assets and leverage ratios.
> Refer to “Liquidity coverage ratio” (page 117) in III – Treasury, Risk, Balance sheet and Off-balance sheet – Liquidity and funding management – Liquidity management in the Credit Suisse Annual Report 2018 for further information on movements in liquidity coverage ratio.
> Refer to “Swiss requirements” (pages 123 to 126) in III – Treasury, Risk, Bal-ance sheet and Off-balance sheet – Capital management – Regulatory frame-work in the Credit Suisse Annual Report 2018 for further information on addi-tional CET1 buffer requirements.
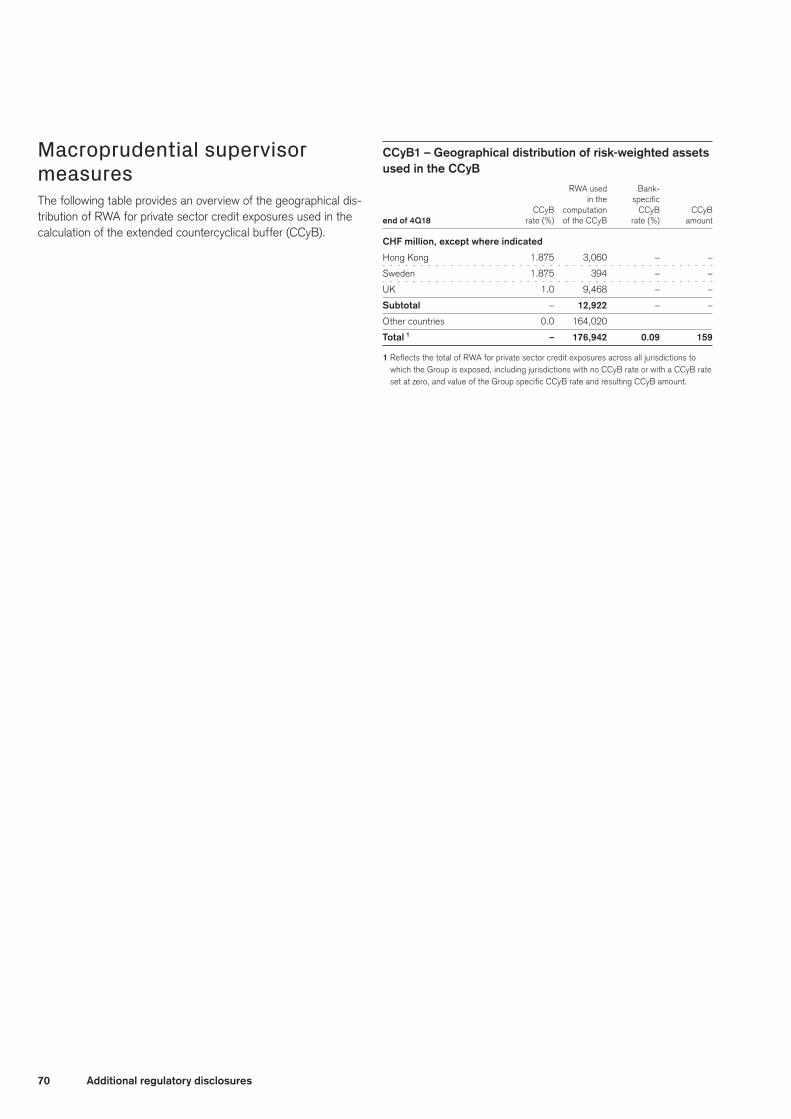
70 Additional regulatory disclosures
Macroprudential supervisor measuresThe following table provides an overview of the geographical dis-tribution of RWA for private sector credit exposures used in the calculation of the extended countercyclical buffer (CCyB).
CCyB1 – Geographical distribution of risk-weighted assets used in the CCyB RWA used Bank-
in the specific
CCyB computation CCyB CCyB
end of 4Q18 rate (%) of the CCyB rate (%) amount
CHF million, except where indicated
Hong Kong 1.875 3,060 – –
Sweden 1.875 394 – –
UK 1.0 9,468 – –
Subtotal – 12,922 – –
Other countries 0.0 164,020
Total 1 – 176,942 0.09 159
1 Reflects the total of RWA for private sector credit exposures across all jurisdictions to which the Group is exposed, including jurisdictions with no CCyB rate or with a CCyB rate set at zero, and value of the Group specific CCyB rate and resulting CCyB amount.

71Additional regulatory disclosures
Leverage metricsBeginning in 1Q15, Credit Suisse adopted the BIS leverage ratio framework, as issued by the BCBS and implemented in Switzer-land by FINMA.
> Refer to “Leverage metrics” (page 134) and “Swiss metrics” (pages 135 to 136) in III – Treasury, Risk, Balance sheet and Off-balance sheet – Capital management in the Credit Suisse Annual Report 2018 for further information on leverage metrics, including the calculation methodology and movements in leverage exposures.
LR1 – Summary comparison of accounting assets vs leverage ratio exposure
end of 4Q18
Reconciliation of consolidated assets to leverage exposure (CHF million)
Total consolidated assets as per published financial statements 768,916
Adjustment for investments in banking, financial, insurance or commercial entities that are consolidated for accounting purposes
but outside the scope of regulatory consolidation 1 (12,655)
Adjustments for derivatives financial instruments 73,110
Adjustments for SFTs (i.e. repos and similar secured lending) (32,278)
Adjustments for off-balance sheet items (i.e. conversion to credit equivalent amounts of off-balance sheet exposures) 84,293
Total leverage exposure 881,386
1 Includes adjustments for investments in banking, financial, insurance or commercial entities that are consolidated for accounting purposes but outside the scope of regulatory consolida-tion and tier 1 capital deductions related to balance sheet assets.
LR2 – Leverage ratio common disclosure template
end of 4Q18
Reconciliation of consolidated assets to leverage exposure (CHF million)
On-balance sheet items (excluding derivatives and SFTs, but including collateral) 569,381
Asset amounts deducted from Basel III tier 1 capital (8,491)
Total on-balance sheet exposures 560,890
Reconciliation of consolidated assets to leverage exposure (CHF million)
Replacement cost associated with all derivatives transactions (i.e. net of eligible cash variation margin) 22,841
Add-on amounts for PFE associated with all derivatives transactions 71,473
Gross-up for derivatives collateral provided where deducted from the balance sheet assets pursuant to the operative accounting framework 20,288
Deductions of receivables assets for cash variation margin provided in derivatives transactions (18,982)
Exempted CCP leg of client-cleared trade exposures (11,553)
Adjusted effective notional amount of all written credit derivatives 186,012
Adjusted effective notional offsets and add-on deductions for written credit derivatives (178,623)
Derivative Exposures 91,456
Securities financing transaction exposures (CHF million)
Gross SFT assets (with no recognition of netting), after adjusting for sale accounting transactions 158,451
Netted amounts of cash payables and cash receivables of gross SFT assets (23,122)
Counterparty credit risk exposure for SFT assets 10,165
Agent transaction exposures (747)
Securities financing transaction exposures 144,747
Other off-balance sheet exposures (CHF million)
Off-balance sheet exposure at gross notional amount 257,755
Adjustments for conversion to credit equivalent amounts (173,462)
Other off-balance sheet exposures 84,293
Swiss tier 1 capital (CHF million)
Swiss tier 1 capital 45,935
Leverage exposure (CHF million)
Total leverage exposure 881,386
Leverage ratio (%)
Basel III leverage ratio 5.2
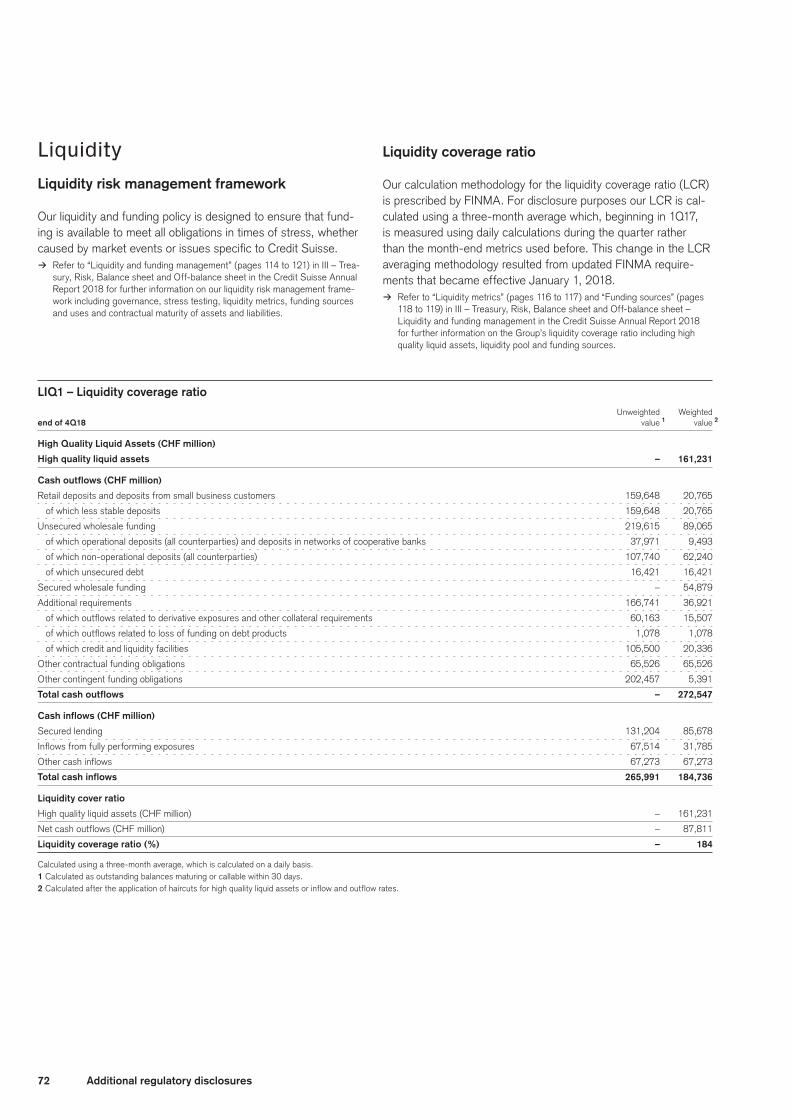
72 Additional regulatory disclosures
LiquidityLiquidity risk management framework
Our liquidity and funding policy is designed to ensure that fund-ing is available to meet all obligations in times of stress, whether caused by market events or issues specific to Credit Suisse.
> Refer to “Liquidity and funding management” (pages 114 to 121) in III – Trea-sury, Risk, Balance sheet and Off-balance sheet in the Credit Suisse Annual Report 2018 for further information on our liquidity risk management frame-work including governance, stress testing, liquidity metrics, funding sources and uses and contractual maturity of assets and liabilities.
Liquidity coverage ratio
Our calculation methodology for the liquidity coverage ratio (LCR) is prescribed by FINMA. For disclosure purposes our LCR is cal-culated using a three-month average which, beginning in 1Q17, is measured using daily calculations during the quarter rather than the month-end metrics used before. This change in the LCR averaging methodology resulted from updated FINMA require-ments that became effective January 1, 2018.
> Refer to “Liquidity metrics” (pages 116 to 117) and “Funding sources” (pages 118 to 119) in III – Treasury, Risk, Balance sheet and Off-balance sheet – Liquidity and funding management in the Credit Suisse Annual Report 2018 for further information on the Group’s liquidity coverage ratio including high quality liquid assets, liquidity pool and funding sources.
LIQ1 – Liquidity coverage ratio Unweighted Weighted
end of 4Q18 value 1 value 2
High Quality Liquid Assets (CHF million)
High quality liquid assets – 161,231
Cash outflows (CHF million)
Retail deposits and deposits from small business customers 159,648 20,765
of which less stable deposits 159,648 20,765
Unsecured wholesale funding 219,615 89,065
of which operational deposits (all counterparties) and deposits in networks of cooperative banks 37,971 9,493
of which non-operational deposits (all counterparties) 107,740 62,240
of which unsecured debt 16,421 16,421
Secured wholesale funding – 54,879
Additional requirements 166,741 36,921
of which outflows related to derivative exposures and other collateral requirements 60,163 15,507
of which outflows related to loss of funding on debt products 1,078 1,078
of which credit and liquidity facilities 105,500 20,336
Other contractual funding obligations 65,526 65,526
Other contingent funding obligations 202,457 5,391
Total cash outflows – 272,547
Cash inflows (CHF million)
Secured lending 131,204 85,678
Inflows from fully performing exposures 67,514 31,785
Other cash inflows 67,273 67,273
Total cash inflows 265,991 184,736
Liquidity cover ratio
High quality liquid assets (CHF million) – 161,231
Net cash outflows (CHF million) – 87,811
Liquidity coverage ratio (%) – 184
Calculated using a three-month average, which is calculated on a daily basis.1 Calculated as outstanding balances maturing or callable within 30 days.2 Calculated after the application of haircuts for high quality liquid assets or inflow and outflow rates.
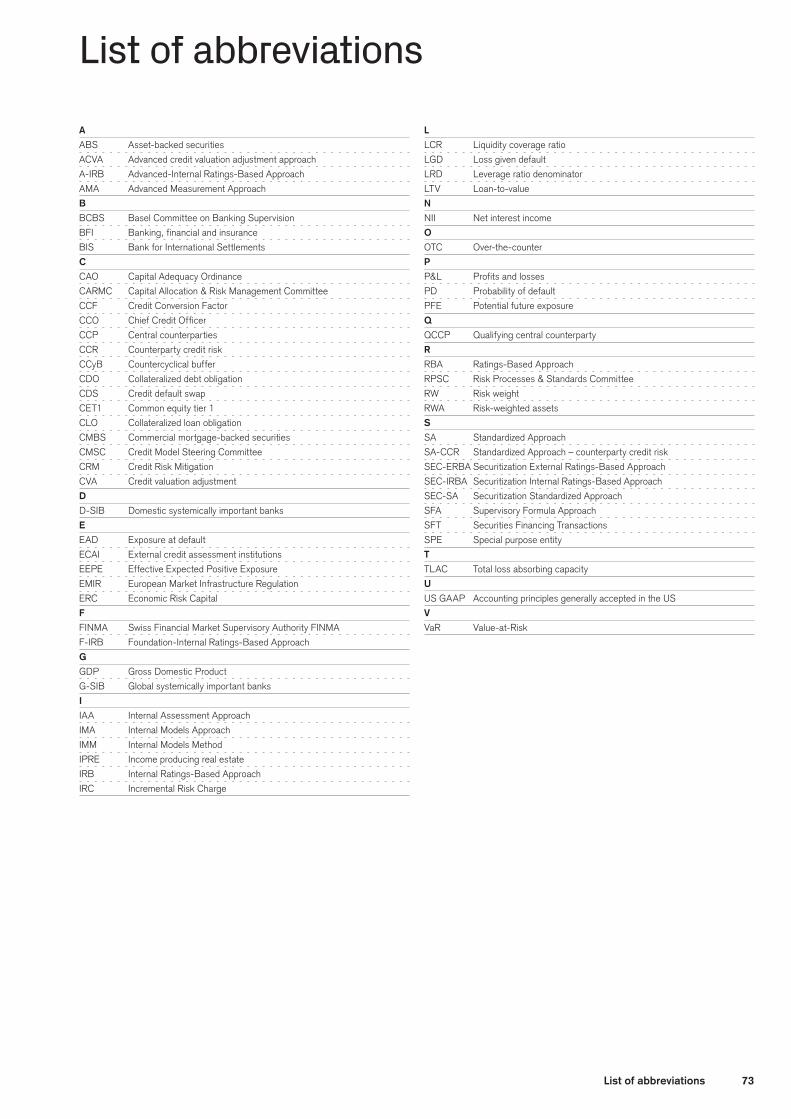
73List of abbreviations
List of abbreviations
A
ABS Asset-backed securities
ACVA Advanced credit valuation adjustment approach
A-IRB Advanced-Internal Ratings-Based Approach
AMA Advanced Measurement Approach
B
BCBS Basel Committee on Banking Supervision
BFI Banking, financial and insurance
BIS Bank for International Settlements
C
CAO Capital Adequacy Ordinance
CARMC Capital Allocation & Risk Management Committee
CCF Credit Conversion Factor
CCO Chief Credit Officer
CCP Central counterparties
CCR Counterparty credit risk
CCyB Countercyclical buffer
CDO Collateralized debt obligation
CDS Credit default swap
CET1 Common equity tier 1
CLO Collateralized loan obligation
CMBS Commercial mortgage-backed securities
CMSC Credit Model Steering Committee
CRM Credit Risk Mitigation
CVA Credit valuation adjustment
D
D-SIB Domestic systemically important banks
E
EAD Exposure at default
ECAI External credit assessment institutions
EEPE Effective Expected Positive Exposure
EMIR European Market Infrastructure Regulation
ERC Economic Risk Capital
F
FINMA Swiss Financial Market Supervisory Authority FINMA
F-IRB Foundation-Internal Ratings-Based Approach
G
GDP Gross Domestic Product
G-SIB Global systemically important banks
I
IAA Internal Assessment Approach
IMA Internal Models Approach
IMM Internal Models Method
IPRE Income producing real estate
IRB Internal Ratings-Based Approach
IRC Incremental Risk Charge
L
LCR Liquidity coverage ratio
LGD Loss given default
LRD Leverage ratio denominator
LTV Loan-to-value
N
NII Net interest income
O
OTC Over-the-counter
P
P&L Profits and losses
PD Probability of default
PFE Potential future exposure
Q
QCCP Qualifying central counterparty
R
RBA Ratings-Based Approach
RPSC Risk Processes & Standards Committee
RW Risk weight
RWA Risk-weighted assets
S
SA Standardized Approach
SA-CCR Standardized Approach – counterparty credit risk
SEC-ERBA Securitization External Ratings-Based Approach
SEC-IRBA Securitization Internal Ratings-Based Approach
SEC-SA Securitization Standardized Approach
SFA Supervisory Formula Approach
SFT Securities Financing Transactions
SPE Special purpose entity
T
TLAC Total loss absorbing capacity
U
US GAAP Accounting principles generally accepted in the US
V
VaR Value-at-Risk
74
Cautionary statement regarding forward-looking information
This document contains statements that constitute forward-looking state-
ments. In addition, in the future we, and others on our behalf, may make
statements that constitute forward-looking statements. Such forward-look-
ing statements may include, without limitation, statements relating to the
following:
p our plans, targets or goals;
p our future economic performance or prospects;
p the potential effect on our future performance of certain contingencies;
and
p assumptions underlying any such statements.
Words such as “believes,” “anticipates,” “expects,” “intends” and “plans”
and similar expressions are intended to identify forward-looking statements
but are not the exclusive means of identifying such statements. We do not
intend to update these forward-looking statements.
By their very nature, forward-looking statements involve inherent risks and
uncertainties, both general and specific, and risks exist that predictions,
forecasts, projections and other outcomes described or implied in forward-
looking statements will not be achieved. We caution you that a number of
important factors could cause results to differ materially from the plans,
targets, goals, expectations, estimates and intentions expressed in such
forward-looking statements. These factors include:
p the ability to maintain sufficient liquidity and access capital markets;
p market volatility and interest rate fluctuations and developments affect-
ing interest rate levels;
p the strength of the global economy in general and the strength of the
economies of the countries in which we conduct our operations, in par-
ticular the risk of continued slow economic recovery or downturn in the
EU, the US or other developed countries or in emerging markets in 2019
and beyond;
p the direct and indirect impacts of deterioration or slow recovery in resi-
dential and commercial real estate markets;
p adverse rating actions by credit rating agencies in respect of us, sover-
eign issuers, structured credit products or other credit-related exposures;
p the ability to achieve our strategic goals, including those related to our
targets and financial goals;
p the ability of counterparties to meet their obligations to us;
p the effects of, and changes in, fiscal, monetary, exchange rate, trade
and tax policies, as well as currency fluctuations;
p political and social developments, including war, civil unrest or terrorist
activity;
p the possibility of foreign exchange controls, expropriation, national-
ization or confiscation of assets in countries in which we conduct our
operations;
p operational factors such as systems failure, human error, or the failure to
implement procedures properly;
p the risk of cyber attacks, information or security breaches or technology
failures on our business or operations;
p the adverse resolution of litigation, regulatory proceedings and other
contingencies;
p actions taken by regulators with respect to our business and practices
and possible resulting changes to our business organization, practices
and policies in countries in which we conduct our operations;
p the effects of changes in laws, regulations or accounting or tax stan-
dards, policies or practices in countries in which we conduct our
operations;
p the potential effects of changes in our legal entity structure;
p competition or changes in our competitive position in geographic and
business areas in which we conduct our operations;
p the ability to retain and recruit qualified personnel;
p the ability to maintain our reputation and promote our brand;
p the ability to increase market share and control expenses;
p technological changes;
p the timely development and acceptance of our new products and ser-
vices and the perceived overall value of these products and services by
users;
p acquisitions, including the ability to integrate acquired businesses suc-
cessfully, and divestitures, including the ability to sell non-core assets;
and
p other unforeseen or unexpected events and our success at managing
these and the risks involved in the foregoing.
We caution you that the foregoing list of important factors is not exclusive.
When evaluating forward-looking statements, you should carefully consider
the foregoing factors and other uncertainties and events, including the
information set forth in “Risk factors” in I – Information on the company in
our Annual Report 2018.


CREDIT SUISSE GROUPParadeplatz 88070 ZurichSwitzerlandcredit-suisse.com