pif: precursor ion fingerprinting
TRANSCRIPT
ApplicationNote: 441
Key Words
• ActivePharmaceuticalIngredient
• DMPK
• Mass Frontier™
Software
• MetaboliteIdentification
• Precursor IonFingerprinting
PIF: Precursor Ion Fingerprinting – Searchingfor a Structurally Diagnostic Fragment UsingCombined Targeted and Data Dependent MSn
Julie A. Horner, Rohan A. Thakur, Thermo Fisher Scientific, San Jose, CA, USARobert Mistrik, Highchem, Ltd., Bratislava, Slovakia
Overview
PurposeDemonstrate the validity of the PIF methodology for anAPI, maropitant, and its metabolites.
MethodsLC with semi-targeted and data dependent MSn and in silico fragmentation.
ResultsTagged greater than ten and elucidated two metabolitestructures using PIF information for the API and metabolites.
Introduction
There is an increasing desire to reduce development timeand cost devoted to ill-fated lead candidates and therefore agrowing need for complete characterization of each com-pound earlier in the discovery process. Discovery DMPKexperiments are becoming routine resulting in a need formore rapid and automated methods of verification that aputative metabolite is related to the parent drug. Here wepresent a simplified Precursor Identifying Fragment (PIF)technique which readily lends itself to routine automationand that offers the advantage of metabolite identificationwith no a priori knowledge of the active pharmaceuticalingredient (API) or any biotransformation products.
Microsomal Incubation
Maropitant sample is prepared at 1 mg/mL in 50/50MeOH/H2O. Incubation is carried out for 60 min at 37 °Cusing BD Gentest™ Sprague Dawley rat microsomes 452521.
PIF Methodology1. Construct spectral trees by Intelligent acquisition of PIF
Data for Control/t=0 and in vitro incubations usingpreset ion trap methods.
2. Use Mass Frontier for Component Identification
3. Compare Control and Sample component spectral trees toDetermine a Precursor Identifying Fragment for the API.
4. Construct the XIC at all levels of MSn of the PrecursorIdentifying Fragment to map probable metabolites.
5. Use Difference Spectra to determine the likely metabolictransformation(s).
6. Use Mass Frontier to Determine the Metabolite Structurefrom the set of possible metabolites.
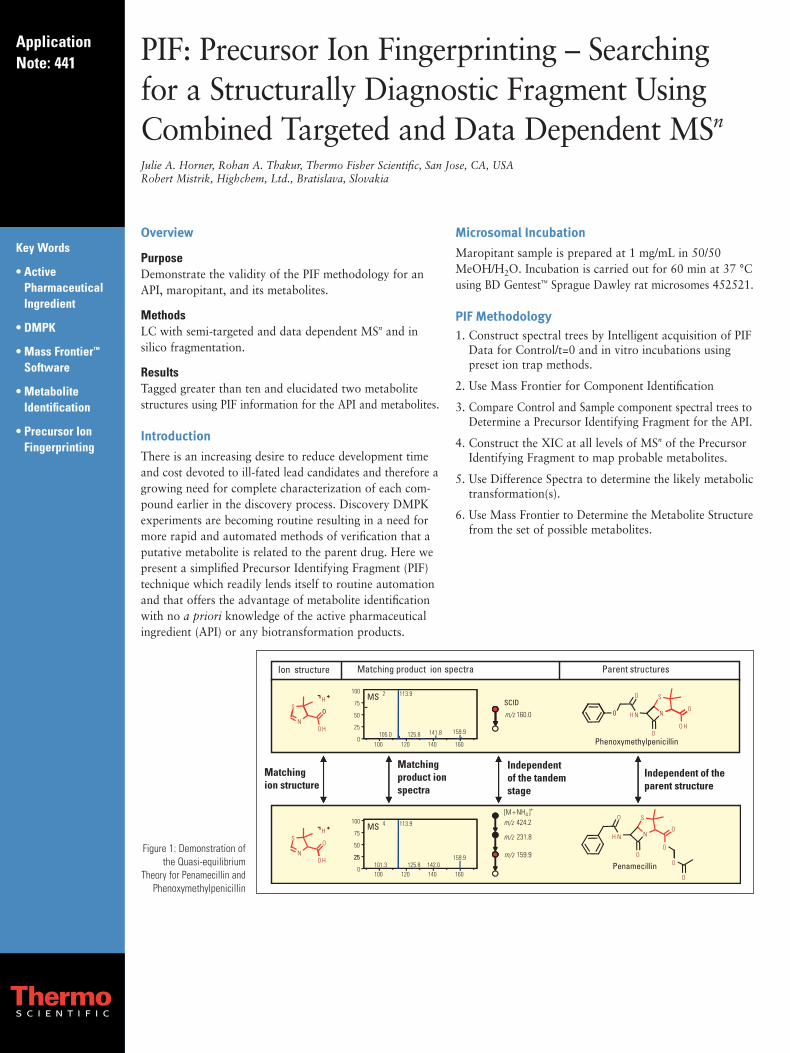
Figure 1: Demonstration ofthe Quasi-equilibrium
Theory for Penamecillin andPhenoxymethylpenicillin
Results
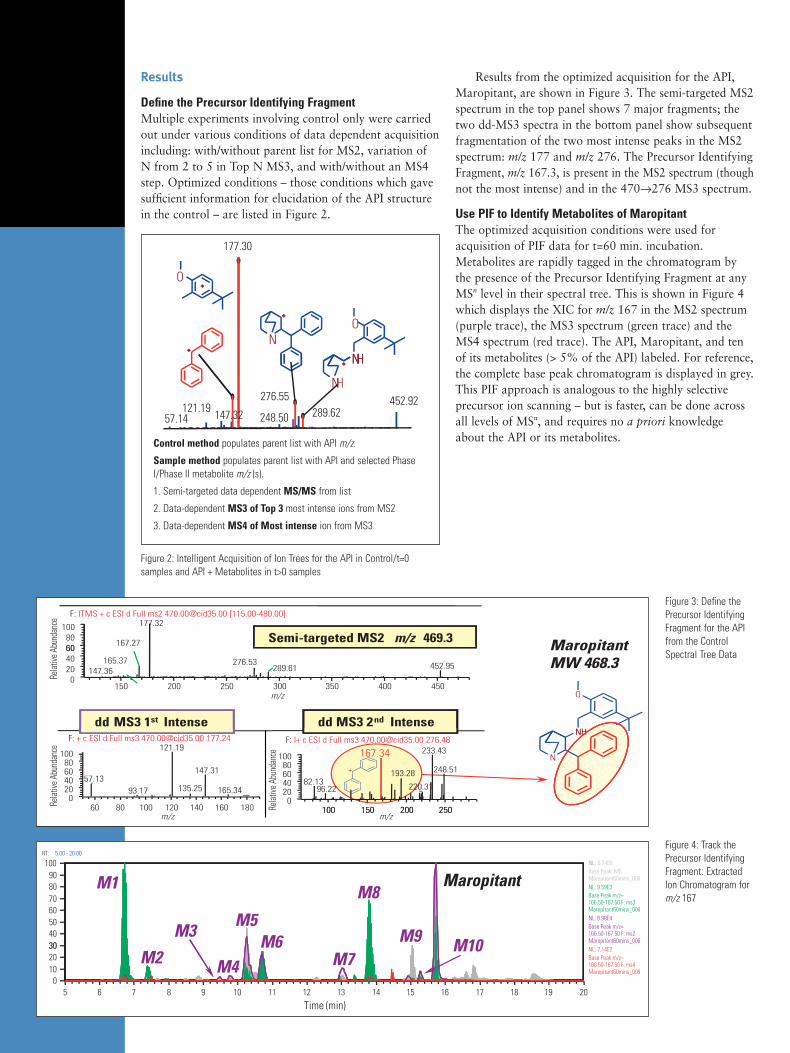
Define the Precursor Identifying FragmentMultiple experiments involving control only were carriedout under various conditions of data dependent acquisitionincluding: with/without parent list for MS2, variation ofN from 2 to 5 in Top N MS3, and with/without an MS4step. Optimized conditions – those conditions which gavesufficient information for elucidation of the API structurein the control – are listed in Figure 2.
Results from the optimized acquisition for the API,Maropitant, are shown in Figure 3. The semi-targeted MS2spectrum in the top panel shows 7 major fragments; thetwo dd-MS3 spectra in the bottom panel show subsequentfragmentation of the two most intense peaks in the MS2spectrum: m/z 177 and m/z 276. The Precursor IdentifyingFragment, m/z 167.3, is present in the MS2 spectrum (thoughnot the most intense) and in the 470→276 MS3 spectrum.
Use PIF to Identify Metabolites of MaropitantThe optimized acquisition conditions were used for acquisition of PIF data for t=60 min. incubation.Metabolites are rapidly tagged in the chromatogram bythe presence of the Precursor Identifying Fragment at anyMSn level in their spectral tree. This is shown in Figure 4which displays the XIC for m/z 167 in the MS2 spectrum(purple trace), the MS3 spectrum (green trace) and theMS4 spectrum (red trace). The API, Maropitant, and tenof its metabolites (> 5% of the API) labeled. For reference,the complete base peak chromatogram is displayed in grey.This PIF approach is analogous to the highly selective precursor ion scanning – but is faster, can be done acrossall levels of MSn, and requires no a priori knowledgeabout the API or its metabolites.
Figure 3: Define thePrecursor IdentifyingFragment for the APIfrom the ControlSpectral Tree Data
Figure 4: Track thePrecursor IdentifyingFragment: ExtractedIon Chromatogram form/z 167
Figure 2: Intelligent Acquisition of Ion Trees for the API in Control/t=0 samples and API + Metabolites in t>0 samples
Control method populates parent list with API m/z.
Sample method populates parent list with API and selected PhaseI/Phase II metabolite m/z (s).
1. Semi-targeted data dependent MS/MS from list
2. Data-dependent MS3 of Top 3 most intense ions from MS2
3. Data-dependent MS4 of Most intense ion from MS3
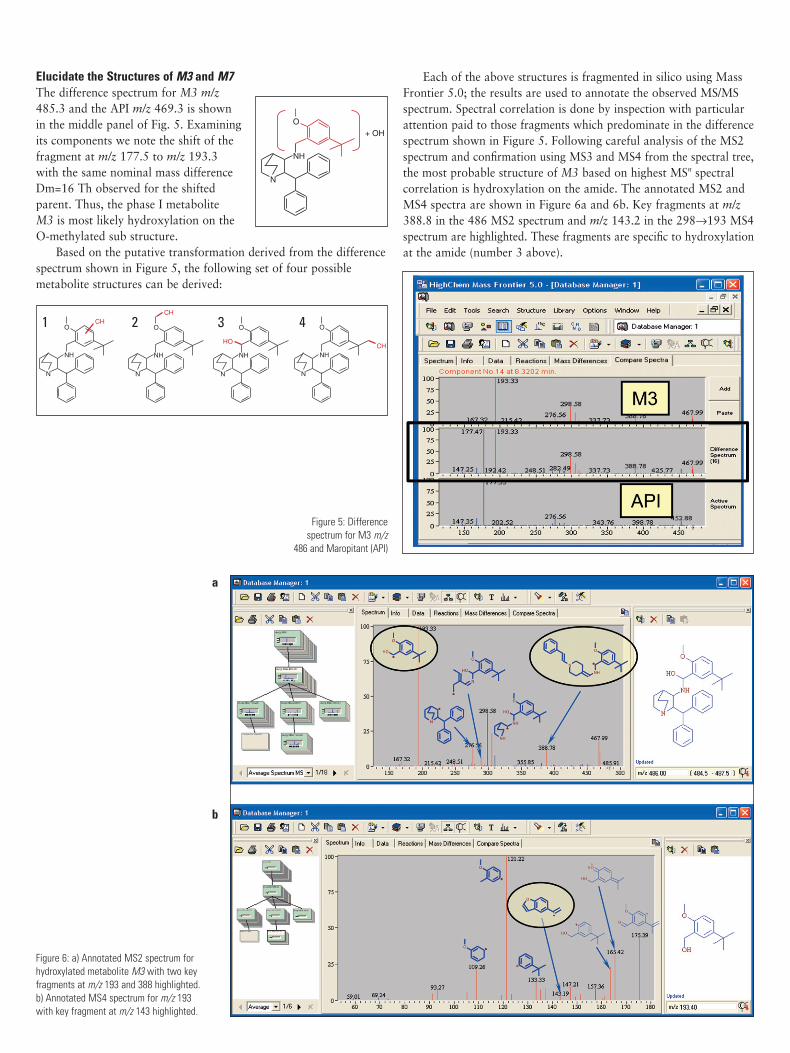
Elucidate the Structures of M3 and M7The difference spectrum for M3 m/z485.3 and the API m/z 469.3 is shown in the middle panel of Fig. 5. Examiningits components we note the shift of thefragment at m/z 177.5 to m/z 193.3 with the same nominal mass differenceDm=16 Th observed for the shifted parent. Thus, the phase I metabolite M3 is most likely hydroxylation on theO-methylated sub structure.
Based on the putative transformation derived from the differencespectrum shown in Figure 5, the following set of four possiblemetabolite structures can be derived:
Each of the above structures is fragmented in silico using MassFrontier 5.0; the results are used to annotate the observed MS/MSspectrum. Spectral correlation is done by inspection with particularattention paid to those fragments which predominate in the differencespectrum shown in Figure 5. Following careful analysis of the MS2spectrum and confirmation using MS3 and MS4 from the spectral tree,the most probable structure of M3 based on highest MSn spectralcorrelation is hydroxylation on the amide. The annotated MS2 andMS4 spectra are shown in Figure 6a and 6b. Key fragments at m/z388.8 in the 486 MS2 spectrum and m/z 143.2 in the 298→193 MS4spectrum are highlighted. These fragments are specific to hydroxylationat the amide (number 3 above).
Figure 5: Differencespectrum for M3 m/z
486 and Maropitant (API)
Figure 6: a) Annotated MS2 spectrum forhydroxylated metabolite M3 with two keyfragments at m/z 193 and 388 highlighted.b) Annotated MS4 spectrum for m/z 193with key fragment at m/z 143 highlighted.
a
b
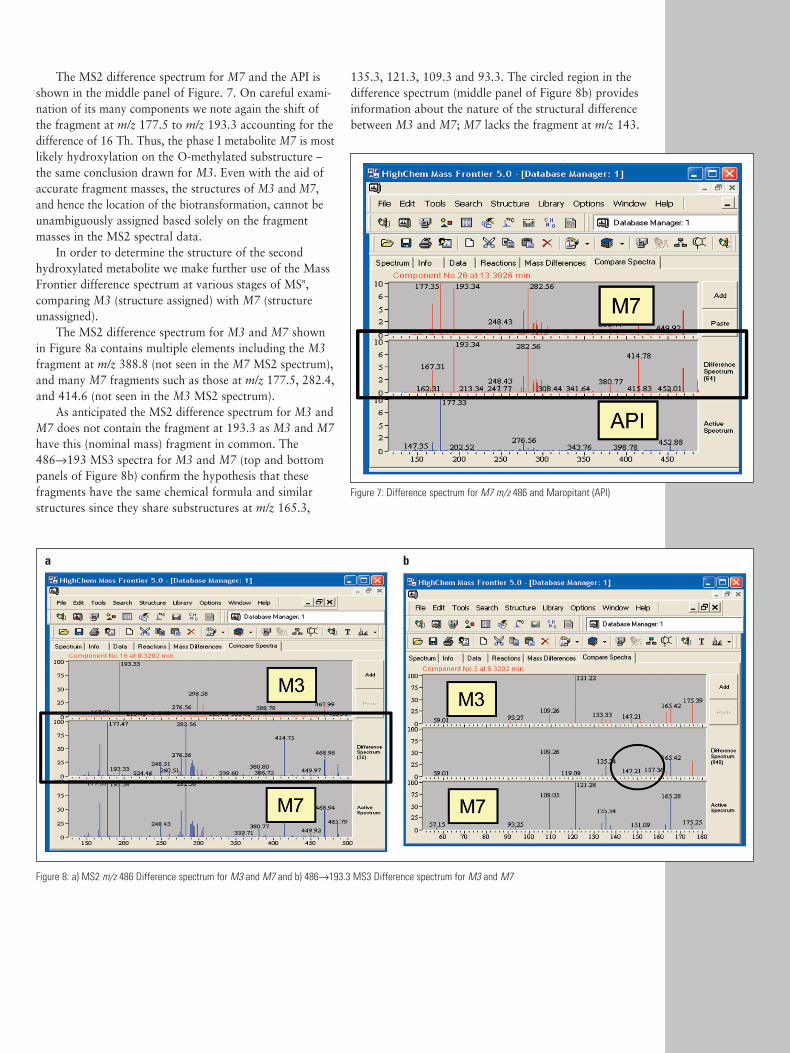
The MS2 difference spectrum for M7 and the API isshown in the middle panel of Figure. 7. On careful exami-nation of its many components we note again the shift ofthe fragment at m/z 177.5 to m/z 193.3 accounting for thedifference of 16 Th. Thus, the phase I metabolite M7 is mostlikely hydroxylation on the O-methylated substructure –the same conclusion drawn for M3. Even with the aid ofaccurate fragment masses, the structures of M3 and M7,and hence the location of the biotransformation, cannot beunambiguously assigned based solely on the fragmentmasses in the MS2 spectral data.
In order to determine the structure of the secondhydroxylated metabolite we make further use of the MassFrontier difference spectrum at various stages of MSn,comparing M3 (structure assigned) with M7 (structureunassigned).
The MS2 difference spectrum for M3 and M7 shownin Figure 8a contains multiple elements including the M3fragment at m/z 388.8 (not seen in the M7 MS2 spectrum),and many M7 fragments such as those at m/z 177.5, 282.4,and 414.6 (not seen in the M3 MS2 spectrum).
As anticipated the MS2 difference spectrum for M3 andM7 does not contain the fragment at 193.3 as M3 and M7have this (nominal mass) fragment in common. The486→193 MS3 spectra for M3 and M7 (top and bottompanels of Figure 8b) confirm the hypothesis that thesefragments have the same chemical formula and similarstructures since they share substructures at m/z 165.3,
135.3, 121.3, 109.3 and 93.3. The circled region in thedifference spectrum (middle panel of Figure 8b) providesinformation about the nature of the structural differencebetween M3 and M7; M7 lacks the fragment at m/z 143.
Figure 7: Difference spectrum for M7 m/z 486 and Maropitant (API)
Figure 8: a) MS2 m/z 486 Difference spectrum for M3 and M7 and b) 486→193.3 MS3 Difference spectrum for M3 and M7
ba
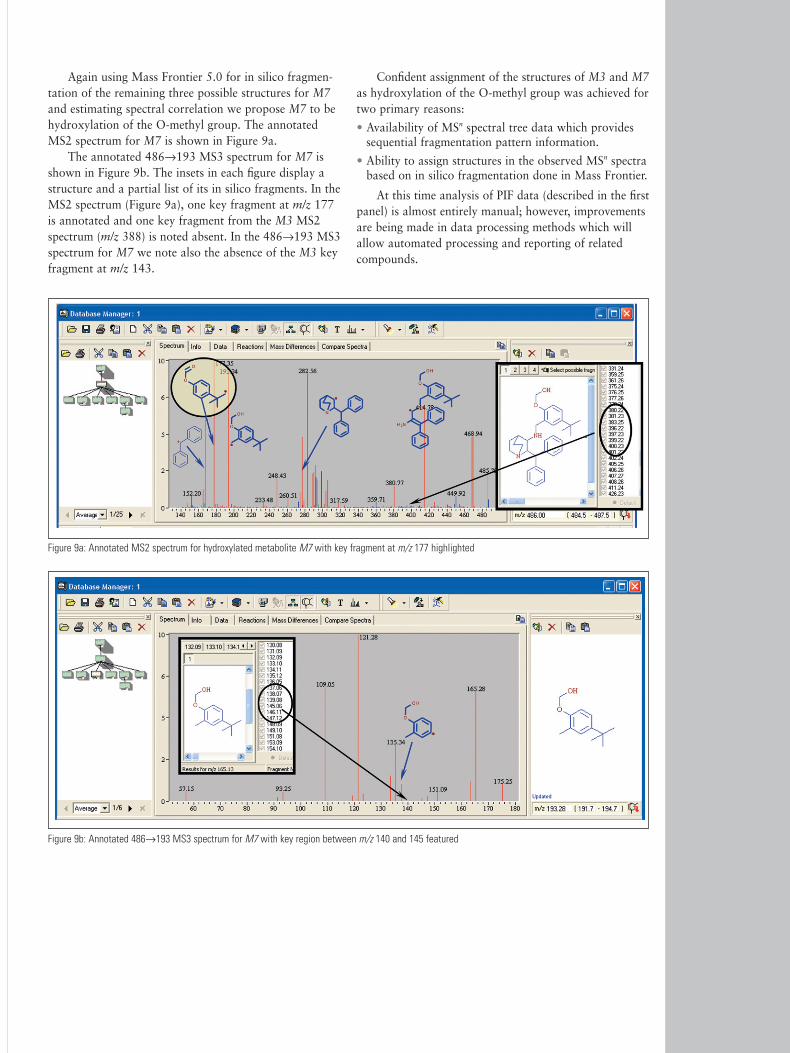
Again using Mass Frontier 5.0 for in silico fragmen-tation of the remaining three possible structures for M7and estimating spectral correlation we propose M7 to behydroxylation of the O-methyl group. The annotatedMS2 spectrum for M7 is shown in Figure 9a.
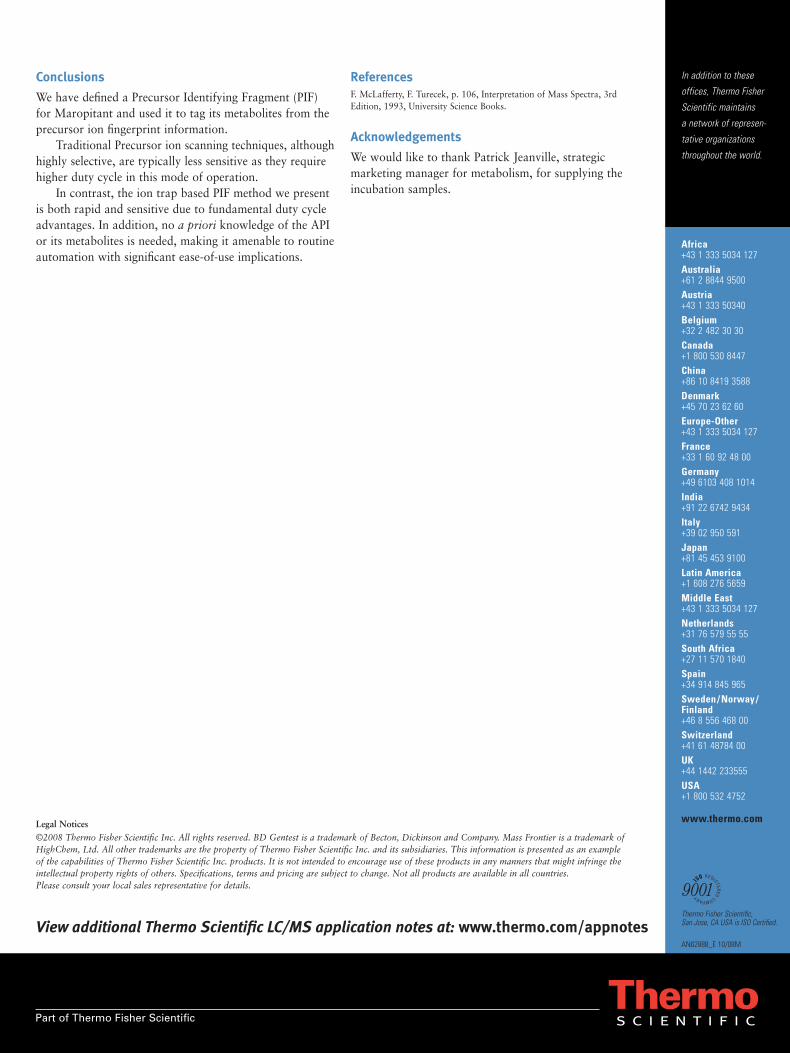
The annotated 486→193 MS3 spectrum for M7 isshown in Figure 9b. The insets in each figure display astructure and a partial list of its in silico fragments. In theMS2 spectrum (Figure 9a), one key fragment at m/z 177is annotated and one key fragment from the M3 MS2spectrum (m/z 388) is noted absent. In the 486→193 MS3spectrum for M7 we note also the absence of the M3 keyfragment at m/z 143.
Confident assignment of the structures of M3 and M7as hydroxylation of the O-methyl group was achieved fortwo primary reasons:
• Availability of MSn spectral tree data which providessequential fragmentation pattern information.
• Ability to assign structures in the observed MSn spectrabased on in silico fragmentation done in Mass Frontier.
At this time analysis of PIF data (described in the firstpanel) is almost entirely manual; however, improvementsare being made in data processing methods which willallow automated processing and reporting of relatedcompounds.
Figure 9a: Annotated MS2 spectrum for hydroxylated metabolite M7 with key fragment at m/z 177 highlighted
Figure 9b: Annotated 486→193 MS3 spectrum for M7 with key region between m/z 140 and 145 featured
In addition to these
offices, Thermo Fisher
Scientific maintains
a network of represen-
tative organizations
throughout the world.
Africa+43 1 333 5034 127Australia+61 2 8844 9500Austria+43 1 333 50340Belgium+32 2 482 30 30Canada+1 800 530 8447China+86 10 8419 3588Denmark+45 70 23 62 60 Europe-Other+43 1 333 5034 127France+33 1 60 92 48 00Germany+49 6103 408 1014India+91 22 6742 9434Italy+39 02 950 591Japan +81 45 453 9100Latin America+1 608 276 5659Middle East+43 1 333 5034 127Netherlands+31 76 579 55 55South Africa+27 11 570 1840Spain +34 914 845 965Sweden / Norway /Finland+46 8 556 468 00Switzerland+41 61 48784 00UK+44 1442 233555USA+1 800 532 4752
www.thermo.com
Part of Thermo Fisher Scientific
Conclusions
We have defined a Precursor Identifying Fragment (PIF)for Maropitant and used it to tag its metabolites from theprecursor ion fingerprint information.
Traditional Precursor ion scanning techniques, althoughhighly selective, are typically less sensitive as they requirehigher duty cycle in this mode of operation.
In contrast, the ion trap based PIF method we presentis both rapid and sensitive due to fundamental duty cycleadvantages. In addition, no a priori knowledge of the APIor its metabolites is needed, making it amenable to routineautomation with significant ease-of-use implications.
ReferencesF. McLafferty, F. Turecek, p. 106, Interpretation of Mass Spectra, 3rdEdition, 1993, University Science Books.
Acknowledgements
We would like to thank Patrick Jeanville, strategic marketing manager for metabolism, for supplying theincubation samples.
AN62888_E 10/08M
Thermo Fisher Scientific,San Jose, CA USA is ISO Certified.
Legal Notices©2008 Thermo Fisher Scientific Inc. All rights reserved. BD Gentest is a trademark of Becton, Dickinson and Company. Mass Frontier is a trademark ofHighChem, Ltd. All other trademarks are the property of Thermo Fisher Scientific Inc. and its subsidiaries. This information is presented as an example of the capabilities of Thermo Fisher Scientific Inc. products. It is not intended to encourage use of these products in any manners that might infringe the intellectual property rights of others. Specifications, terms and pricing are subject to change. Not all products are available in all countries. Please consult your local sales representative for details.
View additional Thermo Scientific LC/MS application notes at: www.thermo.com/appnotes