pierre massé portfolio
TRANSCRIPT

ENGINEER PORTFOLIO
Pierre Massé

As an engineer, I want to work in a company whichunderstands the challenges of today and tomorrow.I wish to innovate all the time as it means betterunderstanding the world around me.
I am enthusiastic about machine learning and I amstudying for data science as it regroupsmathematics, creating algorithms and investigatingdata.
This portfolio shows the projects I have worked on.

Data Science project2015-2016 NBA players analysis
the challenges

The purpose of the project was to find patterns between the way NBA players behave during basketball games. To achieve this,we chose to concatenate different databases containing players characteristics (age, salary, position) and players statistics per36 minutes played (field goal attempt/success, fouls, minutes played…).
Data correctionsThe fist step of this analysis was to identify andremove the first database outliers. “Garbage time”players have outstanding statistics due to the lack oftime they spent on the field. Under thesecircumstances, players that played less than 250minutes in the whole season were deleted.The second step of this correction was to correctthe skewness of each variable with a functionmodification to match a normal repartition.
Correlation MatrixCorrelation was declared valid when the p-valuewas under 5% and the correlation greater than 0,5.This level, relatively traditional, ensured us that thecorrelation was statistically significant.
Correlation board
Corellation
level
c > 0,8
0,8 > c > 0,5
Correlation type
● Salary, Salary per min and Salary per game
● Game started and Min Played
● Field Goal, Field Goal Attempt, Point and PER
● 3Point, 3Point Attempt, Point and PER
● 2Point, 2Point Attempt, Point and PER
● Free-throws, Free-throws Attempt, Point and PER
● Offensive Rebound, Defensive Rebound and Total Rebound
● Field Goal is correlated to the Free Throws and 2Point but not by the 3Point
● Field Goal Attempt is correlated to the 2Point, 2Point Attempt, Free
Throws but not by the 3Point
● Offensive Rebound and Defensive Rebound are correlated to the block
● Turnover are correlated to Assist
● 3 Points and 3 Points Attempt are anti correlated to the Field Goal %
● 3 Points is anti-correlated to Block, Defensive Rebound, Offensive Rebound
Dat
a Sc
ien
ce p
roje
ctN
BA
pla
yers
an
alys
is Objectives and database selection

After glancing rapidly at the different databases axis, some other outliers were identified through the contribution table andthe player’s repartitioning map. These were indeed far from the axis. Five players were removed including Stephen Curry andMichael Beasley. Stephen Curry broke the record of “3 points” in a year : 402, when the last highest was 270. In that sameseason, Michael Beasley rediscovered NBA after a few seasons in China, and, as a consequence, his wages were the lowestpossible, but he played a lot. The quality/price of this player did not fit the model, he was an outlier. The 3 remaining playerswere the last “garbage time” players.
PCA - InterpretationThe analysis of the database’s scree plot indicated that nomore than 3 axis explained the database. In this condition,and according to the previous results, these are the meaningsof all of them :
• Axis 1 : player efficiency• Axis 2 : offensive / defensive player• Axis 3 : ratio time played / wage of the player
Dat
a Sc
ien
ce p
roje
ctN
BA
pla
yers
an
alys
is PCA - Outliers
Axe 1 - 2 Axe 2 - 3

Helped by the dendogram decision tree, 9 different clusters were identified. This is the result of the clustering.
Dat
a Sc
ien
ce p
roje
ctN
BA
pla
yers
an
alys
isClustering
Axe 1 - 2Axe 1 - 3 Axe 2 - 3
Cluster %database interpretation
1 12%Point guard player. He is organising the team mouvements, as a consequence, he doesn't get a lot of
rebounds
2 13% 3 points shooter
3 16% "Trigger-happy" players. Love to shoot, with a poor efficiency in reaching the target
4 13% "Garbage time" players. They play a little time per match
5 9% Defensive players, poor attackers
6 15% Middling players : average in every sectors.
7 15% Defensive minded players
8 8% Offensive minded players
9 13% Superstar players. Great athletes for great salaries
Data Science projectNBA players analysisConclusion
In the NBA, being efficient in scoring “3 points” is the most valuable skill.Most of the players who have this skill earn more than an average player.This can be explained by the fact that “3 points” are harder to get, but alsoadd entertainment to the game.As a surprise, age doesn’t account for anything. Neither on the wages norperformances. This might be one of the biggest surprise of the database.
Data Mining projectPredicting alcoholic behavior in students
Dat
a M
inin
g p
roje
ctSt
ud
en
t al
coh
olic
be
hav
ior
The purpose of the project was to make a model that would be predictive to evaluate the impact of alcohol on studentbehavior. The database at our disposal was filled with information about student’s behavior and environment : age, sex,how often they go out per week, the number of drinks consumed per day and per week, if they have a romantic partnerand their performances in school… To achieve the project’s goal, we defined an alcoholic as a person who drinks at leasttwice a day three times a week.
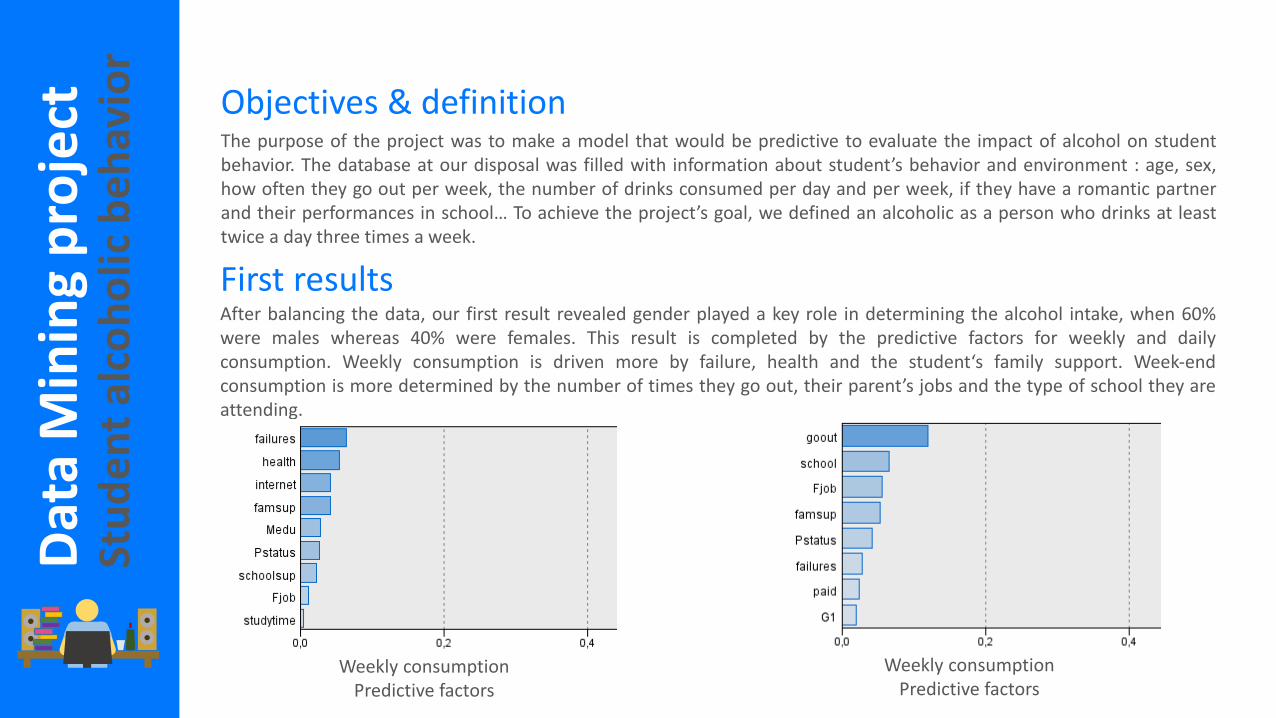
Objectives & definition
After balancing the data, our first result revealed gender played a key role in determining the alcohol intake, when 60%were males whereas 40% were females. This result is completed by the predictive factors for weekly and dailyconsumption. Weekly consumption is driven more by failure, health and the student‘s family support. Week-endconsumption is more determined by the number of times they go out, their parent’s jobs and the type of school they areattending.
First results
Weekly consumptionPredictive factors
Weekly consumptionPredictive factors

Dat
a M
inin
g p
roje
ctSt
ud
en
t al
coh
olic
be
hav
ior
Whether weekly consumption or week-ends consumption, family support is also a really important factor. But what leadsto alcoholic behavior is in the first case failure and in the second case the type of classes students are attending(engineering, business, design). For weekly consumption, health condition could be seen as a consequence of suchbehavior. For week-end consumption, the number of time the student goes out is a predictor, as well as the type of jobtheir families are doing.
Analysis
These two graphs focus on the daily consumption. The first one is showing a predictive analysis for the whole studentspopulation. It shows how important is the difference between the number of student consuming alcohol and those who donot. We made two different types of models : neural and chaid. To complete the study, this second graph shows howaccurate the two models are.
Predictions and model validation

Data Science projectPredicting alcoholic behavior in studentsConclusion
At school, like everywhere else, failure needs to be well supervised. Fromthis analysis we have demonstrated that failures can lead to seriousdiseases and addictions. In order to succeed, family support is also reallyimportant. Schools also play a role in helping their student towardssuccess. Like in companies, the environment and the management are keyperformance indicators for students.

SQL FundamentalsData Journalism
R 101TOEIC test
Ce
rtif
icat
ion
s
English test passed in may2016. This certification is validuntil may 2018.
My score is 915 out of 990.
Basics on finding database andtelling stories about it. Thiscourse has introduced me todata based communication.
Certification for the basic useof R.
Certification for the basic useof SQL.
