phytoplankton succession in the oligotrophic lake stechlin (germany) in 1994 and 1995
TRANSCRIPT
Hydrobiologia 369/370: 179–197, 1998. 179M. Alvarez-Cobelas, C. S. Reynolds, P. Sanchez-Castillo & J. Kristiansen (eds), Phytoplankton and Trophic Gradients.c 1998Kluwer Academic Publishers. Printed in Belgium.
Phytoplankton succession in the oligotrophic Lake Stechlin (Germany)in 1994 and 1995
Judit Padisak1, Lothar Krienitz2, Wolfram Scheffler2, Rainer Koschel2, Jørgen Kristiansen3 &Istvan Grigorszky41 Balaton Limnological Institute of the Hungarian Academy of Science, H-8237 Tihany, Hungary2 Institut fur Gewasserokologie und Binnenfischerei im Forschungsverbund Berlin e. V., Abteilung LimnologieGeschichteter Seen, Alte Fischerhutte 2, D-16775 Neuglobsow, Germany3 Department of Mycology & Phycology, Botanical Institute, University of Copenhagen, Ø Farimagsgade 2 D,DK-1353 Copenhagen K, Denmark4 Ecological Department of the Kossuth University, H-4010 Debrecen, Hungary
Key words:phytoplankton succession, oligotrophic lakes, picophytoplankton, winter growth, diversity
Abstract
Phytoplankton samples were taken weekly from January to December of 1994 (epilimnion) and 1995 (0–25 m,euphotic zone) from the deep, stratified, alkaline, oligotrophic Lake Stechlin, Baltic Lake District, Germany. Thepurpose of the study was to gain detailed information about phytoplankton changes including those of picophyto-plankton, to relate these changes to stratification patterns and nutrient chemistry of the lake and to compare themto results from other lakes of similar character.
During 1994–1995, a total of 142 phytoplankton taxa was encountered in quantitative samples, most beingcommon in deep, oligotrophic lakes. Seasonal development of phytoplankton is characterized by a definite springpeak followed by a moderate summer peak. Autotrophic picophytoplankton made the largest contribution to theannual total biomass. This is probably true for other, temperate, non-acidic, oligotrophic lakes.
Development of the spring assemblage (autotrophic picophytoplankton and centric diatoms) starts in February–March and is terminated by the onset of stratification when diatoms sink to the hypolimnion. Picophytoplankton,especiallySynechococcussp., assembles in a narrow deep-layer maximum in the upper hypolimnion.
Our data show that neither deep circulations nor decreased incident radiation under winter ice and snow coverprevent the development of some specially adapted low-light – high-nutrient species. Our views about the lengthof vegetation period for phytoplankton need to be revised with respect to winter and isothermal conditions.
Introduction
Lake Stechlin is one of the most interesting waters ofNorthern Germany, owing to its morphometry, appear-ance, trophic state and history. It is a relatively pristine,deep, oligotrophic, glacial lake, save that it was subjectto an effluent of cooling water from a nuclear powerplant during the 1960s,1970s and 1980s (Koschel et al.,1985; Koschel & Casper, 1986; Koschel, 1995).
The phytoplankton of Lake Stechlin has been stud-ied more or less regularly since 1959. Results for 1973and 1975 were published by the original investigator
(Kuchler, 1981, 1982), while data for periods 1959–1962, 1963–1964 and 1969–1972 appeared in the syn-theses of Casper (1985a, b). The latter contained achecklist of the algal flora of Lake Stechlin. Datafor 1992 have been published by Krienitz & Scheffler(1994). Extensive measurement of chemical variablesand primary production of phytoplankton started in1970 (Koschel, 1981, 1985, 1995; Mothes et al., 1985;Casper & Koschel, 1995).
This paper reports on the phytoplanktonsuccessionobserved in 1994 and 1995. In order to gain the high-est possible resolution, samples were taken weekly
GSB/prepr: Pipsnr. 159491; Ordernr.:7011638-avg BIO2KAPhydrma27.tex; 7/08/1998; 1:52; v.5; p.1
180
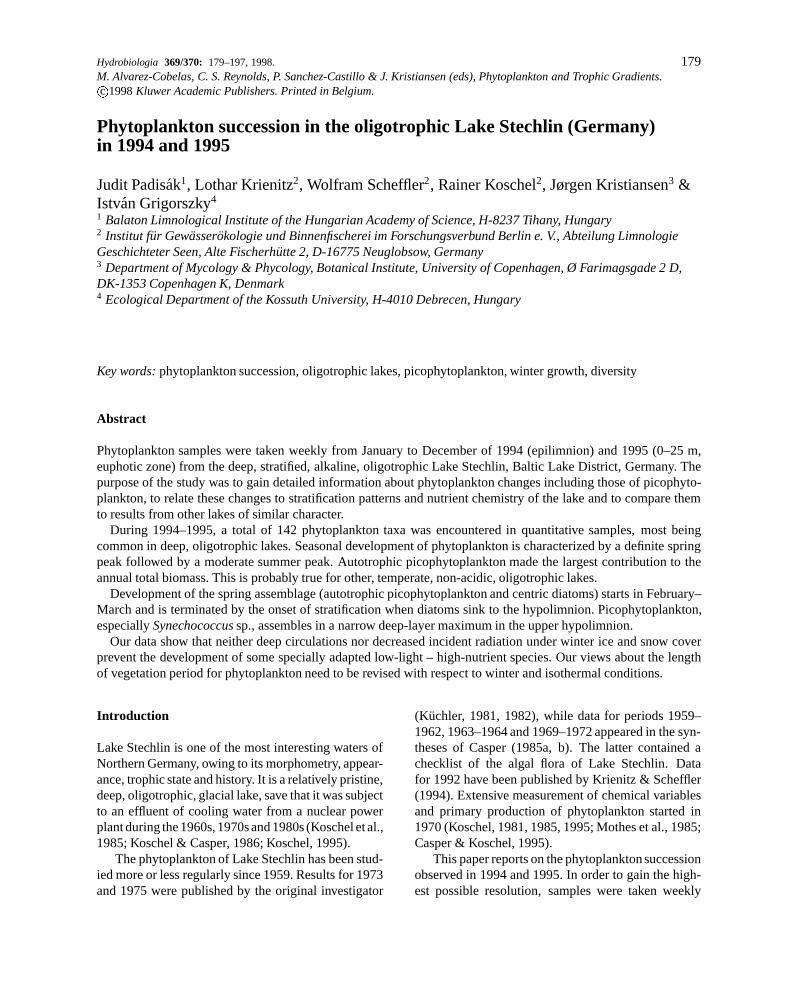
Figure 1. Location of sampling stations.� sampling station 1;�� sampling station 2.
Table 1. Annual averages of some physical and chemical variablesin Lake Stechlin in 1994 and 1995. pH and conductivity data referto the whole water column (0–65m);�: annual average 0–10 m;��: annual average 40–65 m.
1994 1995
Secchi transparency [m] 8.20 7.50
Oxygen saturation [%] 111�; 83�� 104�; 83��
pH 8.2 8.1
Conductivity [�S cm�1] 278 272
PO4-P [�g l�1] 2�; 8�� 2�; 6��
TP [�g l�1] 16�; 19�� 17�; 19��
NO3-N + NO2-N [�g l�1] 18�; 94�� 22�; 71��
NH4-N [�g l�1] 32�; 78�� 25�; 25��
TN [�g l�1] 587�; 584�� 444�; 422��
silica [�g l�1] 620�; 1610�� 660�; 1390��
from January to December. Picoplankton counts werealso performed and the species composition of cen-tric diatoms was determined in separate preparations.In the discussion, special care is taken to evaluate theresults in the context of the community compositionalong trophic gradients.
Description of study site
Lake Stechlin is a deep oligotrophic lake in the BalticLake District (53˚100 N, 13˚020 E, 59.9 m a.s.l.). Thesurface area is 4.25 km2, the maximal depth is 68 m,the mean depth is 23 m, and the total lake volume iscalculated as 97 106 m3. The catchment area amountsof 12.4 km2 of which 80% is covered by forests. Thelake stratifies during April–June, the most stable ther-mocline is usually observed in late July. Inverse strat-ification occurs in winters with prolonged ice cover.Therefore, the lake fluctuates between being mono- ordimictic. Ice cover did not develop on Lake Stechlin inthe winter of 1994/1995 while in 1995/1996 it lastedfrom early December to early April. In the winter of1993/1994 ice cover lasted for a period of two weeksonly. Some important chemical and physical featuresof the lake water are given in Table 1.
At the beginning of the 1960s, a nuclear powerplant was built on the shore of the lake. Cooling waterwas drawn from the the Stechlin-Nehmitz lake sys-tem (Casper, 1985a). This operation led to significantthermal pollution and, moreover, reduced the meanretention time of water in the lake basin from 335 daysto 202 days (Koschel & Casper, 1986). The operationof the nuclear power plant ceased in 1989.
Sampling and methods
Sampling
(i) Epilimnetic samples were taken from 3 to 5 depthseach week between mid January and late Decem-ber 1994 at a buoy installed at Sampling Station2, approximately 400 m north of the Institute furGewasserokologie und Binnenfischerei (water depth:26 m: Figure 1). These samples were mixed foranalyses of phytoplankton composition, biomass andautotrophic picophytoplankton numbers.
(ii) Between January and December 1995 samplesfrom 10 depths within the 0–25 m layer were takenweekly but at sampling Station 1, located at the max-imum depth of the lake. Picoplankton numbers, phy-toplankton composition and biomass were then estab-lished from integrated samples.
Phytoplankton composition and abundance
Phytoplankton species were identified using the mostup-to date phycological manuals and literature.A mini-
hydrma27.tex; 7/08/1998; 1:52; v.5; p.2
181
Table 2. List of algal taxa, their average contribution to annual average biomass and their number of occurrences in Lake Stechlin in1994 an 1995. A total of 88 samples were analyzed during the two years of which 46 in 1994 and 42 in 1995.
1994 1995
Average Number of Average Number of
biomass % occurrences biomass % occurrences
Cyanophyta
Aphanocapsa elachistaW. & G. S. West 0.33 13 – –
Aphanocapsa grevillei(Hassall) Rabenhorst 0.04 5 0.01 2
Aphanothecesp. 0.01 4 – –
Chroococcus limneticusLemmermann 0.15 8
Chroococcus minutus(Kutzing) Nageli <0.01 2 <0.01 3
Chroococcuscf. turgidus(Kutzing) Nageli 1.03 26 0.38 14
Chroococcussp. 0.56 15 1.53 24
Coelospharium kuetzingianumNageli 0.37 21 0.23 7
Eucapsis alpinaClements & Schantz <0.01 1 – –
Merismopedia tenuissimaLemmermann <0.01 3 0.01 3
Microcystis wesenbergiiKomarek <0.01 1 –
Radiocystis geminataSkuja 0.17 12 0.14 11
other Chroococcales 0.08 5 – –
Synechococcussp. (picoalgal size) 15.17 46 33.91 42
colonial cyanobacteria of picoalgal cell sizes 2.83 46 0.75 42
Anabaena lemmermanniiP. Richter 0.17 9 1.14 17
Anabaenasp. 0.35 15 – –
Limnothrix planctonica(Woloszynska) Meffert <0.01 2 – –
Planktolyngbya circumcreta(G. S. West) Anagnostidis & Komarek. <0.01 1 – –
Planktothrix rubescens(DC. ex Gomont) Anagnostidis & Komarek 0.04 6 0.07 8
Oscillatoria chlorinaKutzing ex. Gomont 0.13 2 – –
Pseudanabaena catenataLauterborn 0.01 3 – –
Chlorophyta
Carteria sp. – – 0.03 5
Carteria sp. big – – 0.01 1
Chlamydomonassp. 0.04 8 – –
Chlamydomonassp. small 0.01 11 0.01 6
Eudorina elegansEhrenberg 0.08 5 – –
Pandorina morum(O. F. Muller) Bory 0.19 14 0.08 4
Phacotus lenticularis(Ehrenberg) Stein 0.16 3 0.58 12
other Phytomonadina 0.02 5 0.03 3
Pseudosphaerocystis lacustris(Lemmermann) Novakova 0.20 20 0.50 21
Ankistrodesmus fusiformisCorda <0.01 1 – –
Botryococcus brauniiKutzing andB. terribilis Komarek & Marvan 0.04 3 0.38 9
Coelastrumspp. 0.03 4 0.20 6
Coenochloris polycocca(Korschikov) Hindak 0.15 21 0.13 19
Crucigenia quadrataMorren – – 0.01 8
Dictyosphaeriumsp. – – <0.01 1
Neocystis polycoccaHindak,Pseudodictyosphaerium jurisii
(Hindak) Hindak andChoricystis minor(Skuja) Fott;
(green algae of picoalgal size) 1.02 26 2.69 29
Oocystis lacustrisChodat 0.40 41 0.63 37
Oocystis solitariaWittrock 0.07 17 0.06 3
Pediastrum boryanum(Turpin) Meneghini <0.01 1 0.02 6
Pediastrum duplexMeyen 0.01 1 0.02 2
hydrma27.tex; 7/08/1998; 1:52; v.5; p.3
182
Table 2. Continued.
1994 1995
Average Number of Average Number of
biomass % occurrences biomass % occurrences
Planktosphaeria gelatinosaG. M. Smith 0.02 2 – –
Pseudococcomyxa simplex(Mainx) Fott <0.01 1 – –
Quadrigula pfitzeri(Schroder) G. M. Smith 0.08 15 0.05 6
Scenedesmus armatusChodat 0.06 7
Scenedesmus costato-granulatusSkuja 0.33 19 0.60 40
Scenedesmus obliquus(Turpin) Kutzing <0.01 1
Scenedesmus quadricauda(Turpin) Brebisson 0.10 5 <0.01 1
Scenedesmusspp. – – 0.01 4
unidentified Selenstraceae spp. <0.01 3 <0.01 2
Tetraedron caudatum(Corda) Hansgirg – – <0.01 1
Tetraedron minimum(A. Braun) Hansgirg 0.09 14 0.18 18
Willea vilhelmii (Fott) Komarek 0.09 18 0.20 10
other coccal green algae 0.07 9 <0.01 1
Elakatothrix gelatinosaWille 0.10 40 0.07 26
Koliella longiseta(Vischer) Hindak <0.01 2 – –
Planktonema lauterborniiSchmidle 0.01 7 <0.01 1
Ulothrix sp., filamentous 0.04 9 0.21 8
unicellular Ulotrichales sp. 0.09 13 0.14 14
Closterium acutumvar.variabile (Lemmermann) W. Krieger 0.02 19 0.08 36
Cosmarium bioculatumBrebisson 0.16 13 0.21 13
Cosmarium phaseolusBrebisson ex. Ralfs 0.65 30 0.41 25
Cosmariumsp. – – <0.01 1
Staurastrumsp. 0.07 4 0.20 12
Staurodesmuscf. incus(Brebisson) Teiling 0.02 3 0.01 1
Spirogyrasp. 0.01 2 <0.01 0
Euglenophyta
Euglenasp. – – 0.02 1
Heterokontophyta
Xanthophyceae
Monallanthussp. – – 0.03 4
Trachydiscus sexangulatusEttl 0.37 15 0.48 27
cf. Tetraedriella jovetii(Bourrelly) Bourrelly 0.96 27 0.34 32
Chrysophyceae
Bitrichia chodatii (Reverdin) Chodat 0.17 14 0.03 7
Chrysamoebasp. 0.09 6 <0.01 1
Chrysochromulina parvaLackey 1.24 44 0.09 18
Chrysococcussp. 1.22 15 0.16 31
Chrysolykos planktonicusMack 0.11 6 0.02 5
Dinobryon bavaricumImhof 0.56 16 0.09 12
Dinobryon acuminatumRuttner 0.21 17 <0.01 1
Dinobryon divergensImhof 0.03 9 – –
Dinobryon pediforme(Lemmermann) Steinecke <0.01 1 0.23 11
Dinobryon socialeEhrenberg 5.10 25 4.87 13
Dinobryoncysts 0.16 8 – –
Kephyrionspp. 0.09 9 0.05 22
Mallomonasspp. 0.82 35 0.27 13
Ochromonassp. 0.61 19 0.01 1
Paraphysomonas vestita(Stokes) de Saedeler 0.04 4 – –
hydrma27.tex; 7/08/1998; 1:52; v.5; p.4
183
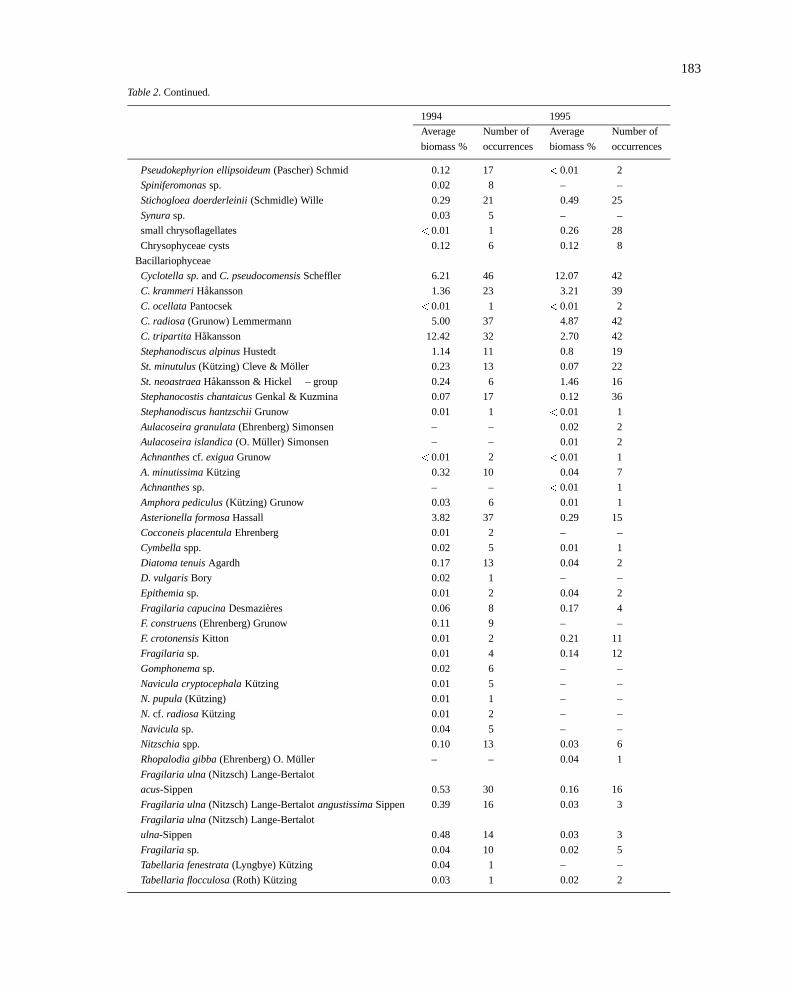
Table 2. Continued.
1994 1995
Average Number of Average Number of
biomass % occurrences biomass % occurrences
Pseudokephyrion ellipsoideum(Pascher) Schmid 0.12 17 <0.01 2
Spiniferomonassp. 0.02 8 – –
Stichogloea doerderleinii(Schmidle) Wille 0.29 21 0.49 25
Synurasp. 0.03 5 – –
small chrysoflagellates <0.01 1 0.26 28
Chrysophyceae cysts 0.12 6 0.12 8
Bacillariophyceae
Cyclotella sp.andC. pseudocomensisScheffler 6.21 46 12.07 42
C. krammeriHakansson 1.36 23 3.21 39
C. ocellataPantocsek <0.01 1 <0.01 2
C. radiosa(Grunow) Lemmermann 5.00 37 4.87 42
C. tripartita Hakansson 12.42 32 2.70 42
Stephanodiscus alpinusHustedt 1.14 11 0.8 19
St. minutulus(Kutzing) Cleve & Moller 0.23 13 0.07 22
St. neoastraeaHakansson & Hickel – group 0.24 6 1.46 16
Stephanocostis chantaicusGenkal & Kuzmina 0.07 17 0.12 36
Stephanodiscus hantzschiiGrunow 0.01 1 <0.01 1
Aulacoseira granulata(Ehrenberg) Simonsen – – 0.02 2
Aulacoseira islandica(O. Muller) Simonsen – – 0.01 2
Achnanthescf. exiguaGrunow <0.01 2 <0.01 1
A. minutissimaKutzing 0.32 10 0.04 7
Achnanthessp. – – <0.01 1
Amphora pediculus(Kutzing) Grunow 0.03 6 0.01 1
Asterionella formosaHassall 3.82 37 0.29 15
Cocconeis placentulaEhrenberg 0.01 2 – –
Cymbellaspp. 0.02 5 0.01 1
Diatoma tenuisAgardh 0.17 13 0.04 2
D. vulgarisBory 0.02 1 – –
Epithemiasp. 0.01 2 0.04 2
Fragilaria capucinaDesmazieres 0.06 8 0.17 4
F. construens(Ehrenberg) Grunow 0.11 9 – –
F. crotonensisKitton 0.01 2 0.21 11
Fragilaria sp. 0.01 4 0.14 12
Gomphonemasp. 0.02 6 – –
Navicula cryptocephalaKutzing 0.01 5 – –
N. pupula(Kutzing) 0.01 1 – –
N. cf. radiosaKutzing 0.01 2 – –
Naviculasp. 0.04 5 – –
Nitzschiaspp. 0.10 13 0.03 6
Rhopalodia gibba(Ehrenberg) O. Muller – – 0.04 1
Fragilaria ulna (Nitzsch) Lange-Bertalot
acus-Sippen 0.53 30 0.16 16
Fragilaria ulna (Nitzsch) Lange-BertalotangustissimaSippen 0.39 16 0.03 3
Fragilaria ulna (Nitzsch) Lange-Bertalot
ulna-Sippen 0.48 14 0.03 3
Fragilaria sp. 0.04 10 0.02 5
Tabellaria fenestrata(Lyngbye) Kutzing 0.04 1 – –
Tabellaria flocculosa(Roth) Kutzing 0.03 1 0.02 2
hydrma27.tex; 7/08/1998; 1:52; v.5; p.5
184
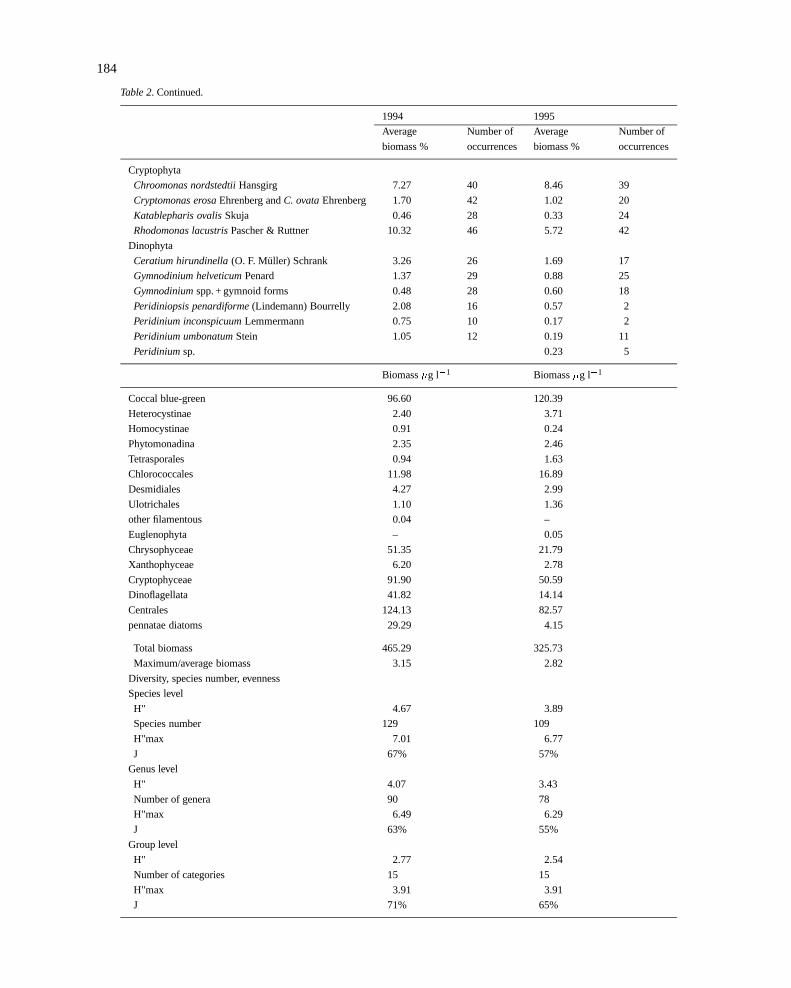
Table 2. Continued.
1994 1995
Average Number of Average Number of
biomass % occurrences biomass % occurrences
Cryptophyta
Chroomonas nordstedtiiHansgirg 7.27 40 8.46 39
Cryptomonas erosaEhrenberg andC. ovataEhrenberg 1.70 42 1.02 20
Katablepharis ovalisSkuja 0.46 28 0.33 24
Rhodomonas lacustrisPascher & Ruttner 10.32 46 5.72 42
Dinophyta
Ceratium hirundinella(O. F. Muller) Schrank 3.26 26 1.69 17
Gymnodinium helveticumPenard 1.37 29 0.88 25
Gymnodiniumspp. + gymnoid forms 0.48 28 0.60 18
Peridiniopsis penardiforme(Lindemann) Bourrelly 2.08 16 0.57 2
Peridinium inconspicuumLemmermann 0.75 10 0.17 2
Peridinium umbonatumStein 1.05 12 0.19 11
Peridiniumsp. 0.23 5
Biomass�g l�1 Biomass�g l�1
Coccal blue-green 96.60 120.39
Heterocystinae 2.40 3.71
Homocystinae 0.91 0.24
Phytomonadina 2.35 2.46
Tetrasporales 0.94 1.63
Chlorococcales 11.98 16.89
Desmidiales 4.27 2.99
Ulotrichales 1.10 1.36
other filamentous 0.04 –
Euglenophyta – 0.05
Chrysophyceae 51.35 21.79
Xanthophyceae 6.20 2.78
Cryptophyceae 91.90 50.59
Dinoflagellata 41.82 14.14
Centrales 124.13 82.57
pennatae diatoms 29.29 4.15
Total biomass 465.29 325.73
Maximum/average biomass 3.15 2.82
Diversity, species number, evenness
Species level
H" 4.67 3.89
Species number 129 109
H"max 7.01 6.77
J 67% 57%
Genus level
H" 4.07 3.43
Number of genera 90 78
H"max 6.49 6.29
J 63% 55%
Group level
H" 2.77 2.54
Number of categories 15 15
H"max 3.91 3.91
J 71% 65%
hydrma27.tex; 7/08/1998; 1:52; v.5; p.6
185
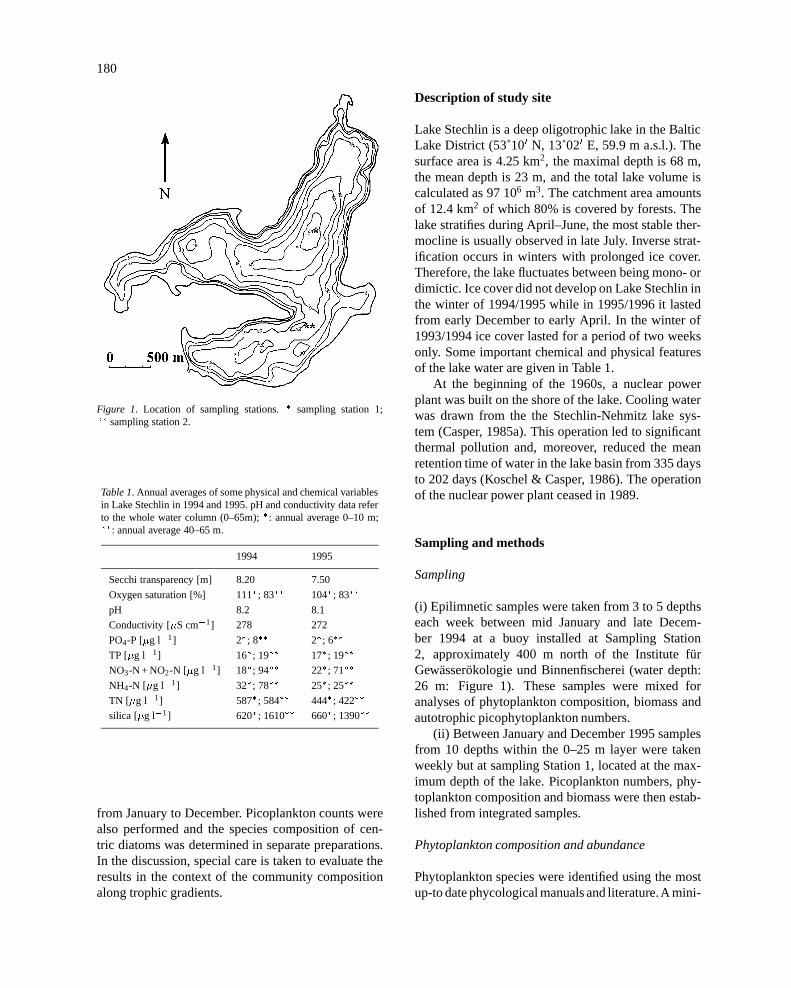
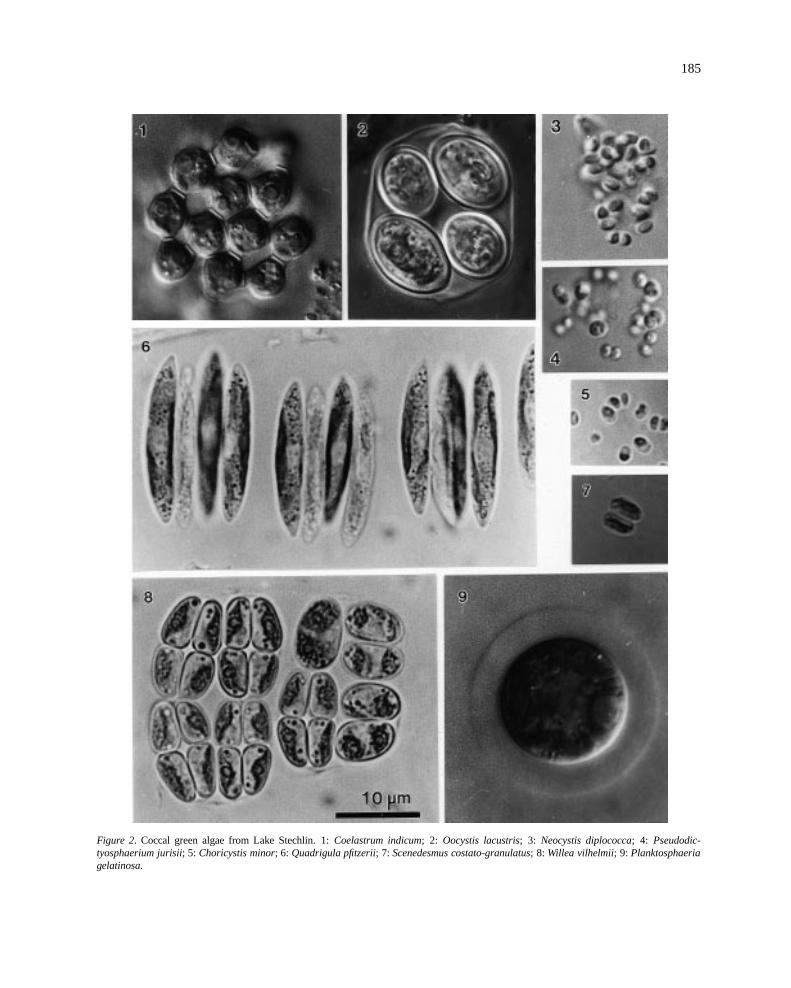
Figure 2. Coccal green algae from Lake Stechlin. 1:Coelastrum indicum; 2: Oocystis lacustris; 3: Neocystis diplococca; 4: Pseudodic-tyosphaerium jurisii; 5: Choricystis minor; 6: Quadrigula pfitzerii; 7: Scenedesmus costato-granulatus; 8: Willea vilhelmii; 9: Planktosphaeriagelatinosa.
hydrma27.tex; 7/08/1998; 1:52; v.5; p.7
186
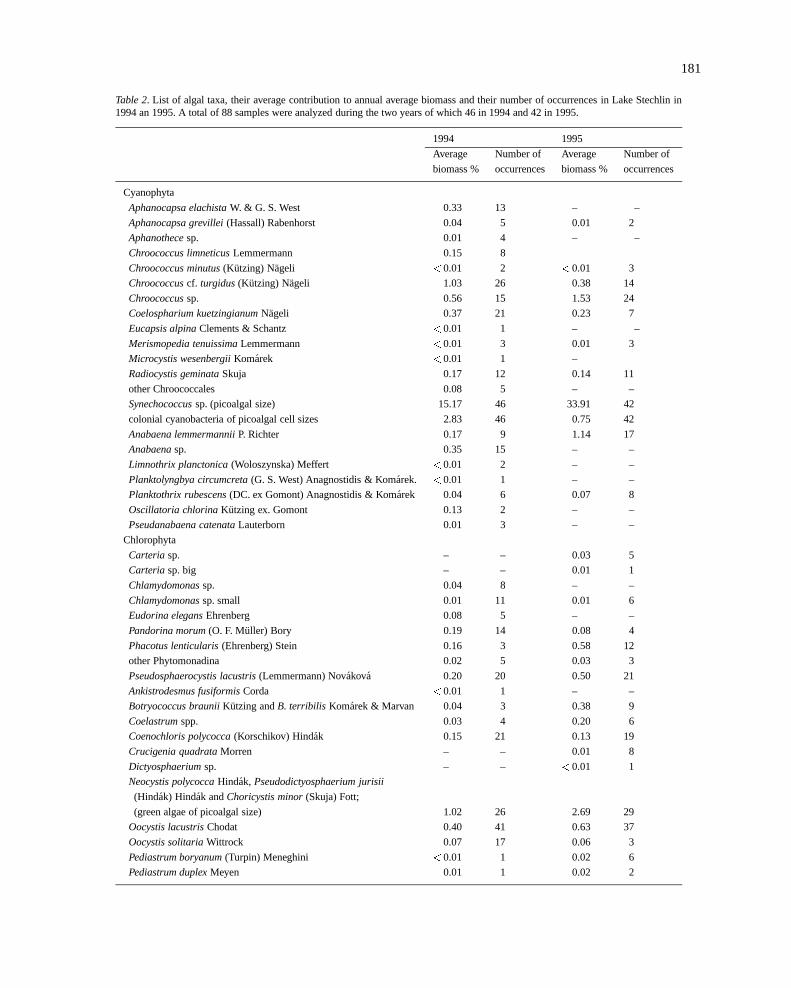
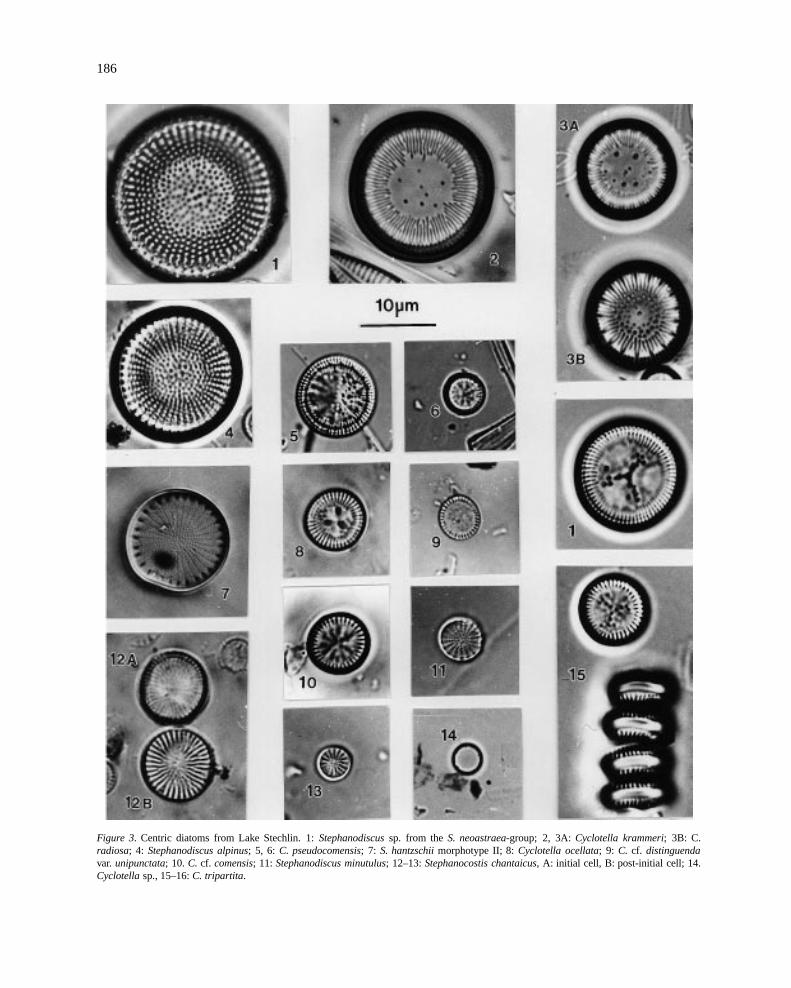
Figure 3. Centric diatoms from Lake Stechlin. 1:Stephanodiscussp. from theS. neoastraea-group; 2, 3A:Cyclotella krammeri; 3B: C.radiosa; 4: Stephanodiscus alpinus; 5, 6: C. pseudocomensis; 7: S. hantzschiimorphotype II; 8:Cyclotella ocellata; 9: C. cf. distinguendavar. unipunctata; 10. C. cf. comensis; 11: Stephanodiscus minutulus; 12–13:Stephanocostis chantaicus, A: initial cell, B: post-initial cell; 14.Cyclotellasp., 15–16:C. tripartita.
hydrma27.tex; 7/08/1998; 1:52; v.5; p.8
187
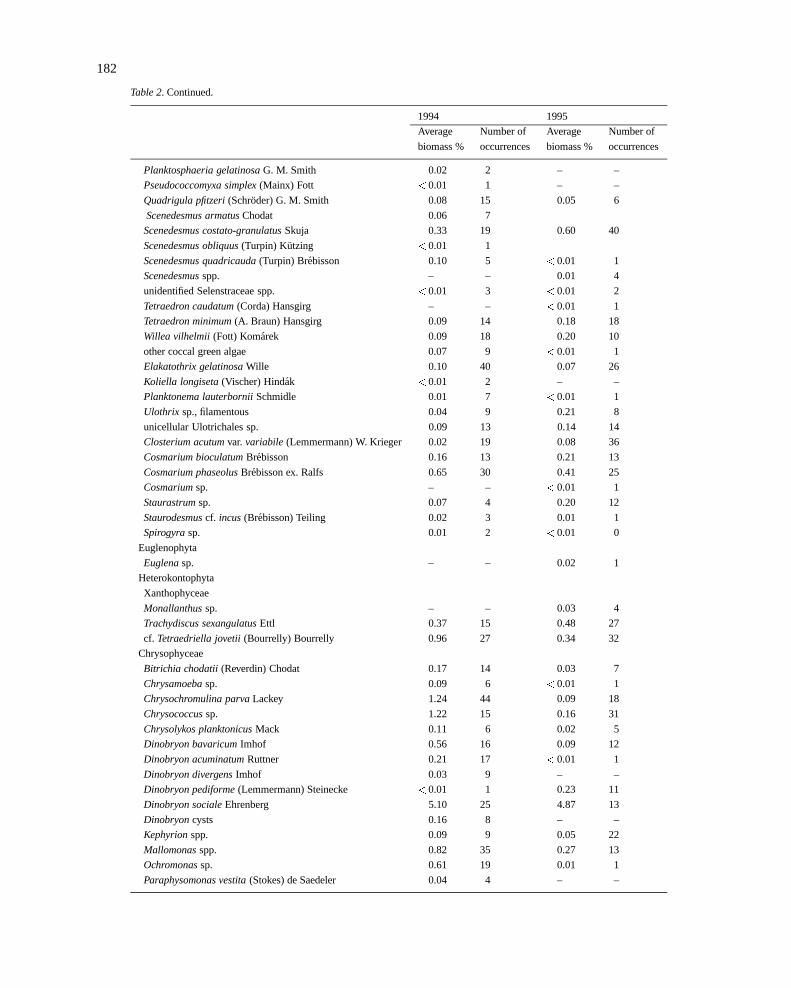
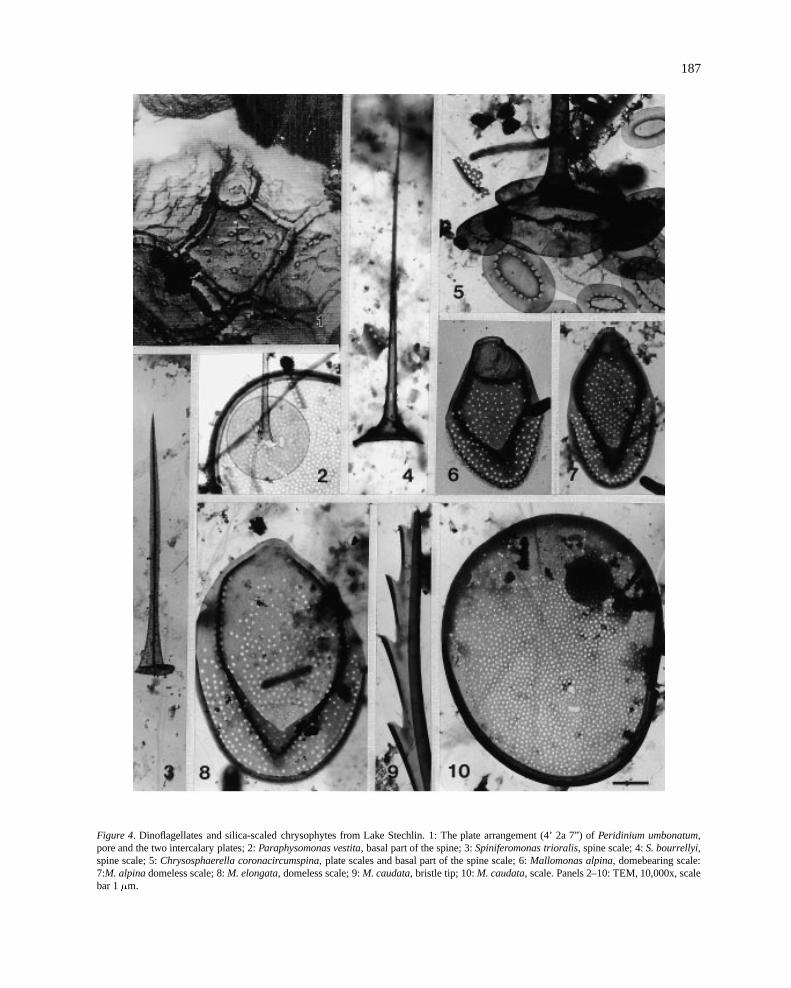
Figure 4. Dinoflagellates and silica-scaled chrysophytes from Lake Stechlin. 1: The plate arrangement (4’ 2a 7”) ofPeridinium umbonatum,pore and the two intercalary plates; 2:Paraphysomonas vestita, basal part of the spine; 3:Spiniferomonas trioralis, spine scale; 4:S. bourrellyi,spine scale; 5:Chrysosphaerella coronacircumspina, plate scales and basal part of the spine scale; 6:Mallomonas alpina, domebearing scale:7:M. alpinadomeless scale; 8:M. elongata, domeless scale; 9:M. caudata, bristle tip; 10:M. caudata, scale. Panels 2–10: TEM, 10,000x, scalebar 1�m.
hydrma27.tex; 7/08/1998; 1:52; v.5; p.9
188
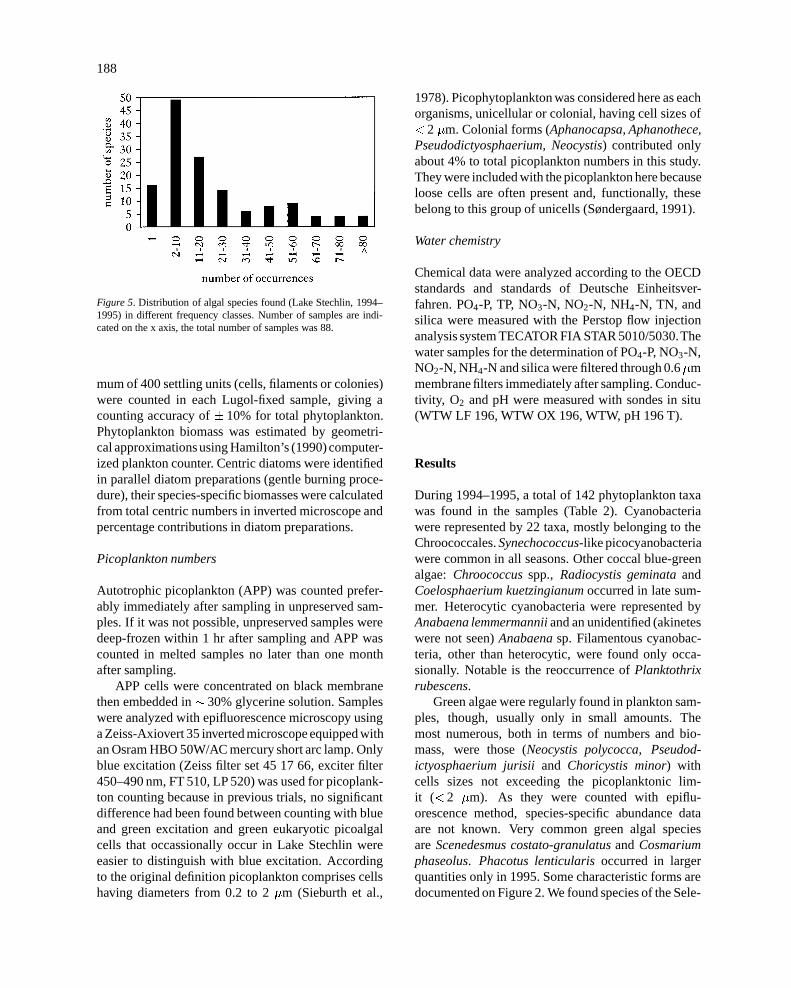
Figure 5. Distribution of algal species found (Lake Stechlin, 1994–1995) in different frequency classes. Number of samples are indi-cated on the x axis, the total number of samples was 88.
mum of 400 settling units (cells, filaments or colonies)were counted in each Lugol-fixed sample, giving acounting accuracy of� 10% for total phytoplankton.Phytoplankton biomass was estimated by geometri-cal approximationsusing Hamilton’s (1990)computer-ized plankton counter. Centric diatoms were identifiedin parallel diatom preparations (gentle burning proce-dure), their species-specific biomasses were calculatedfrom total centric numbers in inverted microscope andpercentage contributions in diatom preparations.
Picoplankton numbers
Autotrophic picoplankton (APP) was counted prefer-ably immediately after sampling in unpreserved sam-ples. If it was not possible, unpreserved samples weredeep-frozen within 1 hr after sampling and APP wascounted in melted samples no later than one monthafter sampling.
APP cells were concentrated on black membranethen embedded in�30% glycerine solution. Sampleswere analyzed with epifluorescence microscopy usinga Zeiss-Axiovert 35 inverted microscope equipped withan Osram HBO 50W/AC mercury short arc lamp. Onlyblue excitation (Zeiss filter set 45 17 66, exciter filter450–490 nm, FT 510, LP 520) was used for picoplank-ton counting because in previous trials, no significantdifference had been found between counting with blueand green excitation and green eukaryotic picoalgalcells that occassionally occur in Lake Stechlin wereeasier to distinguish with blue excitation. Accordingto the original definition picoplankton comprises cellshaving diameters from 0.2 to 2�m (Sieburth et al.,
1978). Picophytoplankton was considered here as eachorganisms, unicellular or colonial, having cell sizes of< 2 �m. Colonial forms (Aphanocapsa, Aphanothece,Pseudodictyosphaerium, Neocystis) contributed onlyabout 4% to total picoplankton numbers in this study.They were included with the picoplankton here becauseloose cells are often present and, functionally, thesebelong to this group of unicells (Søndergaard, 1991).
Water chemistry
Chemical data were analyzed according to the OECDstandards and standards of Deutsche Einheitsver-fahren. PO4-P, TP, NO3-N, NO2-N, NH4-N, TN, andsilica were measured with the Perstop flow injectionanalysis system TECATOR FIA STAR 5010/5030.Thewater samples for the determination of PO4-P, NO3-N,NO2-N, NH4-N and silica were filtered through 0.6�mmembrane filters immediately after sampling. Conduc-tivity, O2 and pH were measured with sondes in situ(WTW LF 196, WTW OX 196, WTW, pH 196 T).
Results
During 1994–1995, a total of 142 phytoplankton taxawas found in the samples (Table 2). Cyanobacteriawere represented by 22 taxa, mostly belonging to theChroococcales.Synechococcus-like picocyanobacteriawere common in all seasons. Other coccal blue-greenalgae: Chroococcusspp., Radiocystis geminataandCoelosphaerium kuetzingianumoccurred in late sum-mer. Heterocytic cyanobacteria were represented byAnabaena lemmermanniiand an unidentified (akineteswere not seen)Anabaenasp. Filamentous cyanobac-teria, other than heterocytic, were found only occa-sionally. Notable is the reoccurrence ofPlanktothrixrubescens.
Green algae were regularly found in plankton sam-ples, though, usually only in small amounts. Themost numerous, both in terms of numbers and bio-mass, were those (Neocystis polycocca, Pseudod-ictyosphaerium jurisiiand Choricystis minor) withcells sizes not exceeding the picoplanktonic lim-it (<2 �m). As they were counted with epiflu-orescence method, species-specific abundance dataare not known. Very common green algal speciesareScenedesmus costato-granulatusandCosmariumphaseolus. Phacotus lenticularisoccurred in largerquantities only in 1995. Some characteristic forms aredocumented on Figure 2. We found species of the Sele-
hydrma27.tex; 7/08/1998; 1:52; v.5; p.10
189
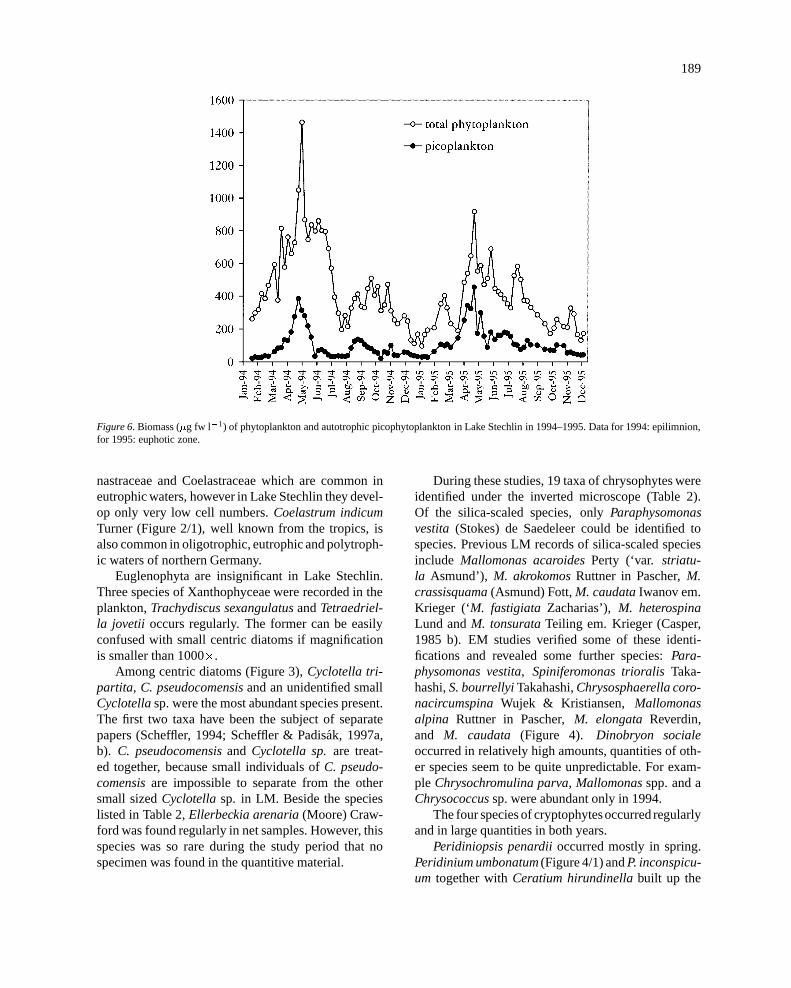
Figure 6. Biomass (�g fw l�1) of phytoplankton and autotrophic picophytoplankton in Lake Stechlin in 1994–1995. Data for 1994: epilimnion,for 1995: euphotic zone.
nastraceae and Coelastraceae which are common ineutrophic waters, however in Lake Stechlin they devel-op only very low cell numbers.Coelastrum indicumTurner (Figure 2/1), well known from the tropics, isalso common in oligotrophic, eutrophic and polytroph-ic waters of northern Germany.
Euglenophyta are insignificant in Lake Stechlin.Three species of Xanthophyceae were recorded in theplankton,Trachydiscus sexangulatusandTetraedriel-la jovetii occurs regularly. The former can be easilyconfused with small centric diatoms if magnificationis smaller than 1000�.
Among centric diatoms (Figure 3),Cyclotella tri-partita, C. pseudocomensisand an unidentified smallCyclotellasp. were the most abundant species present.The first two taxa have been the subject of separatepapers (Scheffler, 1994; Scheffler & Padisak, 1997a,b). C. pseudocomensisand Cyclotella sp.are treat-ed together, because small individuals ofC. pseudo-comensisare impossible to separate from the othersmall sizedCyclotellasp. in LM. Beside the specieslisted in Table 2,Ellerbeckia arenaria(Moore) Craw-ford was found regularly in net samples. However, thisspecies was so rare during the study period that nospecimen was found in the quantitive material.
During these studies, 19 taxa of chrysophytes wereidentified under the inverted microscope (Table 2).Of the silica-scaled species, onlyParaphysomonasvestita (Stokes) de Saedeleer could be identified tospecies. Previous LM records of silica-scaled speciesinclude Mallomonas acaroidesPerty (‘var. striatu-la Asmund’), M. akrokomosRuttner in Pascher,M.crassisquama(Asmund) Fott,M. caudataIwanov em.Krieger (‘M. fastigiata Zacharias’),M. heterospinaLund andM. tonsurataTeiling em. Krieger (Casper,1985 b). EM studies verified some of these identi-fications and revealed some further species:Para-physomonas vestita, Spiniferomonas trioralisTaka-hashi,S. bourrellyiTakahashi,Chrysosphaerella coro-nacircumspinaWujek & Kristiansen, Mallomonasalpina Ruttner in Pascher,M. elongata Reverdin,and M. caudata (Figure 4). Dinobryon socialeoccurred in relatively high amounts, quantities of oth-er species seem to be quite unpredictable. For exam-ple Chrysochromulina parva, Mallomonasspp. and aChrysococcussp. were abundant only in 1994.
The four species of cryptophytesoccurred regularlyand in large quantities in both years.
Peridiniopsis penardiioccurred mostly in spring.Peridinium umbonatum(Figure 4/1) andP. inconspicu-um together withCeratium hirundinellabuilt up the
hydrma27.tex; 7/08/1998; 1:52; v.5; p.11
190
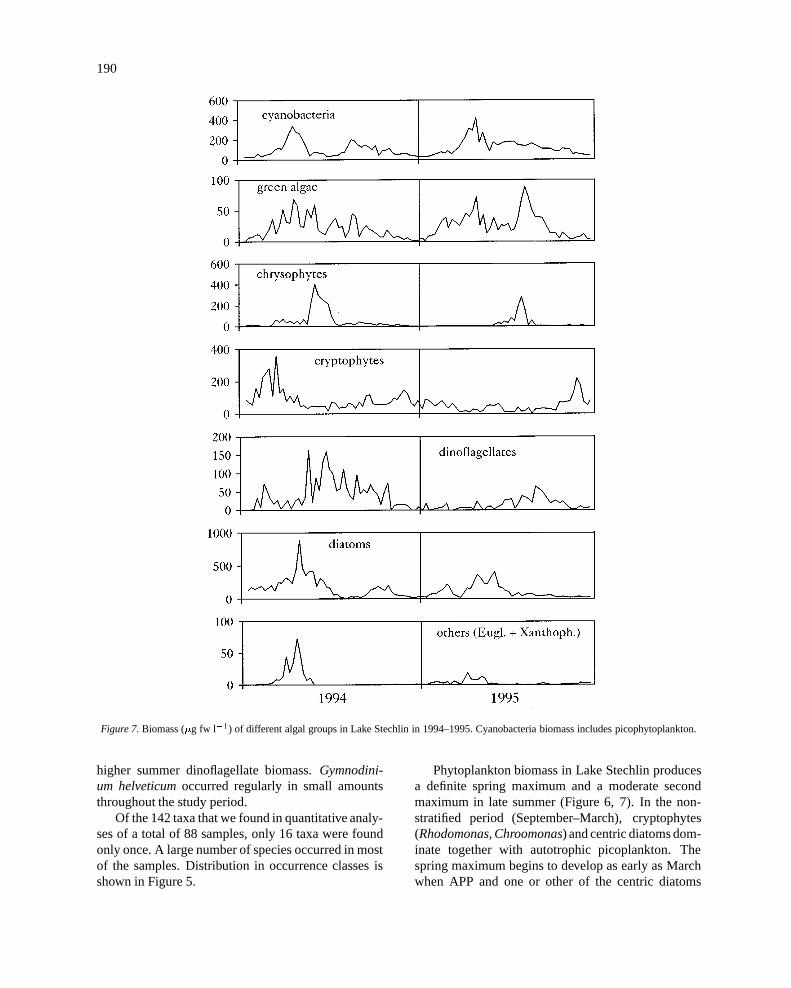
Figure 7. Biomass (�g fw l�1) of different algal groups in Lake Stechlin in 1994–1995. Cyanobacteria biomass includes picophytoplankton.
higher summer dinoflagellate biomass.Gymnodini-um helveticumoccurred regularly in small amountsthroughout the study period.
Of the 142 taxa that we found in quantitative analy-ses of a total of 88 samples, only 16 taxa were foundonly once. A large number of species occurred in mostof the samples. Distribution in occurrence classes isshown in Figure 5.
Phytoplankton biomass in Lake Stechlin producesa definite spring maximum and a moderate secondmaximum in late summer (Figure 6, 7). In the non-stratified period (September–March), cryptophytes(Rhodomonas, Chroomonas) and centric diatoms dom-inate together with autotrophic picoplankton. Thespring maximum begins to develop as early as Marchwhen APP and one or other of the centric diatoms
hydrma27.tex; 7/08/1998; 1:52; v.5; p.12
191
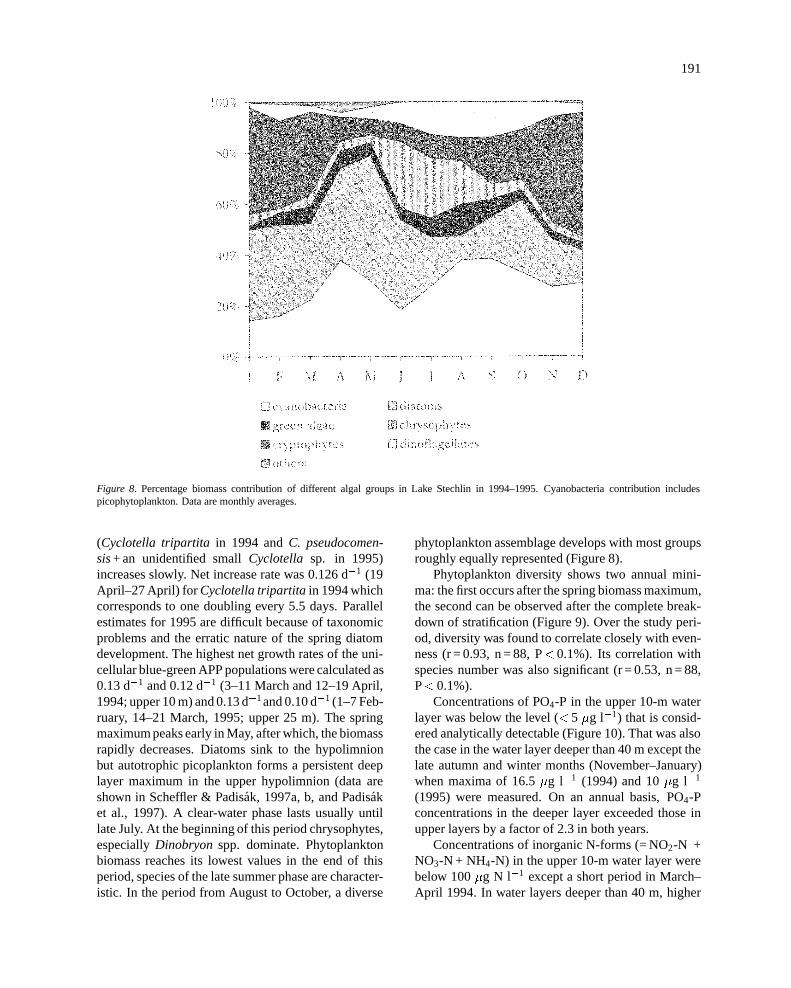
Figure 8. Percentage biomass contribution of different algal groups in Lake Stechlin in 1994–1995. Cyanobacteria contribution includespicophytoplankton. Data are monthly averages.
(Cyclotella tripartita in 1994 andC. pseudocomen-sis+ an unidentified smallCyclotella sp. in 1995)increases slowly. Net increase rate was 0.126 d�1 (19April–27 April) for Cyclotella tripartitain 1994 whichcorresponds to one doubling every 5.5 days. Parallelestimates for 1995 are difficult because of taxonomicproblems and the erratic nature of the spring diatomdevelopment. The highest net growth rates of the uni-cellular blue-green APP populations were calculated as0.13 d�1 and 0.12 d�1 (3–11 March and 12–19 April,1994; upper 10 m) and 0.13 d�1and 0.10 d�1 (1–7 Feb-ruary, 14–21 March, 1995; upper 25 m). The springmaximum peaks early in May, after which, the biomassrapidly decreases. Diatoms sink to the hypolimnionbut autotrophic picoplankton forms a persistent deeplayer maximum in the upper hypolimnion (data areshown in Scheffler & Padisak, 1997a, b, and Padisaket al., 1997). A clear-water phase lasts usually untillate July. At the beginning of this period chrysophytes,especiallyDinobryon spp. dominate. Phytoplanktonbiomass reaches its lowest values in the end of thisperiod, species of the late summer phase are character-istic. In the period from August to October, a diverse
phytoplankton assemblage develops with most groupsroughly equally represented (Figure 8).
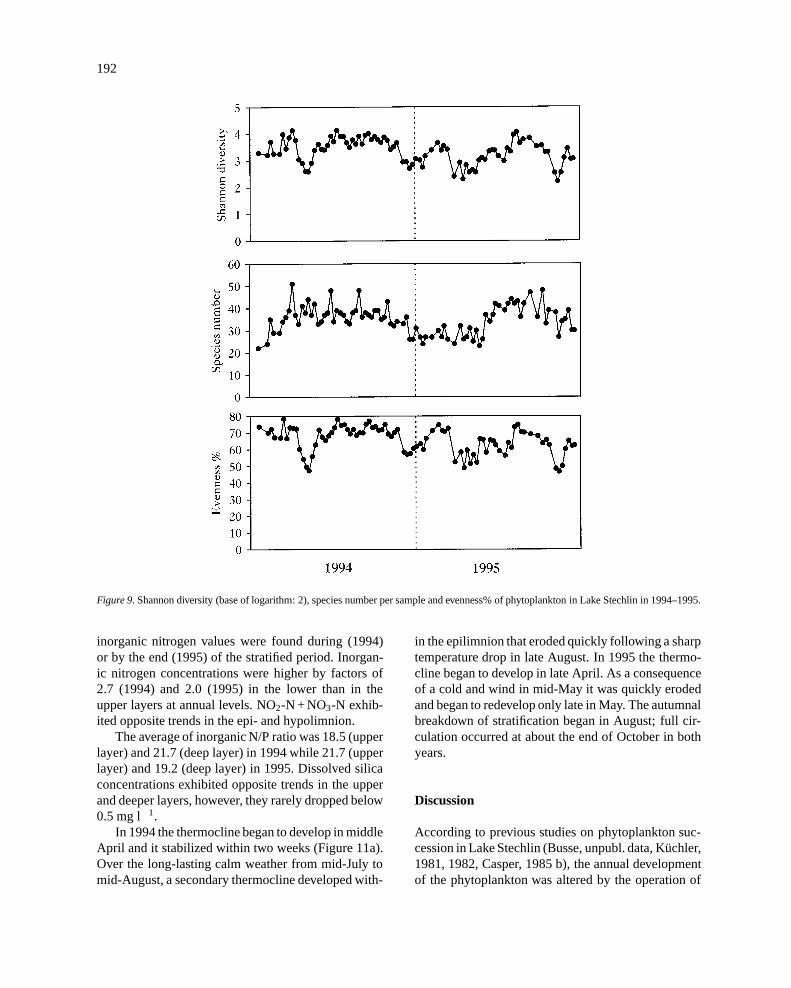
Phytoplankton diversity shows two annual mini-ma: the first occurs after the spring biomass maximum,the second can be observed after the complete break-down of stratification (Figure 9). Over the study peri-od, diversity was found to correlate closely with even-ness (r = 0.93, n = 88, P<0.1%). Its correlation withspecies number was also significant (r = 0.53, n = 88,P< 0.1%).
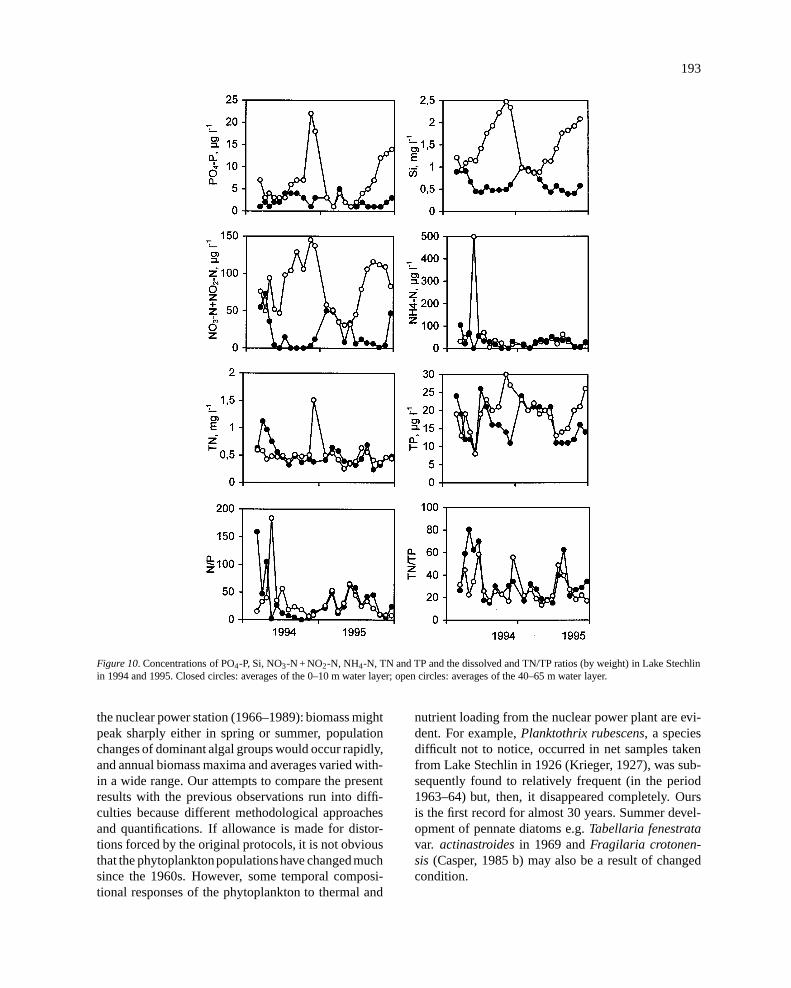
Concentrations of PO4-P in the upper 10-m waterlayer was below the level (< 5 �g l�1) that is consid-ered analytically detectable (Figure 10). That was alsothe case in the water layer deeper than 40 m except thelate autumn and winter months (November–January)when maxima of 16.5�g l�1 (1994) and 10�g l�1
(1995) were measured. On an annual basis, PO4-Pconcentrations in the deeper layer exceeded those inupper layers by a factor of 2.3 in both years.
Concentrations of inorganic N-forms (= NO2-N +NO3-N + NH4-N) in the upper 10-m water layer werebelow 100�g N l�1 except a short period in March–April 1994. In water layers deeper than 40 m, higher
hydrma27.tex; 7/08/1998; 1:52; v.5; p.13
192
Figure 9. Shannon diversity (base of logarithm: 2), species number per sample and evenness% of phytoplankton in Lake Stechlin in 1994–1995.
inorganic nitrogen values were found during (1994)or by the end (1995) of the stratified period. Inorgan-ic nitrogen concentrations were higher by factors of2.7 (1994) and 2.0 (1995) in the lower than in theupper layers at annual levels. NO2-N + NO3-N exhib-ited opposite trends in the epi- and hypolimnion.
The average of inorganic N/P ratio was 18.5 (upperlayer) and 21.7 (deep layer) in 1994 while 21.7 (upperlayer) and 19.2 (deep layer) in 1995. Dissolved silicaconcentrations exhibited opposite trends in the upperand deeper layers, however, they rarely dropped below0.5 mg l�1.
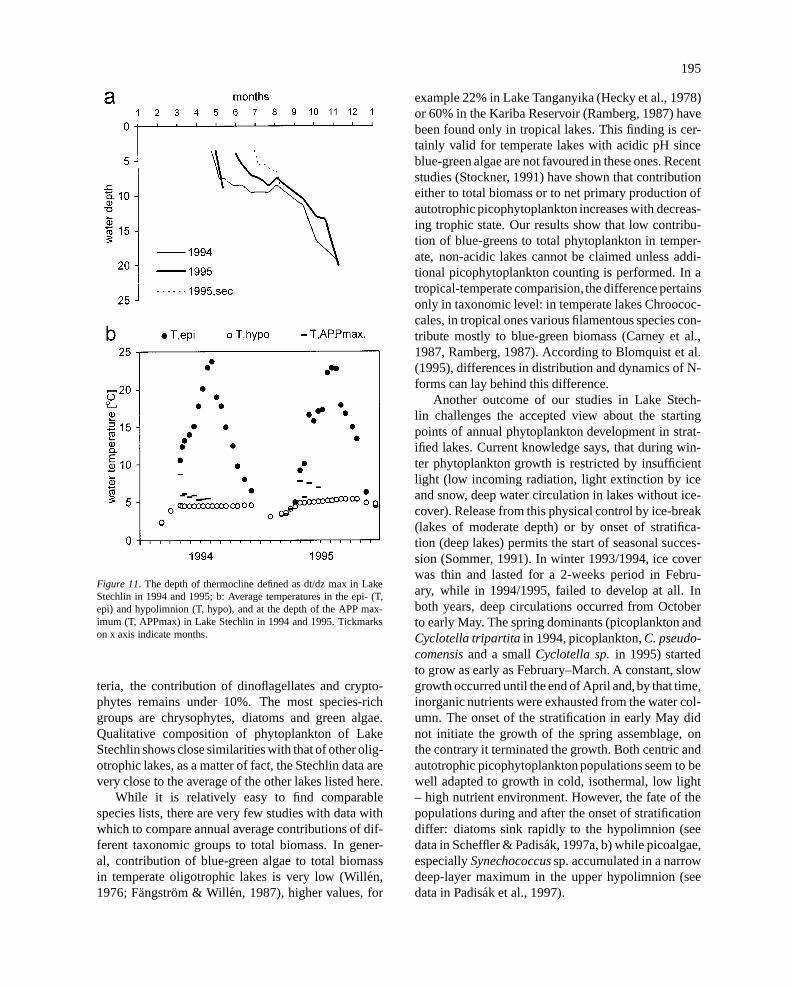
In 1994 the thermocline began to develop in middleApril and it stabilized within two weeks (Figure 11a).Over the long-lasting calm weather from mid-July tomid-August, a secondary thermocline developed with-
in the epilimnion that eroded quickly following a sharptemperature drop in late August. In 1995 the thermo-cline began to develop in late April. As a consequenceof a cold and wind in mid-May it was quickly erodedand began to redevelop only late in May. The autumnalbreakdown of stratification began in August; full cir-culation occurred at about the end of October in bothyears.
Discussion
According to previous studies on phytoplankton suc-cession in Lake Stechlin (Busse, unpubl. data, Kuchler,1981, 1982, Casper, 1985 b), the annual developmentof the phytoplankton was altered by the operation of
hydrma27.tex; 7/08/1998; 1:52; v.5; p.14
193
Figure 10. Concentrations of PO4-P, Si, NO3-N + NO2-N, NH4-N, TN and TP and the dissolved and TN/TP ratios (by weight) in Lake Stechlinin 1994 and 1995. Closed circles: averages of the 0–10 m water layer; open circles: averages of the 40–65 m water layer.
the nuclear power station (1966–1989): biomass mightpeak sharply either in spring or summer, populationchanges of dominant algal groups would occur rapidly,and annual biomass maxima and averages varied with-in a wide range. Our attempts to compare the presentresults with the previous observations run into diffi-culties because different methodological approachesand quantifications. If allowance is made for distor-tions forced by the original protocols, it is not obviousthat the phytoplanktonpopulationshave changedmuchsince the 1960s. However, some temporal composi-tional responses of the phytoplankton to thermal and
nutrient loading from the nuclear power plant are evi-dent. For example,Planktothrix rubescens, a speciesdifficult not to notice, occurred in net samples takenfrom Lake Stechlin in 1926 (Krieger, 1927), was sub-sequently found to relatively frequent (in the period1963–64) but, then, it disappeared completely. Oursis the first record for almost 30 years. Summer devel-opment of pennate diatoms e.g.Tabellaria fenestratavar. actinastroidesin 1969 andFragilaria crotonen-sis (Casper, 1985 b) may also be a result of changedcondition.
hydrma27.tex; 7/08/1998; 1:52; v.5; p.15
194
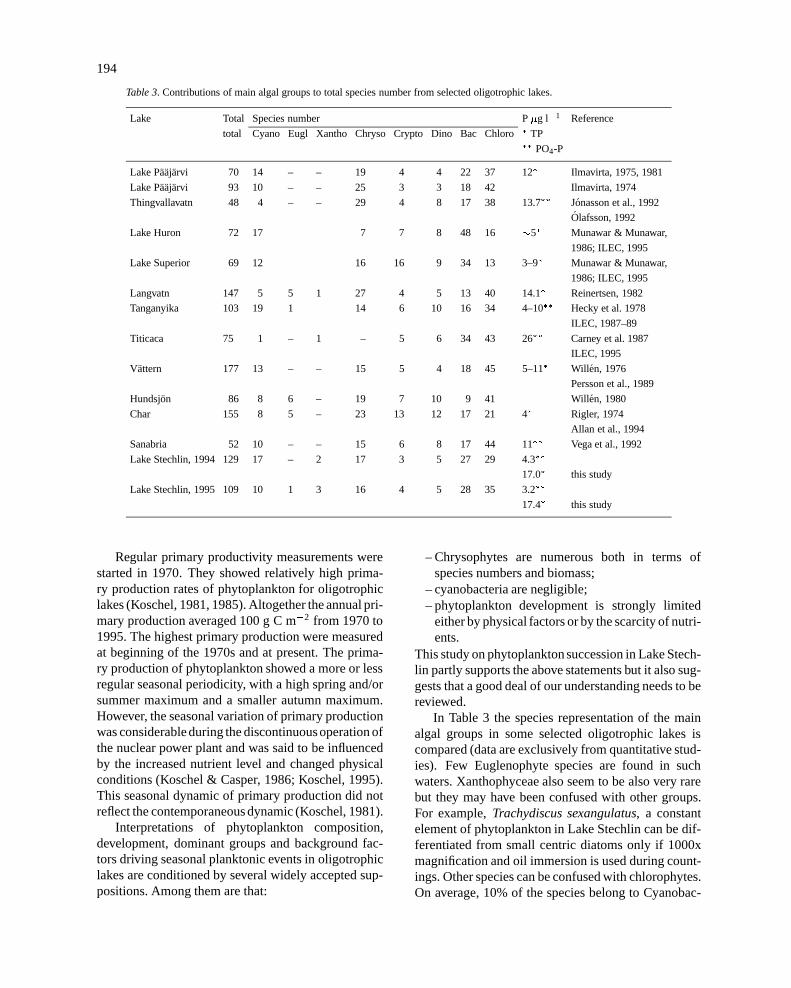
Table 3. Contributions of main algal groups to total species number from selected oligotrophic lakes.
Lake Total Species number P�g l�1 Reference
total Cyano Eugl Xantho Chryso Crypto Dino Bac Chloro� TP�� PO4-P
Lake Paajarvi 70 14 – – 19 4 4 22 37 12� Ilmavirta, 1975, 1981
Lake Paajarvi 93 10 – – 25 3 3 18 42 Ilmavirta, 1974
Thingvallavatn 48 4 – – 29 4 8 17 38 13.7�� Jonasson et al., 1992
Olafsson, 1992
Lake Huron 72 17 7 7 8 48 16 �5� Munawar & Munawar,
1986; ILEC, 1995
Lake Superior 69 12 16 16 9 34 13 3–9� Munawar & Munawar,
1986; ILEC, 1995
Langvatn 147 5 5 1 27 4 5 13 40 14.1� Reinertsen, 1982
Tanganyika 103 19 1 14 6 10 16 34 4–10�� Hecky et al. 1978
ILEC, 1987–89
Titicaca 75 1 – 1 – 5 6 34 43 26�� Carney et al. 1987
ILEC, 1995
Vattern 177 13 – – 15 5 4 18 45 5–11� Will en, 1976
Persson et al., 1989
Hundsjon 86 8 6 – 19 7 10 9 41 Willen, 1980
Char 155 8 5 – 23 13 12 17 21 4� Rigler, 1974
Allan et al., 1994
Sanabria 52 10 – – 15 6 8 17 44 11�� Vega et al., 1992
Lake Stechlin, 1994 129 17 – 2 17 3 5 27 29 4.3��
17.0� this study
Lake Stechlin, 1995 109 10 1 3 16 4 5 28 35 3.2��
17.4� this study
Regular primary productivity measurements werestarted in 1970. They showed relatively high prima-ry production rates of phytoplankton for oligotrophiclakes (Koschel, 1981, 1985). Altogether the annual pri-mary production averaged 100 g C m�2 from 1970 to1995. The highest primary production were measuredat beginning of the 1970s and at present. The prima-ry production of phytoplankton showed a more or lessregular seasonal periodicity, with a high spring and/orsummer maximum and a smaller autumn maximum.However, the seasonal variation of primary productionwas considerableduring the discontinuousoperation ofthe nuclear power plant and was said to be influencedby the increased nutrient level and changed physicalconditions (Koschel & Casper, 1986; Koschel, 1995).This seasonal dynamic of primary production did notreflect the contemporaneous dynamic (Koschel, 1981).
Interpretations of phytoplankton composition,development, dominant groups and background fac-tors driving seasonal planktonic events in oligotrophiclakes are conditioned by several widely accepted sup-positions. Among them are that:
– Chrysophytes are numerous both in terms ofspecies numbers and biomass;
– cyanobacteria are negligible;– phytoplankton development is strongly limited
either by physical factors or by the scarcity of nutri-ents.
This study on phytoplanktonsuccession in Lake Stech-lin partly supports the above statements but it also sug-gests that a good deal of our understanding needs to bereviewed.
In Table 3 the species representation of the mainalgal groups in some selected oligotrophic lakes iscompared (data are exclusively from quantitative stud-ies). Few Euglenophyte species are found in suchwaters. Xanthophyceae also seem to be also very rarebut they may have been confused with other groups.For example,Trachydiscus sexangulatus, a constantelement of phytoplankton in Lake Stechlin can be dif-ferentiated from small centric diatoms only if 1000xmagnification and oil immersion is used during count-ings. Other species can be confused with chlorophytes.On average, 10% of the species belong to Cyanobac-
hydrma27.tex; 7/08/1998; 1:52; v.5; p.16
195
Figure 11. The depth of thermocline defined as dt/dz max in LakeStechlin in 1994 and 1995; b: Average temperatures in the epi- (T,epi) and hypolimnion (T, hypo), and at the depth of the APP max-imum (T, APPmax) in Lake Stechlin in 1994 and 1995. Tickmarkson x axis indicate months.
teria, the contribution of dinoflagellates and crypto-phytes remains under 10%. The most species-richgroups are chrysophytes, diatoms and green algae.Qualitative composition of phytoplankton of LakeStechlin shows close similarities with that of other olig-otrophic lakes, as a matter of fact, the Stechlin data arevery close to the average of the other lakes listed here.
While it is relatively easy to find comparablespecies lists, there are very few studies with data withwhich to compare annual average contributions of dif-ferent taxonomic groups to total biomass. In gener-al, contribution of blue-green algae to total biomassin temperate oligotrophic lakes is very low (Willen,1976; Fangstrom & Will en, 1987), higher values, for
example 22% in Lake Tanganyika (Hecky et al., 1978)or 60% in the Kariba Reservoir (Ramberg, 1987) havebeen found only in tropical lakes. This finding is cer-tainly valid for temperate lakes with acidic pH sinceblue-green algae are not favoured in these ones. Recentstudies (Stockner, 1991) have shown that contributioneither to total biomass or to net primary production ofautotrophic picophytoplankton increases with decreas-ing trophic state. Our results show that low contribu-tion of blue-greens to total phytoplankton in temper-ate, non-acidic lakes cannot be claimed unless addi-tional picophytoplankton counting is performed. In atropical-temperate comparision, the difference pertainsonly in taxonomic level: in temperate lakes Chroococ-cales, in tropical ones various filamentous species con-tribute mostly to blue-green biomass (Carney et al.,1987, Ramberg, 1987). According to Blomquist et al.(1995), differences in distribution and dynamics of N-forms can lay behind this difference.
Another outcome of our studies in Lake Stech-lin challenges the accepted view about the startingpoints of annual phytoplankton development in strat-ified lakes. Current knowledge says, that during win-ter phytoplankton growth is restricted by insufficientlight (low incoming radiation, light extinction by iceand snow, deep water circulation in lakes without ice-cover). Release from this physical control by ice-break(lakes of moderate depth) or by onset of stratifica-tion (deep lakes) permits the start of seasonal succes-sion (Sommer, 1991). In winter 1993/1994, ice coverwas thin and lasted for a 2-weeks period in Febru-ary, while in 1994/1995, failed to develop at all. Inboth years, deep circulations occurred from Octoberto early May. The spring dominants (picoplankton andCyclotella tripartitain 1994, picoplankton,C. pseudo-comensisand a smallCyclotella sp.in 1995) startedto grow as early as February–March. A constant, slowgrowth occurred until the end of April and,by that time,inorganic nutrients were exhausted from the water col-umn. The onset of the stratification in early May didnot initiate the growth of the spring assemblage, onthe contrary it terminated the growth. Both centric andautotrophic picophytoplankton populations seem to bewell adapted to growth in cold, isothermal, low light– high nutrient environment. However, the fate of thepopulations during and after the onset of stratificationdiffer: diatoms sink rapidly to the hypolimnion (seedata in Scheffler & Padisak, 1997a, b) while picoalgae,especiallySynechococcussp. accumulated in a narrowdeep-layer maximum in the upper hypolimnion (seedata in Padisak et al., 1997).
hydrma27.tex; 7/08/1998; 1:52; v.5; p.17
196
The 1995/1996 winter was very cold, ice coverlasted from early December to mid-April. Under 45 cmice + 20 cm snow cover in February considerable popu-lation increase of the rare diatom,Stephanocostis chan-taicuswas observed (Scheffler & Padisak, in press, b)indicating that neither deep circulations nor increasedlight extinction by ice and snow cover prevents growthof specially adapted species. These records togetherwith other, quite recent ones (Wiedner & Nixdorf, thisvolume) call the attention to the importance of phyto-plankton studies in winter periods. In general, our viewof the ‘vegetation period’ in phytoplankton may needto be modified.
References
Allan, R. J., M. Dickmann, C. B. Gray & V. Cromie, 1994. The bookof Canadian lakes. The Canadian Association on Water Quality,Monogr. ser. 3: 563–570.
Blomquist, P., A. Pettersson & P. Hyenstrand, 1995. Ammonium-nitrogen: a key regulatory factor causing dominance of non-nitrogen-fixing cyanobacteria in aquatic systems. Arch. Hydro-biol. 132: 141–164.
Carney, H. J., P. J. Richerson & P. Eloranta, 1987. Lake Titicaca(Peru/Bolivia) phytoplankton: Species composition and struc-tural comparison with other tropical and temparate lakes. Arch.Hydrobiol. 110: 365–385.
Casper, S. J. (ed.), 1985a. Lake Stechlin. A temperate oligotrophiclake. Dr. W. Junk Publ., Dordrecht, Boston, Lancaster.
Casper, S. J., 1985b. The phytoplankton. In Casper, S.J. (ed), 1985a.Lake Stechlin. A temperate oligotrophic lake. Dr. W. Junk Publ.,Dordrecht, Boston, Lancaster: 157–195.
Casper, P. & R. Koschel, 1995. Description of Lake Stechlin. Lim-nologica, Berlin 25: 281–284.
Fangstrom, I. & E. Willen, 1987. Clustering and canonical cor-respondence analysis of phytoplankton and environmental vari-ables. Vegetatio 71: 87–95.
Hamilton, P. B. 1990. The revised edition of a computerized planktoncounter for plankton, periphyton and sediment analyses. Hydro-biologia 194: 23–30.
Hecky, R. E., E. J. Fee, H. Kling & J. W. Rudd, 1978. Studies onthe planktonic ecology of Lake Tanganyika. Can. Fish. mar. Serv.tech. Rep. 816, 51 pp.
ILEC, 1987–1989. Data book of world lake environments – a surveyof the state of world lakes. ILEC and UNEP, Otsu.
ILEC, 1995. Data book of world lake environments – a survey ofthe state of world lakes – 3. The Americas. ILEC and UNEP,Kusatsu.
Ilmavirta, V., 1974. Diel periodicity in the phytoplankton communityof the oligotrophic lake Paajarvi, southern Finland. I. Phytoplank-tonic primary production and related factors. Ann. Bot. Fenn. 11:136–177.
Ilmavirta, V., 1975. Diel periodicity of phytoplankton community ofthe oligotrophic Lake Paajarvi, southern Finland. II. Late summerphytoplanktonic biomass. Ann. Bot. Fenn. 12: 37–44.
Ilmavirta, V., 1981. The ecosystem of the oligotrophic Lake Paajarvi1. Lake basin and primary production. Verh. int. Ver. Limnol. 21:442–447.
Jonasson, P. M., H. Adalsteinsson & G. St. Jonasson, 1992. Produc-tion and nutrient supply of phytoplankton in subarctic, dimicticThingvallavatn, Iceland. Oikos 64: 162–187.
Koschel, R., 1981. Bilanz der Primarproduktion des Phytoplanktonsin den Gewassern des Stechlinseesystems. Limnologica, Berlin13: 55–81.
Koschel, R., 1985. The primary production of the phytoplankton. InCasper, S.J. (ed), 1985. Lake Stechlin: a temperate oligotrophiclake. Dr. W. Junk Publ., Dordrecht, Boston, Lancaster: 287–313.
Koschel, R., 1995. Manipulation of whole-lake ecosystems and long-term limnological observation in the Brandenburg-Mecklenburglake district, Germany. Int. Rev. ges. Hydrobiol. 80: 1–12.
Koschel, R. & J. Casper, 1986. Dieokologische Bedeutung desKernkraftwerkes I der DDR ‘Rheinsberg’ fur den Stechlin. Biol.Rundschau 24: 179–195.
Koschel, R., Mothes, G. & Casper, S. J., 1985. The nuclear powerplant and its role in the life of Lake Stechlin. In Casper, S.J. (ed),1985. Lake Stechlin: a temperate oligotrophic lake. Dr. W. JunkPubl.,Dordrecht, Boston, Lancaster: 419–432.
Krieger, 1927. Die GattungCentronellaVoigt. Ber. Deutsch. Bot.Ges. 45: 281–290.
Krienitz, L. & W. Scheffler, 1994. The Selenastraceae of theoligotrophic Lake Stechlin (Brandenburg, Germany). Biologia,Bratislava, 49: 463–471.
Kuchler, L., 1981. Phytoplanktonuntersuchungen im Stechlinseege-biet in den Jahren 1973–1975. Limnologica, Berlin 13: 83–99.
Kuchler, L., 1982. Phytoplanktonuntersuchungen im Stechlin undim Nordbecken des Nehmitzsees. Limnologica, Berlin 14: 231–241.
Mothes, G., Koschel, R. & Proft, G., 1985. The chemical envi-ronment. In Casper, S.J. (ed), 1985. Lake Stechlin: a temperateoligotrophic lake. Dr. W. Junk Publ., Dordrecht, Boston, Lan-caster, 87–128.
Munawar, M. & I. F. Munawar, 1986. The seasonality of phytoplank-ton in the North American Great Lakes, a comparative synthesis.Hydrobiologia 138: 85–116.
Olafsson, J., 1992. Chemical characteristics and trace elements ofThingvallavatn. OIKOS 64: 151–161.
Padisak, J., R. Koschel, L. Krienitz & J. Nedoma, 1997. Deep lay-er autotrophic picophytoplankton maximum in the oligotrophicStechlinsee, Germany: origin, activity, development and erosion.European J. Phycol. 32: 403–416.
Persson, G., H. Olsson, T. Wiederholm & E. Willen, 1989. LakeVattern, Sweden: A 20-year perspective. Ambio 18: 208–218.
Ramberg, L., 1987. Phytoplankton succession in the Sanyati basin,Lake Kariba. Hydrobiologia 153: 193–202.
Reinertsen, H., 1982. The effect of nutrient addition on the phyto-plankton community of an oligotrophic lake. Holarctic Ecol. 5:225–252.
Rigler, 1974. Char Lake Project. PF-2. Final Report. Can. Comm.Int. Biol. Progr., Toronto, 96 pp.
Scheffler, W., 1994.Cyclotella pseudocomensisnov. spec. (Bacillar-iophyceae) aus norddeutschen Seen. Diatom Res. 9: 355–369.
Scheffler, W. & J. Padisak, 1997a.Cyclotella tripartita (Bacillar-iophyceae), a dominant species in the oligotrophic Stechlinsee(Germany). Nova Hedw. 65: 221–232.
Scheffler, W. & J. Padisak, 1997b.Cyclotella tripartita, eine furDeutschland neue Diatomee des Planktons. DGL Jahrestagung,Wissenschaftliche Kurzreferaten, Schwedt/Oder, Germany, 16–20 September, 1996.
Sieburth, J. M., V. Smetacek & J. Lenz. 1978. Pelagic ecosystemstructure: heterotrophic compartments of the plankton and theirrelationship to plankton size fractionation. Limnol. Oceanogr. 23:1256–1263.
hydrma27.tex; 7/08/1998; 1:52; v.5; p.18
197
Sommer, U., 1991. Phytoplankton: directional succession and forcedcycles. In Remmert, H. (ed), The Mosaic-Cycle Concept ofEcosystems, Springer Verlag, Berlin: 132–146.
Søndergaard, M., 1991. Phototropic picoplankton in temperate lakes:seasonal abundance and importance along trophic gradient. Int.Rev. ges. Hydrobiol. 76: 502–522.
Stockner, J. C., 1991. Autotrophic picoplankton in freshwater envi-ronments: the view from the summit. Int. Rev. ges. Hydrobiol.76: 483–492.
Vega, J. C., C. de Hoyos & J. J. Aldasoro, 1992. The Sanabria lake.The largest natural freshwater lake in Spain. Limnetica 8: 49–57.
Wiedner, C. & B. Nixdorf, 1997. Success of chrysophytes, cryp-tophytes and dinoflagellates over blue-greens (cyanobacteria)during an extreme winter (1995/96) in eutrophic shallow lakes.Hydrobiologia 369/370: 229–235.
Will en, E., 1976. Phytoplankton in L. Hjalmaren. Acta Univ. Upsal.378: 1–18.
Will en, T., 1980. Phytoplankton from Swedish lakes, 3. Lake Hund-sjon and other kettle lakes of central Sweden. Arch. Hydrobiol.89: 135–159.
hydrma27.tex; 7/08/1998; 1:52; v.5; p.19