physics of ball sports - · pdf filebeach volley, football/soccer, golf, handball, hockey,...
TRANSCRIPT
13
FEATURES
EPN 47/3
PHYSICS OF BALL SPORTS l C.Cohen1 and C.Clanet2 – DOI: http://dx.doi.org/10.1051/epn/2016301
l 1 Paris Diderot University, Paris, France and 2 Ecole Polytechnique, Palaiseau, France
Ball sports have been part of human history for thousands of years [1]. Nowadays, 13 of them are part of the Olympic games (badminton, basketball, beach volley, football/soccer, golf, handball, hockey, rugby, table tennis, tennis, volleyball, water polo, ice hockey). All these games differ by launcher (hand, club, racket, bat), ball (size, shape and mass), pitch size and number of players. These differences induce different ball velocities. Apart from the velocities and the way to maximize them, we discuss in this article the ball trajectories and their impact on the size of sports fields.
EPN 47/3
PHySICS OF bALL SPORTSFEATURES
14
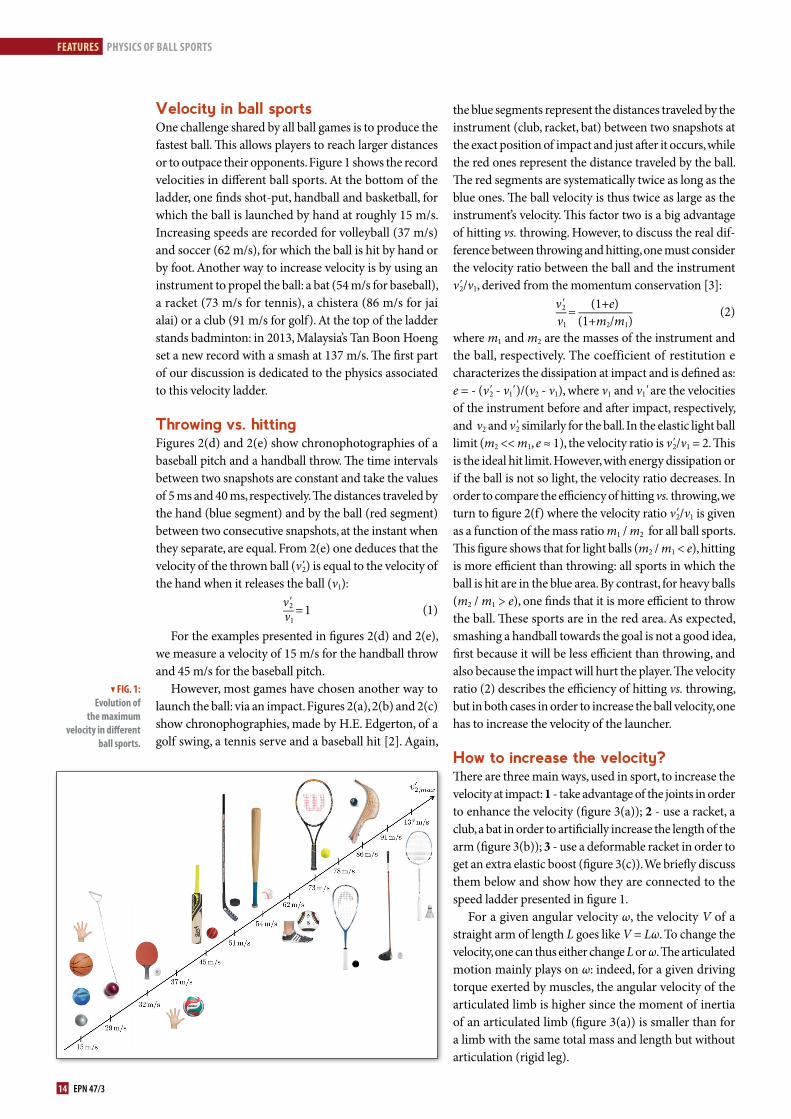
Velocity in ball sportsOne challenge shared by all ball games is to produce the fastest ball. This allows players to reach larger distances or to outpace their opponents. Figure 1 shows the record velocities in different ball sports. At the bottom of the ladder, one finds shot-put, handball and basketball, for which the ball is launched by hand at roughly 15 m/s. Increasing speeds are recorded for volleyball (37 m/s) and soccer (62 m/s), for which the ball is hit by hand or by foot. Another way to increase velocity is by using an instrument to propel the ball: a bat (54 m/s for baseball), a racket (73 m/s for tennis), a chistera (86 m/s for jai alai) or a club (91 m/s for golf). At the top of the ladder stands badminton: in 2013, Malaysia’s Tan Boon Hoeng set a new record with a smash at 137 m/s. The first part of our discussion is dedicated to the physics associated to this velocity ladder.
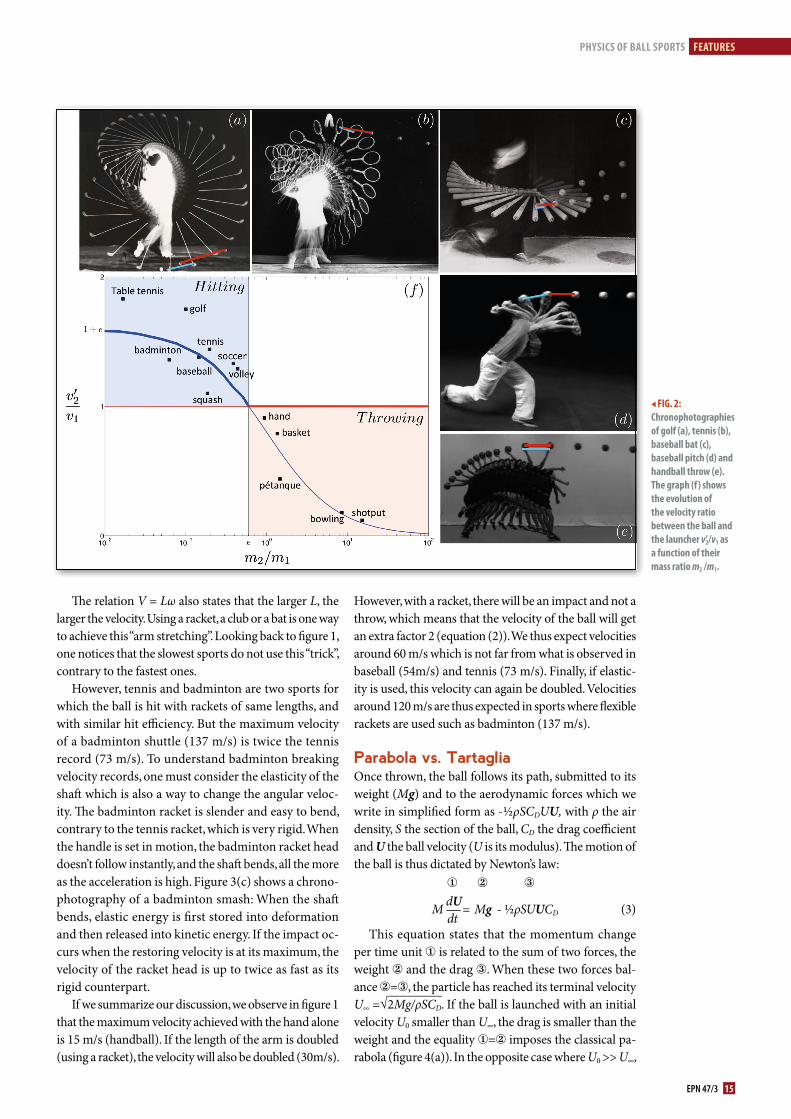
Throwing vs. hittingFigures 2(d) and 2(e) show chronophotographies of a baseball pitch and a handball throw. The time intervals between two snapshots are constant and take the values of 5 ms and 40 ms, respectively. The distances traveled by the hand (blue segment) and by the ball (red segment) between two consecutive snapshots, at the instant when they separate, are equal. From 2(e) one deduces that the velocity of the thrown ball (ν'2) is equal to the velocity of the hand when it releases the ball (ν1):
ν'2—ν1 = 1 (1)
For the examples presented in figures 2(d) and 2(e), we measure a velocity of 15 m/s for the handball throw and 45 m/s for the baseball pitch.
However, most games have chosen another way to launch the ball: via an impact. Figures 2(a), 2(b) and 2(c) show chronophographies, made by H.E. Edgerton, of a golf swing, a tennis serve and a baseball hit [2]. Again,
the blue segments represent the distances traveled by the instrument (club, racket, bat) between two snapshots at the exact position of impact and just after it occurs, while the red ones represent the distance traveled by the ball. The red segments are systematically twice as long as the blue ones. The ball velocity is thus twice as large as the instrument’s velocity. This factor two is a big advantage of hitting vs. throwing. However, to discuss the real dif-ference between throwing and hitting, one must consider the velocity ratio between the ball and the instrument ν'2/ν1, derived from the momentum conservation [3]:
ν'2—ν1
= (1+e) —(1+m2/m1)
(2)
where m1 and m2 are the masses of the instrument and the ball, respectively. The coefficient of restitution e characterizes the dissipation at impact and is defined as: e = - (ν'2 - ν1' )/(ν2 - ν1), where ν1 and ν1' are the velocities of the instrument before and after impact, respectively, and ν2 and ν'2 similarly for the ball. In the elastic light ball limit (m2 << m1, e ≈ 1), the velocity ratio is ν'2/ν1 = 2. This is the ideal hit limit. However, with energy dissipation or if the ball is not so light, the velocity ratio decreases. In order to compare the efficiency of hitting vs. throwing, we turn to figure 2(f) where the velocity ratio ν'2/ν1 is given as a function of the mass ratio m1 / m2 for all ball sports. This figure shows that for light balls (m2 / m1 < e), hitting is more efficient than throwing: all sports in which the ball is hit are in the blue area. By contrast, for heavy balls (m2 / m1 > e), one finds that it is more efficient to throw the ball. These sports are in the red area. As expected, smashing a handball towards the goal is not a good idea, first because it will be less efficient than throwing, and also because the impact will hurt the player. The velocity ratio (2) describes the efficiency of hitting vs. throwing, but in both cases in order to increase the ball velocity, one has to increase the velocity of the launcher.
How to increase the velocity?There are three main ways, used in sport, to increase the velocity at impact: 1 - take advantage of the joints in order to enhance the velocity (figure 3(a)); 2 - use a racket, a club, a bat in order to artificially increase the length of the arm (figure 3(b)); 3 - use a deformable racket in order to get an extra elastic boost (figure 3(c)). We briefly discuss them below and show how they are connected to the speed ladder presented in figure 1.
For a given angular velocity ω, the velocity V of a straight arm of length L goes like V = Lω. To change the velocity, one can thus either change L or ω. The articulated motion mainly plays on ω: indeed, for a given driving torque exerted by muscles, the angular velocity of the articulated limb is higher since the moment of inertia of an articulated limb (figure 3(a)) is smaller than for a limb with the same total mass and length but without articulation (rigid leg).
. FIG. 1: Evolution of
the maximum velocity in different
ball sports.
EPN 47/3 15
PHySICS OF bALL SPORTS FEATURES
However, with a racket, there will be an impact and not a throw, which means that the velocity of the ball will get an extra factor 2 (equation (2)). We thus expect velocities around 60 m/s which is not far from what is observed in baseball (54m/s) and tennis (73 m/s). Finally, if elastic-ity is used, this velocity can again be doubled. Velocities around 120 m/s are thus expected in sports where flexible rackets are used such as badminton (137 m/s).
Parabola vs. TartagliaOnce thrown, the ball follows its path, submitted to its weight (Mg) and to the aerodynamic forces which we write in simplified form as -½ρSCDUU, with ρ the air density, S the section of the ball, CD the drag coefficient and U the ball velocity (U is its modulus). The motion of the ball is thus dictated by Newton’s law: ① ② ③
M dU—dt
= Mg - ½ρSUUCD (3)
This equation states that the momentum change per time unit ① is related to the sum of two forces, the weight ② and the drag ③. When these two forces bal-ance ②=③, the particle has reached its terminal velocity U∞ =√–
2Mg/ρSCD. If the ball is launched with an initial velocity U0 smaller than U∞, the drag is smaller than the weight and the equality ①=② imposes the classical pa-rabola (figure 4(a)). In the opposite case where U0 >> U∞,
The relation V = Lω also states that the larger L, the larger the velocity. Using a racket, a club or a bat is one way to achieve this “arm stretching”. Looking back to figure 1, one notices that the slowest sports do not use this “trick”, contrary to the fastest ones.
However, tennis and badminton are two sports for which the ball is hit with rackets of same lengths, and with similar hit efficiency. But the maximum velocity of a badminton shuttle (137 m/s) is twice the tennis record (73 m/s). To understand badminton breaking velocity records, one must consider the elasticity of the shaft which is also a way to change the angular veloc-ity. The badminton racket is slender and easy to bend, contrary to the tennis racket, which is very rigid. When the handle is set in motion, the badminton racket head doesn’t follow instantly, and the shaft bends, all the more as the acceleration is high. Figure 3(c) shows a chrono-photography of a badminton smash: When the shaft bends, elastic energy is first stored into deformation and then released into kinetic energy. If the impact oc-curs when the restoring velocity is at its maximum, the velocity of the racket head is up to twice as fast as its rigid counterpart.
If we summarize our discussion, we observe in figure 1 that the maximum velocity achieved with the hand alone is 15 m/s (handball). If the length of the arm is doubled (using a racket), the velocity will also be doubled (30m/s).
b FIG. 2: Chronophotographies of golf (a), tennis (b), baseball bat (c), baseball pitch (d) and handball throw (e). The graph (f) shows the evolution of the velocity ratio between the ball and the launcher ν'2/ν1 as a function of their mass ratio m2 /m1.
EPN 47/3
PHySICS OF bALL SPORTSFEATURES
16
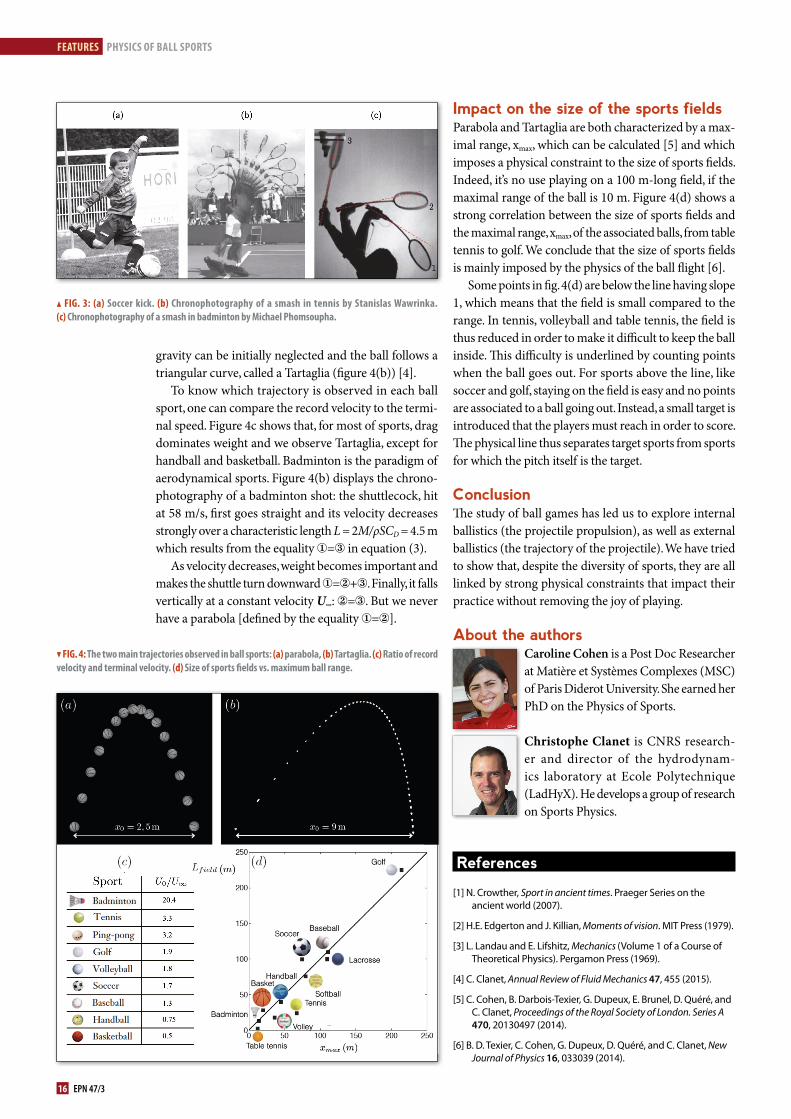
Impact on the size of the sports fieldsParabola and Tartaglia are both characterized by a max-imal range, xmax, which can be calculated [5] and which imposes a physical constraint to the size of sports fields. Indeed, it’s no use playing on a 100 m-long field, if the maximal range of the ball is 10 m. Figure 4(d) shows a strong correlation between the size of sports fields and the maximal range, xmax, of the associated balls, from table tennis to golf. We conclude that the size of sports fields is mainly imposed by the physics of the ball flight [6].
Some points in fig. 4(d) are below the line having slope 1, which means that the field is small compared to the range. In tennis, volleyball and table tennis, the field is thus reduced in order to make it difficult to keep the ball inside. This difficulty is underlined by counting points when the ball goes out. For sports above the line, like soccer and golf, staying on the field is easy and no points are associated to a ball going out. Instead, a small target is introduced that the players must reach in order to score. The physical line thus separates target sports from sports for which the pitch itself is the target.
ConclusionThe study of ball games has led us to explore internal ballistics (the projectile propulsion), as well as external ballistics (the trajectory of the projectile). We have tried to show that, despite the diversity of sports, they are all linked by strong physical constraints that impact their practice without removing the joy of playing.
About the authorsCaroline Cohen is a Post Doc Researcher at Matière et Systèmes Complexes (MSC) of Paris Diderot University. She earned her PhD on the Physics of Sports.
Christophe Clanet is CNRS research-er and director of the hydrodynam-ics laboratory at Ecole Polytechnique (LadHyX). He develops a group of research on Sports Physics.
References
[1] N. Crowther, Sport in ancient times. Praeger Series on the ancient world (2007).
[2] H.E. Edgerton and J. Killian, Moments of vision. MIT Press (1979).
[3] L. Landau and E. Lifshitz, Mechanics (Volume 1 of a Course of Theoretical Physics). Pergamon Press (1969).
[4] C. Clanet, Annual Review of Fluid Mechanics 47, 455 (2015).
[5] C. Cohen, B. Darbois-Texier, G. Dupeux, E. Brunel, D. Quéré, and C. Clanet, Proceedings of the Royal Society of London. Series A 470, 20130497 (2014).
[6] B. D. Texier, C. Cohen, G. Dupeux, D. Quéré, and C. Clanet, New Journal of Physics 16, 033039 (2014).
gravity can be initially neglected and the ball follows a triangular curve, called a Tartaglia (figure 4(b)) [4].
To know which trajectory is observed in each ball sport, one can compare the record velocity to the termi-nal speed. Figure 4c shows that, for most of sports, drag dominates weight and we observe Tartaglia, except for handball and basketball. Badminton is the paradigm of aerodynamical sports. Figure 4(b) displays the chrono-photography of a badminton shot: the shuttlecock, hit at 58 m/s, first goes straight and its velocity decreases strongly over a characteristic length L = 2M/ρSCD = 4.5 m which results from the equality ①=③ in equation (3).
As velocity decreases, weight becomes important and makes the shuttle turn downward ①=②+③. Finally, it falls vertically at a constant velocity U∞: ②=③. But we never have a parabola [defined by the equality ①=②].
m FIG. 3: (a) Soccer kick. (b) Chronophotography of a smash in tennis by Stanislas Wawrinka. (c) Chronophotography of a smash in badminton by Michael Phomsoupha.
. FIG. 4: The two main trajectories observed in ball sports: (a) parabola, (b) Tartaglia. (c) Ratio of record velocity and terminal velocity. (d) Size of sports fields vs. maximum ball range.