physicochemical characterization of chitin and chitosan ... knidri.pdf · the morphology of chitin...
TRANSCRIPT

EL Knidri et al., JMES, 2017, 8 (10), pp. 3648-3653 3648
1. Introduction
The maritime industry is one of the most important and modern sectors in Morocco, it’s an essential economic
activity which constitutes a real development lever for the country, but it generate several tons of unusable and
hazardous wastes for the environment.
The valorization of maritime wastes, especially those of crustaceans, is the best solution to deal with this
problem; they can be used as raw matter to produce biomaterials, mainly chitin and chitosan.
Chitin is one of the most abundant biopolymers in nature after cellulose [1,2]; it is obtained in industrial scale
from shrimps, crabs and crustaceans in general, it is also present, with small quantities, in some insects, green
algae, fungi and yeast[3–5].
Chitosan is the most important derivative of chitin after deacetylation. The major procedure for obtaining
chitosan is based on the alkaline deacetylation of chitin with alkaline solution.
Structurally, chitosan is a straight-chain polymer of glucosamine and N-acetylglucosamine[4].
This polymer is biodegradable, biocompatible and could assist in the reduction of pollutants in residual waters
by chelating with heavy metallic ions, by adsorption of industrial dyes and pesticide[6–9], such as several
natural adsorbents, like clay in tubular membrane[10].This biopolymer has a wide range of applications in the
medical field, cosmetic, in the food industry and especially in the wastewater treatment [11,12].
The main objectives of the present work were to valorize the waste from the maritime processing industry and to
produce chitin and chitosan from Moroccan shrimp shell wastes.
The extraction process of this polymer was carried out in three main steps: demineralization, deproteinization
and deacetylation, and the final product were characterized by fourier transform infrared spectroscopy FTIR, x-
ray diffraction XRD and scanning electron microscopy SEM.
Journal of materials and Environmental Sciences ISSN : 2028-2508
Copyright © 2017,
University of Mohammed Premier Oujda
Morocco
Physicochemical Characterization of Chitin and Chitosan Producted from
Parapenaeus Longirostris Shrimp Shell Wastes
H. EL Knidri*, R. Belaabed*, R. El khalfaouy*, A. Laajeb*, A. Addaou*, A. Lahsini*
*Catalysis, Materials and Environment Laboratory, Sidi Mohamed Ben Abdellah University, Fez, Morocco
Address:Higher School of Technology BP 2427 Road Imouzzer 30000 Fez
Abstract
In this study, chitin was extracted from Parapenaeus Longirostris shrimp
shell wastes using a chemical procedure, sodium hydroxide and hydrochloric
acid solutions were used for deproteination and demineralization, respectively.
However, the chitin is not widely used for industrial application because it is
insoluble in many solvents. Chitosan, a soluble biopolymer under acidic
conditions, was extracted by deacetylation of chitin in alkaline treatment with
50% (w/v). The results of this study indicate that the shrimp shells are a rich
source of chitin. The extracted chitosan exhibited a higher degree of
deacetylation and a higher crystallinity index.The degree of deacetylation was
calculated by the titration method and infrared spectroscopy, the samples
obtained were characterized by fourier transform infrared spectroscopy FTIR,
x-ray diffraction XRD and scanning electron microscopy SEM.
Received 23 Feb 2017,
Revised 22 May 2017,
Accepted 26 May 2017
Keywords
Waste,
Valorization,
Chitin,
Chitosan,
Caracterization.
ma
Phone: +212671553908
Journal of Materials and Environmental Sciences ISSN : 2028-2508
Copyright © 2017,
University of Mohammed Premier
Oujda Morocco
JMES, 2017 Volume 8, Issue 10, Page 3648-3653
http://www.jmaterenvironsci.com/

EL Knidri et al., JMES, 2017, 8 (10), pp. 3648-3653 3649
2. Experimental
2.1. Material
All of the reagents used were of a highly pure grade, and the ultra-pure water was used for preparation of all
solution. In this study shrimp shells were obtained from a central market fish (Fez, Morocco) and all shells were
from a single species of shrimp (ParapenaeusLongirostris).
The hydrochloric acid HCl (37%), the potassium hydroxide (85%) and the sodium hydroxide (pellets, 97%)
were purchased from Sigma-Aldrich.
2.2. Methods
The shrimp (ParapenaeusLongirostris) shells were washed thoroughly with boiling water to eliminate the other
impurities, then they were rinsed with distilled water, and dried at 80oC overnight, and finally grinded to pass
through a sieve 200 µm.
The extraction of the chitosan was carried out in three steps: demineralization, deproteinization and
deacetylation.
Demineralization and deproteinization steps were carried out with 3M hydrochloric acid HCl solution at 75 oC
for 2h00 to remove the carbonate calcium CaCO3 and10% of sodium hydroxide solutionNaOH at 80oC for 2h00
to remove proteinrespectively.
The chitosan was prepared by alkali treatment of chitin using 50% (w/v) of NaOH solution at 100 oC for 2h30,
using a solid to solvent ratio of 1/20. The reactants were filtered, washed with deionized water to neutral pH and
dried overnight at 80 oC.The product obtained was designed by Chitosan CTS.
On the other hand, the deacetylation of chitin obtained was tested by microwave treatment at a power of 350W
using KOH solution at 50% (w/v). The product obtained was designed by Chitosan CS. Different contact times
(5, 15, 20 and 25 min) were used in order to produce chitosan with different degree of deacetylation.
2.3. Characterization
2.3.1. X-ray powder diffractometry XRD
The characterization of chitin and their corresponding chitosan was investigated using an x-ray diffractometer
(PANaltytical, model X’Pert Pro) operated at a voltage of 40 kV and 40 mA with Cu kα radiation at λ = 1.5406
A˚ between 2θ angles of 5o and 45
o.
The crystallinity index of the polymers was determined by dividing the area of the crystalline peaks by the total
area under the curve, according to the equation of [13]:
ICR = [(I110– Iam) / I110] x 100 (1)
Where I110 is the maximum intensity of the (110) diffraction peak at 2θ = 20° and Iam is that of the amorphous
diffraction signal at 2θ = 16°.
2.3.2. Scanning electron microscopy SEM
The surface morphology and the microstructure of chitin and chitosan were studied using scanning electron
microscopy, coupled with energy dispersive spectroscopy EDS, used to identify the elemental composition of
material.
2.3.3. Fourier transform infrared spectroscopy FTIR
Infra Red spectra of chitin and chitosan were performed using FTIR spectrophotometer (Bruker, Vertex 70), in
the range of 400–4000 cm-1
, using ATR mode of operation. 16 scans were accumulated at a resolution of 4 cm-1.
2.3.4. Determination of the deacetylation degree
2.3.4.1. FTIR spectroscopy method
The deacetylation degree is one of the most important chemical parameters capable of influencing the
performance of chitosan in many applications. FTIR spectroscopy was also used to estimate the deacetylation
degree of chitosan.
This technique require choosing an appropriate band measure (1320 cm-1), an appropriate reference band (1420
cm-1), and drawing a good base line, to measure the intensity of absorption. The DD% was calculated using the
equation of [14] :
A1320/A1420 = 0.3822 + 0.03133 DA (2)
Avec: DA = 100 – DD (3)
EL Knidri et al., JMES, 2017, 8 (10), pp. 3648-3653 3650
2.3.4.2. Conductometric titration Method
The degree of deacetylation DD% of chitosan was determined by the conductometric titration method. 100 mg
of chitosan were dissolved in 20 ml of 0.1 M HCl and after being diluted to 100 ml with ultrapure water, it was
titrated with 0.1M KOH according to Hussain, Iman, and Maji[15].
The standard titrant solution was added to chitosan solution gradually. Both the volume of KOH added and the
conductivity values of the solution were recorded. The values of conductance (mS.cm-1
) with the corresponding
KOH volumes were plotted in a graphic to find the linear variation before and after the equivalence point.
The differential volume (∆V) of alkali between first and second neutralization point corresponds to the acid
consumed by amino groups present in the chitosan. The deacetylation degree was calculated using equation:
𝐷𝐷𝐴 =203 × 𝑄
1 + 42 𝑄× 100 (4)
𝑄 =𝑁 × 𝑉2 − 𝑉1
𝑚 (5)
Where V1 and V2 are the volume of KOH used in the titration, m is the weight of chitosan and N is the
normality of KOH.
3. Results and discussion
The chitin was prepared by acid and alkaline treatments using 3M hydrochloric acid HCl solution and 10% of
sodium hydroxide solutionNaOH respectively. The yield of chitin was 86.28% in the total weight of the dried
ParapenaeusLongirostris shrimp shell wastes, and after N- acetylation the yield of chitosan CTS was 29.45%.
This result indicates that Moroccan shrimp shell waste is an important source for chitin, which was higher than
that obtained from crab shell which yielded 10% on dry weight basis according to Tolaimate et al.[16].
3.1. X-ray powder diffractometry XRD
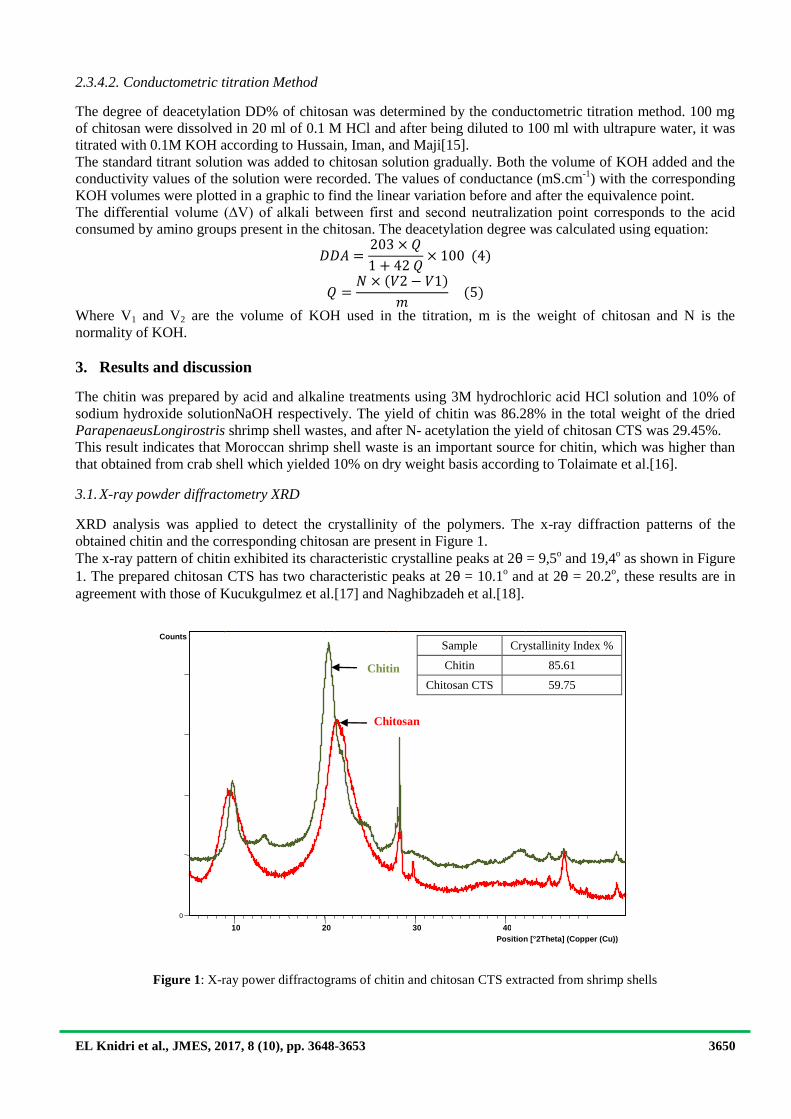
XRD analysis was applied to detect the crystallinity of the polymers. The x-ray diffraction patterns of the
obtained chitin and the corresponding chitosan are present in Figure 1.
The x-ray pattern of chitin exhibited its characteristic crystalline peaks at 2θ = 9,5o and 19,4
o as shown in Figure
1. The prepared chitosan CTS has two characteristic peaks at 2θ = 10.1o and at 2θ = 20.2
o, these results are in
agreement with those of Kucukgulmez et al.[17] and Naghibzadeh et al.[18].
Figure 1: X-ray power diffractograms of chitin and chitosan CTS extracted from shrimp shells
Position [°2Theta] (Copper (Cu)) 10 20 30 40
Counts
0
Chitin
Chitosan
CTS
Sample Crystallinity Index %
Chitin 85.61
Chitosan CTS 59.75

EL Knidri et al., JMES, 2017, 8 (10), pp. 3648-3653 3651
3.2. Scanning electron microscopy SEM
The morphology of chitin and chitosan CTS was studied by scanning electron microscopy. Figure 2 shows the
SEM photographs of chitin and chitosan CTS extracted from shrimp shell waste with different magnifications.
The extracted chitosan was observed to have layers of flakes, and porous could be seen on some areas, as in the
study of Kucukgulmez et al. [17].
Figure 2: SEM photographs of prepared chitin (A) and chitosan CTS (B)
3.3. Fourier transform infrared spectroscopy FTIR
FTIR spectroscopic analysis was used to determine the chemical structure of chitosan. The infrared spectrum for
produced chitosan CTS is shown in Figure 3.
Figure 3: FTIR spectrum of extracted chitosan CTS
According to this spectrum, the band at 3357-3290 cm-1
could be assigned to ν (N-H), ν (O-H) and ν (NH2)
which present in chitosan in different amounts among which NH2 groups being the least. The small peak around
2873 cm-1
is ascribed as -CH2– and -CH3 groups. However, the amide I band is observed around 1647 cm-1
, the
peak observed around 1586 cm-1
is attributed to N-H bending of the amide II bands and finally the peak at 1420
cm-1
indicates the C–H bending vibrations of -CH2. Similar results are reported previously by Laaraibi et al.[19],
Kumari and Rath[5] and Teli and Sheikh[20].

EL Knidri et al., JMES, 2017, 8 (10), pp. 3648-3653 3652
3.4. Determination of the deacetylation degree
After the demineralization and deproteinization steps, the chitin extracted was transformed to chitosan under
different reaction time of deacetylation, 5, 15, 20 and 25 min.
The variation of deacetylation degree DD% of the various chitosan samples has been determined by applying
the conductometric method of analysis. The deacetylation degree of samples was determined using equation (4).
The values of conductivity with the corresponding KOH volumes, for different reaction time, were plotted in a
curve to find the linear variation before and after the equivalence point (Figure 4a). The curves exhibit two
inflexion points, the difference of volume of KOH added between these two points corresponds to the volume of
HCl needed to protonate the amine groups of each chitosan sample i.e. to transform NH2 to NH3+ groups.
The two points are found by intersection of three lines in the curve, the first line corresponds to neutralization of
HCl in excess, the second refers to neutralization of the ammonium group and the third to the excess of KOH
solution Figure 4b.The measured degree of acetylation DA% was 83.8, 74.42, 69.5 and 64.5% for 5, 15, 20 and
25 min treated samples respectively.
The deacetylation degree DD% of chitosan CTS, calculated using equation 2, is in the order of 82%.
Figure 4a:Conductometric titration of chitosan samples at different reaction time
Figure 4b: Combined plot of conductometric titration of chitosan samples at different reaction time

EL Knidri et al., JMES, 2017, 8 (10), pp. 3648-3653 3653
Conclusion
The study described in this paper has demonstrated that chitin can be effectively extracted from shrimp shells
wastes of ParapenaeusLongirostris following demineralization using 3M of HCl and deproteination using 10%
of NaOH. Chitosan, the most important derivative of chitin, was successfully obtained by partial deacetylation
of chitin under alkaline conditions. This work investigated the physicochemical characteristics of chitosan; it
was found that chitosan extracted has all the characteristic peaks and a crystallinity index of 59.75 %.
The shrimp shell wastes were successfully transformed to biopolymer biodegradable and friend of the
environment. From these results it could be concluded that there is a good potential for the extraction of
chitosan from Moroccan shrimp wastes (yield of chitosan was 29.45%), which constitute a significant amount of
waste in environment.
References
1. Younes I., Ghorbel-Bellaaj O., Nasri R., Chaabouni M., Rinaudo M., and Nasri M.,Process Biochem., 47
(2012) 2032–2039.
2. Arbia W., Arbia L., Adour L., and Amrane A., Food Technol. Biotechnol.51 (2012) 12-25.
3. El Knidri H., El Khalfaouy R., Laajeb A., Addaou A., and Lahsini A.,Process Saf. Environ. Prot., 104
(2016) 395–405.
4. Paulino A. T., Simionato J. I., Garcia J. C., and Nozaki J., Carbohydr. Polym. 64 (2006) 98–103.
5. Kumari S.and Rath P. K., Procedia Mater. Sci., 6 (2014) 482–489.
6. Arroussi A., Slimane S. K., Benosman A., and Bensaha S.,J. Mater. Environ. Sci 5 (2014) 2391–2396.
7. El Fargani H., Lakhmiri R., Albourine A., Cherkaoui O., and Safi M.,J. Mater. Environ. Sci. 7 (2016)
1334–1346.
8. El Fargani O. C. H., Lakhmiri R., El Farissi1 H., Albourine A., Safi M., J. Mater. Environ. Sci.,(2017)
724–739.
9. Rissouli L., Benicha M., and Chabbi M., J. Mater. Environ. Sci., 7 (2016) 531–540.
10. El khalfaouy R., Elabed A., Khallouk K., El Knidri H., Belaabed R., Addaou A., Laajeb A., Lahsini A., J.
Mater. Environ. Sci., 8 (2017)2276–2281.
11. Abdou E. S., Nagy K. S. a, and Elsabee M. Z., Bioresour. Technol., 99 (2008) 1359–67.
12. Bajaj M., Winter J., and Gallert C., Biochem. Eng. J., 56 (2011) 51–62.
13. Zhang Y., Xue C., Xue Y., Gao R., and Zhang X., Carbohydr. Res., 340 (2005) 1914–7.
14. Mohammed M. H., Williams P.., Tverezovskaya O.,Food Hydrocoll., 31 (2013) 166–171.
15. Hussain M. R., Iman M., and Maji T. K., Int. J. Adv. Eng.(2013) 4–12.
16. Tolaimate A., Desbrières J., Rhazi M., Alagui A., Vincendon M., Vottero P., Polymer (Guildf),41 (2000)
2463–2469.
17. Kucukgulmez A., Celik M., Yanar Y., Sen D., Polat H., Kadak a. E., Food Chem., 126 (2011) 1144–
1148.
18. Naghibzadeh M., Amani A., Amini M., Esmaeilzadeh E., Mottaghi-Dastjerdi N., Faramarzi M. A.,J.
Nanomater.(2010) 1–7.
19. Laaraibi A., Charhouf I., Bennamara A., Abourriche A., and Berrada M.,J. Mater. Environ. Sci.6 (2015)
3511–3516.
20. Teli M. D. and Sheikh J., Int. J. Biol. Macromol., 50 (2012) 1195–200.
(2017) ; http://www.jmaterenvironsci.com