physical environment final - epa...
TRANSCRIPT

PHYSICAL ENVIRONMENT OF THE YANNARIE SALT PROJECT AREA
October 2005


p:\straits\solarsalt\reports\ermp\technical reports\geomorphology\physical environment final.doc
PHYSICAL ENVIRONMENT OF THE YANNARIE SALT PROJECT AREA
Prepared for
Straits Salt Pty Ltd
by
D.C. Blandford & Associates Pty Ltd
and
Oceanica Consulting Pty Ltd
October 2005
Report No. 391/3


D.C. Blandford & Assoc & Oceanica: Straits Salt: Physical Environment i
Client: Straits Salt Pty Ltd Revisions history
DISTRIBUTION REVIEW
Version Author Recipients No. Copies &
Format Date Reviewer Date
1 DCB BJH
T. Naughton G. Humphries M. Bailey J. Gray
1 x Hardcopy 1x Hardcopy 1 x DOC/1 x PDF
24/08/05
FINAL DCB BJH
T. Naughton J. Grey G. Humphries
2 x Hardcopy 1 x PDF 1 x PDF 1 x PDF
26/10/05
Disclaimer This report has been prepared on behalf of and for the exclusive use of Straits Salt Pty Ltd, and is subject to and issued in accordance with the agreed terms and scope between Straits Salt Pty Ltd and Oceanica Consulting Pty Ltd and D.C. Blandford & Associates Pty Ltd. D.C. Blandford & Associates Pty Ltd or Oceanica Consulting Pty Ltd accepts no liability or responsibility whatsoever for it in respect of any use of or reliance upon this report by any third party. Copying this report without the permission of Straits Salt Pty Ltd, D.C. Blandford & Associates Pty Ltd or Oceanica Consulting Pty Ltd is not permitted. © Copyright 2005 D.C. Blandford & Associates Pty Ltd © Copyright 2005 Oceanica Consulting Pty Ltd

D.C. Blandford & Assoc & Oceanica: Straits Salt: Physical Environment i
Contents
1. Introduction .......................................................................................................1
2. Regional Setting................................................................................................3
3. Geology..............................................................................................................7
4. Landscape Elements ........................................................................................9 4.1 Outwash Plain ................................................................................................................. 11
4.1.1 Alluvial/colluvial plain ........................................................................................... 11 4.2 Dunefield.......................................................................................................................... 12
4.2.1 Longitudinal dunes ............................................................................................... 12 4.2.2 Interdunal swales/claypans.................................................................................. 13 4.2.3 Yanrey Point sand sheet ...................................................................................... 14 4.2.4 Fringing dunes ..................................................................................................... 16
4.3 Salt Flat ............................................................................................................................ 17 4.3.1 Salt flats................................................................................................................ 17 4.3.2 Mainland remnants............................................................................................... 21
4.4 Coastal Fringe ................................................................................................................. 21 4.4.1 Tidal creeks.......................................................................................................... 21 4.4.2 Dune ridges.......................................................................................................... 24 4.4.3 Sand sheet ........................................................................................................... 25 4.4.4 Beaches ............................................................................................................... 27 4.4.5 Limestone outcrops.............................................................................................. 27
5. Soils .................................................................................................................29 5.1 Introduction and Methods.............................................................................................. 29
5.1.1 Literature Review ................................................................................................. 29 5.1.2 Desktop Appraisal and Photo Interpretation ........................................................ 30 5.1.3 Field Inspection and Soil Profile Description........................................................ 30
5.2 Soil Landscapes of the Project Area ............................................................................ 31 5.2.1 Introduction .......................................................................................................... 31 5.2.2 Soils of the outwash plain .................................................................................... 31 5.2.3 Soils of the dunefield............................................................................................ 32 5.2.4 Soils of the salt flat ............................................................................................... 32 5.2.5 Soils of the coastal fringe..................................................................................... 34
5.3 Soil Profiles of the Project Area .................................................................................... 34 5.4 Material Characterisation ............................................................................................... 45
5.4.1 Soil Chemistry ...................................................................................................... 45 5.4.2 Particle Size Distribution ...................................................................................... 45 5.4.3 Atterburg Limits .................................................................................................... 46
6. Hydrology ........................................................................................................49 6.1 Surface Hydrology .......................................................................................................... 49
6.1.1 Introduction .......................................................................................................... 49 6.1.2 Stream discharge ................................................................................................. 51 6.1.3 Flood plain interaction .......................................................................................... 54 6.1.4 Discharge from major storms............................................................................... 54 6.1.5 Discharge from minor storms............................................................................... 57 6.1.6 Fate of discharge from mainland streams............................................................ 57
6.2 Groundwater HydrOlogy ................................................................................................ 60 6.2.1 Introduction .......................................................................................................... 60 6.2.2 Methods................................................................................................................ 60 6.2.3 Outwash Plain ...................................................................................................... 64 6.2.4 Dunefield .............................................................................................................. 71 6.2.5 Salt Flat ................................................................................................................ 71

ii D.C. Blandford & Assoc & Oceanica: Straits Salt: Physical Environment
7. Oceanography.................................................................................................73 7.1.1 Tides..................................................................................................................... 73 7.1.2 Historic sea level trend......................................................................................... 74 7.1.3 Waves .................................................................................................................. 74 7.1.4 Seiches................................................................................................................. 74 7.1.5 Storm surge.......................................................................................................... 75 7.1.6 Tsunamis.............................................................................................................. 76 7.1.7 Currents................................................................................................................ 78
8. Conceptual Model of Landform Development ..............................................81 8.1 Sea level pre-history....................................................................................................... 81 8.2 Climate Change............................................................................................................... 82 8.3 Landform Development.................................................................................................. 82
9. References.......................................................................................................91
10. Acknowledgements ........................................................................................95
11. Abbreviations and Glossary...........................................................................97
12. Appendix..........................................................................................................99

D.C. Blandford & Assoc & Oceanica: Straits Salt: Physical Environment iii
List of Tables Table 5.1 Summary of sites and soil profiles investigated....................................35 Table 5.2 Soil horizon pH and salinity from representative sites ..........................45 Table 5.3 Particle size distribution of selected soil materials................................46 Table 6.1 Estimated peak flows and volumes of Yannarie River and Rouse
Creek....................................................................................................52 Table 6.2 Outlet discharge summary....................................................................54
List of Figures Figure 1.1 Location diagram....................................................................................2 Figure 2.1 Summer and winter wind roses for Learmonth .......................................5 Figure 2.2 Mean daily maximum and minimum temperatures at Learmonth ...........5 Figure 2.3 Average monthly rainfall and number of rain days at Learmonth
Airport.....................................................................................................6 Figure 2.4 Average annual frequency of tropical cyclones in the Australian
region .....................................................................................................6 Figure 4.1 Landscape elements of the project area and soil inspection sites........10 Figure 4.2 Traverse cross-sections .......................................................................18 Figure 5.1 Soil and profile descriptions for inspection sites Y3 and Y4 .................36 Figure 5.2 Soil and profile descriptions for inspection sites Y5 and Y5A ...............37 Figure 5.3 Soil and profile descriptions for inspection sites Y6, Y7 and Y8 ...........38 Figure 5.4 Soil and profile descriptions for inspection sites SS1 and SS2.............39 Figure 5.5 Soil and profile descriptions for inspection site SS3 .............................40 Figure 5.6 Soil and profile descriptions for inspection site SS9 .............................41 Figure 5.7 Soil and profile descriptions for inspection sites SS11 and SS16.........42 Figure 5.8 Sediment transect across the Salt Flat (Transect 1).............................43 Figure 5.9 Sediment transect across the Salt Flat (Transect 2).............................44 Figure 5.10 Plasticity Index for selected clay samples from the project area ..........47 Figure 6.1 Yannarie River 100-year 24-hour hydrograph ......................................53 Figure 6.2 Rouse Creek 100-year 24-hour hydrograph .........................................53 Figure 6.3 Discharge hydrographs for the 100-year ARI runoff event ...................56 Figure 6.4 Bore locations.......................................................................................61 Figure 6.5 Superficial aquifer groundwater contours .............................................65 Figure 6.6 Groundwater quality map .....................................................................69 Figure 7.1 Example of tidal signature at Exmouth .................................................73 Figure 7.2 Tidal inundation curve for Hope Point...................................................74 Figure 7.3 Storm surge measured at Exmouth during passage of Tropical
Cyclone Vance .....................................................................................75 Figure 7.4 Measured surge levels generated by Tropical Cyclone Vance.............76

iv D.C. Blandford & Assoc & Oceanica: Straits Salt: Physical Environment
Figure 7.5 Time series of residuals recorded following the Boxing Day Tsunami at Onslow and Exmouth (from 25 to 31 December 2004)......77
Figure 7.6 Depth-averaged tide-induced residual currents in Exmouth Gulf .........79 Figure 8.1 Holocene sea level curve for south western Australia ..........................81 Figure 8.2 Schematic presentation of previous climate history of the study
area (based on Wyrwoll 1993)..............................................................82 Figure 8.3 Time-stratigraphic relationships between landform units of the
project area ..........................................................................................83 Figure 8.4 Geomorphology of the Yanrey Point area ............................................85 Figure 8.5 Satellite imagery showing the Ashburton palaeo-super delta ...............86 Figure 8.6 Diagrammatic representation of the Ashburton palaeo super-delta......87
List of Plates Plate 4.1 Changes in vegetation patterns on the outwash plain are related to
flow paths and the nature of the sediments ..........................................11 Plate 4.2 Typical surface features of Rouse Creek showing multiple
channels on the outwash plain .............................................................12 Plate 4.3 View south-west across longitudinal dunefield towards mouth of
the Yannarie River South and salt flats. The steeper east-facing flank of the dunes is towards the camera .............................................13
Plate 4.4 Claypans and interdunal swales in the dunefield landscape element.................................................................................................14
Plate 4.5 Well-developed system of deflation pans and claypans within the dunefield landscape element................................................................14
Plate 4.6 Yanrey Point sand sheet where the steep slope indicates north easterly movement (hence prevailing south to south westerly winds) ...................................................................................................15
Plate 4.7 Palaeosol exposed in the Yanrey Point sand sheet .............................15 Plate 4.8 Eroding fringing foredune along the western edge of the dunefield
landscape with a younger and smaller frontal dune along the base .....16 Plate 4.9 A well developed storm debris line (including washed-up dingy)
present on western edge of a mainland remnant .................................17 Plate 4.10 Featureless salt flat landform ...............................................................19 Plate 4.11 Mouth of the Yannarie River South where it discharges to the salt
flat. Discolouration at the mouth is due to the deposition of terrestrial sediments .............................................................................19
Plate 4.12 Pattern of relic tidal creek visible on salt flat.........................................20 Plate 4.13 Inundation of salt flats following Tropical Cyclone Vance (24 March
1999) ....................................................................................................20 Plate 4.14 Example of a mainland remnant showing presence of longitudinal
dunes and claypans..............................................................................21 Plate 4.15 Intertidal mangrove system showing tidal creek and fringing
mud/sand flats ......................................................................................22
D.C. Blandford & Assoc & Oceanica: Straits Salt: Physical Environment v
Plate 4.16 Tidal creek and fringing mangroves with algal mat visible in lower right foreground ....................................................................................23
Plate 4.17 Rising tidal front traversing algal mat inshore of the mangroves south of Hope Point ..............................................................................23
Plate 4.18 Dune ridge located in areas where mangrove fringe is absent or sparse (view north from Hope Point) ....................................................24
Plate 4.19 Dune ridge along shore south of Hope Point........................................25 Plate 4.20 Sand sheet with dunes at Locker Point ................................................26 Plate 4.21 Locker Point sand sheet following surge inundation by Tropical
Cyclone Vance (23 March 1999) ..........................................................26 Plate 4.22 Ridge and runnel morphology of beach on Tent Island ........................27 Plate 4.23 Limestone forming low cliffs on western end of Hope Point .................28 Plate 4.24 Limestone pavement in nearshore environment immediately north
of Tubridgi Point ...................................................................................28 Plate 6.1 View of Yannarie River downstream from the North West Coastal
Highway................................................................................................50 Plate 6.2 The mouth of the Yannarie River South at its discharge point onto
the salt flats ..........................................................................................50 Plate 6.3 View downstream of Rouse Creek from North West Coastal
Highway................................................................................................51

D.C. Blandford & Assoc & Oceanica: Straits Salt: Physical Environment 1
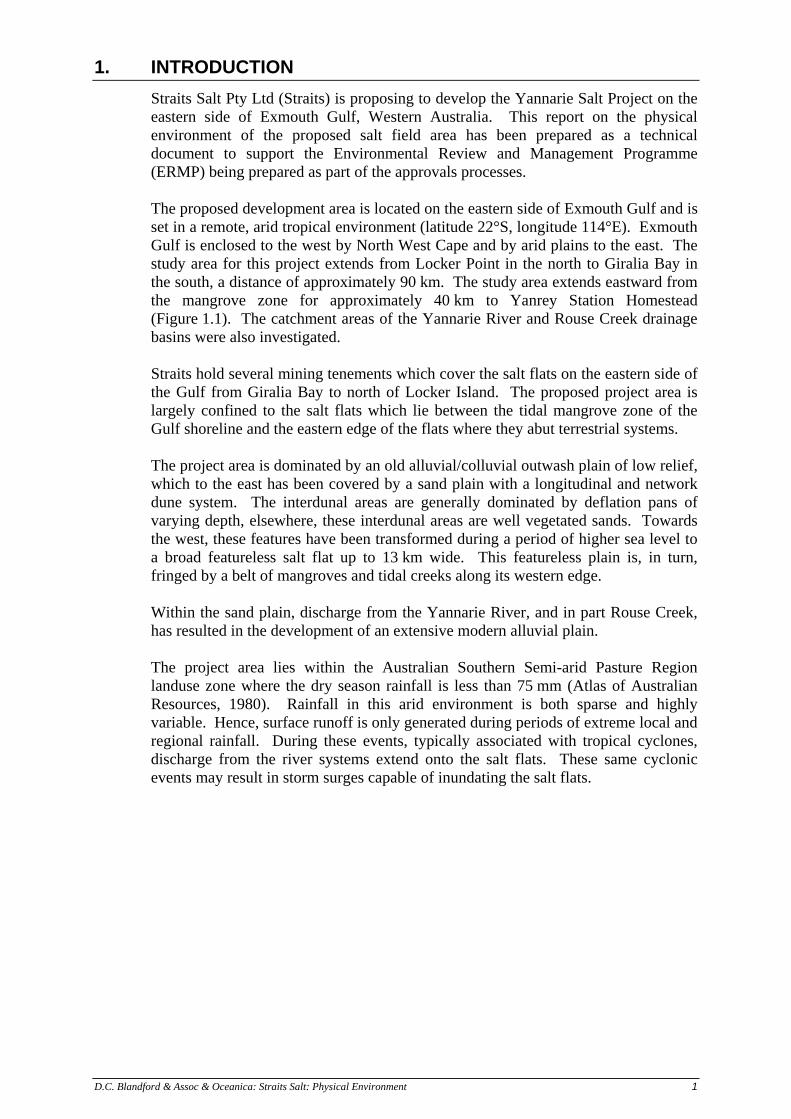
1. INTRODUCTION Straits Salt Pty Ltd (Straits) is proposing to develop the Yannarie Salt Project on the eastern side of Exmouth Gulf, Western Australia. This report on the physical environment of the proposed salt field area has been prepared as a technical document to support the Environmental Review and Management Programme (ERMP) being prepared as part of the approvals processes. The proposed development area is located on the eastern side of Exmouth Gulf and is set in a remote, arid tropical environment (latitude 22°S, longitude 114°E). Exmouth Gulf is enclosed to the west by North West Cape and by arid plains to the east. The study area for this project extends from Locker Point in the north to Giralia Bay in the south, a distance of approximately 90 km. The study area extends eastward from the mangrove zone for approximately 40 km to Yanrey Station Homestead (Figure 1.1). The catchment areas of the Yannarie River and Rouse Creek drainage basins were also investigated. Straits hold several mining tenements which cover the salt flats on the eastern side of the Gulf from Giralia Bay to north of Locker Island. The proposed project area is largely confined to the salt flats which lie between the tidal mangrove zone of the Gulf shoreline and the eastern edge of the flats where they abut terrestrial systems. The project area is dominated by an old alluvial/colluvial outwash plain of low relief, which to the east has been covered by a sand plain with a longitudinal and network dune system. The interdunal areas are generally dominated by deflation pans of varying depth, elsewhere, these interdunal areas are well vegetated sands. Towards the west, these features have been transformed during a period of higher sea level to a broad featureless salt flat up to 13 km wide. This featureless plain is, in turn, fringed by a belt of mangroves and tidal creeks along its western edge. Within the sand plain, discharge from the Yannarie River, and in part Rouse Creek, has resulted in the development of an extensive modern alluvial plain. The project area lies within the Australian Southern Semi-arid Pasture Region landuse zone where the dry season rainfall is less than 75 mm (Atlas of Australian Resources, 1980). Rainfall in this arid environment is both sparse and highly variable. Hence, surface runoff is only generated during periods of extreme local and regional rainfall. During these events, typically associated with tropical cyclones, discharge from the river systems extend onto the salt flats. These same cyclonic events may result in storm surges capable of inundating the salt flats.

2 D.C. Blandford & Assoc & Oceanica: Straits Salt: Physical Environment
Figure 1.1 Location diagram

D.C. Blandford & Assoc & Oceanica: Straits Salt: Physical Environment 3
2. REGIONAL SETTING Exmouth Gulf is located approximately 1,200 km north of Perth in the Pilbara region of Western Australia (Figure 1.1). Exmouth Gulf is a large (2,600 km2), shallow (mean depth 11.9 m) inverse estuarine embayment with an approximate width and length of 45 and 80 km, respectively (Figure 1.1). The Gulf shallows and narrows southward towards Gales Bay and Giralia Bay but has no other significant restrictions to water flow. The Gulf spans a significant boundary between the geomorphologically distinct Pilbara (to the east) and Gascoyne (to the west) coastal sectors; Sandalwood Peninsula marks the dividing line (Semeniuk 1993a). Extensive mangrove forests occur along the eastern coast in the southern half of the bay, extending from the Bay of Rest on the western shore to Hope Point on the eastern shore. The western shore of the Gulf, from North West Cape to the Bay of Rest is characterised by narrow beaches backed by dunes and fronted by sand and rock flats. The Bay of Rest and Gales Bay contain small but complex mangal systems distinct from those on the eastern shore. The Gulf is a tide and wave dominated embayment with minimal river inputs. Offshore of the mouth of the Gulf, the continental shelf is relatively narrow with a width to the 200 m isobath of approximately 50 km. The mouth of the Gulf is marked by a string of islands which roughly parallel the shore, including the Muiron Islands, Flat Island and Serrurier Island. A number of smaller islands and shoals occur along the western side of the Gulf, including Whalebone Island, Y Island and Eva Island. High evaporation and low runoff rates to Exmouth Gulf can result in high salinities (up to 39 parts per thousand) towards the southern end of the Gulf (Brown, 1988). The study area has a dry climate with hot summers and mild winters. However, there is considerable variation in the climate both within the region and from year to year. The prevailing weather conditions are largely determined by two broad scale influences: (1) a sub-tropical high-pressure belt to the south dominated by anticyclones; and (2) a trough of low pressure that typically extends over the inland Pilbara during the summer months. These combine to produce a general south or south-westerly wind regime for much of the year (). Winds from the north-easterly quadrant appear to be common during afternoons in both summer and winter. However, winds may vary considerably due to the influence of afternoon sea breezes in the warmer months. Sea breezes are important local-scale weather phenomena generated by temperature differences between the land and the ocean. These sea breezes are generally south to south-westerly on the western side of North West Cape and typically either south-westerly or north-easterly on the Exmouth Gulf side. During summer tropical cyclones may form over the warm waters off north-western Australia and move southwards and inland resulting in strong winds, high seas and heavy rain. Temperature measurements at Learmonth (on the western shore of Exmouth Gulf) indicate an average January maximum temperature of 38.0°C (Figure 2.2) although further north on the peninsular temperatures are moderated by winds passing over the ocean. It is not uncommon for maxima to exceed 40°C for several consecutive days when winds blow from the inland Pilbara during summer. By contrast, winters are mild with July average maximum and minimum temperatures being 24.0°C and 11.3°C, respectively (Figure 2.2). Overnight temperatures rarely fall below 5.0°C. The annual rainfall for the Exmouth Gulf region is highly variable with an annual average of 260 mm. Peak rainfall occurs from January to March (associated with the

4 D.C. Blandford & Assoc & Oceanica: Straits Salt: Physical Environment
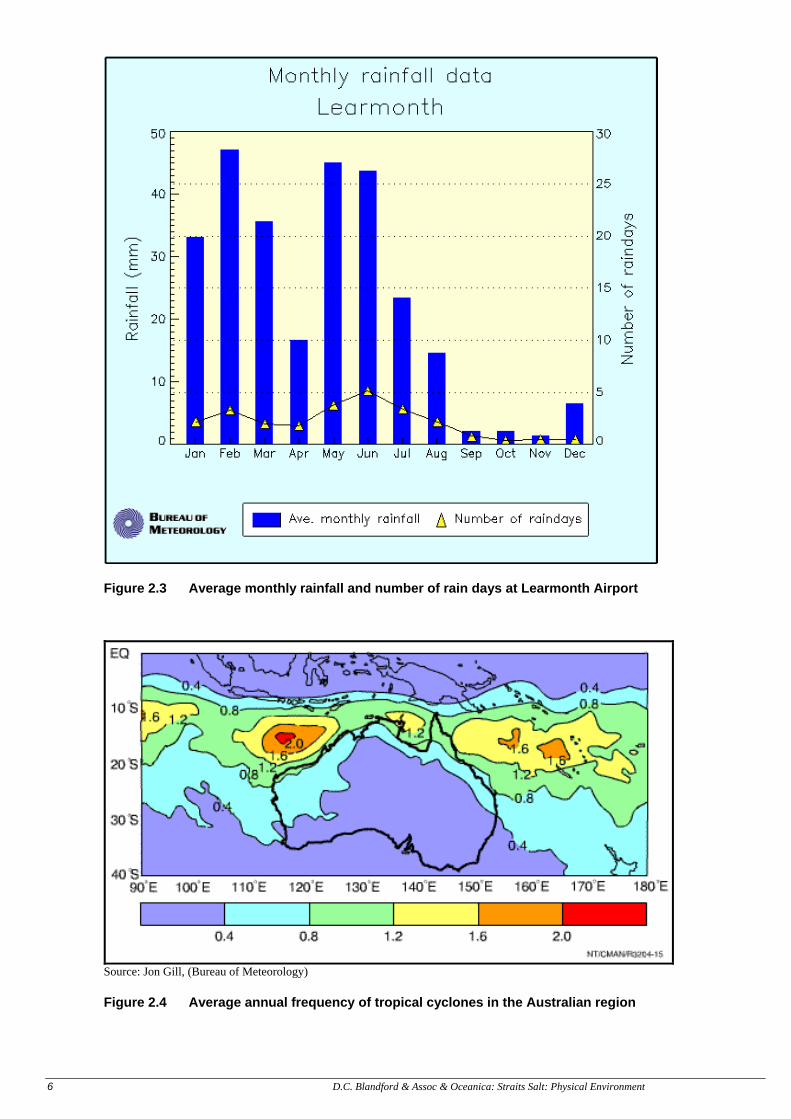
passage of tropical cyclones) and between May and June (associated with tropical cloud bands originating to the northwest) (Figure 2.3). The heaviest rainfall is generally associated with the tropical cyclones and can cause extensive flooding in the area—tropical cyclones are responsible for 20–40% of the annual input of freshwater into Exmouth Gulf (Wyrwoll 1993). Evaporation is high and varies from 3.9 mm per day in June to 12.5 mm per day in December. The annual average rainfall is significantly exceeded by the mean annual evaporation of 3,140 mm. Tropical cyclones affect the North West Cape area about once every two years on average (Figure 2.4, Lourensz 1981). These cyclones may be experienced during the months from December to April but are most common in February and March (75 % of occurrences). The track of individual cyclones is semi-random, though typically cyclones have approached the Exmouth Gulf area from the north or northeast. A severe cyclone will impact the area approximately once every 25 years; previous severe tropical cyclones occurred in 1945, 1953, 1964 (Tropical Cyclone Katie) and 1999 (Tropical Cyclone Vance). Tropical Cyclone Vance was registered as a Category 5 cyclone and was the most intense tropical cyclone ever recorded to cross the Australian coast (Bureau of Meteorology 2000). The eye of this Cyclone passed down Exmouth Gulf, about 25 km to the east of Exmouth and 80 km to the west of Onslow. During this Cyclone, the highest ever wind gust recorded on the Australian mainland of 267 km/h was recorded at Learmonth Airport on 22 March 1999. At Onslow the maximum gust recorded was 182 km/h. Tropical Cyclone Vance also resulted in approximately 200–300 mm of rainfall to the east and south of Exmouth with consequent flooding of these areas.

D.C. Blandford & Assoc & Oceanica: Straits Salt: Physical Environment 5
Figure 2.1 Summer and winter wind roses for Learmonth
05
10152025303540
JanFeb Mar Apr
May Jun Ju
lAug Sep Oct Nov
Dec
Month
Tem
pera
ture
(deg
C)
Mean dailymaximumtemperatureMean daily minimumtemperature
Source: Bureau of Meteorology
Figure 2.2 Mean daily maximum and minimum temperatures at Learmonth
6 D.C. Blandford & Assoc & Oceanica: Straits Salt: Physical Environment
Figure 2.3 Average monthly rainfall and number of rain days at Learmonth Airport
Source: Jon Gill, (Bureau of Meteorology)
Figure 2.4 Average annual frequency of tropical cyclones in the Australian region

D.C. Blandford & Assoc & Oceanica: Straits Salt: Physical Environment 7
3. GEOLOGY The Yannarie Salt project area lies wholly within the Gascoyne sub-basin, one of three major sub-basins of the north-south trending Carnarvon Basin (Hocking 1990). At the regional scale, there are three major structural/lithological terranes present. East of the Yannarie River lies a complex of igneous, sedimentary and metamorphic rocks that represent the oldest lithologies in the region, with ages extending back to the Lower and Middle Proterozoic eras. Small areas of Tertiary rocks also outcrop north-east of Yanrey Station homestead and east of the Ashburton River. West of the Ashburton and Yannarie River systems, surficial geology dominates the landscape and is defined by unconsolidated alluvial and colluvial sediments of the Quaternary/?Pliocene outwash plain. Younger sand sheets and associated dunes of the Carnarvon Dunefield, overlie these older deposits. The terrestrial sequence of sediments ends at the present eastern boundary of the extensive salt flats making up the Onslow Plain, which extends westward for approximately 13 km before merging with the fringing mangrove zone on the eastern shore of the Gulf. A line drawn along the eastern edge of the salt flat, and extended south past Giralia Station homestead, represents the eastern boundary of the third terrane. This last area is dominated by three anticlinal structures forming the Giralia Range, Rough Range and, further west, Cape Range. At the project area scale, surficial geology is dominated by unconsolidated sediments. The Quaternary geology of the project area is of particular relevance and comprises the following elements: • A basal ?Pliocene alluvial/colluvial outwash plain that forms the underlying
framework for contemporary Quaternary landforms; • A sand sheet-sand dune complex comprising a system of longitudinal and
network dunes, overlying the outwash plain and of probable Late Pleistocene age, the Carnarvon Dunefield (formed some16-24,000 years BP);
• An alluvial plain associated with discharge from the Yannarie and Rouse drainage systems;
• Claypans in interdune areas that are considered to be a window on the Pliocene sediments;
• A Holocene salt flat, the Onslow Plain. This salt flat is the result of a Holocene marine transgression and regression, which is dated as starting 6,000 years BP and ending about 1,500 years BP;
• Holocene fringing foredune systems, dominant along the eastern margin of the salt flat and the western margins of the mainland remnants on the salt flats. The fringing dunes range up to 15 m in height, are aeolian in origin, generally show a uniform and highly stratified structure indicating a degree of constancy in both wind direction and sediment supply. Most fringing dunes show varying degrees of runoff-induced erosion in the form of gullying.
• A low Holocene frontal dune system, onlapping in part, the western limb of the fringing dunes. This less well developed dune system is considered to be the result of more recent deposition resulting from storm surges. Most of these frontal dunes are associated with well developed debris lines, comprised generally of dead Spinifex. Wind has not played a major role in formation due to the coarse nature of the material size making up the deposits;
• A series of mainland remnants which occur across the salt flat. These remnants which were formed following a return of the Holocene transgression to current

8 D.C. Blandford & Assoc & Oceanica: Straits Salt: Physical Environment
sea levels, contain longitudinal and network dunes, sand sheet and claypan interdune areas, and towards the western limit of the salt flat, some remnants contain quite well developed gently north-dipping beds of calcarenite, of probable aeolian origin. The outcrops range from poorly exposed vertical sections of several metres deep to flat lying sheets exposed on the surface. Elsewhere, erosion of the calcarenite beds has produced a calcrete-like rubble which appears to have undergone secondary cementation.
• An extensive zone of mangrove habitat developed on intertidal sands, silts and clays. The zone is characterised by short tidal creeks, which operate under the influence of diurnal tide changes. None of these tidal creeks receives input from outside the zone.
Bores drilled during the groundwater investigation programme for the project encountered Pliocene deposits comprising moderately sorted fine sand, silt and clay, with sub-angular to angular quartz sand, and with high plasticity clay, containing feldspar, kaolin clays, and minor muscovite and magnetite. Some of these clays demonstrated 2:1 lattices in having high volume expansion capabilities and very high plasticity. When occurring on the surface, such material was often associated with Gilgai formation. These sands, silts, and clays, and admixtures of them, appeared to be quite widespread across the project area and give further give credence to an underlying Pliocene framework of clays, silts, sands, and gravels in various stratigraphic relationships. Sediment grab samples obtained from Exmouth Gulf are dominated by a mixture of coarse to medium carbonate sand, quartzose fine sand, mud and coralline gravel and shells (Brunskill et al. 2001; Orpin et al. 1999). Rounded and iron-stained quatzose granules and pebbles and limestone lithoclasts were also common throughout the Gulf (Brunskill et al. 2001). It is thought that most of the sediment in the Gulf is resuspended pre-Holocene alluvium, transported shorewards during sea level rise over the last 8,000 years (Brunskill et al., 2001). Less than a metre of Holocene sediment has accumulated in most regions of the Gulf over the last 6,000–8,000 years, and it seems likely that some of these Holocene sediments are being eroded and transported out of the Gulf, with the mangrove zone diminishing in area (Brunskill et al., 2001; Semeniuk 1993a and 1993b; Wyrwoll et al. 1993; Brown, 1988). This is also supported by the lack of significant sediment sources delivering material to the mangrove zone. The muddiest sediments are located in the sheltered mangrove channels, tidal flats and the deeper central region. The quartzose fine sands are likely to have mixed origins, including: drift from the aeolian dunes to the south, storm reworking of beach/nearshore deposits and reworked relict alluvium from the shelf (Orpin, et al. 1999). Seagrass beds in the Gulf are isolated and sparse (McCook et al. 1995) hence unconsolidated sediments are freely available for transport by waves and currents. The very low abundance of the porcellaneous foraminifera, Amphisorus hemprichii, which is a common epiphytic species elsewhere on the Western Australian coast, which also indicates the relative lack of seagrass beds within the Gulf (Haig 1998).

D.C. Blandford & Assoc & Oceanica: Straits Salt: Physical Environment 9
4. LANDSCAPE ELEMENTS A series of four landscape elements are defined for the study area. In a generalised two-dimensional representation of the system, these elements form the following sequence (from onshore to offshore) (Figure 4.1): • Outwash Plain; • Dunefield; • Salt Flats; and • Coastal fringe. Within each landscape element a number of landform units and sub-units can be defined and these are described below in more detail.

10 D.C. Blandford & Assoc & Oceanica: Straits Salt: Physical Environment
Figure 4.1 Landscape elements of the project area and soil inspection sites

D.C. Blandford & Assoc & Oceanica: Straits Salt: Physical Environment 11
4.1 OUTWASH PLAIN
The outwash plain landscape element includes the following landform units: alluvial/colluvial plain, and drainage lines. These landform units are described below.
4.1.1 Alluvial/colluvial plain The outwash plain comprises both alluvial and colluvial sediments. The areas of alluvial sediments, which are closely associated with the flood discharge of the Yannarie River, are typified by sediments in the clay, silt and fine sand particle range. Conversely, the areas of colluvial sediments demonstrate less sorting and include coarse sand and gravels, the latter often forming areas of surface lag gravel but with a discontinuous fabric. The nature of the colluvial sediments suggest they were formed in response to sheet floods while the development of a lag surface suggests deflation as the major surface processes. No attempt has made here to differentiate these sediments on genesis. The plain has a low overall gradient from east to west and very low local relief. Subtle changes in the surface material and depositional characteristics are indicated by changes in vegetation communities (Plate 4.1). There is no major incised drainage across the alluvial/colluvial plain as the Yannarie River loses its identity at the entrance to the plain. The Rouse Creek system, which has it genesis well to the east of the Yannarie River, tends to form a small alluvial outlier to the north of the main area of the plain. At this location the system can be identified by a series of small anastomosing channels (Plate 4.2) from where the system enters an area of dune and claypan topography before re-joining the Yannarie system south of the Yankagee Claypan.
Source: D. Blandford
Plate 4.1 Changes in vegetation patterns on the outwash plain are related to flow paths and the nature of the sediments

12 D.C. Blandford & Assoc & Oceanica: Straits Salt: Physical Environment
Source: D. Blandford
Plate 4.2 Typical surface features of Rouse Creek showing multiple channels on the outwash plain
4.2 DUNEFIELD
The dunefield landscape element is also known as the Carnarvon Dunefield (Jennings & Mabbutt 1986), and extends both north and south from the outwash plain. The dunefield landscape comprises a sheet sand base over which a longitudinal dune system has formed. This landscape element comprises the following landform units: longitudinal and network dunes, vegetated interdunal swales and claypans. A sand sheet with non-linear dunes occurs at Yanrey Point and a system of fringing dunes has developed along the western margin of the dunefield landscape element.
4.2.1 Longitudinal dunes The longitudinal and network dunes have formed during more arid conditions when vegetation cover was more sparse than at present. The dunes in the study area are now effectively relict features and are largely vegetated (Plate 4.3). The dunes are generally oriented north/south in the area to the north of the Yannarie River; whereas to the south of the Yannarie River the dunes are oriented north-west/south-east. The dunes, which range in height from four to seven metres, display network patterns and the length of the dunes demonstrate great variability. Much of the contemporary surface form of the longitudinal dunes is a function of degradation and sand mobilisation. The eastern slopes of these dunes demonstrate composite geometry with gradients up to 13%. This asymmetric morphology suggests a contemporary stable but dominant wind direction from west of south.

D.C. Blandford & Assoc & Oceanica: Straits Salt: Physical Environment 13
Source: D. Blandford
Plate 4.3 View south-west across longitudinal dunefield towards mouth of the Yannarie River South and salt flats. The steeper east-facing flank of the dunes is towards the camera
4.2.2 Interdunal swales/claypans The interdunal areas of the dunefield landscape are generally either: (1) stable and vegetated; or (2) form deflation zones and claypans (Plate 4.4). In some areas, particularly where the interdune areas are extensive, the deflation zones and claypans may dominate the landscape (Plate 4.5). The floor of the claypans may be up to 1.5 m below ground level and a series of claypans may link to form a discontinuous network of storage and high runoff areas. These areas are a major factor in the complexity of the surface drainage patterns. The largest of these claypans, the Yankagee Claypan, lies immediately north of the Yannarie River outwash plain.

14 D.C. Blandford & Assoc & Oceanica: Straits Salt: Physical Environment
Source: D. Blandford
Plate 4.4 Claypans and interdunal swales in the dunefield landscape element
Source: D. Blandford
Plate 4.5 Well-developed system of deflation pans and claypans within the dunefield landscape element
4.2.3 Yanrey Point sand sheet An isolated area (approximately 100 ha) of unvegetated red sands is located at Yanrey Point. The Yanrey Point sand sheet has been formed into a series of complex ridges under the influence of the prevailing southerly winds (Plate 4.6). The dune heights in this area are approximately 14 m. The northern edge of this sand sheet

D.C. Blandford & Assoc & Oceanica: Straits Salt: Physical Environment 15
appears to be moving northwards and engulfing vegetated areas. Several swale areas within the sand sheet have a sparse cover of low vegetation. A palaeosol has also been exposed in one of the larger swales within this landform unit (Plate 4.7); the surface of the palaeosol contains gravel and stone fragments.
Source: D. Blandford
Plate 4.6 Yanrey Point sand sheet where the steep slope indicates north easterly movement (hence prevailing south to south westerly winds)
Source: D. Blandford
Plate 4.7 Palaeosol exposed in the Yanrey Point sand sheet

16 D.C. Blandford & Assoc & Oceanica: Straits Salt: Physical Environment
4.2.4 Fringing dunes The western edge of the dunefield landscape sharply abuts the salt flats. In several areas along this boundary (and on several mainland remnants), a fringing dune landform unit has formed (Plate 4.8). This unit consists of two elements which may occur together or separately: (1) a larger highly-stratified fringing foredune; and to the west of this, (2) a smaller frontal dune. The fringing foredunes have formed from deposition of wind-blown sands sourced from the salt flat. Whereas, the frontal dune has been formed by storm surge. Storm debris lines are often observed within the fringing dune landform and are more common on the mainland remnants towards the west (Plate 4.9).
Source: M. Bailey
Plate 4.8 Eroding fringing foredune along the western edge of the dunefield landscape with a younger and smaller frontal dune along the base

D.C. Blandford & Assoc & Oceanica: Straits Salt: Physical Environment 17
Source: B.Hegge
Plate 4.9 A well developed storm debris line (including washed-up dingy) present on western edge of a mainland remnant
4.3 SALT FLAT
The salt flat landscape element is also known as the Onslow Plain (Jennings and Mabutt 1986). This plain is only rarely inundated by marine waters and then only under cyclonic surge events. The salt flat landscape includes the following landform units: salt flats and mainland remnants. These landform units are described below.
4.3.1 Salt flats The salt flat landform covers the largest area of all the landforms units in the study region. This landform extends from the fringing dunes of the dunefield landscape to the coastal fringe and ranges in width from 4.5 to 13 km. The salt flats, which extend from Sandalwood Peninsula to Locker Point, form a flat featureless plain (Figure 4.2, Plate 4.10). There is very little evidence of significant fluvial sediment deposition along the eastern edge of the salt flats (Plate 4.11). Some areas, generally towards the eastern edge of the salt flats, show the faint impression of previous tidal creeks which have been infilled (Plate 4.12). The salt flats are only inundated by marine waters under cyclone generated surge events (Plate 4.13).

18 D.C. Blandford & Assoc & Oceanica: Straits Salt: Physical Environment
Figure 4.2 Traverse cross-sections

D.C. Blandford & Assoc & Oceanica: Straits Salt: Physical Environment 19
Source: D. Blandford
Plate 4.10 Featureless salt flat landform
Source: D. Blandford
Plate 4.11 Mouth of the Yannarie River South where it discharges to the salt flat. Discolouration at the mouth is due to the deposition of terrestrial sediments

20 D.C. Blandford & Assoc & Oceanica: Straits Salt: Physical Environment
Source: D. Blandford
Plate 4.12 Pattern of relic tidal creek visible on salt flat
Source: B. Hanstrum
Plate 4.13 Inundation of salt flats following Tropical Cyclone Vance (24 March 1999)

D.C. Blandford & Assoc & Oceanica: Straits Salt: Physical Environment 21
4.3.2 Mainland remnants The salt flat landform unit contains a number of mainland remnants (Plate 4.14). These features are remnants of the dunefield landscape which once extended to the eastern shore of Exmouth Gulf and now remain isolated on the salt flats following a small marine transgression/regression. Hence, the majority of the remnants contain a physical framework typical of the dunefield landscape, in particular, longitudinal dunes, interdunal swales/claypans and fringing foredunes. However, the interdunal swales/claypans do not exhibit the same degree of eroision as those within the dunefield landscape. A foredune unit (with occasional debris lines) is located on the southern and western edge of some of these mainland remnants (see Plate 4.9), and is generally better developed on the remnants located towards the western edge of the salt flat landscape.
Source: D. Blandford
Plate 4.14 Example of a mainland remnant showing presence of longitudinal dunes and claypans
4.4 COASTAL FRINGE
The coastal fringe landscape element lies along the western edge of the study area and forms the eastern fringe of Exmouth Gulf. This coastal fringe includes the following landform units: tidal creeks; foredunes, sand sheet, beaches and limestone outcrops. Each of these units is described below.
4.4.1 Tidal creeks The tidal creeks and associated intertidal mangroves forms a major bio-physical system along the western boundary of the project area. The tidal creek unit is characterised by sinuous tidal creeks, mud/sand flats and a discontinuous mosaic of mangals (Plate 4.15 and Plate 4.16). This unit extends along the eastern shore of Exmouth Gulf from Sandalwood Peninsular to Locker Island. The tidal creek unit is

22 D.C. Blandford & Assoc & Oceanica: Straits Salt: Physical Environment
most extensive in the sheltered environments south of Hope Point. North of Hope Point this unit is most developed in the sheltered lee of the offshore islands and points, including Hope Point, Simpson Island, Burnside Island and Tent Island. Five mangrove associations have been identified in the study region (Biota 2005a). The mangroves form a fringe along the edge of the sinuous tidal creeks and they reduce in density with distance inland, and with distance from the edge of the creeks. Tidal creeks are associated with relatively high tidal ranges with low gradient shores. The tidal creeks typically form a wide mouth which narrows and shallows upstream via a sinuous channel which becomes dendritic towards the landward (eastern) end. An algal mat, which grades into the salt flat landform unit (Plate 4.17), often forms a narrow fringe immediately landward of the mangrove zone. The algal mat communities are sustained by occasional inundation by spring high tides.
Source: D. Blandford
Plate 4.15 Intertidal mangrove system showing tidal creek and fringing mud/sand flats

D.C. Blandford & Assoc & Oceanica: Straits Salt: Physical Environment 23
Source: D. Blandford
Plate 4.16 Tidal creek and fringing mangroves with algal mat visible in lower right foreground
Source: M. Bailey
Plate 4.17 Rising tidal front traversing algal mat inshore of the mangroves south of Hope Point
24 D.C. Blandford & Assoc & Oceanica: Straits Salt: Physical Environment
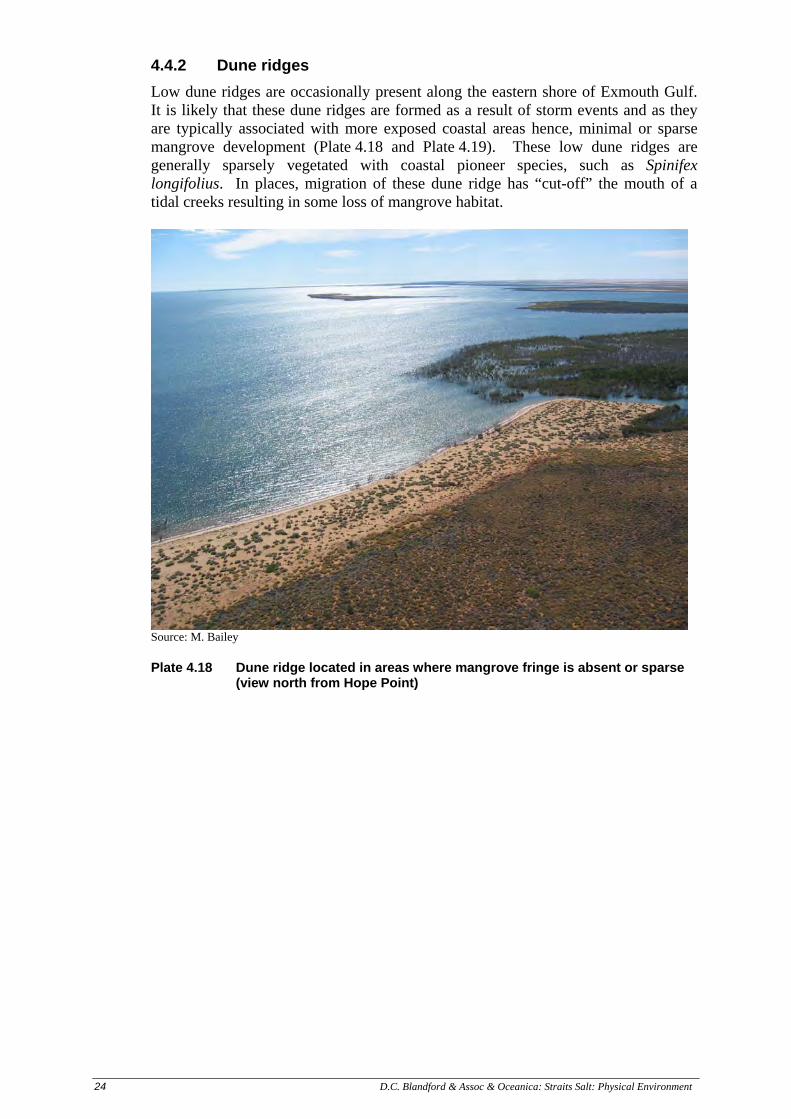
4.4.2 Dune ridges Low dune ridges are occasionally present along the eastern shore of Exmouth Gulf. It is likely that these dune ridges are formed as a result of storm events and as they are typically associated with more exposed coastal areas hence, minimal or sparse mangrove development (Plate 4.18 and Plate 4.19). These low dune ridges are generally sparsely vegetated with coastal pioneer species, such as Spinifex longifolius. In places, migration of these dune ridge has “cut-off” the mouth of a tidal creeks resulting in some loss of mangrove habitat.
Source: M. Bailey
Plate 4.18 Dune ridge located in areas where mangrove fringe is absent or sparse (view north from Hope Point)

D.C. Blandford & Assoc & Oceanica: Straits Salt: Physical Environment 25
Source: M. Bailey
Plate 4.19 Dune ridge along shore south of Hope Point
4.4.3 Sand sheet The sand sheet landform occurs to the north of the region at Locker Point and is similar in morphology to the Yanrey Point sand sheet. The sand sheet forms an extensive area of unconsolidated mobile sands which cover the majority of Locker Point (Plate 4.20). Within the sand sheet, dunes exhibit a transverse/barchan form indicating a relatively constant wind direction (from the south/south-west) and a moderate sand supply. A deflation zone occurs along the western edge of this sand sheet and areas of deflation are also present in several of the dune swales. The dunes within the sand sheet have an average height of approximately 3 m but range up to maximum heights of 6–7 m. During Tropical Cyclone Vance, dunes along the western edge of the dunefield were significantly affected (Plate 4.21); lower dunes were completely removed by overtopping waters whereas erosion and scarping occurred in areas of higher dunes (Nott and Hubbert 2003). This event also resulted in considerable mangrove and seagrass losses along the east coast of the Gulf (Loneragan et al. 2003).

26 D.C. Blandford & Assoc & Oceanica: Straits Salt: Physical Environment
Source: B. Hegge
Plate 4.20 Sand sheet with dunes at Locker Point
Source: B. Hanstrum
Plate 4.21 Locker Point sand sheet following surge inundation by Tropical Cyclone Vance (23 March 1999)

D.C. Blandford & Assoc & Oceanica: Straits Salt: Physical Environment 27
4.4.4 Beaches Sandy beaches are relatively uncommon across the study region but increase in occurrence to the north of Hope Point. In essence, the distribution of sandy beaches is inversely related to the intertidal mangrove landform and indicates the increased exposure to wind wave energy with distance northwards. The most extensive sandy beaches occur along the south-western flanks of Hope Point, Tent Island and Locker Point. These locations have the greatest exposure (fetch length) to the prevailing south/south-westerly wind waves. These sandy beaches are generally characterised by narrow sub-aerial beach and a low, wide sub-aqueous profile, with a ridge and runnel morphology (Plate 4.22). These beach forms are characteristic of tide dominated beach systems with a relatively large tidal range (when compared to wave energy) and a surplus of sediments.
Source: B.Hegge
Plate 4.22 Ridge and runnel morphology of beach on Tent Island
4.4.5 Limestone outcrops South of Hope Point rock outcrops are only present along the shore at Islam Islets and Whalebone Island. However, from Hope Point northwards rock outcrops are more prevalent and occur at Hope Point, Simpson Island, Burnside Island, Tent Island and Tubridgi Point. These outcrops are all limestone which is exposed to form low relief cliffs (Plate 4.23) and platforms (Plate 4.24) along the western shores. At Hope Point and on Simpson and Burnside Islands, these outcrops form low wave-cut cliffs whereas; in other areas including Tubridgi Point, the rock outcrop occurs as a low limestone pavement at the shoreline.

28 D.C. Blandford & Assoc & Oceanica: Straits Salt: Physical Environment
Source: M. Bailey
Plate 4.23 Limestone forming low cliffs on western end of Hope Point
Source: B. Hegge
Plate 4.24 Limestone pavement in nearshore environment immediately north of Tubridgi Point

D.C. Blandford & Assoc & Oceanica: Straits Salt: Physical Environment 29
5. SOILS
5.1 INTRODUCTION AND METHODS
The location and scale of the project area and the apparent level of activity during the more recent period of geomorphic pre-history suggested that the soils would be best defined using a soil landscape approach. A reconnaissance survey indicated that soil horizonation was mainly the result of stratification from erosion/deposition sequences rather than from pedologic processes. The following methodology applied generally to the investigation of soil landscapes and soils in the Project Area.
5.1.1 Literature Review A review of previous work relating to the soils of the project area indicated that the available data was coarse and covered only the regional scale rather than the detail of the project area. No site specific data was available. Soils data for the project area were derived initially from Northcote et al. (1975), including the Soil Map of Australia at a scale of 1:5,000,000 and then from the Atlas of Australian Soils (Bettanay et al. 1965-6) at a scale of 1:2,000,000. These coarse data sets were used to define the range of soils that were potentially present in the project area. The regional physical framework forming the basis for soil development and the potential distribution of profile types and the resultant soil landscapes, was assessed using van de Graaff et al. (1982, and 1980), Hocking (1990), and Struckmeyer and Totterdell (1990). The following major soil units were identified in the region of the eastern Exmouth Gulf at a scale of 1:2,000,000 (Bettenay et al. 1965-6): • Clayey soils of minimal development formed from non-calcareous, firm grey
clays with little pedologic organisation. These soils dominate the tidal zone of the study area. Their Principal Profile Form (PPF) is typically Uf1.41.
• Loamy soils with little development and either calcareous or siliceous. These are medium textured soils of the Onslow Plain, (termed the salt flat in this document) and typically have a PPF of Um1.2.
• Soils with gradational texture profiles, ie. soils with increasing clay content with increasing depth are mapped as the sand plain/dune system (the Carnarvon Dunefield). Typical PPF is Gn2.12.
• Texture contrast soils (Duplex soils) are mapped as the soils of the Alluvial-Colluvial Outwash Plain. Typical PPF is Dr2.33.
These major soil groups, their spatial relationships and PPF are consistent with the observations from the present study. However, the field evidence obtained in the present study indicates that the texture contrast soils may also extend throughout the sand plain and dunefield areas as a function of the geomorphic pre-history, as well as being dominant on the outwash plain. This aspect is discussed further.
30 D.C. Blandford & Assoc & Oceanica: Straits Salt: Physical Environment
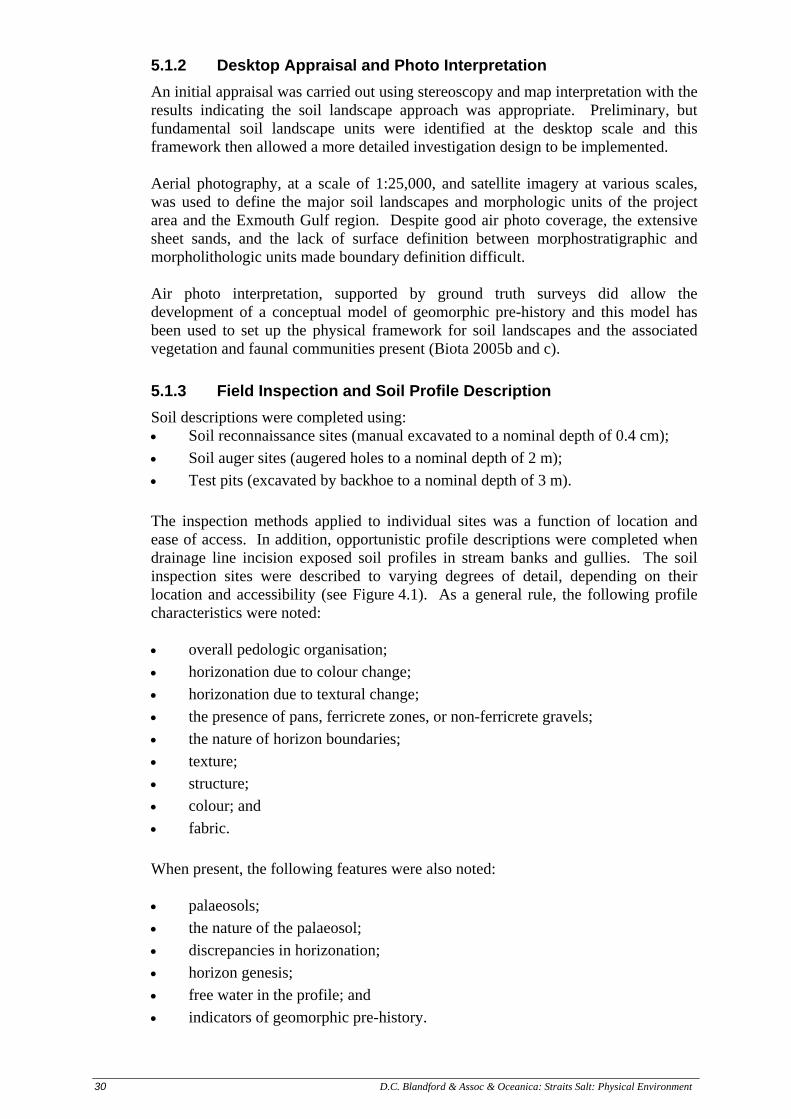
5.1.2 Desktop Appraisal and Photo Interpretation An initial appraisal was carried out using stereoscopy and map interpretation with the results indicating the soil landscape approach was appropriate. Preliminary, but fundamental soil landscape units were identified at the desktop scale and this framework then allowed a more detailed investigation design to be implemented. Aerial photography, at a scale of 1:25,000, and satellite imagery at various scales, was used to define the major soil landscapes and morphologic units of the project area and the Exmouth Gulf region. Despite good air photo coverage, the extensive sheet sands, and the lack of surface definition between morphostratigraphic and morpholithologic units made boundary definition difficult. Air photo interpretation, supported by ground truth surveys did allow the development of a conceptual model of geomorphic pre-history and this model has been used to set up the physical framework for soil landscapes and the associated vegetation and faunal communities present (Biota 2005b and c).
5.1.3 Field Inspection and Soil Profile Description Soil descriptions were completed using: • Soil reconnaissance sites (manual excavated to a nominal depth of 0.4 cm); • Soil auger sites (augered holes to a nominal depth of 2 m); • Test pits (excavated by backhoe to a nominal depth of 3 m). The inspection methods applied to individual sites was a function of location and ease of access. In addition, opportunistic profile descriptions were completed when drainage line incision exposed soil profiles in stream banks and gullies. The soil inspection sites were described to varying degrees of detail, depending on their location and accessibility (see Figure 4.1). As a general rule, the following profile characteristics were noted: • overall pedologic organisation; • horizonation due to colour change; • horizonation due to textural change; • the presence of pans, ferricrete zones, or non-ferricrete gravels; • the nature of horizon boundaries; • texture; • structure; • colour; and • fabric. When present, the following features were also noted: • palaeosols; • the nature of the palaeosol; • discrepancies in horizonation; • horizon genesis; • free water in the profile; and • indicators of geomorphic pre-history.

D.C. Blandford & Assoc & Oceanica: Straits Salt: Physical Environment 31
Samples, representative of the range of materials present, were collected for laboratory analysis from appropriate sites to define the particle size distribution within the profile and within profile horizons and to generally characterise the range of materials present.
5.2 SOIL LANDSCAPES OF THE PROJECT AREA
5.2.1 Introduction As noted previously, the project area is located within the Carnarvon Basin, a major morphotectonic-geological division of Western Australia, and within this Division, the area of interest lies within the salt flat (Onslow Plain) and the dunefield (Carnarvon Dunefield). Within this physical framework, the soils and sediment stratigraphy are complex, reflecting periods of erosion and deposition, the development and deposition of an aeolian sheet sand and dune system, periods of fluvial re-working of sediments, at least one marine transgression and regression, and the development of a fringing coastal dune system that probably represents the most recent major geomorphic episode. Many of the profiles examined in detail reflect this complex physical framework and the soils are simply an arrangement of sediments, the characteristics of which reflect their origin and method of transport and deposition. At some sites, the horizonation present may represent true pedologic organisation, that is, organisation based on the soil forming processes, while at other sites the horizonation is stratigraphic. For this reason, few of the profiles inspected can be defined in terms of the Northcote (1971) classification using PPFs. One PPF was recognised in the project area using the Northcote (1971) system for classifying Australian soils. This PPF was a typical earthy sand and was characteristic of profiles present in longitudinal dunes. The PPF of Uc5.21 was characterised by pedologic organisation that included slight colour changes and fabric development with increasing depth. While it is tempting to try to describe many of the soils according to the Northcote system of classification, the majority of the soil profiles examined were a collection of sediments and did not fit easily into a formal classification system. The following notes describe briefly the typical soil profiles examined in the field and suggests profile genesis. Table 1, following these descriptions, summarises sites and the characteristics of the soil profiles present.
5.2.2 Soils of the outwash plain The soils of the outwash plain were examined by soil auger and by looking at profiles exposed in river banks (the Yannarie River) downstream from Yanrey Homestead. Three sites were examined (Y12, Y11, Y10) and all sites displayed profiles dominated by high rank clays. The true alluvial soils on the Yannarie flood plain demonstrated self-mulching and seasonal cracking light to medium clays. The surface generally comprised a thin veneer of silty sand up to 0.10 m thick. The upper profile on the alluvial soils tended to be neutral to slightly alkaline (pH = 7.5 to 8.0) with low total dissolved solids (TDS = 298 mg/kg). These soils are massive rather than being pedal at depth.

32 D.C. Blandford & Assoc & Oceanica: Straits Salt: Physical Environment
There was little difference in the characteristics of soil profile material along the north-south traverse line selected to try and identify changes in the units of the outwash plain. At all three sites, high rank clays dominated and pH ranged up to 8.2. Small gilgais (soil microrelief typical of clay soils caused by expansion/contraction with changes in moisture content), with diameters up to 1.5 m were present at Site Y11. Site Y10, located east of Wangacoothara Bore, was also dominated by medium clay, with the soil material being non-calcareous. This profile also contained small (3 mm) carbonate nodules and isolated sub-angular to sub-rounded pebbles to 150 mm in diameter. The presence of discrete carbonate nodules and water-worn pebbles testifies to the complexity of profile genesis. Further west at Site Y9, the texture changes to a fine sandy clay loam (FSCL) to sandy clay (SC), a difference identified in the field by coherence and plasticity. The profile at Y9 is described as a massive, dark reddish brown (2.5YR 3/4) platy structured fine sandy clay loam to 0.15 m overlying a massive, dark red (10R 3/4), alkaline (pH 8.6), non-saline (TDS = 292 mg/kg) fine sandy clay loam to sandy clay. This material is located towards the northern boundary of the outwash plain.
5.2.3 Soils of the dunefield It was expected that the soils of this large landscape element would be extremely variable and would be dominated by the Earthy Sands (PPF of Uc5.21) of the longitudinal dunes, and by duplex soils in the interdune areas. It is not until the profile is examined in detail in this landform unit that the complexity of profile genesis and geomorphic pre-history is revealed in the general project area. Site Y7 is a profile site in the floor of a 'typical' claypan. The profile is described as a massive dark red, alkaline, slightly saline, medium clay. Sites Y6 and Y5 are typical profiles associated with longitudinal dunes and are generally described as slightly alkaline, single-grain fabric sands, with clearly defined fabric development with increasing depth, and characterised by the PPF of Uc5.21. The coarse- to medium-grained sheet sands, forming the surface material in this landscape, are generally shallow ie, less than 1.0 m deep, and overlie soil material with elevated clay and total fines content (25–30%< 2 µm). This relationship suggests that the upper surface of the underlying clays is an eroded palaeo surface but no attempt is made here to identify the time frame of the diastem. The deeper profiles described at Sites Y5 and Y6 demonstrate the difficulty in trying to define the profile according to a formal classification system. The horizonation present in these profiles is not due to pedologic organisation but rather to stratigraphy based on periods of erosion and deposition.
5.2.4 Soils of the salt flat A number of traverses were made across the salt flat to assess surface conditions and to sample the sediments of the flat. The field evidence, collected by Parsons Brinkerhoff (2005a), from shallow logs and PSD analysis of near-surface materials suggests a complex stratigraphy resulting from the transport and deposition of terrestrial sediments deposited on the eastern shore of the flats and re-distributed by wind and surges caused by periodic major storms.

D.C. Blandford & Assoc & Oceanica: Straits Salt: Physical Environment 33
The sediments on the salt flat seem to be dominated by terrestrial sediments, reworked to varying degrees by wind and water. The materials present, and their stratographic relationship suggest a constantly changing depositional environment. The presence of the Ashburton palaeo super-delta (see Section 8.3) provides the mechanism for such a relationship. The two major forms of water energy for reworking these sediments are periodic: (1) major storm surges associated with high energy cyclones; and (2) stream discharge associated with major runoff events in the Ashburton palaeo super-delta. It is probable that the clays present at depth are linked to quiescent periods of deposition or backswamp conditions in the super-delta, and have been reworked during the Holocene marine transgression when the waters of Exmouth Gulf extended to the present eastern edge of the salt flats. The associated regression would almost certainly result in the contribution of terrestrial sediments to the system and the reworking of these sediments according to the energy fluxes prevailing at the time. The following notes summarise data from a number of sites investigated by Parsons Brinkerhoff (2005a) as part of engineering studies across the salt flats. Site H001 Located 800 m west of the mainland at Yanrey Point. A silty sand with 87% sand size material in the top 1.0 m of the profile. This is an area of probable accumulation of terrestrial sediments. Site H003 Located 4.5 km west of H001 and 5.3 km west of the mainland at Yanrey Point. A sandy clay loam of probable terrestrial origin with the sediments reworked by major tidal surges. A gravel layer is present at 0.8 m Site H004 Located 7.2 km west of Yanrey Point towards the western boundary of the flats. This is also a complex profile where the top 0.4 m is dominated by an apparently terrestrial sand containing 15% fines. This material overlies a sandy gravel layer where the gravel content exceeds 30% of the PSD curve. This layer in turn rests on a further sandy material but with reduced gravel content at 10%. Site H005 Located 8.7 km west of Yanrey Point at what is the probable western boundary of the salt flat at this location. At this site, the upper 0.8 m of the profile comprises a sandy clay loam with 67% sand and 33% fines suggesting a stronger marine influence. Again, this material overlies a gravelly sand inferring that the gravel layer may be a significant marker bed, the surface of which may represent a major interval (diastem) in the depositional record. However, the influence of major storm surge events on the distribution of surface sediments must be considered in any interpretation of geomorphic pre-history but the spatial continuity of this material at this location suggests a stratum of local significance. Elsewhere on the salt flats, the PSD within the upper profile is characterised by variable sand silt and clay contents with sand contents generally greater than 50% (range 36 to 81%) and fines contents ranging from a low of 14% to a high of 61%. Fines are defined here as silt plus clay.

34 D.C. Blandford & Assoc & Oceanica: Straits Salt: Physical Environment
5.2.5 Soils of the coastal fringe The soils of the coastal fringe are highly variable and no site along the 90 km length of the project area coast can be regarded as being "typical" of the soils present. The sediments making up the soils of the mangrove zone, for example, have all been subject to varying degrees of reworking by coastal currents and diurnal tide movements. Periodic storms provide energy to further sort and redistribute the sediments. The following description relates to a profile that occurs east of Hope Island and towards the western side of the inter-tidal flat. The upper 300 mm comprises fine- to medium-grained sand. This surface layer overlies 200 mm of what is more typically marine silt and then 300 mm of a sandy silt to silty sand containing shell fragments. These upper layers overlie a major horizon, 2.1 m in thickness, of gravelly sand that ranges in size from fine- to coarse-grained and contains abundant shell fragments. This horizon in turn overlies a gravely silt. Approximately 10 km south of this location, the sediments at the eastern edge of the tidal flat, but still in the mangrove zone, gave the following particle size distribution data: 19% clay; 14% silt; 33% fine sand; and 32% medium sand. The remaining 2% comprised coarse sand. In this sample, 67% of the sediments making up the so called “mangrove muds” were sand size particles. The small dunes and beach deposits comprise coarse-grained gritty sands, generally with abundant shell fragments or skeletal remains of marine invertebrates.
5.3 SOIL PROFILES OF THE PROJECT AREA
This section details the characteristics of the major soil profiles examined in the field. A summary of the main sites investigated is presented in Table 5.1 and soil profile descriptions of selected sites are presented in Figure 5.1 to Figure 5.7. The location of these soil inspection sites is shown in Figure 4.1.

D.C. Blandford & Assoc & Oceanica: Straits Salt: Physical Environment 35
Table 5.1 Summary of sites and soil profiles investigated
Soil Inspection Sites Soil description Y3 Truncated profile with a light clay (LC) palaeosol at 1.5 m overlain by fine sand
clay loam (FSCL) with sub-rounded pebbles.
Y4 Strongly duplex with sand surface over fine sandy clay loam (FSCL). Contains nodular calcrete horizon 1.0 m thick between 1 and 2 m depth. Increasing salinity with depth to 12,600 mg/kg. Strongly alkaline.
Y5 Longitudinal dune with Earthy Sand (Uc5.21) overlying truncated profile with medium to high rank clays overlying sand (FSL) at 2.3 m. Strongly alkaline. Increasing salinity to 11,424 mg/kg.
Y6 Deep earthy sand (Uc5.21) profile with fabric development at depth.
Y7 Truncated duplex profile with the surface sand removed. Profile is Uf comprising alkaline medium clay with salinity of 1,817 mg/kg TDS.
Y8 A red (10R3/4) duplex soil (chocolate soil) alkaline to moderately alkaline, non saline. Profile dominated by fine sandy clay loams with the lower horizon calcareous overlying a massive medium clay.
SS1 Uniform red sand profile with a PPF of Uc5.21, Earthy Sand. Fabric is single-grained with increasing fabric development with depth.
SS2 Uniform textured profile with a neutral (pH 7.6) strongly saline (15,040 mg/kg TDS) light sandy clay loam texture (SCL-). Salt crusting on surface and with typical Solonchak appearance. Presence of sub-rounded pebbles at 0.8 m indicates an alluvial origin.
SS3 Red duplex soil (Dr2) with 0.30 m surface sand overlying a slightly alkaline (pH 7.7) saline (6,720 mg/kg TDS) fine sandy clay loam.
SS9 Alkaline (pH8.8) non-saline (129 mg/kg) sand to loamy sand at 0.0–0.5 m. At 1.5 m depth, sand becomes highly stratified, pH remains alkaline (pH 8.1) and salinity increases to 1,920 mg/kg. The basal unit of the dune complex demonstrates episodic erosion by wind with aeolian scour infill. “Calcrete’ nodules occur in the basal unit where the pH is 8.7 and salinity is 1,139 mg/kg TDS.
SS11 Red earthy sand (Uc521) single-grained fabric with fabric development at depth.
SS16 Red duplex soil with the A horizon comprising single grain fabric dunal sands overlying a fine sandy clay loam.
The variability in horizonation, and the variability in materials making up the various strata of the surface soils become apparent away from the deeper sands forming the longitudinal and network sand dunes. An indication of the types of processes operating in the recent past is evidenced by the complex stratigraphy present at Sites Y4, Y5 and Y8.

36 D.C. Blandford & Assoc & Oceanica: Straits Salt: Physical Environment
Figure 5.1 Soil and profile descriptions for inspection sites Y3 and Y4

D.C. Blandford & Assoc & Oceanica: Straits Salt: Physical Environment 37
Figure 5.2 Soil and profile descriptions for inspection sites Y5 and Y5A

38 D.C. Blandford & Assoc & Oceanica: Straits Salt: Physical Environment
Figure 5.3 Soil and profile descriptions for inspection sites Y6, Y7 and Y8

D.C. Blandford & Assoc & Oceanica: Straits Salt: Physical Environment 39
Figure 5.4 Soil and profile descriptions for inspection sites SS1 and SS2

40 D.C. Blandford & Assoc & Oceanica: Straits Salt: Physical Environment
Figure 5.5 Soil and profile descriptions for inspection site SS3

D.C. Blandford & Assoc & Oceanica: Straits Salt: Physical Environment 41
Figure 5.6 Soil and profile descriptions for inspection site SS9

42 D.C. Blandford & Assoc & Oceanica: Straits Salt: Physical Environment
Figure 5.7 Soil and profile descriptions for inspection sites SS11 and SS16
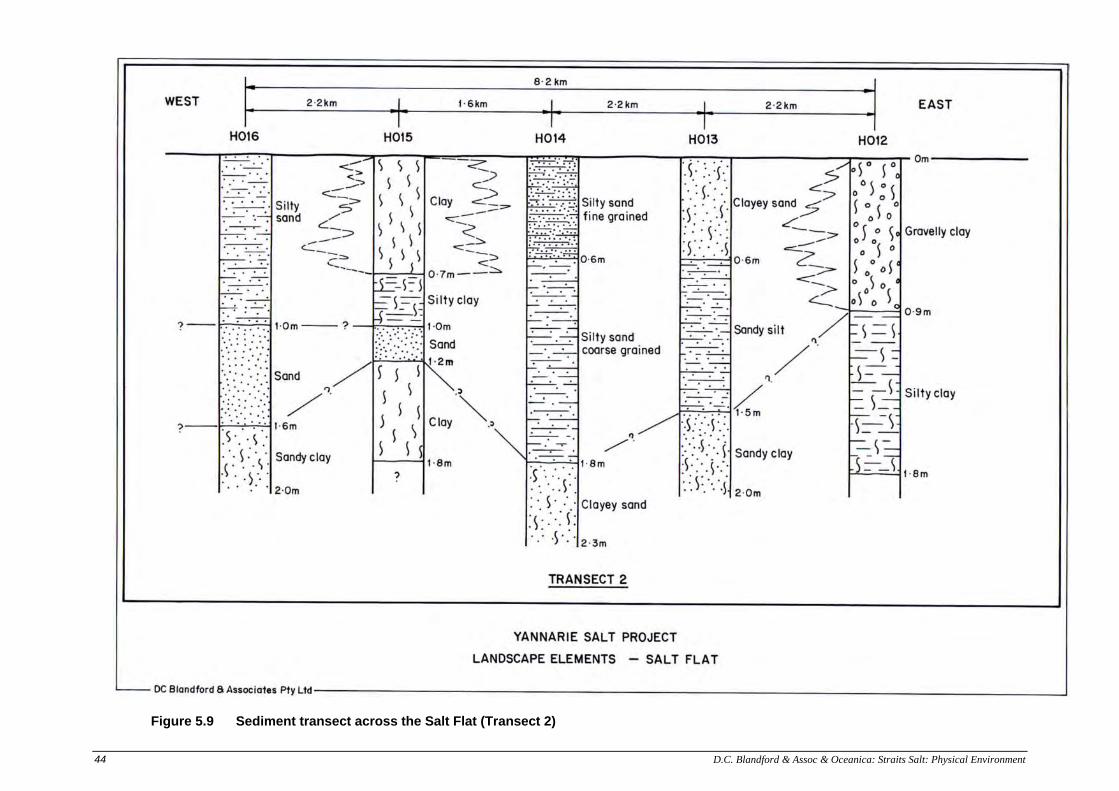
The sediment profiles present across the salt flats have been defined by shallow auger drilling along a series of west–east traverses. Two of these have been selected and presented as long-section profiles, typical of the complexity of the salt flat stratigraphy (see Transect 1 in Figure 5.8 and Transect 2 in Figure 5.9). The presence of sands, inter-bedded sandy gravels and gravely sands, and a distinct lack of spatial continuity in individual strata suggest a colluvial/alluvial origin for these sediments. This in turn suggests that the sediments are part of the older and westward extent of the Ashburton palaeo super-delta.

D.C. Blandford & Assoc & Oceanica: Straits Salt: Physical Environment 43
Figure 5.8 Sediment transect across the Salt Flat (Transect 1)
44 D.C. Blandford & Assoc & Oceanica: Straits Salt: Physical Environment
Figure 5.9 Sediment transect across the Salt Flat (Transect 2)

D.C. Blandford & Assoc & Oceanica: Straits Salt: Physical Environment 45
5.4 MATERIAL CHARACTERISATION
5.4.1 Soil Chemistry Soil pH shows quite high variability throughout the project area (Table 5.2).
Table 5.2 Soil horizon pH and salinity from representative sites
Soil Inspection
Sites
Site
Description
Depth
(m) Soil pH
Salinity
(mg/kg)
Y4 Interdune swale 0.1 1.0 2.1 3.6
8.0 8.8 8.5 8.3
130 5,897 7,000
12,600 Y5A Sand dune/swale 3.5 8.5 11,424 Y6 Sand dune 2.1 7.6 Y7 Claypan 1.1 8.1 1,817 SS2 Saline Flat 0.4 7.6 15,040 SS3 Interdune area 0.4 7.7 6,720 SS9 Coastal Dune
(basal unit)
0.4 1.5 1.6
8.8 8.1 8.7
129 1,920 1,139
5.4.2 Particle Size Distribution The particle size distribution (PSD) of the materials sampled reflects the variation in materials and depositional environment. Table 5.3 presents the PSD of a range of materials sampled during field investigations. Detailed PSD’s are provided in the Appendix.

46 D.C. Blandford & Assoc & Oceanica: Straits Salt: Physical Environment
Table 5.3 Particle size distribution of selected soil materials
Landscape Element/
Soil Inspection Sites
Depth
(m)
Clay
(%)
Silt
(%)
Sand
(%)
Gravel
(%) Alluvial/Colluvial Plain Y7 1.00 43 19 38 0 SS5 0.40 5 5 90 0 Dune Field Y3 1.00 30 15 47 8 Y4-1 Y4-5
0.10 3.60
3 34
4 24
93 36
6
Y5A-1 Y5A-2
1.80 3.00
51 19
25 7
7 73
17 1
Y6 0.90 4 1 95 0 Mainland Remnants SS11 0.40 1 1 98 0 SS14 0.30 11 8 76 5 SS16 0.30 7 4 89 0 SS13 0.30 8 5 55 32 SS12 0.30 3 2 95 0 SS10 0.30 4 1 95 0 SS20 0.30 3 1 96 0 SS18 0.30 7 2 91 0 Salt Flat H001 0-0.95 8 5 87 0 H003 0-0.80 10 9 66 15 H004
0.2-0.4 0.4-1.0 1.0-1.5
11 10 12
4 5 6
85 53 72
0 32 10
H005 0.3-0.8 18 15 67 0 H018 0.5-1.3 12 7 81 0 H025 0.2-0.7 12 16 72 0 H030 0-0.6 6 8 75 11 H031 0.8-1.4 35 6 58 1 H035 1.0-1.5 24 37 36 3 Coastal Fringe CF1 0.35 19 14 67 0
Notes: Clay is material <0.002 mm in diameter Silt is material from 0.002 to 0.06 mm in diameter Sand is material from 0.06 to 2.0 mm in diameter Gravel is material from 2.0 to 60 mm
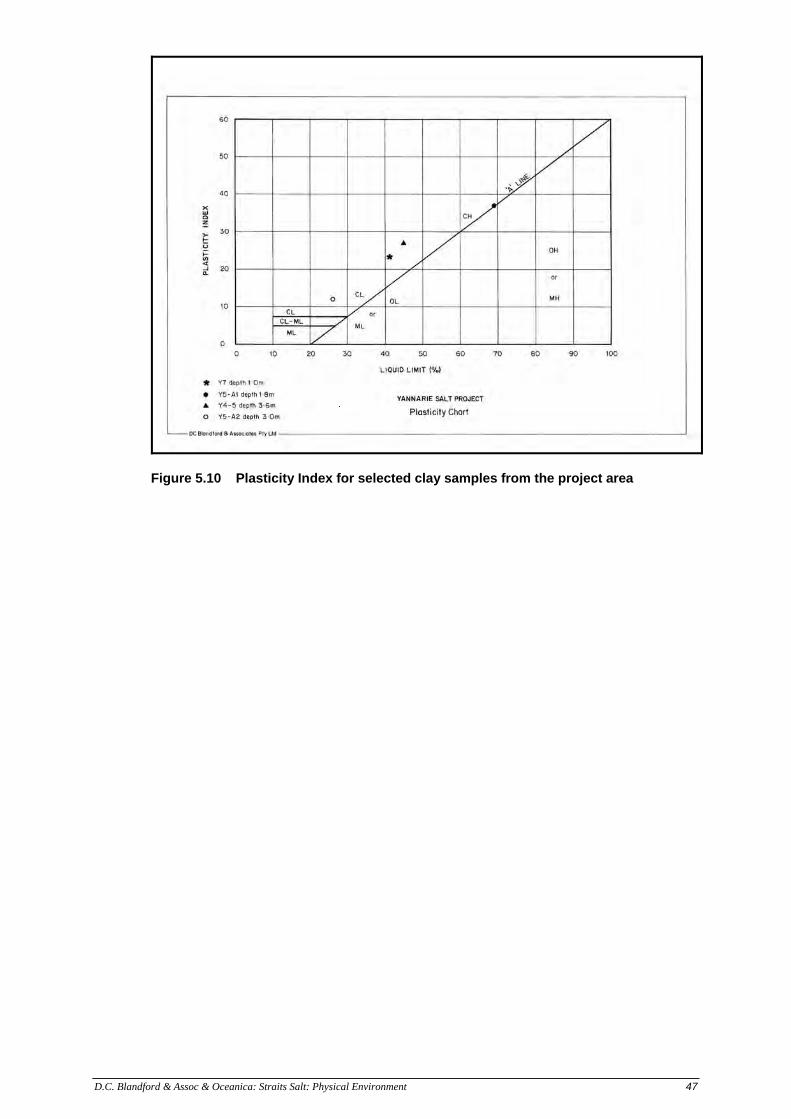
5.4.3 Atterburg Limits While determination of the PSD of a soil allows definition of the texture of a soil and how that particular soil will behave, PSD is not a useful indicator for determining the behaviour of fine-grained soils. In terms of engineering properties, the shape rather than the size of the particles is important in defining behaviour. The cohesive nature and hence performance of the fine-grained soils is directly impacted by moisture content. A limited number of high clay content samples, considered to be representative of fine-grained soils from the project area were tested and the results are set out in the Plasticity Chart below (Figure 5.10).
D.C. Blandford & Assoc & Oceanica: Straits Salt: Physical Environment 47
Figure 5.10 Plasticity Index for selected clay samples from the project area


D.C. Blandford & Assoc & Oceanica: Straits Salt: Physical Environment 49
6. HYDROLOGY
6.1 SURFACE HYDROLOGY
These notes are based on a report prepared by Parsons Brinkerhoff on the surface hydrology of the project area (Parsons Brinkerhoff, 2005a).
6.1.1 Introduction Flows in the drainage lines of the study area, exhibit a complex interrelationship between water course, location, floodplains, claypans and a suite of longitudinal and network sand dunes. In addition, due to the arid climate and very high evaporation rates, the occurrence of overland flow is rare and usually only associated with tropical cyclone events. The significant water courses in the study area include: Yannarie River, Rouse Creek and Chinty Creek. The Ashburton River discharges to the north of the study area.. In the study area, the majority of freshwater flow occurs within the Yannarie River and Rouse Creek systems. The Yannarie River is the major river system of the study area and has a length of about 185 km and catchment area of approximately 4300 km2 (Parsons Brinkerhoff 2005a). The Yannarie River system, which is generally linear, rises in High Range, approximately 140 km south-east of the North West Coastal Highway. It is approximately 260 m wide at the North West Coastal Highway (Plate 6.1) and this width decreases to approximately 140 m immediately downstream from Yanrey Homestead. The well-defined drainage line of the Yannarie River extends downstream from the North West Coastal Highway for some 45 km before losing its identity on the outwash plain just downstream from Yanrey Homestead. The average stream gradient from the headwaters to the flood-out on Yanrey Station is approximately 0.2%. During flood conditions, the Yannarie River discharges as sheet flow onto the alluvial plain. As the depth of flow increases, adjacent but smaller interdunal basins, including claypans, also become flooded. The majority of the water discharged to these storage areas is eventually lost through evaporation and to a lesser extent through infiltration. Only under very high flow conditions does water discharge via Yannarie River South or Yannarie River North onto the salt flats (Plate 6.2). Rouse Creek, which parallels the Yannarie River system, has a catchment area of 1,700 km2 and a stream length of 75 km. The defined channel of Rouse Creek is approximately 95 m at the crossing of the North West Coastal Highway (Plate 6.3), but then loses its identify approximately 10 km downstream of the Highway. At this point, the majority of flow spreads as sheet flow into the interdunal basins noted above. During high flow events, some of the water from Rouse Creek has been reported to flow into the Ashburton River and may discharge onto the salt flats via Rouse Creek South and Rouse Creek North. Some water from Rouse Creek may also flow into the Yankagee Claypan.

50 D.C. Blandford & Assoc & Oceanica: Straits Salt: Physical Environment
Source: D. Blandford
Plate 6.1 View of Yannarie River downstream from the North West Coastal Highway
Source: M. Bailey
Plate 6.2 The mouth of the Yannarie River South at its discharge point onto the salt flats

D.C. Blandford & Assoc & Oceanica: Straits Salt: Physical Environment 51
Source: D. Blandford
Plate 6.3 View downstream of Rouse Creek from North West Coastal Highway
6.1.2 Stream discharge Peak flows and annual flow for average recurrence intervals (ARI) of 1 in 5, 10, 20, 50 and 100 years have been estimated using a runoff routing programme. The results show that no significant run-off occurs in either the Yannarie or Rouse systems from the annual and 2-year ARI rainfall events, a result consistent with site observations. This is true for both the the crossings at the North West Coastal Highway and at Yanrey Station homestead. Annual events are usually generated by thunderstorms, the occasional scattered rainfall depressions or residual depressions dispersed from elsewhere. These more common rainfall events are usually very localised and may cover only a small proportion of the catchment areas. The larger flood events, such as the 1 in 20 years ARI floods, are usually generated by cyclones either depositing rain directly over the catchments, or brought about by rain bearing depressions, which generate outside the catchment areas. Peak flows have been estimated at the bridges on the North West Coastal Highway and then further downstream near Yanrey Station where the flow starts to spread into various storage depressions before some of the excess flow eventually discharges to the salt flat if the water levels reach sufficient height to develop a hydraulic head. The critical storm duration for the Yannarie River catchment is approximately 24 hours and the associated 1:100 year total rainfall is 268 mm. The critical storm duration for the catchment of the Rouse is about 12 hours. However, for discharge calculation purposes, a 24-hour duration is applied to both catchments. Sometimes large flow events in catchments such as is the Yannarie are the results of the combination of more than one storm falling in the same catchment area, with quite different spatial and temporal patterns.

52 D.C. Blandford & Assoc & Oceanica: Straits Salt: Physical Environment
Peak flows at the bridges on the North West Coastal Highway are greater than the peak flow downstream near Yanrey Station for both the Yannarie and the Rouse systems. This reduction in peak flows is due to attenuation brought about by factors such as flatter slopes, the streams becoming less defined, shallower and wider flow, and the elongated nature of the last reaches of the waterways. A summary of discharge for the Yannarie River and Rouse Creek is presented in Table 6.1.
Table 6.1 Estimated peak flows and volumes of Yannarie River and Rouse Creek
12 hour 24 hour
Design Flow
Peak Flow
Bridge (m3/s)
Volume (M m3)
Peak Flow
Yanrey (m3/s)
Volume (M m3)
Peak Flow
Bridge (m3/s)
Volume (M m3)
Peak Flow
Yanrey (m3/s)
Volume (M m3)
Yannarie River
Q5 0 0 0 0 0 0 0 0
Q10 14 3.0 13 3.4 20 4.2 19 5.0 Q20 83 13.4 78 15.8 514 60.0 484 71.6 Q50 503 64.3 483 76.6 1714 106 1620 192 Q100 879 103 851 124. 3,000 256 2,848 306
Rouse Creek Q5 0 0 0 0 0 0 0 0
Q10 18 1.5 12 1.9 27 2.0 18 2.7 Q20 110 6.3 72 8.4 577 27.6 442 37.2 Q50 405 29.7 379 39.9 1,731 73.6 1,427 99.3 Q100 701 47.6 663 64.2 3,072 148 3,033 200
Source: Parsons Brinkerhoff (2005a) The estimated 24-hour storm peak flows from the Yannarie at the North West Coastal Highway for the 20, 50 and 100 year ARI are 577, 1,700, and 3,000 m3/s, respectively. Both catchments produced similar peak flows for the 24-hour, 100-year storms, even though the Yannarie catchment is approximately 2.5 times that of Rouse. This results from catchment characteristics where the Yannarie catchment is typically more elongated compared to Rouse. This greater runoff distances offsets the time of concentration of the subcatchments at the discharge outlet (ie. flows dissipated in the nearest subcatchments by the time the furthest subcatchment contributed). Subsequently a ‘flatter’ discharge hydrograph results. Conversely, for the concentric Rouse catchment, the time of contribution from the subcatchment is closer aligned, thus reponds more rapidly (ie. narrower discharge hydrograph). Figure 6.1 and Figure 6.2 show the hydrographs of the Yannarie and Rouse at the bridges on the North West Coastal Highway and further downstream.

D.C. Blandford & Assoc & Oceanica: Straits Salt: Physical Environment 53
Source: Parsons Brinkerhoff (2005a)
Figure 6.1 Yannarie River 100-year 24-hour hydrograph
Source: Parsons Brinkerhoff (2005a)
Figure 6.2 Rouse Creek 100-year 24-hour hydrograph
During the March 2004 flood event, 360 mm of total rainfall was recorded over a period of 24 hours and during the flood event of March 1999 about 240 mm of total rainfall was recorded over a period of 24 hours. The 360 mm of rainfall which caused the 2004 flood event had a return period of more than 1 in 100 years, regardless of whether the storm duration was 6, 12 or 24 hours.

54 D.C. Blandford & Assoc & Oceanica: Straits Salt: Physical Environment
The total rainfall of 240 mm. which caused the March 1999 flood event, had a return period of between 20 years and 100 years, depending on whether the storm duration was, 24, 12 or 6 hours. During the March 2004 flood event, the upstream water level of the Yannarie at the bridge on the North West Coastal Highway was observed to be between 1.5 to 2.0 m below the deck of the bridge. Such a water level gives an estimated peak flow of 3,000 m3/s (1:100 ARI) in the hydrological modelling of the catchment. Similarly the bridge over the Rouse on the North West Coastal Highway was observed to be flowing almost to full capacity during the 1999 and 2004 flood events but was never overtopped.
6.1.3 Flood plain interaction The existing watercourses and outlets to the salt flats are inter-connected by a 200 km2 flood plain. A satellite image recorded shortly after Tropical Cyclone Vance crossed the area, was used to establish the following flow characteristics: • Flows that breakout from Rouse Creek during major storm events spread both
north and westwards; • Flows travelling north are partly contained within the local dunal systems and
partly make there way out towards the salt flat via interdunal flows; • Flows that are west bound appear to be partly contained by local depressions
and channels with most continuing on to meet up with the Yannarie system; and;
• Flows that discharge from the Yannarie River are temporarily stored within the flood plain before continuing west or dispersing northwards into claypans and interdune depressions according to the hydraulic head generated.
6.1.4 Discharge from major storms Storages provided by the flood plain and interdunal basins, including claypans, greatly influence discharge at the four main outlets. Outflows have been conservatively estimated on the assumption that inflows from the Yannarie River and Rouse Creek are fed directly into the flood plain as storage. In reality, only a portion of the flows from Rouse Creek ends up in the flood plain with most being captured by local depressions and interdunal flows north of the flood plain. Table 6.2 below is a summary of stream discharge:
Table 6.2 Outlet discharge summary
20-Year 100-Year Location
Q (m3/s) H (m) V (m/s) Q (m3/s) H (m) V (m/s) Yannarie South 150 0.7 2.2 1010 2.2 4.5 Yannarie North 50 0.4 1.5 780 1.8 4.3 Rouse South 15 0.2 0.8 490 1.8 2.7 Rouse North 10 0.2 0.7 460 1.9 3.0
Source: Parsons Brinkerhoff (2005a) As expected from field inspections of the drainage line outlets, the above results indicate that Yannarie South is the dominant outlet. For intermediate storm events such as the 20-year ARI, over 65% of the total outflows is discharged via this outlet. The percentage is reduced to some 35% for 100-year ARI but is expected to increase to 80% for the lesser storms such as the 10-year ARI.

D.C. Blandford & Assoc & Oceanica: Straits Salt: Physical Environment 55
Peak discharge through the Yannarie North outlet accounts for approximately 25% of the total outflows for both the 20- and 100-year ARI storm events. The remaining Rouse South and Rouse North outlets, where flows take on a less direct path, each accounts for approximately 10% of the total outflows. The storage head (ie. water level at the flood plain) for the 20- and 100-year ARI storms was estimated to be 1 and 3 m respectively. This range is consistent with the anecdotal evidence that during Tropical Cyclone Faye (March 2004), flooding near Yanrey Station was in excess of 2 m. Discharge hydrographs are presented in Figure 6.3.

56 D.C. Blandford & Assoc & Oceanica: Straits Salt: Physical Environment
Source: Parsons Brinkerhoff (2005a)
Figure 6.3 Discharge hydrographs for the 100-year ARI runoff event

D.C. Blandford & Assoc & Oceanica: Straits Salt: Physical Environment 57
Peak flows at the Yannarie South and North outlets are expected to exceed 4 m/s for 100-year ARI storms. At these velocities, the suspended and saltation load of the discharge will be very high resulting in a fully loaded water column. This would result in negligable erosion of the salt flat. Velocities for the Rouse outlets are less than those at the Yannarie.
6.1.5 Discharge from minor storms The losses incurred from overland flows within the Yannarie and Rouse systems greatly limits the discharge at the outlets and based on the recommended losses in Pilgrim (1987), these systems will not generate sufficient rainfall excess for the lesser storm events to produce any runoff. This suggests that these two systems are effectively disconnected from the outlet sub-catchments during minor storms. Interogation of the daily rainfall data obtained from the Bureau of Meterology shows that the regional temporal pattern are mainly in clusters of one, two and three days. Because the data itself are not available in smaller increments (such as minutes or hours), it would be unreasonable to model the subcatchments for storms other than the 24, 48 and 72 hour durations. The outcome based on an initial loss of 22 mm and a continual loss of 5 mm shows that the only flow generated in the modelling came from the Yannarie South outlet for the 2-year, 24 hour ARI storm. A broad historical assessment of runoff potential was carried out for the last 30 years (ie. between 1971 and 2000 inclusive). During this period, it is estimated that on a total of 10 occassions, discharge from the Yannarie South outlet was due to a 2-year, 24-hour storm. The estimated average volume of discharge from these minor storms is approximately 17,000 m3. The above statistics are an indication of the infrequent and random nature of minor storms in the Exmouth Gulf region. In addition, the volume discharged onto the salt flat by these minor storms can be considered as insignificant. Evaporation of approximately 9 mm/d very quickly reduces the volume of water present on the salt flat following these minor events.
6.1.6 Fate of discharge from mainland streams The surface hydrology of the Yannarie Salt Project Area is a key component in the description of the physical environment. Surface drainage systems, and their dependence on rainfall resulting from cyclonic and regional weather patterns for episodic discharge, are linked directly to project engineering design on the one hand and to an understanding of the relationships between the hinterland, the salt flats and coastal zone ecology on the other. Parsons Brinckerhoff have provided data detailing the complexity of the surface hydrology of the terrestrial environment and have, through the results of modelling, identified the magnitude and frequency of a range of discharge events for the Yannarie and Rouse drainage systems. The results to date allow a description of the surface hydrology up to the discharge point of the Yannarie and Rouse systems onto the salt flats. The fate of this discharge is central to consideration of salt field design and definition of links between the mainland and the mangrove zone along the western edge of the salt flats.

58 D.C. Blandford & Assoc & Oceanica: Straits Salt: Physical Environment
The salt flat, onto which stream discharge occurs, has its genesis in a Holocene marine transgression which resulted in erosion, in part, of the original Quaternary/?Pliocene outwash plain. The result, following a return to pre-transgression sea level, was the formation of a broad, flat, featureless plain up to 13 km wide extending from the mainland to the newly formed shoreline of the mangrove zone. The destruction of the original outwash plain, and its superimposed sand sheet and dunefield was not complete as areas of the plain with elevated relief remained behind when the regression phase was complete. These areas, which now appear as mainland remnants across the salt flat, generally contain all the physical attributes of the mainland dunefield systems. In terms of understanding the relationship between the drainage systems and the salt flat, it is necessary to understand that what water is available for discharge is the result of either a prolonged high intensity rainfall event generated by a local cyclone or the result of regional rainfall generated by a decaying cyclone or by local storms yielding high intensity rainfall. The data provided by Parsons Brinckerhoff indicate that the 1:100-year ARI event will discharge to the salt flat. Smaller events, such as the 1:20-year ARI down to the 1:2-year ARI, will also discharge to the salt flat but with greatly diminished volumes of water. Ultimate discharge to the salt flat is the end result of surface runoff from the Yannarie and Rouse systems being routed through the flood plain where some storage occurs, and some flow being diverted north through the dunefield system where further storage occurs. This is a very complex surface hydrological system that converts a 1:100-year peak flow in the Yannarie River at the bridge on the North West Coastal Highway of 3,000 m3/s to a 990 m3/s peak flow at the mouth of the Yannarie South channel where it discharges to the salt flat The performance of any single discharge event is dependent on a number of factors, key among which are the sediment load of the discharge, the depositional patterns of sediment resulting from the last discharge event, the degree of re-working of salt flat sediments by storm surges, and the simple relationship of the presence of water on the salt flat at the time of discharge and the depth of this water. Discharge from the Yannarie South channel can be likened to a garden hose lying at the edge of a very large slab of concrete where the area of the slab of concrete is at least 50 m square and is effectively impermeable. Simulation of the 20-year ARI storms and less is provided by turning the hose on briefly for a few seconds then turning it off. Discharge is seen to spread out from the hose according to the roughness and slope of the concrete slab. The short time the hose is on means that little water is discharged to the slab and it travels a very short distance before flow stops. Over time, this thin veneer of standing water evaporates. The same scenario applies to the larger 1:100-year event. Here, the hose is turned on for several minutes only this time, the tap is turned on slowly at first then gradually turned full on then slowly turned off. The distribution pattern of water across the concrete is identical except that the area covered is larger. What is important is that the leading edge of the sheet of water on the salt flat is travelling at a very high velocity and depth at the outlet point but both depth and velocity dissipate rapidly with increasing distance from the outlet. If we simulate a storm surge, we have five fire fighting hoses lined up along the opposite side of the slab. They are all turned on together and their combined effect is to inundate the slab, meeting and combining with the discharge from our garden hose. The waters are mixed and flows become indistinguishable. When the hoses

D.C. Blandford & Assoc & Oceanica: Straits Salt: Physical Environment 59
are turned off, flows stop, energy dissipates, (sea level returns to normal), and the slab dries out, ready for the next event. An attempt to define the fate of discharge has been made by taking the Q100 peak flow data and converting it to a constant flow regime at a given distance across the salt flat. At the mouth of the Yannarie South drainage channel, the geometry of discharge for the 1:100-year event is a stream of water 100 m wide, flowing 2.2 m deep and with a discharge velocity of 4.5 m/s. The potential flow was modelled (without considering the rising and falling limbs of the hydrograph) by developing a series of channels with increasing width with incremental increases in distance from the discharge datum. Each increase in channel width has been accompanied by a corresponding decrease in water depth with a calculated resultant flow velocity. In simple terms, as the width of flow increases, the depth of flow decreases and the velocity of flow decreases to the point where, at approximately 1.6 km from the discharge point, the flow is 1,500 m wide, is less than 1 cm deep, and is flowing at approximately 0.01 m/s. A number of calculations were carried out using a range of roughness coefficients (n) to assess the sensitivity of the model to this parameter. Further, at the 600 m mark from the discharge point, the slope of the salt flat was reduced, and ‘n’ was also reduced in accordance with the changed surface conditions, to counter the artificial effect of the ‘delta’ at the discharge point, a feature readily visible on satellite imagery. In addition to the dynamics of the discharge event, surface hollows and depressions exist across the salt flat. These will result in both the ponding of water and channelling of flows, according to the spatial relationship and interconnectedness of these features. Further, when flows of such dimensions, ie 1 cm deep and flowing at 1 cm/sec, are subject to strong winds, these winds can stop the discharge and cause it to travel down wind. In this scenario, southerly winds can blow the water back across the salt flat towards the mainland. This surface phenomenon has been observed at Lake Carey in the goldfields region of Western Australia. For this flow to continue to the coast, it would require sustained discharge at over the 100-year peak flow of 990 m3/s. The model indicates that under conditions of discharge to a ‘dry’ salt flat, runoff from the 100-year event will not reach the mangrove zone. However, if the rainfall event does have a true 1:100-year ARI associated with a local cyclone, then the salt flat will most likely be saturated from rainfall on the one hand and may be subject to storm surge on the other. This means that the depth and nature of water at the mangrove zone and across the salt flat will be determined by tidal effects and storm surge, rather by stream discharge. There is also a very complex relationship between the time when rainfall occurs, the duration of the event, the timing of a storm generated surge, and ultimate stream discharge. Anecdotal evidence indicates that, as a result of low surface gradients, it can take up to a week for flood waters at Yanrey Station homestead to reach the salt flat. Such a delay suggests that any storm surge may be well passed prior to discharge occurring. Based on the discharge characteristics of the Yannarie South drainage system, there appears to be no direct hydrologic link between discharge from the mainland drainage systems and the ecosystems of the project area mangrove zone. If runoff were to reach this zone, it would be aided by higher sea levels, resulting from extreme storm events, transgressing the salt flat. Further, given the long time frame and periodicity of such events, it is most unlikely that the coastal zone ecosystems rely on energy flows generated by mainland stream discharge.

60 D.C. Blandford & Assoc & Oceanica: Straits Salt: Physical Environment
6.2 GROUNDWATER HYDROLOGY
6.2.1 Introduction This section has been extracted and summarised from a report prepared by Parsons Brinckerhoff (2005b). The hydrogeological component of the physical environment is important in understanding the links between surface water drainage, claypan recharge and discharge, and the washout features observed from the dunefields onto the salt flats. Hydrogeological processes often play a significant role in controlling or buffering surface water flows in this type of environment and the contribution of baseflow to any potential flood event needs to be incorporated into engineering design. The investigation concentrated on the superficial aquifer formations in the project area as potential issues concerning hydrogeological processes relevant to the proposed development are generally limited to the superficial aquifer formations. Further investigations into the properties of the underlying confined hydrogeological formations in the study area have not been carried out and are not considered of direct relevance to this study.
6.2.2 Methods The methods adopted for the groundwater study are detailed below. They include a review of appropriate literature, interrogation of available databases, and a limited drilling programme. The following two published map sheets provide relevant geological and hydrogeological information on the study area: • Talandji 1:100,000 Topographic Survey (Royal Australian Survey 1989); and, • Yanrey–Ningaloo 1:250,000 Geological Map (GSWA 1980). Approximately 90 bores or wells occur within a 50 km radius of the study area and about 50 of these data points were reported to be accessible or operational. The majority of wells are clustered along drainage lines such as the Yannarie River and Rouse Creek; however, very few points are available within the dunefield (Carnarvon Dunefield) or on the salt flats (Onslow Plain).

D.C. Blandford & Assoc & Oceanica: Straits Salt: Physical Environment 61
Figure 6.4 Bore locations


D.C. Blandford & Assoc & Oceanica: Straits Salt: Physical Environment 63
Forty petroleum exploration wells have been drilled in the Yanrey-Ningaloo map area by West Australian Petroleum Pty Ltd (WAPET), Marathon Petroleum Australia and the Bureau of Mineral Resources between 1953 and 1978 (GSWA 1980). The first well to strike oil in Australia, Rough Range No.1 drilled by WAPET in 1953, is located in the map area. The hydrogeological information available from the petroleum exploration records is of little significance, although they do provide deep stratigraphic information. Anecdotal information was provided by the pastoralist on Yanrey Station, which has been in the Alston family since 1903. Information of hydrogeological relevance is as follows: • The majority of wells on the property were excavated using hand tools. No
shoring or side wall support was required during excavation and the sandy clays and silts contain enough moisture to remain stable for the duration of the well construction. Groundwater is generally encountered in a well-cemented calcrete layer between 6 and 10 m below the surface. The calcrete required blasting in some cases (e.g. at Don’s Bore, Figure 6.4) to access water contained within the calcrete horizon.
• The quality of water in the taps and showers at the homestead improves during periods of flow in the Yannarie River, suggesting that groundwater in the calcrete aquifer is locally recharged by the Yannarie River;
• The pastoralist reports that the dunes are relatively mobile. The shed at the back of the homestead has been slowly enveloped by the sand dune during the past 30 years; and,
• Tropical Cyclone Vance in 1999 destroyed 90% of all windmills on Yanrey Station. Many of the windmills were subsequently replaced with solar pumping systems. The station is prone to flooding from outflow of the Yannarie River and Rouse Creek systems.
Hydrogeological field investigations, including a bore census of the lower Yannarie River catchment, outwash plain commenced in July 2004. The bore census and surface water investigations included: • Visit to a total of 72 sites, including operational and abandoned wells,
windmills, bores, tanks and claypans; • Of the 72 sites, water level information was obtained from 38 sites, and
information on water chemistry was available from 41 sites. Both water level and chemistry information is available from 30 sites;
• Visit to Golden Bore, an artesian bore drilled by WRC to a depth of 555 m below ground level. Measurements of flow, water pH, electrical conductivity (EC), and temperature were recorded;
• Measurement of surface water EC and pH in a number of claypans on the Carnarvon Dunefield;
• Observation of micro-hydrogeological processes occurring in dunes and claypans on the Carnarvon Dunefield during a low-intensity rainstorm; and,
• Measurement of EC and pH of water from tanks, troughs and pumps located on Yanrey Station, fed by reticulation from water supply bores on the outwash plain of the Yannarie River.
Hydrogeological information within the dunefield landscape is sparse as the area is not actively grazed due to access limitations and the poor quality of groundwater for

64 D.C. Blandford & Assoc & Oceanica: Straits Salt: Physical Environment
stock watering. The groundwater hydrology of the superficial formations of each landscape element is presented below.
6.2.3 Outwash Plain Water levels measured in superficial aquifer wells and bores on the outwash plain are between 8 and 20 m below ground level. Watering points on Yanrey Station are generally excavated to the base of the authigenic calcrete horizon within alluvial and colluvial outwash plain sediments, where groundwater flows freely into the well. Flows in the Yannarie River channel recharge the superficial aquifer. Evidence for this includes: • The thickness, cementation and lateral continuity of the calcrete horizon
decreases with distance from the Yannarie River suggesting the calcrete is precipitated from recharge waters from the river channel;
• A locally relatively steep hydraulic gradient is observed between the Yannarie River channel and the greater outwash plain area, indicating the river is a source of groundwater recharge (Figure 6.5). The hydraulic gradient flattens past Wanjacootharra Well, delineating the western extent of the competent calcrete horizon and associated alluvial sediments. Drilling reveals the calcrete to the west of this point is present as thin, discontinuous lenses;
• The electrical conductivity (EC) of groundwater in bores and wells closest to the Yannarie River channel is fresh to transitional, ranging between 1,000 and 3,000 µS/cm and increasing in EC with distance from the Yannarie River channel. Fresh water is recharged into the calcrete aquifer during times of flow in the river, and by sub-surface flow in the permeable river channel sediments; and,
• Anecdotal evidence suggests that the quality of the non-potable water supply to the Yanrey Station homestead improves significantly during periods of flow in the Yanarrie River. The wells supplying the homestead with non-potable water exploit groundwater resources within the calcrete horizon,

D.C. Blandford & Assoc & Oceanica: Straits Salt: Physical Environment 65
Figure 6.5 Superficial aquifer groundwater contours


D.C. Blandford & Assoc & Oceanica: Straits Salt: Physical Environment 67
The Yannarie River represents the most significant source of recharge to the superficial aquifer in the study area. Water level fluctuations are negligible during periods of no flow in the Yannarie River. Contributions to recharge by direct rainfall infiltration are minimal as the majority of rainfall is lost to either surface runoff or evaporation and evapotranspiration following each rainfall event. Groundwater contours shown in Figure 6.5 suggest that recharge occurs across a significantly broader front than is represented by the present day channel. The calcrete is the most hydraulically conductive unit in the outwash plain profile. Recharge water from the Yannarie River flows through the calcrete and is disseminated at the western extent of the calcrete horizon. The alluvium and claypan deposits present beneath the calcrete horizon are of low hydraulic conductivity, although isolated lenses of high permeability river gravels and sands, deposited in channels and as sheet flow during flood events, may provide additional sources of preferential through flow/recharge in the outwash plain profile. Such deposits were observed at an unidentified bore approximately 2.5 km south of Noogara Bore (WIN ID 20004298) where coarse rounded gravels were observed on the ground surface over a width of up to 400 m. Additionally, recharge takes place along the length of the Yannarie River up-catchment from the study area. Changes in hydraulic gradient are a function of recharge and decay of residual head through the western portion of the outwash plain. The groundwater quality map (Figure 6.6) provides evidence of low EC water near the recharge source along present day channels of the Yannarie and Rouse river systems. The quality of groundwater in bores and wells decreases significantly following periods of high abstraction due to up-coning of saline water, indicating that water recharged from the Yannarie River is present as a lens overlying a more saline regional groundwater system. The quality of groundwater in the regional outwash plain system is brackish, ranging from 3,000 to 15,000 µS/cm. Discharge from the superficial formations in the outwash plain system is by through flow towards the west, and a small component of leakage into the underlying pre-quaternary sandstones, calcarenites and shales.


D.C. Blandford & Assoc & Oceanica: Straits Salt: Physical Environment 69
Figure 6.6 Groundwater quality map


D.C. Blandford & Assoc & Oceanica: Straits Salt: Physical Environment 71
6.2.4 Dunefield Groundwater in the dunefield was encountered between 4 and 8 m below the level of the claypans in bores drilled during the current investigation coincident with thin, discontinuous lenses of calcrete. Groundwater yields within the calcrete and claypan deposits are low; the monitoring bores installed during the current investigation were bailed dry at a rate of approximately 0.25 L/s. Groundwater gradients within the dunefield landscape unit are consequently flat (0.0002), with groundwater recharged by a small component of through flow from the outwash plain. The electrical conductivity of the groundwater in the dunefield is brackish to saline, with EC’s ranging from 10,000 to 55,000 µS/cm at the water table, reflecting the distance of the dunefield from the recharge source at the Yannarie River. As with the outwash plain, rainfall recharge to the water table is negligible, largely due to high evaporation rates and the low permeability of the claypan deposits. Consequently, the majority of rainfall remains perched on claypan surfaces prior to evaporation. The following micro-hydrogeological processes were observed during a rainfall event on the 28th of July 2004: • Rainfall infiltrates into the dunes surrounding each claypan, discharging at the
base of the dune as a wetting front. Infiltrated rain water then flows onto the claypan surface; and,
• Rainwater collects in the topographic lows of the claypans where it is lost to evaporation following the rainfall event. The depth of rainwater on the claypan surface following the observed rainfall event was between 5 and 50 mm deep, with electrical conductivities as low as 190 µS/cm.
• Evidence of breaching of the dunes surrounding some of the larger claypans is observed, suggesting that the interconnection of the claypans form an important component in the surface water drainage system within the dunefield.
6.2.5 Salt Flat The salt flats (Onslow Plain), which is a supratidal flat, is commonly characterised by slow sediment accumulation, including authigenic gypsum, anhydrite and carbonate minerals has an ephemeral halite crust and laminated saltpan deposits (Lewis and McConchie 1994). The plain forms a thin unconfined aquifer of sand, silt and clay above a low permeability clay layer. The depth to water beneath the salt flat ranges from 0.2 to 1 m. The hydraulic gradient is extremely low (0.00009) due to negligible topographic variation and recharge is by through flow from the claypan deposits in the dunefield. The elevation of the underlying clay layer is generally above sea-level, hydraulically isolating the water levels beneath the plain from tidal influences. However, the supratidal salt flats are intermittently recharged by spring tide events and flood events from the Yannarie and Rouse river systems. The majority of surface water on the salt flats is lost to evaporation, concentrating salts in the surficial sediments as halite crusts. These are subsequently dissolved by infiltrating surface water to produce hypersaline groundwater. Measured groundwater EC beneath the salt flat ranges from 120,000 to 263,000 µS/cm. Groundwater discharge from the salt plain is via through-flow into the intertidal zone.


D.C. Blandford & Assoc & Oceanica: Straits Salt: Physical Environment 73
7. OCEANOGRAPHY
7.1.1 Tides Exmouth Gulf is mesotidal and experiences mixed predominantly semi-diurnal tides. The mean spring tide range at Exmouth is 1.8 m with a mean neap tide range of 0.6 m (Department of Defence 2002). The interaction between the diurnal and semi-diurnal components generally means that there is only a very short period (1–2 days) in a month when the daily tidal range is less than 1 m (Figure 7.1). The bathymetry of the Gulf shallows southwards towards Giralia Bay which results in an increase in tidal range of at least 0.1 m towards the southern end of the Gulf (APASA 2005). The tidal inundation curve shows that for 5% of the time tidal levels will exceed +2.7 m CD [Chart Datum] (Figure 7.2).
0
50
100
150
200
250
300
17 F
eb 0
0:00
18 F
eb 0
0:00
19 F
eb 0
0:00
20 F
eb 0
0:00
21 F
eb 0
0:00
22 F
eb 0
0:00
23 F
eb 0
0:00
24 F
eb 0
0:00
25 F
eb 0
0:00
26 F
eb 0
0:00
27 F
eb 0
0:00
28 F
eb 0
0:00
29 F
eb 0
0:00
Date & Time
Hei
ght (
cm)
Source: Department of Planning and Infrastructure
Figure 7.1 Example of tidal signature at Exmouth

74 D.C. Blandford & Assoc & Oceanica: Straits Salt: Physical Environment
0
0.5
1
1.5
2
2.5
3
3.5
0 10 20 30 40 50 60 70 80 90 100Percentage of time submerged
Hei
ght m
abo
ve C
hart
Dat
um
Highest astronomical tide
Lowest astronomical tide
Mean High Water Spring
Mean Low Water Spring
Mean High Water Neap
Mean Low Water Neap
Mean Sea Level
Source: Worley 2005
Figure 7.2 Tidal inundation curve for Hope Point
7.1.2 Historic sea level trend Analysis of the annual sea level trends from 1966 to 1997 at Port Hedland and Carnarvon show an average trend of -1.32 mm/yr and +0.25 mm/year, respectively (Mitchell et al. 2000). Sea level trend analyses is not available for either Onslow or Exmouth.
7.1.3 Waves The waters of Exmouth Gulf are protected from Indian Ocean wave energy by North West Cape and several islands at the mouth of the Gulf. Hence, the primary wave energy in the Gulf is locally generated wind waves. The energy of these wind waves is directly proportional to the distance of open water (fetch) over which the wind is able to blow, wind strength and water depth. The beaches of Hope Point and Tent Island face the longest fetch for the prevailing south to south-easterly winds. It is anticipated that strong winds blowing across the Gulf will generate wind waves of up to 1.5 m high on the coast at the end of the fetch.
7.1.4 Seiches Seiches are long-period stationary (standing) waves that are likely to occur within the Gulf. Seiches cause a small amplitude periodic rise and fall of the water level at the shoreline and are seiches are typically induced by wind and/or changes in

D.C. Blandford & Assoc & Oceanica: Straits Salt: Physical Environment 75
atmospheric pressures. The authors are not aware of any analysis of the observational records for seiche activity in Exmouth Gulf. However, assuming a simplified basin geometry (depth = 12 m, width = 45 km, length = 80 km) the fundamental seiche modes of the Gulf may be calculated as approximately 1 hr from east to west and approximately 2 hr from north to south.
7.1.5 Storm surge Storm events are typically associated with onshore winds and low atmospheric pressure and these factors together may result in elevated water levels at the shoreline, termed storm surge. The semi-enclosed waters of Exmouth Gulf have the potential to result in large storm surges, particularly at the southern end of the Gulf. During periods of large storm surges the water line may extend well inland of the normal high tide mark. The greatest surge levels are typically associated with the summer months, with surge levels up to 0.4 m higher than in winter. This is likely to be primarily due to the lower barometric pressures over the Pilbara at this time. During winter, the surge levels coincide with the passage of frontal systems (i.e. 4–5 days). The greatest observed surge levels occurred during Tropical Cyclone Vance which crossed the coast on 22 March 1999. During this cyclone, the maximum water level measured at Exmouth was +4.7 m CD which included 3.6 m of storm surge (Figure 7.3); whereas at Onslow, a storm surge height of +3.3 m was recorded (Nott and Hubbert 2003). The maximum water level within Exmouth Gulf during Tropical Cyclone Vance was surveyed at approximately +7.3 m CD at Locker Point (Nott and Hubbert 2003) (Figure 7.4). The extent of the sand splay, the tabular cross-beds, scour pits, and imbricated gravel suggest that the marine inundation generated by Tropical Cyclone Vance near Tubridgi Point, struck the coast with considerable force and moved inland as a reasonably high velocity ‘wall’ of broken water (bore). Such flows, and the impacts upon the coast are more reminiscent of tsunamis than that normally ascribed to storm surge (Nott and Bryant 2003).
-40-20
020406080
100120140160180200220240260280300320340360380400420440460480500
01 M
ar 0
0:00
02 M
ar 0
0:00
03 M
ar 0
0:00
04 M
ar 0
0:00
05 M
ar 0
0:00
06 M
ar 0
0:00
07 M
ar 0
0:00
08 M
ar 0
0:00
09 M
ar 0
0:00
10 M
ar 0
0:00
11 M
ar 0
0:00
12 M
ar 0
0:00
13 M
ar 0
0:00
14 M
ar 0
0:00
15 M
ar 0
0:00
16 M
ar 0
0:00
17 M
ar 0
0:00
18 M
ar 0
0:00
19 M
ar 0
0:00
20 M
ar 0
0:00
21 M
ar 0
0:00
22 M
ar 0
0:00
23 M
ar 0
0:00
24 M
ar 0
0:00
25 M
ar 0
0:00
26 M
ar 0
0:00
27 M
ar 0
0:00
28 M
ar 0
0:00
29 M
ar 0
0:00
30 M
ar 0
0:00
31 M
ar 0
0:00
Date
Hei
ght (
cm)
DATARESIDUAL
Source: Department of Planning and Infrastructure Data = observed water level observations; Residual (which shows the storm surge component) = observed water level observations – predicted tide
Figure 7.3 Storm surge measured at Exmouth during passage of Tropical Cyclone Vance

76 D.C. Blandford & Assoc & Oceanica: Straits Salt: Physical Environment
Source: Nott & Hubbert (2003)
Figure 7.4 Measured maximum water levels generated by Tropical Cyclone Vance
7.1.6 Tsunamis A tsunami is a wave, or series of waves, generated in a water body by sudden, large-scale displacement of water. Ocean tsunamis are most commonly generated by sub-surface seismic events generating vertical displacement, or by underwater volcanic eruptions. However, other mechanisms may produce tsunamis, including submarine landslides on the continental shelf, very large explosions or large meteorite impacts. Tsunamis have very low frequencies (wavelengths may exceed 100 km) and may have speeds approaching 1,000 km/hr in deep water. Just like normal ocean waves, as the wave approaches shallow water it slows down or shoals whereby as the wavelength shortens the wave height increases. Tsunamis are affected by the same shoaling processes as regular ocean waves, including friction, diffraction, reflection and refraction. However, due to their very long wavelengths, the processes of shoaling, friction and refraction begin to affect the tsunami from the edge of the continental shelf; in contrast, swell waves typically only begin to feel these effects within 1–2 km from shore. Consequently, the energy of a tsunami at the shoreline of a broad continental shelf is likely to be less than on a similar shoreline with a narrow shelf. Embayments act to focus the wave, increasing the height towards the head of the bay whereas offshore islands act to disperse the energy of a tsunami and thereby reduce the overall height.

D.C. Blandford & Assoc & Oceanica: Straits Salt: Physical Environment 77
Several tsunamis have affected the north-west coast of Western Australia in historic times, including: 1883 (Krakatoa volcanic explosion), 1977 (Sumbawa earthquake), 3 June 1994 (Java Trench earthquake) and 26 December 2004 (Sunda Arc earthquake). The large tide and surge range normally experienced along the north-west coast of Western Australia reduces the likelihood of damage from tsunamis; unless the tsunami occurs coincident with a spring high tide. Observations of wave run-up levels in the Exmouth Gulf region from these tsunamis indicate that the maximum vertical water level reached during these tsunamis were: less than 2 m in 1883, approximately 4 m in 1977 and approximately 1.5 m in 1994 (Geoscience Australia, 2005). The most recent tsunami, 2004 was recorded at standard ports around the coast of Western Australia by the Department for Planning and Infrastructure. The narrow continental shelf at Onslow resulted in a relatively large signal with tsunami waves reaching a height of approximately 1 m; whereas at the Exmouth Boat Harbour the wave height was significantly less (approximately 0.5 m) due to the sheltering within the shallow waters of the Gulf (Figure 7.5). It appears that quantifying the risk of a tsunami affecting the north-west shelf area is presently not feasible on account of the following issues (Steve Buchan, Chief Ocean Engineer, MetOcean Engineers, pers. comm. 2005): • A very limited number of tsunami events have been recorded along the north-
west shelf; • The impact of a tsunami on the coast is highly dependent on the direction of
approach; and • Very few earthquakes generate a tsunami (earthquakes generally must exceed
7.5 on the Richter Scale and must result in a vertical displacement of the sea bed).
Source: Department for Planning & Infrastructure
Figure 7.5 Time series of residuals recorded following the Boxing Day Tsunami at Onslow and Exmouth (from 25 to 31 December 2004)
Onslow
Exmouth

78 D.C. Blandford & Assoc & Oceanica: Straits Salt: Physical Environment
7.1.7 Currents Exmouth Gulf has no sill or other restrictions to water flow within the basin. Circulation within the Gulf is principally driven by a combination of tide and wind energies (Massel et al. 1997). However, excepting cyclone events, currents generated by waves are only likely to be important at the entrance to the Gulf (Massel et al. 1997). Current modelling indicates that the tidal currents along the deeper waters of the western margin of the Gulf are primarily orientated north-south (APASA 2005). Tidal currents along the eastern margin are generally oriented north-west to south-east; though this is interrupted locally to form complex flows governed by the local topography (Figure 7.6). The majority of tidal exchange between the Gulf and the offshore waters occurs between Point Murat, and South Muiron Island and there is very little net transport across the Gulf. There is a small net tidal flow north and west out of Giralia Bay whereas the net tidal flow along the remainder of the east coast is either onshore-offshore or negligible. During large tides, the current velocity in the Gulf may be approximately 20 cm/s. Wind-driven circulation is anticipated to be more important than tidal circulation at the regional scale because tidal migrations are relatively short due to the semi-diurnal tidal regime, which limits each period of tidal flow to less than six hours.

D.C. Blandford & Assoc & Oceanica: Straits Salt: Physical Environment 79
Source: APASA (2005)
Figure 7.6 Depth-averaged tide-induced residual currents in Exmouth Gulf


D.C. Blandford & Assoc & Oceanica: Straits Salt: Physical Environment 81
8. CONCEPTUAL MODEL OF LANDFORM DEVELOPMENT
8.1 SEA LEVEL PRE-HISTORY
Recent compilations of sea level data for Western Australia (Wyrwoll 1993; Collins et al. 1993; Searle and Woods 1986; Playford 1988; Playford and Leech 1977) suggests that about 18,000 years Before Present (BP) sea level was approximately 130 m below the present level and by the start of the Holocene period (approximately 10,000 years BP—Before Present) the sea level was still approximately 25 m below the present level (Figure 8.1). At approximately 8,000 years BP the sea level reached a height of -20 m below present level and at approximately 6,300 years BP the sea level was approximately 3 m above present levels (termed the mid-Holocene high-stand). Since that time sea level gradually declined to reach the present level approximately 1,500 years BP.
Figure 8.1 Holocene sea level curve for south western Australia

82 D.C. Blandford & Assoc & Oceanica: Straits Salt: Physical Environment
8.2 CLIMATE CHANGE
The following description of the regional palaeoclimate has been extracted from Wyrwoll (1993). Wetter conditions than the present climate prevailed during the majority of the Tertiary (c. 7–65 Ma BP). This was replaced by a drier climate regime in the closing stages of the Tertiary. The exact time of the drier conditions has not been established with certainty; though it is possible that drier conditions commenced during the late-Pliocene (c. 4–7 Ma BP). An interglacial–glacial climate, similar to today, is likely to have developed by the early- to mid-Pleistocene (c. 0.9–1.5 Ma BP). There is evidence that the climate during the last approximately 0.5 Ma has oscillated between long, dry glacial stages, and shorter, wet interglacial stages. The glacial periods produced climates drier and colder than those of the Holocene and lasted for periods of around 100,000 years. The most extreme dry conditions coincided with the glacial maxima—the last glacial maximum occurred c. 18,000 years BP. Shorter interglacial periods, of ca. 10,000 years, resulted in climates that were similar or wetter than the current prevailing climate. Theories exist that some Pleistocene (ca. 12,000–1,500,000 years BP) interglacials were wetter than those in the Holocene (ca. 12,000 BP to present); however this has been difficult to demonstrate with geological evidence. The available evidence does suggest that it is likely that the climate has been drier than present conditions for much of the last 100,000 years. It is likely that similar precipitation levels to today would have prevailed in the area for most of the last c.10,000 years. This sequence is summarised schematically in Figure 8.2.
Figure 8.2 Schematic presentation of previous climate history of the study area (based on Wyrwoll 1993)
8.3 LANDFORM DEVELOPMENT
The physiography and spatial arrangement of the landscape elements in the project area are underpinned by a complex geomorphic prehistory. This report only addresses those landscape elements that make up the project area; however, it is useful to look beyond the immediate area to enable a conceptual landform model to be developed. This also aids in the interpretation of the landform development history. A suggested time-stratigraphic relationship is presented in the text below and summarised in Figure 8.3. This relationship has resulted in the development of a complex spatial arrangement of geomorphic units which is illustrated well in the Yanrey Point region (Figure 8.4).
0246810
Time-Scale (millions years before present)
Rel
ativ
e W
etne
ss S
cale
Wetter
Drier
Present
65
Tertiary
Late Tertiary - Pliocene
Fluctuating Glacial -Interglacial periods

D.C. Blandford & Assoc & Oceanica: Straits Salt: Physical Environment 83
Figure 8.3 Time-stratigraphic relationships between landform units of the project area


D.C. Blandford & Assoc & Oceanica: Straits Salt: Physical Environment 85
Figure 8.4 Geomorphology of the Yanrey Point area
The present surface form and the complex hydrological relationships, are directly related to the ongoing development of the Ashburton River palaeo-super delta (Figure 8.5). This super-delta has a surface area of approximately 700 km2. Evidence from satellite imagery suggests that the palaeo Ashburton River, after passing through the Parry Range onto the western lowlands flowed in a westerly direction to the location of the present coast. Accordingly, it discharged via a major system across what is now defined as the outwash plain and dunefield. At this time, both the Rouse Creek, and the Yannarie River were major tributaries of the Ashburton.

86 D.C. Blandford & Assoc & Oceanica: Straits Salt: Physical Environment
Figure 8.5 Satellite imagery showing the Ashburton palaeo-super delta

D.C. Blandford & Assoc & Oceanica: Straits Salt: Physical Environment 87
Figure 8.6 Diagrammatic representation of the Ashburton palaeo super-delta
Ongoing sediment deposition on the super-delta has resulted in the development of a number of palaeo drainage lines. The evidence suggests that there were at least three major drainage lines of the Ashburton River over the period of formation of this super delta. These were: (1) a west-flowing palaeo drainage line which followed closely the present alluvial plain; (2) a northwest-flowing palaeo drainage line which approximately bisected the super-delta to the north-west of the alluvial plain and discharged in the vicinity of the existing Chinty Creek; and (3) the present north-flowing course of the Ashburton River along the eastern boundary of the super-delta.
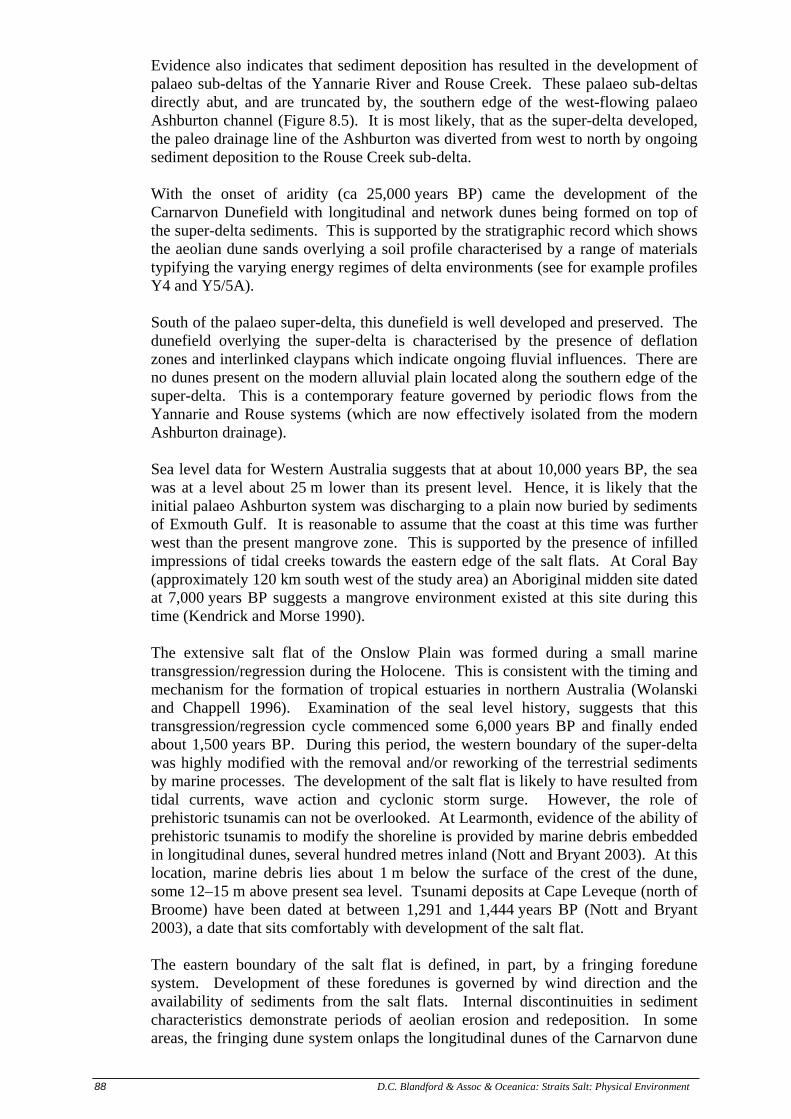
88 D.C. Blandford & Assoc & Oceanica: Straits Salt: Physical Environment
Evidence also indicates that sediment deposition has resulted in the development of palaeo sub-deltas of the Yannarie River and Rouse Creek. These palaeo sub-deltas directly abut, and are truncated by, the southern edge of the west-flowing palaeo Ashburton channel (Figure 8.5). It is most likely, that as the super-delta developed, the paleo drainage line of the Ashburton was diverted from west to north by ongoing sediment deposition to the Rouse Creek sub-delta. With the onset of aridity (ca 25,000 years BP) came the development of the Carnarvon Dunefield with longitudinal and network dunes being formed on top of the super-delta sediments. This is supported by the stratigraphic record which shows the aeolian dune sands overlying a soil profile characterised by a range of materials typifying the varying energy regimes of delta environments (see for example profiles Y4 and Y5/5A). South of the palaeo super-delta, this dunefield is well developed and preserved. The dunefield overlying the super-delta is characterised by the presence of deflation zones and interlinked claypans which indicate ongoing fluvial influences. There are no dunes present on the modern alluvial plain located along the southern edge of the super-delta. This is a contemporary feature governed by periodic flows from the Yannarie and Rouse systems (which are now effectively isolated from the modern Ashburton drainage). Sea level data for Western Australia suggests that at about 10,000 years BP, the sea was at a level about 25 m lower than its present level. Hence, it is likely that the initial palaeo Ashburton system was discharging to a plain now buried by sediments of Exmouth Gulf. It is reasonable to assume that the coast at this time was further west than the present mangrove zone. This is supported by the presence of infilled impressions of tidal creeks towards the eastern edge of the salt flats. At Coral Bay (approximately 120 km south west of the study area) an Aboriginal midden site dated at 7,000 years BP suggests a mangrove environment existed at this site during this time (Kendrick and Morse 1990). The extensive salt flat of the Onslow Plain was formed during a small marine transgression/regression during the Holocene. This is consistent with the timing and mechanism for the formation of tropical estuaries in northern Australia (Wolanski and Chappell 1996). Examination of the seal level history, suggests that this transgression/regression cycle commenced some 6,000 years BP and finally ended about 1,500 years BP. During this period, the western boundary of the super-delta was highly modified with the removal and/or reworking of the terrestrial sediments by marine processes. The development of the salt flat is likely to have resulted from tidal currents, wave action and cyclonic storm surge. However, the role of prehistoric tsunamis can not be overlooked. At Learmonth, evidence of the ability of prehistoric tsunamis to modify the shoreline is provided by marine debris embedded in longitudinal dunes, several hundred metres inland (Nott and Bryant 2003). At this location, marine debris lies about 1 m below the surface of the crest of the dune, some 12–15 m above present sea level. Tsunami deposits at Cape Leveque (north of Broome) have been dated at between 1,291 and 1,444 years BP (Nott and Bryant 2003), a date that sits comfortably with development of the salt flat. The eastern boundary of the salt flat is defined, in part, by a fringing foredune system. Development of these foredunes is governed by wind direction and the availability of sediments from the salt flats. Internal discontinuities in sediment characteristics demonstrate periods of aeolian erosion and redeposition. In some areas, the fringing dune system onlaps the longitudinal dunes of the Carnarvon dune

D.C. Blandford & Assoc & Oceanica: Straits Salt: Physical Environment 89
field. These fringing dunes have themselves been on-lapped by a smaller system of frontal dunes which have a distinctly marine composition. It is likely that these small frontal dunes have been formed by storm surge generated during the passage of contemporary tropical cyclones. The dominant south-westerly winds have played a key role in determining the contemporary landforms of the eastern shore of Exmouth Gulf. Hope Point forms a natural transition point between the calmer, broader, shallow areas to the south, which where tidal creeks predominate. North of Hope Point, the fetch length for a south-westerly wind increases to 30–40 km and the shoreline is dominated by limestone cliffs or beaches over limestone pavement; tidal creeks in this area are located in the lee of limestone islands (Simpson and Burnside) or Tent Point.


D.C. Blandford & Assoc & Oceanica: Straits Salt: Physical Environment 91
9. REFERENCES Asia Pacific Applied Science Associates (APASA) 2005. Yannarie Project for
Straits Resources. Regional scale modelling: Phase 1 Progress Report. April 2005.
Atlas of Australian Resources, 1980. National Division of Mapping.
Bettenay, E., Churchward, H. M. and McArthur, W. M., 1965-6. Atlas of Australian Soils, Sheet 6: Meekatharra-Hamersley Range Area. Commonwealth Scientific and Industrial Research Organisation, Division of Soils.
Biota Environmental Sciences, 2005a. Yannarie Salt Project Mangrove and Coastal Ecosystem Study: Baseline Ecological Assessment. Prepared for Straits Salt Pty Ltd, August 2005.
Biota Environmental Sciences, 2005b. Yannarie Salt Project Fauna Survey. Prepared for Straits Salt Pty Ltd, April 2005.
Biota Environmental Sciences, 2005c. Yannarie Salt Project Flora and Vegetation Assessment. Prepared for Straits Salt Pty Ltd, July 2005.
Brown, R.G., 1988. Holocene sediments and environments, Exmouth Gulf, Western Australia. In Purcell, P.G. and Purcell, R.R. (Eds.). The North West Shelf, Australia. Proceedings of Petroleum Exploration Society, Australia, Symposium ,Perth, 10–12 August 1988, pp. 85–93.
Brunskill, G.J., Orpin, A.R., Zagorskis, I, Woolfe, K.J. and Ellison, J., 2001. Geochemistry and particle size of surface sediments of Exmouth Gulf, Northwest Shelf, Australia. Continental Shelf Research, 21: 157–201.
Bureau of Meteorology, 2000. Severe Tropical Cyclone Vance 16 March 1999–23 March 1999. Commonwealth of Australia, March 2000.
Collins, L.B., Zhu, Z.R., Wyrwoll, K.-H., Hatcher, B.G., Playford, P.E., Eisenhauer, A., Chen, J.H., Wasserburg, G.J. and Bonani, G., 1993. Holocence growth history of a reef complex on a cool-water carbonate margin: Easter Group of the Houtman Abrolhos, Eastern Indian Ocean. Marine Geology, 115: 29–46.
Department of Defence, 2002. Australian National Tide Tables. Australian Hydrographic Publication 11. Canberra.
Geological Survey of Western Australia (GSWA), 1980: 1:250,000 Geological Series – Explanatory Notes, Yanrey-Ningaloo Map Sheet SF49-12, SF50-9, International Index.
Geoscience Australia, 2005. http://www.ga.gov.au/.
Haig, D.W. 1998. Foraminifera from Exmouth Gulf, Western Australia, Journal of the Royal Society of Western Australia, 80(4): 263-280.
Haig, D.W., Smith, M. and Apthorpe, M.C. Middle Eocene foraminifera from the type Giralia Calcarenite, Gascoyne Platform, southern Carnarvon Basin, Western Australia, Alcheringa, 21: pp 229-245 (1997)
Hocking, R. M., 1990. Carnarvon Basin. In Memoir 3 Geology and Mineral Resources of Western Australia. Geological Survey of Western Australia. State Printing Division, Perth.
Institution of Engineers, Australia. 1987. Australian Rainfall and Runoff (4th Ed.).
Jennings, J, N, and Mabbutt, J. A., 1986. Physiographic outlines and regions. In Jeans, D. N. (Ed), Australia: A Geography. Volume One. The Natural Environment.

92 D.C. Blandford & Assoc & Oceanica: Straits Salt: Physical Environment
Kendrick, G. and Morse, K., 1990. Evidence of recent mangrove decline from an archaeological site in Western Australia. Australian Journal of Ecology, 15(3): 349–353.
Lewis, D.W., and McConchie, D., 1994. Practical Sedimentology (2nd Ed). Chapman and Hall Publishing.
Loneragan N.R., Kenyon R.A., Crocos P.J., Ward R.D., Lehnert S., Haywood M.D.E., Arnold S., Barbard R., Burford M., Caputi N., Kangas M., Manson F., McCulloch R., Penn J.W., Sellers M., Grewe P., Ye Y., Harch B., Barvington M., & Toscas P., 2003. Developing techniques for enhancing prawn fisheries, with a focus on brown tiger prawns (Penaeus esculentus) in Exmouth Gulf. Final Report on FRDC Project 1999/222. CSIRO, Cleveland, pp.287.
Lourensz, R.S., 1981. Tropical cyclones in the Australian region July 1909 to June 1980. Bureau of Meteorology, Australian Government Publishing Service, Canberra.
Massel S.R., Brinkman, R.M., Mason, L. and Bode, L. 1997. Water circulation and waves in Exmouth Gulf. In: Love, P.K. (Ed), Proceedings of the Australian Physical Oceanography Conference (10–12 February 1997), Macquarie University, Sydney, p.48.
McCook, L J, Klumpp, D W, and McKinnon, A D, 1995. Seagrass communities in Exmouth Gulf, Western Australia: a preliminary survey. Royal Society of Western Australia. Journal, 78(3): 81–87.
Mitchell, M., Chittleborough, J, Ronai, B. and Lennon, G.W. 2000. Sea Level Rise in Australia and the Pacific. Pacific Islands Conference on Climate Change, Climate Variability and Sea Level Change. Rarotonga, Cook Islands, 3–7 April 2000.
Northcote, K.H., Hubble, G.D., Isbell, R.F., Thompson, C.H., and Bettenay, E., 1975. A Description of Australian Soils. CSIRO Australia.
Northcote, K. H., 1971. A Factual Key for the Recognition of Australian Soils. Rellim Technical Publications, Glenside South Australia.
Nott, J. and Hubbert, G., 2003. Comparisons between topographically surveyed debris lines and modelled inundation levels from severe Tropical Cyclones Vance and Chris, and their geomorphic impact on the sand coast. Australian Meteorological Magazine.
Nott, J. and Bryant, E. 2003. Extreme marine inundations (Tsunamis?) of coastal Western Australia. The Journal of Geology; 11:691–706.
Oceanica Consulting Pty Ltd, 2005. Yannarie Salt Project—Marine and Coastal Environment of eastern Exmouth Gulf. Prepared for Straits Salt Pty Ltd, August 2005, Draft.
Orpin, A.R., Haig, D.W. and Woolfe, K.J., 1999. Sedimentary and foraminiferal facies in Exmouth Gulf, in arid tropical northwestern Australia. Australian Journal of Earth Science, 46(4): 607.
Parsons Brinkerhoff, 2005a. Surface Hydrology for Exmouth Salt Field. Prepared for Straits Resources, March 2005, Draft Rev B.
Parsons Brinkerhoff, 2005b. Superficial Aquifer Hydrogeology of the Yannarie River Delta. Prepared for Straits Resources, July 2005, Draft Rev A.
Pilgrim, DH, (Ed), 1987. Australian Rainfall and Runoff—A Guide to Flood Estimation. Institution of Engineers, Australia, Barton, ACT.

D.C. Blandford & Assoc & Oceanica: Straits Salt: Physical Environment 93
Playford, P.E., 1988. Guidebook to the Geology of Rottnest Island. Geological Society of Australia, Western Australian Division, Excursion Guidebook No 2, 67 pp.
Playford, P.E. and Leech, R.E.J., 1977. Geology and Hydrology of Rottnest Island. Geological Survey of Western Australia, Report No. 6.
Royal Australian Survey, 1989: Talandji 1:100,000 Topographic Survey Map, Series R611, Sheet 1853, Edition 2-AAS.
Searle, D.J. and Woods, P., 1986. Detailed documentation of Holocene sea-level record in the Perth region, south-westeern Australia. Quaternary Research, 26: 299–308.
Semeniuk, V., 1993a. The Pilbara Coast: A riverine coastal plain in a tropical arid setting, northwestern Australia. Sedimentary Geology, 83: 235–256.
Semeniuk, V., 1993b. The mangrove systems of Western Australia: 1993 Presidential Address. Journal of the Royal Society of Western Australia, 76: 99–122.
Struckmeyer, H. I. M. and Totterdell, J. M., 1990. Australia, Evolution of a Continent. Bureau of Mineral Resources, Geology and Geophysics, Palaeogeographic Group, Canberra, Australia.
Van de Graaff, W. J. E., Denman, P. D., Hocking, R. M., and Baxter, J. L., 1980. Yanrey-Ningaloo 1:250,000 Geological Series—Explanatory Notes: Sheets SF49-12, SF50-9. Geological Survey of Western Australia
Van de Graaff, W. J. E., Denman, P. D., and Hocking, R. M., 1982. Onslow 1:250,000 Geological Series—Explanatory Notes: Sheet SF50-5. Geological Survey of Western Australia.
Wolanski, E. and Chappell, J., 1996. The response of tropical Australian estuaries to a sea level rise. Journal of Marine Systems, 7: 267–279.
Worley 2005. Model Results to aid in Selection of Pump Location in Deans Creek. Report to Straits Salt. April 2005.
Wyrwoll, K.-H., 1993. An outline of Late-Cenozoic palaeoclimate events in the Cape Range region. Records of the Western Australian Museum Supplement 45: 39–50.
Wyrwoll, K.-H., Kendrick, G.W. and Long, J.A., 1993. The geomorphology and Late Cenozoic geomorphological evolution of the Cape Range-Exmouth Gulf region. Records of the Western Australian Museum Supplement, 45: 1–23.


D.C. Blandford & Assoc & Oceanica: Straits Salt: Physical Environment 95
10. ACKNOWLEDGEMENTS This report was prepared by Doug Blandford (D.C. Blandford & Associates) and Bruce Hegge (Oceanica). Tanya Stul (Oceanica) assisted with the section on climate change. Katy Rawlings and Charlotte Tuckerman (Oceanica) completed the report formatting.


D.C. Blandford & Assoc & Oceanica: Straits Salt: Physical Environment 97
11. ABBREVIATIONS AND GLOSSARY
ABBREVIATIONS
ARI Average Recurrence Interval
CD Chart Datum
EC Electrical Conductivity
PPF Principal Profile Form
PSD Particle Size Distribution
TDS Total Dissolved Solids
GLOSSARY
Aeolian Caused or carried by the wind.
Anastomosing Stream pattern which, owing to excessive sediment deposition in the main channel, branch and rejoin irregularly to create a net-like formation.
Anticline Upfold of the earth’s crust.
Authigenic Formed in situ.
Barchan dune Unconnected transverse dune with crescentic plan shape with the crescent opening downwind.
Bathymetry Pertaining to the depth of a body of water.
Calcareous Containing abundant calcium carbonate
Claypan Layer of compact clay within the soil
Deflation zone Basin or depression formed by the action of the wind and characterised by a lack of fine superficial material.
Diastem An interface marking a significant break in the geologic record.
Diurnal Occurring once in a 24-hour period.
Epiphytic A plant which grows on another plant in a non-parasitic relationship.
Ferricrete A pan formed by iron oxides which occurs within or on the surface of soil profiles.
Foraminifera Microscopic planktonic organisms which secrete carbonate shells.
Gilgai Depressions in clay soils caused by expansion and contraction associated with wetting and drying cycles. Generally associated with two to one lattice clays.

98 D.C. Blandford & Assoc & Oceanica: Straits Salt: Physical Environment
Intertidal Area of land between low tide and high tide levels which is intermittently exposed and inundated by tidal activity.
Longitudinal dunes Also called seif dunes or linear dunes. Mildly sinuous dune aligned parallel with the direction of the dominant wind.
Mesotidal Moderate tidal regime with range between high and low tide of 1–2 m.
Neap tide Period during monthly tidal cycle with lowest tidal range.
Network dunes Dune form resulting from the overlap of a number of transverse dune systems each aligned to a different wind regime.
Palaeosol Ancient soil.
Pedologic Pertaining to the soils
Ridge and runnel morphology
Beach form which typically develops in sandy environments exposed to fetch-limited waves and relatively large tidal ranges. These beaches are characterised by a series of intertidal sand bars alternating with deeper channels.
Semi-diurnal tide Tide with two periods of high water and two periods of low water occurring within a day.
Siliceous Containing abundant silica.
Sill Submarine bar or ridge across the mouth of an inlet or embayment.
Slickenside Polished and scratched surface indicating plane of movement.
Solonchak A white alkali soil.
Spring tides Period during monthly tidal cycle with highest tidal range.
Transverse dune Dune ridge with crests transverse (perpendicular) to the direction of the dominant wind and which migrate in the direction of the dominant wind.

D.C. Blandford & Assoc & Oceanica: Straits Salt: Physical Environment 99
12. APPENDIX
Appendix Particle Size Distribution Curves

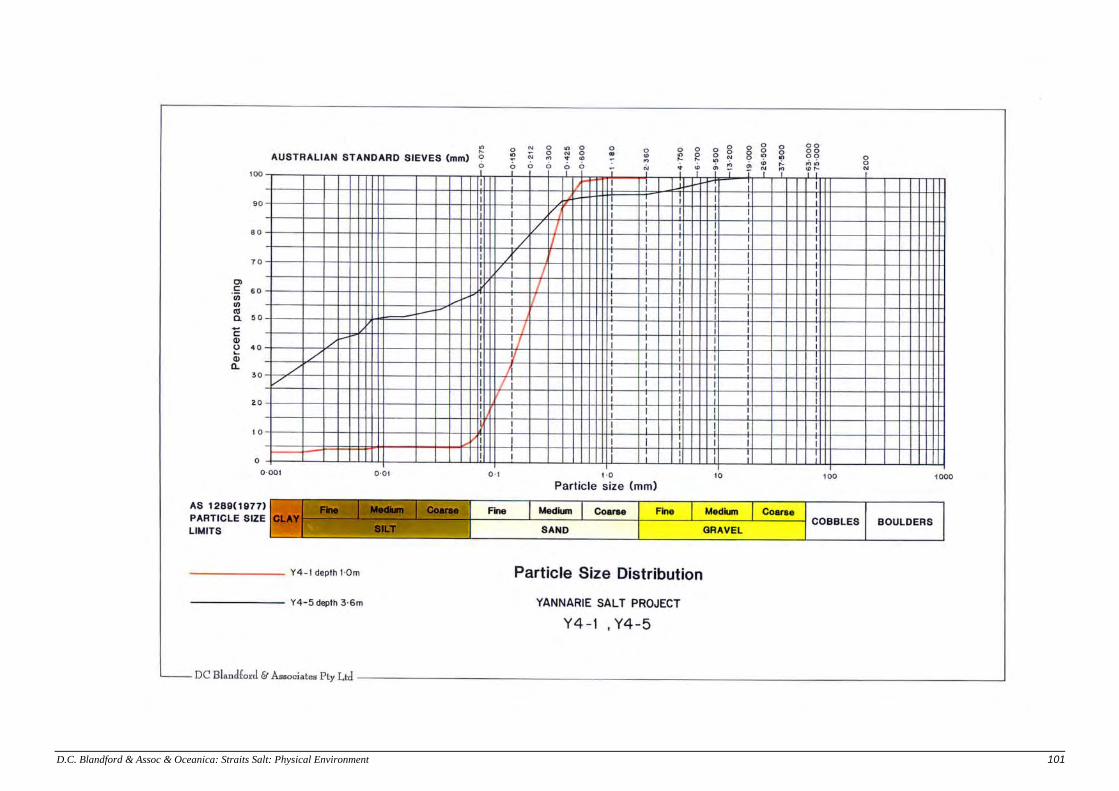
D.C. Blandford & Assoc & Oceanica: Straits Salt: Physical Environment 101

102 D.C. Blandford & Assoc & Oceanica: Straits Salt: Physical Environment

D.C. Blandford & Assoc & Oceanica: Straits Salt: Physical Environment 103

104 D.C. Blandford & Assoc & Oceanica: Straits Salt: Physical Environment

D.C. Blandford & Assoc & Oceanica: Straits Salt: Physical Environment 105

106 D.C. Blandford & Assoc & Oceanica: Straits Salt: Physical Environment

D.C. Blandford & Assoc & Oceanica: Straits Salt: Physical Environment 107

108 D.C. Blandford & Assoc & Oceanica: Straits Salt: Physical Environment

D.C. Blandford & Assoc & Oceanica: Straits Salt: Physical Environment 109

110 D.C. Blandford & Assoc & Oceanica: Straits Salt: Physical Environment

D.C. Blandford & Assoc & Oceanica: Straits Salt: Physical Environment 111

Oceanica Consulting Pty Ltd 99 Broadway, Nedlands. PO Box 3172, Broadway, Nedlands, Western Australia 6009
Tel: (08) 9389 9669 Fax: (08) 9389 9660 [email protected] ABN 89 093 752 811