phyllanthus inhibits proliferation, metastasis...
TRANSCRIPT

PHYLLANTHUS INHIBITS PROLIFERATION,
METASTASIS, ANGIOGENESIS AND INDUCES
APOPTOSIS OF HUMAN MELANOMA (MEWO)
AND PROSTATE ADENOCARCINOMA (PC-3)
CELLS THROUGH MODULATION OF
MULTIPLE CELL SIGNALLING PATHWAYS
TANG YIN QUAN
THESIS SUBMITTED IN FULFILLMENT OF THE
REQUIREMENTS FOR THE DEGREE OF
DOCTOR OF PHILOSOPHY
DEPARTMENT OF MEDICAL MICROBIOLOGY
FACULTY OF MEDICINE
UNIVERSITY OF MALAYA
KUALA LUMPUR
2013
UNIVERSITI MALAYA
ORIGINAL LITERARY WORK DECLARATION
Name of Candidate: TANG YIN QUAN
Registration/Matric No: MHA 100038
Name of Degree:
Title of Thesis (“this Work”): PHYLLANTHUS INHIBITS PROLIFERATION,
METASTASIS, ANGIOGENESIS AND INDUCES APOPTOSIS OF HUMAN
MELANOMA (MEWO) AND PROSTATE ADENOCARCINOMA (PC-3)
CELLS THROUGH MODULATION OF MULTIPLE CELL SIGNALLING
PATHWAYS
Field of Study: CELL BIOLOGY
I do solemnly and sincerely declare that:
(1) I am the sole author/writer of this Work;
(2) This Work is original;
(3) Any use of any work in which copyright exists was done by way of fair dealing and
for permitted purposes and any excerpt or extract from, or reference to or reproduction
of any copyright work has been disclosed expressly and sufficiently and the title of the
Work and its authorship have been acknowledged in this work;
(4) I do not have any actual knowledge nor do I ought reasonably to know that the
making of this work constitutes an infringement of any copyright work;
(5) I hereby assign all and every rights in the copyright to this work to the University of
Malaya (“UM”), who henceforth shall be owner of the copyright in this work and that
any reproduction or use in any form or by any means whatsoever is prohibited without
the written consent of UM having been first had and obtained;
(6) I am fully aware that if in the course of making this work I have infringed any
copyright whether intentionally or otherwise, I may be subject to legal action or any
other action as may be determined by UM.
Candidate’s Signature Date
Subscribed and solemnly declared before,
Witness’s Signature Date
Name:
Designation:
ii
ABSTRACT
Modern cancer treatment therapies such as surgery, chemotherapy and
immunotherapy are deemed relatively unsuccessful due to their ineffectiveness, safety
issues and costliness. As not all cancer patients respond positively to current anticancer
agents, mortality rates of cancer are on a continuous rise including melanoma and
prostate cancer.
Natural product-based traditional medicine, often overshadowed by modern
medicine, has returned to be a holistic approach for health care in many societies. This
“back to basic” approach is due to its long history of usage in disease treatment and the
pharmacological/nutritional value of these products which are believed to be able to
halt/delay cancer progression.
In this study, the anticancer properties of four Phyllanthus (P.amarus, P.niruri,
P.urinaria and P.watsonii) were studied against on human melanoma, MeWo and
prostate adenocarcinoma, PC-3 cells. The main aims of this study were to identify the
anti-proliferation, anti-metastasis, anti-angiogenesis properties, apoptosis induction and
mechanisms of inhibition of Phyllanthus plant extracts on these cancer cells.
Phyllanthus extracts have significantly inhibited the growth of MeWo and PC-3
cells at IC50 values at the range of 155.0-260.0 µg/ml and 54.2-153.3 µg/ml for aqueous
and methanolic extracts, respectively. This growth inhibition was due to cell cycle arrest
at G1-phase in PC-3 and S-phase in MeWo cells, concurrent with the accumulation of
apoptotic cells at Sub-G1. Induction of apoptosis was further implicated with the
activation of caspase-3/7, presence of TUNEL positive cells and DNA fragmentations
as well as increased pro-apoptotic Bax proteins activity in treated cancer cells. Low
level of LDH was detected in treated MeWo and PC-3 cells as the result of damage to

iii
the cytoplasmic membrane, indicative of late apoptosis or necrosis. In contrast,
Phyllanthus exerted low cytotoxicity in human normal cell lines (CCD-1127Sk, RWPE-
1 and HUVECs).
The anti-metastatic and anti-angiogenic effects of Phyllanthus extracts were
observed when Phyllanthus extracts inhibited several essential steps during metastasis
and angiogenesis; (i) adhesion, (ii) migration, (iii) invasion, (iv) transendothelial
migration and (v) microcapillary-like tube formations. These observations were most
likely due to reduction in activities of matrix metalloproteinase-2, -7 and -9 in treated
cells as was noted.
These observed anticancer properties ofPhyllanthus extracts are believed to be
due to the plants inhibitory effects on multiple signalling pathways; MAPKs, Wnt,
Myc/Max, Hypoxia and NFκB, via alteration on their intracellular signalling activities
including pan-Ras, c-Raf, Akt, Elk1, RSK, c-Jun, JNK1/2, β-catenin, GSK3β, c-myc,
HIF-1α, VEGF, NFκB p50 and p52. In addition, various other proteins involved in
proliferation, metastasis and apoptosis were found to be differentially expressed in
treated MeWo and PC-3 cells.
Taken together, the results showed that Phyllanthus extracts possess anticancer
effects through inhibition in proliferation, metastasis and angiogenesis as well as
induction of apoptosis on human melanoma, MeWo and prostate adenocarcinoma, PC-3
cells. Thus, Phyllanthus is a promising candidate for the development of future
anticancer agents and could possibly be introduced as a part of diet to prevent cancer
development.

iv
ABSTRAK
Terapi rawatan kanser moden seperti pembedahan, kemoterapi, dan imunoterapi
telah dianggap tidak berhasil kerana ketidakberkesanan, isu-isu keselamatan dan kos
yang tinggi. Oleh sebab tidak semua pesakit kanser bertindak balas secara positif
kepada ejen antikanser, kadar kematian kanser semakin meningkat termasuk
“melanoma” dan kanser prostat.
Perubatan tradisional yang berasaskan penggunaan produk semulajadi yang
sering dibayangi oleh perubatan moden, telah kembali menjadi salah satu pendekatan
dalam penjagaan kesihatan masyarakat. Pendekatan "kembali kepada asas" ini adalah
disebabkan oleh sejarah panjang penggunaannya dalam rawatan penyakit dan nilai
farmakologi/nutrisi produk ini yang dipercayai dapat menghentikan/melambatkan
perkembangan kanser.
Dalam kajian ini, aktiviti antikanser dari empat Phyllanthus (P.amarus, P.niruri,
P.urinaria dan P.watsonii) telah dikaji terhadap sel melanoma, MeWo dan kanser
prostat, PC-3. Matlamat utama kajian ini adalah untuk mengenalpasti sifat-sifat “anti-
proliferation”, “anti-metastasis”, “anti-angiogenesis”, induksi apoptosis dan mekanisme
ekstrak tumbuhan Phyllanthus terhadap sel-sel kanser ini.
Ekstrak Phyllanthus telah menghalang pertumbuhan sel MeWo dan PC-3 pada
nilai IC50 pada julat 155.0-260.0 μg/ml bagi ekstrak “aqueous” dan 54.2-153.3 μg/ml
bagi ekstrak “methanolic”. Penghalangan pertumbuhan sel-sel ini adalah disebabkan
oleh penyekatan di kitaran sel pada fasa G1 dalam sel PC-3 dan fasa S dalam sel
MeWo, serentak dengan pengumpulan sel-sel apoptotik di Sub-G1. Induksi apoptosis
sekaligus dikaitkan dengan pengaktifan “caspase-3/7”, kehadiran sel positif TUNEL
dan “DNA fragmentations” serta dengan peningkatan aktiviti protein Bax pro-apoptotik

v
di dalam sel-sel kanser. Tahap rendah LDH telah dikesan dalam sel MeWo dan PC-3
yang diakibatkan oleh kerosakan pada “cytoplasmic membrane”, yakni, menunjukkan
tanda apoptosis lewat atau nekrosis. Selain itu, Phyllanthus menunjukan tahap rendah
“cytotoxicity” terhadap sel-sel manusia biasa (CCD-1127Sk, RWPE-1 dan HUVECs).
Aktiviti “anti-metastatic” dan “anti-angiogenic” Phyllanthus telah diperhatikan
apabila ekstrak Phyllanthus menghalang beberapa langkah penting semasa metastasis
dan angiogenesis; (i) “adhesion”, (ii) “migration”, (iii) “invasion”, (iv) transendothelial
migration” dan (v) “microcapillary-like tube formation”. Ini adalah disebabkan oleh
pengurangan aktiviti “matrix metalloproteinase”-2, -7 dan -9 dalam sel-sel yang
dirawati Phyllanthus.
Aktiviti antikanser dalam ekstrak Phyllanthus dipercayai berpunca daripada
kesan penghalangan tumbuhan tersebut dalam pelbagai “signalling pathways”; MAPKs,
Wnt, Myc/Max, Hypoxia dan NFκB, melalui perubahan aktiviti “intracellular
signalling” seperti pan-Ras, c-Raf, Akt, Elk1, RSK, c-Jun, JNK1/2, β-catenin, GSK3β,
c-myc, HIF-1α, VEGF, NFκB p50 dan p52. Disamping itu, pelbagai protein lain yang
terlibat dalam “proliferation”, “metastasis” dan “apoptosis” juga didapati berbeza dalam
sel-sel MeWo dan PC-3 setelah dirawati oleh Phyllanthus.
Kesimpulannya, hasil penyelidikan menunjukkan bahawa ekstrak Phyllanthus
mempunyai aktiviti antikanser melalui penghalangan dalam proliferasi, metastasis dan
angiogenesis serta induksi apoptosis pada sel melanoma, MeWo dan prostat kanser, PC-
3. Dengan itu, Phyllanthus berkemungkinan dapat dijadikan agen antikanser pada masa
depan dan diperkenalkan sebagai sebahagian daripada diet untuk menghalang
perkembangan kanser.

vi
ACKNOWLEDGEMENTS
No one walks alone in the journey of life. Apart from the efforts of myself, the
success of this doctoral thesis largely depends on the supports advices of many others.
First and foremost, I would like to gratefully and sincerely thank my supervisor,
Prof. Dr. Shamala Devi from the Department of Medical Microbiology, University of
Malaya (UM). She has guided and supported me throughout my project with her
patience and knowledge whilst allowing me the room to work in my own way. She
encouraged me to not only grow as a researcher but also as an independent thinker. I
attribute the level of my Ph.D degree to her encouragement and effort and without her
this thesis, too, would not have been completed or written. For everything you’ve done
for me, Prof, I thank you.
In my daily life, I have been blessed with a friendly and cheerful group of best
friends; Ms. Thamil Vaani, Ms. Anusyah Rathakrishnan, Ms. Adeline Yeo, and Ms.
Ramapraba Appana. Thanks for their supports, for the time we spent, the nice chats and
all the fun moments. Besides, they also had taught me humility and how to value the
lives, thoughts and expressions of others, how to care for and understand other needs.
They were always there cheering me up and stood by me through the good times and
bad. I am truly fortunate to have them as my best friends.
Thanks to Ms. Lee Sau Har and Dr. Wang Seok Mui for their kindness,
friendship, supports, and discussions throughout the project. Not forgetting my
colleagues, Mr. Le Cheng Foh, Dr. Deepa, Mr. Tan Wee Chee, and Dr. Mohammad for
all the support and encouragement. They also provided for some much-needed humor
and entertainment in what could have otherwise been a somewhat stressful laboratory

vii
environment. It would have been a lonely lab without them. I appreciate all of you and
will always cherish all the great moments we had together in the last three years.
Special thanks goes to staffs of the Department of Medical Microbiology, UM,
especially Ms. Ew Cheng Lan, for her guidance on cell culture. My sincere thanks to the
staff in the Medical Biotechnology Laboratory, Faculty of Medicine, UM, especially
Kak Sri, Kak Zul and Kak Athirah for the permission to use the equipment and their
guidance in running 2D gel electrophoresis and mass spectrometry analysis. Thanks to
sale representatives who have helped me in different parts in my research. My research
would not have been possible without their helps.
I would like to acknowledge the financial support of the Ministry of Science,
Technology and Innovation (MOSTI) for granting me National Science Fellowships
(NSF) and University of Malaya for Postgraduate Research Fund (PPP) that have made
this research possible.
Lastly, and most importantly, my deepest gratitude goes to my family for their
boundless love, quiet patient, and support throughout my life and being my strength;
this thesis is simply impossible without them. Thanks for their unwavering faith and
confidence in me is what has shaped me to be the person I am today. I dedicate this
thesis to my parents Mr. Tang Voon Kong and Mrs. Soon Meow Chin, my brothers and
younger sister. They were always unequivocal supporting me and encouraging me
throughout with their best wishes.

viii
TABLE OF CONTENTS
ABSTRACT ................................................................................................................ ii
ABSTRAK .................................................................................................................. iv
ACKNOWLEDGEMENTS ...................................................................................... vi
TABLE OF CONTENTS ........................................................................................ viii
LIST OF FIGURES ................................................................................................ xiii
LIST OF TABLES ................................................................................................. xvii
LIST OF SYMBOLS AND ABBREVIATIONS ................................................ xviii
CHAPTER 1: INTRODUCTION .......................................................................... 1
1.1 CANCER ................................................................................................. 1
1.1.1 Overview ........................................................................................... 1
1.1.2 Development of Cancer (Carcinogenesis) ......................................... 2
1.1.3 Prostate Cancer .................................................................................. 4
1.1.4 Malignant Melanoma ...................................................................... 11
1.2 Hallmarks of Cancer .............................................................................. 23
1.2.1 Sustaining Proliferative Signalling .................................................. 23
1.2.2 Evading Growth Suppressors .......................................................... 38
1.2.3 Resisting Cell Death ........................................................................ 41
1.2.4 Enabling Replicative Immortality ................................................... 47
1.2.5 Invasion and Metastasis .................................................................. 49
1.2.6 Angiogenesis ................................................................................... 52
1.2.7 Reprogramming of Energy Metabolism .......................................... 54
1.2.8 Evading Immune Destruction .......................................................... 57
1.3 Natural Products .................................................................................... 58
1.3.1 History and background of the use of natural products as
therapeutics agents .......................................................................... 58
1.3.2 Plants as source of anticancer agents .............................................. 59
1.4 Phyllanthus ............................................................................................ 62
1.4.1 History and conventional usage of Phyllanthus .............................. 62

ix
1.4.2 Scientifically proven pharmacological activities of Phyllanthus
and its constituents .......................................................................... 65
1.5 Justification and Objectives of the Study .............................................. 67
CHAPTER 2: METHODOLOGY ....................................................................... 69
2.1 Cell Culture and Maintenance ............................................................... 69
2.1.1 Normal and Cancer Cell Lines ........................................................ 69
2.1.2 Culture Medium .............................................................................. 69
2.1.3 Culture Technique ........................................................................... 70
2.2 Preparation of Serial Dilutions of Samples and Standard Anticancer
Drugs ............................................................................................... 72
2.3 High performance liquid chromatography coupled with
electronspray ionization (ESI) and mass spectrometry (LCMS-
MS) analysis ................................................................................... 72
2.4 Assessment of Cancer Cell’s Proliferation ............................................ 73
2.5 Assessment of Cell Cycle Distribution ................................................. 75
2.6 Apoptosis Assays .................................................................................. 76
2.6.1 Caspase-3/7 Detection ..................................................................... 77
2.6.2 TUNEL Assay and Apoptotic Index ............................................... 78
2.6.3 DNA Fragmentation ........................................................................ 78
2.7 Necrosis Assay ...................................................................................... 79
2.8 Anti-Metastasis Assays ......................................................................... 80
2.8.1 Transwell Migration assay .............................................................. 81
2.8.2 Transwell Invasion assay ................................................................ 82
2.8.3 Wound healing assay ....................................................................... 82
2.8.4 Cancer Cell (Cell-Matrix) Adhesion assay ..................................... 83
2.8.5 Tumour Transendothelial Migration Assay .................................... 84
2.8.6 Gelatin and casein Zymographies ................................................... 85
2.9 In vitro anti-angiogenesis assay – ECM gel-induced capillary tube
formation ......................................................................................... 86
x
2.10 Molecular Mechanisms of Anti-carcinogenic Properties of
Phyllanthus extracts ........................................................................ 87
2.10.1 Dual luciferase pathway reporter transient transfection .................. 87
2.10.2 Western Blot Analysis ..................................................................... 89
2.11 2-Dimensional Gel Electrophoresis for Protein Identification .............. 90
2.11.1 Sampel Preparation and Protein Quantification .............................. 90
2.11.2 First and Second Dimensional Separation ...................................... 91
2.11.3 Protein Digestion, Desalting and MALDI-TOF/TOF Analysis ...... 92
2.12 Statistical analysis ................................................................................. 93
CHAPTER 3: RESULTS ...................................................................................... 94
3.1 Identification of Bioactive Compounds ................................................ 94
3.2 Anti-proliferative effect of Phyllanthus extracts, fractions and
standard anticancer drugs on growth of cells .................................. 96
3.2.1 Human melanoma (MeWo) cells .................................................... 96
3.2.2 Human Adenocarcinoma (PC-3) cells ............................................. 98
3.2.3 Human Umbilical Vein Endothelial Cells (HUVECs) .................. 100
3.3 Induction of Cancer Cell Cycle Arrest ................................................ 101
3.3.1 S-phase arrest in human melanoma (MeWo) cells ........................ 101
3.3.2 G1-phase arrest in human prostate adenocarcinoma (PC-3) cells . 104
3.4 Mechanism (s) of Cancer Cell Death .................................................. 106
3.4.1 Phyllanthus induced Caspases-3/7 Activation .............................. 106
3.4.2 Phyllanthus induced DNA Fragmentation in Cancer Cells .......... 108
3.4.3 Phyllanthus induced changes in membrane integrity by LDH
release ........................................................................................... 113
3.5 Phyllanthus exerts Anti-Metastatic Effect .......................................... 116
3.5.1 Inhibition of Cancer and Endothelial Cells’ Migration ................. 116
3.5.2 Inhibition of Cancer Cell’s Motility .............................................. 120
3.5.3 Inhibition of Cancer and Endothelial Cells’ Invasion ................... 123

xi
3.5.4 Cell-Extracellular Matrix Interactions in Cancer Cells ................. 127
3.5.5 Inhibition of Cancer Cells’ Transendothelial Migration ............... 130
3.5.6 Inhibition on Matrix Metalloproteinase (MMP) Enzymes ............ 133
3.6 Phyllanthus exerts Anti-Angiogenic Effect ........................................ 138
3.7 Disruption of Cancer Cell Signalling Pathways by Phyllanthus ......... 140
3.7.1 Alterations on Multiple Signalling Pathways in MeWo cells ....... 140
3.7.2 Alterations on Multiple Signalling Pathways in PC-3 cells .......... 142
3.7.3 Phyllanthus disrupted anti-apoptotic/pro-apoptotic balance in
cancer cells .................................................................................... 144
3.7.4 Alterations of MAPK Pathways by Phyllanthus extracts ............. 146
3.7.5 Alterations of Myc/Max and Hypoxia Pathways by Phyllanthus
extracts .......................................................................................... 150
3.7.6 Alterations of NFκB Pathway by Phyllanthus extracts in MeWo
and PC-3 cells ............................................................................... 154
3.8 Proteomic profiling of the differentially expressed proteins in
Phyllanthus treated MeWo and PC-3 cells ................................... 156
CHAPTER 4: DISCUSSION .............................................................................. 165
4.1 Bioactive Compounds in Phyllanthus ................................................. 166
4.2 Anti-Proliferative Effect of Phyllanthus ............................................. 167
4.3 Regulation of Cancer Cells Proliferation by Phyllanthus ................... 169
4.4 Induction of Apoptosis by Phyllanthus ............................................... 171
4.5 Anti-Metastatic Effect of Phyllanthus ................................................. 178
4.6 Anti-Angiogenesis Effect of Phyllanthus ........................................... 180
4.7 Activation of Matrix Metalloproteinases by Phyllanthus ................... 183
4.8 Alteration in Energy Metabolism of Cancer cells ............................... 185
CHAPTER 5: CONCLUSION ........................................................................... 189
REFERENCES ....................................................................................................... 193
APPENDICES ........................................................................................................ 225
APPENDIX I: Reagent and media preparation ................................................... 225

xii
APPENDIX II: The fold changes of differentially expressed proteins in
treated MeWo cells. ...................................................................... 234
APPENDIX III: The fold changes of differentially expressed proteins in
treated PC-3 cells. ......................................................................... 238
APPENDIX IV: Additional Outputs of the PHD Project .................................... 243
xiii
LIST OF FIGURES
Figure 1.1: Schematic representative of carcinogenesis development (Tang &
Sekaran, 2011). ....................................................................................... 3
Figure 1.2: Zones (left) and lobes (right) classifications of prostate gland
(National Cancer Institute, 2009). .......................................................... 5
Figure 1.3: Schematic representation of prostate cancer progression. Depending
upon the genes involved, the degree of prostate cancer growth is
variable between individuals and the scale shown is an estimated
average. Adapted from (Labrie et al., 2000). ......................................... 7
Figure 1.4: Stages of prostate cancer (National Cancer Institute, 2009). ................... 10
Figure 1.5: Three most common types of skin cancer; (A) Basal cell carcinoma
(B) Squamous cell carcinoma (Romito & Burr, 2011), and (C)
Malignant melanoma (Skin Cancer Specialists, 2012). (D)
Progression of malignant melanoma, adapted from (Miller &
Mihm, 2006). ........................................................................................ 13
Figure 1.6: Types of invasive melanoma: (A) superficial spreading melanoma
(Lehrer, 2011) , (B) nodular melanoma (Gupta, 2012), (C) lentigo
maligna melanoma (Oakley, 2012), and (D) acral lentiginous
melanoma (Swetter et al., 2004). .......................................................... 16
Figure 1.7: Diagnosis of melanoma according “A-B-C-D-E” acronym (Abbasi et
al., 2004). .............................................................................................. 18
Figure 1.8: Oncogene activation of the MAPK/ERK cascade (Roberts & Der,
2007). .................................................................................................... 26
Figure 1.9: Overview of activation JNK and p38 MAPK pathways (Wagner &
Nebreda, 2009). .................................................................................... 29
Figure 1.10: The Wnt signalling pathway. Three distinct pathways: (1) the
canonical (β-catenin, blue) pathway, (2) non-canonical (planar cell
polarity, PCP, orange) pathway, and (3) Wnt/Ca2+
pathway (green)
(Huelsken & Behrens, 2002). ............................................................... 32
Figure 1.11: Impact on the epigenetic program of cells with Myc/Max. Adapted
from (Felsher, 2003). ............................................................................ 34
Figure 1.12: Overview of the cannonical (Left) and non-cannonical (Right) of
NFκB pathways (Hooper, 2012). .......................................................... 37

xiv
Figure 1.13: The p53-Mdm2 interactions. Arrows indicate positive inputs;
horizontal bars indicate inhibitory inputs (Oren et al., 2002). ............. 40
Figure 1.14: Schematic diagram illustrating (A) intrinsic and (B) extrinsic
pathways of apoptosis (Fan et al., 2005). ............................................. 44
Figure 1.15: Schematic representation of cell cycle regulation (Andrietta et al.,
2001). .................................................................................................... 48
Figure 1.16: Schematic representative of cascade steps in cancer metastasis
(Bacac & Stamenkovic, 2008). ............................................................. 51
Figure 1.17: Schematic representation of the tumour angiogenesis cascade (Li et
al., 2012). .............................................................................................. 53
Figure 1.18: Schematic representation of the hypoxia-inducible factor (HIF)-1
pathway (Ziello et al., 2007). ............................................................... 56
Figure 1.19: P.urinaria (Fito Pharma 2011), P.amarus (Find me cure, 2011) and
P.niruri (GardenSeed, 2011). ............................................................... 63
Figure 3.1: Anti-proliferative effect of Phyllanthus extracts on the growth of
HUVECs. ............................................................................................ 100
Figure 3.2: The kinetic of cell cycle distribution of Phyllanthus extracts-treated
MeWo cells. ........................................................................................ 103
Figure 3.3: The kinetic of cell cycle distribution of Phyllanthus extracts-treated
PC-3 cells. ........................................................................................... 105
Figure 3.4: The level of caspases-3/7 in cells treated with Phyllanthus extracts
and standard drugs). ............................................................................ 107
Figure 3.5: TUNEL analysis of MeWo and PC-3 cancer cells after treatment
with Phyllanthus extracts with magnification 100X. ......................... 109
Figure 3.6: Percentage of apoptotic index (%) of untreated and treated
(Phyllanthus extracts and anticancer drugs) of MeWo and PC-3
cancer cells from TUNEL analysis. .................................................... 110
Figure 3.7: Apoptotic DNA fragmentation was observable in Phyllanthus
extracts-treated (A) MeWo and (B) PC-3 cells. ................................. 112
Figure 3.8: The percentage of LDH levels in treated and untreated MeWo cells. ... 114
Figure 3.9: The percentage of LDH levels in the treated and untreated PC-3
cancer cells. ........................................................................................ 115
Figure 3.10: Effect of Phyllanthus extracts on the migration ability of MeWo
cells. .................................................................................................... 117

xv
Figure 3.11: Effect of Phyllanthus extracts on the migration ability of PC-3 cells. 118
Figure 3.12: Effect of Phyllanthus extracts on the migration ability of HUVECs. . 119
Figure 3.13: Effect of Phyllanthus extracts on the motility of MeWo cells. ........... 121
Figure 3.14: Effect of Phyllanthus extracts on the motility of PC-3 cells. .............. 122
Figure 3.15: Effect of Phyllanthus extracts on the invasion ability of MeWo
cells. .................................................................................................... 124
Figure 3.16: Effect of Phyllanthus extracts on the invasion ability of PC-3 cells. .. 125
Figure 3.17: Effect of Phyllanthus extracts on the invasion ability of HUVECs. ... 126
Figure 3.18: Effects of Phyllanthus on MeWo cells adhesion activity. ................... 128
Figure 3.19: Effects of Phyllanthus on PC-3 cells’ adhesion activity. ................... 129
Figure 3.20: Effects of Phyllanthus on transendothelial migration of MeWo cells. 131
Figure 3.21: Effects of Phyllanthus on transendothelial migration of PC-3 cells. ... 132
Figure 3.22: Zymography analysis of MeWo cells. MMP-2 and -7 were detected
at 64KDa and 20kDa, respectively. .................................................... 134
Figure 3.23: Zymography analysis of PC-3 cells. .................................................... 136
Figure 3.24: Zymography analysis of HUVECs. MMP-2 was detected at 64kDa. . 137
Figure 3.25: Effect of Phyllanthus extracts on microcapillary-like tube formation
of HUVECs. ....................................................................................... 139
Figure 3.26: Alterations in ten cancer-related pathways upon Phyllanthus
treatment in MeWo cells. ................................................................... 141
Figure 3.27: Alterations in ten cancer-related pathways upon Phyllanthus
treatment in PC-3 cells. ...................................................................... 143
Figure 3.28: Effects of Phyllanthus extracts on pro-apoptotic/anti-apoptotic
balance in (A) MeWo and (B) PC-3 cells. ......................................... 145
Figure 3.29: Alterations in activities of intracellular signalling molecules of
MAPK and PI3K/Akt pathways upon Phyllanthus treatment in
MeWo cells. ........................................................................................ 147
Figure 3.30: Alterations in activities of intracellular signalling molecules of
MAPK and PI3K/Akt pathways upon Phyllanthus treatment in PC-
3 cells. ................................................................................................. 149
Figure 3.31: Alterations in activities of intracellular signalling molecules of
Myc/Max and Hypoxia pathways upon Phyllanthus treatment in
MeWo cells. ........................................................................................ 151

xvi
Figure 3.32: Alteration in intracellular signalling molecules of (A) Wnt and (B)
Myc/Max and Hypoxia pathways in PC-3 cells after treatment with
Phyllanthus extracts. ........................................................................... 153
Figure 3.33: Alterations of activities intracellular signalling molecules in NFκB
pathway in (A) MeWo and (B) PC-3 cells after treatment with
Phyllanthus extracts. ........................................................................... 155
Figure 3.34: The proteomic profiles of (A) untreated, aqueous- (B) and
methanolic- (C) Phyllanthus treated MeWo cells. ............................. 158
Figure 3.35: Proteomic profiles of (A) untreated, aqueous- (B) and methanolic-
(C) Phyllanthus treated PC-3 cells. .................................................... 162
Figure 4.1: Schematic diagram illustrating Phyllanthus regulates multiple
signalling [MAPKs (A), PI3K/Akt (B), Myc/Max and Hypoxia (C),
NFκB (D) and p53 (E)] pathways and protein activities (G) in
MeWo cells. ........................................................................................ 187
Figure 4.2: Schematic diagram illustrating Phyllanthus regulates multiple
signalling [(MAPKs (A), PI3K/Akt (B), Wnt, Myc/Max and
Hypoxia (C), NFκB (D), and apoptosis (E)] pathways and protein
activities (G) in PC-3 cells. ................................................................ 188

xvii
LIST OF TABLES
Table 1:1: Treatment of melanoma according stages (Melanoma Institute
Australia, 2012; National Cancer Institute, 2012; Sosman, 2012). ...... 20
Table 1:2: Differential features of apoptosis and necrosis (Bold et al., 1997;
Bortner et al., 1997; Cohen, 1997) ....................................................... 46
Table 1:3: Natural products-plant derived anticancer drugs (Pezzuto, 1997; da
Rocha et al., 2001; Amin et al., 2009). ................................................ 61
Table 1:4: Worldwide ethnobotanical uses of P. niruri (Taylor, 2003). ................ 64
Table 1:5: Various pharmacological activities of Phyllanthus species. ................. 65
Table 2:1: Standard curve for protein quantification ............................................. 91
Table 3:1: Bioactive compounds in aqueous and methanolic extracts of
Phyllanthus species (P.A: P.amarus, P.N: P.niruri; P.U:
P.urinaria and P.W: P.watsonii) (Tang et al., 2010). .......................... 95
Table 3:2: The IC50 values of Phyllanthus extracts on human skin cancer
(melanoma, MeWo) and normal (CCD-1127Sk) cell lines. Data
represent the mean (± SEM) of three independent experiments,
each performed in triplicate. All showed significant difference
between untreated cells and Phyllanthus-treated cells, p<0.05
(Tang et al., 2010). ............................................................................... 97
Table 3:3: Cytotoxicity (IC50 ± SEM) values of Phyllanthus extracts on human
prostate adenocarcinoma (PC-3) and normal (RWPE-1) cell lines.
Data represent the mean (± SEM) of three independent
experiments, each performed in triplicate. All showed significant
difference between untreated cells and Phyllanthus-treated cells,
p<0.05 (Tang et al., 2010). ................................................................... 99
Table 3:4: The differentially expressed proteins in treated MeWo cells. ............ 159

xviii
LIST OF SYMBOLS AND ABBREVIATIONS
Abbreviations Description
µg Microgram
m/z Mass- to charge- ratio
°C Degree Celcius
vs Versus
ATP Adenosine triphosphate
DMSO Dimethylsulfoxide
ECM Extracellular matrix
EDTA Ethylene diamine Tetra-acetic Acid
FDA Food and Drug Administration
FBS Fetal bovine serum
HPLC High-performance liquid chromatography
Hsp Heat Shock Proteins
LDH Lactate dehydrogenase
NCI National Cancer Institute
MMP Matrix Metalloproteinase
MTS [3-(4,5-dimethylthiazol-2-yl)-5-. (3-carboxymethoxyphenyl)-2-(4-
sulfophenyl)-2H-tetrazolium]
MS/MS Tandem mass spectrometer
PAGE Polyacrylamide grl electrophoresis
PBS Phosphate buffered saline
SDS Sodium dodecyl sulfate
WHO World Health Organization
NCI National Cancer Institute
MMP Matrix Metalloproteinase

1
CHAPTER 1: INTRODUCTION
1.1 CANCER
1.1.1 Overview
The first description of cancer is recorded in an ancient Egyptian papyrus dated
between 3000 and 1500 B.C., about eight cases of breast tumours that were treated by
cauterization. However, the origin of the word “Cancer” was first described by the
ancient Greek physician, Hippocrates (460-370 B.C.), known as the “Father of
Medicine”. Hippocrates was the first person who clearly recognized and differentiated
between benign and malignant tumours after noticing the presence of blood vessels only
in malignant tumours. Carcinos and carcinoma were the terms used by Hippocrates to
describe non-ulcer forming and ulcer-forming tumours, respectively. In Greek, both
words refer to a crab, most likely applied to the disease where the finger-like spreading
projections from a cancer mimic claws of a crab. Later, the Roman physician, Celsus
(28-50 B.C.), translated these terms into the Latin word, “Cancer” which is also known
as crabs and until today is still widely used in medicine (Cohen, 1997;
MedicineWorld.Org, 2012).
Cells are the building blocks of all living things in this world and all cells are
derived from pre-existing cells. Every cell carries out respiration, reproduction
(meiosis) and growth (mitosis), which are controlled by regulating gene expression at
the DNA level. In a normal cell, disruptions or mutations in their DNA will initiate a
repair system on the involved DNA or leading to cell death (Anagnostopoulos et al.,
2008). However, in cancer cells, neither the DNA is repaired nor cell death occurs;
instead, the mutated cell will continuously generate new mutated cells, which all have
the same damaged DNA as the first cell does. These mutated cells may have acquired

2
various abnormalities, including aneuploidy, chromosomal rearrangements,
amplifications, deletions, gene rearrangements, and loss- or gain-of-function mutations
(Mills, 2003). Most cancer cases are genetically inherited because the mutated DNA can
be passed along the generations. Most mutation in DNA can occur during cell
replication and/or caused by carcinogens such as cigarette smoking, diet or oncoviruses
such as Epstein–Barr virus (Kim et al., 1994; Vincent & Gatenby, 2008; Cancer
Research UK, 2012).
Cancer is a name given to a group of diseases that arise from a single (mutated)
cell when it starts to grow abnormally in an uncontrollable manner to form a group of
undifferentiated cells, known as a tumour. Tumours are classified into two categories,
benign or malignant. Not all benign tumours are cancerous but all malignant tumours
are (Hanahan and Weinberg, 2000). The main difference is that benign tumour lacks
metastatic ability, grows locally and is less harmful. However, some benign tumours
can transform into malignant tumours that possess metastatic ability to invade and
spread to other parts of the body via the blood or lymphatic circulation and form
secondary tumours and eventually cause death (Vincent & Gatenby, 2008; Hanahan &
Weinberg, 2011).
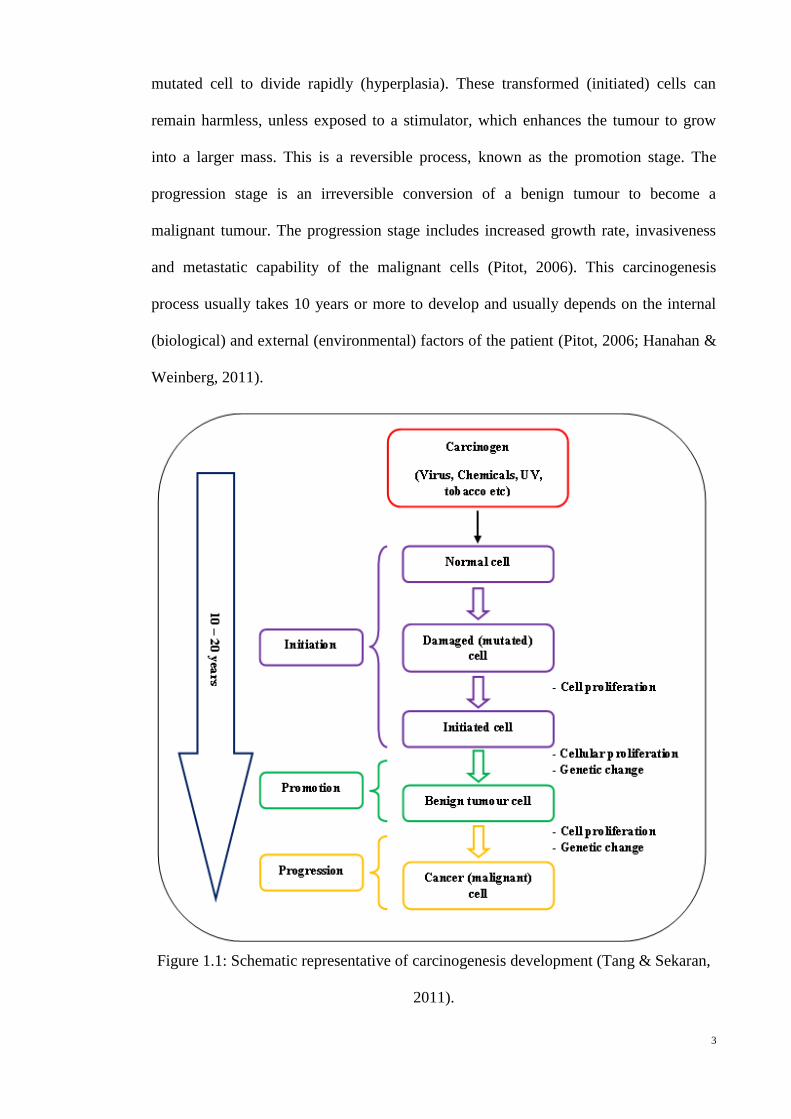
1.1.2 Development of Cancer (Carcinogenesis)
Cancer develops through a multistep process known as carcinogenesis, where by
normal cells are transformed into cancerous cells. The process involves cellular and
genetic changes and eventually reprograms a cell, thus forming a malignant mass.
Carcinogenesis involves three significant steps; initiation, promotion and progression
(Figure 1.1) (Van der Kamp & Jaspers, 1984; Pitot, 2006). An initiation stage is a
permanent and irreversible event, which involves one or more cellular changes arising
upon exposure to carcinogens, which leads to alteration in DNA and may result in a
3
mutated cell to divide rapidly (hyperplasia). These transformed (initiated) cells can
remain harmless, unless exposed to a stimulator, which enhances the tumour to grow
into a larger mass. This is a reversible process, known as the promotion stage. The
progression stage is an irreversible conversion of a benign tumour to become a
malignant tumour. The progression stage includes increased growth rate, invasiveness
and metastatic capability of the malignant cells (Pitot, 2006). This carcinogenesis
process usually takes 10 years or more to develop and usually depends on the internal
(biological) and external (environmental) factors of the patient (Pitot, 2006; Hanahan &
Weinberg, 2011).
Figure 1.1: Schematic representative of carcinogenesis development (Tang & Sekaran,
2011).
4
1.1.3 Prostate Cancer
1.1.3.1 Anatomy and Physiology of Prostate Gland
The prostate gland is a compound tubuloalveolar exocrine gland of the male
reproductive system, which is responsible for the production and storage of seminal
fluids. These fluids are enriched with zinc, citric acid, choline, and various proteins and
hormones that provide a protective medium for sperms as they make their way through
the vagina for fertilization. Without this protective medium, most sperm would die soon
after ejaculation. Before ejaculation, sperms will enter the vas deferens that is connected
to the urethra, a tube that extends from the bladder to the tip of penis and builds the
opening for semen and urine. During ejaculation, the muscular contractions in the
prostate gland help to expel the semen out of the body through the urethra. It also
produces a protein known as prostate-specific antigen (PSA) that turns the semen into
liquid. The normal adult human prostate is about the size of a walnut and is located at
the neck of the urinary bladder and surrounds part of the urethra (National Cancer
Institute, 2009). Within the prostate, there is a prostatic urethra, an extension of the
urethra coming from the bladder, and merges with the two ejaculatory ducts.
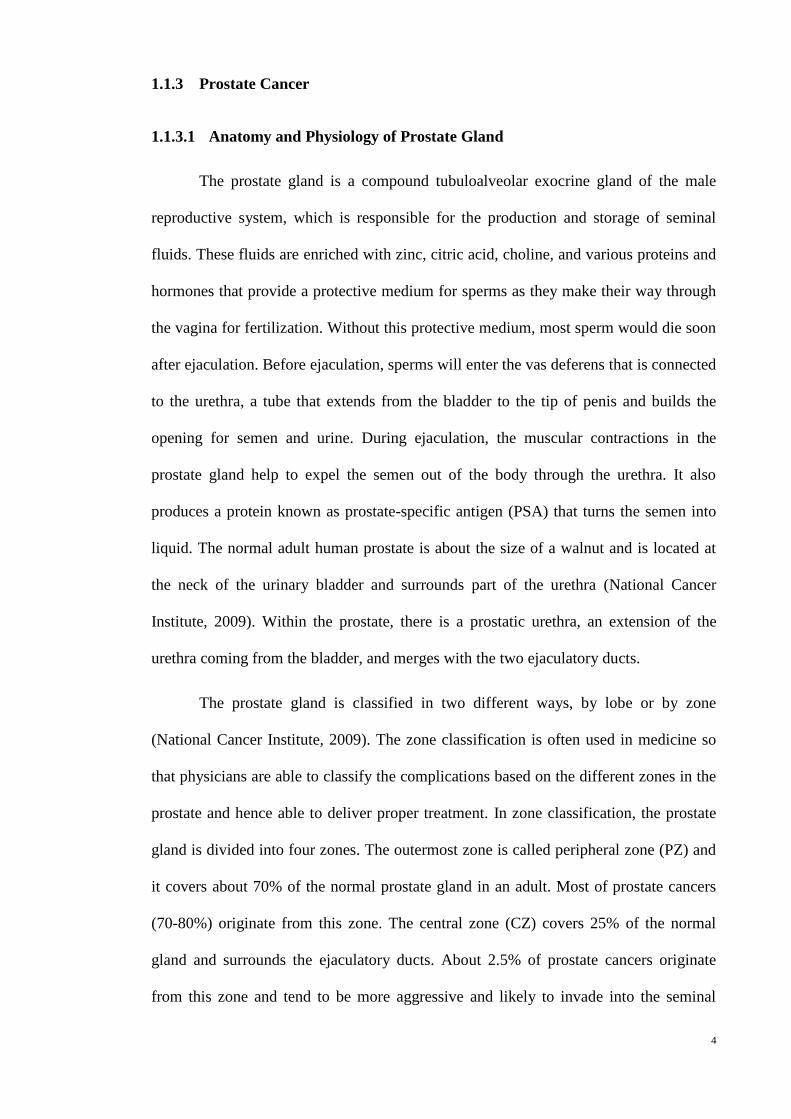
The prostate gland is classified in two different ways, by lobe or by zone
(National Cancer Institute, 2009). The zone classification is often used in medicine so
that physicians are able to classify the complications based on the different zones in the
prostate and hence able to deliver proper treatment. In zone classification, the prostate
gland is divided into four zones. The outermost zone is called peripheral zone (PZ) and
it covers about 70% of the normal prostate gland in an adult. Most of prostate cancers
(70-80%) originate from this zone. The central zone (CZ) covers 25% of the normal
gland and surrounds the ejaculatory ducts. About 2.5% of prostate cancers originate
from this zone and tend to be more aggressive and likely to invade into the seminal
5
vesicle. The third zone known as transition zone (TZ) covers 5% of normal prostate
volume and this region is associated with prostate enlargement problems. The last zone
known as anterior fibro-muscular zone or stroma, is devoid of any glandular parts but
composed mainly of muscles and fibrous tissues.
In anatomy, prostate gland is divided into four lobes; anterior lobe, posterior
lobe, lateral lobes and median lobe (National Cancer Institute, 2009). Anterior lobe
refers to the anterior portion of the gland lying in front of the urethra. This lobe lacks
glandular tissue and completely composed of fibromuscular tissue. Median lobe is a
cone-shaped portion of the gland situated between the two ejaculatory ducts and the
urethra. The lateral lobes form the main mass of the gland and are continuous
posteriorly. There are two lobes (right and left lobes) separated by the prostatic urethra.
The last part is the posterior lobe, which is used by anatomists to describe the
posteromedial part of the lateral lobes that can be palpated through the rectum during a
digital rectal exam (DRE).
Figure 1.2: Zones (left) and lobes (right) classifications of prostate gland (National
Cancer Institute, 2009).

6
1.1.3.2 Prostate Cancer
In 2008, according to GLOBOCAN report, there were about 12.7 million newly
diagnosed cancer cases with 7.6 million cancer deaths (Ferlay et al., 2010). Prostate
cancer is the second most frequently diagnosed cancer after lung cancer. The incidence
and mortality rates of prostate cancer are increasing in Asia as well as in the United
States over the past few decades (Ferlay et al., 2010), while in Malaysia, prostate cancer
is the 6th most common cancer among men (Hew, 2012).
Prostate cancer, also knowns as adenocarcinoma, develops when the semen-
secreting prostate gland cells are transformed into cancer cells. The schematic
representation in Figure 1.3 shows the evolution of prostate cancer which starts with
alterations at the genetic level, followed by a series of molecular changes, eventually
resulting in an immortal cancer cell. The accumulation of genetic and molecular
changes over the years allows visible histopathology of cancer cells. The malignancy of
prostate tumour is a slow-growing process, and hence likely to be detected among the
elderly. Prostate tumours can only be detectable when they reach relatively larger in
size (0.3 cm3) by screening of prostate-specific antigen (PSA), or via digital rectal exam
(DRE) and/or transrectal echography of the prostate. It is important to mention that
when diagnosis has become possible by screening, approximately 60% of the prostate
cancers have metastasized outside of the prostate and are no longer organ confined
(Labrie et al., 2000; National Cancer Institute, 2009).

7
Figure 1.3: Schematic representation of prostate cancer progression. Depending upon
the genes involved, the degree of prostate cancer growth is variable between individuals
and the scale shown is an estimated average. Adapted from (Labrie et al., 2000).

8
1.1.3.3 Symptoms and Diagnosis
The high mortality rate in prostate cancer patients is due to late detection as
prostate cancer is usually asymptomatic or the symptoms appear only during the
advanced stage of disease. Patients will experience difficulties during urination such as
nocturia, hematuria, dysuria, pain, and may also have limited sexual functions and
performance. The presence of pain in one or more bones such as in flares in the pelvis,
the lower back, the hips, or the upper legs; may indicate the occurrence of metastases.
In rare cases, patient may experience significant unexplained weight loss and fatigue.
About 50% of prostate cancer patients are usually diagnosed with bone metastasis
(National Cancer Institute, 2009).
There are several methods to diagnose prostate cancer in male patients, such as,
detection of prostate tumour marker, prostate specific antigen, transrectal
ultrasonography, digital rectal examination and biopsy (National Cancer Institute,
2009). Prostate-specific antigen (PSA) is a specific protein produced by prostate gland.
PSA occurs in the serum of healthy men is in small quantities, and therefore abnormally
high levels of serum PSA indicate the presence of prostate cancer. Federal Drug
Administration (FDA) has approved the screening of the PSA in conjunction with a
digital rectal exam (DRE) in men for early detection. A digital rectal examamination
(DRE) is to check for abnormal growth or enlargement of the prostate gland in men as
presence of prostate tumour can be felt as a hard lump. Transrectal ultrasonography
(TRUS) uses high energy ultrasound to provide qualitative as well as quantitative
measurements of prostate tissue stiffness. Biopsy is the removal small pieces of prostate
tissue through transrectal (rectum) or transperinal (between scrotum and rectum) for
microscopic examination by urologists and oncologists.

9
1.1.3.4 Stages and Treatments
It is important to determine the stage of prostate tumour in order to choose and
deliver the best modalities of treatment to patientw. There is a differential response to
treatment in the different stages of prostate cancer. Several tests will be conducted in
order to determine the stage of prostate tumour in patients, that includes CT
(computerised tomography) scan, MRI (magnetic resonance imaging), PSA (prostate-
specific antigen) test and tumour biopsy (National Cancer Institute, 2009).
There are four stages in prostate tumour (Figure 1.4) (National Cancer Institute,
2009). Stage I is where cancer cells are found in prostate gland with low PSA levels
(<10 ng/ml). In stage II, PSA levels are between 10-20 ng/ml and it is further
subdivided into two groups; IIA and IIB. In stage IIA, cancer cells may be found in one-
half or less than one lobe, but in stage IIB, cancer cells may be seen in both lobes of the
prostate gland. In stage III, cancer could spread beyond the outer layer of prostate gland
and may spread to the seminal vesicles with PSA values ranging from 2-10 ng/ml. In
stage IV, the PSA can be any level because cancer has spread to nearby or other organs
such as rectum, bladder and bone.
Currently, there are four standard treatments for prostate cancer; watchful
waiting, surgery, radiation therapy and hormone therapy. In watchful waiting, a patient
will be closely monitored by doctors and no treatment will be given until symptoms
start to appear. While in surgery, the prostate gland from patients will be removed
before the cancer cells spreads to organs in the vicinity. In radiation therapy, high
energy X-rays will be used to kill cancer cells. Antiandrogens, estrogens and luteinizing
hormone-releasing hormone agonists, are the few examples used in hormone therapy to
stop the growth of cancer cells. Other treatments are includes chemotherapy and proton-
beam radiation therapy (National Cancer Institute, 2009).

10
Figure 1.4: Stages of prostate cancer (National Cancer Institute, 2009).

11
1.1.4 Malignant Melanoma
1.1.4.1 Anatomy and Organization of Human Skin
The skin is the soft outermost covering of the human body. In mammals, the
skin is the largest organ of the integumentary system, composed of multiple layers of
ectodermal tissue. The functions of skin includes protection of the underlying muscles,
bones and internal organs, sensation, heat regulation, control of evaporation, excretion,
absorption and water resistance (Miller & Mihm, 2006).
1.1.4.2 Skin Cancer (Nonmelanoma and Melanoma)
Skin cancer is the most commonly diagnosed type of cancer. There are three
main types of skin cancers; basal cell carcinoma, squamous cell carcinoma, and
malignant melanoma (Table 1.5) (National Cancer Institute, 2012). The less common
skin cancers accounting for less than 1% of nonmelanoma skin cancers includes
dermatofibrosarcoma protuberans, merkel cell carcinoma, kaposi's sarcoma,
keratoacanthoma, sebaceous carcinomas, microcystic adnexal carcinoma, Pagets's
disease of the breast, atypical fibroxanthoma, leimyosarcoma, and angiosarcoma (Skin
Cancer Info Line, 2012). Each cancer is named based on the type of skin cell from
which it arose.
Nonmelanoma skin cancer (basal cell carcinoma and squamous cell carcinoma)
is the most common type of skin cancer, whereas melanoma is least common, but is the
most aggressive and serious type of skin cancer. Basal cell carcinoma presents as a
raised, smooth, pearly bump on the sun-exposed skin of the head, neck, back, chest, or
shoulders. It is considered as the least deadly form when compared to others skin
cancers. Squamous cell carcinoma is the second most common skin cancer and appears
12
as red, scaling, thickened patch on sun-exposed skin and ulceration and bleeding may
occur.
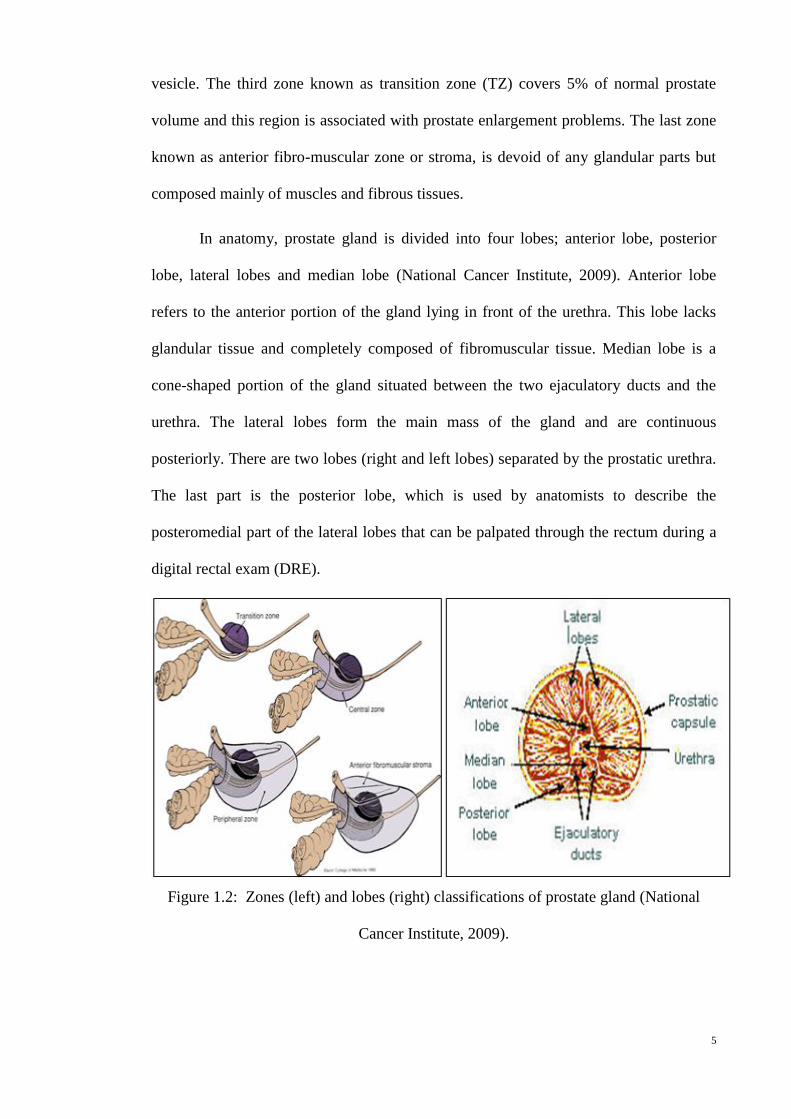
Melanoma is a tumour arising from the melanocyte, which are melanin-
producing cells located in the basal layer of the epidermis (Figure 1.6). The main
function of this cell is to produce melanin through a process called melanogenesis.
Melanin provides protection to the hypodermis from ultraviolet rays (DNA
photodamage). Fair-skinned populations are more susceptible to melanoma
development as compared to dark-skinned populations due to the low activity and
number of melanocytes in their skin. Malignant melanoma is an aggressive and life-
threatening skin cancer because it has a high tendency to metastasize to other parts of
the human body. In most of the cases, melanomas are typically pigmented (having a
brown or dark colour), but in rare cases, this pigment can be flesh-coloured and this is
known as amelanotic melanoma (Miller & Mihm, 2006).
Most of the melanoma cases start from an uncontrolled proliferation of
melanocytes into benign nevus, or mole, in the human epidermis skin layer (Figure
1.5D). These pre-existing benign nevi will continue to progress into dysplastic nervus.
However, there are exceptions where some melanomas will begin from dysplastic
nevus, which are not really invasive malignancies, but rather just moles that have some
aberrant growth. A radial growth phase melanoma is where the melanoma starts to grow
through the epidermis into the upper region of dermis, where blood vessel and
lymphatics are located. The melanoma continues to progress in a vertical growth phase
and spreads deeper into the dermis and starts invading the blood vessels and/or
lymphatic systems. Eventually, the metastasized melanoma forms a secondary tumour
at a distant site in the body (lung, liver or brain) (Miller & Mihm, 2006).

13
The American Cancer Society has estimated 76,690 individuals will be
diagnosed with melanoma with 9,480 expected deaths in 2013 (Siegel et al., 2013).
Australia and New Zealand have the highest incidence rate of skin cancer in the world
(Cancer Council Australia, 2012). In 2010, there were 12,818 new cases of malignant
melanoma diagnosed in the United Kingdom alone (Cancer Reserach UK, 2012).
Figure 1.5: Three most common types of skin cancer; (A) Basal cell carcinoma (B)
Squamous cell carcinoma (Romito & Burr, 2011), and (C) Malignant melanoma (Skin
Cancer Specialists, 2012). (D) Progression of malignant melanoma, adapted from
(Miller & Mihm, 2006).

14
1.1.4.3 Types of Melanoma
In general, melanomas are categorized based on their clinical characteristics and
histologic at features. Melanoma can be divided into two main categories, in situ and
invasive. In situ melanoma is the least dangerous type of melanoma. In situ melanoma
rarely spread and is curable if removed early with a 5 mm margin of normal skin.
However, invasive melanomas are not confined only to the epidermis, and are able to
grow into the dermis layer of the skin. The deeper the growth of melanoma into the
dermis, the greater the risk that it may spread to distant sites as there are blood vessels
and lymphatic systems, which aids melanoma to metastasize. There are four basic types
of invasive melanoma, which differ in occurrence and distribution in the human body;
superficial spreading melanoma (SSM), nodular melanoma (NM), lentigo maligna
melanoma (LMM), and acral lentiginous melanoma (ALM) (de Braud et al., 2003)
(Figure 1.6).
Superficial spreading melanoma (SSM) is the most common form of cutaneous
melanoma accounting for about 70% of all diagnosed melanoma cases. It may occur at
any age and body site. It usually appears flat, and is irregular in shape and colour, with
various shades of black and brown. SSM is characterized by a noticeable intraepidermal
proliferation (Lemon & Burns, 1998; de Braud et al., 2003). It exhibits a slow-growing
radial growth pattern that may progress into a nodular appearance. The regressions of
patches are frequently seen in an amelanotic area. It then becomes an asymmetrically
raised patch with sculpted edges and is irregularly pigmented with colours varying from
pale blue and pink to mottled brown-black variegation, sometimes completely black (de
Braud et al., 2003).
Nodular melanoma (NM) is the most aggressive type of melanoma and accounts
for 15 to 30% of all diagnosed melanoma patients (de Braud et al., 2003). NMs are

15
more common in men and often seen in non-weight-bearing areas such as trunk, head
and neck regions. It appears as a nodule with sharply demarcated borders on the skin,
often shiny with a slightly infiltrated base. The colour of NM is generally darkly
pigmented. However, some can be light brown or even colourless (non-pigmented) and
more uniform than SSM (Sagebiel, 1993). These lesions are characterized by a
relatively rapid vertical growth phase, which is capable of growing more rapidly in
thickness (penetrate into the skin) rather than growing radially (growth in diameter to
form a peduncle). It usually has a well-defined border as compared to superficial SSM
(Sagebiel, 1993; Lemon & Burns, 1998). Ulceration and bleeding may occur in NM
patients.
Lentigo maligna melanoma (LMM) accounts for approximately 5% of all
melanoma cases (Weinstock & Sober, 2006). It is often diagnosed in elderly patients
who are more than 50 years of age and appears in sun-exposed areas such as the face,
forearms, head and neck. LLM arises from a pre-existing lentigo with irregular edges,
rather than a mole. The colour of the lesion varies between dark to brown-black
variegation (Weinstock & Sober, 2006). The growth pattern of LLM is more radial than
other types of melanomas, remain in situ for up to approximately 20 years, thus
resulting in decreased incidence of metastasis (Lemon & Burns, 1998). However, this
horizontal non-invasive growth phase may divert to vertical growth. The vertical growth
phase usually involves spindle-like cells invading into the reticular dermis surrounded
by fibrotic stroma (dermoplastic) or may form fascicles displaying neural features
infiltrating the perineural structures of the skin (de Braud et al., 2003).
Acral lentiginous melanoma accounts for less than 5% of all diagnosed
melanomas. As its name dictated, it mainly occurs on non-hairy skin of the acra (palm,
sole, nailbed), and generally appears as a plantar lesion on the weight-bearing surface of
the foot (Piliang, 2009). The appearance of this lesion may be vary due to the skin

16
thickness at these sites (de Braud et al., 2003). This is the most common type of
melanoma seen in dark-skinned people (African Americans, Hispanics, and Asians),
and rarely occurs in white people (de Braud et al., 2003; Piliang, 2009). This aggressive
type of melanoma has the ability to metastasize much like nodular melanomas (Lemon
& Burns, 1998).
Figure 1.6: Types of invasive melanoma: (A) superficial spreading melanoma (Lehrer,
2011) , (B) nodular melanoma (Gupta, 2012), (C) lentigo maligna melanoma (Oakley,
2012), and (D) acral lentiginous melanoma (Swetter et al., 2004).

17
1.1.4.4 Diagnosis
Malignant melanoma is diagnosed according to its pigmentation. “A-B-C-D-E”
acronym is a guideline used in the identification of pigmented lesions evaluated with
biopsy (Figure 1.7) (Abbasi et al., 2004). Asymmetry (A) is where two halves of
median line through a mole is not a match of each other. Border (B) is where the
borders of an early melanoma tend to be irregular or uneven. The edges may be
scalloped or notched. Having a variety of colour (C) is another warning signal for
melanoma. The mole or lesion is not one uniform colour but rather a combination
ranging from light brown to dark brown, black, red, blue or white. Diameter (D) of
melanoma usually greater than 1/4 inch or 6 mm. Evolution (E) refers to any noticeable
change occurring in a mole or lesion over time regardless of size, shape, colour,
elevation, or any new symptoms such as bleeding, itching or crusting (Bono et al.,
1999).

18
Figure 1.7: Diagnosis of melanoma according “A-B-C-D-E” acronym (Abbasi et al.,
2004).
1.1.4.4.1 Stages and Treatments
It is important to determine the depth of melanoma growth into the skin and its
degree of metastasis. This information is important to determine the appropriate
treatment to be delivered, risk of reoccurrence, and the ability to metastasize into the
nearby lymph nodes. Most melanomas occurring at an early stage have high cure rates.
However, the effectiveness of treatment is diminished in advanced melanoma and has a
50% survival rate, ranging from 2 to 8 months with only 5% generally surviving for 5
years or more (Jemal et al., 2011).
The American Joint Committee on Cancer (AJCC) TNM classification is the
most often classification for melanoma staging. TNM classification is based on the size
of primary tumour (T), number of regional lymph nodes (N) and presence or absence of

19
distant metastases (M) (Balch et al., 2009). The T stage is based on vertical thickness of
the lesions in millimeters (Breslow’s thickness) and the anatomic level of invasion into
the dermal layers of skin and subcutaneous fat (Clark’s classification). The N stage is
determined by the distance of metastasized melanoma to nearby lymph nodes. The M
stage is simply based on the presence or absence of metastasis to distant sites.
Melanoma is further grouped into different stages according to the revised TNM
staging system. The combinations of T, N, and M groups will give an overall stage,
using Roman numerals I to IV (Table 1.1). This process is known as stage grouping
(Kim et al., 2002; Balch et al., 2009). In general, the patients with lower stage cancers
have high chances of cure. Therefore, correct staging is important because best
modalities of treatment to be delivered to patient are generally based on this parameter.

20
Table 1:1: Treatment of melanoma according stages (Melanoma Institute Australia,
2012; National Cancer Institute, 2012; Sosman, 2012).
Stages of
Melanoma
Description Treatments
Stage 0
(in situ) Appears as abnormal discoloured or
dark coloured mole.
Only in the epidermis and has not
spread into dermis layer
Surgery, or
Cream on sensitive areas on
the face
Stage I Stage IA: thickness is less or about
1 mm, with no ulceration and no
mitoses
Stage IB: thickness is less or about 1
mm, with ulceration or mitoses
Surgery (depends on the
thickness of the melanoma)
Stage II Stage IIA:
thickness is 1 - 2 mm with
ulceration or thickness is 2 - 4
mm with no ulceration
No spread into nearby lymph
nodes or distant metastasis
Stage IIB:
thickness is 2 - 4 mm with
ulceration or greater than
thickness 4 mm with no
ulceration
No spread into nearby lymph
nodes or distant metastasis
Stage IIC:
thickness is greater than
thickness 4 mm with ulceration
No spread into nearby lymph
nodes or distant metastasis
Surgery, or
Adjuvant therapy with
interferon after surgery
Stage III Stage IIIA:
thickness ranges from less that 1
mm to more than 4 mm with no
ulceration
Micrometastasis into 1 – 3
nearby lymph nodes
No distant metastasis
Stage IIIB:
thickness is ranging from less
Surgery
Lymph node dissection,
Adjuvant therapy (radiation
therapy) with interferon
after surgery
Injections with Bacille
Calmette-Guerin (BCG)
vaccine or interleukin-2
directly into the melanoma
or

21
that 1 mm to more than 4 mm
with or without ulceration
Macrometastasis into 1 – 2
nearby lymph nodes
No distant metastasis
Stage IIIC:
thickness is ranging from less
that 1 mm to more than 4 mm
with or without ulceration
Macrometastasis into 1 – 2
nearby lymph nodes
Metastasis in 4 or more lymph
nodes and present of matted
lymph nodes
No distant metastasis
Topical immunotherapy
imiquimod
Chemotherapy,
immunotherapy with
cytokines, or both combined
(biochemotherapy).
Stage IV Melanoma has metastasized into
other organs such as the liver, lungs
and brain.
High levels of LDH
Surgery
Immunotherapy drugs
(Ipilimumab, interferon or
interleukin-2), and
Chemotherapy drugs
(Dacarbazine,
temozolomide)
Radiation therapy
There are four standard treatments for melanoma; surgery, chemotherapy,
immunotherapy and radiation therapy (Table 1.1). Surgery is the usual recommended
treatment of choice for malignant melanomas (Lemon & Burns, 1998). If melanomas
are detected at an early stage, surgical excision itself is sufficient with lower chances of
reoccurrence (Garbe et al., 2008). Patients with intermediate thickness of melanomas
(0.76-4.00 mm) who received wide excision and elective lymph node dissection
(ELND) usually have a significantly higher survival rate than those who received wide
excision alone (Krag et al., 1995; Balch et al., 1996; Agnese et al., 2003). ELND is the
removal of all lymph nodes from the area surrounding the primary melanoma (Balch et
al., 1996).
22
Chemotherapeutic agents have been widely used in the treatment of different
types of cancer including malignant melanoma. Chemotherapeutic agents that have
shown anticancer activities against malignant melanoma include dacarbazine, cisplatin,
carboplatin, temozolomide, vinca alkaloids, platinum compounds, nitrosoureas and
taxanes (Cocconi et al., 1992; Grossman & Altieri, 2001; Mouawad et al., 2010). The
first anticancer agent for malignant melanoma treatment approved by FDA was
dacarbazine with the highest response rate compared to other drugs (Cocconi et al.,
1992). Polytherapy or combination therapy has been evaluated to improve the efficiency
of chemotherapeutic agents (Sosman, 2012). The most widely used combinations
including (i) cisplatin, vinblastine and dacarbazine; (ii) cisplatin, dacarbazine,
carmustine and tamoxifen; (iii) bleomycin, vincristine, carmustine and dacarbazine; and
(iv) carmustine, hydroxyurea and dacarbazine (Cocconi et al., 1992; Jilaveanu et al.,
2009; Mouawad et al., 2010).
Immunotherapy is a form of treatment that directly or indirectly, uses the host
immune responses to fight cancer cells in patients (National Cancer Institute, 2012).
Interferon alpha (IFN-α) has shown moderate activity against stage IV melanoma with
10% to 22% overall response rates (Chowdhury et al., 1999; Jilaveanu et al., 2009). In
addition, IFN-α also possesses immunomodulatory effects to enhance the functions of
natural killer cells, macrophages and T-lymphocyte functions as well as inhibit
angiogenesis (Chowdhury et al., 1999; Mouawad et al., 2010). Another
immunotherapeutic agent is interleukin-2 (IL-2), and has been approved by the FDA for
therapy of patients with advanced stage melanoma. It acts through a variety of
mechanisms including activation of cytotoxic T-cells and natural killer cells as well as
production of other cytokines (Enk et al., 1998; Chowdhury et al., 1999; Atkins et al.,
2000). However, the application of these immunotherapeutic agents is limited due to
their high toxicity. Therefore, these biological agents have been used in smaller doses in

23
combination with chemotherapy (biochemotherapy) to increase efficacy and to reduce
toxicity (Yee et al., 2000; Jilaveanu et al., 2009).
1.2 Hallmarks of Cancer
The hallmarks of cancer is comprised of at least eight biological capabilities
acquired during the multistep development of human tumours (Hanahan & Weinberg,
2011). Each of these hallmarks is derived upon changes in the normal cell’s physiology
and interacts with each other to promote malignant growth. The hallmarks constitute an
organizing principle for rationalizing the complexities of neoplastic disease. This
includes sustaining proliferative signalling, evading growth suppressors, resisting cell
death, enabling replicative immortality, inducing angiogenesis and metastasis,
reprogramming of energy metabolism and evading immune destruction.
1.2.1 Sustaining Proliferative Signalling
Normal cells are carefully monitored for the production and release of growth-
promoting signals to ensure a balance or homeostasis between cell numbers and cell
death. Generally, growth factors such as epidermal growth factor (EGF), transforming
growth factor (TGF) and tumour necrosis factor alpha (TNF-α), binds to specific
receptors on the surface of their target cells, typically containing intracellular tyrosine
kinases. This engagement transmits signals via branched intracellular signalling
pathways to regulate progression of cell cycle as well as cell growth (Aaronson, 1991).
The conversion of a normal cell to a transformed cell usually starts from mutations in
DNA, which causes the cells to no longer depend on growth signals, thus promoting
uncontrolled growth and proliferation. (Hanahan & Weinberg, 2011).
There are several alternatives by which cancer cells acquire the ability to sustain
proliferative signalling: (1) autocrine proliferative stimulation where cancer cells

24
produce their own growth factors to which they respond in autocrine manner via
expression of cognate receptors (Lippman et al., 1986; Iihara et al., 2006), (2) paracrine
proliferative stimulation where cancer cells may send signals to stimulate normal cells
in its vicinity to produce various growth factors required for cancer cells (Bhowmick et
al., 2004; Cheng et al., 2008), (3) increases the number of cell surface receptor at the
cancer cell to hyperrespond to growth factors, or (4) structural alteration in the surface
receptors of cancer cells to mediate ligand-independent response (Hanahan &
Weinberg, 2011).
There are various cellular signalling pathways in a cell that are interconnected to
form complex networks (Hanahan & Weinberg, 2011). A cell will integrate all
information from each signal to regulate diverse functions, such as protein synthesis and
cell growth, motility, differentiation, and cell death. The ability of intracellular
signalling networks to integrate and distribute regulatory information requires a
signalling molecule to respond to multiple inputs and output signals. However, the same
signalling molecules will control different processes within different signalling
complexes or at different intracellular locations. In addition, in different cell types, the
activation of a signalling molecule may also have distinct consequences (Martin, 2003;
Bazigou & Rallis, 2007).
During tumour progression, cancer cells acquire a number of alterations at both
the cellular and genetic levels. All cancer cells derive an advantage by either
dysregulating, upregulating, or deregulating signalling pathways that confer these cells
the capacities to grow independently of growth and anti-growth signals, metastasis,
initiate an angiogenetic response, and evade from apoptosis (Bazigou & Rallis, 2007).

25
1.2.1.1 Mitogen Activated Protein Kinase (MAPK) Signalling
Mitogen-activated protein kinase (MAPK) pathway contains conserved kinases
that transmit extracellular signals to the host cell machinery that controls important
cellular processes such as growth, proliferation, differentiation, migration and apoptosis.
Three-tier kinases have been well characterized and widely studied in mammalian cells;
a MAPK kinase kinase (MAPKKK), a MAPK kinase (MAPKK) and a MAPK (Johnson
and Lapadat, 2002). In addition, at least six members of the MAPK family have been
discovered; extracellular signal-regulated kinase: ERK1/2, ERK3/4, ERK5, ERK7/8,
Jun N-terminal kinase/stress activated protein kinases (JNK1/2/3; also called SAPKs)
with many splice variants (Fang & Richardson, 2005; Wagner & Nebreda, 2009;
Rodríguez-Berriguete et al., 2011) and the p38 kinases (p38 α/ß/γ/δ) (Olson &
Hallahan, 2004; Wagner & Nebreda, 2009) In general, MAPK/ERK pathway is
activated by binding of a growth factor to cell surface receptors, whereas the
MAPK/JNK and p38 pathways are activated by stress, inflammatory cytokines and
growth factors. Aberrant regulation of MAPK signalling contributes to development and
progression of cancer including cancer cell proliferation, survival, migration and
invasion (Fecher et al., 2008).
The MAPK/ERK pathway is well-studied as its dysregulation can be found in
approximately one-third of all human cancers (Figure 1.8). The biological consequences
of active ERK pathway including the enhancement of cancer cells’ proliferation,
differentiation, angiogenesis, motility and invasiveness. Upon activation by the binding
of growth factors such as TNF-α, the extracellular signal is transmitted to small GTP
binding proteins (Ras), which in turn activates the kinase cascades; starting from
MAPKKK (Raf) to MAPKK (MEK1/2), and lastly to MAPK (ERK). Cancer cells
usually will create an autocrine feedback loop in promotion of Ras-mediated
transformation and Raf-mediated gene expression changes. Therefore, an aberrant

26
activation of Ras and Raf proteins can be found in different types of human cancers
(breast, prostate, lung, colon cancers, etc) (Hilger et al., 2002; Gollob et al., 2006;
Roberts & Der, 2007).
Figure 1.8: Oncogene activation of the MAPK/ERK cascade (Roberts & Der, 2007).

27
The JNK family of MAP kinases is mainly activated in response to diverse
stimuli including inflammatory cytokines, ultraviolet (UV) and gamma radiation,
growth factor deprivation, DNA-damaging (cytotoxic) agents, and certain G-protein
coupled receptors (Figure 1.9) (Weston & Davis, 2002; Hui et al., 2007). There are
three JNK isoforms – JNK1, JNK2 and JNK3. JNK1 and JNK2 are ubiquitously
expressed in all types of cells, whereas JNK3 expression is only localized in brain, heart
and testis. JNK activation requires dual phosphorylation on tyrosine and threonine
residues by MEK4 and MEK7. Both MEK4 and MEK7 are activated by several
MAPKKKs, including MEKK1–4, MLL2 and 3, YTpl-2, DLK, TAO1 and 2, TAK1
and ASK1 and 2. Once activated, JNK will be translocating from the cytoplasm into the
nucleus where it regulates transcription factors including AP-1, Elk-1, c-myc, p53, as
well as anti-apoptotic proteins such as Bcl-2 and 14-3-3 (Heasley & Han, 2006; Bode &
Dong, 2007; Turjanski et al., 2007). The JNK also plays a part in the regulation of p53
transcriptional activity and stability (Buschmann et al., 2000; She et al., 2002b; Wu,
2004).
Several studies showed an aberrant activation of JNK activity in various types of
cancers including prostate, breast, pancreas and lung (Lin, 2002; Xu et al., 2006;
Wagner & Nebreda, 2009). The main aim of JNK signalling is the formation a complex
known as activating protein-1 (AP-1) via combination of c-Jun and c-Fos proteins. This
transcription factor controls cellular physiology including cell proliferation, apoptosis,
differentiation and developmental processes. (Eferl & Wagner, 2003; Kennedy et al.,
2003). Several studies have shown that the deficiency of c-Jun protein in fibroblasts
could inhibite transformation of normal cells to cancer cells (Dérijard et al., 1994;
Johnson et al., 1996; She et al., 2002a), highlighting the importance of JNK signalling
pathway in the regulation of proliferation in tumourigenesis (Schreiber et al., 1999;
Eferl & Wagner, 2003). In addition, JNK has also been shown to promote cancer

28
metastasis by activating matrix metalloproteinases, MMP-2 and -9 (Hong et al., 2005;
Liang et al., 2007). Therefore, aberrant activation of JNK/c-Jun/AP-1 is implicated in
tumour development (Eferl & Wagner, 2003; Kennedy et al., 2003).
In mammals, p38 isoforms are strongly activated by physical and chemical
stress signals, oxidative stress, hypoxia, inflammatory cytokines, heat and osmotic
shock (Figure 1.9). The four isoforms of p38, namely p38 α, β and γ and δ are
characterized by the presence of the conserved Thr-Gly-Tyr (TGY) phosphorylation
motifs in their activation loop with some differences in their functions (Kumar et al.,
2003). The expression of p38 α and p38 β are ubiquitous in all cells, whereas, p38γ and
p38δ are confined in certain tissues such as muscle, testis, lung and kidney. These
conserved motif is a target of phosphorylation by MEK3 and MEK6. However, in some
cases, p38 can also be activated by MEK4, an activator kinase of JNK. Once activated,
cytoplasmic p38 proteins will translocate into the nucleus where they regulate several
genes including NFκB, Elk-1, p53 and Max, that are involved in apoptosis, cell cycle
progression, growth and differentiation (Dhillon et al., 2007).
Several studies have established that p38 plays an important role in the
progression of leukemia, lymphoma, breast, prostate, gastric and lung cancers (Park et
al., 2003; Uzgare et al., 2003; Olson & Hallahan, 2004; Hui et al., 2007). The
expression of upstream kinases (PAK1, MEK6, and MEK4) and p38 are found in
prostate cancer cells (Park et al., 2003; Uzgare et al., 2003; Xu et al., 2006). Besides,
p38 plays a vital role in a hypoxic environment that increases survival, clonogenecity,
migration and invasiveness of prostate cancer cells by increasing expression of matrix
metalloproteinases (Uzgare et al., 2003; Khandrika et al., 2009; Kwon et al., 2009).
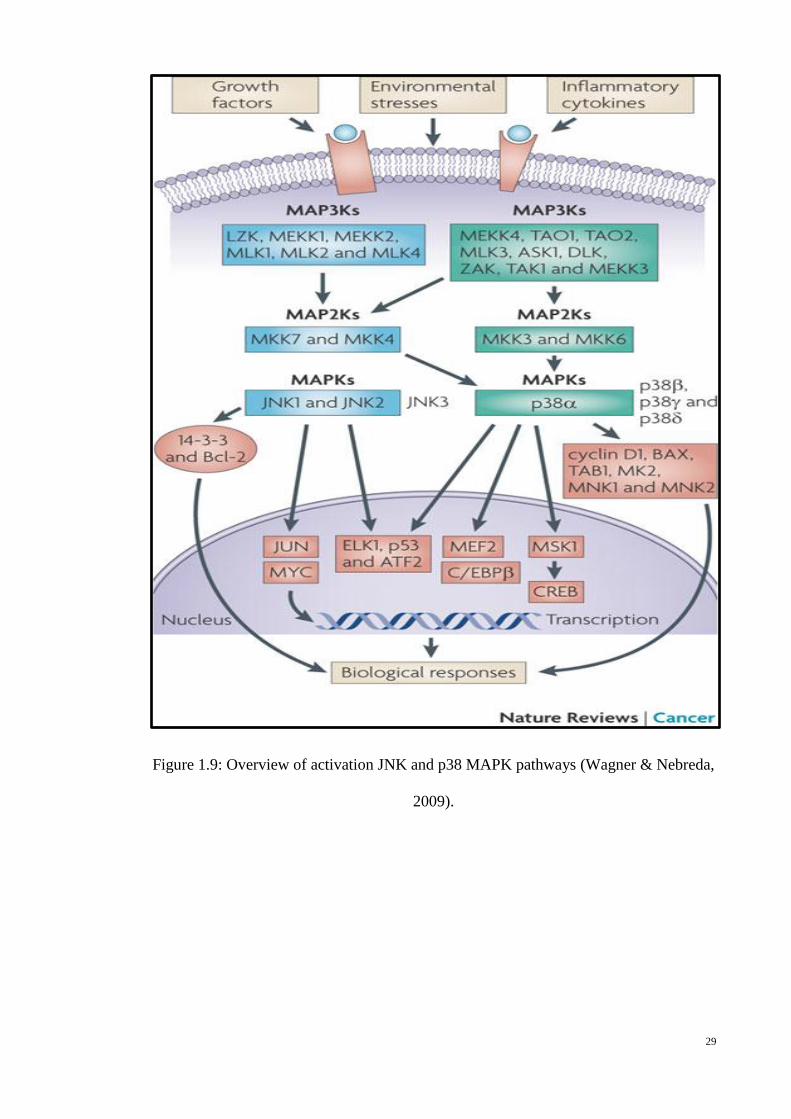
29
Figure 1.9: Overview of activation JNK and p38 MAPK pathways (Wagner & Nebreda,
2009).
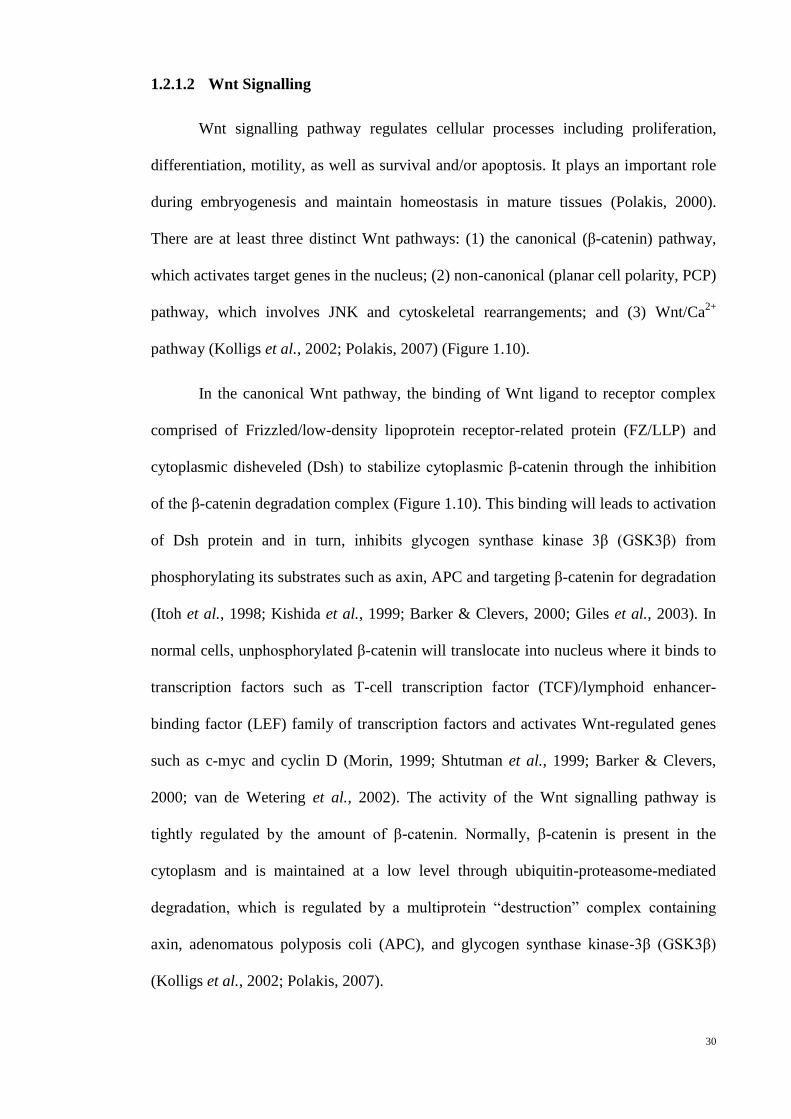
30
1.2.1.2 Wnt Signalling
Wnt signalling pathway regulates cellular processes including proliferation,
differentiation, motility, as well as survival and/or apoptosis. It plays an important role
during embryogenesis and maintain homeostasis in mature tissues (Polakis, 2000).
There are at least three distinct Wnt pathways: (1) the canonical (β-catenin) pathway,
which activates target genes in the nucleus; (2) non-canonical (planar cell polarity, PCP)
pathway, which involves JNK and cytoskeletal rearrangements; and (3) Wnt/Ca2+
pathway (Kolligs et al., 2002; Polakis, 2007) (Figure 1.10).
In the canonical Wnt pathway, the binding of Wnt ligand to receptor complex
comprised of Frizzled/low-density lipoprotein receptor-related protein (FZ/LLP) and
cytoplasmic disheveled (Dsh) to stabilize cytoplasmic β-catenin through the inhibition
of the β-catenin degradation complex (Figure 1.10). This binding will leads to activation
of Dsh protein and in turn, inhibits glycogen synthase kinase 3β (GSK3β) from
phosphorylating its substrates such as axin, APC and targeting β-catenin for degradation
(Itoh et al., 1998; Kishida et al., 1999; Barker & Clevers, 2000; Giles et al., 2003). In
normal cells, unphosphorylated β-catenin will translocate into nucleus where it binds to
transcription factors such as T-cell transcription factor (TCF)/lymphoid enhancer-
binding factor (LEF) family of transcription factors and activates Wnt-regulated genes
such as c-myc and cyclin D (Morin, 1999; Shtutman et al., 1999; Barker & Clevers,
2000; van de Wetering et al., 2002). The activity of the Wnt signalling pathway is
tightly regulated by the amount of β-catenin. Normally, β-catenin is present in the
cytoplasm and is maintained at a low level through ubiquitin-proteasome-mediated
degradation, which is regulated by a multiprotein “destruction” complex containing
axin, adenomatous polyposis coli (APC), and glycogen synthase kinase-3β (GSK3β)
(Kolligs et al., 2002; Polakis, 2007).

31
In the non-canonical (Planar cell polarity, PCP) pathway, this pathway will leads
to the activation of the small GTPases RHOA (RAS homologue gene-family member
A) and RAC1, allowing the activation of JNK and ROCK (RHO-associated, coiled-coil-
containing protein kinase 1). This will cause changes in cell adhesion and motility, and
allows remodelling of the cytoskeleton. The Wnt/Ca2+
pathway, meanwhile, is mediated
by G proteins and phospholipases (PLC) and leads to a brief increase in free calcium in
cytoplasm and subsequently activates the PKC (protein kinase C), CAMKII (calcium
calmodulin mediated kinase II) and phosphatase calcineurin. The activation of cell
division control protein 42 (Cdc42) PKC allows cell adhesion, migration, and tissue
separation (Polakis, 2000; Moon et al., 2004; Katoh, 2005).
Mutations in APC and Axin have been found in some tumours lead to the
dysregulation of this pathway in human cancers (Polakis, 2000; Moon et al., 2004;
Polakis, 2007). In addition, alteration of Wnt5a, a tumour suppressor gene, could also
lead to tumour formation, amplification or overexpression of positive regulators of
components of this pathway are observed in several type of cancers (Nagahata et al.,
2003; Okino et al., 2003). Besides that, Frizzled-related protein 1 (FRP1/ FRZB), a
secreted Wnt inhibitor is frequently absent in human cancers (Ugolini et al., 1999).
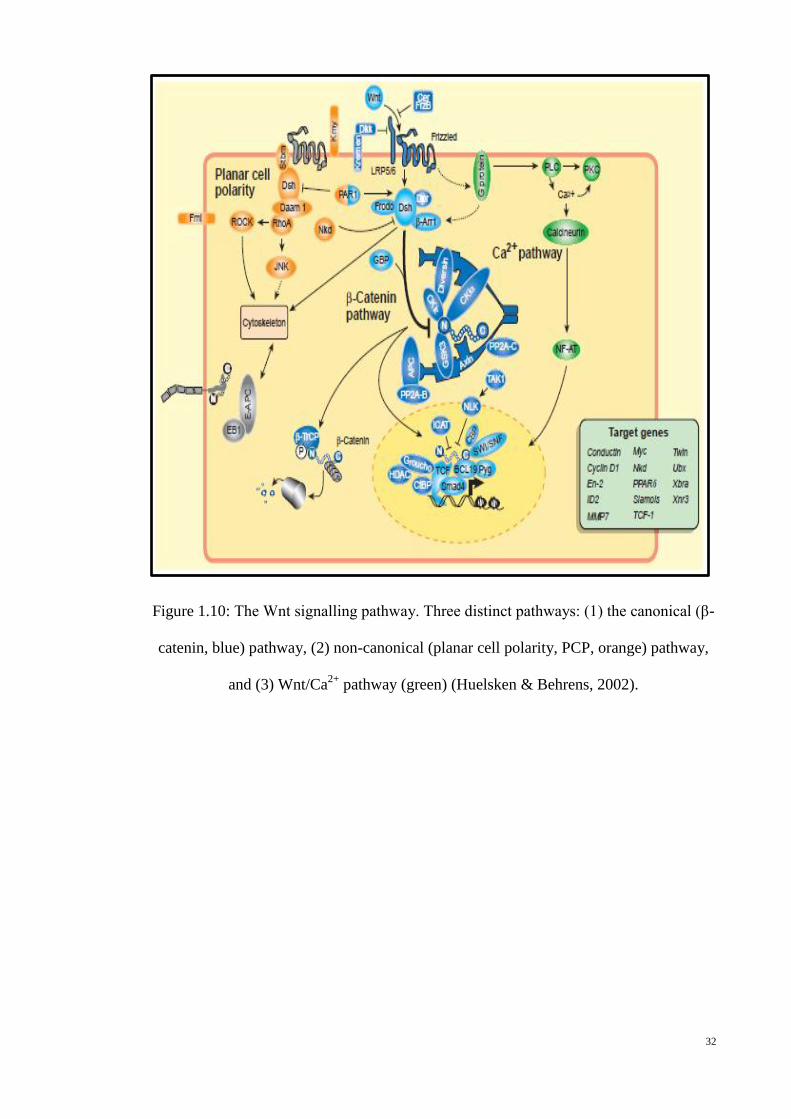
32
Figure 1.10: The Wnt signalling pathway. Three distinct pathways: (1) the canonical (β-
catenin, blue) pathway, (2) non-canonical (planar cell polarity, PCP, orange) pathway,
and (3) Wnt/Ca2+
pathway (green) (Huelsken & Behrens, 2002).
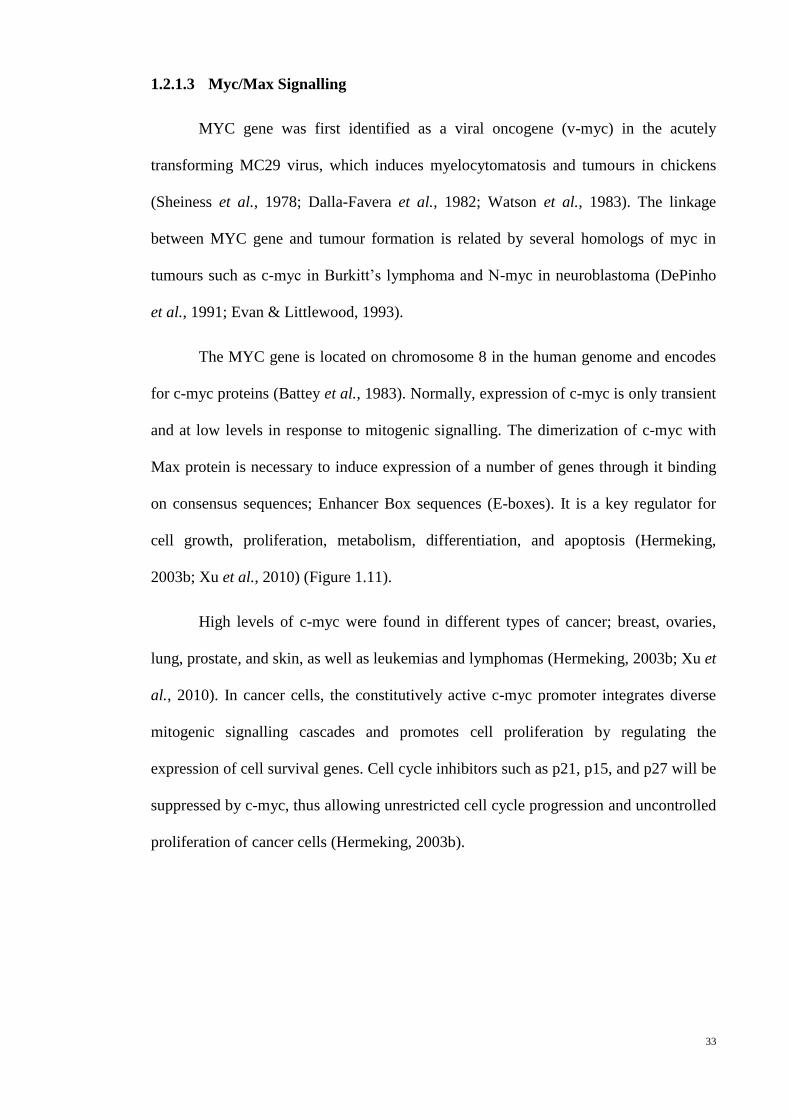
33
1.2.1.3 Myc/Max Signalling
MYC gene was first identified as a viral oncogene (v-myc) in the acutely
transforming MC29 virus, which induces myelocytomatosis and tumours in chickens
(Sheiness et al., 1978; Dalla-Favera et al., 1982; Watson et al., 1983). The linkage
between MYC gene and tumour formation is related by several homologs of myc in
tumours such as c-myc in Burkitt’s lymphoma and N-myc in neuroblastoma (DePinho
et al., 1991; Evan & Littlewood, 1993).
The MYC gene is located on chromosome 8 in the human genome and encodes
for c-myc proteins (Battey et al., 1983). Normally, expression of c-myc is only transient
and at low levels in response to mitogenic signalling. The dimerization of c-myc with
Max protein is necessary to induce expression of a number of genes through it binding
on consensus sequences; Enhancer Box sequences (E-boxes). It is a key regulator for
cell growth, proliferation, metabolism, differentiation, and apoptosis (Hermeking,
2003b; Xu et al., 2010) (Figure 1.11).
High levels of c-myc were found in different types of cancer; breast, ovaries,
lung, prostate, and skin, as well as leukemias and lymphomas (Hermeking, 2003b; Xu et
al., 2010). In cancer cells, the constitutively active c-myc promoter integrates diverse
mitogenic signalling cascades and promotes cell proliferation by regulating the
expression of cell survival genes. Cell cycle inhibitors such as p21, p15, and p27 will be
suppressed by c-myc, thus allowing unrestricted cell cycle progression and uncontrolled
proliferation of cancer cells (Hermeking, 2003b).

34
Figure 1.11: Impact on the epigenetic program of cells with Myc/Max. Adapted from
(Felsher, 2003).

35
1.2.1.4 Nuclear Factor Kappa Beta (NFκB)
The nuclear factor kappa B (NFκB) is a family of transcription factors involved
in the regulation of immune responses and inflammation. Incorrect regulation of NFκB
has been linked to a number of disease including septic shock, viral infection
inflammatory and autoimmune diseases as well as cancer (Migliazza et al., 1994;
Mukhopadhyay et al., 1995; Caamaño et al., 1996; Shukla et al., 2004; Dolcet et al.,
2005; Prusty et al., 2005; Bindhu et al., 2006).
NFκB is not a single gene but a family of closely related transcription factors,
p50 (NFκB1), p52 (NFκB2), RelA (p65), c-Rel and RelB (Karin & Lin, 2002;
Moynagh, 2005). These five transcription factors shared a domain in their sequence,
known as Rel Homology Domain (RHD). This domain allows (1) dimerization to occur
(homodimers and/or heterodimers), (2) interacttion with their specific inhibitors, IκBs
and (3) mediation of DNA binding. Only RelA (p65), c-Rel and RelB contains C-
terminal transcriptional activation domains (TADs) to regulate their target genes. Both
p50 and p52 can participate in their target gene regulations by forming heterodimers
with RelA, c-Rel, or RelB. In addition, p50 and p52 homodimers form a complex with
nuclear protein Bcl-3 to act as a transcriptional activator (Moynagh, 2005).
In normal cells, cytoplasmic NFκB dimer interacts with inhibitors of NFκB
(IκBs) and therefore remains in an inactive state in the cytoplasm. There are four
members of IκB; IκBα, IκBβ, IκBɛ and Bcl-3. These IκB members contain two
conserved serines that become targets of phosphorylation by the IκB kinases (IKK). The
IKK complex contains highly homologous kinase subunits, catalytic subunits (IKKα
and IKKβ) and the regulatory subunit (IKKγ or NEMO). Upon phosphorylation, IkB
members dissociate from NFκB and undergo proteasome-dependent degradation (Karin
& Lin, 2002; Moynagh, 2005).

36
There are two signalling pathways in NFκB; the canonical pathway (or classical
pathway) and the non-canonical pathway (or alternative pathway) (Figure 1.12) (Karin
& Lin, 2002; Moynagh, 2005; Gilmore, 2006). In the canonical signalling pathway,
ligand-receptor interactions (such as TRAF) will recruit and activate the IkB kinase
(IKK) complex. Activation of IKK complex will mediate phosphorylation-induced
proteasomal degradation of the IkB inhibitor. This subsequently allows the active NFκB
transcription factor subunits to translocate into the nucleus and regulate their target
genes. The canonical pathway activates NFκB dimers comprised of RelA, c-Rel, RelB
and p50 (Gilmore, 2006; Hayden & Ghosh, 2008).
The non-canonical pathway involves the activation of p100/RelB complexes.
The IKK complex in this pathway is only comprised of two catalytic IKKα subunits, but
not NEMO. Upon receptor binding, NFκB-inducing kinase (NIK) will be activated and
phosphorylated to activate the IKK complex. In turn, this complex phosphorylates p100
or p105 resulting in p52/RelB or p50/RelA active heterodimer, respectively, (Moynagh,
2005; Hayden & Ghosh, 2008), then is tranlocated into the nucleus to regulate target
genes.
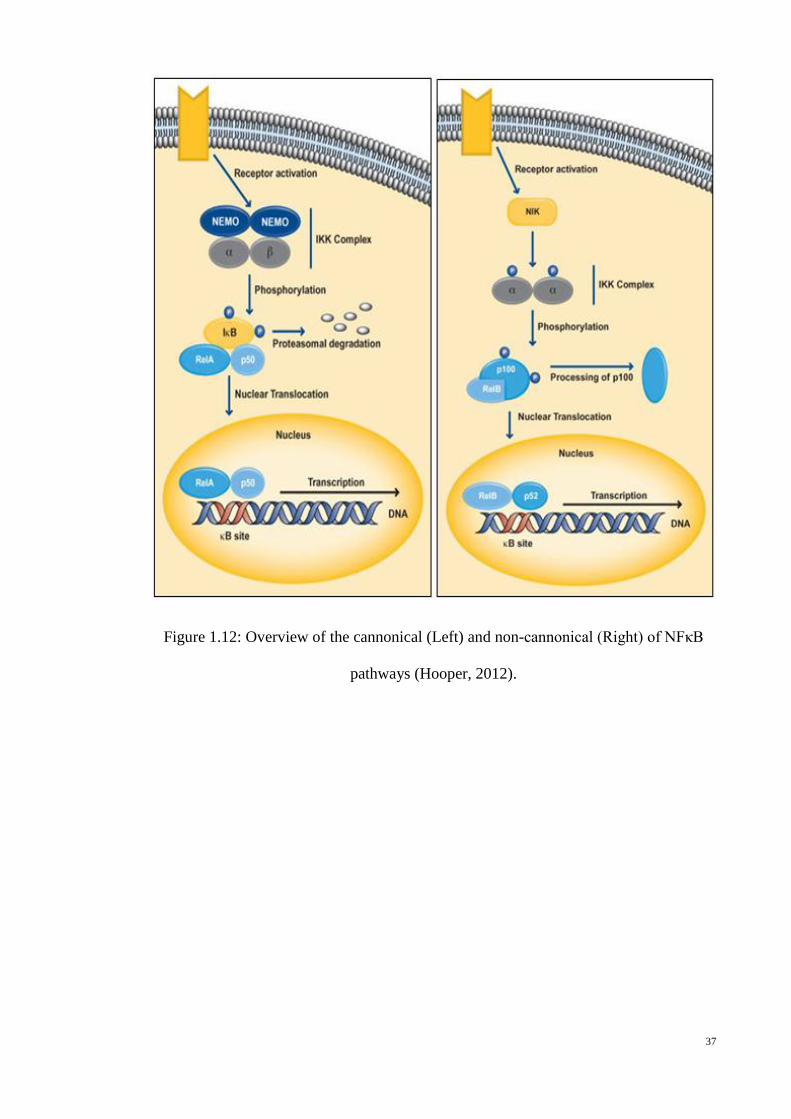
37
Figure 1.12: Overview of the cannonical (Left) and non-cannonical (Right) of NFκB
pathways (Hooper, 2012).
38
1.2.2 Evading Growth Suppressors
Cancer cells negatively regulate cell proliferation by inhibition of tumour
suppressor genes. There are a number of tumour suppressors in a cell and their main
function is to protect cells from transforming to cancer cells. One of the well-studied
tumour suppressor proteins is p53 that governs both cell proliferation and activate
apoptotic programs (Hanahan & Weinberg, 2011).
A TP53 gene is a tumour suppressor gene located on chromosome 17 and
encodes p53 protein. The p53 protein is a transcription factor that interacts with a large
number of proteins and plays an important role in regulating cell cycle, growth,
proliferation, and apoptosis (Vogelstein et al., 2000). Upon DNA damage, p53 protein
will bind to DNA, to induce production of p21 protein which is a potent cyclin-
dependent kinase inhibitor (CKI). The p21 protein inhibits cell cycle progression by
inhibiting the activity of cyclin-CDK2 or -CDK1 complexes until damaged DNA is
repaired. If the extent of DNA damage exceeds the capacity of the repair mechanism,
the cell will be destroyed via apoptosis. However, deregulation of p53 proteins in
cancers causes p53 to no longer bind to DNA in an effective way, and as a consequence
the p21 protein is not available to act as the 'stop signal' for cell division. Therefore,
cells divide uncontrollably, and form tumours. Loss of p53 in many cancers leads to
genome instability, impaired cell cycle regulation, and inhibition of apoptosis (Nikolova
et al., 2000; Joerger & Fersht, 2007; Song et al., 2007).
This tumour suppressor protein is also activated in response to oncogene
activation, hypoxia and DNA damage, leading to growth arrest and/or apoptosis by
stimulating the expression of various p53 target genes including p21, Bax, Puma, Noxa,
Apaf-1, Fas and DR5 (Vousden & Lu, 2002) or by repressing the expression of anti-
apoptotic proteins such as Bcl-2 and Bcl-XL (Xu et al., 2001; Hoffman et al., 2002).

39
Besides involvement at the nuclear level, p53 can also translocate into mitochondria
where it interacts with Bcl-XL, resulting in permeability transition and release of
cytochrome c (Findley et al., 1997; Mihara et al., 2003).
Mouse double minute 2 (Mdm2) (HDM2 in humans, henceforth as Mdm2)
oncoprotein is a negative regulator of p53 (Figure 1.13). Mdm2 is a transcription target
of p53, thus producing an auto regulatory feedback loop (Picksley & Lane, 1993;
Vogelstein et al., 2000; Lahav et al., 2004). Mdm2 will promote the ubiquitination and
rapid degradation of p53 to keep p53 at a low level. Mdm2 activity is positively
regulated by serine/threonine kinase (Akt) which is activated in response to survival
signals from growth factor receptors (Gottlieb et al., 2002). Akt will promote Mdm2-
mediated suppression of p53 by suppressing the action of the adenosine diphosphate-
ribosylation factor (ARF), a tumour suppressor gene. ARF expression is dependent on
the activity of adenovirus E2 gene promoter region binding factor 1 (E2F-1) and by the
action of oncogenes such as c-myc, Ras and β-catenin (Henriksson et al., 2001).
Increased ARF activity leads to activation of p53 and induction of apoptosis. Aberrant
accumulations of proto-oncogenes such as β-catenin, Ras, Myc and E1a have been
documented in melanoma, breast, colorectal and prostate cancers (Sherr & Weber,
2000).

40
Figure 1.13: The p53-Mdm2 interactions. Arrows indicate positive inputs; horizontal
bars indicate inhibitory inputs (Oren et al., 2002).

41
1.2.3 Resisting Cell Death
Inhibition of apoptotic cell death in cancer cells allows the cells to expand their
number during carcinogenesis. Apoptosis is known as one of the most important types
of cell death in response to cytotoxic treatment. The administration of anticancer drugs
from natural products has shown to be capable of inducing apoptotic death of cancer
cells (HemaIswarya & Doble, 2006). This offers new opportunities in identifying new
targets for therapeutic intervention and pharmacological manipulation in cancer
research.
1.2.3.1 Bcl-2 family
The Bcl-2 (B-cell lymphoma 2) family consists of regulatory proteins that
tightly regulates apoptosis including pro-apoptotic (Bax and Bak), and anti-apoptotic
proteins (Bcl-xL, Bcl-w, Mcl-1, A1) (Reed, 1998; Korsmeyer, 1999). When anti-
apoptotic proteins, Bax and Bak are activated, the integrity of the outer mitochondrial
membrane is changed, causing the release of cytochrome c. The released cytochrome c
activates a cascade of caspases that act via their proteolytic activities to induce the
multiple cellular changes associated with the apoptotic program (Chao & Korsmeyer,
1998; Gross et al., 1999; Korsmeyer, 1999).
1.2.3.2 Caspases
Caspases (cysteinyl, aspartate-specific protease) are a family of cysteine
proteases that plays an important role in cell death. Caspases are present as inactive pro-
forms or zymogens within a cell. There are two types of caspases: initiator caspases
(caspase-2,-8,-9,-10) and effector caspases (caspase-3,-6,-7). Caspases are activated
either by the mitochondrion-mediated (intrinsic) pathway or death receptor-mediated
(extrinsic) pathway (Cohen, 1997; Stennicke & Salvesen, 2000). The activated initiator
caspases will activate the effector caspases in a cascade by cleaving their inactive pro-
42
forms. In turn, the effector caspases will cleave other important cellular protein within
the cell that lead to the morphological and biochemical features associated to apoptosis
(Cohen, 1997; Earnshaw et al., 1999). One of the downstream substrates of caspases is
caspase-activated deoxyribonuclease (CAD), which induce DNA fragmentation in
apoptotic cells. In normal conditions, CAD will bind to its inhibitor (ICAD) to form a
complex in the nucleus. During apoptosis, activated caspase-3 will dissociate CAD from
the complex and DNA fragmentation to take place. In addition, caspases target
structural proteins such as lamin A, actin, Gas2 and fodrin, to produce apoptosis
morphological characteristics including membrane blebbing, cell shrinkage, chromatin
condensation and apoptotic body formation (Fan et al., 2005; Herrera-Esparza et al.,
2011).
1.2.3.3 Apoptosis
Apoptosis or programmed cell death plays an important role in physiological
growth and tissue homeostasis. In anticancer research, apoptotic cell death is a crucial
strategy to kill tumour cells via activation of apoptosis signal transduction pathways:
intrinsic and/or extrinsic pathways (Bold et al., 1997; Fulda & Debatin, 2006).
The intrinsic pathway occurs in response to cellular signals resulting from DNA
damage, a defective cell cycle, hypoxia, loss of cell survival factors, or other types of
severe cell stress as well as chemotherapeutic drugs (Figure 1.14) (Kaufmann &
Earnshaw, 2000; Johnstone et al., 2002). Upon cellular stress, the equilibrium of
activity between pro- and anti-apoptotic members of the Bcl-2 superfamily of proteins
in a cell will be disrupted. In turn, these pro-apoptotic proteins will be activated and
induce the opening of mitochondrion permeability transition pores (MPTPs).
Cytochrome c will be released into the cytosol and it will bind to the adapter apoptotic
protease activating factor-1 (Apaf-1). The recruitment of cytochrome c, Apaf-1, pro-

43
caspase 9, dATP (deoxyadenosine triphosphate) or ATP will form a multi-protein
complex, known as apoptosome (Tsujimoto, 2001; Adams & Cory, 2002; Marsden et
al., 2002). Apoptosome aids the cleavage of procaspase-9 to form active caspase-9, and
later activates caspase-3 and -7, ultimately resulting in cell death (Figure 1.14A).
The extrinsic pathway begins outside the cell through the activation of specific
pro-apoptotic receptors on the cell surface, known as the death receptor such as Fas or
TNFR-1 (Tumour Necrosis Factor receptor-1) (Figure 1.14). These death receptors are
activated by specific molecules known as pro-apoptotic ligands. These ligands include
Apo2L/TRAIL and CD95L/FasL which will bind to their cognate receptors DR4/DR5
and CD95/Fas, respectively (Fulda & Debatin, 2006). This binding induces receptor
clustering and recruitment of the adaptor protein Fas-associated death domain (FADD)
and procaspase-8, forming a death-inducing signalling complex (DISC). Formation of
the DISC will cause an autocatalytic processing in procaspase-8 to form active caspase-
8. Alternatively, caspase-8 will activate effector caspase-3, -6, and -7, thereby
converging on the intrinsic pathway (Fulda & Debatin, 2006; Liu et al., 2006a). In
addition, caspase-8 triggers mitochondrion-mediated pathway by cleaving Bid (a pro-
apoptotic Bcl-2 family member) into its active form, truncated Bid (tBid), which
translocates into mitochondria. The combination of tBid with other proapoptotic Bcl-2
family members, Bax and Bak, will induce the release of cytochrome c and apoptosis-
inducing factor (AIF) into cytosol. AIF will induce DNA fragmentation and chromatin
condensation (Figure 1.14B) (Fan et al., 2005; Fulda & Debatin, 2006).

44
Figure 1.14: Schematic diagram illustrating (A) intrinsic and (B) extrinsic pathways of apoptosis (Fan et al., 2005).

45
1.2.3.4 Necrosis
Necrosis is another type of cell death in multicellular organisms and is derived from
the Greek “nekros” for corpse. It is a passive form of cell deaths. Necrosis also plays a role
in some physiological processes such as inner ear development (Zong & Thompson, 2006),
tissue renewal of small and large intestines (Barkla & Gibson, 1999; Murdoch et al., 1999),
follicular maturation during oogenesis and loss of interdigital cells in the mouse embryo
(Chautan et al., 1999; Murdoch et al., 1999).
It can be initiated by external factors (viruses, bacteria, protozoa, toxins) and
internal factors such as complements, activated natural killers and peritoneal macrophages
(Bortner et al., 1997; Dong et al., 1997; Blom et al., 1999; Arantes et al., 2000; Shimizu et
al., 2000; Warny et al., 2000). In addition, inadequate levels of cytokines, nitric oxide (NO)
and reactive oxygen species (ROS) secretion in some pathological conditions also causes
necrotic cells death (Proskuryakov et al., 2003).
Although apoptosis and necrosis have been defined based on their distinguishable
morphological criteria, however, they may involve several common signalling and
execution mechanisms (Leist et al., 1999b). The caspase-independent cell death is likely to
resemble necrosis as it lacks the typical features of apoptosis (Table 1.2) (Holler et al.,
2000; Leist & Jaattela, 2001; Fan et al., 2005). Adenosine triphosphate (ATP) levels also
play critical decisive regulatory roles between apoptosis and necrosis. If the amount of ATP
is below a certain critical level, it can either switch apoptotic cell death to necrosis or
initiate necrosis by itself (Eguchi et al., 1997; Leist et al., 1999a; Proskuryakov et al.,
2003). In contrast to apoptosis that requires potassium (K+) and calsium (Ca
2+) ions efflux

46
to induce cell shrinkage, necrosis requires sodium ion (Na+) influx to induce cell swelling
(Table 1.2) (Bortner et al., 1997).
Table 1:2: Differential features of apoptosis and necrosis (Bold et al., 1997; Bortner et al.,
1997; Cohen, 1997)
Apoptosis Necrosis
Biochemical characteristic
Tightly regulated by physiological
homeostasis
Initiate by nonphysiological trama
Activation of caspase cascades
No caspases are require
Active process (ATP-dependent)
Passive process (no energy require)
Apoptotic DNA fragmentation
(demonstrates a "ladder" pattern at ~180bp
intervals on agarose gels)
Random DNA fragmentation (demonstrates
a smear pattern on agarose gels)
Morphological characteristic
Formation of membrane blebbing, but no
loss of integrity
Loss of membrane integrity
Formation of apoptotic bodies
Swelling of organelles and eventually cell
lysis
Lysosome still intact Lysosomal leakage
Physiological features
Death of individual cells Death of groups of cell
No inflammatory response Inflammatory response evoked
Phagocytosis by nearby cells and
macrophages
Phagocytosis by macrophages

47
1.2.4 Enabling Replicative Immortality
Cell cycle is a series of events controlled by complex signalling pathways
leading to cell DNA replication and division to form new cells. This process possesses
checkpoints to ensure fidelity or errors (mutated DNA) are corrected, otherwise, the
cells will be initiated to undergo cell death. In cancer, due to genetic mutations, this
regulatory process can malfunction and cause uncontrolled cell proliferation (Hartwell
& Kastan, 1994; Evan & Vousden, 2001). Cell cycle can be divided into four distinct
phases: G1-, S-, G2- and M-phases (mitosis). M phase is composed of two tightly
coupled processes: mitosis and cytokinesis. Mitosis is where the cell's chromosomes are
divided into the two ‘daughter’ cells, while cytokinesis is where the cell's cytoplasm
divides in half to forms distinct cells (Hartwell & Kastan, 1994; Shapiro & Harper,
1999).
There are two key classes of regulatory molecules, cyclins and cyclin-dependent
kinases (CDKs) that determine a cell's progress through the cell cycle (Figure 1.15).
During the G1 phase, cyclin D will form a complex with CDKA; cyclin D/CDKA. This
complex will phosphorylate their negative regulator, the retinoblastoma protein (pRB),
to release E2F transcription factors. The free E2F will regulate genes needed for the G1
to S transition. To enter the S phase, cyclin D will be replaced by cyclin E to from
cyclin E/CDKA complex. During S phase, cyclin A will be produced and its binding
with CDKA is important for DNA synthesis. At the late S phase, cyclin B will be
synthesized and is likely to form a complex with CDKA. This complex will promote the
cell to enter G2 phase (Figure 1.15) (Hartwell & Kastan, 1994; Shapiro & Harper, 1999;
Evan & Vousden, 2001). CDKIs such as p21 and p27 also play essential roles in
controlling cell cycle progression by negatively regulating CDK activities (Toyoshima
& Hunter, 1994; Coqueret, 2003).

48
The relationship between cell cycle and cancer are obviously related, since the
cell cycle machinery controls cell proliferation while cancer is a disease of
inappropriate cell proliferation. Progression through the cell cycle is tightly regulated by
activity of cyclins, cyclin-dependent kinases (CDKs), cyclin-dependent kinase
inhibitors (CDKIs), growth factors (GFs), their receptors (GFRs), and inhibitory (GFR-
I) factors. Thus, disrupting these controlling factors might cause cell cycle arrest
(Waldman et al., 1997). Many of the anticancer agents from natural products and
chemotherapy agents exert their effects via interrupting cell cycle progression (Shapiro
& Harper, 1999).
Figure 1.15: Schematic representation of cell cycle regulation (Andrietta et al., 2001).

49
1.2.5 Invasion and Metastasis
About 90% of cancer-associated mortality is caused by cancer metastasis and
yet it still remains poorly understood in cancer pathogenesis (Hanahan & Weinberg,
2000; Gupta & Massagué, 2006). It is one of the most challenging complications in
cancer treatment. Metastasis is a complex and multistep process whereby cancer cells
spread throughout the body, forming secondary tumours at a distance from its origin
(primary tumour). Only small fractions from primary tumour are capable of metastasis.
Metastatic cascades start from; (a) detachment of cancer cells from the primary tumour
mass, (b) invasion to local tissue stroma, (c) penetration into nearby local lymphatic
and/or blood vessels, (d) survive within the circulation, (e) arrested in capillaries or
venules at other organs, (f) penetrate through corresponding parenchyma, (g) adapt to
the new local microenvironment, and (h) divide to form the new secondary tumour
(Figure 1.16) (Gupta & Massagué, 2006).
During metastasis, metastatic cancer cells must acquire five distinct functions
including interaction with the local microenvironment, migration, invasion, resistance to
apoptosis, and induction of angiogenesis (Figure 1.16) (Roy et al., 2009). The secretion
of matrix metalloproteinases is a critical component for metastatic tumour cell to
migrate to different tissues. Matrix metalloproteinases (MMPs) are zinc-dependent
endopeptidases that are capable of degrading and remodeling extracellular matrix
(ECM) process (Gialeli et al., 2011). MMPs have been divided into four distinct groups
based on their substrate specificity; collagenases, gelatinases, stromelysins and
matrilysins. The activity of MMPs is tightly regulated by its inhibitor, tissue inhibitors
of metalloproteinases (TIMPs). The balance between MMPs and TIMPs is largely
responsible for the remodeling of tissues associated with various physiological
processes such as embryonic development, angiogenesis, and tissue repair.

50
Dysregulation of this balance is implicated in various diseases including cancer
invasion and metastasis (Figure 1.16). Thus, MMP have been implicated in progression
and metastasis of different tumours (Bacac & Stamenkovic, 2008; Roy et al., 2009;
Gialeli et al., 2011).
Several members of MMP family have been implicated in the degradation of
ECM and associated with tumour growth and angiogenesis such as MMP-2 and MMP-
9. Tumour cells always overexpress of MMP enzymes in order to degrade the basement
membrane, invade a nearby lymphatic and/or blood vessel (intravasation) and
extravasate at a distant site and invading the surrounding tissue in order to form
secondary tumours. Besides ECM components, MMPs also can degrade other
molecules including growth factor precursor (e.g. VEGF, FGF) to induce angiogenesis.
Activation of growth factors and cleavage of adhesion molecules are believed to
attribute to MMP-induced EMT (Bacac & Stamenkovic, 2008; Roy et al., 2009).
Epithelial–mesenchymal transition or transformation (EMT) is a hallmark of cancer
progression to metastasis. It is the process that allows an epithelial cell to lose its
interaction with the basement membrane and possesses a mesenchymal cell phenotype,
which includes enhanced migratory ability, invasiveness, and resistance to apoptosis
(Yilmaz & Christofori, 2009; Singh & Settleman, 2010). In addition, degradation of E-
cadherin by MMPs could disrupt cell-cell interactions and integrins between tumour
cells and ECM which enhances the migration and invasion of tumour cells (Noë et al.,
2001; Bacac & Stamenkovic, 2008; Bourboulia & Stetler-Stevenson, 2010).
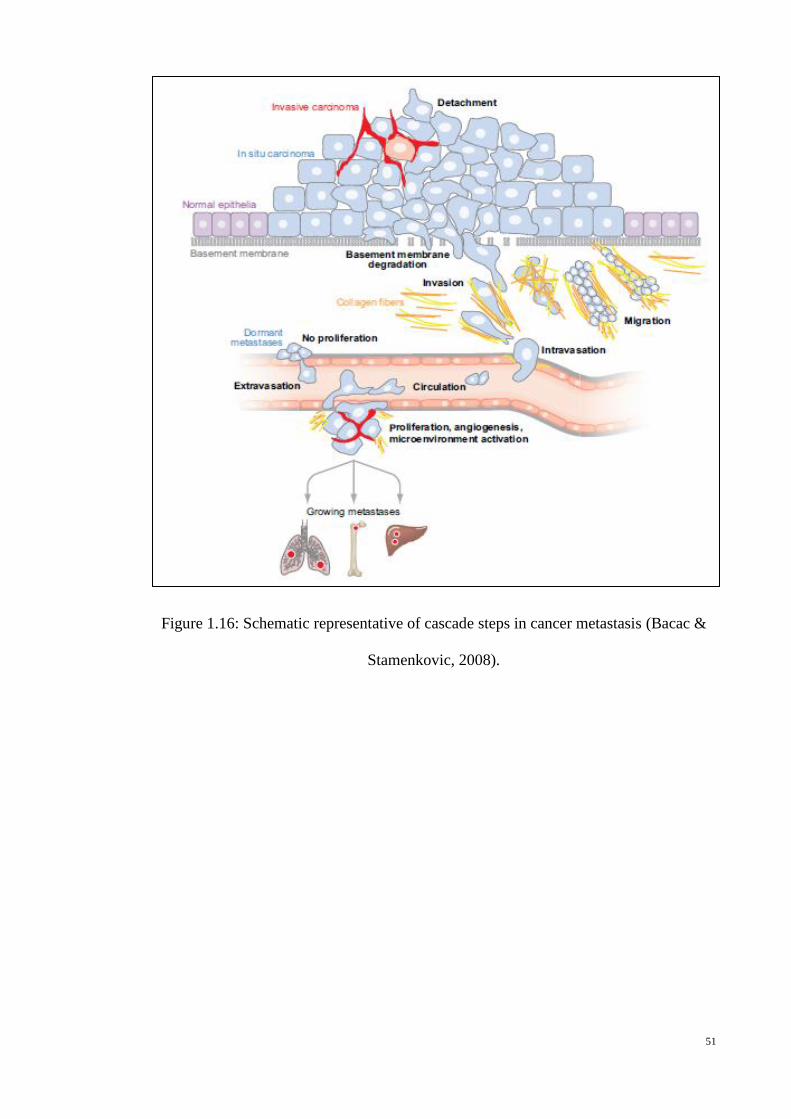
51
Figure 1.16: Schematic representative of cascade steps in cancer metastasis (Bacac &
Stamenkovic, 2008).

52
1.2.6 Angiogenesis
Angiogenesis, or neovascularisation, is a term referring to the physiological
process of new blood vessels formation as an extension from the pre-existing blood
vessel. Angiogenesis plays a fundamental role in tumour growth and metastasis and has
been labelled as one of the hallmarks of cancer. Therefore, tumour growth and
metastasis depends on angiogenesis and remains a main cause of high cancer morbidity
and mortality rates. Besides providing oxygen and nutrients for tumour growth,
angiogenesis also provides a path to allow the tumour cells to metastasize (Weidner et
al., 1991; Zetter, 1998; Kerbel, 2000).
A tumour will produce and release angiogenic growth factors such as vascular
endothelial growth factor (VEGF), platelet-derived growth factor (PDGF), basic
fibroblast growth factor (bFGF) and angiopoietin. These angiogenic growth factors will
bind to their respective receptors on the surface of endothelial cells (EC) in nearby pre-
existing blood vessels. This binding will activate ECs to proliferate and start producing
several proteases including MMP enzymes. ECs will migrate out through the degraded
basement membrane (BM) of vessel walls by MMP enzymes, towards the tumour mass.
Adhesion molecules such as integrins (αvß3 and αvß5) will guide the sprouting new
blood vessel (remodeling of EC) to sprout forward to the tumour. Besides degradation
of ECM, MMPs also degrade other components in the tissue in front of the sprouting
vessel tip in order to provide space for new vessel to grow forward. As the new blood
vessel extends, the surrounding tissue is remolded around the vessel and the sprouting
EC will roll up to form a blood vessel tube. Combination of individual blood vessel
tubes will form blood vessel loops that can circulate blood. Finally, newly formed blood
vessel tubes will be stabilized by specialized muscle cells (smooth muscle cells and
pericytes) that provide structural support (Figure 1.17) (Li et al., 2012).
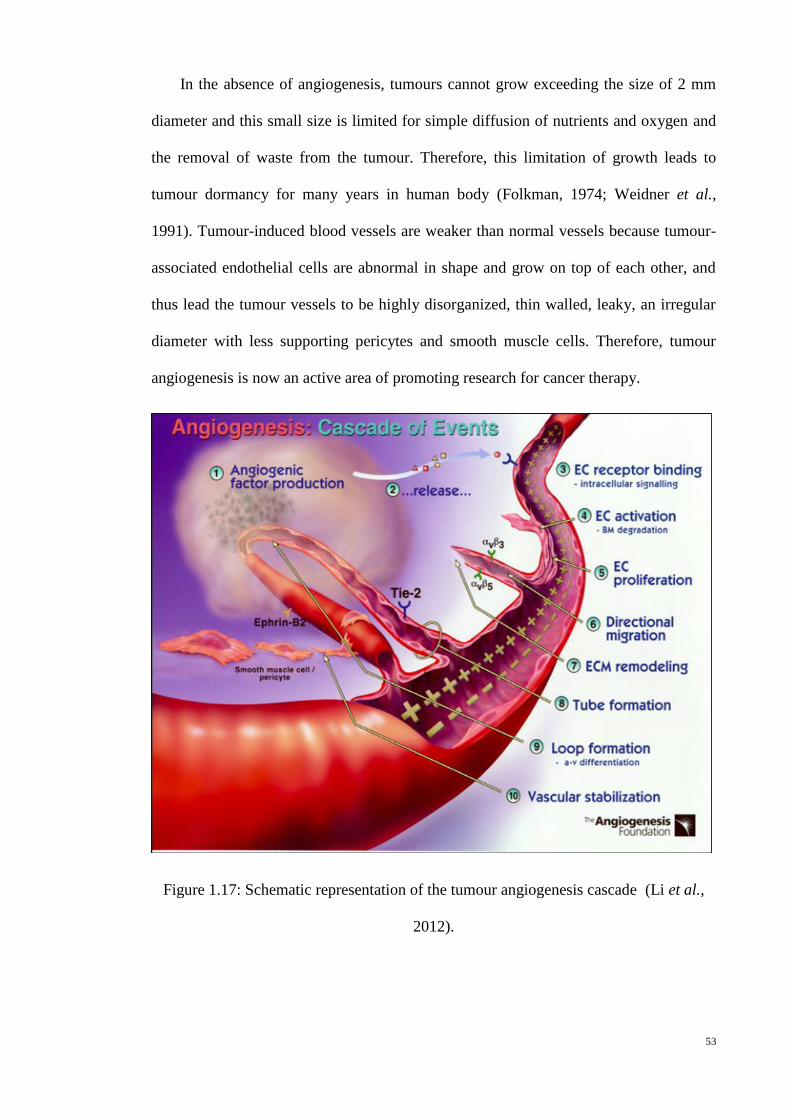
53
In the absence of angiogenesis, tumours cannot grow exceeding the size of 2 mm
diameter and this small size is limited for simple diffusion of nutrients and oxygen and
the removal of waste from the tumour. Therefore, this limitation of growth leads to
tumour dormancy for many years in human body (Folkman, 1974; Weidner et al.,
1991). Tumour-induced blood vessels are weaker than normal vessels because tumour-
associated endothelial cells are abnormal in shape and grow on top of each other, and
thus lead the tumour vessels to be highly disorganized, thin walled, leaky, an irregular
diameter with less supporting pericytes and smooth muscle cells. Therefore, tumour
angiogenesis is now an active area of promoting research for cancer therapy.
Figure 1.17: Schematic representation of the tumour angiogenesis cascade (Li et al.,
2012).

54
1.2.7 Reprogramming of Energy Metabolism
A fast-growing cancer cell requires an adjustment in its energy metabolism to
continuously supply the building blocks required for continuously growth and division.
Under aerobic conditions, glucose is the main energy source that will convert to
pyruvate via glycolysis and the subsequently released free energy is used to generate
ATP and NADH in mitochondria. However, under anaerobic conditions, normal cells
will undergo apoptosis due to stress on the mitochondria. In contrast, cancer cells can
reprogram their glucose metabolism and energy production, by limiting their energy
metabolism in mitochondria. This reprogramming of energy metabolism in cancer cells
is known as the “Warburg effect” after Otto Warburg (Warburg, 1956; Kim & Dang,
2006; Vander Heiden et al., 2009).
This reprogramming of energy metabolism has allowed cancer cells to reduce
their ATP production 18-folds than in normal cells. To compensate the efficiency of
ATP production, cancer cells have up-regulated their glucose transporters, notably
GLUT1 to increase glucose intake into the cytoplasm (Airley et al., 2001; Jones &
Thompson, 2009; Veronica et al., 2010). The markedly increase of glucose uptake by
human tumours is observed with a radiolabeled analog of glucose (18F-
fluorodeoxyglucose, FDG), used as a reporter in positron emission tomography (PET)
(Gillies et al., 2008).
The rapid growth of cancer cells usually outpaces the new blood vessel
generation, and hence results in insufficient blood supply/oxygen to the tumour tissues,
and thus causes the cancer cells fall into a hypoxic, or oxygen deprivation state. There
are two major regulators in hypoxic stress; hypoxia-inducible factors (HIF-1α and HIF-
1β). The importance of these transcription factors in tumour cell survival is reflected in
the finding where the levels of HIF-1α in glioma tumour cells is proportional to the

55
grade of the tumour (Zagzag et al., 2000). During tumour progression, HIF-1 induces
several glycolytic enzymes and glucose transporters such as aldolase A and pyruvate
kinase M to produce energy in hypoxic environments (Schäfer et al., 1997; Discher et
al., 1998). In addition, HIF-1 decreases mitochondrial oxygen consumption by
regulating pyruvate dehydrogenase kinase I and inhibiting the citric acid cycle
(Papandreou et al., 2006).
During activation of the hypoxia pathway, the mRNA of HIF-1α is transcribed
by binding of specificity protein 1(Sp1), P300, and HIF-1β on HIF-1α gene in the
nucleus. In normal cells, HIF-1α is either hydroxylated and ubiquinated, or mostly
degraded by proteasomes (under normal oxygen conditions) (Discher et al., 1998).
However, during hypoxic condition, HIF-1α will re-enter the nucleus and form a
transcription complex with the HIF-1β subunit (Schäfer et al., 1997). This complex will
regulate its target genes such as vascular endothelial growth factor (VEGF) and
cathepsin D to induce new blood vessels production, or angiogenesis to supply more
oxygen and nutrients for tumour growth (Figure 1.18).

56
Figure 1.18: Schematic representation of the hypoxia-inducible factor (HIF)-1 pathway
(Ziello et al., 2007).

57
1.2.8 Evading Immune Destruction
The immune system is the defense system in the human body that monitors
tissue homeostasis by providing protection against infectious pathogens and eliminates
damaged cells including cancer cells. However, the interaction of immune system and
tumour progression is still poorly understood. A tumour is believed to possess the
capability of avoiding detection by the immune system or have been able to limit the
extent of immunological killing, thereby evading eradication (Vajdic & van Leeuwen,
2009; Hanahan & Weinberg, 2011).
Studies found that immunodeficient mice that lack different components of the
immune system are likely to develop tumours than immunocompetent mice (Hanahan &
Weinberg, 2011). Several studies have showed that tumours arose more frequently
and/or grew more rapidly in the immunudeficient mice, particularly lacks of CD8+
cytotoxic T lymphocytes (CTLs), CD4+ Th1 helper T cells, or natural killer (NK) cells,
relative to immunocompetent mice (Kim et al., 2007; Teng et al., 2008). These studies
indicate that both the innate and adaptive cellular immune system plays a significant
role in immune surveillance and thus eradication of the tumour (Kim et al., 2007;
Nelson, 2008; Teng et al., 2008).
A better prognosis is seen in colon and ovarian tumour patients which is heavily
infiltrated with CTLs and NK cells compared to those that lack these cells (Nelson,
2008). Cancer cells may evade from destruction by inhibiting some components in the
human immune system and/or modulated their surface receptors to escape from immune
surveillance. For example, cancer cells can inhibit CTLs and NK cells through the
secretion of TGF-β or other immunosuppressive factors (Shields et al., 2010; Yang et
al., 2010) or by activation of regulatory T cells (Tregs) and myeloid-derived suppressor
cells (MDSCs) which inhibits the actions of cytotoxic lymphocytes.
58
1.3 Natural Products
1.3.1 History and background of the use of natural products as therapeutics
agents
Since the dawn of human history, humans have relied on plants and herbs as
vital source for survival. Besides being a mainstay of nutrition, plants and herbs are also
plays an important role in the treatment of illness. The earliest records on the usage of
natural products in the treatment is including cuneiform in Mesopotamia, Chinese herbs
guide documents and Ayurvedic hymns (Cragg & Newman, 2005; Ji et al., 2009). One
of the best examples is the discovery and development of Artemisinin (antimalaria
drug) from Artemisia annua L, which was used in China for almost 2000 years for
treating various infectious and chronic conditions (van Agtmael et al., 1999).
By definition, a natural product refers to a compound that is present in or
produced naturally and not man-made or artificial. Natural product can originate from
microbes or plants sources (Table 1.3). Generally, a natural product is the common term
for herbs, dietary supplements, traditional Chinese medicine, or alternative medicine
(Cragg & Newman, 2005).
Natural product-based traditional medicine, often overshadowed by modern
medicine, has returned to be an alternative approach for health care in many societies.
The World Health Organization (WHO) estimated about 80% of world’s populations
still relies on traditional medicines as primary health care. Although the number of
natural products based drugs introduced to market is low, but the interest of these drugs
has not dropped in worldwide pharmaceutical companies (WHO, 2008). This is because
the degree of chemical diversity and novelties of molecular structures found in natural
products are broader than any sources. In addition, natural products are sometimes

59
preferred in medicine due to the fact that they can balance the combination of
therapeutic effects with minimum side effects. The importance of natural products as
therapeutic agents has stated by N.R. Farnsworth, an eminent scientist in ethnobotanical
field; “each plant is a unique chemical factory capable of synthesizing an unlimited
number of highly complex and unusual chemical substances whose structures could
escape the imagination of synthetic chemists could” (Farnsworth et al., 1985).
The plant-derived natural products have widely used in medicine including as
antipyretics, neurotransmission modulators, antihypertensive agents and anti-
inflammatory agents. Narcotic morphine is the first commercial pure natural product
which was marketed by Merck in 1826 (Newman et al., 2000). In 1899, Bayer
introduced the first semisynthetic pure drug based on a natural product, aspirin
(Spainhour, 2005).
1.3.2 Plants as source of anticancer agents
Chemotherapy is deemed relatively unsuccessful due to its ineffectiveness,
safety issues and costliness. As not all cancer patients respond positively to current
anticancer agents, mortality rates of cancer are on a continuous rise. Therefore,
scientists have begun to focus on natural-products as alternatives to produce new
therapeutic agents for cancer treatments. Herbs and plants-derived medicines have a
long history of use in various treatments and now, they still remain as important sources
for the development of anticancer drugs. More than 3000 plants species have been
reported to be involved in the development of anticancer drugs (Shoeb, 2006). The
exploration of anticancer agents from plant sources started in the 1950s. Since then,
extensive research has been conducted and has led to the discovery and development of
several anticancer agents derived from plants such as taxol, vinblastine and vincristine.
From 1940-2006, more that 40% of drugs in the market are anticancer agents and 65%
60
of these anticancer drugs mimic natural compounds (Cragg & Newman, 2005). Some
example of anticancer agents derived from natural products include zapotin (Casimiroa
edulis, apoptotic inducer); apigenin (Mezoneuron cacullatum, antimutagenesis); and
resveratrol (Cassia quinquangulata, cyclooxygenase inhibitor) (Table 1.3) (Holt &
Chandra, 2002; Shoeb, 2006).
Besides as a direct medical application as drug, natural products could also serve
as templates for the design, synthesis, and semisynthesis of new compounds. Paclitaxel
and vincristine are the two examples of semisynthetic compounds used in the treatment
of human cancers. Natural product provides those treating cancer with new avenue of
treatment of the most aggressive forms of the disease (Farnsworth et al., 1985; Cragg &
Newman, 2005; Shoeb, 2006).
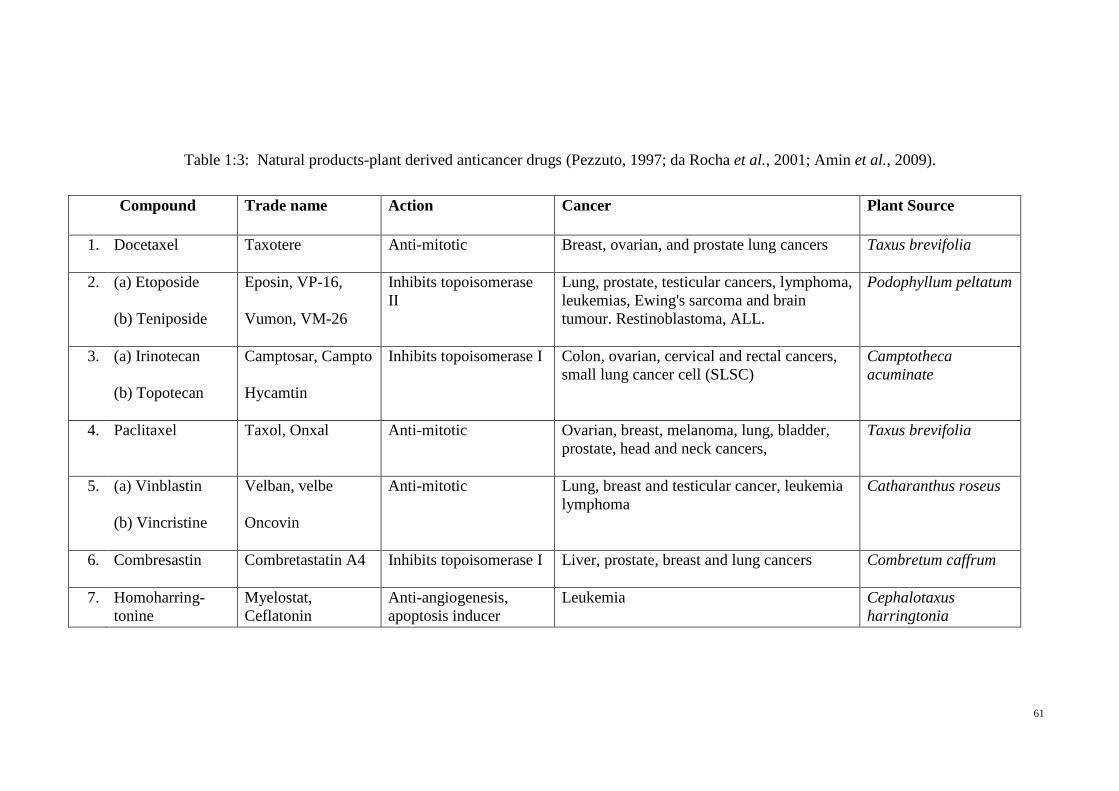
61
Table 1:3: Natural products-plant derived anticancer drugs (Pezzuto, 1997; da Rocha et al., 2001; Amin et al., 2009).
Compound Trade name Action Cancer Plant Source
1. Docetaxel Taxotere Anti-mitotic Breast, ovarian, and prostate lung cancers
Taxus brevifolia
2. (a) Etoposide
(b) Teniposide
Eposin, VP-16,
Vumon, VM-26
Inhibits topoisomerase
II
Lung, prostate, testicular cancers, lymphoma,
leukemias, Ewing's sarcoma and brain
tumour. Restinoblastoma, ALL.
Podophyllum peltatum
3. (a) Irinotecan
(b) Topotecan
Camptosar, Campto
Hycamtin
Inhibits topoisomerase I Colon, ovarian, cervical and rectal cancers,
small lung cancer cell (SLSC)
Camptotheca
acuminate
4. Paclitaxel Taxol, Onxal Anti-mitotic Ovarian, breast, melanoma, lung, bladder,
prostate, head and neck cancers,
Taxus brevifolia
5. (a) Vinblastin
(b) Vincristine
Velban, velbe
Oncovin
Anti-mitotic Lung, breast and testicular cancer, leukemia
lymphoma
Catharanthus roseus
6. Combresastin Combretastatin A4 Inhibits topoisomerase I Liver, prostate, breast and lung cancers Combretum caffrum
7. Homoharring-
tonine
Myelostat,
Ceflatonin
Anti-angiogenesis,
apoptosis inducer
Leukemia Cephalotaxus
harringtonia

62
1.4 Phyllanthus
1.4.1 History and conventional usage of Phyllanthus
Phyllanthus is the largest genus in the family of the Phyllanthaceae
(Euphorbiaceae s.l.). It is widely distributed throughout the tropical and subtropical
regions of world including Malaysia, India, Brazil, Cuba and the Amazon (Lee et al.,
1996; Etta, 2008). To date, there are more than 700 species of Phyllanthus have been
reported (Unander et al., 1990) that includes P. amarus, P. elegans, P. emblica L., P
caroliniensis P. flexuosus, P. reticulatus, P.discoideus, P. muellerianus, P. multiflorus
Willd., P. tenellus Roxb, P. virgatus Forst. f., P. urinaria L., P. niruri, P. reticulatus, P.
conami Sw, P. lathyroides, P. casticum and P. madagascariensi. In different countries,
Phyllanthus is known by different names such as “Dukung Anak” in Malaysia, “Hsieh-
hsia Chu” in China, “Quebra Pedra” in Brazil and in India, it known as “Pitirishi”
and/or “Budhatri” (Taylor, 2003).
This plant has a long history in the medical herbalism system. It is mainly used
to treat kidney and urinary bladder disturbances. In Ayurvedic medicine, Phyllanthus
has a long tradition of use to treat jaundice, gonorrhea, frequent menstruation, dysentery
and diabetes as well as skin ulcers, sores, swelling, and itchiness (Calixto et al., 1998).
In Traditional Chinese Medicinal (TCM), Phyllanthus has been used for generations to
eliminate gallstones and kidney stones, as well as an immune system stimulator (Taylor,
2003).
Due to different climates and geographically regions, Phyllanthus grows in
different forms such as annual and perennial herbs, shrubs, and pachycaulous succulents
in order to survive. It can grow up to 12-24 inches in height and blooms with many
greenish white flowers. One of the famous Phyllanthus species is P.niruri. In Amazon,

63
it is named as “stone breaker” due to its effectiveness in the elimination of gallstones
and kidney stones and other treatments including diabetes and intestinal infections
(Taylor, 2003). Table 1.4 shows the various usage of Phyllanthus niruri in different
societies.
Figure 1.19: P.urinaria (Fito Pharma 2011), P.amarus (Find me cure, 2011) and
P.niruri (GardenSeed, 2011).

64
Table 1:4: Worldwide ethnobotanical uses of P. niruri (Taylor, 2003).
Region Uses
Amazonia Anodyne, apertif, blennorrhagia, carminative, colic, diabetes, digestive,
diuretic, dropsy, dysentery, dyspepsia, emmenagogue, fever, flu, gallstones,
gonorrhea, itch, jaundice, kidney aliments, kidney stones, laxative, malaria,
proctitis, stomachache, stomachic, tenesmus, tonic, tumour, vaginitis,
vermifuge
Bahamas/
Caribbean
Antihepatotoxic, antispasmodic, appetite stimulant, antiviral, aperitif,
bactericidal, cold, constipation, diuretic, fever, flu, hypoglycemic, laxative,
stomachache, typhoid
Brazil Abortifacient, ache (joint), albuminuria, analgesic, antibacterial,
anticancerous, antidiabetic, anti-inflammatory, antilithic, antispasmodic,
antiviral, aperient, arthritis, biliary conditions, bladder problems, bladder
stones, calculi, catarrh (liver and kidney), chologogue, cystitis, deobstruent,
diabetes, diaphoretic, digestion stimulant, diuretic, fever, gallbladder,
gallstones, gastritis, gastrointestinal problems, gout, hepatitis,
hepatoprotective, hydropsy, hypertension, hypoglycemic, jaundice, kidney
colic, kidney pain, kidney stones, liver, m alaria, muscle relaxant, obesity,
prostatitis, purgative, renal colic, renal problems, stomachic, sudorific, tonic,
uric acid excess, urinary problems, uterine relaxant
Haiti Carminative, colic, digestive, diuretic, fever, indigestion, malaria,
spasmolytic, stomachache, stomachic, tenesmus
India Anemia, asthma, astringent, bronchitis, conjunctivitis, cough, deobstruent,
dropsy, diabetes, diarrhea, diuretic, dysentery, fevers, eye disorders,
galactagogue, genitourinary disorders, gonorrhea, hepatitis, jaundice,
leucorrhea, menorrhagia, oligogalactia, ringworm, scabies, stomachic, thirst,
tuberculosis, tumour (abdomen), urogenital tract infections, warts
Malaysia Caterpillar sting, dermatosis, diarrhea, diuretic, emmenagogue, itch,
miscarriage, piscicide, purgative, renosis, syphilis, vertigo
Peru Calculus, diuretic, emmenagogue, gallstones, hepatitis, kidney pain,
kidney problems, kidney stones, renal problems, urinary infections,
vermifuge
United States Analgesic, bronchitis, chologogue, deobstruent, diabetes, fever,
gallbladder problems, gallstones, gout, hepatitis, hypertension, kidney
problems, kidney stones, liver disease, uric acid excess, urinary tract
infections
Elsewhere Analgesic, antipyretic, appetite stimulant, blennorrhagia, bruises,
chologogue, cough, cuts, diabetes, diarrhea, diuretic, dropsy, dysentery,
dyspepsia, emmenagogue, eye diseases, fever, gallstones, gonorrhea, itch,
jaundice, kidney disease, kidney stones, laxative, malaria, menorrhagia,
menstrual problems, poultice, purgative, rectitis, stomachache, tonic,
tuberculosis, urinary tract infections, vaginitis, venereal diseases

65
1.4.2 Scientifically proven pharmacological activities of Phyllanthus and its
constituents
Phyllanthus is believed to have originated from India and by the late 1980s,
these plants have gained attention from scientists worldwide. One of its species, P.
niruri has showed clinical efficacy against viral Hepatitis B (Calixto et al., 1998; Padma
& Setty, 1999). Therefore, substantial studies of this genus regarding its chemistry,
pharmacological activity and clinical effectiveness have been extensively carried out.
The extract of these plants had been reported to have a variety of pharmacological
effects and is listed in Table 1.5.
Table 1:5: Various pharmacological activities of Phyllanthus species.
Pharmacological
activities
Description
Antiviral Inhibits cellular proliferation, DNA polymerase, hepatitis B
surface antigen (HBsAg) gene expression
(Venkateswaran et al., 1987; Blumberg et al., 1990; Yeh et al.,
1993; Ott et al., 1997; Huang et al., 2003; Lee et al., 2003a)
Growth inhibitions of HIV-1 and HIV-2
(Venkateswaran et al., 1987; Naik & Juvekar, 2003)
Antibacterial Growth inhibitions of Escherichia coli, Enterococcus faecium,
Pseudomonas aeruginosa, Staphylococcus aureus,
Mycobacterium smegmatis, Bacillus stearothermophilus,
Bacillus subtilis, Micrococcus leuteus, Salmonella typhi,
Enterobacter aerogenes, Proteus mirabilis, and Proteus vulgaris
(Mensah et al., 1990; Mazumder et al., 2006; Komuraiah et al.,
2011)
Hepatoprotective
and
gastroprotective
Reduces liver infiltration, focal necrosis and intracellular level of
reactive oxygen species
(Lee et al., 2006a; Naaz et al., 2007)
Protects liver tissues against oxidative damage and improves
liver repair mechanism
(Bhattacharjee & Sil, 2006)
Gastroprotective (Shokunbi & Odetola, 2008)

66
Hypoglycaemia or
anti-diabetic Hypoglycemic effect
(Raphael et al., 2002; Adeneye et al., 2006; Kumar et al., 2008)
Anticancer and
antitumour Anticancer properties against liver, renal, breast, colon, lung,
cervical, ovarian, colorectal, melanoma and leukemia cancer
cells
(Pettit et al., 1984; Jeena et al., 1999; Rajeshkumar & Kuttan,
2000; Huang et al., 2004b; Rajkapoor et al., 2007; Ratnayake et
al., 2008; Ngamkitidechakul et al., 2010)
Antitumour properties against sarcoma, Dalton's Lymphoma
Ascites (DLA), Ehrlich Ascites Carcinoma (EAC),
hepatocarcinoma, and skin tumour
(Rajeshkumar & Kuttan, 2000; Rajeshkumar et al., 2002;
Ngamkitidechakul et al., 2010)
Others Diuretic and hypotensive effects
(Srividya & Periwal, 1995)
Antioxidant properties
(Khopde et al., 2001; Kumaran & Joel Karunakaran, 2007)
Lipid lowering activity
(Khanna et al., 2002)
Anti-inflammatory effect
(Ihantola-Vormisto et al., 1997; Kiemer et al., 2003)
Antinociceptive effect
(Santos et al., 1995; Santos et al., 2000)
Analgesic effect
(Santos et al., 1994)
Antimalaria
(Totte et al., 2001)
Antimutagenic and antigenotoxic properties
(Sripanidkulchai et al., 2002)
Anti-babesial and anti-plasmodialactivity
(Totte et al., 2001; Subeki et al., 2005)

67
1.5 Justification and Objectives of the Study
Melanoma is the most fatal form of skin cancer, with higher morbidity and
mortality rates in fair-skinned populations, whereas, prostate cancer remains one of the
major life-threatening cancers in men. Typically, tumour metastasis is the main cause
for high morbidity and mortality rates in cancer patients. Currently, the best treatments
for melanoma and prostate cancers include patient management as well as standard
treatments to control metastasis such as chemotherapeutic drugs, surgery and/ or
radiation therapy. Conversely, these treatments are often accompanied by undesirable
side effects such as vomiting, nausea and alopecia. Distressingly, not all cancer patients
respond positively to current anticancer agents and the mortality rates have increased
inspite of treatment. Hence, intense effort is required to acquire anticancer agents that
have minimal side effects and could also target cancer metastasis.
Natural product-based traditional medicine, is often overshadowed by modern
medicine, has returned to be a holistic approach for health care in many societies. This
“back to basic” approach is due to its long history of usage in disease treatment and the
pharmacological/nutritional value of these products are believed to be able to halt/delay
cancer progression. The well-known examples of plant-derived anticancer drugs include
taxol (antimicrotubule agent) and vincristine (mitotic inhibitor) (Shoeb, 2006). Herb-
and plant-derived medicines that are widely used in traditional cultures have gained
popularity in modern society as natural alternatives to produce new potential therapeutic
compounds (Shoeb, 2006).
Phyllanthus plant is widely distributed in subtropical and tropical regions. A
variety of pharmacological effects have been reported including antiviral, antibacterial,
anti-hepatotoxic as well as having anti-diabetic properties. These effects are mainly
attributed to the presence of various of bioactive compounds in Phyllanthus plant such
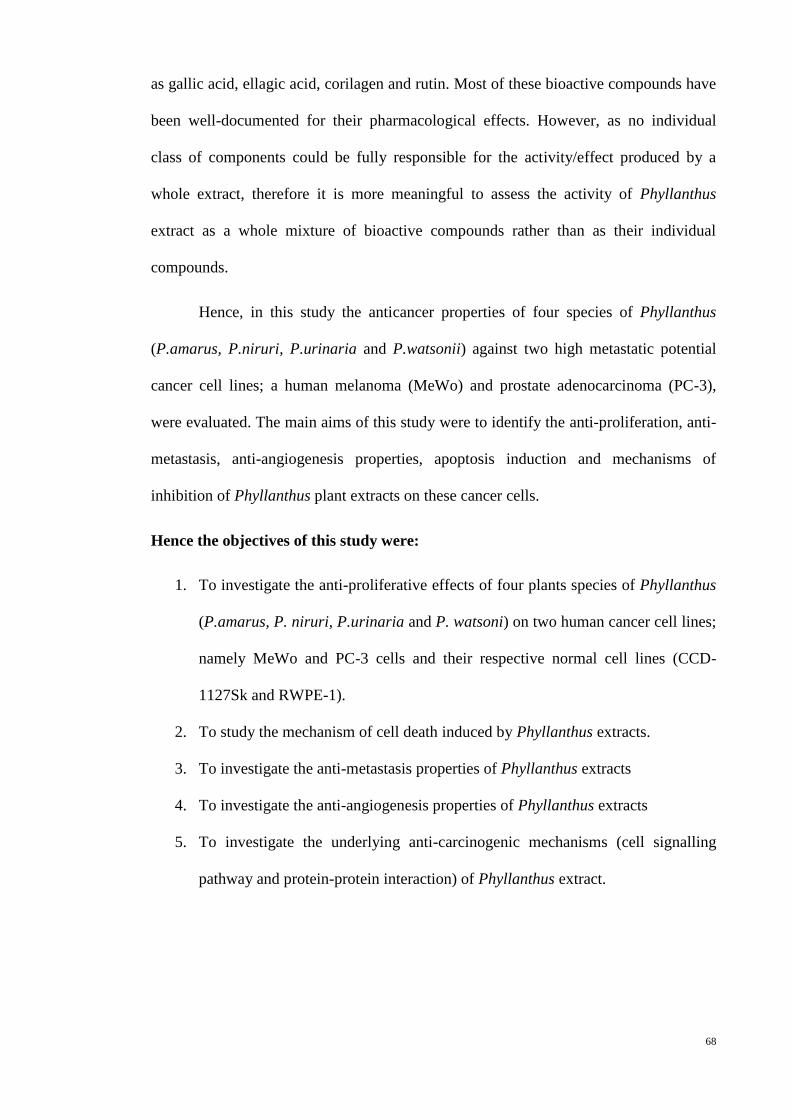
68
as gallic acid, ellagic acid, corilagen and rutin. Most of these bioactive compounds have
been well-documented for their pharmacological effects. However, as no individual
class of components could be fully responsible for the activity/effect produced by a
whole extract, therefore it is more meaningful to assess the activity of Phyllanthus
extract as a whole mixture of bioactive compounds rather than as their individual
compounds.
Hence, in this study the anticancer properties of four species of Phyllanthus
(P.amarus, P.niruri, P.urinaria and P.watsonii) against two high metastatic potential
cancer cell lines; a human melanoma (MeWo) and prostate adenocarcinoma (PC-3),
were evaluated. The main aims of this study were to identify the anti-proliferation, anti-
metastasis, anti-angiogenesis properties, apoptosis induction and mechanisms of
inhibition of Phyllanthus plant extracts on these cancer cells.
Hence the objectives of this study were:
1. To investigate the anti-proliferative effects of four plants species of Phyllanthus
(P.amarus, P. niruri, P.urinaria and P. watsoni) on two human cancer cell lines;
namely MeWo and PC-3 cells and their respective normal cell lines (CCD-
1127Sk and RWPE-1).
2. To study the mechanism of cell death induced by Phyllanthus extracts.
3. To investigate the anti-metastasis properties of Phyllanthus extracts
4. To investigate the anti-angiogenesis properties of Phyllanthus extracts
5. To investigate the underlying anti-carcinogenic mechanisms (cell signalling
pathway and protein-protein interaction) of Phyllanthus extract.
69
CHAPTER 2: METHODOLOGY
2.1 Cell Culture and Maintenance
2.1.1 Normal and Cancer Cell Lines
In this study, human skin melanoma cells, MeWo (ATCC: HTB-65) and prostate
adenocarcinoma cells, PC-3 (ATCC: CRL-1435), normal human skin cells, CCD-
1127Sk (ATCC: CRL-2565) and normal human prostate cells, RWPE-1 (ATCC: CRL-
11609) as well as human umbilical vein endothelial cells, HUVECs (ATCC: CRL-
2873) were used. All these cell lines were purchased from American Type Culture
Collection (ATCC) and cultured with different media, EMEM (Eagle’s minimum
essential medium) for MeWo cells, RPMI-1640 (Roswell Park Memorial Institute) for
PC-3 cells, keratinocyte growth medium-chemically defined, KGM™-CD medium
(CC-4455, Lonza, USA) for RWPE-1 cells, DMEM (Dulbecco’s modified Eagle
Medium) for CCD-1127Sk cells and endothelial growth media, EGM-2 Bullet Kit (CC-
3162, Lonza, USA) for HUVECs. Growth media were supplemented with 10% heat-
inactivated fetal bovine serum (FBS, Flowlab, Australia). All cells were grown in 5 ml
in 25 cm2 flasks or 20 ml in 75 cm
2 flasks (Nunc, Denmark). Cells were maintained at
37°C under humidified air with 5% CO2. Cells were harvested using 0.25% trypsin-
EDTA (Hyclone) when they reach 70–80% confluency in culture flasks. Cells
undergoing exponential growth were used throughout the experiments.
2.1.2 Culture Medium
KGM™-CD (Chemically Defined) and EGM-2 BulletKit media were purchased
from Lonza and were supplemented with SingleQuots™ Kit, consisting of essential
growth factors, cytokines, and supplements. Culture media (EMEM, DMEM and
70
RPMI-1640) were purchased from Flowlab, Australia and stored at 4°C until further
reconstitution for use. The powder was reconstituted by dissolving the medium together
with 3.7 g of sodium bicarbonate and 4.7 g of HEPES (Sigma-Aldrich, Ireland Ltd) in
one liter of sterile double-distilled water or milliQ water. After complete dissolution of
the powder, the medium was then filter-sterilized with 0.2 µm membrane filter
(Nalgene, USA) using air pressure from a machine diaphragm pump. The medium was
stored at 4°C till further use. Fetal Bovine Serum (FBS, Flowlab, Australia) was heat
inactivated at 56°C for 30 minutes, aliquoted into 50 ml tubes (Nunc, Germany) and
stored at -20°C till required for reconstitution as complete growth medium. Heat-
inactivated FBS was added freshly into medium at 10% concentration just before use.
2.1.3 Culture Technique
All cell culture procedures were conducted under sterile conditions in a vertical
flow hood (Microflow, Birmingham, UK) to avoid contaminations. Cell passaging is the
process of splitting cultured cells to yield large or low number of cells from pre-existing
cells, depending on the purpose. Briefly, old growth media was discarded, rinsed with
sterile PBS and trypsinized with trypsin-EDTA (0.25%) for 5 minutes. The detached
cells were resuspended in serum-containing growth medium and the suspension was
gently aspirated few times to avoid cell clumps. At ratio 1:1, cell suspension was mixed
with 0.2% trypan blue solution (Sigma-Aldrich, Ireland Ltd) and loaded into the
haemocytometer chamber. The cells were counted under an inverted microscope
(Olympus CK-40).
71
The calculation of cell number in 1ml of solution is as following:
Cell number/1 ml = A x B x C
Where,
A = average number of cells counted in four large corner squares,
B = dilution factor is 2 (1:1 dilution of cell suspension with trypan blue), and
C = volume of 0.1 mm3 square is equivalent to 10
-4 ml but substitute with 10
4 in
calculation as for conversion factor to convert 10-4
ml to 1 ml.
Cryoperservation of the cells was performed to store the cells in liquid nitrogen
for future use. The freezing medium consists of culture medium, pure fetal bovine
serum (FBS) and the freeze substitute, dimethyl sulphoxide (DMSO, Sigma-Aldrich,
Ireland Ltd) at 6:3:1 ratio. Briefly, cell suspension was spun down at 1,500 rpm
(Eppendorf Centrifuge 5810R, Germany) for 10 minutes at 4°C. Cell pellet was
resuspended with freezing medium and transferred to a cryogenic vial (Nunc, Denmark)
at 2x10⁶ cell/vial. The vial was tightly capped, properly labeled with cell line, passage
number, and date of freeze down, and placed in a freezing container which was then
stored at -80°C overnight before transferring it into the liquid nitrogen tank for long
term storage.
Cryopreserved cells from the liquid nitrogen were thawed when required for
experiments. Briefly, cryogenic vial was thawed by rapid agitation of in a 37°C water
bath (Memmert). Contents in cryovial were transferred to a 25 cm2 culture flask
containing warm growth media and incubated overnight. On the following day, the flask
was rinsed with PBS to remove any floating dead cells and residual DMSO and
replaced with new growth medium.
72
2.2 Preparation of Serial Dilutions of Samples and Standard Anticancer Drugs
Aqueous and methanolic extracts of four different species of Phyllanthus
(P.amarus, P.niruri, P.urinaria, and P.watsonii) were prepared and provided by Dr.
Indu Bala, Biotechnology Centre, Malaysian Agricultural Research and Development
Institute (MARDI). The freshly harvested whole plants (P.amarus, P.niruri, P.urinaria,
and P.watsonii) except the root part were collected, washed, and dried at room
temperature. The dried materials were cut into smaller pieces and freeze dried with
liquid nitrogen into powder form. For the aqueous extract, the dried sample was mixed
with extraction buffer (ultra pure water, diethyldithiocarbamic acid and formic acid),
while absolute methanol was used for the methanolic extract. The mixtures were then
centrifuged at 8,900 rpm at 4°C for 5 minutes. The supernatant was collected after three
rounds of extraction and filtered with 15 WHATMAN No.4. The powder form of each
extract was prepared after vacuum dried and kept at -20°C. For the experiment, the
master stock of aqueous extract (10 mg/ml) and methanolic extract (40 mg/ml) were
prepared by dissolving into sterile miliQ water and DMSO, respectively. Standard
anticancer drugs, Doxorubicin (Dox) and 5-Fluorouracil (5’FU) were used as positive
control in this study. Master stock of plant extracts and standard drugs were aliquoted
into 1 ml tubes and kept at -20°C.
2.3 High performance liquid chromatography coupled with electronspray
ionization (ESI) and mass spectrometry (LCMS- MS) analysis
For aqueous extracted samples, 2 ml of supernatant was dried in a vacuum
concentrator (Concentrator 5301 eppendorf, Germany) and re-dissolved into 20 mg/ml
with 30% methanol before being subjected for LC-MS-MS analysis. For those samples
extracted with methanol, total supernatant was evaporated using rotary evaporator

73
(Rotavapor RII, BUCHI, Switzerland) and re-dissolved again with 20% methanol.
Samples were then separated with solid phase extraction (SPE) column (LiChrolut RP-
18, 1000 mg/6 ml, Merck, Germany) with mobile phase of 60% methanol and 70%
methanol. All elutes were concentrated to 0.5 ml, then diluted 8 times with 40%
methanol before being subjected for LC-MS-MS analysis.
Samples were separated using HPLC system comprising of a HPLC binary
pump, an autosampler injector compartment and diode array detector (DAD) (1200
series, Agilent Technologies, Germany). Separations were carried out using a reverse
phase C- 18, 150 mm X 4.6 mm i.d, 5 µm particle size Thermo Hypersil GOLD column
(Thermo Scientific, UK). Separation was developed using a mobile phase of 0.1%
formic acid in water (solvent A) and 0.1% formic acid in acetonitrile (solvent B) with a
gradient setting of solvent B: 5% (5 min), 5–90% (60 min), 5% (4 min) at flow rate of 1
ml/min. The injection volume was set at 20µl and the detections were both at 280 nm
and 360 nm. For mass spectrometry analysis, 3200 QTrap LC/MS/MS system (Appiled
Bioscience – MDS Sciex) was used with the iron source and voltage was maintained at
500°C and -4.5 kV for negative ionization, respectively. Nitrogen generator was set to
be operated at 60 psi curtain gas flow, 90 psi source gas flow and 60 psi exhaust gas
flow. Two types of scanning modes were chosen: enhance mass spectrometer (EMS)
and enhance ion product (EPI) for a full scan mass spectra ranging from m/z 100–1200.
2.4 Assessment of Cancer Cell’s Proliferation
The anti-proliferative activity of Phyllanthus was measured using a
colourimetric MTS assay, which is composed of solutions of a novel tetrazolium
compound 3-(4,5-dimethylthiazol-2-yl)-5-(3-carboxymethoxyphenyl)-2-(4-sulphonyl)-
2H-tetrazolium, inner salt, MTS and an electron coupling reagent (phenazine
74
methosulphate; PMS) (Promega, Madison, WI). This assay is based on the cleavage of
the yellow dye MTS to purple formazan crystals by dehydrogenase activity in
mitochondria of viable cells (Husoy et al., 1993). Cancer (MeWo and PC-3) and normal
(CCD-1127Sk and RWPE-1, HUVECs) cells in cultured flasks were washed thoroughly
with sterile PBS (1X), collected by addition of trypsin-EDTA (1X) solution and re-
suspended in the culture medium. The cancer and normal cell lines were then counted
and seeded at 1x10⁵ cells per well in a 96-wells flat-bottom plate. For endothelial cells
(HUVECs), cells were seeded at 5x10³ cells per well into a fibronectin pre-coated 96-
well plate. The seeded cells were incubated overnight at 37°C for cell attachment.
The master stock solution of Phyllanthus crude extracts were serially diluted and
added to the cells to reach a final concentration at a range of 31.3–500.0 µg/ml and
further incubated for 72 hours. The percentage of DMSO in working concentration of
methanolic extracts was not exceeding 1.3% to avoid toxicity to cell. Anticancer drugs,
Doxorubicin (Calbiochem, USA) and 5’Fluorouracil (Duchefa, The Netherlands) were
used as positive controls for PC-3 and MeWo cells, respectively. In addition, the
fractions of crude aqueous extract of Phyllanthus species, fraction 1 and 2 were also
tested for their anti-proliferative effect on normal and cancer cells for comparison with
the crude extracts. After 72 hours, the cytotoxicity screening was performed using
CellTiter 96®AQueous Non-Radioactive Cell Proliferation Assay kit (Promega, USA),
according to the manufacturer’s instructions. Briefly, an equal volume of MTS/PMS
solution was added in each well and the plate was stored in dark for an hour before
determining their absorbance at 490 nm with the reference wavelength at 600 nm using
GloMax Multi Detection System (Promega, USA). The absorbance is directly
proportional to the number of viable cells in the culture. At least three replications for
each sample were used to determine the anti-proliferative activity. The percentage of

75
cell viability of Phyllanthus extracts on both human cancer and normal cell lines were
determined using following formula:
Percentage of cell viability
= [Mean OD of the tested cells – Mean OD of the medium]
[Mean OD of the untreated cells – Mean OD of the medium]
Half-maximal inhibitory concentration (IC50) value is a concentration of tested
sample that kills 50% of cell population as compared to the untreated control. The IC50
was determined as cut-off values of each Phyllanthus plant extracts to have anti-cancer
properties according to US National Institute of Health (NIH) plant screening program
and will be used in subsequent experiments.
2.5 Assessment of Cell Cycle Distribution
Assessing the damaged DNA of cancer cells resulting from exposure to
anticancer agents is important in cancer biology and toxicology studies. The
susceptibility and variation of DNA to damage can differ between cell types. Thus,
assessment of anti-proliferative activity of Phyllanthus was determined by measuring
the amount of cellular DNA damage in a cancer cell population (MeWo and PC-3)
through flow cytometric application.
Flow cytometric analysis allows the measurement of changes in cellular DNA
content during the various phases of the cell cycle. Optimization of flow cytometric
DNA was performed to increase the sensitivity in detecting levels of DNA damage
(strand breaks) and allowed the measurement of the extent of DNA damage by
providing adequate resolution, linearity and sensitivity to distinguish single cells from
aggregates in flow cytometry. In addition, optimization of flow cytometry is to ensure
stability of the system performance and reproducibility of the results. Propidium iodide
X 100%

76
(PI) dye was used as it intercalates with DNA and allows evaluation of cell viability and
DNA content at excitation/emission wavelength the 480/490 nm.
Melanoma (MeWo) and prostate cancer cells (PC-3) were seeded at 2.5x10⁵
cells per well in a 6-wells plate and allowed to incubate overnight. Cells treated with
respective IC50 value of Phyllanthus extracts were incubated at different time intervals;
24, 48, 60 and 72 hours. The floating and trypsin-detached cells were collected and
fixed in 70% ethanol. The ethanol-fixed cells were spun down and washed twice with
ice-cold PBS. The cell pellet was stained with propidium iodide (10 µg/ml) (Sigma-
Aldrich, Ireland Ltd) in PBS (Flowlab) containing RNase A (1 mg/ml) and was
incubated in a 37°C water bath (Memmert) for 30 minutes in the dark before being
analyzed on a FASCalibur flow cytometer (Becton Dickinson, USA). Cell cycle
distribution is presented as the number of cells versus the amount of DNA as indicated
by the intensity of fluorescence. The percentage of cells in sub-G1, G0/G1, S and G2/M
phases of cell cycle was quantitated using WinMDI software. The percentage of
hypodiploid cells (Sub-G1) over total cells was calculated and expressed as percentage
of apoptotic cells.
2.6 Apoptosis Assays
Inhibition of apoptosis in cancer is a major causative factor leading to malignant
transformation of the cancer cells, metastasis and resistance to anticancer agents. The
induction of apoptosis in cancer cells is important to halt cancer progression. Therefore,
induction of apoptosis by Phyllanthus plant extracts in cancer cells (MeWo and PC-3)
was studied using caspases detection, TUNEL and DNA fragmentation.

77
2.6.1 Caspase-3/7 Detection
Caspases (caspase-3 and -7) are member of executioners in apoptosis induction.
Their activity was measured by caspase-Glo-3/7 assay (Promega, Madison, WI). This is
a luminescent assay that allows measurement of caspase-3 and -7 activities by providing
proluminescent caspase–3/-7 substrate, Z-DEVD. The cleavage of this Z-DEVD by
these caspases will produce aminoluciferin that generate luminescent signals.
Cancer (MeWo and PC-3) cells were seeded at a density of 1x10⁴ of cells/well
in 96-wells white-walled flat bottom plates and incubated overnight for cell attachment.
Cells were then treated with the respective IC50 value of Phyllanthus extracts for 72
hours. Control well consists of cells with culture medium without extracts while blank
wells contained culture medium only. The Z-DEVD substrate reagent was added at 1:1
ratio to the cells. After an hour of incubation at room temperature, caspase-3/7 activity
of treated cells was determined by measuring luminescence signal using GloMax Multi
Detection System (Promega, USA). The percentage of caspase-3/7 of Phyllanthus
extract-treated cell was determined, where the background luminescence associated
with the culture media and assay reagent (blank reaction) was subtracted from the
experimental values of treated cells. The percentage activity of caspase-3/7 level was
presented as mean of three independent experiments conducted in triplicates.
Percentage of caspase-3/7 activity
= [Mean RLU of the tested cells – Mean RLU of the medium]
[Mean RLU of the untreated cells – Mean RLU of the medium]
Where,
RLU = Relative Luminescence Units
X 100%

78
2.6.2 TUNEL Assay and Apoptotic Index
DNA fragments produced by Phyllanthus treatment was determined using the
ApopTag@Plus Peroxidase In Situ Apoptosis Detection Kit (Cemicon International,
USA) based on the terminal deoxynucleotidyl-transferase mediated dUTP nick end
labeling (TUNEL) assay according to the manufacture’s instruction. Cancer cells
(MeWo and PC-3) were treated with respective IC50 values of Phyllanthus extracts for
72 hours. The cells were fixed with 1% paraformaldehyde in PBS (pH 7.4) and dried on
a silanized glass slide. Pre-cooled ethanol:acetic acid (2:1 v/v) was used for post-
fixation of cells on the slide for 5 minutes at -20°C. Endogenous peroxidase was
quenched with 3% H2O2 at room temperature for 5 minutes. The apoptotic DNA
fragments were labelled with digoxigenin antibody with TdT (terminal
deoxynucleotidyl transferase) enzyme and then conjugated with anti-digoxigenin
antibody. The labelled peroxidase-apoptotic DNA fragments were then treated with
peroxidase substrate, diaminobenzidine (DAB) to produce permanent and localized
brown-coloured stain. Methyl green (Sigma-Aldrich, Ireland Ltd) was used to
counterstain the cells to further differentiate the apoptotic cells from viable normal cells.
The slide was observed under light microscope (Olympus BX41) and photographed
with Olympus U-CMAD3 camera. The number of apoptotic cells were calculated from
a total of at least 1000 apoptotic cells at 100x magnification and presented as an
apoptotic index. Apoptotic cells were identified in TUNEL assay by brown coloured
cells from blue coloured viable cells.
2.6.3 DNA Fragmentation
During apoptosis, chromatin DNA were cleaved by the activated endogenous
endonucleases into internucleosomal fragments with 180 base pairs (bp) and multiples
thereof (360, 540, etc.) which can be detected using agarose gel electrophoresis assay.
79
Cancer cells (MeWo and PC-3) were treated with respective IC50 values of Phyllanthus
extract for 72 hours. After incubation, both floating and trypsin-detached cells were
collected and then centrifuged at 1,500 rpm for 5 minutes at 4°C. The cell pellet was
resuspended with sterile PBS and then lysed with ice-cold lysis buffer (1 M Tris-HCl,
pH 8.0, 0.5 M EDTA, 100% Triton X-100 and distilled water) for 35 minutes at 4°C.
The cell lysates were centrifuged at 7,800 rpm for 30 minutes at 4°C and supernatant
was collected. The DNA sample was extracted from supernatant with 25:24:1 (v/v/v)
equal volume of neutral phenol:chloroform:isoamyl alcohol (Sigma-Aldrich, Ireland
Ltd). The DNA sample was precipitated by adding two volumes of isopropanol (Fisher
Scientific, Canada) and 0.1 volume of 3 M sodium acetate (pH 5.2) into the supernatant
and left undisturbed at -20°C overnight. The precipitate containing the DNA fragment
was centrifuged at 7,800 rpm for 30 minutes at room temperature. The RNA in the
sample was digested with 30 μl of deionized water-RNase solution (10 mg/ml RNase,
Sigma, Ireland Ltd) for 30 minutes at 37°C. The DNA was loaded and electrophoresed
on 1.2% agarose gel (Vivantis, UK) containing 0.5 μg/ml of ethidium bromide
(Invitrogen, Canada). DNA fragments were visualized under UV light using UV
transilluminator (Vilbert loumat, France) at 312 nm and photographed using Olympus
C-5060 camera.
2.7 Necrosis Assay
The leakage of LDH enzyme from damaged membrane cells may indicate for
late stages of apoptosis or necrosis (Edinger & Thompson, 2004). The measurement of
LDH levels in Phyllanthus treated cells was determined by CytoTox-One Homogenous
Membrane Integrity Assay kit (Promega, USA). Cancer cells (MeWo and PC-3) were
seeded at 1x10⁴ cells per well in black-coloured 96-wells flat bottom plate and
incubated for overnight. The cells were treated with respective IC50 value of

80
Phyllanthus extract for 72 hours. The negative control wells were cell with culture
medium only whereas blank wells contained culture medium. The CytoTox-One reagent
containing diaphorase was added into cells and incubated at room temperature for 10
minutes. The generated fluorescence signal indicated LDH activity was measured at an
excitation wavelength of 560 nm and an emission wavelength of 640 nm by using
GloMax Multi Detection System (Promega, USA). The LDH levels were presented as
the mean of three independent experiments conducted in triplicate manner.
Percentage of LDH level
= [Mean RFU of the tested cells – Mean RFU of the medium]
[Mean RFU of the untreated cells – Mean RFU of the medium]
Where,
RFU = Relative Fluorescence Units
2.8 Anti-Metastasis Assays
Cell migration is defined as the movement of cells from one area to another in
response to chemoattractant and it is one of the important phenotype changes in cancer
cells during metastasis (Zetter, 1998). Cell invasion is similar to cell migration except in
cell invasion; the cells have to invade through an extracellular matrix (ECM) barrier by
enzymatically degrading this barrier in order to become established in a new site
(Weidner et al., 1991). Besides cancer cells, endothelial cells migration is essential
during tumour-induced angiogenesis. During angiogenesis, endothelial cells migrate
from existing vessels, invade surrounding tissue into new areas, proliferate and
assemble into new capillaries that supply oxygen and nutrients to tumour mass
(Delgado et al., 2011). The transwell migration/invasion assay is a commonly used
assay to study the migratory/invasion response of cell to chemical signals. This assay is
X 100%
81
also known as the Boyden or modified Boyden chamber assay. Migration and invasion
assays were performed using transwell filter culture plate, which has an upper chamber
containing polycarbonate filters of 8.0 µm pore size (Corning, USA). The wound
healing assay was performed to confirm findings from transwell migration assay. The
anti-metastatic effect of Phyllanthus in cancer cells (MeWo and PC-3) and HUVECs
was studied in terms of migration, invasion and adhesion.
2.8.1 Transwell Migration assay
Both cancer (MeWo and PC-3, 2.5x10⁵ cells/well) and HUVECs (2x10
5
cells/well) were seeded in 6-wells plate and incubated overnight. After incubation, the
cells were treated with various concentrations of Phyllanthus extracts (31.3-500.0
µg/ml) for 72 hours. After 72 hours, pre-treated cells were suspended with serum-free
culture media and added to the upper chamber and the lower chamber was filled with
culture media supplemented with chemoattractant (10% FBS for cancer cells and 10
ng/ml of VEGF (Sigma-Aldrich, Ireland Ltd) for HUVECs). After 12 hours incubation
at 37°C, the cells at the upper side of the upper chamber filter were removed using a
cotton-tipped swab. The cells at the lower chamber were fixed with methanol and
stained with 0.5% crystal violet. The migrated cells were examined under the light
microscope (Olympus BX41) and were photographed with Olympus U-CMAD3
camera. Number of cells at the lower side of the upper chamber was calculated in five
random fields under 100X magnification.
Percentage of Migrated Cells
= [Total number of treated (migrated) cells]
[Total number of untreated (migrated) cells]
X 100%

82
2.8.2 Transwell Invasion assay
For invasion assay, the same protocol was performed as migration assay with the
exception that the filter surface of upper chamber was coated with (1) 10.0 mg/ml of
extracellular matrix (ECM) (Sigma-Aldrich, Ireland Ltd) for cancer cells (MeWo and
PC-3) and (2) 50.0 µg/ml of fibronectin (Roche, Germany) for endothelial cells
(HUVECs). Both cancer (MeWo and PC-3, 2.5x10⁵ cells/well) and HUVECs (2x10
5
cells/well) were seeded in 6-wells plate and incubated overnight. After incubation, the
cells were treated with various concentrations of Phyllanthus extracts (31.3-500.0
µg/ml) for 72 hours. After 72 hours, pre-treated cells were collected, suspended with
serum-free culture media and added to the upper chamber while the lower chamber was
filled with culture media supplemented with chemoattractant (10% FBS for cancer cells
and 10 ng/ml of VEGF for HUVECs). After 12 hours incubation at 37°C, the cells at the
upper side of the upper chamber filter were removed by using a cotton-tipped swab. The
cells at the lower side of the upper chamber were fixed with methanol and stained with
0.5% crystal violet. The invaded cells were examined under the light microscope and
were photographed with Olympus U-CMAD3 camera. Number of cells at the lower side
of the upper chamber was calculated in five random fields under 100X magnification.
Percentage of Invaded Cells
= [Total number of treated (invaded) cells]
[Total number of untreated (invaded) cells]
2.8.3 Wound healing assay
The wound migration assay is a simple and inexpensive method which allows
dual studies; cancer cell migration and cell-cell interactions. This assay was performed
X 100%

83
to confirm previous findings in transwell migration assay and allows investigation of
cancer cell-cell interaction after Phyllanthus treatment. Cancer cells (MeWo and PC-3)
were seeded at 1.0x10⁵ cells per well in a 24-wells plate (Corning, USA) and cultured
until sub-confluence (80-90%). The cells were washed with PBS before substitution of
serum free media. After 24 hours, the plates were scraped firmly with the tip of a
disposable pipette to generate an acellular 1-mm-wide lane per well, known as denuded
zone or wound on the cell monolayer. After washed with sterile PBS, cells were further
incubated with various concentrations of Phyllanthus extract for 24 hours for PC-3 cells
and 48 hours for MeWo cells at 37°C. At the end of incubation time, the cells were
photographed (Olympus µ1040) and the numbers of migrated cells into the denuded
zone were calculated using ImageJ software. At least five different random fields were
quantified for cell migration.
Percentage of Migrated Cells Acrossed into the Denuded Zone
= [Total number of treated migrated cells]
[Total number of untreated migrated cells]
2.8.4 Cancer Cell (Cell-Matrix) Adhesion assay
The interaction of cancer cells with extracellular matrix (ECM) proteins such as
fibronectin, laminin and collagen is important to enables cancer cells to adhere, invade
and metastasize (Hay, 1991). Disruption of these interactions could halt cancer
progression. Cell-matrix adhesion assay was performed to study the interaction of PC-3
cells to type-IV collagen and MeWo cells to fibronectin after treatment with
Phyllanthus extracts. Ninety-six-well plate was pre-coated with adhesion molecules; (1)
50 µg/ml of type-IV collagen (Sigma-Aldrich, Ireland Ltd) for PC-3 cells and (2) 50
X 100%

84
µg/ml of fibronectin for MeWo cells, for 2 hour at 37°C. The pre-coated paltes were
incubated with 1% bovine serum albumin (BSA) (Sigma-Aldrich, Ireland Ltd) to block
nonspecific binding, for an hour prior to the experiment. The Phyllanthus-treated and
untreated cancer cells were harvested, suspended into new media and seeded into the
pre-coated plates and incubated for an hour at 37°C. The non-adherent cells were then
removed with two washes of sterile PBS. The number of adhered cells was then
quantified with CellTiter 96® AQueous Non-Radioactive Cell Proliferation Assay kit
(Promega, USA). Background values of the seeded cells with fibronectin (for MeWo
cells) and type-IV collagen (for PC-3 cells) was subtracted from with the wells coated
with adhesion molecule alone (blank).
Percentage of Adherent Cells
= [Mean OD of the test cells – Mean OD of the blank]
[Mean OD of the untreated cells – Mean OD of the blank]
2.8.5 Tumour Transendothelial Migration Assay
Adhesion and migration of tumour cells on and across the vascular endothelium,
known as transendothelial migration is a critical step of the metastatic cascade (Lee et
al., 2003b). This cascade step was studied via the transendothelial migration assay.
Fibronectin (50 µg/ml) was pre-coated onto the upper chamber of transwell plate for 2
hours at 37°C. HUVECs (5x10⁴ cells/well) were then added onto the fibronectin-coated
chamber and cultured for 72 hours to allow formation of cell monolayer. Pre-treated
cancer (MeWo and PC-3) cells were suspended in serum-free media and were added
onto HUVECs monolayer and allowed to incubate for 16 hours before analysis of
transmigration. The lower chamber was filled with growth culture media with 10% FBS
X 100%

85
used as chemoattractant. The cells on the upper side of the upper chamber filter were
removed by cotton-tipped swab. The cells at lower side of the upper chamber were fixed
and stained with 0.5% crystal violet as previously described and were examined under
the light microscope (Olympus BX41) and photographed with Olympus U-CMAD3
camera. Number of transendothelial migrated cancer cells was calculated from five
random fields under 100X magnification.
Percentage of Transendothelial Migrated Cells
= [Total number of treated transendothelial migrated cells]
[Total number of untreated transendothelial migrated cells]
2.8.6 Gelatin and casein Zymographies
Matrix metalloproteinases (MMPs) are involved in the degradation of
extracellular matrix (ECM) during the tumour angiogenesis and metastasis (Zetter,
1998). MMPs can be analysed with substrate zymography techniques depending on the
degradation of their preferential substrate (Cockett et al., 1998). The activities of MMP-
2 and MMP-9 were assessed by gelatin zymography and MMP-7 by casein
zymography.
Cancer cells (MeWo and PC-3) cells and HUVECs were pre-treated with various
concentrations of Phyllanthus extracts (31.3-500.0 µg/ml) for 72 hours. After 72 hours,
pre-treated cells were washed twice with sterile PBS and incubated with serum-free
culture media for 48 hours. Supernatant was collected and centrifuged at 1,500 rpm for
20 minutes at 4°C to remove cellular debris. The supernatant was collected and stored at
-80°C until further analysis. Mixture of supernatant and sample buffer (0.5 M Tris-HCI
(pH 6.8), 50% glycerol, 10% SDS and 0.1% bromophenol blue) in ratio 1:1 were loaded
and electrophoresis was conducted under non-reducing conditions on 10% SDS
X 100%

86
polyacrylamide separating gel containing 0.1% gelatin (for gelatin zymography) or
0.2% of casein (casein zymography). For casein zymography, the gel was
electrophoresed twice; first without any samples to remove the excess casein and the
second was loaded with samples. After electrophoresis, the gels were washed with 2.5%
Triton-X100 for 1 hour to remove SDS. Subsequently, the gels were incubated in
renaturing buffer (50 mM Tric-HCI, pH 6.8; 200 mM NaCI2; 5 mM CaCI2) for 16 hours
at 37°C. The gels were stained with 0.5% Coomasie Blue for 1 hour at room
temperature and then destained with destaining solution (Methanol: acetic acid: water;
2:1:7) until proper contrast was achieved. The detected MMPs bands were measured
using ImageJ software and the percentage of MMP activitiy was determined using
following formula.
Percentage of MMP activity
= [Mean of treated band intensity]
[Mean of untreated band intensity]
2.9 In vitro anti-angiogenesis assay – ECM gel-induced capillary tube formation
The extracellular matrix (ECM) gel-induced capillary tube formation assay is
one of the most widely used in vitro assays to mimic the reorganization phase of
angiogenesis. This assay measures the ability of endothelial cells to form capillary-like
tube structures, with the support of extracellular matrix. The resulting tubes will
eventually form hollow lumens and become guidance pathways that facilitate tumour
cell metastasis (Akhtar et al., 2002). Thus, ECM gel-induced capillary tube formation
assay was used to assess the anti-angiogenic effects of Phyllanthus extracts. The
extracellular matrix (ECM) gel is derived from Engelbreth Holm-Swarm mouse
sarcoma and contains various proteins such as laminin, collagen, heparan sulfate
X 100%
87
proteoglycan, entactin and other minor components (Sigma-Aldrich, Ireland Ltd).
Extracellular-matrix was coated onto sterile 24-well culture plates prior the experiment.
Two hundred microliter of ECM (10 mg/ml) was added into each well of a 24-well plate
and incubated for 2 hours prior to the experiment.
HUVECs were seeded (2x10⁵ cells/well) at 6-wells plate for overnight. After
incubation, HUVECs were treated with different concentrations of Phyllanthus extracts
(31.3-500.0 µg/ml) and further incubated for 72 hours. Phyllanthus-treated and
untreated HUVECs were harvested and seeded into the ECM-coated 24-well culture
plate at concentration of 1x10⁴ cells/well and incubated for 16 hours. The formation of
microcapillary-like tube structures by HUVECs on ECM gel were observed and
photographed (Olympus µ1040) after 16 hours under a phase contrast microscope. The
complete formations of microcapillary-like tubes were counted using ImageJ software
and percentage of microcappillary-like tubes formed according to following formula.
Percentage of Microcapillary-like Tubes Formed
= [Total number of micro-capillary tubes formed in treated cells]
[Total number of micro-capillary tubes formed in untreated cells]
2.10 Molecular Mechanisms of Anti-carcinogenic Properties of Phyllanthus
extracts
2.10.1 Dual luciferase pathway reporter transient transfection
Many vital biological processes including uncontrolled proliferation, metastasis,
angiogenesis and inhibitions of apoptosis, are tightly regulated by complex signalling
networks and signal transduction in cancer cells to ensure its malignancy. Ten different
X 100%

88
cancer-related pathways were studied using the Cignal Finder 10-Pathway Reporter
Arrays (SA Biosciences, QIAGEN, USA).
Reverse transfection protocol was implemented for this assay. Prior to
transfection, 2 µl of Lipofectamine® 2000 transfection reagent (Invitrogen, USA) was
diluted into 25 µl of Opti-MEM® Reduced Serum Media and incubated for 5 minutes.
Meanwhile, 100 ng of plasmid construct of transcription factor-responsive reporter of
each pathway and control were mixed with 25 µl of Opti-MEM® Reduced Serum Media
(Invitrogen, USA). After 5 minutes, the diluted plasmid construct of each pathway and
control were mixed with diluted Lipofectamine® 2000 in ratio 1:1 and further incubated
for 20 minutes at room temperature. Meanwhile, cancer cells (MeWo and PC-3) were
washed with PBS, trypsinized with trypsin-EDTA (0.25%) and resuspended to 4x10⁵
cells/ml in Opti-MEM® containing 5% of fetal bovine serum and 1% NEAA. After the
20 minutes incubation time, 50 µl of transfection cocktail was added to 4x10⁴ cells/well
and further incubated for 16 hours at 37°C. After transfection, the old media was
discarded and the transfected cells were treated with Phyllanthus extracts at their
respective IC50 values in complete growth medium (MEM supplemented with 10%
FBS, 0.1 mM NEAA, 1 mM sodium pyruvate, 100 U/ml penicillin and 100 μg/ml
streptomycin) and further incubated for another 24 hours. Each transfection condition
was carried out in triplicate.
Each of the pathways/reporters consist an inducible transcription factor
responsive firefly luciferase reporter and constitutively expressing Renilla construct.
Renilla construct is to act as an internal control for normalizing transfection efficiencies
and monitor cell viability. After 24 hours of Phyllanthus treatment, the changes in
expression of each pathway were determined by measuring the generated firefly and
Renilla luminescent signals using the Dual-Glo Luciferase Assay system (Promega,
Madison, WI) on Glomax machine (Promega, USA). The fold changes of each

89
reporter’s expression between Phyllanthus-treated and untreated cells were calculated
from the relative luciferase units, generated from the firefly/Renilla luciferase activity
ratio.
2.10.2 Western Blot Analysis
After identifying the cancer-related pathways altered by Phyllanthus in cancer
cells (MeWo and PC-3), the underlying molecular mechanism was investigated. The
intracellular signalling molecules in MAPK (pan-Ras, c-Raf, Elk, RSK, c-Jun, JNK1/2,
Akt and p38), Wnt (GSK3β, β-catenin and DSH), Myc/Max and Hypoxia (c-myc, HIF-
α, and VEGF) and NFκB (p50 and p52) pathways as well as apoptotic (Bcl-2 and Bax)
proteins were chosen for western blot analysis to determine their expression upon
Phyllanthus treatment in cancer cells. All these antibodies were purchased from Merck
(USA).
Cancer cells were cultured in 25 cm2 culture flask until 80-90% confluency. The
old medium was discarded and treated with respective IC50 value of Phyllanthus
extracts and incubated for 72 hours. After 72 hours, the floating and trypsin-detached
treated cells were collected and spun down at 1,500 rpm for 5 minutes. The cell pellet
was lyzed with lysis buffer on ice for 30 minutes. Supernatant was collected after
centrifuged at 12,000 rpm for 10 minutes at 4C° to remove cellular debris, and kept at -
80°C until further analysis.
Total amount of proteins was determined as described in section 2.11.1, prior to
the experiment. Twenty micrograms of protein lysates were mixed with sample buffer
in ratio 1:1 and resolved on a 12% SDS-PAGE gels. After electrophoresis, proteins
were transferred onto nitrocellulose membranes. Nonspecific binding of the membrane
was blocked with Tris-buffered saline (TBS) containing 5% (w/v) nonfat dry milk and
0.1% (v/v) Tween-20 (TBST) for 2 hours. Membranes were washed with TBST for

90
three times, each with 10 minutes and incubated with appropriate dilution of specific
primary antibodies overnight at 4°C. Subsequently, the membranes were washed with
TBST and incubated with appropriate secondary antibodies (horseradish-conjugated
goat anti-mouse or anti-goat IgG) for 1 hour. Membranes were washed three times with
TBST for 10 minutes; and the band was visualized after incubation with chromogenic
substrate containing 4-chloro-1-napthol and hydrogen peroxide. Reaction was stopped
by washing with distilled water. The membrane was then scanned and ImageJ software
was used to measure the band intensity.
Percentage of protein expression
= [Mean of treated band intensity]
[Mean of untreated band intensity]
2.11 2-Dimensional Gel Electrophoresis for Protein Identification
2.11.1 Sampel Preparation and Protein Quantification
Total proteins were extracted from untreated and treated groups by incubation
with lysis buffer on ice for 30 minutes. The protein pellet was re-solubilized in
rehydration solution (8 M urea, 2% CHAPS, 40 mM DTT, 0.5% IPG buffer pH 3-
11NL, bromophenol blue) and kept at -80°C until further analysis. Total amount of
proteins was determined using 2-D Quant kit (GE Healthcare Bio-Sciences, USA). This
assay is based on the specific binding of copper ions to protein. The colour intensity is
directly proportional to the protein concentration. The working colour reagent was
prepared by mixing colour reagent A and B in ratios 1:100.
X 100%

91
Table 2:1: Standard curve for protein quantification
Tube number 1 2 3 4 5 6
Volume of 2 mg/ml
0 µl 5 µl 10 µl 15 µl 20 µl 25 µl BSA standard solution
Protein quantity 0 µg 10 µg 20 µg 30 µg 40 µg 50 µg
Six tubes were prepared accoding to Table 2.1 to construct a standard curve for
protein quantification. Meanwhile, 10 µl of tested sample was aliquoted into a tube and
labelled as sample tube. Five hundred microliters of precipitant was added into each
standard and sample tube, and incubated for 2-3 minutes at room temperature. Five
hundred microliter of co-precipitant was added into each tube. Tubes were then
centrifuged at 10,000xg for 5 minutes and supernatant was completely removed. Five
hundred microliters of diluted copper solution was added into each tube to dissolve the
protein pellet. Working colour reagent was prepared by diluting concentrated copper
solution into de-ionized water in ratios 1: 4. One milliliter of working colour reagent
was added to each tube and mixed. The tubes were then allowed to stand at room
temperature for 15 minutes. One hundred microliters of samples was transferred into a
well of 96-wells flat bottom plate. At least three replications of each sample were
prepared and absorbance was read at 480 nm. A standard curve for absorbance of the
standard against protein amount was generated and used to determine the protein
amount in sample.
2.11.2 First and Second Dimensional Separation
A total of 500 mg of total proteins were rehydrated into 13 cm immobilized pH
gradient (IPG) strips (pH 3-11 nonlinear) (GE Healthcare, USA). The first dimension
was run on the IPGphor III machine (GE Healthcare, USA) at 20°C with the following

92
settings: step 1 at 500V for 1 hour; step 2 at 500-1000V for 1 hour; step 3 at 1000-
8000V for 2.5 hours, and step 4 at 8000V for 0.5 hour.
Upon completion of first dimensional separations, the strip was equilibrated as
following; first reduction with 64.8 mM of dithiothreitol-SDS equilibration buffer (50
mM Tris-HCl [pH 8.8], 6 M urea, 30% glycerol, 2% SDS, 0.002% bromophenol blue)
for 15 minutes, followed by alkylation with 135.2 mM of iodoacetamide-SDS
equilibration buffer for another 15 minutes. The second dimension electrophoresis was
performed by electrophoresing the samples in 12.5% SDS acrylamide gels by using the
SE600 Ruby system (GE Healthcare) at 25°C in an electrode buffer (25 mM Tris, 192
mM glycine, and 0.1% [wt/vol] SDS) with the following settings: step 1 at 100V/gel for
45 minutes; step 2 at 300V/gel until the run is completed. After electrophoresis, the gels
were fixed with destaining solution for 30 minutes, followed by staining with hot
Coomasie blue for 30 minutes. Lastly, the gels were scanned using Ettan DIGE Imager
(GE Healthcare). Gel images were analyzed using PDQuest 2-D Analysis Software
(Bio-Rad, USA) and only protein spots which showed significant differences (more
than 1.0 fold) were selected for mass spectrometry analysis.
2.11.3 Protein Digestion, Desalting and MALDI-TOF/TOF Analysis
The significant protein spots were manually excised from polyacrylamide gels
and were kept in sterile 1.5 ml eppendorf tubes. Excised spots (gel plugs) were washed
with destaining solution (50% Acetonitrile (ACN) in 50 mM NH4HCO3) until the gel
plugs are clear. The destaining solution was discarded and the gel plugs were then
incubated with reducing solution (100 mM ammonium bicarbonate (NH4HCO3)
containing 10 mM dithiothreitol (DTT)) for 30 minutes at 60°C. Then, the gel plugs
were alkylated with 100 mM NH4HCO3 containing 55 mM iodoacetamine for 20
minutes in the dark and followed with three times washing with 50% acetone in 100
93
mM NH4HCO3 for 20 minutes each. The gel plugs were rehydrated with 100% ACN
and dried in speed vacuum concentrator (Savant SpeedVac®, Thermo Scientific, USA).
In-gel digestion using trypsin gold (Promega, Mass Spectrometry Grade) in 50 mM
NH4HCO3 was added into gel plug and incubated overnight in 37°C. Proteins were
extracted from gel plugs and purified by Ziptip (Ziptip C18, Millipore, Bedford, MA,
USA). The eluted proteins were mixed with MATRIX solution and spotted on MALDI
plate using dry droplet method and analysed using Ab Sciex Tof/TofTM
instruments.
The generated peptides were blasted with MASCOT Search Algorithm (Version 2.1.0)
to identify the possible proteins.
2.12 Statistical analysis
From all the experiments, results were expressed as mean ± standard error
(SEM) of data obtained from three independent experiments using SPSS software
(version 16). The Student t-test, followed by Dunnett’s test were used where values of
*p<0.05 and **p<0.01 were considered significant.

94
CHAPTER 3: RESULTS
3.1 Identification of Bioactive Compounds
The bioactive compounds in both aqueous and methanolic extracts of four
species of Phyllanthus plant were identified by subjecting the extracts to HPLC (High
Performance Liquid Chromatography) analysis coupled with photodiode array (PDA)
and MS/MS detection. Twelve main bioactive compounds were identified based on
their retention time, UV spectra, parent mass spectra and secondary fragmentation
patterns. These bioactive compounds are comprised of ten water-soluble compounds
and four methanol-soluble compounds (Table 3.1).
In aqueous crude extracts of Phyllanthus, all the species consist of at least eight
bioactive compounds and seven of them are identical; gallic acid,
galloylglucopyronoside, corilagen, geraniin, rutin, quercetin glucoside and caffeolquinic
acid. Among these identified bioactive compounds, geraniin is the only compound
which can be found in both aqueous and methanolic extracts (Table 3.1). P.urinaria
contains the highest number of bioactive compounds, followed by P.watsonii, P.amarus
and P.niruri.

95
Table 3:1: Bioactive compounds in aqueous and methanolic extracts of Phyllanthus
species (P.A: P.amarus, P.N: P.niruri; P.U: P.urinaria and P.W: P.watsonii) (Tang et
al., 2010).
Compound Retention
time
[M-H]
m/z
MS-MS
Fragment-
ation
Phyllanthus species
Aq
ueo
us
extr
act
Gallic acid 3.8 169 125,169 P.A, P.N, P.U, P.W
Galloyl-
glucopyronoside
2.8 331 125,169,211,
271
P.A, P.N, P.U, P.W
Corilagen 18 633 301, 125, 169 P.A, P.N, P.U, P.W
Geraniin 22 951 301, 125,
169, 463
P.A, P.N, P.U, P.W
Rutin 26 609 301, 179,151 P.A, P.N, P.U, P.W
Quercetin
glucoside
27 463 301, 179,151 P.A, P.N, P.U, P.W
Caffeolquinic acid 23 353 191 P.A, P.N, P.U, P.W
Digalloyl-
glucopyronoside
15.0 483 125,169,211,
271, 313
P.A, P.N, P.W
Quercetin
rhamnoside
30 447 301, 151 P.U, P.W
Trigalloyl-
glucopyronoside
23
635 125,169,211,
271, 313,465
P.U
Met
han
oli
c ex
tra
ct Geraniin 12 951 301, 125,
169, 463
P.A, P.N, P.U, P.W
Trigalloyl-
glucopyronoside
13 635 125,169,211,
271, 313,465
P.U
Tetragalloyl-
glucopyronoside
15 787 169,211, 313,
465
P.U
Quercetin
diglucoside
9 625 463, 301 P.N
96
3.2 Anti-proliferative effect of Phyllanthus extracts, fractions and standard
anticancer drugs on growth of cells
The MTS assay was used to investigate the potential anti-proliferative
(cytotoxic) effect of Phyllanthus’ crude extracts and their fractions on different cancer
(MeWo and PC-3) and normal cells (RWPE-1, CCD-1127Sk and HUVECs), where the
cells were treated at different concentrations ranging 31.3 to 500.0 µg/ml for 72 hours.
In this study, two standard anticancer drugs namely, 5’Flurouracil (5’FU) and
Doxorubicin (Dox) were used as positive controls.
3.2.1 Human melanoma (MeWo) cells
For aqueous extracts, the IC50 values were in the range of 160.0-260.0 µg/ml and
56.2-153.3 µg/ml for methanolic extracts of Phyllanthus. As presented in Table 3.2,
methanolic extracts showed stronger anti-proliferative effect on MeWo cells, as their
IC50 values were lower than aqueous extracts. P.urinaria showed the strongest anti-
proliferative effect on MeWo cells with the lowest IC50 value at 160.0 µg/ml (p<0.05)
for aqueous and 56.2 µg/ml (p<0.05) for methanolic extracts. As compared to standard
anticancer drugs, both 5’Fluorouracil and doxorubicin showed much stronger anti-
proliferative effect on both MeWo and normal skin cells (CCD-1127Sk) with an IC50
values of 2.5 µg/ml (p<0.05) and 1.0 µg/ml (p<0.05), respectively.
Fractions (fraction 1 and 2) of crude aqueous extract of Phyllanthus were also
evaluated for its cytotoxicity. The IC50 values of fraction 1 of P.niruri, P.urinaria and
P.watsonii were in the range of 433.0–460.0 µg/ml on MeWo cells, and P.amarus did
not show any anti-proliferative effect. On the other hand, fraction 2 of all Phyllanthus
species exhibited lower IC50 values (220.0-240.0 µg/ml) as compared to fraction 1. Both
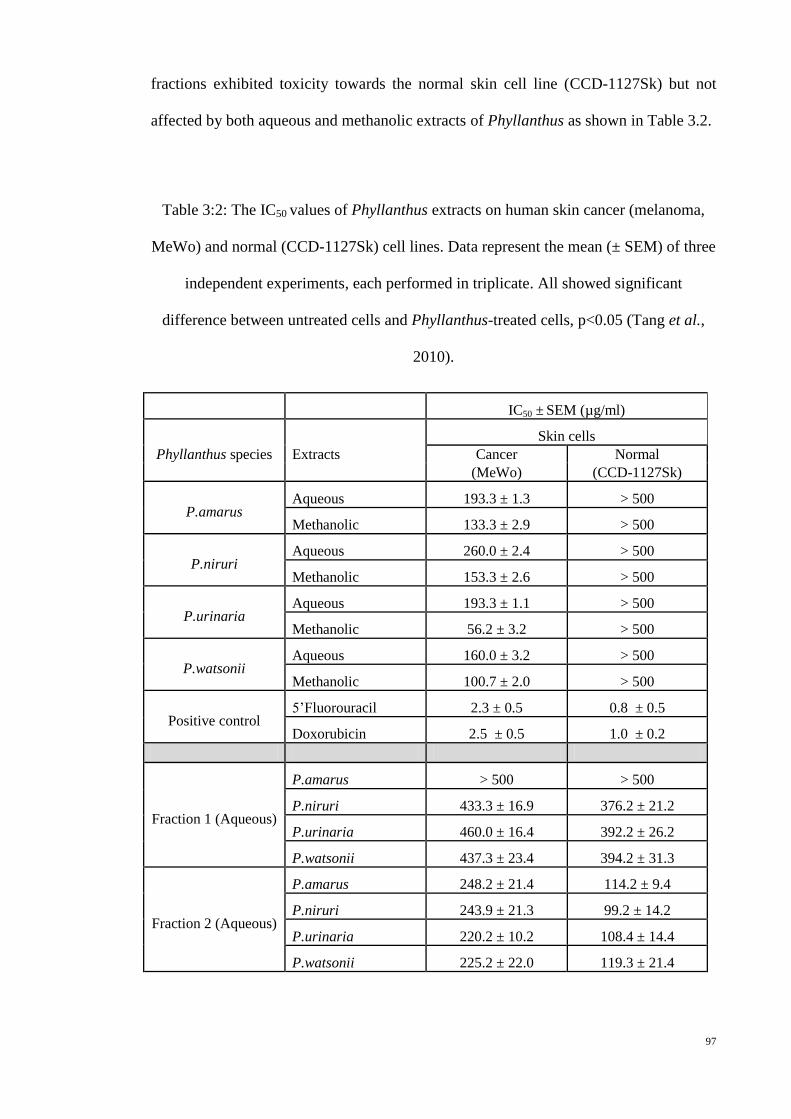
97
fractions exhibited toxicity towards the normal skin cell line (CCD-1127Sk) but not
affected by both aqueous and methanolic extracts of Phyllanthus as shown in Table 3.2.
Table 3:2: The IC50 values of Phyllanthus extracts on human skin cancer (melanoma,
MeWo) and normal (CCD-1127Sk) cell lines. Data represent the mean (± SEM) of three
independent experiments, each performed in triplicate. All showed significant
difference between untreated cells and Phyllanthus-treated cells, p<0.05 (Tang et al.,
2010).
IC50 ± SEM (µg/ml)
Phyllanthus species Extracts
Skin cells
Cancer Normal
(MeWo) (CCD-1127Sk)
P.amarus Aqueous 193.3 ± 1.3 > 500
Methanolic 133.3 ± 2.9 > 500
P.niruri Aqueous 260.0 ± 2.4 > 500
Methanolic 153.3 ± 2.6 > 500
P.urinaria Aqueous 193.3 ± 1.1 > 500
Methanolic 56.2 ± 3.2 > 500
P.watsonii Aqueous 160.0 ± 3.2 > 500
Methanolic 100.7 ± 2.0 > 500
Positive control 5’Fluorouracil 2.3 ± 0.5 0.8 ± 0.5
Doxorubicin 2.5 ± 0.5 1.0 ± 0.2
Fraction 1 (Aqueous)
P.amarus > 500 > 500
P.niruri 433.3 ± 16.9 376.2 ± 21.2
P.urinaria 460.0 ± 16.4 392.2 ± 26.2
P.watsonii 437.3 ± 23.4 394.2 ± 31.3
Fraction 2 (Aqueous)
P.amarus 248.2 ± 21.4 114.2 ± 9.4
P.niruri 243.9 ± 21.3 99.2 ± 14.2
P.urinaria 220.2 ± 10.2 108.4 ± 14.4
P.watsonii 225.2 ± 22.0 119.3 ± 21.4

98
3.2.2 Human Adenocarcinoma (PC-3) cells
Aqueous extracts of Phyllanthus, exhibited IC50 values in the range of 155.0-
178.3 µg/ml (p<0.05), while for the methanolic extracts, the IC50 values were at ranged
54.2-117.7 µg/ml (p<0.05) (Table 3.3). In comparison, methanolic extracts showed
stronger anti-proliferative effect on PC-3 cells as their IC50 value were lower than that
of aqueous extracts. Overall, P.urinaria showed the strongest anti-proliferative effect on
PC-3 cells as compared to other Phyllanthus species. Both 5’Fluorouracil and
doxorubicin showed stronger anti-proliferative effect than Phyllanthus on PC-3 and
normal prostate cells (RWPE-1) with IC50 values of 2.5 µg/ml (p<0.05) and 1.0 µg/ml
(p<0.05), respectively.
Semi-purification of crude aqueous extract of Phyllanthus yielded two fractions
(fraction 1 and 2). Both fractions were evaluated for their cytotoxicity on PC-3 and
RWPE-1 cell lines. The IC50 values of fraction 1 for P.niruri, P.urinaria and P.watsonii
were in the range of 456.0–497.7 µg/ml, but undetected in P.amarus-treated cells. On
the other hand, the IC50 values of fraction 2 for all Phyllanthus species were lower
compared to fraction 1 which at ranged 185.4–228.4 µg/ml. The normal prostate cell
line (RWPE-1) was affected by fraction 1 and 2 but not affected by both aqueous and
methanolic extracts of Phyllanthus as shown in Table 3.3.

99
Table 3:3: Cytotoxicity (IC50 ± SEM) values of Phyllanthus extracts on human prostate
adenocarcinoma (PC-3) and normal (RWPE-1) cell lines. Data represent the mean (±
SEM) of three independent experiments, each performed in triplicate. All showed
significant difference between untreated cells and Phyllanthus-treated cells, p<0.05
(Tang et al., 2010).
IC50 ± SEM (µg/ml)
Phyllanthus
species Extracts
Prostate cells
Cancer Normal
(PC-3) (RWPE-1)
P.amarus Aqueous 178.3 ± 2.8 > 500
Methanolic 84.3 ± 1.1 > 500
P.niruri Aqueous 155.0 ±1.2 > 500
Methanolic 117.7 ± 2.1 > 500
P.urinaria Aqueous 155.7 ± 2.1 > 500
Methanolic 54.2 ± 2.1 > 500
P.watsonii Aqueous 156.7 ± 2.4 > 500
Methanolic 100.5 ± 1.2 > 500
Positive control 5’Fluorouracil 1.0 ± 0.3 1.0 ± 0.5
Doxorubicin 2.5 ± 0.5 1.0 ± 0.1
Fraction 1
(Aqueous)
P.amarus > 500 > 500
P.niruri 483.3 ± 21.1 302.5 ± 21.2
P.urinaria 456.0 ±31.2 315.6 ± 13.2
P.watsonii 497.7 ±2 2.1 323.4 ± 17.6
Fraction 2
(Aqueous)
P.amarus 228.4 ± 9.4 108.4 ± 21.4
P.niruri 214.1 ± 12.5 116.2 ± 26.2
P.urinaria 185.4 ± 21.4 132.6 ± 25.7
P.watsonii 191.5 ± 13.0 115.2 ± 22.0

100
3.2.3 Human Umbilical Vein Endothelial Cells (HUVECs)
Endothelial cells play an important role in the development of new blood
vessels. The excessive proliferation and transformation of endothelial cells would lead
to pathological angiogenesis, which is described as one of the hallmarks of cancer. The
anti-proliferative effect of Phyllanthus extracts on HUVECs was exerted in the range of
125.0-500.0 µg/ml. However, Phyllanthus showed low cytotoxicity against HUVECs
was observed at the maximal dose of all extracts (both aqueous and methanolic) 500.0
µg/ml (Figure 3.1).
Figure 3.1: Anti-proliferative effect of Phyllanthus extracts on the growth of HUVECs.
Figure shows HUVECs were treated with various concentrations of Phyllanthus. Data
represent the mean (± SEM) of three independent experiments, each performed in
triplicate. The asterisk indicates a significant difference between untreated and
Phyllanthus-treated cells, *p<0.05.
101
3.3 Induction of Cancer Cell Cycle Arrest
Cell cycle is a biological process that involves a sequence of molecular events to
ensure correct transmission of the genetic material to subsequent generations. Defects in
cell cycle can lead to genetic modification (mutation) and hence develop uncontrolled
cell proliferation. An uncontrolled proliferation and the ability to evade apoptosis by
cancer cells are the hallmarks of cancer (Hanahan & Weinberg, 2011). Targeting the
cell cycle could be an approach for anticancer agents to halt the uncontrolled
proliferation of cancer cells and initiate them to undergo apoptosis.
The growth arrest on cell cycle and apoptotic induction by Phyllanthus extracts
on cancer (MeWo and PC-3) cells were assessed using propidium iodide DNA
incorporation with flow cytometry. Both MeWo and PC-3 cells were treated with
respective IC50 value of Phyllanthus extracts for 24, 48, 60 and 72 hours. Changes in the
distribution in cell cycle were observable by 24 hours after being treated with
Phyllanthus extracts for both cell lines.
3.3.1 S-phase arrest in human melanoma (MeWo) cells
Phyllanthus extracts exhibited anti-proliferative effect on MeWo cells by growth
arrest at the S-phase at 24 hours and remained evident after 72 hours of treatment. This
was accompanied by accumulation of cells in Sub-G1 (apoptotic cells) phase for both
aqueous and methanolic extracts (Figure 3.2). The percentage of apoptotic cells had
increased in a time-dependent manner from 1.8% at 24 hours to 6.1% at 72 hours as
compared to the untreated cells. Meanwhile, the percentage of cells at the S-phase of
treated MeWo cells was elevated to 15.0% above the controls at 72 hours of treatment.
Furthermore, the percentage of cells at Go/G1 and G2/M phases decreased with time
upon treatment with Phyllanthus extracts due to the fact that treated cells have been

102
arrested at S-phase and subsequently accumulated at Sub-G1 (apoptosis) phase.
However, the potency of Phyllanthus extracts to induce S-phase arrest was not as strong
as the standard anticancer drug (5’Fluorouracil), with a 22.1% difference at 72 hours
post treatment.
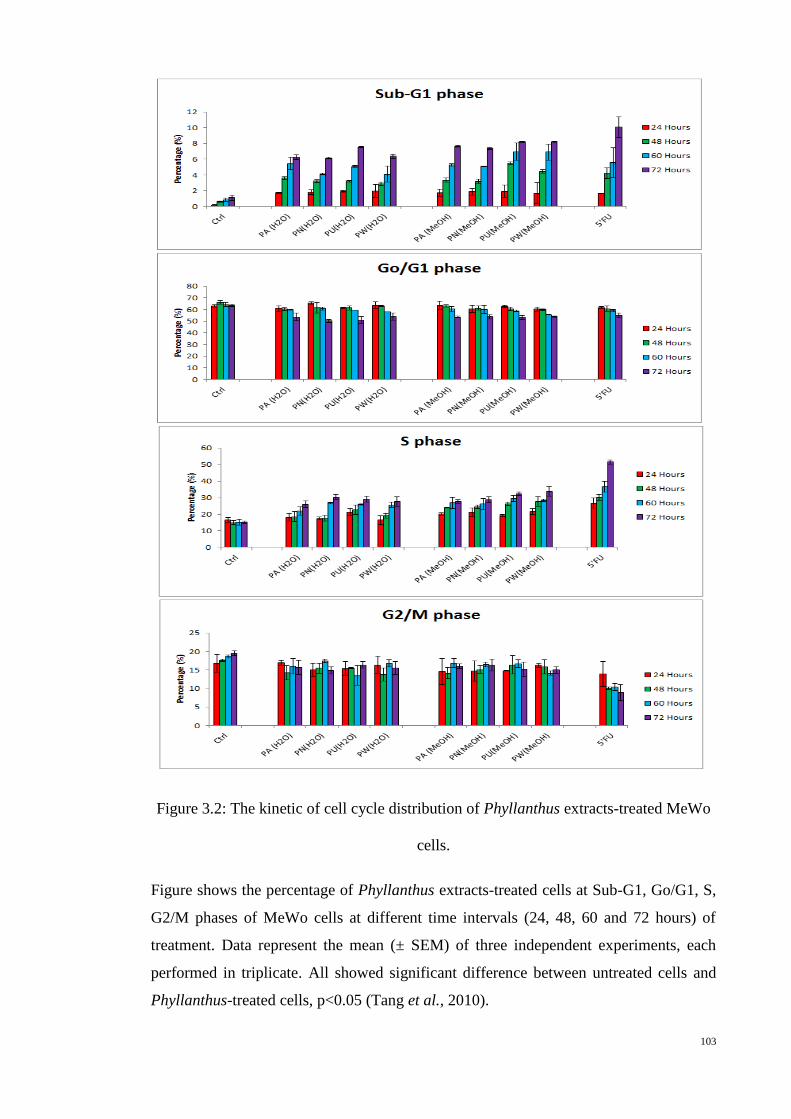
103
Figure 3.2: The kinetic of cell cycle distribution of Phyllanthus extracts-treated MeWo
cells.
Figure shows the percentage of Phyllanthus extracts-treated cells at Sub-G1, Go/G1, S,
G2/M phases of MeWo cells at different time intervals (24, 48, 60 and 72 hours) of
treatment. Data represent the mean (± SEM) of three independent experiments, each
performed in triplicate. All showed significant difference between untreated cells and
Phyllanthus-treated cells, p<0.05 (Tang et al., 2010).

104
3.3.2 G1-phase arrest in human prostate adenocarcinoma (PC-3) cells
Phyllanthus extracts exhibited anti-proliferative effect by disrupting the cell
cycle distribution of treated PC-3 cells and arresting them at the G1-phase with an
accumulation of apoptotic cells at the Sub-G1 (apoptosis) phase (Figure 3.3). The
accumulation of apoptotic cell was 3.4% at 24 hours increased up to 7.4% at 72 hours
(p<0.05), as compared to the untreated cells. The percentage of treated PC-3 cells at Go/
G1-phase was 13.7% at 24 hours and this has increased to 18.8% at 72 hours as
compared to the untreated cells (p<0.05). However, the percentage of treated-PC-3 cells
at the S and G2/M phases decreased with time of treatment due to the fact that treated
PC-3 cells were arrested at Go/G1 phase and subsequently accumulated at Sub-G1
phases. The standard drug, doxorubicin showed a G2/M phase arrest on PC-3 cells at 24
hours and remained evident after 72 hours of treatment.

105
Figure 3.3: The kinetic of cell cycle distribution of Phyllanthus extracts-treated PC-3
cells.
Figure shows the percentage of Phyllanthus extracts-treated cells at Sub-G1, Go/G1, S,
G2/M phases of PC-3 cells at different time intervals (24, 48, 60 and 72 hours) of
treatment. Data represent the mean (± SEM) of three independent experiments, each
performed in triplicate. All showed significant difference between untreated cells and
Phyllanthus-treated cells, p<0.05 (Tang et al., 2010).

106
3.4 Mechanism (s) of Cancer Cell Death
3.4.1 Phyllanthus induced Caspases-3/7 Activation
Activation of caspases (aspartate specific cysteine protease) is one of the
biochemical changes that occur during apoptosis. Caspase-3 and -7 were chosen to be
studied because they can be activated by both the death receptor and mitochondrial
pathways (Cohen, 1997). Furthermore, they are the major executor class of caspases and
both are essential for the induction of DNA fragmentation as well as apoptosis (Nagata,
2000). Phyllanthus extrcats induced caspases-3/7 activation in both PC-3 and MeWoc
ells. The levels of caspases-3/7 induced by Phyllanthus treatment were markedly
increased (3–4 folds) as compared to the control group (Figure 3.4) for both extracts of
Phyllanthus. The level of caspases-3/7 induced by standard drugs (5’Fluorouracil and
doxorubicin) in MeWo and PC-3 cells were 6-folds and 0.5-folds higher than control
group (untreated cells) and Phyllanthus-treated cells, respectively. These indicates that
apoptosis induced by Phyllanthus extracts was mediated via activation of caspases.

107
Figure 3.4: The level of caspases-3/7 in cells treated with Phyllanthus extracts and
standard drugs).
Figure shows the data represent the mean (± SEM) of three independent experiments,
each performed in triplicate. All showed significant difference between untreated cells
and Phyllanthus-treated cells, p<0.05 (Tang et al., 2010).
108
3.4.2 Phyllanthus induced DNA Fragmentation in Cancer Cells
Caspases activation is followed by DNA fragmentation (Nagata, 2000). Therefore,
early and late detections of DNA fragmentation in treated cancer cells were performed
with TUNEL assay and agarose gel electrophoresis, respectively.
3.4.2.1 TUNEL labeling of DNA Fragmentation
TUNEL (terminal deoxynucleotidyl transferase dUTP nick end labeling) assay is
a technique to allow detection of apoptotic cells by labelling the free end of apoptotic
DNA with a marker which can be visualized under light microscope. Apoptotic cells
were observed in Phyllanthus extracts-treated MeWo (Figure 3.5A, red arrow) and PC-3
(Figure 3.5B, red arrow) cells as brown-colour cells and its appearance was similar to
apoptotic cells were present in positive control, apoptotic-inductive anticancer drugs
(5’Fluorouracil and Doxorubicin). Viable cells were stained in blue colour.
The populations of cell death can be calculated and expressed in as an apoptotic
index. The percentage of apoptotic cells (AI) of treated-MeWo and PC-3 cells were
markedly increased up to 50% compared to the untreated cells (control group) at 72
hours of treatment with Phyllanthus extracts (p<0.05) (Figure 3.6). Only 8% difference
in AI values between Phyllanthus and standard drugs (p<0.05) were noted indicating
that the potential of causing apoptotic cell death by Phyllanthus was close to standard
anticancer drugs.

109
Figure 3.5: TUNEL analysis of MeWo and PC-3 cancer cells after treatment with
Phyllanthus extracts with magnification 100X.
Figure shows TUNEL-positive (apoptotic) cells were observable as brown staining cells
(red arrow) in Phyllanthus extract-treated (A) MeWo and (B) PC-3 cells and normal
viable cells stain as blue colour (Tang et al., 2010).

110
Figure 3.6: Percentage of apoptotic index (%) of untreated and treated (Phyllanthus
extracts and anticancer drugs) of MeWo and PC-3 cancer cells from TUNEL analysis.
Figure shows the data represent the mean (± SEM) of three independent experiments,
each performed in triplicate. All showed significant difference between untreated cells
and Phyllanthus-treated cells, p<0.05 (Tang et al., 2010).

111
3.4.2.2 DNA ladder formation
The late detection of DNA fragmentation in cells treated with Phyllanthus
extracts was studied using agarose gel electrophoresis. Analysis of DNA fragments in
apoptotic cells by agarose gel electrophoresis will produce a characteristic DNA ladder
which is described as biochemical hallmarks of apoptosis (Cohen, 1997; Nagata, 2000).
DNA content from Phyllanthus treated cells was extracted and electrophoresed
on agarose gel. The typical ladder DNA fragments were observed in Phyllanthus
extracts-treated MeWo (Figure 3.7A) and PC-3 (Figure 3.7B) cells on agarose gel under
a UV transiluminator. This similar pattern was seen with standard anticancer drugs,
which possess apoptotic induction, indicating the ability of Phyllanthus extracts to
induce apoptosis on MeWo and PC-3 cells.

112
Figure 3.7: Apoptotic DNA fragmentation was observable in Phyllanthus extracts-
treated (A) MeWo and (B) PC-3 cells.
Figure shows Lane 1 -4: aqueous extracts and Lane 6 – 9: methanol extracts for
P.amarus, P.niruri, P.urinaria and P.watsonii, orderly. Lane 5 and 10: 1kb DNA
marker, Lane 11: standard drugs, where (A) 5’Fluorouracil for MeWo and (B)
Doxorubicin for PC-3 cells. Lane 12: untreated cells (Tang et al., 2010).

113
3.4.3 Phyllanthus induced changes in membrane integrity by LDH release
One of the biochemical changes during necrosis is leakage of lactate
dehydrogenase (LDH) enzyme. The determination of necrotic-induction of Phyllanthus
was performed by measuring LDH levels in treated cancer cells by using CytoTox-One
Homogeneous Membrane Integrity Assay. This is a fluoremetric assay to allow
measurement of the release of LDH from cells with damaged membrane which is
associated with necrotic cell death (Loo & Rillema, 1998; Denecker et al., 2001). LDH
released into the culture medium was measured based on the conversion of resazurin
into resorufin through enzymatic activity.
3.4.3.1 LDH Levels in MeWo cells
In untreated cells, the LDH level was measured at 1.2% (p<0.05). However,
LDH levels were noticed to increase in MeWo cells after treatment with Phyllanthus
extracts (Figure 3.8). For aqueous extracts, the LDH levels in MeWo cells were induced
by P.niruri, P.urinaria and P.watsonii in the range from 8.5 to 9.0% (p<0.05) and 5.1%
by P.amarus (p<0.05). This indicates that the aqueous extracts of P.amarus possessed
the lowest necrotic effect among aqueous extracts in MeWo cells.
For methanolic extracts, the LDH leakage induced by P.amarus, P.urinaria and
P.watsonii ranged from 7.3 to 7.8%, and 8.3% by P.niruri (p<0.05). The methanolic
extract of P.niruri possessed strongest necrotic effect among the methanolic extracts on
MeWo cells. However, the percentage of LDH levels induced by 5’FU was much
stronger at 30.0% (p<0.05).

114
Figure 3.8: The percentage of LDH levels in treated and untreated MeWo cells.
Figure shows the LDH levels in the treated group was higher than the untreated
(control) group. Data represent the mean (± SEM) of three independent experiments,
each performed in triplicate. All showed significant difference between untreated cells
and Phyllanthus-treated cells, p<0.05 (Tang et al., 2010).
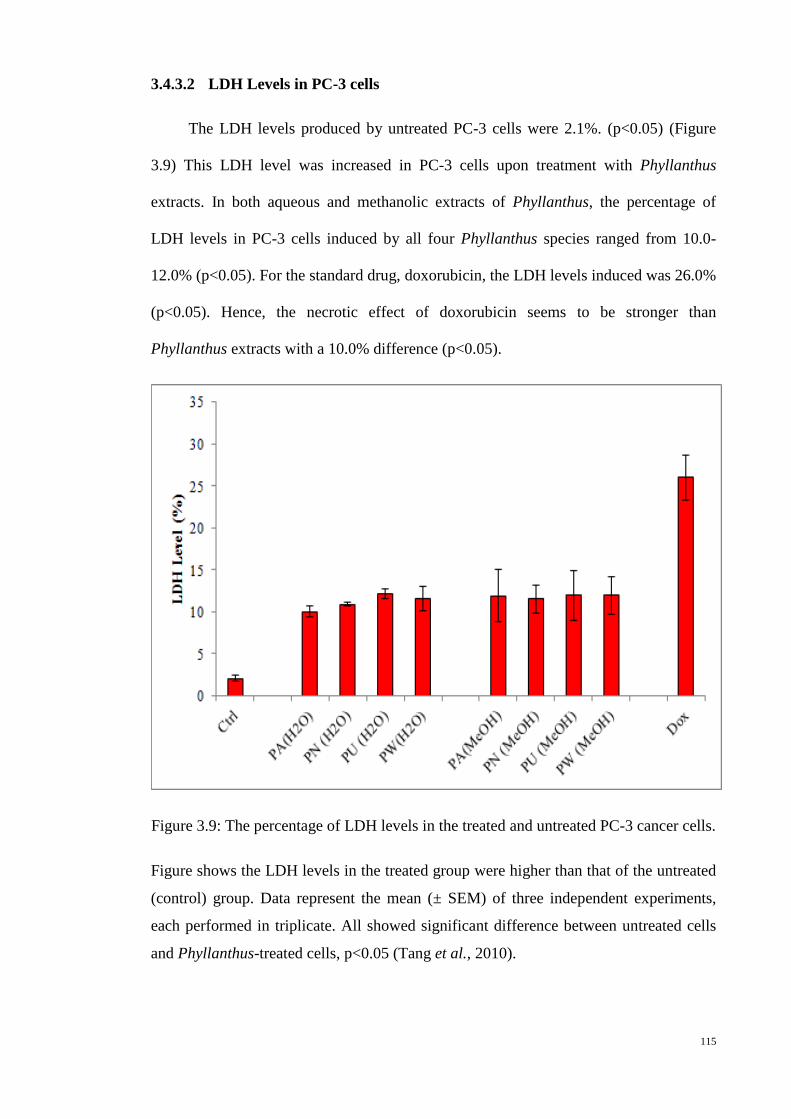
115
3.4.3.2 LDH Levels in PC-3 cells
The LDH levels produced by untreated PC-3 cells were 2.1%. (p<0.05) (Figure
3.9) This LDH level was increased in PC-3 cells upon treatment with Phyllanthus
extracts. In both aqueous and methanolic extracts of Phyllanthus, the percentage of
LDH levels in PC-3 cells induced by all four Phyllanthus species ranged from 10.0-
12.0% (p<0.05). For the standard drug, doxorubicin, the LDH levels induced was 26.0%
(p<0.05). Hence, the necrotic effect of doxorubicin seems to be stronger than
Phyllanthus extracts with a 10.0% difference (p<0.05).
Figure 3.9: The percentage of LDH levels in the treated and untreated PC-3 cancer cells.
Figure shows the LDH levels in the treated group were higher than that of the untreated
(control) group. Data represent the mean (± SEM) of three independent experiments,
each performed in triplicate. All showed significant difference between untreated cells
and Phyllanthus-treated cells, p<0.05 (Tang et al., 2010).

116
3.5 Phyllanthus exerts Anti-Metastatic Effect
Tumour metastasis is a multistep process which includes adhesion of tumour
cells to the extracellular matrix (ECM) of basement membrane, degradation of ECM by
secreted proteolytic enzymes, migration and invasion of cancer cells through the
systemic and/or lymphatic system (Zetter, 1998). Therefore, the anti-metastatic effect of
Phyllanthus was studied by assessing several assays; migration, invasion, cell-matrix
adhesion, transendothelial migration and zymographies.
3.5.1 Inhibition of Cancer and Endothelial Cells’ Migration
The transwell assay was performed to quantify the migratory potential of cancer
(MeWo and PC-3) and endothelial (HUVECs) cells after treatment with Phyllanthus at
different concentrations. 31.3-500.0 µg/ml.
3.5.1.1 Inhibition of MeWo Cells’ Migration
The migration activity of MeWo cells was decreased after treatment with
Phyllanthus extracts (p<0.05) (Figure 3.10). At 31.3 µg/ml of aqueous extracts of
Phyllanthus, the migrated MeWo cells ranged from 81.3-88.9% and reduced to 12.0-
25.6% at 500.0 µg/ml (p<0.05). For methanolic extracts, the migrated MeWo cells
ranged from 83.3-92.9% at 31.3 µg/ml and reduced to a range of 4.4-12.6% at 500.0
µg/ml (p<0.05). Notably the anti-migration effect of methanolic extracts of Phyllanthus
was greater than aqueous extracts. P.urinaria showed the strongest anti-migration
activity in both aqueous and methanolic extracts, followed by P.watsonii, P.niruri and
P.amarus.

117
Figure 3.10: Effect of Phyllanthus extracts on the migration ability of MeWo cells.
Figure shows (Upper) MeWo cells were treated with different concentrations of
Phyllanthus extracts for 72 hours. (Lower) Migration ability of treated MeWo cells was
quantified and represented the mean ± SEM of three independent experiments, each
performed in triplicate. The asterisk indicates a significant difference between untreated
(control) and Phyllanthus-treated cells, *p<0.05 and **p <0.01.
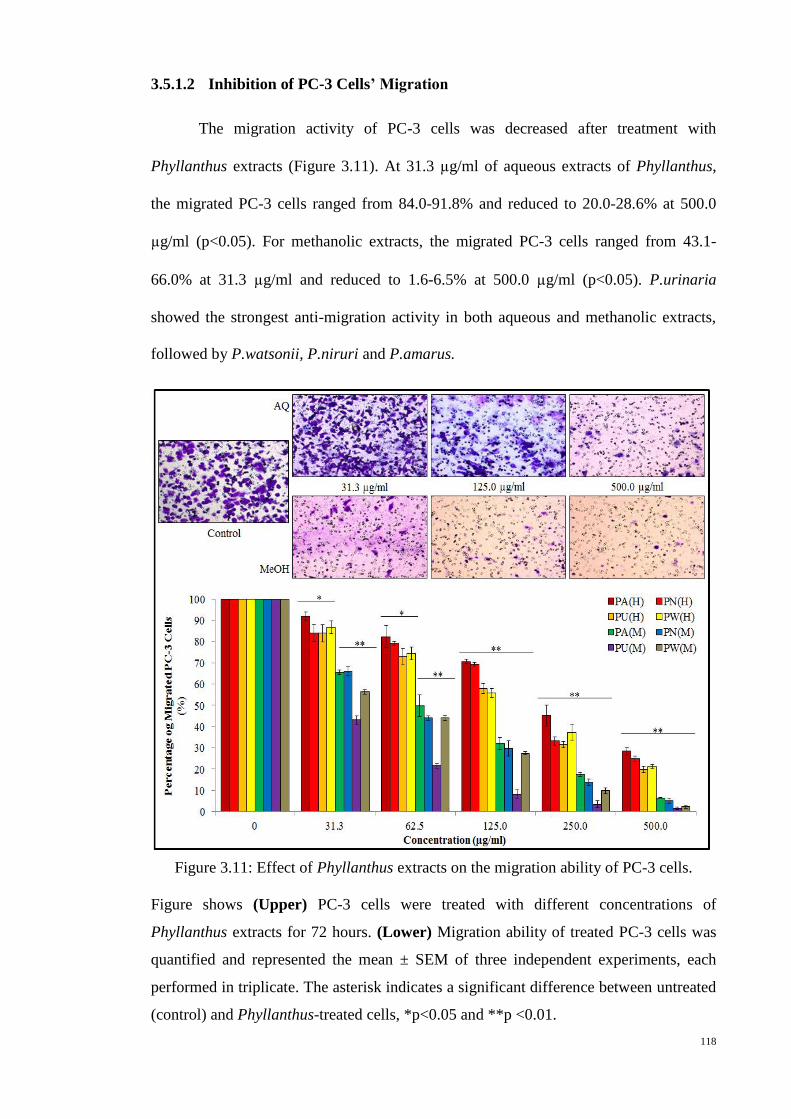
118
3.5.1.2 Inhibition of PC-3 Cells’ Migration
The migration activity of PC-3 cells was decreased after treatment with
Phyllanthus extracts (Figure 3.11). At 31.3 µg/ml of aqueous extracts of Phyllanthus,
the migrated PC-3 cells ranged from 84.0-91.8% and reduced to 20.0-28.6% at 500.0
µg/ml (p<0.05). For methanolic extracts, the migrated PC-3 cells ranged from 43.1-
66.0% at 31.3 µg/ml and reduced to 1.6-6.5% at 500.0 µg/ml (p<0.05). P.urinaria
showed the strongest anti-migration activity in both aqueous and methanolic extracts,
followed by P.watsonii, P.niruri and P.amarus.
Figure 3.11: Effect of Phyllanthus extracts on the migration ability of PC-3 cells.
Figure shows (Upper) PC-3 cells were treated with different concentrations of
Phyllanthus extracts for 72 hours. (Lower) Migration ability of treated PC-3 cells was
quantified and represented the mean ± SEM of three independent experiments, each
performed in triplicate. The asterisk indicates a significant difference between untreated
(control) and Phyllanthus-treated cells, *p<0.05 and **p <0.01.

119
3.5.1.3 Inhibition of HUVECs’ Migration
The migration activity of Phyllanthus against HUVECs was found to be dose-
dependent (Figure 3.12). At 31.3 µg/ml of Phyllanthus aqueous extracts, the migrated
HUVECs were ranged from 93.3-97.2% and reduced to a range of 64.9-73.6% at 500.0
µg/ml (p<0.05). For methanolic extracts of Phyllanthus, the migrated HUVECs ranged
from 93.2-97.7% at 31.3 µg/ml and reduced to 69.8-70.0% at 500.0 µg/ml (p<0.05). As
noted, P.amarus showed the strongest anti-migration activity in both aqueous and
methanolic extracts, followed by P.urinaria, P.watsonii, and P.niruri.
Figure 3.12: Effect of Phyllanthus extracts on the migration ability of HUVECs.
Figure shows (Upper) HUVECs cells were treated with different concentrations of
Phyllanthus extracts for 72 hours. (Lower) Migration ability of treated HUVECs was
quantified and represented the mean ± SEM of three independent experiments each
performed in triplicate. The asterisk indicates a significant difference between
untreated (control) and Phyllanthus-treated cells, *p<0.05 and **p <0.01.

120
3.5.2 Inhibition of Cancer Cell’s Motility
The wound migration assay is a simple and inexpensive method which allows
dual studies; cancer cell migration and cell-cell interactions. This assay was performed
to confirm previous findings in transwell migration assay and allows investigation of
cancer cell-cell interaction after Phyllanthus treatment. This assay was performed only
on cancer (MeWo and PC-3) cells, as it requires to create a "wound" or “denuded zone”
in a cell monolayer and not suitable for HUVECs which needs adhesion molecules on
the flask for growth.
3.5.2.1 Inhibition of MeWo Cells’ Motility
The anti-migration effect of Phyllanthus extracts on MeWo cells by the wound
migration assay is shown in Figure 3.13. The reduction in migration activity of MeWo
cells was clearly observed after treatment with different concentrations of Phyllanthus
extracts. The migrated MeWo cells ranged from 88.9-93.3% by aqueous extracts
treatment at 31.3 µg/ml and further reduced to a range of 28.0-31.0% at 500.0 µg/ml
(p<0.05). For methanolic extracts, the migrated MeWo cells ranged from 84.0-91.5% at
31.3 µg/ml and further reduced to a range of 11.0-21.9% at 500.0 µg/ml (p<0.05).
P.urinaria showed the strongest anti-migration activity in both aqueous and methanolic
extracts, followed by P.watsonii, P.niruri and P.amarus.

121
Figure 3.13: Effect of Phyllanthus extracts on the motility of MeWo cells.
Figure shows (Upper) MeWo cell monolayer was scraped, and the cells were treated
with different concentrations of Phyllanthus extracts for 48 hours. (Lower) Quantitative
assessments of migrated cells are expressed as mean ± SEM of three independent
experiments, each performed in triplicate. The asterisk indicates a significant difference
between untreated (control) and Phyllanthus-treated cells, *p<0.05 and **p <0.01.
.

122
3.5.2.2 Inhibition of PC-3 Cells’ Motility
For the PC-3, the anti-migration effect of Phyllanthus extracts was observed in
wound migration assay (Figure 3.14). The migrated PC-3 cells were around 90.6-93.6%
at 31.3 µg/ml for the the aqueous extracts treatment, and reduced to a range of 20.7-
35.0% at 500.0 µg/ml. For the methanolic extracts, the percentage of migrated PC-3
cells was 74.6-85.9% at 31.3 µg/ml and further reduced to a range of 20.3-23.9% at
500.0 µg/ml. As noted again, P.urinaria showed the strongest anti-migration activity in
both aqueous and methanolic extracts, followed by P.watsonii, P.niruri and P.amarus.
Figure 3.14: Effect of Phyllanthus extracts on the motility of PC-3 cells.
Figure shows (Upper) PC-3 cell monolayer was scraped to create denuded zone and
treated with different concentrations of Phyllanthus extracts for 24 hours. (Lower)
Quantitative assessments of migrated cells are expressed as mean ± SEM of three
independent experiments, each performed in triplicate. The asterisk indicates a
significant difference between untreated (control) and Phyllanthus-treated cells,
*p<0.05 and **p <0.01.

123
3.5.3 Inhibition of Cancer and Endothelial Cells’ Invasion
The invasion ability of cancer cells allows cancer cells to invade beyond the
constraints of the normal tissue from which they originate and to enter the circulation
that leads them to reach distant organs/tissues and eventually form secondary tumours,
called metastases (Mareel & Leroy, 2003). Invasion also plays an important role during
tumour angiogenesis as endothelial cells from pre-existing blood vessels need to invade
surrounding tissues to form new blood vessels towards solid tumour (Carlevaro et al.,
1997).
Thus, the anti-invasion activity of Phyllanthus extracts on MeWo and PC-3 cells
as well as HUVECs was studied with transwell invasion assay after treatment with
Phyllanthus at different concentrations (31.3-500.0 µg/ml).
3.5.3.1 Inhibition of MeWo Cell’ Invasion
The invasion activity of MeWo cells was noted to decrease after treatment with
Phyllanthus extracts (Figure 3.15). The invasion ability of MeWo cells were
significantly inhibited by both aqueous and methanolic extracts of Phyllanthus from
31.3-500.0 µg/ml (p<0.05). At 31.3 µg/ml of aqueous extracts, the invaded MeWo cells
were 83.9-91.9% and reduced to a range of 13.6-31.8% at 500.0 µg/ml (p<0.05). For
methanolic extracts, the invaded MeWo cells ranged from 84.6-92.9% at 31.3 µg/ml
and reduced to a range of 8.4-15.3% at 500.0 µg/ml (p<0.05). P.urinaria showed the
strongest anti-invasion activity in both aqueous and methanolic extracts, followed by
P.watsonii, P.niruri and P.amarus.

124
Figure 3.15: Effect of Phyllanthus extracts on the invasion ability of MeWo cells.
Figure shows (Upper) MeWo cells were treated with different concentrations of
Phyllanthus extracts for 72 hours. (Lower) Invasion ability of treated MeWo cells was
quantified and represented the mean ± SEM of three independent experiments, each
performed in triplicate. The asterisk indicates a significant difference between
untreated (control) and Phyllanthus-treated cells, *p<0.05 and **p <0.01.

125
3.5.3.2 Inhibition of PC-3 Cell’ Invasion
The invasion activity of PC-3 cells was decreased after treatment with
Phyllanthus extracts (Figure 3.16). At 31.3 µg/ml of aqueous extracts, the invaded PC-3
cells ranged from 83.2-93.6% and reduced to 20.9-31.8% at 500.0 µg/ml (p<0.05),
while for methanolic extracts, the invaded PC-3 cells ranged from 60.6-91.2% at 31.3
µg/ml and reduced to 11.1-21.1% at 500.0 µg/ml (p<0.05). As noted before, P.urinaria
showed the strongest anti-invasion activity in both aqueous and methanolic extracts,
followed by P.watsonii, P.niruri and P.amarus.
Figure 3.16: Effect of Phyllanthus extracts on the invasion ability of PC-3 cells.
Figure shows (Upper) PC-3 cells were treated with different concentrations of
Phyllanthus extracts for 72 hours. (Lower) Invasion ability of treated PC-3 cells was
quantified and represented the mean ± SEM of three independent experiments, each
performed in triplicate. The asterisk indicates a significant difference between
untreated (control) and Phyllanthus-treated cells, *p<0.05 and **p <0.01.

126
3.5.3.3 Inhibition of HUVECs’ Invasion
For HUVECs, the invasion activity reduced upon treatment with Phyllanthus
extracts (Figure 3.17). At 31.3 µg/ml of aqueous extracts of Phyllanthus, the invaded
HUVECs ranged from 93.6-98.9% and reduced to 51.2-52.6% at 500.0 µg/ml (p<0.05),
while for methanolic extracts, the percentage of invaded HUVECs were 90.3-93.9% at
31.3 µg/ml and reduced to a range of 48.3-55.9% at 500.0 µg/ml (p<0.05). The results
showed that both aqueous and methanolic extracts of Phyllanthus showed similar extent
of anti-invasion effects on HUVECs for all Phyllanthus species.
Figure 3.17: Effect of Phyllanthus extracts on the invasion ability of HUVECs.
Figure shows (Upper) HUVEC cells were treated with different concentrations of
Phyllanthus extracts for 72 hours. (Lower) Invasion ability of treated HUVECs was
quantified and represented the mean ± SEM of three independent experiments, each
performed in triplicate. The asterisk indicates a significant difference between untreated
(control) and Phyllanthus-treated cells, *p<0.05 and **p <0.01.

127
3.5.4 Cell-Extracellular Matrix Interactions in Cancer Cells
The interaction of cancer cell with ECM proteins such as fibronectin, laminin
and collagen is important to enable cancer cells to adhere, invade and metastasize.
Disruption of these interactions could halt cancer progression. Cell-matrix adhesion
assay was performed to study the interaction of PC-3 cells to type-IV collagen and
MeWo cells to fibronectin after treatment with Phyllanthus extracts
3.5.4.1 Inhibition on MeWo Cells-Extracellular Matrix Interactions
Figure 3.18 shows the adhesion activity of MeWo cells to fibronectin was
significantly reduced after treatment with Phyllanthus extracts. At 31.3 µg/ml of
aqueous extracts, the adherent MeWo cells ranged from 64.7-71.6% and reduced to 3.6-
16.2% at 500.0 µg/ml (p<0.05), while for methanolic extracts, the adherent MeWo cells
were 61.1-68.8% at 31.3 µg/ml and further reduced to 2.0-4.6% at 500.0 µg/ml
(p<0.05). P.urinaria again showed the strongest inhibitory effect on adhesion activity of
MeWo cells in both aqueous and methanolic extracts, followed by P.watsonii, P.amarus
and P. niruri.

128
Figure 3.18: Effects of Phyllanthus on MeWo cells adhesion activity.
Figure shows the adhesion ability of treated MeWo cells towards fibronectin were
exhibited a dose-dependent manner of Phyllanthus concentrations. Data represent the
mean (± SEM) of three independent experiments, each performed in triplicate. The
asterisk indicates a significant difference between untreated (control) and Phyllanthus-
treated cells, *p<0.05 and **p <0.01.

129
3.5.4.2 Inhibition on PC-3 Cells-Extracellular Matrix Interactions
The adhesion ability of PC-3 cells towards type-IV collagen was reduced after
treatment with Phyllanthus extracts (Figure 3.19). In the aqueous extracts treatment, the
adherent PC-3 cells were 82.6-90.6% at 31.3 µg/ml, and reduced to a range of 10.6-
11.7% at 500.0 µg/ml, while for methanolic extracts, the adherent PC-3 cells were 70.7-
81.2% at 31.3.0 µg/ml and reduced to 3.8-4.4% at 500.0 µg/ml. Again P.urinaria
showed the strongest inhibitory effects in adhesion activity of PC-3 cells, followed by
P.watsonii, P.amarus and P.niruri in both aqueous and methanolic extracts.
Figure 3.19: Effects of Phyllanthus on PC-3 cells’ adhesion activity.
Figure shows the adhesion ability of treated PC-3 cells towards type-IV collagen were
exhibited a dose-dependent manner to Phyllanthus concentrations. Data represent the
mean (± SEM) of three independent experiments, each performed in triplicate. The
asterisk indicates a significant difference between untreated (control) and Phyllanthus-
treated cells, *p<0.05 and **p <0.01.

130
3.5.5 Inhibition of Cancer Cells’ Transendothelial Migration
During metastasis, cancer cells will transvasate into blood vessels, circulate in
the blood stream and transmigrate out from the vessels into a new site of the body to
form secondary tumours. In order to study cancer cells-endothelium interaction and
transmigration, tumour transendothelial migration assay was performed.
3.5.5.1 Inhibition of MeWo Cells’ Transendothelial Migration
As shown in Figure 3.20, Phyllanthus extracts significantly inhibited
transendothelial migration of MeWo in a dose-response manner at all concentration
(p<0.05). At 31.3 µg/ml of aqueous extracts, the transendothelial migrated MeWo cells
ranged from 73.8-81.3% and reduced to 4.2-21.6% at 500.0 µg/ml. For methanolic
extracts, the transendothelial migrated MeWo cells were around 72.9-82.6% at 31.3
µg/ml and reduced to 2.0-4.8% at 500.0 µg/ml. Again, P.urinaria showed the strongest
inhibitory effects on transendothelial migration ability of MeWo cells, followed by
P.watsonii, P.niruri and P.amarus in both aqueous and methanolic extracts.

131
Figure 3.20: Effects of Phyllanthus on transendothelial migration of MeWo cells.
Figure shows (Upper) MeWo cells were treated with different concentrations of
Phyllanthus extracts for 72 hours. (Lower) Transendothelial migration ability of treated
MeWo cells was quantified and represented the mean ± SEM of three independent
experiments each performed in triplicate. The asterisk indicates a significant difference
between untreated (control) and Phyllanthus-treated cells, *p<0.05 and **p <0.01.

132
3.5.5.2 Inhibition of PC-3 Cells’ Transendothelial Migration
Phyllanthus extracts also exhibits the inhibiton effect on transendothelial
migration of PC-3 cells in a dose-response manner (Figure 3.21). At 31.3 µg/ml of
aqueous extracts of Phyllathus, the transendothelial migrated PC-3 cells ranged from
72.2-83.6% and reduced to 10.3-21.3% at 500.0 µg/ml, while for methanolic extracts,
the transendothelial migrated PC-3 cells were 51.9-80.3% at 31.3 µg/ml and reduced to
3.3-13.3% at 500.0 µg/ml. P.urinaria again showed the strongest inhibitory effects on
transendothelial migration ability of PC-3 cells, followed by P.watsonii, P.niruri and
P.amarus in both aqueous and methanolic extracts.
Figure 3.21: Effects of Phyllanthus on transendothelial migration of PC-3 cells.
Figure shows (Upper) PC-3 cells were treated with different concentrations of
Phyllanthus extracts for 72 hours. (Lower) Transendothelial migration ability of treated
PC-3 cells was quantified and represented the mean ± SEM of three independent
experiments, each performed in triplicate. The asterisk indicates a significant difference
between untreated (control) and Phyllanthus-treated cells, *p<0.05 and **p <0.01.
133
3.5.6 Inhibition on Matrix Metalloproteinase (MMP) Enzymes
Matrix metalloproteinases (MMPs) are zinc-dependent matrix proteases which
are involved in ECM destruction, cell growth, apoptosis, angiogenesis, invasion and
migration. Inhibition of these enzymes is believed to prevent endothelial and cancer
cells’ invasiveness, subsequently, decreasing the incidence of tumour metastasis and
halts the formation of secondary tumours. Gelatinase (MMP-2 and -9) and matrilysins
(MMP-7 and -26) metalloproteases were detected in MeWo, PC-3 and HUVECs by
zymographies and their activities were noted to be altered upon Phyllanthus treatment.
3.5.6.1 Inhibition of MMP-2 and MMP-7 in MeWo cells
As shown in Figure 3.22, MMP-2 was detected at 64kDa in MeWo cells. At
31.3 µg/ml of aqueous extracts of Phyllathus, the MMP-2 levels ranged from 89.2-
95.3% (p<0.05) and reduced to 21.4-33.3% at 500.0 µg/ml (p<0.01). For methanolic
extracts, the MMP-2 levels were around 81.4-94.2% at 31.3 µg/ml (p<0.05) and
reduced to a range of 13.3-21.4% at 500.0 µg/ml (p<0.01).
Besides that, MMP-7 was also detected at 64kDa in MeWo cells (Figure 3.22).
At 31.3 µg/ml of aqueous extracts of Phyllathus, the MMP-7 levels ranged from 89.4-
93.3% (p<0.05) and reduced to 26.3-34.2% at 500.0 µg/ml (p<0.01). For methanolic
extracts, the MMP-2 levels ranged from 80.4-91.4% at 31.3 µg/ml (p<0.05) and reduced
to 29.4-33.4% at 500.0 µg/ml (p<0.01). P.urinaria showed the strongest inhibitory
effects on MMP-2 and -7 activities of MeWo cells, followed by P.watsonii, P.niruri and
P.amarus in both aqueous and methanolic extracts.

134
Figure 3.22: Zymography analysis of MeWo cells. MMP-2 and -7 were detected at
64KDa and 20kDa, respectively.
Figure shows the MMPs activities were measured and expressed as mean ± SEM of
three independent experiments, each performed in triplicate. The asterisk indicates a
significant difference between untreated (control) and Phyllanthus-treated cells,
*p<0.05 and **p <0.01.

135
3.5.6.2 Inhibition of MMP- 7, -9 and -26 in PC-3 cells
Four different MMPs were detected in PC-3 cells; MMP-7 at 20kDa, pro-MMP
9 at 92kDa, active MMP-9 at 82kDa and MMP-26 at 18kDa (Figure 3.23). As shown in
Figure 3.23, MMP-7 levels ranged from 80.3-91.4% (p<0.05) at 31.3 µg/ml and reduced
to 20.3-31.3% at 500.0 µg/ml (p<0.01) of aqueous-treated cells. For methanolic
extracts, the MMP-7 levels were around 79.3-81.3% at 31.3 µg/ml (p<0.05) and
reduced to a range of 26.8-37.2% at 500.0 µg/ml (p<0.01).
The MMP-26 activity was reduced by Phyllanthus extracts in treated PC-3 cells
and its levels ranged from 71.3-81.4% (p<0.05) at 31.3 µg/ml and were reduced to 43.2-
60.2% at 500.0 µg/ml (p<0.01) in aqueous-treated PC-3 cell. For methanolic extracts,
the MMP-26 levels were 65.3-71.4% at 31.3 µg/ml (p<0.05) and reduced to 34.3-49.2%
at 500.0 µg/ml (p<0.01). As MMP-26 acts as an activator of pro-MMP-9 to activate
MMP-9, reduction of MMP-26 activity is followed by increased levels of pro-MMP 9.
The pro-MMP-9 levels ranged from 21.4-25.7% (p<0.05) at 31.3 µg/ml and increased to
86.3-91.7% at 500.0 µg/ml (p<0.01) of aqueous-treated PC-3 cells. For methanolic
extracts, the pro-MMP-9 levels ranged from 10.4-21.4% at 31.3 µg/ml (p<0.05) and
increased to 83.2-91.5% at 500.0 µg/ml (p<0.01). As consequence from this, active
MMP-9 activity in PC-3 cells was reduced after treatment with Phyllanthus. At 31.3
µg/ml of aqueous extracts of Phyllathus, the active MMP-9 levels were 80.2-88.2%
(p<0.05) and reduced to 17.3-23.8% at 500.0 µg/ml (p<0.01). For methanolic extracts,
the MMP-9 levels ranged from 79.2-87.4% at 31.3 µg/ml (p<0.05) and reduced to a
range of 9.4-14.2% at 500.0 µg/ml (p<0.01).

136
Figure 3.23: Zymography analysis of PC-3 cells.
Figure shows four different MMPs; MMP-7, pro-MMP-9, active MMP-9 and MMP-2,
were detected, measured and expressed as mean ± SEM of three independent
experiments, each performed in triplicate. The asterisk indicates a significant difference
between untreated (control) and Phyllanthus-treated cells, *p<0.05 and **p <0.01.
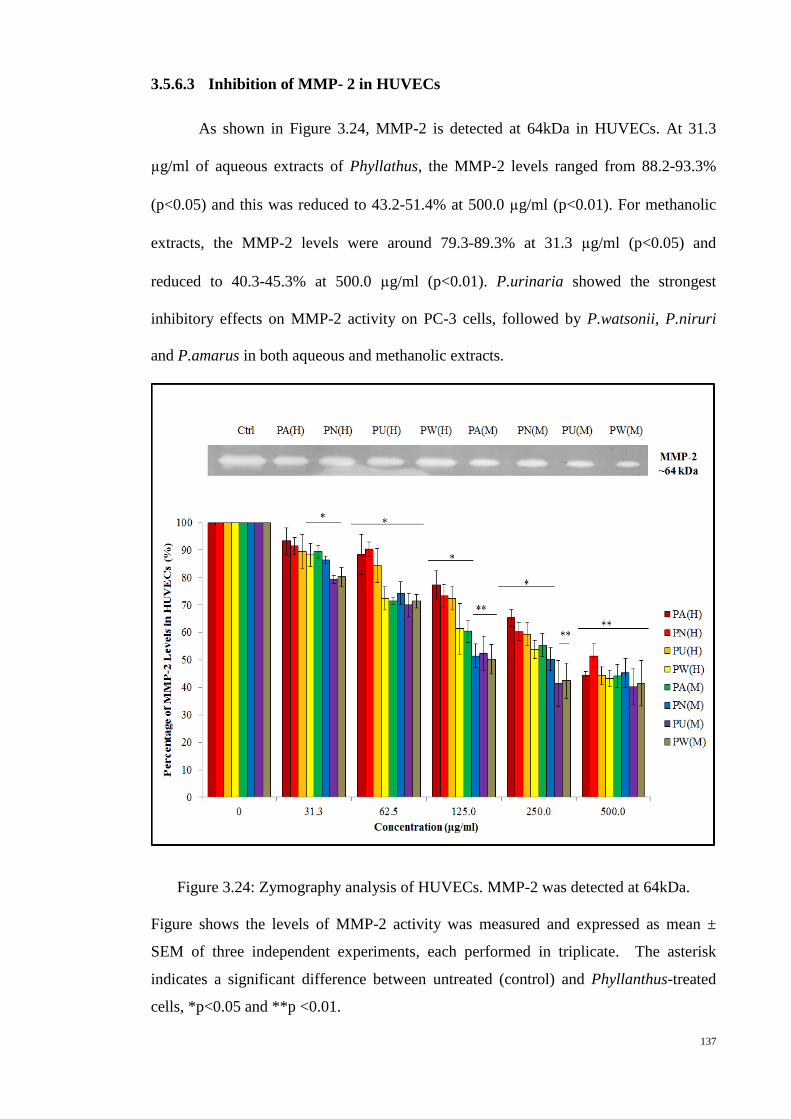
137
3.5.6.3 Inhibition of MMP- 2 in HUVECs
As shown in Figure 3.24, MMP-2 is detected at 64kDa in HUVECs. At 31.3
µg/ml of aqueous extracts of Phyllathus, the MMP-2 levels ranged from 88.2-93.3%
(p<0.05) and this was reduced to 43.2-51.4% at 500.0 µg/ml (p<0.01). For methanolic
extracts, the MMP-2 levels were around 79.3-89.3% at 31.3 µg/ml (p<0.05) and
reduced to 40.3-45.3% at 500.0 µg/ml (p<0.01). P.urinaria showed the strongest
inhibitory effects on MMP-2 activity on PC-3 cells, followed by P.watsonii, P.niruri
and P.amarus in both aqueous and methanolic extracts.
Figure 3.24: Zymography analysis of HUVECs. MMP-2 was detected at 64kDa.
Figure shows the levels of MMP-2 activity was measured and expressed as mean ±
SEM of three independent experiments, each performed in triplicate. The asterisk
indicates a significant difference between untreated (control) and Phyllanthus-treated
cells, *p<0.05 and **p <0.01.

138
3.6 Phyllanthus exerts Anti-Angiogenic Effect
The extracellular matrix (ECM) gel-induced capillary tube formation assay is
one of the most widely used in vitro assays to mimic the reorganization phase of
angiogenesis. This assay measures the ability of endothelial cells to form capillary-like
tube structures with the the support of extracellular matrix. The resulting tubes will
eventually form hollow lumen and become guidance pathways that facilitate tumour cell
metastasis. Thus, ECM gel-induced capillary tube formation assay was used to assess
the anti-angiogenic effects of Phyllanthus extracts
Without any treatment, endothelial cells become elongated and form
microcapillary-like tube structures, organized by larger number of HUVECs on ECM
gel (Figure 3.25). The inhibition in gel-induced microcapillary-like tube structures by
Phyllanthus extracts was noticed from 31.3-500.0 µg/ml. At 31.3 µg/ml of aqueous
extracts of Phyllanthus, the percentage of tube formation ranged from 90.8-93.3%
(p<0.05) and was further reduced to 31.3-37.4% at 500.0 µg/ml (p<0.05). For
methanolic extracts, the percentage of tube formation was around 90.1-92.3% at 31.3
µg/ml and reduced to 24.6-30.6% at 500.0 µg/ml (p<0.05). P.urinaria again showed the
strongest inhibitory effect on microcapillary-like tube structures of HUVECs, followed
by P.watsonii, P.amarus and P.niruri in both aqueous and methanolic extracts.

139
Figure 3.25: Effect of Phyllanthus extracts on microcapillary-like tube formation of
HUVECs.
Figure shows (Upper) Microcapillary-like tube formation of HUVECs at different
concentrations of Phyllanthus extracts. (Lower) The completed microcappilary-like
tube formation was calculated and expressed as mean ± SEM of three experiments, each
performed in triplicate. The asterisk indicates a significant difference between
untreated (control) and Phyllanthus-treated cells, *p<0.05 and **p <0.01.
140
3.7 Disruption of Cancer Cell Signalling Pathways by Phyllanthus
From the results, Phyllanthus extracts have exhibited anti-proliferation, anti-
metastasis, anti-angiogenesis and induction of apoptosis on both melanoma (MeWo)
and prostate (PC-3) cancer cell lines. Further investigations to study the underlying
molecular mechanisms of these anticancer effects of Phyllanthus on MeWo and PC-3
cells was carried out. The cancer ten-pathway reporter array was performed to profile
the changes in the activities of ten different signalling pathways relevant to cancer that
is influenced by Phyllanthus. The ten-related cancer pathways that were screened
included Wnt, Notch, p53/DNA damage, TGFβ, cell cycl3/pRb-E2F, NFκB, Myc/Max,
hypoxia, MAPK/ERK and MAPK/JNK.
3.7.1 Alterations on Multiple Signalling Pathways in MeWo cells
Figure 3.26 showed the differential expression of each cancer-related pathway in
treated and untreated MeWo cells. It was noted that in the untreated MeWo cells, six
(p53/DNA damage, NFκB, Myc/Max, Hypoxia, MAPK/ERK and MAPK/JNK)
investigated pathways were expressed to regulate the cell growth and survival. It is
observed that out of these six pathways, four pathways (NFκB, Myc/Max, Hypoxia and
MAPK/ERK) showed significantly down-regulation in treated MeWo cells (p<0.05).
Contrarily, the expression of p53/DNA damage and MAPK/JNK pathways showed
significant up-regulation in the treated cells (p<0.05). Other pathways investigated were
found to be not significantly affected by Phyllanthus extracts (p>0.05).

141
Figure 3.26: Alterations in ten cancer-related pathways upon Phyllanthus treatment in MeWo cells.
Figure shows data represent the mean (± SEM) of three independent experiments, each performed in triplicate. The asterisk indicates a significant
difference between untreated (control) and Phyllanthus-treated cells, *p<0.05 and **p <0.01.
142
3.7.2 Alterations on Multiple Signalling Pathways in PC-3 cells
Figure 3.27 depicts the differential expression of Wnt, Notch, p53, TGF-β, cell
cycle/pRB-E2F, NFκB, Myc/Max, Hypoxia, MAPK/ERK and MAPK/JNK pathways
affected by Phyllanthus species on PC-3 cells. It was noted that in the untreated PC-3
cells, all ten investigated pathways were expressed to regulate the cells growth and
survival. Upon treatment with the different Phyllanthus species, the cells showed a
significant down regulation of six pathways; Wnt, NFκB, Myc/Max, Hypoxia,
MAPK/ERK and MAPK/JNK, suggesting that the plant extracts exerted its properties
by targeting these pathways (p<0.05). The other pathways were not significantly
affected by Phyllanthus extracts (p>0.05).

143
Figure 3.27: Alterations in ten cancer-related pathways upon Phyllanthus treatment in PC-3 cells.
Figure shows data represent the mean (± SEM) of three independent experiments, each performed in triplicate. The asterisk indicates a significant
difference between untreated (control) and Phyllanthus-treated cells, *p<0.05.

144
3.7.3 Phyllanthus disrupted anti-apoptotic/pro-apoptotic balance in cancer cells
One of the hallmarks of cancer is the inhibition of apoptosis. This can be
achieved by suppressing the expression of pro-apoptotic protein, Bax and stimulating
the expression of anti-apoptotic protein, Bcl-2. As shown in Figure 3.28, Bax and Bcl-2
proteins were detected at 23kDa and 26kDA, respectively.
In Figure 3.28A, it is observed the levels of the pro-apoptotic Bax proteins in
treated MeWo was significantly increased with a concurrent decreased in anti-apoptotic
Bcl-2 protein in treated MeWo cells as compared to untreated MeWo cells (p<0.05).
Besides that, another apoptosis related protein; p53, was also detected at 53kDa. The
p53 levels were significantly up-regulated in MeWo cells after treatment with
Phyllanthus extracts (p<0.05). These observations indicate that Phyllanthus was able to
induce apoptosis through the activation of p53 pathway and disrupted the anti-
apoptotic/pro-apoptotic balance in MeWo cells.
A similar phenomenon was observed in treated PC-3 cells (Figure 3.28B). The
graph shows a significant increase of Bax protein in the Phyllanthus-treated cells
(p<0.05) with a concurrent decrease in Bcl-2 (p<0.05). P53 protein was not found in
both untreated and treated PC-3 cells, suggesting Phyllanthus induced apoptosis via
p53-independent pathway.
Among the species of Phyllanthus, both aqueous and methanolic extracts of
P.watsonnii showed the most significant changes on Bax and Bcl expression (p<0.01),
followed by P.urinaria, P.niruri and P.amarus.

145
(A)
(B)
Figure 3.28: Effects of Phyllanthus extracts on pro-apoptotic/anti-apoptotic balance in
(A) MeWo and (B) PC-3 cells.
Figure shows data represent the mean (± SEM) of three independent experiments, each
performed in triplicate. The asterisk indicates a significant difference between untreated
(control) and Phyllanthus-treated cells, *p<0.05 and **p <0.01.

146
3.7.4 Alterations of MAPK Pathways by Phyllanthus extracts
The high expressions of MAPK signalling in melanoma and prostate cancers
impinges on most signalling pathways and plays a critical role in the progression of
cancer such as tumour metastasis and angiogenesis. Three different major MAPK were
studied; ERK, JNK and p38 MAPK pathways.
3.7.4.1 Down-Regulation of MAPK/ERK, p38 MAPK and PI3K/Akt Pathways in
MeWo cells
Three up-stream activator molecules in MAPK and PI3K/Akt pathways; pan-
Ras, c-Raf and Akt were highly expressed in the untreated MeWo cells. The constitutive
activations of these molecules can activate their downstream targets including
MAPK/ERK (RSK, Elk1, c-Jun/AP-1), MAPK/JNK (JNK1/2) and p38 (p38 MAPK).
As shown in Figure 3.29, the expressions of all these intracellular signalling molecules
were detected in untreated MeWo cells indicating their involvement in regulating
MeWo cells’ growth. However, the expression of all these intracellular signalling
molecules had notably been down-regulated expression (p<0.05) except for JNK1/2
protein which showed a slight increase in expression in treated MeWo cells.

147
Figure 3.29: Alterations in activities of intracellular signalling molecules of MAPK and PI3K/Akt pathways upon Phyllanthus treatment in MeWo
cells.
Figure shows data represent the mean (± SEM) of three independent experiments, each performed in triplicate. The asterisk indicates a significant
difference between untreated (control) and Phyllanthus-treated cells, *p<0.05 and **p <0.01.

148
3.7.4.2 Down-Regulation of MAPK and PI3K/Akt Pathways in PC-3 cells
In untreated PC-3 cells, two upstream activators, pan-Ras and c-Raf were highly
expressed to ensure constitutive activation of MAPK pathways (Figure 3.30). Another
upstream activator of Akt was also found to be highly expressed in PC-3 cells. The
constitutive activations of pan-Ras, c-Raf and Akt can activate their downstream targets
in three different MAPK pathways; MAPK/ERK (RSK, Elk1, c-Jun/AP-1), MAPK/JNK
(JNK1/2) and p38 (p38 MAPK). As shown in Figure 3.30, the detected expressions of
all these intracellular signalling molecules in untreated PC-3 cells indicate their
involvement in regulating PC-3 cells’ growth. Nevertheless, expression all these
signalling molecules proteins had notably been down-regulated in PC-3 cells treated
with the different species of Phyllanthus (p<0.05).
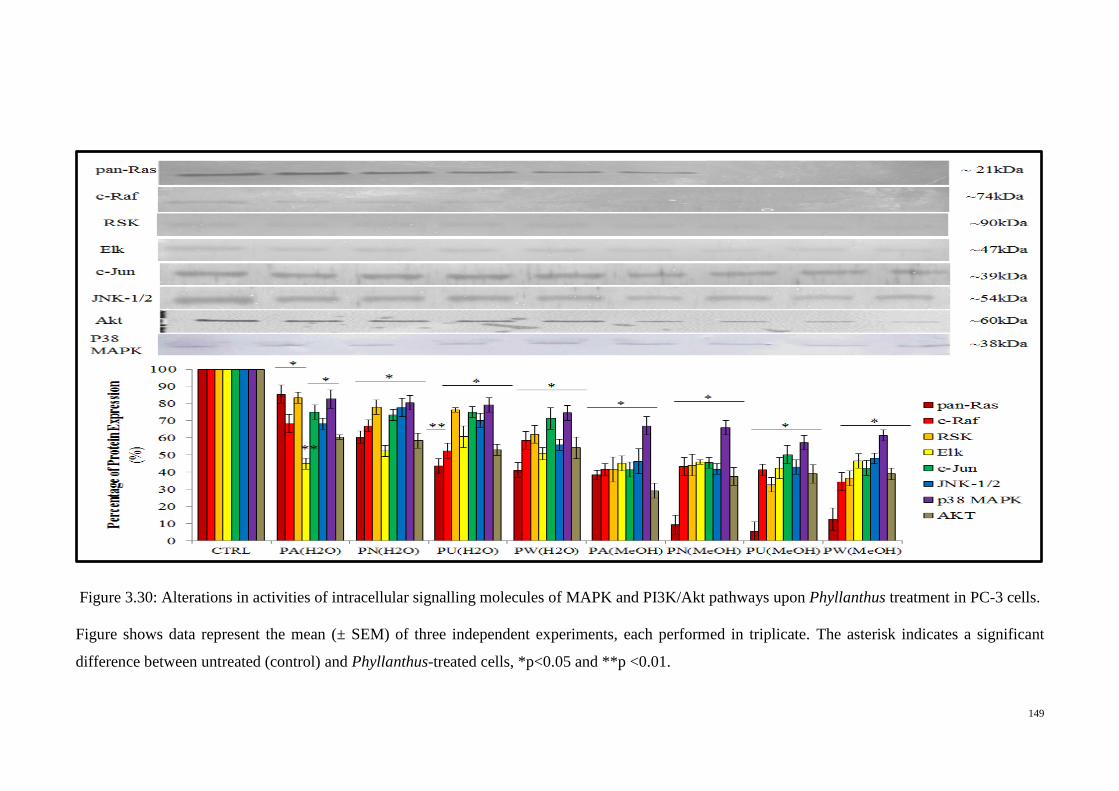
149
Figure 3.30: Alterations in activities of intracellular signalling molecules of MAPK and PI3K/Akt pathways upon Phyllanthus treatment in PC-3 cells.
Figure shows data represent the mean (± SEM) of three independent experiments, each performed in triplicate. The asterisk indicates a significant
difference between untreated (control) and Phyllanthus-treated cells, *p<0.05 and **p <0.01.
150
3.7.5 Alterations of Myc/Max and Hypoxia Pathways by Phyllanthus extracts
The high expression of Myc/Max and hypoxia pathways in melanoma and
prostate cancers was observed in untreated MeWo and PC-3 cells (Figure 3.26 and
3.27), suggesting their crosstalk activities to regulate tumour metastasis and
angiogenesis. In these pathways, three intracellular signalling molecules were detected
by western blot; c-myc, HIF-1α, VEGF and GSK3β. However, their expressions were
altered after treatment with Phyllanthus.
3.7.5.1 Down-Regulation of Myc/Max and Hypoxia Pathways in MeWo cells
As shown in Figure 3.31, the expression of the c-myc was detected at 65kDa and
its expression was noticed significantly decreased by aqueous- (p<0.05) and
methanolic-Phyllanthus (p<0.01) treated MeWo cells as compared to untreated cells.
The downstream target of c-myc; HIF-1α and VEGF were detected at 120kDa and
50kD, respectively. Their expression was significantly down-regulated in treated MeWo
cells as compared to untreated cells (p<0.05). A negative regulator of c-myc, glycogen
synthase kinase 3-beta (Gsk3β) was detected at 51kDa and its expression was
significantly up-regulated in treated MeWo cells as compared to untreated MeWo cells
(p<0.01).

151
Figure 3.31: Alterations in activities of intracellular signalling molecules of Myc/Max
and Hypoxia pathways upon Phyllanthus treatment in MeWo cells.
Figure shows data represent the mean (± SEM) of three independent experiments, each
performed in triplicate. The asterisk indicates a significant difference between untreated
(control) and Phyllanthus-treated cells, *p<0.05 and **p <0.01.

152
3.7.5.2 Down-Regulation of Wnt, Myc/Max and Hypoxia Pathways in PC-3 cells
The expression of Wnt signalling pathway was detected at increased levels in
PC-3 cells (Figure 3.27) with high percentage down-regulation when treated with
Phyllanthus. Investigation of the downstream molecules in this pathway, revealed
expression of three intracellular signalling molecules; Dishevelled (DSH) at 95kDA,
Gsk3β at 47kDA and β–catenin at 65kDA. After treatment with aqueous (p<0.05) and
methanolic (p<0.01) extracts of Phyllanthus species as shown in Figure 3.32A, the
expression of DSH and β–catenin were noted significantly down-regulated. Contrarily,
the expression of Gsk3β was significantly up-regulated in treated PC-3 cells as
compared to untreated PC-3 cells (p<0.01).
In the Myc/Max and hypoxia pathways, three different intracellular signalling
molecules were detected by western blot. As shown in Figure 3.32B, the expression of
the c-myc was detected at 67kDA and its expression was noted to be down-regulated in
aqueous- (p<0.05) and methanolic-treated (p<0.01) PC-3 cells. The downstream targets
of c-myc; HIF-1α and VEGF were detected at 120kDa and 50kDa, respectively. The
expression of HIF-1α and VEGF in PC-3 was significantly down-regulated by
Phyllanthus extracts (p<0.05).

153
(A)
(B)
Figure 3.32: Alteration in intracellular signalling molecules of (A) Wnt and (B)
Myc/Max and Hypoxia pathways in PC-3 cells after treatment with Phyllanthus
extracts.
Figure shows data represent the mean (± SEM) of three independent experiments, each
performed in triplicate. The asterisk indicates a significant difference between untreated
(control) and Phyllanthus-treated cells, *p<0.05 and **p <0.01.
154
3.7.6 Alterations of NFκB Pathway by Phyllanthus extracts in MeWo and PC-3
cells
Two members of NFκB signalling pathway proteins were detected in MeWo and
PC-3 cells; NFκB p50 and NFκB p52. As shown in Figure 3.33, both proteins were
significantly down-regulated in MeWo and PC-3 cells after treatment Phyllanthus
extracts as compared to untreated cells. The level of both NFκB p50 and p52
expressions were down-regulated to a range of 56.4-72.3% (p<0.05) by aqueous and
44.5-57.9% by methanolic extracts in treated cells (p<0.01) in both cells.
Among the Phyllanthus species, P.urinaria showed strongest inhibitory effects
on these intracellular signalling molecules in NFκB pathways, followed by P.watsonii,
P.amarus and P.niruri for both aqueous and methanolic extracts.

155
(A)
(B)
Figure 3.33: Alterations of activities intracellular signalling molecules in NFκB
pathway in (A) MeWo and (B) PC-3 cells after treatment with Phyllanthus extracts.
Figure shows data represent the mean (± SEM) of three independent experiments, each
performed in triplicate. The asterisk indicates a significant difference between untreated
(control) and Phyllanthus-treated cells, *p<0.05 and **p <0.01.

156
3.8 Proteomic profiling of the differentially expressed proteins in Phyllanthus
treated MeWo and PC-3 cells
The interaction of protein in a cell is complex and provides a comprehensive
picture of cellular function and biological processes. In cancer, this interaction usually
is tightly regulated to ensure malignancy of cancer. The dysregulation of some proteins
and/or interactions may halt the growth of cancer. Therefore, studies of cancer-related
proteins in cancer cells after treatment with Phyllanthus plant extracts could explain its
anticancer properties via regulation in the protein and/or interaction networks of cancer.
A 2D electrophoresis approach was performed to compare the proteomic
profiles of an untreated cell with that treated cancer cells to identify differentially
expressed proteins that may be involved in the anticancer activity of Phyllanthus plant
extracts. The proteomic profiles of untreated and treated MeWo (Figure 3.34) and PC-3
(Figure 3.35) cells were obtained from ImageMaster 2D scanner (GE Healthcare Life
Sciences). A two-dimensional electrophoresis gel analytical software, PDQuest version
7.1 (Bio-Rad, USA) was used to to evaluate and identify the differentially expressed
proteins between untreated and treated groups.
Differentially expressed proteins were statistically defined based on two criteria:
1) degree of intensity >1.0 fold (Protein scores of greater than 70 are considered
significant, p<0.05) and 2) reoccurrence of the same proteins in the three repeated
experiments.
3.8.1.1 Proteomic profiling of human melanoma, MeWo cells
According to these criteria, 52 proteins in treated MeWo cells were identified by
MS/MS and grouped in four biological processes; Group 1 (cell adhesion, migration,
invasion and metastasis), Group II (proliferation, cell cycle and apoptosis), Group III
(glycogenesis and glycolysis) and Group IV (protein synthesis and energy

157
metabolisms), based on their functions described in UniProtKB/Swiss-Prot protein
database (Table 3.4).
In Group I, 8 proteins were found to be differentially expressed in treated MeWo
cells. Of these, type I cytoskeletal 13 keratin was found to be up-regulated (p<0.05). Its
expression was significantly up-regulated about 1.4-1.8 folds higher than untreated
cells. Proteins that were down-regulated in treated cells were identified as Ephrin-B1,
alpha-centractin, bystin, superoxide dismutase, tubulin beta chain, F-actin-capping
protein subunit alpha-2 and partitioning defective 3 homolog.
In Group II, 21 proteins were significantly down-regulated in MeWo cells after
treatment with Phyllanthus extracts. Among these down-regulated proteins, HCLS1-
associated protein X-1 and casein kinase II subunit alpha proteins showed the greatest
reduction at 1.5-2.3 folds in their expression as compared to untreated cells (p<0.05).
In Group III, 5 enzymes were down-regulated in treated MeWo cells. These
identified enzymes were glucosamine--fructose-6-phosphate aminotransferase, protein
phosphatase 1 regulatory subunit 3D, alpha-enolase, pyruvate kinase isozymes M1/M2
and phosphoglycerate kinase 1.
In Group IV, 15 proteins were found to be down-regulated at the range of 1.3-
1.9 in Phyllanthus treated MeWo cells as compared to untreated cells. Eight of these
proteins; E3 ubiquitin-protein ligase ARIH2 and RNF115, aspartate aminotransferase,
26S protease regulatory subunit 8, putative elongation factor 1-alpha-like 3,
mitochondrial inner membrane organizing system protein 1 (MINOS), zinc finger
protein, Sec1 and trimethyllysine dioxygenase have been known to be involved
involved in regulation of mitochondrial integrity and stability of cellular proteisn.

158
Figure 3.34: The proteomic profiles of (A) untreated, aqueous- (B) and methanolic- (C)
Phyllanthus treated MeWo cells.

159
Table 3:4: The differentially expressed proteins in treated MeWo cells.
Differentially expressed proteins in Phyllanthus-treated MeWo
cells
Group I
(Cell
adhesion,
migration,
invasion and
metastasis)
Down-regulated Up-regulated
1.
2.
3.
5.
6.
7.
8.
9.
Ephrin –B1
Alpha-centractin
Bystin
Vimentin
Superoxide dismutase
[Mn], mitochondrial
Tubulin beta chain
F-actin-capping protein
subunit alpha-2
Partitioning defective 3
homolog
4. Keratin, type I
cytoskeletal 13
Group II
(Proliferation,
cell cycle and
apoptosis)
Down-regulated
10.
11.
12.
13.
14.
15.
16.
17.
18.
19.
20.
Casein kinase II subunit
alpha
Bis(5'-nucleosyl)-
tetraphosphatase
[asymmetrical]
Mitochondrial import
inner membrane
translocase subunit Tim8
Structure-specific
endonuclease subunit
SLX1
E3 ubiquitin-protein
ligase TRAF7
Humanin-like protein 9
Galectin-3
Heterogeneous nuclear
ribonucleoprotein H
Annexin A5
Transcription elongation
factor A protein-like 3
Nuclear body protein
SP140-like protein
21.
22.
23.
24.
25.
26.
27.
28.
29.
30.
31.
32.
14-3-3 protein theta
Peptidyl-prolyl cis-trans
isomerase A
Zinc finger protein 169
GRB2-related adapter
protein
HCLS1-associated
protein X-1
Methyl-CpG-binding
domain protein 4
Glutathione transferase
omega – 1
Peroxiredoxin-1
Serpin B9
E3 ubiquitin-protein
ligase ZNRF1
E3 ubiquitin-protein
ligase ARIH2
E3 ubiquitin-protein
ligase RNF115

160
Group III
(Glycogenesis
and
glycolysis)
Down-regulated
33.
34.
35.
Glucosamine--fructose-6-
phosphate
aminotransferase
[isomerizing] 2
Protein phosphatase 1
regulatory subunit 3D
Alpha-enolase
36.
37.
Pyruvate kinase
isozymes M1/M2
Phosphoglycerate kinase
1
Group IV
(Protein
synthesis and
energy
metabolisms)
Down-regulated
38.
39.
40.
41.
42.
43.
44.
Aspartate
aminotransferase,
cytoplasmic
Small proline-rich
protein 3
Patatin-like
phospholipase domain-
containing protein 4
Ethanolamine kinase 1
26S protease regulatory
subunit 8
Putative elongation factor
1-alpha-like 3
Mitochondrial inner
membrane organizing
system protein 1
45.
46.
47.
48.
49.
50.
51.
52.
Cathepsin D
AP-4 complex subunit
sigma-1
Adenylate kinase
Metallothionein-1H
Zinc finger protein 534
Mitochondrial inner
membrane protease
ATP23 homolog
Sec1 family domain-
containing protein 1
Trimethyllysine
dioxygenase,
mitochondrial

161
3.8.1.2 Proteomic profiling of human prostate adenocarcinoma, PC-3 cells
There were 72 differentially expressed proteins identified in treated PC-3 cells
(Table 3.5). In Group I, 10 proteins were found to be differentially expressed in
Phyllanthus treated PC-3 cells. Of these, three keratin proteins (type II cytoskeletal 8,
type I cytoskeletal 9, and keratin-associated protein 3-1) were observed to be up-
regulated. Notably, these up-regulated proteins were derived from same family, keratin
and their expressions were about 1-2 folds higher than untreated cells. The 7 other
proteins found to be down-regulated were Ephrin-B1, actin, EH domain-binding protein
1, heat shock protein 1, vimentin, tubulin alpha-8 chain and MEMO1.
In Group II, 28 proteins were significantly down-regulated in treated PC-3 cells.
Among these altered proteins, five namely gluthathione S-transferease P, protein Wnt-
5a, proto-oncogene Wnt-3, putative Ras-related protein Rab-42 and GTPAse HRas
precursor showed the greatest reduction in their expression with a range of 1.7-2.2 folds
higher than untreated cells (p<0.05).
In Group III, 7 down-regulated proteins were identified in the treated PC-3 cells
and five of them were enzymes; phosphoglycerate kinase-1, alpha-enolase,
glyceraldehyde-3-phosphate dehydrogenase (G3PD), fructose-biphosphate aldolase and
triosephosphate isomerase.
In Group IV, 27 proteins were differentially expressed with only one being
significantly up-regulated in PC-3 after treatment with Phyllanthus extracts; voltage-
dependent anion-selective channel protein 1 in the range of 1.5-1.8 folds higher. Among
the down-regulated proteins detected, four have been associated with calcium regulation
were detected; 39S ribosomal protein L51, calumenin, calreticulin and 78 kDa glucose
regulated protein.

162
Figure 3.35: Proteomic profiles of (A) untreated, aqueous- (B) and methanolic- (C)
Phyllanthus treated PC-3 cells.

163
Table 3.5: The differentially expressed proteins in treated PC-3 cells.
Differential expressed proteins in Phyllanthus-treated PC-3 cells
Group I
(Cell adhesion,
migration,
invasion and
metastasis)
Down-regulated Up-regulated
1.
3.
4.
5.
8.
9.
10.
Ephrin –B1
Actin, cytoplasmic 2
EH domain-binding protein
1
Heat shock protein beta-1
Vimentin
Tubulin alpha-8 chain
Protein MEMO1
2.
6.
7.
Keratin, type II
cytoskeletal 8
Keratin, type I cytoskeletal
9
Keratin-associated protein
3-1
Group II
(Proliferation,
cell cycle and
apoptosis)
Down-regulated
11.
12.
13.
14.
15.
16.
17.
18.
19.
20.
21.
22.
23.
24.
DNA damage-binding
protein 2
Transcription factor 23
Proliferation-associated
protein 2G4
Growth factor receptor-
bound protein 2
Gremlin-1
14-3-3 protein theta
14-3-3 protein gamma
Annexin A1
Coiled-coil domain-
containing protein 74B
Heterogeneous nuclear
ribonucleoprotein H
Glutathione S-transferase P
Protein Wnt-5a
Transmembrane protein
222
Sperm protein associated
with the nucleus on the X
chromosome N3
25.
26.
27.
28.
29.
30.
31.
32.
33.
34.
35.
36.
37.
38.
ATP-dependent DNA
helicase Q1
Galectin-1
Heat shock protein beta-1
Glutathione transferase
omega – 1
Peroxiredoxin-1
Thioredoxin-dependent
peroxide reductase,
mitochondrial
RuvB-like 2
Serpin B9
E3 ubiquitin-protein ligase
ZNRF1
Probable G-protein coupled
receptor 179
Bcl-2-like protein 11
Proto-oncogene Wnt-3
precursor
Putative Ras-related
protein Rab-42
GTPase HRas precursor
Group III
(Glycogenesis
and glycolysis)
Down-regulated
39.
40.
41.
42.
Urocortin-3
Phosphoglycerate kinase 1
Alpha-enolase
Glyceraldehyde-3-
phosphate dehydrogenase
43.
44.
45
Fructose-bisphosphate
aldolase a
Triosephosphate isomerase
Neuroglobin

164
Group IV
(Protein
synthesis and
energy
metabolisms)
Down-regulated
45.
46.
47.
48.
49.
50.
51.
52.
53.
54.
55.
56.
57.
58.
39S ribosomal protein
L51
Betaine--homocysteine S-
methyltransferase 1
Bis(5'-nucleosyl)-
tetraphosphatase
[asymmetrical]
Galactose-3-O-
sulfotransferase 3
Type 2 lactosamine
alpha-2,3-
sialyltransferase
Calumenin
Protein disulfide-
isomerase A4
Calreticulin
Heat shock protein HSP
90-alpha
ADP/ATP translocase 1
6-phosphogluconate
dehydrogenase,
decarboxylating
5'-AMP-activated protein
kinase subunit beta-1
78kDa glucose-regulated
protein
NADH dehydrogenase
[ubiquinone] 1 alpha
subcomplex subunit 12
59.
60.
61.
62.
63.
64.
65.
66.
67.
68.
69.
71.
72.
Protein disulfide-isomerase
A3
Elongation factor Tu,
mitochondrial
Mitochondrial inner
membrane organizing system
protein 1
NADH dehydrogenase
[ubiquinone] flavoprotein 2,
mitochondrial
ADP-ribosylation factor-like
protein 6
Vacuolar protein sorting-
associated protein 26A
BTB/POZ domain-containing
protein KCTD5
Dynamin-1-like protein
Nicotinamide N-
methyltransferase
Proteasome subunit beta
type-3
Speckle-type POZ protein-
like
Adenylate kinase isoenzyme
6
Eukaryotic translation
initiation factor 3 subunit 12
Up-regulated
70. Voltage-dependent anion-selective channel protein 1

165
CHAPTER 4: DISCUSSION
The integration of human knowledge and intelligence in science and technology
has improved the quality of human health with earlier diagnosis, different types of
treatments and reductions in hospitalization. However, the global burden of cancer has
not decreased but has seen a continuous rise (Ferlay et al., 2010). Modern cancer
treatment therapies such as surgery, chemotherapy and immunotherapy are deemed
relatively unsuccessful due to their ineffectiveness, side effects, safety issues and
costliness. In addition, humankind is confronted with increasing implementation of
cancer-associated lifestyle choices such as smoking and physical inactivity, contributing
to an increase in the number of deaths caused by cancer annually (Hanahan &
Weinberg, 2011). As not all cancer patients respond positively to current anticancer
agents, mortality rates of certain cancers continue to rise, including melanoma and
prostate cancer.
Herbs and plants are the basic remedies in many traditional medicine systems
and have been extensively used throughout the world for thousands of years and still
continue to offer mankind with alternatives for disease treatment. The exploration of
anticancer agents from plant sources began in the 1950s and is still active, with the
successful discoveries of plant-derived anticancer drugs such as taxol, vinblastine and
vincristine (Cragg & Newman, 2005; Shoeb, 2006). The “back to basics” approach is
due to both its long history of usage in disease treatment and the
pharmacological/nutritional value of these products which are believed to be able to
halt/delay cancer progression (Deorukhkar et al., 2007).
In this study, the anticancer properties of four Phyllanthus (P.amarus, P.niruri,
P.urinaria and P.watsonii) were studied on human melanoma, MeWo and prostate
166
adenocarcinoma, PC-3 cells. The main aims of this study were to identify the various of
ways by which Phyllanthus plant extracts exert their anti-cancer properties on these two
cancer cell lines
4.1 Bioactive Compounds in Phyllanthus
Food is the main source of essential nutrients to support the nutritional needs of
our body. Plant-based foods contain a wide range of non-nutrient bioactive compounds
for vital biological functions including the defense system. These bioactive compounds
are normally non-toxic in the human body and are important for health promotion.
Several epidemiologic studies have shown that a plant-based diet provided protective
effects on chronic diseases such as cancer (Duthie et al., 2000; Talalay & Fahey, 2001).
In cancer treatment, approximately 74% of anticancer agents are naturally derived
products (Tan et al., 2006).
Phyllanthus extracts were subjected to high performance liquid chromatography
(HPLC) coupled with electronspray ionization (ESI) and mass spectrometry (LCMS-
MS) analysis to identify the presence of bioactive compounds. The results revealed that
Phyllanthus extracts consists of twelve bioactive compounds; gallic acid,
galloylglucopyronside, digalloylglucopyronside, trigalloylglucopyronside,
tetragalloylglucopyronoside, corilagen, geraniin, rutin, quercetin glucoside, quercetin
diglucoside, quercetin rhamnoside, and caffeolquinic acid. (Table 3.1) Some of these
bioactive compounds such as geraniin, corilagen and gallic acid have been proven to
possess anticancer effect on different cancers (Alía et al., 2006; Guruvayoorappan &
Kuttan, 2007; Lee et al., 2008a; Chen et al., 2009).
Geraniin is the main tannin in Euphorbiaceae and its hydrolysation produces
corilagin (Okuda et al., 1980). Both of these compounds were identified in all four

167
Phyllanthus species. In addition, geraniin is the only bioactive compound that can be
found in both aqueous and methanolic extracts of four Phyllanthus species. Geraniin
and corilage have been shown to contribute to growth arrest and induction of apoptosis
in several cancer cells (Pan et al., 2000; Huang et al., 2004b; Chu et al., 2007; Lee et
al., 2008a; Wang & Jin, 2010; Xiong & Qing, 2010). Besides this, gallic acid has been
shown to exhibit anti-proliferative effects on several cancer cell lines such as lung
(Ohno et al., 1999; Choi et al., 2009), stomach, colon (Yoshioka et al., 2000), prostate
(Chen et al., 2009) and cervical (Choi et al., 2009).
As no individual class of components could be fully responsible for the
activity/effect produced by a whole extract (Sun & Hai Liu, 2006), it was therefore
more meaningful to assess the activity of Phyllanthus extracst as a whole mixture of
bioactive compounds rather than as their individual compounds. Semi-purification of
crude extract of Phyllanthus yielded two fractions (fraction 1 and 2). Both fractions
were evaluated for their cytotoxicity as comparison to crude extracts of Phyllanthus
species.
4.2 Anti-Proliferative Effect of Phyllanthus
Anti-proliferative effect or cytotoxicity screening was conducted on human skin
melanoma (MeWo) and prostate (PC-3) cancer cell lines. The half-maximal inhibitory
concentration (IC50) value is a parameter used to assess dose/concentration of anticancer
drug, which has an impact on the proliferation of cancer cells. In the present study,
crude (aqueous and methanolic) extracts of four plant species of Phyllanthus displayed
different IC50 values on human skin melanoma (MeWo) (Table 3.2) and prostate (PC-3)
(Table 3.3) cell lines. The variations in the IC50 values of Phyllanthus extracts against
melanoma and prostate cancer cells might be due to the differing levels of bioactive
168
compounds present in each Phyllanthus species. Among the four Phyllanthus species,
P. urinaria showed the strongest anti-proliferative effect with the lowest IC50 values
compared to other species. This could be associated to the presence of higher content of
bioactive compounds in both extracts.
As noted, the methanolic extracts of Phyllanthus seemed to have more
pronounced anti-proliferative effects compared to the aqueous extracts as their effect
was exhibited at a relatively low dose. Geraniin can be found in both aqueous and
methanolic extracts. However, geraniin is present together with other bioactive
compounds in aqueous extracts. This mixture might have reduced the killing effect of
geraniin on cancer cells, thus resulting in the aqueous extracts exerting the same anti-
proliferative effect at a higher dose as compared to methanolic exracts. Several studies
reported that the organic-soluble compounds are likely to inhibit or are lethal to
cancerous cells than water-soluble compounds based solely on its toxicity effect (Cai et
al., 2004; Saetung et al., 2005).
Phyllanthus extracts have exhibited low cytotoxic effects on normal human skin
(CCD- 1127Sk) and prostate (RWPE-1) cell lines as well as the human umbilical vein
endothelial cells (HUVECs). These findings correlate with studies carried out by Huang
et al. in which Phyllanthus plants likely displayed selective killing against cancer cells
(Huang et al., 2004a). This selective anti-proliferative or cytotoxic effect of Phyllanthus
is important because currently available anticancer drugs can target normal cells and
cancer cells, resulting in serious side effects. Thus, Phyllanthus may be applied in
cancer treatments as it has much lower undesirable side effects.
The anti-proliferative effect of Phyllanthus species could be due to the presence
of different bioactive compounds in aqueous extract including galic acid, rutin, and
quercetin, as well as geraniin in both aqueous and methanolic extracts (Table 1). These
169
bioactive compounds have been reported to possess anti-proliferative effects associated
with their natural antioxidant activity (Aruoma et al., 1993; Lamson & Brignall, 2000;
Yen et al., 2002; Alía et al., 2006; Lin et al., 2008; Ito, 2011). The roles of these
bioactive compounds against cancer have been well documented as they can reduce the
chance of cancer development by preventing mutation caused by free radicals in normal
cells (Rao & Agarwal, 2000; Hayes & McMahon, 2001). Therefore, the low anti-
proliferative effect of Phyllanthus extracts on normal cells (CCD- 1127Sk, RWPE-1
and HUVECs) is believed due to presence of these naturally occurring bioactive
compounds with antioxidative properties in Phyllanthus plant extracts.
Phyllanthus plant extracts exhibited selective cytotoxicity against MeWo and
PC-3 human cancer cells. In comparison, the plant extracts did not show any significant
cytotoxicity on normal human skin (CCD-1127Sk) and prostate (RWPE-1) cells. In
contrast, semi-purification of all Phyllanthus’ aqueous crude extract; fraction 1 and 2
have displayed cytotoxicity to both normal and cancer cell lines. As mentioned earlier,
no any individual class of components in an extract could be entirely held accountable
for the activity produced by the whole extract itself (Sun & Hai Liu, 2006). Therefore, it
was more meaningful to assess the anticancer activity of Phyllanthus as a complete
mixture of bioactive compounds in crude extracts rather than fractionation of
Phyllanthus species.
4.3 Regulation of Cancer Cells Proliferation by Phyllanthus
Cell cycle is the main regulator in cell proliferation and growth. Deregulation of
this process will drive cancer cells into uncontrolled proliferation, which has been
described as one of the hallmark traits of cancer (Evan and Vousden, 2001). This
deregulation of cell cycle in human cancer appears to be the ultimate targets for possible

170
therapeutic interventions. Several studies have showed that the anti-proliferative effects
of cytotoxic agents are attributed to cell cycle arrest at different phases (G0/G1, S or
G2/M) and lead to apoptosis induction (Hsieh & Wu, 1999; Evan & Vousden, 2001).
Phyllanthus extracts induced cell cycle arrest at S-phase in MeWo cell (Figure
3.2) indicating that DNA synthesis was interupted, halting the progression of cell cycle
at S-phase and leading to apoptosis induction with evidence of apoptotic cell
accumulation of Sub-G1 phase. The induction of apoptosis in MeWo cells was further
implicated with caspases-3/7 activation, TUNEL-positive cells and DNA fragmentation
(Figure 3.4-3.7). The S-phase arrest in Phyllanthus treated MeWo cells were due to an
alteration in MAPK/JNK and PI3K/Akt (Figure 3.29). Shishodia et al. has shown the
the suppression of PI3K/Akt and activation of JNK/c-Jun would lead to activation of
cyclin-dependent kinase inhibitor (CKI), p21 to induce S-phase arrest (Shishodia et al.,
2007). In addition, the cell cycle arrest at S-phase was further imposed with the
activation of p53 in treated MeWo cells (Figure 3.28A).The involvement of p53 to
induce cell cycle arrest at S-phase was observed as p21 is a major target for
transactivation by p53 (Radhakrishnan et al., 2004). The activation of p21 will induce
cell cycle arrest at S-phase through two mechanisms; (1) interaction of p21 with the
proliferating cell nuclear antigen (PCNA) (Waga et al., 1994; LaBaer et al., 1997;
Levine, 1997) and/or (2) p21 directly inhibiting the activity of cyclin E/CDK2
complexes (Harper et al., 1995; Kuwajerwala et al., 2002; Shishodia et al., 2007).
Beyond its involvement with cyclin/CDKs, p21 also involved in regulation of various
DNA-binding proteins that contribute to growth arrest including NFκB, Myc, E2F,
STAT3, and estrogen receptor (Perkins, 2002; Coqueret, 2003; Fritah et al., 2005).
Therefore, the down-regulations of c-myc (Figure 3.31) and NFκB (Figure 3.33A)
proteins were observed in MeWo cells after treatment with Phyllanthus extracts (Figure
4.1C and 4.1D).

171
Phyllanthus extracts have exerted their growth arrest on treated-PC-3 cells by
accumulating the cells at Go/G1-phase (Figure 3.3), indicating that Phyllanthus extracts
may interfere with protein synthesis in PC-3 cells. The induction of apoptosis by
Phyllanthus was observed with accumulation of apoptotic cells at Sub-G1 phase, and
further implicated with caspases-3/7 activation, TUNEL-positive cells and DNA
fragmentation (Figure 3.4-3.7). The G1-phase arrest in Phyllanthus treated PC-3 cells
was believed due to the down-regulation of MAPKs, Wnt, NFκB and Myc/Max
pathways (Figure 3.30, 3.32 and 3.33). The down-regulation of these pathways could
lead to the activation of cyclin-dependent kinase inhibitor (CKI), p27, which in turn, the
activated p27 proteins could inhibit the activation of cyclin E/CDK2 and/or cyclin
D/CDK4 complexes that halted cell cycle progression at G1 phase (Collins et al., 2005;
Ollinger et al., 2007). In addition, down-regulation of Wnt and Myc/Max pathways by
Phyllanthus in PC-3 cells caused activation of GSK3β to degrade c-myc and β-catenin
proteins (Figure 4.2C), which in turn, reduce production of cyclin D, which is an
important initiator of cell cycle. Several studies have shown the involvement of Wnt
and Myc/Max pathways in regulation of cyclin D to induce cell growth arrest
(Massagué, 2004; Dolcet et al., 2005; Tang et al., 2009).
4.4 Induction of Apoptosis by Phyllanthus
Evasiveness of apoptosis is one of the hallmarks of cancer. This can be achieved
by suppressing the expression of pro-apoptotic protein, Bax and stimulating the
expression of anti-apoptotic protein, Bcl-2. However, the expression of Bcl-2 was
greatly suppressed, accompanied by the up-regulation of Bax expression in Phyllanthus-
treated MeWo and PC-3 cells (Figure 3.28). The reduction in Bcl-2 expression was due
to the inhibitions in MAPK pathway by Phyllanthus extracts (Milella et al., 2002; Xiao
et al., 2004) (Figure 3.29 and 3.30). The highly expressed Bax could induce cytochrome

172
c release from the mitochondria which can then induce proteolytic activation of
procaspse-9. This in turn activates caspase-3 and -7 (Kirsch et al., 1999; Fan et al.,
2005) as detected (Figure 3.4) and finally leads to apoptosis induction in MeWo and
PC-3 cancer cells (Figure 4.1E and 4.2E).
Other pro-apoptotic factors, caspase-3 and -7 were also found to be up-regulated
in treated MeWo and PC-3 cells (Figure 3.4). The actived caspase-3 and -7 can induce
apoptosis via (1) cleaving and releasing of caspase-activated DNase (CAD) from its
inhibitor in CAD/ICAD complex, which in turn, translocates into the nucleus to cause
internucleosomal DNA fragmentation (Cohen, 1997; Fan et al., 2005) and (2)
inactivation of enzyme poly (ADP-ribose) polymerase (PARP) (Los et al., 2002).
Therefore, elevation of these caspases after Phyllanthus treatment produces the
appearance of the morphological characteristics of apoptosis, allowing for DNA
fragments to be seen on an agarose gel (Figure 3.7) and is further confirmed with the
presence of TUNEL-positive cells (Figure 3.5). Hence, the anti-proliferative effect of
Phyllanthus extracts on MeWo and PC-3 cancer cell lines was accompanied with
apoptosis by triggering the activation of caspase-3 and -7. Several studies have reported
the involvement of geraniin, rutin, quercetin and gallic acid that presence in Phyllanthus
extracts to induce apoptosis via caspases activation (Serrano et al., 1998; Ohno et al.,
1999; Shen et al., 2003; Lee et al., 2008a; Wang & Jin, 2010).
The PI3K/Akt pathway is an overactive intracellular signalling pathway that can
be found in different cancers that involves in the regulation of apoptosis, cell cycle
progression and cellular growth (Figure 4.1A and 4.2A) (Luo et al., 2003; Osaki et al.,
2004; Vara et al., 2004). However, supression of Akt protein by Phyllanthus was
observed in both MeWo and PC-3 cells (Figure 3.29 and 3.30) and this suppression
could induce apoptosis through activation of pro-apoptotic factors such as Bax, GSK3β,
procaspase-9 and TRAIL/APO-2L (TNF-Related Apoptosis-Inducing Ligand) (Cross et

173
al., 1995; Datta et al., 1997; Testa & Bellacosa, 2001). The activation of Bax and
GSK3β were both detected in the treated cancer cells (Figure 3.28, 3.31 and 3.32).
Induction of apoptosis by Phyllanthus will be further implemented when the
transcription factor cyclic AMP response element-binding protein (CREB) and IκB
kinase (IKK), a positive regulator of NFκB are dephosphorylated by Akt protein, thus
possibly leading to a reduction in the expression of genes with anti-apoptotic activity
(Kane et al., 1999; Vara et al., 2004).
Ras proteins are membrane bound GTPases responsible for transmitting
extracellular signals into the nucleus to regulate gene-driven malignancy of cancer
including proliferation, apoptosis, evasion, metastasis and angiogenesis (Figure 4.1B
and 4.2B) (Roberts & Der, 2007). The observed down-regulation of pan-Ras proteins by
Phyllanthus will then leads to suppression of its downstream target; c-Raf (Figure 3.29
and 3.30). The major downstream targets of c-Raf can be subdivided into three mitogen-
activated protein kinase (MAPK) pathways; ERK1/2, JNK1/2 and p38 MAPK (Figure
4.1B and 4.2B). In cancer cells, the activate ERK1/2 molecules will activate RSK and
Elk1 proteins that subsequently activate c-Jun and c-Fos proteins. Both c-Jun and c-Fos
will then combine to form an activator protein (AP-1) which is a transcription factor
that regulates survival genes (Figure 4.1B and 4.2B). Besides that, JNK1/2 and p38
MAPK pathways are also involved in enhancing AP-1 formation by also producing c-
Jun and c-Fos (Roberts & Der, 2007). However, all these intracellular signalling
molecules involved in the MAPK signalling were noted to be down-regulated in MeWo
and PC-3 cells after treatment with Phyllanthus extracts (Figure 3.29 and 3.30). These
observations could be due to presence of quercetin and gallic acid in Phyllanthus
extracts that induce apoptosis via suppression of MAPK pathway as observed (Ishikawa
& Kitamura, 2000; Nguyen et al., 2004; Granado-Serrano et al., 2006; Ho et al., 2010).
174
Tumour necrosis factor-alpha (TNF-α) is a cytokine that and is capable of
activating multiple downstream signalling pathways, including caspases, IκB kinase
(IKK) and JNK (Baud & Karin, 2001; Lin, 2002). TNF-α does not usually induce
apoptosis unless NFκB has been inactivated (Baud & Karin, 2001; Karin & Lin, 2002).
During TNF-α induced apoptosis, caspases will be activated and IKK will be
inactivated. The inactivation of IKK causes NFκB to bind to its inhibitor and is then
unable to translocate into nucleus to regulate its target genes, which include inhibitors
of apoptosis (IAPs) family (Baldwin, 2001; Karin & Lin, 2002). Therefore, Phyllanthus
probably causes apoptosis in MeWo cells by regulating TNF-α induced apoptosis
through activation of the JNK pathway (Figure 3.29) and inhibition of NFκB pathway
(Figure 3.33A).
In different types of cancer, NFκB is constitutively active and is believed to play
an anti-apoptotic role (Ahn et al., 2007). The inhibition of NFκB was observed in
MeWo and PC-3 cells after treatment with Phyllanthus extracts (Figure 3.33). The
inhibitory effect of Phyllanthus extracts on NFkB pathway was conducted by measuring
the activities of NFkB-1 (p50) and NFkB -2 (p52). Both p50 and p52 lack a
transactivation domain, thus are required to form homodimers or heterodimers with
other Rel subunits, in order to regulate its target genes (Figure 4.1D and 4.2D). The
anti-apoptotic effects of active NFκB have been proposed as NFκB induces the
expression of the Inhibitors of Apoptosis (IAPs) and some anti-apoptotic proteins. The
IAPs can suppress the activation of effector caspases (caspases-3, -6, -7, and 9),
whereas anti-apoptotic proteins (e.g. Bcl-2) can antagonize the function of the pro-
apoptotic proteins (e.g. Bax). Therefore, the observed down-regulation of NFκB
pathways in treated cancer cells (Figure 3.33) is believed to inhibit proliferation and by
suppressing anti-apoptotic proteins (Bcl-xl and cIAP) as well as by inducing

175
programmed cell death in MeWo and PC-3 cells (Figure 4.1D and 4.2D) (Levine et al.,
2003; Aggarwal, 2004).
The highly conserved cellular processes of apoptosis cannot be regulated by a
single protein; instead they are usually controlled by a group of tightly regulated
proteins. Uncontrolled proliferation of cancer cells can cause many of these proteins to
be differentially expressed to pace with the tumour growth. With the treatment of
Phyllanthus, many of these proteins were found to be altered in MeWo (Table 3.4) and
PC-3 cells (Table 3.5) such as keratin, Ephrin-B1, alpha-centractin, bystin, tubulin,
actin, vimentin and protein MEMO1 (Figure 4.1G and 4.2G).
Two differentially expressed proteins showed greatest reduction in their
expression in treated cells after treatment with Phyllanthus; HCLS1-associated protein
X-1 (HAX1) and casein kinase II subunit alpha (CK2). HAX-1 is a 35kDa protein that
interacts with HS1 and the α-subunit of G13 heterotrimeric G protein for cell migration
(Suzuki et al., 1997; Radhika et al., 2004). HAX-1 is highly expressed in hypoxic
tumour progression, metastatic pancreatic cancer and oral squamous cell carcinoma,
liver, lung, and breast cancer (Velculescu et al., 1995; Jiang et al., 2003; Ramsay et al.,
2007). The down-regulation of HAX-1 is believed to inhibit cell migration and induce
apoptosis as it shares partial sequence similarity with pro-apoptotic proteins in Bcl-2
family (Suzuki et al., 1997; Klein et al., 2006). CK2 is a highly conserved protein
serine/threonine kinase and is highly expressed in different cancers (Landesman-Bollag
et al., 2001; Litchfield, 2003; Izeradjene et al., 2005). Several studies showed that the
involvement of CK2 has anti-apoptotic function through (1) inhibition on Max which is
a transcriptional partner of the c-myc, from caspase-mediated degradation (Krippner-
Heidenreich et al., 2001), (2) deactivation of Bid, a pro-apoptotic protein (Desagher et
al., 2001), and (3) through protection from Fas- and drug-triggered apoptosis (Desagher
et al., 2001; Guo et al., 2001). Therefore, down-regulation of CK2 in treated MeWo
176
cells could elicit apoptosis induction and could increase the susceptibility of MeWo
cells to apoptotic inducer chemotherapeutic agents (Faust & Montenarh, 2000; Ravi &
Bedi, 2002; Ruzzene et al., 2002).
Another differentially expressed protein that showed reduction in its expression
in treated cells after treatment with Phyllanthus was galectin. Galectin is a
multifunctional protein, which can act as (1) an apoptosis inhibitor (Yang & Liu, 2003;
Hoyer et al., 2004), (2) mRNA splicing promoter (Dagher et al., 1995; Vyakarnam et
al., 1997), and (3) as an adhesion molecule (Glinsky et al., 2001) to promote cancer
progression and metastasis (Takenaka et al., 2002; Liu & Rabinovich, 2005). Therefore,
the down-regulation of galectins in treated MeWo and PC-3 cells is believed to inhibit
metastasis and trigger programmed cell death.
Besides this, Phyllanthus extracts also disrupted cancer-related proteins involved
in cell cycle to halt the growth of MeWo and PC-3 cells. These altered proteins include
DNA damage-binding protein 2, transcription factor 23, gremlin-1, proliferation-
associated protein 2G4, growth factor receptor-bound protein 2, 14-3-3 proteins,
annexin A1, glutathione, galectin-1, heat shock proteins, peroxiredoxin, RuvB-like 2
and Serpin B9, in treated cancer cells (Table 3.4 and 3.5). Among these proteins, the
expressions of glutathione S-transferases showed the greatest reduction compared to
other proteins. Glutathione S-transferases (GSTs) are a family of enzymes that play an
important role in redox homeostasis. These enzymes are highly expressed in cancer
cells and are believed to limit the efficacy of chemotherapeutic agents (Tew, 1994;
Townsend et al., 2003). This occurs via detoxification whereby the agents are
conjugated with reduced gluthathione, causing them to be more water-soluble and
enhancing the elimination of the agents (Hayes & McMahon, 2001; Michael & Doherty,
2005). Therefore, the suppression of GSTs in treated PC-3 cells could possibly bypass
177
detoxification of Phyllanthus extracts, allowing them to be circulated to target cancer
areas.
Another down-regulated protein by Phyllanthus was Damaged DNA Binding
protein 2 (DDB2). It is a 48kDa subunit protein of the damage-specific DNA-binding
heterodimeric complex (DDB) and is involved DNA repair mechanism, transcription
and cell cycle regulation in normal cells (Datta et al., 2001; Martinez et al., 2001;
Takimoto et al., 2002; Stoyanova et al., 2009). During cell cycle, high levels of DDB2
in G1-phase are observed (Stoyanova et al., 2009). It has been proposed that DDB2
plays an important role in regulation of cell cycle and apoptosis induction rather than in
the DNA repair mechanism (Kulaksız et al., 2005). Therefore, the low level of DDB2
proteins in treated cells is believed to attribute to cell cycle arrest and the triggering
apoptosis induction.
Lactate dehydrogenase (LDH) is a cytoplasmic enzyme that is produced by the
mitochondria and present in all tissues. It plays an important role in oxidation of lactate
while reducing pyruvate in carbohydrate metabolism during anaerobic glycolysis
(Nathan et al., 2006). LDH has been widely used as a general indicator and monitors for
acute or chronic tissue damage, heart attack, kidney and liver disease as well as cancer.
(Goldberg et al., 1989; Ribeiro et al., 1999; Danpure, 2004). The potential of LDH as a
tumour biomarker was identified in several cancers such as melanoma (Ugurel et al.,
2009), lung (Jørgensen et al., 1989; Molina et al., 2004), breast (Seth et al., 2003; Duffy
& Crown, 2008) and prostate cancers (Albers et al., 2008; Scher et al., 2009). During
necrosis, LDH enzyme will be secreted due to damaged cell membrane of necrotic cells
and causes an inflammatory reaction (Drent et al., 1996). However, the changes in the
cytoplasmic membrane integrity during late apoptosis also resulting secretion of LDH
(Rauen et al., 1999; Jiang et al., 2007). Measurements of LDH enzyme as an indicator
of necrosis, demonstrated that Phyllanthus extracts besides having apoptotic activity,

178
also possess minimal capacity for inducing necrotic cell death on both MeWo and PC-3
cells (Figure 3.8 and 3.9). Taken together, the results indicate that the Phyllanthus plant
possesses a dual-capability for cell death.
4.5 Anti-Metastatic Effect of Phyllanthus
Typically, tumour metastasis is the main cause for high morbidity and mortality
rates in cancer patients. Most melanoma and prostate cancer patients’ exhibits clinical
evidence of tumour metastases such as lung, breast and bone metastases (Jemal et al.,
2011). The mortality associated with metastasized tumours, accounting for 90% of all
cancer deaths (Gupta & Massagué, 2006). Metastases has caused poor prognosis in
these cancer patients and is a major clinical challenge in cancer treatment.
Cancer cell interaction with the basement membrane is an important step in the
initiation of the metastatic cascade (Poste & Fidler, 1980; Gupta & Massagué, 2006).
The basement membrane is a thin layer that underlies the epithelium of vessels,
capillaries, cavities and organs. It is composed of glycoproteins such as collagen and
laminin (Okegawa et al., 2004). However, adhesion activity of MeWo and PC-3 cells
after treatment with Phyllanthus extracts to fibronectin and type-IV collagen
respectively, was disrupted (Figure 3.18 and 3.19). In addition, Phyllanthus extracts
have significantly inhibited MeWo and PC-3 cells’ migration and invasion ability in a
dose-dependent manner (Figure 3.10-3.17). Migration of cancer cells across the
endothelium is important for secondary tumour development and Phyllanthus extracts
significantly inhibited the transendothelial migration of MeWo (Figure 3.20) and PC-3
cells (Figure 3.21). All these findings indicate that Phyllanthus exhibits its anti-
metastatic activity through inhibition of several crucial steps of tumour-invasion which
include attachment of tumour cell to the membrane, migration, invasion and
179
transendothelial migration of MeWo and PC-3 cells and could possibly lessen the
chances of secondary tumour formation. Epithelial-mesenchymal transition (EMT) is a
cellular process that allows immotile epithelial cells to become motile mesenchymal
cells, promoting carcinoma invasion and metatstasis as well as resistance to apoptosis
(Voulgari & Pintzas, 2009). Several signalling networks including PI3K/Akt- (Figure
4.1A and 4.2A), Ras/MAPK- (Figure 4.1B and 4.2B), Wnt- (Figure 4.1C and 4.2C) and
NFκB-dependent (Figure 4.1D and 4.2D) pathways in EMT were found to be down-
regulated in treated MeWo and PC-3 cells, and are thus believed to inhibit metastasis of
cancer cells (Klymkowsky & Savagner, 2009). The inhibition on metastasis was further
imposed with the up-regulation of keratin and concurrent down-regulation of vimentin
in MeWo and PC-3 cells after treatment with Phyllanthus. The exact mechanism of up-
regulation of keratin during EMT is unclear but its down-regulation in treated cells can
restrict the motility of cells, thus halting metastasis (Paccione et al., 2008).
In cell cytosol, Akt protein protects vimentin from caspase-induced proteolysis,
and in Phyllanthus-treated cells, Akt was down-regulated and thus down-regulates
production of vimentin. The overexpression of vimentin is always correlated with
tumour growth and invasion, where vimetin is believed to regulate various intracellular
signalling pathways and cell surivial (Zhu et al., 2010). This is done by (1) stabilization
of the ERK protein, allowing it to be translocated into the nucleus (Perlson et al., 2006;
Satelli & Li, 2011) and (2) preventing assembly of the Raf-14-3-3 complex, allowing
Ras protein to be continuously expressed and thus regulate signalling pathways in cells
(Tzivion & Avruch, 2002). Therefore, down-regulation of vimentin could decrease
melanoma and prostate cancer growth, adhesion and invasion as well as apoptosis
induction via suppression on ERK- and Ras-dependent pathways as observed.
A phosphoserine/phosphothreonine binding protein, 14-3-3 is involved in
protein kinase signalling that regulates several vital biological processes in cancer
180
including cell cycle, DNA damage checkpoint, activation of MAPK, prevention of
apoptosis, and coordination of integrin signalling and cytoskeletal dynamics
(Hermeking, 2003a; Tzivion et al., 2006). This can all be achieved by association of 14-
3-3 with (1) oncogenic proteins (Ras, Bcr and Bcr-Abl), (2) cell survival factors (Bad,
Bax, ASK-1), (3) tumour suppressors (p53, TSC2, p27) and (4) cell cycle regulators
(Cdc25 A, B and C, Wee1, Chk1) as well as (5) proteins involved motility (p130 Cas,
integrins β1, β2, β3 and Ron) (Hermeking, 2003a; Wilker & Yaffe, 2004; Tzivion et al.,
2006). However, all these vital biological processes in MeWo and PC-3 cells are
believed to be interrupted due to the down-regulation of the 14-3-3 protein.
4.6 Anti-Angiogenesis Effect of Phyllanthus
Tumour-induced angiogenesis is the growth of new blood capillaries from pre-
existing blood vessels and involves multiple steps including endothelial cell (EC)
activation, disruption of vascular basement membranes, and migration and proliferation
of ECs (Delgado et al., 2011). Tumour-induced metastasis and angiogenesis are
intrinsically connected as highly vascular tumours may have a higher metastatic
potential than angiogenic tumours (Zetter, 1998). Besides providing oxygen and
nutrients for tumour growth, angiogenesis also provides a path to allow the tumour cells
to metastasize (Weidner et al., 1991).
Tumour-induced angiogenesis has similar cytophysiological changes in
endothelial cells as in metastatic cells. The activated endothelial cells will migrate out
from parental vessels, invade basement membrane, proliferate and assemble into new
capillaries to supply oxygen and nutrients to tumours (Zetter, 1998). Therefore, the anti-
angiogenesis activity of Phyllanthus was studied by assessing cell viability, migration,
invasion and microcapillary-like tube structure formation using HUVECs.
181
The migration and invasion capabilities of endothelial cells are the basis in
angiogenesis. Their motility capability is initiated by pro-angiogenic factors including
VEGF, secreted by the tumour (Carmeliet & Jain, 2000). In addition, this factor can
increase proliferation and differentiation of endothelial cells into capillaries to form new
blood vessels for tumour growth and metastasis. Results show that Phyllanthus extracts
have effectively inhibited the migration and invasion ability of HUVECs (Figure 3.12
and 3.17). In addition, the low expression of VEGF and its regulator, HIF-1α in MeWo
and PC-3 cells were detected after treatment with Phyllanthus extracts (Figure 3.31 and
3.32) and further explaines that Phyllanthus extracts have reduced the expression and/or
secretion of VEGF of cancer cells via suppression on HIF-1α to inhibit angiogenesis
(Figure 4.1C and 4.2C). Therefore, these findings suggested that Phyllanthus extracts
can significantly reduce migration and invasion of endothelial cells, indicating the
plants potential as an anti-angiogenic agents and was shown previously by Huang et al
(Huang et al., 2006). On the ECM gel, HUVECs assembled into microcapillary–like
tube structures or lumen and this formation was inhibited when treated with Phyllanthus
extracts (Figure 3.25).
Besides that, suppression on Wnt and Myc/Max pathways in MeWo (Figure
4.1C) and PC-3 (Figure 4.2C) cells by Phyllanthus extracts can be attributed to down-
regulation of VEGF and HIF-1α. This can achieve by activate GSK3β protein to
degrade β-catenin and c-myc proteins, thus down-regulating the expression of VEGF
and HIF-1α (Figure 3.31 and 3.32). In addition, suppression on MAPK and PI3K/Akt
pathways in MeWo (Figure 4.1A and 4.2B) and PC-3 (Figure 4.2A and 4.2B) cells by
Phyllanthus extracts could also lead to inactivation of VEGF, thus inhibiting tumour-
induced angiogenesis (Adya et al., 2008).
Besides VEGF, the Ephrin-B1 protein also plays an important role in tumour-
induced angiogenesis. Ephrin-B1 can act as a ligand to bind and activate Eph receptor

182
tyrosine kinases that induce migration and integrin-mediated αvβ3 and α5β1 attachment
(Huynh-Do et al., 2002; Sawai et al., 2003; Surawska et al., 2004; Kuijper et al., 2007;
Tanaka et al., 2007). High expression of Ephrin-B1 is found in different types of
advanced cancer such as studies gastric, colorectal, breast, ovarian, neuroblastoma, and
lung cancers (Sawai et al., 2003; Herath et al., 2006; Cortina et al., 2007; Tanaka et al.,
2007; Vaught et al., 2008). Therefore, down-regulation of of Ephrin-B1 by Phyllanthus
extracts could inhibit cancer progression via inhibition on modulation integrin-mediated
cell attachment, migration and angiogenesis (Huynh-Do et al., 2002).
Several plant-derived compounds identified to possess anti-angiogenesis activity
includes sanguinarine isolated from Sanguinaria canadensis, vinca alkaloids from
Catharanthus roseus and pterogynidine from Alchornea glandulos (Eun & Koh, 2004;
Kruczynski et al., 2006; Flávia et al., 2009). The anti-angiogenic effect of Phyllanthus
against endothelial cells could be due to the presence of bioactive compounds in the
plant such as gallic acid, rutin and quercetin (Donnini et al., 2006; Guruvayoorappan &
Kuttan, 2007; Chen et al., 2009). These compounds have been reported to reduce the
sensitivity of endothelial cells towards VEGF via inhibitions on several signalling
pathways including PI3k/Akt, NFκB and Ras/MAPK pathways (Figure 3.29, 3.30 and
3.33) (Shiojima & Walsh, 2002; Donnini et al., 2006; Liu et al., 2006b; Adya et al.,
2008; Kitamura et al., 2008; Lu et al., 2010). All these findings indicate that
Phyllanthus can inhibit tumour growth through the suppression of blood vessel
development and has a high potential to be developed as an anti-angiogenesis agent.
Furthermore, Phyllanthus could also possibly prevent other angiogenesis-mediated
disorders such as diabetic blindness, age-related macular degeneration, rheumatoid
arthritis and stroke.

183
4.7 Activation of Matrix Metalloproteinases by Phyllanthus
In metastasis, matrix proteolytic enzymes such as matrix metalloproteinases
(MMPs) are known to be crucial for degradation of extracellular matrix components and
promoting both endothelial and tumour cellular invasion in vitro and in vivo (Huang et
al., 2006; Bourboulia & Stetler-Stevenson, 2010). Overexpression of MMP enzymes is
always associated with poor prognosis (Sier et al., 1996; Yoshizaki et al., 2001;
Pellikainen et al., 2004; Liu et al., 2005). MMP-2 and MMP-9 are always found highly
expressed in various cancers malignancies, including cervical, melanoma, breast, colon
and prostate cancers (Stearns & Stearns, 1996; Luca et al., 1997; Kondapaka et al.,
1998; Nielsen et al., 1998).
In this study, different MMP enzymes including MMP-2, -7, -9 and -26 were
detected in HUVECs, MeWo and PC-3 cell lines (Figure 3.22-3.24). Phyllanthus
extracts showed inhibitory effects on expression of MMP-2 in HUVECs and MeWo
cells. Human matrilysin-2, also known as MMP-26 is an activator for pro-MMP-9 (Uría
& López-Otín, 2000; Marchenko et al., 2001). MMP-9 and MMP-26 are commonly
found in the human prostate carcinoma tissue samples than in prostatitis, benign
prostate hyperplasia (BSH), and normal prostate tissue (Lee et al., 2006b). However,
PC-3 cells showed reduction of both active MMP-26 and MMP-9 after treatment with
Phyllanthus extracts; in conjuction with increasing levels of pro MMP-9 level (Figure
3.23). Another down-regulated MMP enzyme in treated MeWo and PC-3 cells was
MMP-7 which has a broad proteolytic activity against a variety of extracellular matrix
substrates, including collagens, proteoglycans, elastin, laminin, fibronectin, and casein
(Wilson & Matrisian, 1996; Adachi et al., 1999). The reduction of active MMP-2, -7
and -9 after treatments with Phyllanthus extracts partially explain the inhibition of

184
migration and invasion of endothelial cell as well as melanoma and prostate cancer
cells.
In Phyllanthus, several bioactive compounds have been identified (Tang et al.,
2010). Some of these bioactive compounds have been suggested to inhibit activities of
MMPs including gallic acid and 5-caffeoylquinic acid. Gallic acid has been shown to
inhibit migration and invasion of several cancer cells through the reduction of MMP
activities (Ho et al., 2010; Lu et al., 2010) and 5-caffeoylquinic acid has also been
shown to be a strong inhibitor on MMP-9 (Jin et al., 2005). In addition, these reduced
activities of MMPs upon treatment with Phyllanthus could be due to alteration in signal
transduction in PI3K/AKT, Ras-Raf-MAP kinase, Wnt, NFκB pathways in the
regulation of MMP expression (Figure 4.1 and 4.2) (Montague et al., 2004; Ho et al.,
2010). In addition, both Wnt5a and Wnt-3 proteins are involved in Wnt signalling
pathway and regulation of MMPs, were found to be down-regulated by Phyllanthus
extracts (Masckauchán et al., 2006; Pukrop et al., 2006).
There are several proteins involved in regulations of MMPs that were found to
be altered in treated cancer cells such as superoxide dismutase and heat shock protein.
The down-regulated mitochondrial superoxide dismutase protein could suppress MMP
action and alters intracellular ROS and nitric oxide levels via inhibition on the
MAPK/ERK pathway (Ranganathan et al., 2001; Zhang et al., 2002). In addition,
down-regulation of heat shock protein beta-1 Hsp27 protein could affect MMP-9
activity, thus inhibits metastasis and angiogenesis (Hansen et al., 2001; Aldrian et al.,
2002; Lee et al., 2008b).

185
4.8 Alteration in Energy Metabolism of Cancer cells
The rapid uncontrolled proliferation of cancer cells usually outpaces new blood
vessels generation, hence resulting in insufficient bloods supply/oxygen to tumour
tissues. In this hypoxic condition, the cancer cells are forced to up-regulate the
expression of genes and enzymes which are involved an anaerobic glycolytic pathway
as the main route of energy production, and this phenomenon is known as Wasburg
effect (Warburg, 1956; Hsu & Sabatini, 2008) (Vander Heiden et al., 2009). The
expression of hyoxia-inducible factor (HIF) is activated during low oxygen level
(Guppy, 2002; Xu et al., 2005). The active HIF will mediate activation genes involved
in angiogenesis (e.g. VEGF), cell survival (e.g. IGF-1) and metastasis (e.g. LOX, PAI-
1) and drives tumour progression (Poon et al., 2009). This metabolic adaptation in
response to these alterations is believed to be associated with resistance to therapeutic
agents (Carmeliet et al., 1998).
Phyllanthus extracts were noted to inhibit the glycolytic pathway and energy
production in MeWo and PC-3 by down-regulating HIF-1α protein. The deactivated
HIF-1α protein will reduce the production VEGF and thus inhibit tumour angiogenesis,
glycolytic pathway and energy production and thereby decrease cancer progression
(Figure 3.31 and 3.32). The synthesis of HIF-1α protein in the Wasburg effect is
regulated by activation of the PI3K/Akt and Ras-MAPK (Poon et al., 2009). Therefore,
both PI3K/Akt and Ras-MAPK pathways were also noted to be suppressed by
Phyllanthus plant extracts (Figure 3.29 and 3.30). In addition, several glycolytic
enzymes were significantly down-regulated in MeWo and PC-3 cells after treatment
with Phyllanthus extracts (Table 3.4 and 3.5, Group III) such as glucosamine-fructose-
6-phosphate aminotransferase, fructose-bisphosphate aldolase protein phosphatase 1
186
regulatory subunit 3D, alpha-enolases, pyruvate kinase isozymes M1/M2, urocortin-3,
alpha-enolase, GAPDH and phosphoglycerate kinases.
The mitochondrion is involved in protein synthesis and energy metabolism for
cancer cell survival, transformation, invasion and metastasis (Wallace, 1999). Thirteen
mitochondria-related components (E3 ubiquitin-protein ligase ARIH2 and RNF115,
aspartate aminotransferase, 26S protease regulatory subunit 8, putative elongation factor
1-alpha-like 3, mitochondrial inner membrane organizing system protein 1 (MINOS),
zinc finger protein, Sec1, trimethyllysine dioxygenase, 39S ribosomal protein L51,
calumenin, calreticulin and 78 kDa glucose regulated protein) were found to be down-
regulated in Phyllanthus-treated MeWo (Table 3.4, Group IV) and PC-3 (Table 3.4,
Group IV) cells. This down-regulation is believed to be attributed to alteration in
intracellular calcium, energy production (e.g. ATP) and stability of cellular proteins in
treated (MeWo and PC-3 cells, thus triggering apoptotic cell death and halting cancer
growth (Henderson et al., 1982; Franklin et al., 1997; Yabe et al., 1997; Ferrell et al.,
2000; Sreedhar & Csermely, 2004; Zhang et al., 2004; Thornburg et al., 2008; Alkhaja
et al., 2012; Sun et al., 2012) .
Among the affected mitochondria-related components in Phyllanthus-treated
cells, only one protein was significantly up-regulated; voltage-dependent anion-
selective channel protein 1. Voltage-dependent anion-selective channel protein 1
(VDAC) is a mitochondrial outer membrane protein that regulates ATP/ADP exchange
and respiratory control (Hiller et al., 2008). VDAC has been shown to be pro-apoptotic
by regulation of Bak and Bax (Tsujimoto & Shimizu, 2002; Rostovtseva et al., 2005) as
well as activation of caspase-8 to induce extrinsic apoptosis pathway (Madesh &
Hajnóczky, 2001; Roucou et al., 2002). Therefore, the up-regulation of VDAC by
Phyllanthus extracts was able to initiate apoptotic cell death in cancer cells (Figure
4.2F).

187
Figure 4.1: Schematic diagram illustrating Phyllanthus regulates multiple signalling
[MAPKs (A), PI3K/Akt (B), Myc/Max and Hypoxia (C), NFκB (D) and p53 (E)]
pathways and protein activities (G) in MeWo cells.

188
Figure 4.2: Schematic diagram illustrating Phyllanthus regulates multiple signalling
[(MAPKs (A), PI3K/Akt (B), Wnt, Myc/Max and Hypoxia (C), NFκB (D), and
apoptosis (E)] pathways and protein activities (G) in PC-3 cells.

189
CHAPTER 5: CONCLUSION
Modern therapies for cancer treatment such as surgery, chemotherapy and
immunotherapy are deemed relatively unsuccessful due to their ineffectiveness, safety
issues (side effects) and costliness. Although chemotherapy was advocated at one time,
but recent studies have implied that these agents are no longer effective as they used to
be, mainly these agents being cytotoxic to both normal and cancer cells. These
treatments are often elicited undesirable side effects such as vomiting, nausea and
alopecia. As not all cancer patients respond positively to current anticancer agents, the
mortality rates are on a continuous rise including melanoma and prostate cancer.
Natural product-based traditional medicine, is often overshadowed by modern
medicine, has returned to be a holistic approach for health care in many societies. This
“back to basic” approach is due to its long history of usage in disease treatment and the
pharmacological/nutritional value of these products which are believed to be able to
halt/delay cancer progression. Therefore, the anticancer properties of Phyllanthus plant
extracts were studied against human melanoma, MeWo and prostate adenocarcinoma,
PC-3 cells.
In summary, the findings of the study suggested that Phyllanthus extracts
possesses the ability to suppress the proliferation of MeWo and PC-3 directly without
affecting the growth of normal cells; CCD-1127Sk, RWPE-1 and HUVECs. P.urinaria
showed the strongest anti-proliferative effect on both cancer cell lines with an IC50
value ranged 54.2-56.2 µg/ml and 155.7-193.3 µg/ml for methanolic and aqueous
extracts, respectively. The selective killing on cancer cells by Phyllanthus extracts was
observed. However, the anti-proliferative effect of Phyllanthus extracts should be

190
further investigated on the other types of normal cells to further imposed its selective
killing properties on cancer cells only.
The anti-proliferative effect of Phyllanthus extracts against MeWo and PC-3
cells is likely to be due to the induction of growth arrest and apoptosis. Treatment with
Phyllanthus extracts induced significant different cell cycle arrest in treated MeWo (S-
phase arrest) and PC-3 (G1-phase arrest). Phyllanthus extracts induces cell cycle arrest
at S-phase in MeWo cell was due to an alteration in MAPK/JNK, PI3K/Akt and p53
pathways to interfere activities of the PCNA and/or cyclin E/CDK2 complexes. On the
other hand, the G1-phase arrest in Phyllanthus treated PC-3 cells was due to
suppression on MAPK, PI3K/Akt, Wnt and Myc/Max pathways to inhibit cyclin
E/CDK2 and/or cyclin D/CDK4 complexes, halting cell cycle progression. However, a
detailed investigation on the G1- and S-phases related proteins such as cyclin D, cyclin
E, cyclin A, p21, and p27 as well as other cell cycle regulatory molecules are required
to shed light on the actual molecular mechanisms of Phyllanthus extracts induced cell
cycle arrest.
Phyllanthus extracts were capable to induce apoptosis in PC-3 and MeWo cells
via activation of caspases-3/7 to induce DNA fragmentation. Caspase activation
represents one of the earliest known markers for the onset of apoptosis while DNA
fragmentation which occurs downstream of caspase cascade activation represents a late,
dispensable step in the apoptotic process. Other pro-apoptotic factor, Bax was also
found to be up-regulated in treated cancer cells. The activated Bax could induce
cytochrome c release from mitochondria to initiate caspases-induce apoptosis. However,
a detailed exploration of other pro-apoptotic and anti-apoptotic proteins as well as the
regulatory molecules such as cytochrome c and PUMA needs to be carried out to
explicate the exact molecular mechanism of Phyllanthus-induced apoptosis. Besides
inducing apoptosis, Phyllanthus extracts were also showed to capable induce minimal

191
necrotic cell death. The induction of necrosis by Phyllanthus extracts was observed
through the leakage of LDH enzymes from the treated cancer cells. All these findings
were based on biochemical changes during apoptotic and necrotic mechanisms.
Therefore, further investigation is necessary to investigate Phyllanthus-induce apoptosis
or necrosis in the term of morphological changes. The typical apoptotic cells’
morphology including chromatin condensation, cell shrinkage, membrane blebbing, and
formation of apoptotic bodies can be investigated by staining methods includes Hoescht
33258, Acridine orange/ethidium bromide (AO/EtBr), and Annexin-V. Besides that,
transmission electron microscopy (TEM) may provide a better and clear view of the
morphological changes during apoptosis/necrosis.
Typically, tumour-induced metastasis and angiogenesis are the main cause for
high morbidity and mortality rates in cancer patients. Both are intrinsically connected.
Besides providing oxygen and nutrients for tumour growth, angiogenesis also provides
a path to allow the tumour cells to metastasize. The anti-metastatic and anti-angiogenic
effects of Phyllanthusextracts were observed when Phyllanthus extracts inhibited
several essential steps during metastasis and angiogenesis; (i) adhesion, (ii) migration,
(iii) invasion, (iv) transendothelial migration and (v) microcapillary-like tube
formations. These observations were most likely due to reduction in activities of matrix
metalloproteinase-2, -7, -9 and VEGF in Phyllanthus-treated cells. In addition,
Phyllanthus extracts have impaired energy production and mitochondria integrity of
MeWo and PC-3 cells via inhibition on hypoxia pathway and glycolytic enzymes.
These observed anticancer properties ofPhyllanthus extracts are believed to be
due to the plants inhibitory effects on multiple signalling pathways; MAPKs, Wnt,
Myc/Max, Hypoxia and NFκB, via alteration on their intracellular signalling activities
including c-Ras, pan-Raf, RSK, Akt, Elk1, RSK, c-Jun, JNK1/2, β-catenin, GSK3β, c-
myc, HIF-1α, VEGF, NFκB p50 and p52.
192
The highly conserved cellular processes of invasion, metastasis and apoptosis
cannot be regulated by a single protein; instead they are usually controlled by a group of
tightly regulated proteins. Uncontrolled proliferation of cancer cells can cause many of
these proteins to be differentially expressed to pace with the tumour growth. With the
treatment of Phyllanthus, many of these vital proteins were found to be altered in
MeWo and PC-3 cells and this may affects cellular functions and biological processes in
MeWo and PC-3 cells, thus halts their progression.
In summary, this study revealed a comprehensive perspective of the possible
mechanism behind the anticancer activity of Phyllanthus extracts by inspection of their
regulation in multiple signalling pathways and protein-protein interaction in melanoma
(MeWo) and prostate adenocarcinoma (PC-3) cells. This study not only shows that
Phyllanthus could be developed as an alternative anticancer agent; the identified
diffentially expressed proteins could become potential targets for development of new
anticancer agents. Besides, Phyllanthus also possibly be part of plant-based diet to
prevent cancer development. Further in vivo studies with Phyllanthus alone or in
conjunction with existing chemotherapeutic drugs are needed to demonstrate the overall
effect in a living subject (e.g. mice) in term of toxicity and efficacy as an
anticancer/antitumour agent.

193
REFERENCES
Aaronson, S.A. (1991) Growth Factors and Cancer. Science (New York, NY). 254(5035):
1146.
Abbasi, N.R., Shaw, H.M., Rigel, D.S., Friedman, R.J., McCarthy, W.H., Osman, I.,
Kopf, A.W. and Polsky, D. (2004) Early Diagnosis of Cutaneous Melanoma.
JAMA: the Journal of the American Medical Association. 292(22): 2771-2776.
Adachi, Y., Yamamoto, H., Itoh, F., Hinoda, Y., Okada, Y. and Imai, K. (1999)
Contribution of Matrilysin (Mmp-7) to the Metastatic Pathway of Human
Colorectal Cancers. Gut. 45(2): 252-258.
Adams, J.M. and Cory, S. (2002) Apoptosomes: Engines for Caspase Activation.
Current Opinion in Cell Biology. 14(6): 715-720.
Adeneye, A., Amole, O. and Adeneye, A. (2006) Hypoglycemic and
Hypocholesterolemic Activities of the Aqueous Leaf and Seed Extract of< I>
Phyllanthus Amarus</I> in Mice. Fitoterapia. 77(7): 511-514.
Adya, R., Tan, B.K., Punn, A., Chen, J. and Randeva, H.S. (2008) Visfatin Induces
Human Endothelial Vegf and Mmp-2/9 Production Via Mapk and Pi3k/Akt
Signalling Pathways: Novel Insights into Visfatin-Induced Angiogenesis.
Cardiovascular Research. 78(2): 356-365.
Aggarwal, B.B. (2004) Nuclear Factor-Κb: The Enemy Within. Cancer cell. 6(3): 203-
208.
Agnese, D.M., Abdessalam, S.F., Burak Jr, W.E., Magro, C.M., Pozderac, R.V. and
Walker, M.J. (2003) Cost-Effectiveness of Sentinel Lymph Node Biopsy in Thin
Melanomas. Surgery. 134(4): 542-547.
Ahn, K.S., Sethi, G. and Aggarwal, B.B. (2007) Nuclear Factor-Kappa B: From Clone
to Clinic. Current molecular medicine. 7(7): 619-637.
Airley, R., Loncaster, J., Davidson, S., Bromley, M., Roberts, S., Patterson, A., Hunter,
R., Stratford, I. and West, C. (2001) Glucose Transporter Glut-1 Expression
Correlates with Tumor Hypoxia and Predicts Metastasis-Free Survival in
Advanced Carcinoma of the Cervix. Clinical Cancer Research. 7(4): 928-934.
Akhtar, N., Dickerson, E.B. and Auerbach, R. (2002) The Sponge/Matrigel
Angiogenesis Assay. Angiogenesis. 5(1): 75-80.
Albers, M.J., Bok, R., Chen, A.P., Cunningham, C.H., Zierhut, M.L., Zhang, V.Y.,
Kohler, S.J., Tropp, J., Hurd, R.E. and Yen, Y.F. (2008) Hyperpolarized 13c
Lactate, Pyruvate, and Alanine: Noninvasive Biomarkers for Prostate Cancer
Detection and Grading. Cancer Research. 68(20): 8607-8615.
Aldrian, S., Trautinger, F., Fröhlich, I., Berger, W., Micksche, M. and Kindas-Mügge, I.
(2002) Overexpression of Hsp27 Affects the Metastatic Phenotype of Human
Melanoma Cells in Vitro. Cell Stress & Chaperones. 7(2): 177.
Alía, M., Mateos, R., Ramos, S., Lecumberri, E., Bravo, L. and Goya, L. (2006)
Influence of Quercetin and Rutin on Growth and Antioxidant Defense System of
a Human Hepatoma Cell Line (Hepg2). European Journal of Nutrition. 45(1):
19-28.

194
Alkhaja, A.K., Jans, D.C., Nikolov, M., Vukotic, M., Lytovchenko, O., Ludewig, F.,
Schliebs, W., Riedel, D., Urlaub, H. and Jakobs, S. (2012) Minos1 Is a
Conserved Component of Mitofilin Complexes and Required for Mitochondrial
Function and Cristae Organization. Molecular Biology of the Cell. 23(2): 247-
257.
Amin, A., Gali-Muhtasib, H., Ocker, M. and Schneider-Stock, R. (2009) Overview of
Major Classes of Plant-Derived Anticancer Drugs. International Journal of
Biomedical Science. 5(1): 1-11.
Anagnostopoulos, K., Tentes, I. and Kortsaris, A. (2008) Cell Signaling in Cancer.
Journal of BU ON.: official journal of the Balkan Union of Oncology. 13(1): 17.
Andrietta, M.H., Eloy, N.B., Hemerly, A.S. and Ferreira, P.C.G. (2001) Identification of
Sugarcane Cdnas Encoding Components of the Cell Cycle Machinery. Genetics
and Molecular Biology. 24(1-4): 61-88.
Arantes, R.M.E., Lourenssen, S., Machado, C.R.S. and Blennerhassett, M.G. (2000)
Early Damage of Sympathetic Neurons after Co-Culture with Macrophages: A
Model of Neuronal Injury in Vitro. Neuroreport. 11(1): 177-181.
Aruoma, O.I., Murcia, A., Butler, J. and Halliwell, B. (1993) Evaluation of the
Antioxidant and Prooxidant Actions of Gallic Acid and Its Derivatives. Journal
of Agricultural and Food Chemistry. 41(11): 1880-1885.
Atkins, M.B., Kunkel, L., Sznol, M. and Rosenberg, S.A. (2000) High-Dose
Recombinant Interleukin-2 Therapy in Patients with Metastatic Melanoma:
Long-Term Survival Update. The Cancer Journal from Scientific American. 6:
S11.
Bacac, M. and Stamenkovic, I. (2008) Metastatic Cancer Cell. Annu. Rev. Pathmechdis.
Mech. Dis. 3: 221-247.
Balch, C.M., Gershenwald, J.E., Soong, S., Thompson, J.F., Atkins, M.B., Byrd, D.R.,
Buzaid, A.C., Cochran, A.J., Coit, D.G. and Ding, S. (2009) Final Version of
2009 Ajcc Melanoma Staging and Classification. Journal of Clinical Oncology.
27(36): 6199-6206.
Balch, C.M., Soong, S.J., Bartolucci, A.A., Urist, M.M., Karakousis, C.P., Smith, T.J.,
Temple, W.J., Ross, M.I., Jewell, W.R. and Mihm, M. (1996) Efficacy of an
Elective Regional Lymph Node Dissection of 1 to 4 Mm Thick Melanomas for
Patients 60 Years of Age and Younger. Annals of Surgery. 224(3): 255.
Baldwin, A.S. (2001) Control of Oncogenesis and Cancer Therapy Resistance by the
Transcription Factor Nf-Kappab. Journal of Clinical Investigation. 107(3): 241-
246.
Barker, N. and Clevers, H. (2000) Catenins, Wnt Signaling and Cancer. Bioessays.
22(11): 961-965.
Barkla, H. and Gibson, P.R. (1999) The Fate of Epithelial Cells in the Human Large
Intestine. Pathology. 31(3): 230-238.
Battey, J., Moulding, C., Taub, R., Murphy, W., Stewart, T., Potter, H., Lenoir, G. and
Leder, P. (1983) The Human C-Myc Oncogene: Structural Consequences of
Translocation into the Igh Locus in Burkitt Lymphoma. Cell. 34(3): 779-787.
Baud, V. and Karin, M. (2001) Signal Transduction by Tumor Necrosis Factor and Its
Relatives. Trends in cell biology. 11(9): 372-377.

195
Bazigou, E. and Rallis, C. (2007) Cell Signaling and Cancer. Genome Biology. 8(7):
310.
Bhattacharjee, R. and Sil, P.C. (2006) The Protein Fraction of Phyllanthus Niruri Plays
a Protective Role against Acetaminophen Induced Hepatic Disorder Via Its
Antioxidant Properties. Phytotherapy Research. 20(7): 595-601.
Bhowmick, N.A., Neilson, E.G. and Moses, H.L. (2004) Stromal Fibroblasts in Cancer
Initiation and Progression. Nature. 432(7015): 332-337.
Bindhu, O., Ramadas, K., Sebastian, P. and Pillai, M.R. (2006) High Expression Levels
of Nuclear Factor Kappa B and Gelatinases in the Tumorigenesis of Oral
Squamous Cell Carcinoma. Head & Neck. 28(10): 916-925.
Blom, W.M., De Bont, H.J.G.M., Meijerman, I., Kuppen, P.J.K., Mulder, G.J. and
Nagelkerke, J.F. (1999) Interleukin‐2–Activated Natural Killer Cells Can Induce
Both Apoptosis and Necrosis in Rat Hepatocytes. Hepatology. 29(3): 785-792.
Blumberg, B., Millman, I., Venkates, P. and Thyagarajan, S. (1990) Hepatitis B Virus
and Primary Hepatocellular Carcinoma: Treatment of Hbv Carriers with< I>
Phyllanthus Amarus</I>. Vaccine. 8: S86-S92.
Bode, A.M. and Dong, Z. (2007) The Functional Contrariety of Jnk. Molecular
Carcinogenesis. 46(8): 591-598.
Bold, R.J., Termuhlen, P.M. and McConkey, D.J. (1997) Apoptosis, Cancer and Cancer
Therapy. Surgical Oncology. 6(3): 133-142.
Bono, A., Tomatis, S., Bartoli, C., Tragni, G., Radaelli, G., Maurichi, A. and
Marchesini, R. (1999) The Abcd System of Melanoma Detection. Cancer. 85(1):
72-77.
Bortner, C.D., Hughes Jr, F.M. and Cidlowski, J.A. (1997) A Primary Role for K+ and
Na+ Efflux in the Activation of Apoptosis. Journal of Biological Chemistry.
272(51): 32436-32442.
Bourboulia, D. and Stetler-Stevenson, W.G. Matrix Metalloproteinases (Mmps) and
Tissue Inhibitors of Metalloproteinases (Timps): Positive and Negative
Regulators in Tumor Cell Adhesion. 2010. 20: 161-168. Elsevier.
Buschmann, T., Minamoto, T., Wagle, N., Fuchs, S.Y., Adler, V., Mai, M. and Ronai,
Z. (2000) Analysis of Jnk, Mdm2 and P14< Sup> Arf</Sup> Contribution to the
Regulation of Mutant P53 Stability. Journal of Molecular Biology. 295(4):
1009-1021.
Caamaño, J.H., Perez, P., Lira, S.A. and Bravo, R. (1996) Constitutive Expression of
Bc1-3 in Thymocytes Increases the DNA Binding of Nf-Kappab1 (P50)
Homodimers in Vivo. Molecular and Cellular Biology. 16(4): 1342-1348.
Cai, Y., Luo, Q., Sun, M. and Corke, H. (2004) Antioxidant Activity and Phenolic
Compounds of 112 Traditional Chinese Medicinal Plants Associated with
Anticancer. Life Sciences. 74(17): 2157-2184.
Calixto, J.B., Santos, A.R.S. and Yunes, R.A. (1998) A Review of the Plants of the
Genus Phyllanthus: Their Chemistry, Pharmacology, and Therapeutic Potential.
Medicinal Research Reviews. 18(4): 225-258.
Cancer Council Australia (2012) Skin Cancer [online]. Available:
http://www.cancer.org.au/about-cancer/types-of-cancer/skin-cancer.html.
(Accessed: 15 October 2012).
196
Cancer Research UK (2012) Epstein-Barr Virus [online]. Available:
http://www.cancerresearchuk.org/cancer-
info/cancerstats/causes/infectiousagents/epsteinbarrvirus/. (Accessed: 15
October 2012).
Cancer Reserach UK (2012) Skin Cancer Incidence Statistics [online]. Available:
http://www.cancerresearchuk.org/cancer-
info/cancerstats/types/skin/incidence/uk-skin-cancer-incidence-statistics.
(Accessed: 15th October 2012).
Carlevaro, M.F., Albini, A., Ribatti, D., Gentili, C., Benelli, R., Cermelli, S., Cancedda,
R. and Cancedda, F.D. (1997) Transferrin Promotes Endothelial Cell Migration
and Invasion: Implication in Cartilage Neovascularization. The Journal of Cell
Biology. 136(6): 1375-1384.
Carmeliet, P., Dor, Y., Herbert, J.M., Fukumura, D., Brusselmans, K., Dewerchln, M.,
Neeman, M., Bono, F., Abramovitch, R. and Maxwells, P. (1998) Role of Hif-1
in Hypoxia-Mediated Apoptosis, Cell Proliferation and Tumour Angiogenesis.
NATURE-LONDON-. 485-490.
Carmeliet, P. and Jain, R.K. (2000) Angiogenesis in Cancer and Other Diseases.
NATURE-LONDON-. 249-257.
Chao, D.T. and Korsmeyer, S.J. (1998) Bcl-2 Family: Regulators of Cell Death. Annual
Review of Immunology. 16(1): 395-419.
Chautan, M., Chazal, G., Cecconi, F., Gruss, P. and Golstein, P. (1999) Interdigital Cell
Death Can Occur through a Necrotic and Caspase-Independent Pathway.
Current Biology. 9(17): 967-S961.
Chen, H.M., Wu, Y.C., Chia, Y.C., Chang, F.R., Hsu, H.K., Hsieh, Y.C., Chen, C.C.
and Yuan, S.S. (2009) Gallic Acid, a Major Component of< I> Toona
Sinensis</I> Leaf Extracts, Contains a Ros-Mediated Anti-Cancer Activity in
Human Prostate Cancer Cells. Cancer Letters. 286(2): 161-171.
Cheng, N., Chytil, A., Shyr, Y., Joly, A. and Moses, H.L. (2008) Transforming Growth
Factor-Β Signaling–Deficient Fibroblasts Enhance Hepatocyte Growth Factor
Signaling in Mammary Carcinoma Cells to Promote Scattering and Invasion.
Molecular Cancer Research. 6(10): 1521-1533.
Choi, K.C., Lee, Y.H., Jung, M.G., Kwon, S.H., Kim, M.J., Jun, W.J., Lee, J., Lee, J.M.
and Yoon, H.G. (2009) Gallic Acid Suppresses Lipopolysaccharide-Induced
Nuclear Factor-Κb Signaling by Preventing Rela Acetylation in A549 Lung
Cancer Cells. Molecular Cancer Research. 7(12): 2011-2021.
Chowdhury, S., Vaughan, M. and Gore, M. (1999) New Approaches to the Systemic
Treatment of Melanoma. Cancer Treatment Reviews. 25(5): 259-270.
Chu, S.C., Yang, S.F., Liu, S.J., Kuo, W.H., Chang, Y.Z. and Hsieh, Y.S. (2007) < I> in
Vitro</I> and< I> in Vivo</I> Antimetastatic Effects of< I> Terminalia
Catappa</I> L. Leaves on Lung Cancer Cells. Food and Chemical Toxicology.
45(7): 1194-1201.
Cocconi, G., Bella, M., Calabresi, F., Tonato, M., Canaletti, R., Boni, C., Buzzi, F.,
Ceci, G., Corgna, E. and Costa, P. (1992) Treatment of Metastatic Malignant
Melanoma with Dacarbazine Plus Tamoxifen. New England Journal of
Medicine. 327(8): 516-523.

197
Cockett, M.I., Murphy, G., Birch, M., O'Connell, J., Crabbe, T., Millican, A., Hart, I.
and Docherty, A. Matrix Metalloproteinases and Metastatic Cancer. Biochemical
Society Symposium, 1998. 63: 295.
Cohen, G.M. (1997) Caspases: The Executioners of Apoptosis. Biochemical Journal.
326(Pt 1): 1.
Collins, N.L., Reginato, M.J., Paulus, J.K., Sgroi, D.C., LaBaer, J. and Brugge, J.S.
(2005) G1/S Cell Cycle Arrest Provides Anoikis Resistance through Erk-
Mediated Bim Suppression. Molecular and Cellular Biology. 25(12): 5282-
5291.
Coqueret, O. (2003) New Roles for P21 and P27 Cell-Cycle Inhibitors: A Function for
Each Cell Compartment? Trends in Cell Biology. 13(2): 65.
Cortina, C., Palomo-Ponce, S., Iglesias, M., Fernández-Masip, J.L., Vivancos, A.,
Whissell, G., Humà, M., Peiró, N., Gallego, L. and Jonkheer, S. (2007) Ephb–
Ephrin-B Interactions Suppress Colorectal Cancer Progression by
Compartmentalizing Tumor Cells. Nature Genetics. 39(11): 1376-1383.
Cragg, G.M. and Newman, D.J. (2005) Plants as a Source of Anti-Cancer Agents.
Journal of Ethnopharmacology. 100(1): 72-79.
Cross, D.A.E., Alessi, D.R., Cohen, P., Andjelkovich, M. and Hemmings, B.A. (1995)
Inhibition of Glycogen Synthase Kinase-3 by Insulin Mediated by Protein
Kinase B. Nature. 378(6559): 785-789.
da Rocha, A.B., Lopes, R.M. and Schwartsmann, G. (2001) Natural Products in
Anticancer Therapy. Current Opinion in Pharmacology. 1(4): 364-369.
Dagher, S.F., Wang, J.L. and Patterson, R.J. (1995) Identification of Galectin-3 as a
Factor in Pre-Mrna Splicing. Proceedings of the National Academy of Sciences.
92(4): 1213-1217.
Dalla-Favera, R., Gelmann, E.P., Martinotti, S., Franchini, G., Papas, T.S., Gallo, R.C.
and Wong-Staal, F. (1982) Cloning and Characterization of Different Human
Sequences Related to the Onc Gene (V-Myc) of Avian Myelocytomatosis Virus
(Mc29). Proceedings of the National Academy of Sciences. 79(21): 6497-6501.
Danpure, C. (2004) Lactate Dehydrogenase and Cell Injury. Cell Biochemistry and
Function. 2(3): 144-148.
Datta, A., Bagchi, S., Nag, A., Shiyanov, P., Adami, G.R., Yoon, T. and Raychaudhuri,
P. (2001) The P48 Subunit of the Damaged-DNA Binding Protein Ddb
Associates with the Cbp/P300 Family of Histone Acetyltransferase. Mutation
Research/DNA Repair. 486(2): 89-97.
Datta, S.R., Dudek, H., Tao, X., Masters, S., Fu, H., Gotoh, Y. and Greenberg, M.E.
(1997) Akt Phosphorylation of Bad Couples Survival Signals to the Cell-
Intrinsic Death Machinery. Cell. 91(2): 231-242.
de Braud, F., Khayat, D., Kroon, B.B.R., Valdagni, R., Bruzzi, P. and Cascinelli, N.
(2003) Malignant Melanoma. Critical Reviews in Oncology/Hematology. 47(1):
35-63.
Delgado, V.M.C., Nugnes, L.G., Colombo, L.L., Troncoso, M.F., Fernández, M.M.,
Malchiodi, E.L., Frahm, I., Croci, D.O., Compagno, D. and Rabinovich, G.A.
(2011) Modulation of Endothelial Cell Migration and Angiogenesis: A Novel

198
Function for the “Tandem-Repeat” Lectin Galectin-8. The FASEB Journal.
25(1): 242-254.
Denecker, G., Vercammen, D., Steemans, M., Vanden, B.T., Brouckaert, G., Van Loo,
G., Zhivotovsky, B., Fiers, W., Grooten, J. and Declercq, W. (2001) Death
Receptor-Induced Apoptotic and Necrotic Cell Death: Differential Role of
Caspases and Mitochondria. Cell Death and Differentiation. 8(8): 829.
Deorukhkar, A., Krishnan, S., Sethi, G. and Aggarwal, B.B. (2007) Back to Basics:
How Natural Products Can Provide the Basis for New Therapeutics.
DePinho, R.A., Schreiber-Agus, N. and Alt, F.W. (1991) Myc Family Oncogenes in the
Development of Normal and Neoplastic Cells. Advances in Cancer Research.
57: 1.
Dérijard, B., Hibi, M., Wu, I.H., Barrett, T., Su, B., Deng, T., Karin, M. and Davis, R.J.
(1994) Jnk1: A Protein Kinase Stimulated by Uv Light and Ha-Ras That Binds
and Phosphorylates the C-Jun Activation Domain. Cell. 76(6): 1025.
Desagher, S., Osen-Sand, A., Montessuit, S., Magnenat, E., Vilbois, F., Hochmann, A.,
Journot, L., Antonsson, B. and Martinou, J.C. (2001) Phosphorylation of Bid by
Casein Kinases I and Ii Regulates Its Cleavage by Caspase 8. Molecular cell.
8(3): 601-611.
Dhillon, A., Hagan, S., Rath, O. and Kolch, W. (2007) Map Kinase Signalling Pathways
in Cancer. Oncogene. 26(22): 3279-3290.
Discher, D.J., Bishopric, N.H., Wu, X., Peterson, C.A. and Webster, K.A. (1998)
Hypoxia Regulates Β-Enolase and Pyruvate Kinase-M Promoters by Modulating
Sp1/Sp3 Binding to a Conserved Gc Element. Journal of Biological Chemistry.
273(40): 26087-26093.
Dolcet, X., Llobet, D., Pallares, J. and Matias-Guiu, X. (2005) Nf-Kb in Development
and Progression of Human Cancer. Virchows Archiv. 446(5): 475-482.
Dong, Z., Saikumar, P., Weinberg, J.M. and Venkatachalam, M.A. (1997)
Internucleosomal DNA Cleavage Triggered by Plasma Membrane Damage
During Necrotic Cell Death. Involvement of Serine but Not Cysteine Proteases.
The American Journal of Pathology. 151(5): 1205.
Donnini, S., Finetti, F., Lusini, L., Morbidelli, L., Cheynier, V., Barron, D., Williamson,
G., Waltenberger, J. and Ziche, M. (2006) Divergent Effects of Quercetin
Conjugates on Angiogenesis. British Journal of Nutrition. 95(05): 1016-1023.
Drent, M., Cobben, N., Henderson, R., Wouters, E. and van Dieijen-Visser, M. (1996)
Usefulness of Lactate Dehydrogenase and Its Isoenzymes as Indicators of Lung
Damage or Inflammation. European Respiratory Journal. 9(8): 1736-1742.
Duffy, M.J. and Crown, J. (2008) A Personalized Approach to Cancer Treatment: How
Biomarkers Can Help. Clinical Chemistry. 54(11): 1770-1779.
Duthie, G.G., Duthie, S.J. and Kyle, J.A.M. (2000) Plant Polyphenols in Cancer and
Heart Disease: Implications as Nutritional Antioxidants. Nutrition Research
Reviews. 13(1): 79.
Earnshaw, W.C., Martins, L.M. and Kaufmann, S.H. (1999) Mammalian Caspases:
Structure, Activation, Substrates, and Functions During Apoptosis. Annual
Review of Biochemistry. 68(1): 383-424.

199
Edinger, A.L. and Thompson, C.B. (2004) Death by Design: Apoptosis, Necrosis and
Autophagy. Current Opinion in Cell Biology. 16(6): 663-669.
Eferl, R. and Wagner, E.F. (2003) Ap-1: A Double-Edged Sword in Tumorigenesis.
Nature Reviews Cancer. 3(11): 859-868.
Eguchi, Y., Shimizu, S. and Tsujimoto, Y. (1997) Intracellular Atp Levels Determine
Cell Death Fate by Apoptosis or Necrosis. Cancer Research. 57(10): 1835-1840.
Enk, A.H., Jonuleit, H., Saloga, J. and Knop, J. (1998) Dendritic Cells as Mediators of
Tumor‐Induced Tolerance in Metastatic Melanoma. International Journal of
Cancer. 73(3): 309-316.
Etta, H. (2008) Effects of Phyllanthus Amarus on Litter Traits in Albino Rats. Scientific
Research and Essay. 3(8): 370-372.
Eun, J.P. and Koh, G.Y. (2004) Suppression of Angiogenesis by the Plant Alkaloid,
Sanguinarine. Biochemical and Biophysical Research Communications. 317(2):
618-624.
Evan, G.I. and Littlewood, T.D. (1993) The Role of C-Myc in Cell Growth. Current
Opinion in Genetics & Development. 3(1): 44.
Evan, G.I. and Vousden, K.H. (2001) Proliferation, Cell Cycle and Apoptosis in Cancer.
Nature. 411(6835): 342-348.
Fan, T.J., Han, L.H., Cong, R.S. and Liang, J. (2005) Caspase Family Proteases and
Apoptosis. Acta Biochimica et Biophysica Sinica. 37(11): 719-727.
Fang, J.Y. and Richardson, B.C. (2005) The Mapk Signalling Pathways and Colorectal
Cancer. The Lancet Oncology. 6(5): 322-327.
Farnsworth, N.R., Akerele, O., Bingel, A.S., Soejarto, D.D. and Guo, Z. (1985)
Medicinal Plants in Therapy. Bulletin of the World Health Organization. 63(6):
965.
Faust, M. and Montenarh, M. (2000) Subcellular Localization of Protein Kinase Ck2.
Cell and Tissue Research. 301(3): 329-340.
Fecher, L.A., Amaravadi, R.K. and Flaherty, K.T. (2008) The Mapk Pathway in
Melanoma. Current opinion in oncology. 20(2): 183-189.
Felsher, D.W. (2003) Cancer Revoked: Oncogenes as Therapeutic Targets. Nature
Reviews Cancer. 3: 375-379.
Ferlay, J., Shin, H.-R., Bray, F., Forman, D., Mathers, C. and Parkin, D.M. (2010)
Estimates of Worldwide Burden of Cancer in 2008: Globocan 2008.
International Journal of Cancer. 127(12): 2893-2917.
Ferrell, K., Wilkinson, C.R.M., Dubiel, W. and Gordon, C. (2000) Regulatory Subunit
Interactions of the 26s Proteasome, a Complex Problem. Trends in Biochemical
Sciences. 25(2): 83-88.
Findley, H.W., Gu, L., Yeager, A.M. and Zhou, M. (1997) Expression and Regulation
of Bcl-2, Bcl-Xl, and Bax Correlate with P53 Status and Sensitivity to Apoptosis
in Childhood Acute Lymphoblastic Leukemia. Blood. 89(8): 2986-2993.
Flávia, L., Ana, P., Luis, R., Dulce, S., Vanderlan, B., Isabel, A., Iracilda, C. and
Raquel, S. (2009) Anti-Angiogenic Effects of Pterogynidine Alkaloid Isolated
from Alchornea Glandulosa. BMC Complementary and Alternative Medicine. 9.
Folkman, J. (1974) Tumor Angiogenesis1. Advances in Cancer Research. 19: 331.

200
Franklin, R.B., Zou, J., Gorski, E., Yang, Y. and Costello, L.C. (1997) Prolactin
Regulation of Mitochondrial Aspartate Aminotransferase and Protein Kinase C
in Human Prostate Cancer Cells. Molecular and Cellular Endocrinology.
127(1): 19-25.
Fritah, A., Saucier, C., Mester, J., Redeuilh, G. and Sabbah, M. (2005) P21waf1/Cip1
Selectively Controls the Transcriptional Activity of Estrogen Receptor Α.
Molecular and Cellular Biology. 25(6): 2419-2430.
Fulda, S. and Debatin, K. (2006) Extrinsic Versus Intrinsic Apoptosis Pathways in
Anticancer Chemotherapy. Oncogene. 25(34): 4798-4811.
Garbe, C., Terheyden, P., Keilholz, U., Kölbl, O. and Hauschild, A. (2008) Treatment
of Melanoma. Deutsches Arzteblatt International. 105(49): 845.
Gialeli, C., Theocharis, A.D. and Karamanos, N.K. (2011) Roles of Matrix
Metalloproteinases in Cancer Progression and Their Pharmacological Targeting.
Febs Journal. 278(1): 16-27.
Giles, R.H., van Es, J.H. and Clevers, H. (2003) Caught up in a Wnt Storm: Wnt
Signaling in Cancer. Biochimica et Biophysica Acta (BBA)-Reviews on Cancer.
1653(1): 1-24.
Gillies, R.J., Robey, I. and Gatenby, R.A. (2008) Causes and Consequences of
Increased Glucose Metabolism of Cancers. Journal of Nuclear Medicine.
49(Suppl 2): 24S-42S.
Gilmore, T. (2006) Introduction to Nf-Κb: Players, Pathways, Perspectives. Oncogene.
25(51): 6680-6684.
Glinsky, V.V., Glinsky, G.V., Rittenhouse-Olson, K., Huflejt, M.E., Glinskii, O.V.,
Deutscher, S.L. and Quinn, T.P. (2001) The Role of Thomsen-Friedenreich
Antigen in Adhesion of Human Breast and Prostate Cancer Cells to the
Endothelium. Cancer Research. 61(12): 4851-4857.
Goldberg, R.J., Gore, J.M., Gurwitz, J.H., Alpert, J.S., Brady, P., Strohsnitter, W.,
Chen, Z. and Dalen, J.E. (1989) The Impact of Age on the Incidence and
Prognosis of Initial Acute Myocardial Infarction: The Worcester Heart Attack
Study. American Heart Journal. 117(3): 543-549.
Gollob, J.A., Wilhelm, S., Carter, C. and Kelley, S.L. Role of Raf Kinase in Cancer:
Therapeutic Potential of Targeting the Raf/Mek/Erk Signal Transduction
Pathway. 2006. 33: 392-406. Elsevier.
Gottlieb, T.M., Leal, J., Seger, R., Taya, Y. and Oren, M. (2002) Cross-Talk between
Akt, P53 and Mdm2: Possible Implications for the Regulation of Apoptosis.
Oncogene. 21(8): 1299.
Granado-Serrano, A.B., Martín, M.A., Bravo, L., Goya, L. and Ramos, S. (2006)
Quercetin Induces Apoptosis Via Caspase Activation, Regulation of Bcl-2, and
Inhibition of Pi-3-Kinase/Akt and Erk Pathways in a Human Hepatoma Cell
Line (Hepg2). The Journal of Nutrition. 136(11): 2715-2721.
Gross, A., McDonnell, J.M. and Korsmeyer, S.J. (1999) Bcl-2 Family Members and the
Mitochondria in Apoptosis. Genes & development. 13(15): 1899-1911.
Grossman, D. and Altieri, D.C. (2001) Drug Resistance in Melanoma: Mechanisms,
Apoptosis, and New Potential Therapeutic Targets. Cancer and Metastasis
Reviews. 20(1): 3-11.

201
Guo, C., Yu, S., Davis, A.T., Wang, H., Green, J.E. and Ahmed, K. (2001) A Potential
Role of Nuclear Matrix-Associated Protein Kinase Ck2 in Protection against
Drug-Induced Apoptosis in Cancer Cells. Journal of Biological Chemistry.
276(8): 5992-5999.
Guppy, M. (2002) The Hypoxic Core: A Possible Answer to the Cancer Paradox.
Biochemical and biophysical research communications. 299(4): 676-680.
Gupta, A.A. (2012) Nodular Melanoma [online]. Available:
http://usmlerescue.com/aagupta2/photo/view/nodular-melanoma/. (Accessed:
16th October 2012 2012).
Gupta, G.P. and Massagué, J. (2006) Cancer Metastasis: Building a Framework. Cell.
127(4): 679-695.
Guruvayoorappan, C. and Kuttan, G. (2007) Antiangiogenic Effect of Rutin and Its
Regulatory Effect on the Production of Vegf, Il-Lß and Tnf-0£ in Tumor
Associated Macrophages. Journal of Biological Sciences. 7(8): 1511-1519.
Hanahan, D. and Weinberg, R.A. (2000) The Hallmarks of Cancer. Cell. 100(1): 57-70.
Hanahan, D. and Weinberg, R.A. (2011) Hallmarks of Cancer: The Next Generation.
Cell. 144(5): 646-674.
Hansen, R.K., Parra, I., Hilsenbeck, S.G., Himelstein, B. and Fuqua, S.A.W. (2001)
Hsp27-Induced Mmp-9 Expression Is Influenced by the Src Tyrosine Protein
Kinase Yes. Biochemical and Biophysical Research Communications. 282(1):
186-193.
Harper, J.W., Elledge, S.J., Keyomarsi, K., Dynlacht, B., Tsai, L.H., Zhang, P.,
Dobrowolski, S., Bai, C., Connell-Crowley, L. and Swindell, E. (1995)
Inhibition of Cyclin-Dependent Kinases by P21. Molecular Biology of the Cell.
6(4): 387.
Hartwell, L.H. and Kastan, M.B. (1994) Cell Cycle Control and Cancer. Science (New
York, NY). 266(5192): 1821.
Hay, E.D. (1991) Cell Biology of Extracellular Matrix. Springer.
Hayden, M.S. and Ghosh, S. (2008) Shared Principles in Nf-Κb Signaling. Cell. 132(3):
344-362.
Hayes, J.D. and McMahon, M. (2001) Molecular Basis for the Contribution of the
Antioxidant Responsive Element to Cancer Chemoprevention. Cancer Letters.
174(2): 103-113.
Heasley, L.E. and Han, S.Y. (2006) Jnk Regulation of Oncogenesis. Molecules and
Cells. 21(2): 167.
HemaIswarya, S. and Doble, M. (2006) Potential Synergism of Natural Products in the
Treatment of Cancer. Phytotherapy Research. 20(4): 239-249.
Henderson, L., Nelson, P. and Henderson, L. Mammalian Enzymes of Trimethyllysine
Conversion to Trimethylaminobutyrate. Federation Proceedings, 1982. 41:
2843.
Henriksson, M., Selivanova, G., Lindström, M. and Wiman, K. (2001) Inactivation of
Myc-Induced P53-Dependent Apoptosis in Human Tumors. Apoptosis. 6(1):
133-137.
202
Herath, N., Spanevello, M., Sabesan, S., Newton, T., Cummings, M., Duffy, S.,
Lincoln, D., Boyle, G., Parsons, P. and Boyd, A. (2006) Over-Expression of Eph
and Ephrin Genes in Advanced Ovarian Cancer: Ephrin Gene Expression
Correlates with Shortened Survival. BMC Cancer. 6(1): 144.
Hermeking, H. (2003a) The 14-3-3 Cancer Connection. Nature Reviews Cancer. 3(12):
931-943.
Hermeking, H. (2003b) The Myc Oncogene as a Cancer Drug Target. Current Cancer
Drug Targets. 3(3): 163-175.
Herrera-Esparza, R., Herrera-van-Oostdam, D., López-Robles, E. and Avalos-Díaz, E.
(2011) The Role of Apoptosis in Autoantibody Production. Reumatismo. 59(2):
87-99.
Hew, K. (2012) Prostate Cancer [online]. Available:
http://www.malaysiaoncology.org/article.php?aid=32. (Accessed: 12 February
2012).
Hilger, R., Scheulen, M. and Strumberg, D. (2002) The Ras-Raf-Mek-Erk Pathway in
the Treatment of Cancer. Onkologie. 25(6): 511-518.
Hiller, S., Garces, R.G., Malia, T.J., Orekhov, V.Y., Colombini, M. and Wagner, G.
(2008) Solution Structure of the Integral Human Membrane Protein Vdac-1 in
Detergent Micelles. Science Signalling. 321(5893): 1206.
Ho, H.H., Chang, C.S., Ho, W.C., Liao, S.Y., Wu, C.H. and Wang, C.J. (2010) Anti-
Metastasis Effects of Gallic Acid on Gastric Cancer Cells Involves Inhibition of
Nf-Κb Activity and Downregulation of Pi3k/Akt/Small Gtpase Signals. Food
and Chemical Toxicology. 48(8): 2508-2516.
Hoffman, W.H., Biade, S., Zilfou, J.T., Chen, J. and Murphy, M. (2002) Transcriptional
Repression of the Anti-Apoptoticsurvivin Gene by Wild Type P53. Journal of
Biological Chemistry. 277(5): 3247-3257.
Holler, N., Zaru, R., Micheau, O., Thome, M., Attinger, A., Valitutti, S., Bodmer, J.L.,
Schneider, P., Seed, B. and Tschopp, J. (2000) Fas Triggers an Alternative,
Caspase-8–Independent Cell Death Pathway Using the Kinase Rip as Effector
Molecule. Nature Immunology. 1(6): 489-495.
Holt, G.A. and Chandra, A. (2002) Herbs in the Modern Healthcare Environment-an
Overview of Uses, Legalities, and the Role of the Healthcare Professional.
Clinical Research and Regulatory Affairs. 19(1): 83-107.
Hong, I.K., Kim, Y.M., Jeoung, D.I., Kim, K.C. and Lee, H. (2005) Tetraspanin Cd9
Induces Mmp-2 Expression by Activating P38 Mapk, Jnk and C-Jun Pathways
in Human Melanoma Cells. Exp Mol Med. 37(3): 230-239.
Hooper, C. (2012) Overview of Nfkb Signaling [online]. Available:
http://www.abcam.com/index.html?pageconfig=resource&rid=11255&pid=1062
9. (Accessed: 15th October 2012).
Hoyer, K.K., Pang, M., Gui, D., Shintaku, I.P., Kuwabara, I., Liu, F.T., Said, J.W.,
Baum, L.G. and Teitell, M.A. (2004) An Anti-Apoptotic Role for Galectin-3 in
Diffuse Large B-Cell Lymphomas. The American Journal of Pathology. 164(3):
893-902.

203
Hsieh, T. and Wu, J.M. (1999) Differential Effects on Growth, Cell Cycle Arrest, and
Induction of Apoptosis by Resveratrol in Human Prostate Cancer Cell Lines.
Experimental Cell Research. 249(1): 109-115.
Hsu, P.P. and Sabatini, D.M. (2008) Cancer Cell Metabolism: Warburg and Beyond.
Cell. 134(5): 703-707.
Huang, R.L., Huang, Y.L., Ou, J.C., Chen, C.C., Hsu, F.L. and Chang, C. (2003)
Screening of 25 Compounds Isolated from Phyllanthus Species for Anti‐Human
Hepatitis B Virus in Vitro. Phytotherapy Research. 17(5): 449-453.
Huang, S.T., Yang, R.C., Chen, M.Y. and Pang, J.H.S. (2004a) < I> Phyllanthus
Urinaria</I> Induces the Fas Receptor/Ligand Expression and Ceramide-
Mediated Apoptosis in Hl-60 Cells. Life Sciences. 75(3): 339-351.
Huang, S.T., Yang, R.C., Lee, P.N., Yang, S.H., Liao, S.K., Chen, T.Y. and Pang,
J.H.S. (2006) Anti-Tumor and Anti-Angiogenic Effects of< I> Phyllanthus
Urinaria</I> in Mice Bearing Lewis Lung Carcinoma. International
Immunopharmacology. 6(6): 870-879.
Huang, S.T., Yang, R.C. and Pang, J.H.S. (2004b) Aqueous Extract of Phyllanthus
Urinaria Induces Apoptosis in Human Cancer Cells. The American Journal of
Chinese Medicine. 32(02): 175-183.
Huelsken, J. and Behrens, J. (2002) The Wnt Signalling Pathway. Journal of Cell
Science. 115(21): 3977-3978.
Hui, L., Bakiri, L., Mairhorfer, A., Schweifer, N., Haslinger, C., Kenner, L.,
Komnenovic, V., Scheuch, H., Beug, H. and Wagner, E.F. (2007) P38α
Suppresses Normal and Cancer Cell Proliferation by Antagonizing the Jnk–C-
Jun Pathway. Nature Genetics. 39(6): 741-749.
Huynh-Do, U., Vindis, C., Liu, H., Cerretti, D.P., McGrew, J.T., Enriquez, M., Chen, J.
and Daniel, T.O. (2002) Ephrin-B1 Transduces Signals to Activate Integrin-
Mediated Migration, Attachment and Angiogenesis. Journal of Cell Science.
115(15): 3073-3081.
Ihantola-Vormisto, A., Summanen, J., Kankaanranta, H., Vuorela, H., Asmawi, Z.M.
and Moilanen, E. (1997) Anti-Inflammatory Activity of Extracts from Leaves of
Phyllanthus Emblica. Planta Medica. 63(6): 518.
Iihara, K., Shiozaki, H., Tahara, H., Kobayashi, K., Inoue, M., Tamura, S., Miyata, M.,
Oka, H., Doki, Y. and Mori, T. (2006) Prognostic Significance of Transforming
Growth Factor‐Α in Human Esophageal Carcinoma Implication for the
Autocrine Proliferation. Cancer. 71(10): 2902-2909.
Ishikawa, Y. and Kitamura, M. (2000) Anti-Apoptotic Effect of Quercetin: Intervention
in the Jnk-and Erk-Mediated Apoptotic Pathways. Kidney International. 58(3):
1078-1087.
Ito, H. (2011) Metabolites of the Ellagitannin Geraniin and Their Antioxidant
Activities. Planta Medica-Natural Products and Medicinal Plant Research.
77(11): 1110.
Itoh, K., Krupnik, V.E. and Sokol, S.Y. (1998) Axis Determination in Xenopus Involves
Biochemical Interactions of Axin, Glycogen Synthase Kinase 3 and ²-Catenin.
Current Biology : CB. 8(10): 591-594.

204
Izeradjene, K., Douglas, L., Delaney, A. and Houghton, J.A. (2005) Casein Kinase Ii
(Ck2) Enhances Death-Inducing Signaling Complex (Disc) Activity in Trail-
Induced Apoptosis in Human Colon Carcinoma Cell Lines. Oncogene. 24(12):
2050-2058.
Jeena, K.J., Joy, K. and Kuttan, R. (1999) Effect of< I> Emblica Officinalis</I>,< I>
Phyllanthus Amarus</I> and< I> Picrorrhiza Kurroa</I> on< I> N</I>-
Nitrosodiethylamine Induced Hepatocarcinogenesis. Cancer Letters. 136(1): 11-
16.
Jemal, A., Bray, F., Center, M.M., Ferlay, J., Ward, E. and Forman, D. (2011) Global
Cancer Statistics. CA: A Cancer Journal for Clinicians. 61(2): 69-90.
Ji, H.F., Li, X.J. and Zhang, H.Y. (2009) Natural Products and Drug Discovery. EMBO
Reports. 10(3): 194-200.
Jiang, W., Bell, C.W. and Pisetsky, D.S. (2007) The Relationship between Apoptosis
and High-Mobility Group Protein 1 Release from Murine Macrophages
Stimulated with Lipopolysaccharide or Polyinosinic-Polycytidylic Acid. The
Journal of Immunology. 178(10): 6495-6503.
Jiang, Y., Zhang, W., Kondo, K., Klco, J.M., Martin, T.B.S., Dufault, M.R., Madden,
S.L., Kaelin, W.G. and Nacht, M. (2003) Gene Expression Profiling in a Renal
Cell Carcinoma Cell Line: Dissecting Vhl and Hypoxia-Dependent Pathways.
Molecular cancer research. 1(6): 453-462.
Jilaveanu, L.B., Aziz, S.A. and Kluger, H.M. (2009) Chemotherapy and Biologic
Therapies for Melanoma: Do They Work? Clinics in Dermatology. 27(6): 614-
625.
Jin, U.H., Lee, J.Y., Kang, S.K., Kim, J.K., Park, W.H., Kim, J.G., Moon, S.K. and
Kim, C.H. (2005) A Phenolic Compound, 5-Caffeoylquinic Acid (Chlorogenic
Acid), Is a New Type and Strong Matrix Metalloproteinase-9 Inhibitor: Isolation
and Identification from Methanol Extract of< I> Euonymus Alatus</I>. Life
Sciences. 77(22): 2760-2769.
Joerger, A. and Fersht, A. (2007) Structure–Function–Rescue: The Diverse Nature of
Common P53 Cancer Mutants. Oncogene. 26(15): 2226-2242.
Johnson, R., Spiegelman, B., Hanahan, D. and Wisdom, R. (1996) Cellular
Transformation and Malignancy Induced by Ras Require C-Jun. Molecular and
Cellular Biology. 16(8): 4504-4511.
Johnstone, R.W., Ruefli, A.A. and Lowe, S.W. (2002) Apoptosis-a Link between
Cancer Genetics and Chemotherapy. Cell. 108(2): 153-164.
Jones, R.G. and Thompson, C.B. (2009) Tumor Suppressors and Cell Metabolism: A
Recipe for Cancer Growth. Genes & Development. 23(5): 537-548.
Jørgensen, L., Hansen, H. and Cooper, E. (1989) Neuron Specific Enolase,
Carcinoembryonic Antigen and Lactate Dehydrogenase as Indicators of Disease
Activity in Small Cell Lung Cancer. European Journal of Cancer and Clinical
Oncology. 25(1): 123-128.
Kane, L.P., Shapiro, V.S., Stokoe, D. and Weiss, A. (1999) Induction of Nf-Κb by the
Akt/Pkb Kinase. Current Biology. 9(11): 601-S601.
Karin, M. and Lin, A. (2002) Nf-Kappab at the Crossroads of Life and Death. Nature
immunology. 3(3): 221-227.

205
Katoh, M. (2005) Wnt/Pcp Signaling Pathway and Human Cancer (Review). Oncology
Reports. 14(6): 1583.
Kaufmann, S.H. and Earnshaw, W.C. (2000) Induction of Apoptosis by Cancer
Chemotherapy. Experimental Cell Research. 256(1): 42.
Kennedy, N.J., Sluss, H.K., Jones, S.N., Bar-Sagi, D., Flavell, R.A. and Davis, R.J.
(2003) Suppression of Ras-Stimulated Transformation by the Jnk Signal
Transduction Pathway. Genes & Development. 17(5): 629-637.
Kerbel, R.S. (2000) Tumor Angiogenesis: Past, Present and the near Future.
Carcinogenesis. 21(3): 505-515.
Khandrika, L., Lieberman, R., Koul, S., Kumar, B., Maroni, P., Chandhoke, R.,
Meacham, R.B. and Koul, H.K. (2009) Hypoxia-Associated P38 Mitogen-
Activated Protein Kinase-Mediated Androgen Receptor Activation and
Increased Hif-1α Levels Contribute to Emergence of an Aggressive Phenotype
in Prostate Cancer. Oncogene. 28(9): 1248-1260.
Khanna, A., Rizvi, F. and Chander, R. (2002) Lipid Lowering Activity of< I>
Phyllanthus Niruri</I> in Hyperlipemic Rats. Journal of Ethnopharmacology.
82(1): 19-22.
Khopde, S., Priyadarsini, K.I., Mohan, H., Gawandi, V., Satav, J., Yakhmi, J.,
Banavaliker, M., Biyani, M. and Mittal, J. (2001) Characterizing the Antioxidant
Activity of Amla (Phyllanthus Emblica) Extract. CURRENT SCIENCE-
BANGALORE-. 81(2): 185-190.
Kiemer, A.K., Hartung, T., Huber, C. and Vollmar, A.M. (2003) < I> Phyllanthus</I><
I> Amarus</I> Has Anti-Inflammatory Potential by Inhibition of Inos, Cox-2,
and Cytokines Via the Nf-Κb Pathway. Journal of Hepatology. 38(3): 289-297.
Kim, C.J., Reintgen, D.S. and Balch, C.M. (2002) The New Melanoma Staging System.
Cancer Control. 9(1): 9-15.
Kim, J. and Dang, C.V. (2006) Cancer's Molecular Sweet Tooth and the Warburg
Effect. Cancer Research. 66(18): 8927-8930.
Kim, N.W., Piatyszek, M.A., Prowse, K.R., Harley, C.B., West, M.D., Ho, P.L.,
Coviello, G.M., Wright, W.E., Weinrich, S.L. and Shay, J.W. (1994) Specific
Association of Human Telomerase Activity with Immortal Cells and Cancer.
Science (New York, N.Y.). 266(5193): 2011-2015.
Kim, R., Emi, M. and Tanabe, K. (2007) Cancer Immunoediting from Immune
Surveillance to Immune Escape. Immunology. 121(1): 1-14.
Kirsch, D.G., Doseff, A., Chau, B.N., Lim, D.S., de Souza-Pinto, N.C., Hansford, R.,
Kastan, M.B., Lazebnik, Y.A. and Hardwick, J.M. (1999) Caspase-3-Dependent
Cleavage of Bcl-2 Promotes Release of Cytochrome C. Journal of Biological
Chemistry. 274(30): 21155-21161.
Kishida, M., Koyama, S., Kishida, S., Matsubara, K., Nakashima, S., Higano, K.,
Takada, R., Takada, S. and Kikuchi, A. (1999) Axin Prevents Wnt-3a-Induced
Accumulation of Beta-Catenin. Oncogene. 18(4): 979.
Kitamura, T., Asai, N., Enomoto, A., Maeda, K., Kato, T., Ishida, M., Jiang, P.,
Watanabe, T., Usukura, J. and Kondo, T. (2008) Regulation of Vegf-Mediated
Angiogenesis by the Akt/Pkb Substrate Girdin. Nature Cell Biology. 10(3): 329-
337.

206
Klein, C., Grudzien, M., Appaswamy, G., Germeshausen, M., Sandrock, I., Schäffer,
A.A., Rathinam, C., Boztug, K., Schwinzer, B. and Rezaei, N. (2006) Hax1
Deficiency Causes Autosomal Recessive Severe Congenital Neutropenia
(Kostmann Disease). Nature genetics. 39(1): 86-92.
Klymkowsky, M.W. and Savagner, P. (2009) Epithelial-Mesenchymal Transition: A
Cancer Researcher’s Conceptual Friend and Foe. The American Journal of
Pathology. 174(5): 1588.
Kolligs, F.T., Bommer, G. and Göke, B. (2002) Wnt/Beta-Catenin/Tcf Signaling: A
Critical Pathway in Gastrointestinal Tumorigenesis. Digestion. 66(3): 131-144.
Komuraiah, A., Bolla, K., Rao, K.N., Ragan, A., Raju, V. and Charya, M.A.S. (2011)
Antibacterial Studies and Phytochemical Constituents of South Indian
Phyllanthus Species. African Journal of Biotechnology. 8(19).
Kondapaka, S.B., Fridman, R. and Reddy, K.B. (1998) Epidermal Growth Factor and
Amphiregulin up‐Regulate Matrix Metalloproteinase‐9 (Mmp‐9) in Human
Breast Cancer Cells. International Journal of Cancer. 70(6): 722-726.
Korsmeyer, S.J. (1999) Bcl-2 Gene Family and the Regulation of Programmed Cell
Death. Cancer Research. 59(7 Supplement): 1693s-1700s.
Krag, D.N., Meijer, S.J., Weaver, D.L., Loggie, B.W., Harlow, S.P., Tanabe, K.K.,
Laughlin, E.H. and Alex, J.C. (1995) Minimal-Access Surgery for Staging of
Malignant Melanoma. Archives of Surgery. 130(6): 654.
Krippner-Heidenreich, A., Talanian, R.V., Sekul, R., Kraft, R., Thole, H., Ottleben, H.
and Lüscher, B. (2001) Targeting of the Transcription Factor Max During
Apoptosis: Phosphorylation-Regulated Cleavage by Caspase-5 at an Unusual
Glutamic Acid Residue in Position P1. Biochemical Journal. 358(Pt 3): 705.
Kruczynski, A., Poli, M., Dossi, R., Chazottes, E., Berrichon, G., Ricome, C., Giavazzi,
R., Hill, B.T. and Taraboletti, G. (2006) Anti-Angiogenic, Vascular-Disrupting
and Anti-Metastatic Activities of Vinflunine, the Latest Vinca Alkaloid in
Clinical Development. European Journal of Cancer. 42(16): 2821-2832.
Kuijper, S., Turner, C.J. and Adams, R.H. (2007) Regulation of Angiogenesis by Eph–
Ephrin Interactions. Trends in Cardiovascular Medicine. 17(5): 145-151.
Kulaksız, G., Reardon, J.T. and Sancar, A. (2005) Xeroderma Pigmentosum
Complementation Group E Protein (Xpe/Ddb2): Purification of Various
Complexes of Xpe and Analyses of Their Damaged DNA Binding and Putative
DNA Repair Properties. Molecular and Cellular Biology. 25(22): 9784-9792.
Kumar, S., Boehm, J. and Lee, J.C. (2003) P38 Map Kinases: Key Signalling Molecules
as Therapeutic Targets for Inflammatory Diseases. Nature Reviews Drug
Discovery. 2(9): 717-726.
Kumar, S., Kumar, D., Deshmukh, R., Lokhande, P., More, S. and Rangari, V. (2008)
Antidiabetic Potential of< I> Phyllanthus Reticulatus</I> in Alloxan-Induced
Diabetic Mice. Fitoterapia. 79(1): 21-23.
Kumaran, A. and Joel Karunakaran, R. (2007) In Vitro Antioxidant Activities of
Methanol Extracts of Five< I> Phyllanthus</I> Species from India. LWT-Food
Science and Technology. 40(2): 344-352.

207
Kuwajerwala, N., Cifuentes, E., Gautam, S., Menon, M., Barrack, E.R. and Reddy,
G.P.V. (2002) Resveratrol Induces Prostate Cancer Cell Entry into S Phase and
Inhibits DNA Synthesis. Cancer Research. 62(9): 2488-2492.
Kwon, G.T., Cho, H.J., Chung, W.Y., Park, K.K., Moon, A. and Park, J.H.Y. (2009)
Isoliquiritigenin Inhibits Migration and Invasion of Prostate Cancer Cells:
Possible Mediation by Decreased Jnk/Ap-1 Signaling. The Journal of
Nutritional Biochemistry. 20(9): 663-676.
LaBaer, J., Garrett, M.D., Stevenson, L.F., Slingerland, J.M., Sandhu, C., Chou, H.S.,
Fattaey, A. and Harlow, E. (1997) New Functional Activities for the P21 Family
of Cdk Inhibitors. Genes & Development. 11(7): 847-862.
Labrie, F., Candas, B. and Dalesio, O. (2000) Androgen Blockade in Prostate Cancer.
Lancet. 356(9226): 341-341.
Lahav, G., Rosenfeld, N., Sigal, A., Geva-Zatorsky, N., Levine, A.J., Elowitz, M.B. and
Alon, U. (2004) Dynamics of the P53-Mdm2 Feedback Loop in Individual
Cells. Nature Genetics. 36(2): 147-150.
Lamson, D.W. and Brignall, M.S. (2000) Antioxidants and Cancer, Part 3: Quercetin.
Alternative Medicine Review: a Journal of Clinical Therapeutic. 5(3): 196.
Landesman-Bollag, E., Romieu-Mourez, R., Song, D.H., Sonenshein, G.E., Cardiff,
R.D. and Seldin, D.C. (2001) Protein Kinase Ck2 in Mammary Gland
Tumorigenesis. Oncogene. 20(25): 3247-3257.
Lee, C.D., Ott, M., Thyagarajan, S., Shafritz, D., Burk, R. and Gupta, S. (2003a)
Phyllanthus Amarus Down‐Regulates Hepatitis B Virus Mrna Transcription and
Replication. European Journal of Clinical Investigation. 26(12): 1069-1076.
Lee, C.D., Ott, M., Thyagarajan, S.P., Shafritz, D.A., Burk, R.D. and Gupta, S. (1996)
Phyllanthus Amarus Down-Regulates Hepatitis B Virus Mrna Transcription and
Replication. Eur J Clin Invest. 26(12): 1069-1076.
Lee, C.Y., Peng, W.H., Cheng, H.Y., Chen, F.N., Lai, M.T. and Chiu, T.H. (2006a)
Hepatoprotective Effect of Phyllanthus in Taiwan on Acute Liver Damage
Induced by Carbon Tetrachloride. The American Journal of Chinese Medicine.
34(03): 471-482.
Lee, J.C., Tsai, C.Y., Kao, J.Y., Kao, M.C., Tsai, S.C., Chang, C.S., Huang, L.J., Kuo,
S.C., Lin, J.K. and Way, T.D. (2008a) Geraniin‐Mediated Apoptosis by
Cleavage of Focal Adhesion Kinase through up‐Regulation of Fas Ligand
Expression in Human Melanoma Cells. Molecular Nutrition & Food Research.
52(6): 655-663.
Lee, J.W., Kwak, H.J., Lee, J.J., Kim, Y.N., Park, M.J., Jung, S.E., Hong, S.I., Lee, J.H.
and Lee, J.S. (2008b) Hsp27 Regulates Cell Adhesion and Invasion Via
Modulation of Focal Adhesion Kinase and Mmp-2 Expression. European
Journal of Cell Biology. 87(6): 377-387.
Lee, S., Desai, K.K., Iczkowski, K.A., Newcomer, R.G., Wu, K.J., Zhao, Y.G., Tan,
W.W., Roycik, M.D. and Sang, Q.X.A. (2006b) Coordinated Peak Expression of
Mmp-26 and Timp-4 in Preinvasive Human Prostate Tumor. Cell Research.
16(9): 750-758.
Lee, T.H., Avraham, H.K., Jiang, S. and Avraham, S. (2003b) Vascular Endothelial
Growth Factor Modulates the Transendothelial Migration of Mda-Mb-231

208
Breast Cancer Cells through Regulation of Brain Microvascular Endothelial Cell
Permeability. Journal of Biological Chemistry. 278(7): 5277-5284.
Lehrer, M. (2011) Skin Cancer, Melanoma Superficial Spreading [online]. Available:
http://www.umm.edu/imagepages/2501.htm. (Accessed: 2012 10th October).
Leist, M. and Jaattela, M. (2001) Four Deaths and a Funeral: From Caspases to
Alternative Mechanisms. Nature Reviews Molecular Cell Biology. 2(8): 589-
598.
Leist, M., Single, B., Naumann, H., Fava, E., Simon, B., Kühnle, S. and Nicotera, P.
(1999a) Inhibition of Mitochondrial Atp Generation by Nitric Oxide Switches
Apoptosis to Necrosis. Experimental Cell Research. 249(2): 396.
Leist, M., Single, B., Naumann, H., Fava, E., Simon, B., Kühnle, S. and Nicotera, P.
(1999b) Nitric Oxide Inhibits Execution of Apoptosis at Two Distinct Atp-
Dependent Steps Upstream and Downstream of Mitochondrial Cytochrome
Crelease. Biochemical and Biophysical Research Communications. 258(1): 215-
221.
Lemon, B. and Burns, R. (1998) Malignant Melanoma: A Literature Review and Case
Presentation. The Journal of Foot and Ankle Surgery. 37(1): 48-54.
Levine, A.J. (1997) P53, the Cellular Gatekeeper Review for Growth and Division.
Cell. 88: 323-331.
Levine, L., Lucci, J.A., Pazdrak, B., Cheng, J.Z., Guo, Y.S., Townsend, C.M. and
Hellmich, M.R. (2003) Bombesin Stimulates Nuclear Factor Κb Activation and
Expression of Proangiogenic Factors in Prostate Cancer Cells. Cancer research.
63(13): 3495-3502.
Li, W., Hutnik, M., Smith, R.a. and Li, V. (2012) The Angiogenesis Process [online].
Available: http://www.angio.org/ua.php. (Accessed: 15th October 2012).
Liang, K.C., Lee, C.W., Lin, W.N., Lin, C.C., Wu, C.B., Luo, S.F. and Yang, C.M.
(2007) Interleukin‐1β Induces Mmp‐9 Expression Via P42/P44 Mapk, P38
Mapk, Jnk, and Nuclear Factor‐Κb Signaling Pathways in Human Tracheal
Smooth Muscle Cells. Journal of Cellular Physiology. 211(3): 759-770.
Lin, A. (2002) Activation of the Jnk Signaling Pathway: Breaking the Brake on
Apoptosis. Bioessays. 25(1): 17-24.
Lin, S.Y., Wang, C.C., Lu, Y.L., Wu, W.C. and Hou, W.C. (2008) Antioxidant, Anti-
Semicarbazide-Sensitive Amine Oxidase, and Anti-Hypertensive Activities of
Geraniin Isolated from< I> Phyllanthus Urinaria</I>. Food and Chemical
Toxicology. 46(7): 2485-2492.
Lippman, M.E., Dickson, R.B., Kasid, A., Gelmann, E., Davidson, N., McManaway,
M., Huff, K., Bronzert, D., Bates, S. and Swain, S. (1986) Autocrine and
Paracrine Growth Regulation of Human Breast Cancer. Journal of Steroid
Biochemistry. 24(1): 147-154.
Litchfield, D.W. (2003) Protein Kinase Ck2: Structure, Regulation and Role in Cellular
Decisions of Life and Death. Biochemical Journal. 369(Pt 1): 1.
Liu, F.T. and Rabinovich, G.A. (2005) Galectins as Modulators of Tumour Progression.
Nature Reviews Cancer. 5(1): 29-41.

209
Liu, W.W., Zeng, Z.Y., Wu, Q.L., Hou, J.H. and Chen, Y.Y. (2005) Overexpression of
Mmp-2 in Laryngeal Squamous Cell Carcinoma: A Potential Indicator for Poor
Prognosis. Otolaryngology--Head and Neck Surgery. 132(3): 395-400.
Liu, Y., Borchert, G., Surazynski, A., Hu, C. and Phang, J. (2006a) Proline Oxidase
Activates Both Intrinsic and Extrinsic Pathways for Apoptosis: The Role of
Ros/Superoxides, Nfat and Mek/Erk Signaling. Oncogene. 25(41): 5640-5647.
Liu, Z., Schwimer, J., Liu, D., Lewis, J., Greenway, F.L., York, D.A. and Woltering,
E.A. (2006b) Gallic Acid Is Partially Responsible for the Antiangiogenic
Activities of Rubus Leaf Extract. Phytotherapy Research. 20(9): 806-813.
Loo, D.T. and Rillema, J.R. (1998) Measurement of Cell Death. Methods in Cell
Biology. 57: 251-264.
Los, M., Mozoluk, M., Ferrari, D., Stepczynska, A., Stroh, C., Renz, A., Herceg, Z.,
Wang, Z.Q. and Schulze-Osthoff, K. (2002) Activation and Caspase-Mediated
Inhibition of Parp: A Molecular Switch between Fibroblast Necrosis and
Apoptosis in Death Receptor Signaling. Molecular Biology of the Cell. 13(3):
978-988.
Lu, Y., Jiang, F., Jiang, H., Wu, K., Zheng, X., Cai, Y., Katakowski, M., Chopp, M. and
To, S.S.T. (2010) Gallic Acid Suppresses Cell Viability, Proliferation, Invasion
and Angiogenesis in Human Glioma Cells. European Journal of Pharmacology.
641(2): 102-107.
Luca, M., Huang, S., Gershenwald, J.E., Singh, R.K., Reich, R. and Bar-Eli, M. (1997)
Expression of Interleukin-8 by Human Melanoma Cells up-Regulates Mmp-2
Activity and Increases Tumor Growth and Metastasis. The American Journal of
Pathology. 151(4): 1105.
Luo, J., Manning, B.D. and Cantley, L.C. (2003) Targeting the Pi3k-Akt Pathway in
Human Cancer: Rationale and Promise. Cancer Cell. 4(4): 257.
Madesh, M. and Hajnóczky, G. (2001) Vdac-Dependent Permeabilization of the Outer
Mitochondrial Membrane by Superoxide Induces Rapid and Massive
Cytochrome C Release. The Journal of Cell Biology. 155(6): 1003-1016.
Marchenko, G.N., Ratnikov, B.I., Rozanov, D.V., Godzik, A., Deryugina, E.I. and
Strongin, A.Y. (2001) Characterization of Matrix Metalloproteinase-26, a Novel
Metalloproteinase Widely Expressed in Cancer Cells of Epithelial Origin.
Biochemical Journal. 356(Pt 3): 705.
Mareel, M. and Leroy, A. (2003) Clinical, Cellular, and Molecular Aspects of Cancer
Invasion. Science Signalling. 83(2): 337.
Marsden, V.S., O’Connor, L., O’Reilly, L.A., Silke, J., Metcalf, D., Ekert, P.G., Huang,
D.C.S., Nicholsonq, D.W., Vaux, D.L. and Bouillet, P. (2002) Apoptosis
Initiated by Bcl-2-Regulated Caspase Activation Independently of the
Cytochrome C/Apaf-1/Caspase-9 Apoptosome. Cell. 419: 634-637.
Martin, G.S. (2003) Cell Signaling and Cancer. Cancer cell. 4(3): 167-174.
Martinez, E., Palhan, V.B., Tjernberg, A., Lymar, E.S., Gamper, A.M., Kundu, T.K.,
Chait, B.T. and Roeder, R.G. (2001) Human Staga Complex Is a Chromatin-
Acetylating Transcription Coactivator That Interacts with Pre-Mrna Splicing and
DNA Damage-Binding Factors in Vivo. Molecular and Cellular Biology.
21(20): 6782-6795.

210
Masckauchán, T.N.H., Agalliu, D., Vorontchikhina, M., Ahn, A., Parmalee, N.L., Li,
C.M., Khoo, A., Tycko, B., Brown, A.M.C. and Kitajewski, J. (2006) Wnt5a
Signaling Induces Proliferation and Survival of Endothelial Cells in Vitro and
Expression of Mmp-1 and Tie-2. Molecular Biology of the Cell. 17(12): 5163-
5172.
Massagué, J. (2004) G1 Cell-Cycle Control and Cancer. Nature. 432(7015): 298-306.
Mazumder, A., Mahato, A. and Mazumder, R. (2006) Antimicrobial Potentiality of
Phyllanthus Amarus against Drug Resistant Pathogens. Natural Product
Research. 20(04): 323-326.
MedicineWorld.Org (2012) History of Cancer [online]. Available:
http://medicineworld.org/cancer/history.html. (Accessed: 15 October 2012).
Melanoma Institute Australia (2012) Treatment [online]. Available:
http://www.melanoma.org.au/about-melanoma/treatment.html. (Accessed: 16th
October 2012).
Mensah, J., Lagarde, I., Ceschin, C., Michelb, G., Gleye, J. and Fouraste, I. (1990)
Antibacterial Activity of the Leaves of< I> Phyllanthus Discoideus</I>. Journal
of Ethnopharmacology. 28(1): 129-133.
Michael, M. and Doherty, M. (2005) Tumoral Drug Metabolism: Overview and Its
Implications for Cancer Therapy. Journal of Clinical Oncology. 23(1): 205-229.
Migliazza, A., Lombardi, L., Rocchi, M., Trecca, D., Chang, C.C., Antonacci, R.,
Fracchiolla, N., Ciana, P., Maiolo, A. and Neri, A. (1994) Heterogeneous
Chromosomal Aberrations Generate 3'truncations of the Nfkb2/Lyt-10 Gene in
Lymphoid Malignancies. Blood. 84(11): 3850-3860.
Mihara, M., Erster, S., Zaika, A., Petrenko, O., Chittenden, T., Pancoska, P. and Moll,
U.M. (2003) P53 Has a Direct Apoptogenic Role at the Mitochondria.
Molecular Cell. 11(3): 577-590.
Milella, M., Estrov, Z., Kornblau, S.M., Carter, B.Z., Konopleva, M., Tari, A., Schober,
W.D., Harris, D., Leysath, C.E. and Lopez-Berestein, G. (2002) Synergistic
Induction of Apoptosis by Simultaneous Disruption of the Bcl-2 and Mek/Mapk
Pathways in Acute Myelogenous Leukemia. Blood. 99(9): 3461-3464.
Miller, A.J. and Mihm, M.C. (2006) Melanoma. New England Journal of Medicine.
355(1): 51-65.
Mills, K. (2003) Methods for the Molecular Analysis of Cancer. Molecular
Biotechnology. 23(2): 167-170.
Molina, R., Filella, X. and Auge, J.M. (2004) Progrp: A New Biomarker for Small Cell
Lung Cancer. Clinical Biochemistry. 37(7): 505-511.
Montague, R., Hart, C.A., George, N.J., Ramani, V.A.C., Brown, M.D. and Clarke,
N.W. (2004) Differential Inhibition of Invasion and Proliferation by
Bisphosphonates: Anti-Metastatic Potential of Zoledronic Acid in Prostate
Cancer. European Urology. 46(3): 389-402.
Moon, R.T., Kohn, A.D., De Ferrari, G.V. and Kaykas, A. (2004) Wnt and Β-Catenin
Signalling: Diseases and Therapies. Nature Reviews Genetics. 5(9): 691-701.
Morin, P.J. (1999) Β‐Catenin Signaling and Cancer. Bioessays. 21(12): 1021-1030.
211
Mouawad, R., Sebert, M., Michels, J., Bloch, J., Spano, J.P. and Khayat, D. (2010)
Treatment for Metastatic Malignant Melanoma: Old Drugs and New Strategies.
Critical Reviews in Oncology/Hematology. 74(1): 27.
Moynagh, P.N. (2005) The Nf-Κb Pathway. Journal of Cell Science. 118(20): 4589-
4592.
Mukhopadhyay, T., Roth, J.A. and Maxwell, S.A. (1995) Altered Expression of the P50
Subunit of the Nf-Kappa B Transcription Factor Complex in Non-Small Cell
Lung Carcinoma. Oncogene. 11(5): 999.
Murdoch, W., Wilken, C. and Young, D. (1999) Sequence of Apoptosis and
Inflammatory Necrosis within the Formative Ovulatory Site of Sheep Follicles.
Journal of Reproduction and Fertility. 117(2): 325-329.
Naaz, F., Javed, S. and Abdin, M. (2007) Hepatoprotective Effect of Ethanolic Extract
of Phyllanthus Amarus Schum. Et Thonn. On Aflatoxin B1-Induced Liver
Damage in Mice. Journal of Ethnopharmacology. 113(3): 503.
Nagahata, T., Shimada, T., Harada, A., Nagai, H., Onda, M., Yokoyama, S., Shiba, T.,
Jin, E., Kawanami, O. and Emi, M. (2003) Amplification, up-Regulation and
over-Expression of Dvl-1, the Human Counterpart of the Drosophila Disheveled
Gene, in Primary Breast Cancers. Cancer Science. 94(6): 515-518.
Nagata, S. (2000) Apoptotic DNA Fragmentation. Experimental Cell Research. 256(1):
12.
Naik, A. and Juvekar, A. (2003) Effects of Alkaloidal Extract of Phyllanthus Niruri on
Hiv Replication. Indian Journal of Medical Sciences. 57(9): 387.
Nathan, D.M., Angus, P.W. and Gibson, P.R. (2006) Hepatitis B and C Virus Infections
and Anti‐Tumor Necrosis Factor‐Α Therapy: Guidelines for Clinical Approach.
Journal of Gastroenterology and Hepatology. 21(9): 1366-1371.
National Cancer Institute (2009) Introduction to the Prostate [online]. Available:
http://www.cancer.gov/cancertopics/screening/understanding-prostate-
changes/page1. (Accessed: 15 October 2012 2012).
National Cancer Institute (2012) Skin Cancer [online]. Available:
http://www.cancer.gov/cancertopics/types/skin. (Accessed: 15 October 2012).
Nelson, B.H. (2008) The Impact of T‐Cell Immunity on Ovarian Cancer Outcomes.
Immunological Reviews. 222(1): 101-116.
Newman, D.J., Cragg, G.M. and Snader, K.M. (2000) The Influence of Natural
Products Upon Drugdiscovery. Nat. Prod. Rep. 17(3): 215-234.
Ngamkitidechakul, C., Jaijoy, K., Hansakul, P., Soonthornchareonnon, N. and
Sireeratawong, S. (2010) Antitumour Effects of Phyllanthus Emblica L.:
Induction of Cancer Cell Apoptosis and Inhibition of in Vivo Tumour Promotion
and in Vitro Invasion of Human Cancer Cells. Phytotherapy Research. 24(9):
1405-1413.
Nguyen, T., Tran, E., Nguyen, T., Do, P., Huynh, T. and Huynh, H. (2004) The Role of
Activated Mek-Erk Pathway in Quercetin-Induced Growth Inhibition and
Apoptosis in A549 Lung Cancer Cells. Carcinogenesis. 25(5): 647-659.
Nielsen, B.S., Timshel, S., Kjeldsen, L., Sehested, M., Pyke, C., Borregaard, N. and
Danø, K. (1998) 92 Kda Type Iv Collagenase (Mmp‐9) Is Expressed in

212
Neutrophils and Macrophages but Not in Malignant Epithelial Cells in Human
Colon Cancer. International Journal of Cancer. 65(1): 57-62.
Nikolova, P.V., Wong, K.B., DeDecker, B., Henckel, J. and Fersht, A.R. (2000)
Mechanism of Rescue of Common P53 Cancer Mutations by Second-Site
Suppressor Mutations. The EMBO Journal. 19(3): 370-378.
Noë, V., Fingleton, B., Jacobs, K., Crawford, H.C., Vermeulen, S., Steelant, W.,
Bruyneel, E., Matrisian, L.M. and Mareel, M. (2001) Release of an Invasion
Promoter E-Cadherin Fragment by Matrilysin and Stromelysin-1. Journal of
Cell Science. 114(1): 111-118.
Oakley, A. (2012) Lentigo Maligna and Lentigo Maligna Melanoma [online].
Available: http://www.dermnetnz.org/lesions/lentigo-maligna.html. (Accessed:
21th October 2012).
Ohno, Y., Fukuda, K., Takemura, G., Toyota, M., Watanabe, M., Yasuda, N., Xinbin,
Q., Maruyama, R., Akao, S. and Gotou, K. (1999) Induction of Apoptosis by
Gallic Acid in Lung Cancer Cells. Anti-Cancer Drugs. 10(9): 845.
Okegawa, T., Pong, R.C., Li, Y. and Hsieh, J.T. (2004) The Role of Cell Adhesion
Molecule in Cancer Progression and Its Application in Cancer Therapy. ACTA
BIOCHIMICA POLONICA-ENGLISH EDITION-. 51: 445-458.
Okino, K., Nagai, H., Hatta, M., Nagahata, T., Yoneyama, K., Ohta, Y., Jin, E.,
Kawanami, O., Araki, T. and Emi, M. (2003) Up-Regulation and
Overproduction of Dvl-1, the Human Counterpart of the Drosophila Dishevelled
Gene, in Cervical Squamous Cell Carcinoma. Oncology Reports. 10(5): 1219.
Okuda, T., Mori, K. and Hatano, T. (1980) The Distribution of Geraniin and
Mallotusinic Acid in the Order Geraniales. Phytochemistry. 19(4): 547-551.
Ollinger, R., Kogler, P., Troppmair, J., Hermann, M., Wurm, M., Drasche, A.,
Konigsrainer, I., Amberger, A., Weiss, H. and Ofner, D. (2007) Bilirubin
Inhibits Tumor Cell Growth Via Activation of Erk. Cell Cycle. 6(24): 3078-
3085.
Olson, J.M. and Hallahan, A.R. (2004) P38 Map Kinase: A Convergence Point in
Cancer Therapy. Trends in Molecular Medicine. 10(3): 125-129.
Oren, M., Bar, J., Blander, G., Damalas, A., Daniely, Y., David, A., Michael, D.,
Minsky, N., Russek, N., Shifman, O., Taplick, O., Wang, X., Wilder, S.a. and
Zalcenstein, A. (2002) Understanding the Role of P53 in Cancer. In Cancer
Reserach and Theraphy Rehovot, Israel: Weizmann Institute of Science. 174-
175
Osaki, M., Oshimura, M. and Ito, H. (2004) Pi3k-Akt Pathway: Its Functions and
Alterations in Human Cancer. Apoptosis. 9(6): 667-676.
Ott, M., Thyagarajan, S. and Gupta, S. (1997) Phyllanthus Amarus Suppresses Hepatitis
B Virus by Interrupting Interactions between Hbv Enhancer I and Cellular
Transcription Factors. European Journal of Clinical Investigation. 27(11): 908-
915.
Paccione, R.J., Miyazaki, H., Patel, V., Waseem, A., Gutkind, J.S., Zehner, Z.E. and
Yeudall, W.A. (2008) Keratin Down-Regulation in Vimentin-Positive Cancer
Cells Is Reversible by Vimentin Rna Interference, Which Inhibits Growth and
Motility. Molecular cancer therapeutics. 7(9): 2894-2903.

213
Padma, P. and Setty, O. (1999) Protective Effect of< I> Phyllanthus Fraternus</I>
against Carbon Tetrachloride-Induced Mitochondrial Dysfunction. Life Sciences.
64(25): 2411-2417.
Pan, M.H., Lin-Shiau, S.Y., Ho, C.T., Lin, J.H. and Lin, J.K. (2000) Suppression of
Lipopolysaccharide-Induced Nuclear Factor-Kappab Activity by Theaflavin-3,
3'-Digallate from Black Tea and Other Polyphenols through Down-Regulation
of Ikappab Kinase Activity in Macrophages. Biochemical Pharmacology. 59(4):
357.
Papandreou, I., Cairns, R.A., Fontana, L., Lim, A.L. and Denko, N.C. (2006) Hif-1
Mediates Adaptation to Hypoxia by Actively Downregulating Mitochondrial
Oxygen Consumption. Cell Metabolism. 3(3): 187-197.
Park, J.I., Lee, M.G., Cho, K., Park, B.J., Chae, K.S., Byun, D.S., Ryu, B.K., Park, Y.K.
and Chi, S.G. (2003) Transforming Growth Factor-Β1 Activates Interleukin-6
Expression in Prostate Cancer Cells through the Synergistic Collaboration of the
Smad2, P38-Nf-Κb, Jnk, and Ras Signaling Pathways. Oncogene. 22(28): 4314-
4332.
Pellikainen, J.M., Ropponen, K.M., Kataja, V.V., Kellokoski, J.K., Eskelinen, M.J. and
Kosma, V.M. (2004) Expression of Matrix Metalloproteinase (Mmp)-2 and
Mmp-9 in Breast Cancer with a Special Reference to Activator Protein-2, Her2,
and Prognosis. Clinical Cancer Research. 10(22): 7621-7628.
Perkins, N.D. (2002) Not Just a Cdk Inhibitor: Regulation of Transcription by
P21waf1/Cip1/Sdi1. Cell Cycle. 1(1): 35-37.
Perlson, E., Michaelevski, I., Kowalsman, N., Ben-Yaakov, K., Shaked, M., Seger, R.,
Eisenstein, M. and Fainzilber, M. (2006) Vimentin Binding to Phosphorylated
Erk Sterically Hinders Enzymatic Dephosphorylation of the Kinase. Journal of
molecular biology. 364(5): 938-944.
Pettit, G.R., Cragg, G.M., Suffness, M.I., Gust, D., Boettner, F.E., Williams, M., Saenz-
Renauld, J., Brown, P., Schmidt, J.M. and Ellis, P.D. (1984) Antineoplastic
Agents. 104. Isolation and Structure of the Phyllanthus Acuminatus Vahl
(Euphorbiaceae) Glycosides. The Journal of Organic Chemistry. 49(22): 4258-
4266.
Pezzuto, J.M. (1997) Plant-Derived Anticancer Agents. Biochemical Pharmacology.
53(2): 121-133.
Picksley, S.M. and Lane, D.P. (1993) What the Papers Say: The P53‐Mdm2
Autoregulatory Feedback Loop: A Paradigm for the Regulation of Growth
Control by P53? Bioessays. 15(10): 689-690.
Piliang, M.P. (2009) Acral Lentiginous Melanoma. Surgical Pathology Clinics. 2(3):
535-541.
Pitot, H.C. (2006) The Molecular Biology of Carcinogenesis. Cancer. 72(S3): 962-970.
Polakis, P. (2000) Wnt Signaling and Cancer. Genes & development. 14(15): 1837-
1851.
Polakis, P. (2007) The Many Ways of Wnt in Cancer. Current opinion in genetics &
development. 17(1): 45-51.
Poon, E., Harris, A.L. and Ashcroft, M. (2009) Targeting the Hypoxia-Inducible Factor
(Hif) Pathway in Cancer. Expert reviews in molecular medicine. 11(1).
214
Poste, G. and Fidler, I.J. (1980) The Pathogenesis of Cancer Metastasis. Nature.
283(5743): 139.
Proskuryakov, S.Y., Konoplyannikov, A.G. and Gabai, V.L. (2003) Necrosis: A
Specific Form of Programmed Cell Death? Experimental Cell Research. 283(1):
1-16.
Prusty, B.K., Husain, S.A. and Das, B.C. (2005) Constitutive Activation of Nuclear
Factor-Kb: Preferential Homodimerization of P50 Subunits in Cervical
Carcinoma. Front Biosci. 10(5): 1510-1519.
Pukrop, T., Klemm, F., Hagemann, T., Gradl, D., Schulz, M., Siemes, S., Trümper, L.
and Binder, C. (2006) Wnt 5a Signaling Is Critical for Macrophage-Induced
Invasion of Breast Cancer Cell Lines. Proceedings of the National Academy of
Sciences. 103(14): 5454-5459.
Radhakrishnan, S.K., Feliciano, C.S., Najmabadi, F., Haegebarth, A., Kandel, E.S.,
Tyner, A.L. and Gartel, A.L. (2004) Constitutive Expression of E2f-1 Leads to
P21-Dependent Cell Cycle Arrest in S Phase of the Cell Cycle. Oncogene.
23(23): 4173-4176.
Radhika, V., Onesime, D., Ha, J.H. and Dhanasekaran, N. (2004) Gα13 Stimulates Cell
Migration through Cortactin-Interacting Protein Hax-1. Journal of Biological
Chemistry. 279(47): 49406-49413.
Rajeshkumar, N., Joy, K., Kuttan, G., Ramsewak, R., Nair, M.G. and Kuttan, R. (2002)
Antitumour and Anticarcinogenic Activity of< I> Phyllanthus</I>< I>
Amarus</I> Extract. Journal of Ethnopharmacology. 81(1): 17-22.
Rajeshkumar, N. and Kuttan, R. (2000) < I> Phyllanthus Amarus</I> Extract
Administration Increases the Life Span of Rats with Hepatocellular Carcinoma.
Journal of Ethnopharmacology. 73(1): 215-219.
Rajkapoor, B., Sankari, M., Sumithra, M., Anbu, J., Harikrishnan, N., Gobinath, M.,
Suba, V. and Balaji, R. (2007) Antitumor and Cytotoxic Effects of Phyllanthus
Polyphyllus on Ehrlich Ascites Carcinoma and Human Cancer Cell Lines.
Bioscience, Biotechnology, and Biochemistry. 71(9): 2177-2183.
Ramsay, A.G., Keppler, M.D., Jazayeri, M., Thomas, G.J., Parsons, M., Violette, S.,
Weinreb, P., Hart, I.R. and Marshall, J.F. (2007) Hs1-Associated Protein X-1
Regulates Carcinoma Cell Migration and Invasion Via Clathrin-Mediated
Endocytosis of Integrin Αvβ6. Cancer research. 67(11): 5275-5284.
Ranganathan, A.C., Nelson, K.K., Rodriguez, A.M., Kim, K.H., Tower, G.B., Rutter,
J.L., Brinckerhoff, C.E., Huang, T.T., Epstein, C.J. and Jeffrey, J.J. (2001)
Manganese Superoxide Dismutase Signals Matrix Metalloproteinase Expression
Via H2o2-Dependent Erk1/2 Activation. Journal of Biological Chemistry.
276(17): 14264-14270.
Rao, A.V. and Agarwal, S. (2000) Role of Antioxidant Lycopene in Cancer and Heart
Disease. Journal of the American College of Nutrition. 19(5): 563-569.
Raphael, K.R., Sabu, M. and Kuttan, R. (2002) Hypoglycemic Effect of Methanol
Extract of Phyllanthus Amarus Schum & Thonn on Alloxan Induced Diabetes
Mellitus in Rats and Its Relation with Antioxidant Potential. Indian Journal of
Experimental Biology. 40(8): 905.
215
Ratnayake, R., Covell, D., Ransom, T.T., Gustafson, K.R. and Beutler, J.A. (2008)
Englerin a, a Selective Inhibitor of Renal Cancer Cell Growth, from Phyllanthus
Engleri. Organic Letters. 11(1): 57-60.
Rauen, U., Polzar, B., Stephan, H., Mannherz, H.G. and De Groot, H. (1999) Cold-
Induced Apoptosis in Cultured Hepatocytes and Liver Endothelial Cells:
Mediation by Reactive Oxygen Species. The FASEB journal. 13(1): 155-168.
Ravi, R. and Bedi, A. (2002) Sensitization of Tumor Cells to Apo2 Ligand/Trail-
Induced Apoptosis by Inhibition of Casein Kinase Ii. Cancer research. 62(15):
4180-4185.
Reed, J.C. (1998) Bcl-2 Family Proteins. Oncogene. 17(25): 3225.
Ribeiro, S., Guilhermino, L., Sousa, J. and Soares, A. (1999) Novel Bioassay Based on
Acetylcholinesterase and Lactate Dehydrogenase Activities to Evaluate the
Toxicity of Chemicals to Soil Isopods. Ecotoxicology and Environmental Safety.
44(3): 287-293.
Roberts, P. and Der, C. (2007) Targeting the Raf-Mek-Erk Mitogen-Activated Protein
Kinase Cascade for the Treatment of Cancer. Oncogene. 26(22): 3291-3310.
Rodríguez-Berriguete, G., Fraile, B., Martínez-Onsurbe, P., Olmedilla, G., Paniagua, R.
and Royuela, M. (2011) Map Kinases and Prostate Cancer. Journal of Signal
Transduction. 2012.
Romito, K. and Burr, R.D. (2011) Basal and Squamous Cell Carcinoma [online].
Available: http://www.webmd.com/melanoma-skin-cancer/squamous-and-basal-
cell-carcinoma. (Accessed: 16th October 2012).
Rostovtseva, T.K., Tan, W. and Colombini, M. (2005) On the Role of Vdac in
Apoptosis: Fact and Fiction. Journal of Bioenergetics and Biomembranes. 37(3):
129-142.
Roucou, X., Montessuit, S., Antonsson, B. and Martinou, J.C. (2002) Bax
Oligomerization in Mitochondrial Membranes Requires Tbid (Caspase-8-
Cleaved Bid) and a Mitochondrial Protein. Biochemical Journal. 368(Pt 3): 915.
Roy, R., Yang, J. and Moses, M.A. (2009) Matrix Metalloproteinases as Novel
Biomarker S and Potential Therapeutic Targets in Human Cancer. Journal of
Clinical Oncology. 27(31): 5287-5297.
Ruzzene, M., Penzo, D. and Pinna, L.A. (2002) Protein Kinase Ck2 Inhibitor 4, 5, 6, 7-
Tetrabromobenzotriazole (Tbb) Induces Apoptosis and Caspase-Dependent
Degradation of Haematopoietic Lineage Cell-Specific Protein 1 (Hs1) in Jurkat
Cells. Biochemical Journal. 364(Pt 1): 41.
Saetung, A., Itharat, A., Dechsukum, C., Wattanapiromsakul, C., Keawpradub, N. and
Ratanasuwan, P. (2005) Cytotoxic Activity of Thai Medicinal Plants for Cancer
Treatment. Songklanakarin Journal of Science and Technology. 27: 471-478.
Sagebiel, R.W. (1993) Melanocytic Nevi in Histologic Association with Primary
Cutaneous Melanoma of Superficial Spreading and Nodular Types: Effect of
Tumor Thickness. Journal of Investigative Dermatology. 100: 322S-325S.
Santos, A.R.S., De Campos, R.O.P., Miguel, O.G., Cechinel Filho, V., Siani, A.C.,
Yunes, R.A. and Calixto, J.B. (2000) Antinociceptive Properties of Extracts of
New Species of Plants of the Genus< I> Phyllanthus</I>(Euphorbiaceae).
Journal of Ethnopharmacology. 72(1): 229-238.

216
Santos, A.R.S., NIERO, R., VIANA, A.N.A.M., MORENO, F.N., CAMPOS, M.M.,
YUNES, R.A. and CALIXTO, J.B. (1994) Analgesic Effects of Callus Culture
Extracts from Selected Species of Phyllanthus in Mice. Journal of Pharmacy
and Pharmacology. 46(9): 755-759.
Santos, A.R.S., Yunes, R.A. and Calixto, J.B. (1995) Analysis of the Mechanisms
Underlying the Antinociceptive Effect of the Extracts of Plants from the Genus<
I> Phyllanthus</I>. General Pharmacology: The Vascular System. 26(7): 1499-
1506.
Satelli, A. and Li, S. (2011) Vimentin in Cancer and Its Potential as a Molecular Target
for Cancer Therapy. Cellular and Molecular Life Sciences. 68(18): 3033-3046.
Sawai, Y., Tamura, S., Fukui, K., Ito, N., Imanaka, K., Saeki, A., Sakuda, S., Kiso, S.
and Matsuzawa, Y. (2003) Expression of Ephrin-B1 in Hepatocellular
Carcinoma: Possible Involvement in Neovascularization. Journal of Hepatology.
39(6): 991-996.
Schäfer, D., Hamm-Künzelmann, B. and Brand, K. (1997) Glucose Regulates the
Promoter Activity of Aldolase a and Pyruvate Kinase M< Sub> 2</Sub> Via
Dephosphorylation of Sp1. FEBS Letters. 417(3): 325-328.
Scher, H.I., Jia, X., de Bono, J.S., Fleisher, M., Pienta, K.J., Raghavan, D. and Heller,
G. (2009) Circulating Tumour Cells as Prognostic Markers in Progressive,
Castration-Resistant Prostate Cancer: A Reanalysis of Immc38 Trial Data. The
Lancet Oncology. 10(3): 233-239.
Schreiber, M., Kolbus, A., Piu, F., Szabowski, A., Möhle-Steinlein, U., Tian, J., Karin,
M., Angel, P. and Wagner, E.F. (1999) Control of Cell Cycle Progression by C-
Jun Is P53 Dependent. Genes & Development. 13(5): 607-619.
Serrano, A., Palacios, C., Roy, G., Cespón, C., Villar, M.L., Nocito, M. and González-
Porqué, P. (1998) Derivatives of Gallic Acid Induce Apoptosis in Tumoral Cell
Lines and Inhibit Lymphocyte Proliferation. Archives of Biochemistry and
Biophysics. 350(1): 49-54.
Seth, R., Kharb, S. and Kharb, D. (2003) Serum Biochemical Markers in Carcinoma
Breast. Indian Journal of Medical Sciences. 57(8): 350.
Shapiro, G.I. and Harper, J.W. (1999) Anticancer Drug Targets: Cell Cycle and
Checkpoint Control. Journal of Clinical Investigation. 104(12): 1645-1654.
She, Q.B., Chen, N., Bode, A.M., Flavell, R.A. and Dong, Z. (2002a) Deficiency of C-
Jun-Nh2-Terminal Kinase-1 in Mice Enhances Skin Tumor Development by 12-
O-Tetradecanoylphorbol-13-Acetate. Cancer Research. 62(5): 1343-1348.
She, Q.B., Huang, C., Zhang, Y. and Dong, Z. (2002b) Involvement of C‐Jun Nh2‐Terminal Kinases in Resveratrol‐Induced Activation of P53 and Apoptosis.
Molecular Carcinogenesis. 33(4): 244-250.
Sheiness, D., Fanshier, L. and Bishop, J.M. (1978) Identification of Nucleotide
Sequences Which May Encode the Oncogenic Capacity of Avian Retrovirus
Mc29. Journal of Virology. 28(2): 600-610.
Shen, S.C., Chen, Y.C., Hsu, F.L. and Lee, W.R. (2003) Differential Apoptosis‐Inducing Effect of Quercetin and Its Glycosides in Human Promyeloleukemic
Hl‐60 Cells by Alternative Activation of the Caspase 3 Cascade. Journal of
Cellular Biochemistry. 89(5): 1044-1055.

217
Sherr, C.J. and Weber, J.D. (2000) The Arf/P53 Pathway. Current Opinion in Genetics
& Development. 10(1): 94-99.
Shields, J.D., Kourtis, I.C., Tomei, A.A., Roberts, J.M. and Swartz, M.A. (2010)
Induction of Lymphoidlike Stroma and Immune Escape by Tumors That
Express the Chemokine Ccl21. Science Signalling. 328(5979): 749.
Shimizu, A., Masuda, Y., Kitamura, H., Ishizaki, M., Ohashi, R., Sugisaki, Y. and
Yamanaka, N. (2000) Complement-Mediated Killing of Mesangial Cells in
Experimental Glomerulonephritis: Cell Death by a Combination of Apoptosis
and Necrosis. Nephron. 86(2): 152-160.
Shiojima, I. and Walsh, K. (2002) Role of Akt Signaling in Vascular Homeostasis and
Angiogenesis. Circulation Research. 90(12): 1243-1250.
Shishodia, S., Sethi, G., Ahn, K.S. and Aggarwal, B.B. (2007) Guggulsterone Inhibits
Tumor Cell Proliferation, Induces S-Phase Arrest, and Promotes Apoptosis
through Activation of C-Jun N-Terminal Kinase, Suppression of Akt Pathway,
and Downregulation of Antiapoptotic Gene Products. Biochemical
Pharmacology. 74(1): 118-130.
Shoeb, M. (2006) Anticancer Agents from Medicinal Plants. Bangladesh journal of
pharmacology. 1(2): 35-41.
Shokunbi, O. and Odetola, A. (2008) Gastroprotective and Antioxidant Activities of
Phyllanthus Amarus Extracts on Absolute Ethanol-Induced Ulcer in Albino
Rats. J. Med. Plant. Res. 2(10): 261-267.
Shtutman, M., Zhurinsky, J., Simcha, I., Albanese, C., D’Amico, M., Pestell, R. and
Ben-Ze’ev, A. (1999) The Cyclin D1 Gene Is a Target of the Β-Catenin/Lef-1
Pathway. Proceedings of the National Academy of Sciences. 96(10): 5522-5527.
Shukla, S., MacLennan, G.T., Fu, P., Patel, J., Marengo, S.R., Resnick, M.I. and Gupta,
S. (2004) Nuclear Factor-Κb/P65 (Rel a) Is Constitutively Activated in Human
Prostate Adenocarcinoma and Correlates with Disease Progression. Neoplasia
(New York, NY). 6(4): 390.
Siegel, R., Naishadham, D. and Jemal, A. (2013) Cancer Statistics, 2013. CA: A Cancer
Journal for Clinicians. 63(1): 11-30.
Sier, C., Kubben, F., Ganesh, S., Heerding, M., Griffioen, G., Hanemaaijer, R., Van
Krieken, J., Lamers, C. and Verspaget, H. (1996) Tissue Levels of Matrix
Metalloproteinases Mmp-2 and Mmp-9 Are Related to the Overall Survival of
Patients with Gastric Carcinoma. British Journal of Cancer. 74(3): 413.
Singh, A. and Settleman, J. (2010) Emt, Cancer Stem Cells and Drug Resistance: An
Emerging Axis of Evil in the War on Cancer. Oncogene. 29(34): 4741-4751.
Skin Cancer Info Line (2012) Non-Melanoma Skin Cancer [online]. Available:
http://www.skincancerinfoline.com/skin-cancer-non-melanoma.html. (Accessed:
15th October 2012).
Skin Cancer Specialists (2012) Malignant Melanoma [online]. Available:
http://www.skincancerspecialists.com/malignant_melanoma.shtml. (Accessed:
16th October 2012).
Song, H., Hollstein, M. and Xu, Y. (2007) P53 Gain-of-Function Cancer Mutants
Induce Genetic Instability by Inactivating Atm. Nature Cell Biology. 9(5): 573-
580.
218
Sosman, J.A. (2012) Patient Information: Melanoma Treatment; Advanced or
Metastatic Melanoma (Beyond the Basics) [online]. Available:
http://www.uptodate.com/contents/melanoma-treatment-advanced-or-metastatic-
melanoma-beyond-the-basics. (Accessed: 16th October 2012).
Spainhour, C.B. (2005) Natural Products. Pharmaceutical Sciences Encyclopedia: Drug
Discovery, Development, and Manufacturing.
Sreedhar, A.S. and Csermely, P. (2004) Heat Shock Proteins in the Regulation of
Apoptosis: New Strategies in Tumor Therapy: A Comprehensive Review.
Pharmacology & therapeutics. 101(3): 227-257.
Sripanidkulchai, B., Tattawasart, U., Laupatarakasem, P., Vinitketkumneun, U.,
Sripanidkulchai, K., Furihata, C. and Matsushima, T. (2002) Antimutagenic and
Anticarcinogenic Effects of< I> Phyllanthus Amarus</I>. Phytomedicine. 9(1):
26-32.
Srividya, N. and Periwal, S. (1995) Diuretic, Hypotensive and Hypoglycaemic Effect of
Phyllanthus Amarus. Indian Journal of Experimental Biology. 33(11): 861.
Stearns, M. and Stearns, M.E. (1996) Evidence for Increased Activated
Metalloproteinase 2 (Mmp-2a) Expression Associated with Human Prostate
Cancer Progression. Oncology Research. 8(2): 69.
Stennicke, H.R. and Salvesen, G.S. (2000) Caspases–Controlling Intracellular Signals
by Protease Zymogen Activation. Biochimica et Biophysica Acta (BBA)-Protein
Structure and Molecular Enzymology. 1477(1): 299-306.
Stoyanova, T., Roy, N., Kopanja, D., Raychaudhuri, P. and Bagchi, S. (2009) Ddb2
(Damaged-DNA Binding Protein 2) in Nucleotide Excision Repair and DNA
Damage Response. Cell Cycle. 8(24): 4067-4071.
Subeki, Matsuura, H., Takahashi, K., Yamasaki, M., Yamato, O., Maede, Y., Katakura,
K., Kobayashi, S., Trimurningsih and Chairul, a. (2005) Anti-Babesial and Anti-
Plasmodial Compounds from Phyllanthus N Iruri. Journal of Natural Products.
68(4): 537-539.
Sun, J. and Hai Liu, R. (2006) Cranberry Phytochemical Extracts Induce Cell Cycle
Arrest and Apoptosis in Human Mcf-7 Breast Cancer Cells. Cancer Letters.
241(1): 124-134.
Sun, Q., Hua, J., Wang, Q., Xu, W., Zhang, J., Kang, J. and Li, M. (2012) Expressions
of Grp78 and Bax Associate with Differentiation, Metastasis, and Apoptosis in
Non-Small Cell Lung Cancer. Molecular Biology Reports. 1-9.
Surawska, H., Ma, P.C. and Salgia, R. (2004) The Role of Ephrins and Eph Receptors in
Cancer. Cytokine & Growth Factor Reviews. 15(6): 419-433.
Suzuki, Y., Demoliere, C., Kitamura, D., Takeshita, H., Deuschle, U. and Watanabe, T.
(1997) Hax-1, a Novel Intracellular Protein, Localized on Mitochondria,
Directly Associates with Hs1, a Substrate of Src Family Tyrosine Kinases. The
Journal of Immunology. 158(6): 2736-2744.
Swetter, S.M., Geller, A.C. and Kirkwood, J.M. (2004) Melanoma in the Older Person.
Oncology. 18(9): 1187-1196.
Takenaka, Y., Fukumori, T. and Raz, A. (2002) Galectin-3 and Metastasis.
Glycoconjugate Journal. 19(7): 543-549.

219
Takimoto, R., MacLachlan, T.K., Dicker, D.T., Niitsu, Y., Mori, T. and El-Deiry, W.S.
(2002) Brca1 Transcriptionally Regulates Damaged DNA Binding Protein
(Ddb2) in the DNA Repair Response Following Uv-Irradiation. Cancer Biology
& Therapy. 1(2): 171-179.
Talalay, P. and Fahey, J.W. (2001) Phytochemicals from Cruciferous Plants Protect
against Cancer by Modulating Carcinogen Metabolism. The Journal of
Nutrition. 131(11): 3027S-3033S.
Tan, G., Gyllenhaal, C. and Soejarto, D. (2006) Biodiversity as a Source of Anticancer
Drugs. Current Drug Targets. 7(3): 265-277.
Tanaka, M., Kamata, R., Takigahira, M., Yanagihara, K. and Sakai, R. (2007)
Phosphorylation of Ephrin-B1 Regulates Dissemination of Gastric Scirrhous
Carcinoma. The American Journal of Pathology. 171(1): 68-78.
Tang, Y., Simoneau, A.R., Liao, W., Yi, G., Hope, C., Liu, F., Li, S., Xie, J., Holcombe,
R.F. and Jurnak, F.A. (2009) Wif1, a Wnt Pathway Inhibitor, Regulates Skp2
and C-Myc Expression Leading to G1 Arrest and Growth Inhibition of Human
Invasive Urinary Bladder Cancer Cells. Molecular Cancer Therapeutics. 8(2):
458-468.
Tang, Y.Q., Jaganath, I.B. and Sekaran, S.D. (2010) Phyllanthus Spp. Induces Selective
Growth Inhibition of Pc-3 and Mewo Human Cancer Cells through Modulation
of Cell Cycle and Induction of Apoptosis. PLoS One. 5(9): e12644.
Tang, Y.Q. and Sekaran, S.D. (2011) Evaluation of Phyllanthus, for Its Anti-Cancer
Properties. In Prostate Cancer - from Bench to Bedside, ed. Philippe E. Spiess.
InTech. 305-320
Taylor, L. (2003) Technical Data Report for Chancap Piedra Stone Breaker
(Phyllanthus Niruri). Herbal.
Teng, M.W.L., Swann, J.B., Koebel, C.M., Schreiber, R.D. and Smyth, M.J. (2008)
Immune-Mediated Dormancy: An Equilibrium with Cancer. Journal of
Leukocyte Biology. 84(4): 988-993.
Testa, J.R. and Bellacosa, A. (2001) Akt Plays a Central Role in Tumorigenesis. Science
Signalling. 98(20): 10983.
Tew, K.D. (1994) Glutathione-Associated Enzymes in Anticancer Drug Resistance.
Cancer research. 54(16): 4313-4320.
Thornburg, J.M., Nelson, K.K., Clem, B.F., Lane, A.N., Arumugam, S., Simmons, A.,
Eaton, J.W., Telang, S. and Chesney, J. (2008) Targeting Aspartate
Aminotransferase in Breast Cancer. Breast Cancer Research. 10(5): R84.
Totte, J., Tona, L., Pieters, L., Mesia, K., Vlietinck, A., Ngimbi, N., Chrimwami, B.,
Cimanga, K., de Bruyne, T. and Apers, S. (2001) In-Vivo Antimalarial Activity
of Cassia Occidentalis, Morinda Morindoides and Phyllanthus Niruri. Annals of
Tropical Medicine and Parasitology. 95(1): 47-57.
Townsend, D.M., Tew, K.D. and Tapiero, H. (2003) The Importance of Glutathione in
Human Disease. Biomedicine & Pharmacotherapy. 57(3): 145-155.
Toyoshima, H. and Hunter, T. (1994) P27, a Novel Inhibitor of G1 Cyclin-Cdk Protein
Kinase Activity, Is Related to P21. Cell. 78(1): 67.
Tsujimoto, Y. (2001) Role of Bcl‐2 Family Proteins in Apoptosis: Apoptosomes or
Mitochondria? Genes to Cells. 3(11): 697-707.

220
Tsujimoto, Y. and Shimizu, S. (2002) The Voltage-Dependent Anion Channel: An
Essential Player in Apoptosis. Biochimie. 84(2-3): 187.
Turjanski, A., Vaque, J. and Gutkind, J. (2007) Map Kinases and the Control of Nuclear
Events. Oncogene. 26(22): 3240-3253.
Tzivion, G. and Avruch, J. (2002) 14-3-3 Proteins: Active Cofactors in Cellular
Regulation by Serine/Threonine Phosphorylation. Journal of Biological
Chemistry. 277(5): 3061-3064.
Tzivion, G., Gupta, V.S., Kaplun, L. and Balan, V. 14-3-3 Proteins as Potential
Oncogenes. Seminars in Cancer Biology, 2006. 16: 203-213. Elsevier.
Ugolini, F., Adelaide, J., Charafe-Jauffret, E., Nguyen, C., Jacquemier, J., Jordan, B.,
Birnbaum, D. and Pebusque, M.J. (1999) Differential Expression Assay of
Chromosome Arm 8p Genes Identifies Frizzled-Related (Frp1/Frzb) and
Fibroblast Growth Factor Receptor 1 (Fgfr1) as Candidate Breast Cancer Genes.
Oncogene. 18(10): 1903.
Ugurel, S., Utikal, J. and Becker, J.C. (2009) Tumor Biomarkers in Melanoma. Cancer
control: Journal of the Moffitt Cancer Center. 16(3): 219.
Unander, D.W., Venkateswaran, P., Millman, I., Bryan, H.H., Blumberg, B.S., Janick, J.
and Simon, J. (1990) Phyllanthus Species: Sources of New Antiviral
Compounds. Advances in new crops. Timber Press, Portland, OR. 8720: 518-
521.
Uría, J.A. and López-Otín, C. (2000) Matrilysin-2, a New Matrix Metalloproteinase
Expressed in Human Tumors and Showing the Minimal Domain Organization
Required for Secretion, Latency, and Activity. Cancer Research. 60(17): 4745-
4751.
Uzgare, A.R., Kaplan, P.J. and Greenberg, N.M. (2003) Differential Expression and/or
Activation of P38mapk, Erk1/2, and Jnk During the Initiation and Progression of
Prostate Cancer. The Prostate. 55(2): 128-139.
Vajdic, C.M. and van Leeuwen, M.T. (2009) Cancer Incidence and Risk Factors after
Solid Organ Transplantation. International Journal of Cancer. 125(8): 1747-
1754.
van Agtmael, M.A., Eggelte, T.A. and van Boxtel, C.J. (1999) Artemisinin Drugs in the
Treatment of Malaria: From Medicinal Herb to Registered Medication. Trends
in Pharmacological Sciences. 20(5): 199.
van de Wetering, M., Sancho, E., Verweij, C., de Lau, W., Oving, I., Hurlstone, A., van
der Horn, K., Batlle, E., Coudreuse, D. and Haramis, A.P. (2002) The Β-
Catenin/Tcf-4 Complex Imposes a Crypt Progenitor Phenotype on Colorectal
Cancer Cells. Cell. 111(2): 241-250.
Van der Kamp, A. and Jaspers, N. (1984) The Molecular Biology of Carcinogenesis.
Cutaneous Melanoma and Precursor Lesions. Martinus Nijhoff, Boston
Dordrecht. 9-18.
Vander Heiden, M.G., Cantley, L.C. and Thompson, C.B. (2009) Understanding the
Warburg Effect: The Metabolic Requirements of Cell Proliferation. Science
Signalling. 324(5930): 1029.

221
Vara, J.Á.F., Casado, E., de Castro, J., Cejas, P., Belda-Iniesta, C. and González-Barón,
M. (2004) Pi3k/Akt Signalling Pathway and Cancer. Cancer treatment reviews.
30(2): 193-204.
Vaught, D., Brantley-Sieders, D.M. and Chen, J. (2008) Eph Receptors in Breast
Cancer: Roles in Tumor Promotion and Tumor Suppression. Breast Cancer Res.
10(6): 217.
Velculescu, V.E., Zhang, L., Vogelstein, B. and Kinzler, K.W. (1995) Serial Analysis of
Gene Expression. Science-AAAS-Weekly Paper Edition. 270(5235): 484-486.
Venkateswaran, P., Millman, I. and Blumberg, B. (1987) Effects of an Extract from
Phyllanthus Niruri on Hepatitis B and Woodchuck Hepatitis Viruses: In Vitro
and in Vivo Studies. Proceedings of the National Academy of Sciences. 84(1):
274-278.
Veronica, H., Salvador, H., Stephan, R., Miriam, W., Cyril, R., Antonio, C., Jacques, P.,
Robert, G., Licia, R. and Stefano, F. (2010) Proton Dynamics in Cancer.
Vincent, T.L. and Gatenby, R.A. (2008) An Evolutionary Model for Initiation,
Promotion, and Progression in Carcinogenesis. International Journal of
Oncology. 32(4): 729-737.
Vogelstein, B., Lane, D. and Levine, A.J. (2000) Surfing the P53 Network. Nature.
408(6810): 307.
Voulgari, A. and Pintzas, A. (2009) Epithelial–Mesenchymal Transition in Cancer
Metastasis: Mechanisms, Markers and Strategies to Overcome Drug Resistance
in the Clinic. Biochimica et Biophysica Acta (BBA)-Reviews on Cancer.
1796(2): 75-90.
Vousden, K.H. and Lu, X. (2002) Live or Let Die: The Cell's Response to P53. Nature
Reviews Cancer. 2(8): 594-604.
Vyakarnam, A., Dagher, S.F., Wang, J.L. and Patterson, R.J. (1997) Evidence for a
Role for Galectin-1 in Pre-Mrna Splicing. Molecular and Cellular Biology.
17(8): 4730-4737.
Waga, S., Hannon, G.J., Beach, D. and Stillman, B. (1994) The P21 Inhibitor of Cyclin-
Dependent Kinases Controls DNA Replication by Interaction with Pcna. Nature.
369(6481): 574-578.
Wagner, E.F. and Nebreda, Á.R. (2009) Signal Integration by Jnk and P38 Mapk
Pathways in Cancer Development. Nature Reviews Cancer. 9(8): 537-549.
Waldman, T., Zhang, Y., Dillehay, L., Yu, J., Kinzler, K., Vogelstein, B. and Williams,
J. (1997) Cell-Cycle Arrest Versus Cell Death in Cancer Therapy. Nature
Medicine. 3(9): 1034-1036.
Wallace, D.C. (1999) Mitochondrial Diseases in Man and Mouse. Science. 283(5407):
1482-1488.
Wang, B.Q. and Jin, Z.X. Induction of Apoptosis in Human Gastric Carcinoma Cell by
Geraniin. Biomedical Engineering and Informatics (BMEI), 2010 3rd
International Conference on, 2010. 5: 1951-1954. IEEE.
Warburg, O. (1956) On the Origin of Cancer Cells. Science. 123(3191): 309-314.
Warny, M., Keates, A.C., Keates, S., Castagliuolo, I., Zacks, J.K., Aboudola, S., Qamar,
A., Pothoulakis, C., LaMont, J.T. and Kelly, C.P. (2000) P38 Map Kinase

222
Activation by Clostridium Difficile Toxin a Mediates Monocyte Necrosis, Il-8
Production, and Enteritis. Journal of Clinical Investigation. 105(8): 1147-1156.
Watson, D.K., Reddy, E.P., Duesberg, P.H. and Papas, T.S. (1983) Nucleotide
Sequence Analysis of the Chicken C-Myc Gene Reveals Homologous and
Unique Coding Regions by Comparison with the Transforming Gene of Avian
Myelocytomatosis Virus Mc29, Delta Gag-Myc. Proceedings of the National
Academy of Sciences. 80(8): 2146-2150.
Weidner, N., Semple, J.P., Welch, W.R. and Folkman, J. (1991) Tumor Angiogenesis
and Metastasis—Correlation in Invasive Breast Carcinoma. New England
Journal of Medicine. 324(1): 1-8.
Weinstock, M. and Sober, A. (2006) The Risk of Progression of Lentigo Maligna to
Lentigo Maligna Melanoma. British Journal of Dermatology. 116(3): 303-310.
Weston, C.R. and Davis, R.J. (2002) The Jnk Signal Transduction Pathway. Current
Opinion in Genetics & Development. 12(1): 14-21.
WHO (2008) Traditional Medicine [online]. Available:
http://www.who.int/mediacentre/factsheets/fs134/en/. (Accessed: 17th October
2012).
Wilker, E. and Yaffe, M.B. (2004) 14-3-3 Proteins—a Focus on Cancer and Human
Disease. Journal of Molecular and Cellular Cardiology. 37(3): 633-642.
Wilson, C.L. and Matrisian, L.M. (1996) Matrilysin: An Epithelial Matrix
Metalloproteinase with Potentially Novel Functions. The International Journal
of Biochemistry & Cell Biology. 28(2): 123-136.
Wu, G.S. (2004) The Functional Interactions between the P53 and Mapk Signaling
Pathways. Cancer Biol Ther. 3(2): 156-161.
Xiao, D., Choi, S., Johnson, D.E., Vogel, V.G., Johnson, C.S., Trump, D.L., Lee, Y.J.
and Singh, S.V. (2004) Diallyl Trisulfide-Induced Apoptosis in Human Prostate
Cancer Cells Involves C-Jun N-Terminal Kinase and Extracellular-Signal
Regulated Kinase-Mediated Phosphorylation of Bcl-2. Oncogene. 23(33): 5594-
5606.
Xiong, J.Z. and Qing, W.B. Induction of P53 Genes in Human Hepatoma Cells by
Geraniin. Biomedical Engineering and Informatics (BMEI), 2010 3rd
International Conference on, 2010. 5: 2071-2074. IEEE.
Xu, C., Shen, G., Yuan, X., Kim, J., Gopalkrishnan, A., Keum, Y.S., Nair, S. and Kong,
A.N.T. (2006) Erk and Jnk Signaling Pathways Are Involved in the Regulation
of Activator Protein 1 and Cell Death Elicited by Three Isothiocyanates in
Human Prostate Cancer Pc-3 Cells. Carcinogenesis. 27(3): 437-445.
Xu, J., Chen, Y. and Olopade, O.I. (2010) Myc and Breast Cancer. Genes & Cancer.
1(6): 629-640.
Xu, R., Pelicano, H., Zhou, Y., Carew, J.S., Feng, L., Bhalla, K.N., Keating, M.J. and
Huang, P. (2005) Inhibition of Glycolysis in Cancer Cells: A Novel Strategy to
Overcome Drug Resistance Associated with Mitochondrial Respiratory Defect
and Hypoxia. Cancer research. 65(2): 613-621.
Xu, X., Qiao, W., Linke, S.P., Cao, L., Li, W.M., Furth, P.A., Harris, C.C. and Deng,
C.X. (2001) Genetic Interactions between Tumor Suppressors Brca1 and P53 in
Apoptosis, Cell Cycle and Tumorigenesis. Nature Genetics. 28(3): 266-271.

223
Yabe, D., Nakamura, T., Kanazawa, N., Tashiro, K. and Honjo, T. (1997) Calumenin, a
Ca2+-Binding Protein Retained in the Endoplasmic Reticulum with a Novel
Carboxyl-Terminal Sequence, Hdef. Journal of Biological Chemistry. 272(29):
18232-18239.
Yang, L., Pang, Y. and Moses, H.L. (2010) Tgf-Β and Immune Cells: An Important
Regulatory Axis in the Tumor Microenvironment and Progression. Trends in
Immunology. 31(6): 220-227.
Yang, R.Y. and Liu, F.T. (2003) Galectins in Cell Growth and Apoptosis. Cellular and
Molecular Life Sciences. 60(2): 267-276.
Yee, C., Thompson, J.A., Roche, P., Byrd, D.R., Lee, P.P., Piepkorn, M., Kenyon, K.,
Davis, M.M., Riddell, S.R. and Greenberg, P.D. (2000) Melanocyte Destruction
after Antigen-Specific Immunotherapy of Melanoma Direct Evidence of T Cell–
Mediated Vitiligo. The Journal of Experimental Medicine. 192(11): 1637-1644.
Yeh, S.F., Hong, C.Y., Huang, Y.L., Liu, T.Y., Choo, K.B. and Chou, C.K. (1993)
Effect of an Extract from< I> Phyllanthus Amarus</I> on Hepatitis B Surface
Antigen Gene Expression in Human Hepatoma Cells. Antiviral Research. 20(3):
185-192.
Yen, G.C., Duh, P.D. and Tsai, H.L. (2002) Antioxidant and Pro-Oxidant Properties of
Ascorbic Acid and Gallic Acid. Food Chemistry. 79(3): 307-313.
Yilmaz, M. and Christofori, G. (2009) Emt, the Cytoskeleton, and Cancer Cell Invasion.
Cancer and Metastasis Reviews. 28(1): 15-33.
Yoshioka, K., Kataoka, T., Hayashi, T., Hasegawa, M., Ishi, Y. and Hibasami, H.
(2000) Induction of Apoptosis by Gallic Acid in Human Stomach Cancer Kato
Iii and Colon Adenocarcinoma Colo 205 Cell Lines. Oncology Reports. 7(6):
1221.
Yoshizaki, T., Maruyama, Y., Sato, H. and Furukawa, M. (2001) Expression of Tissue
Inhibitor of Matrix Metalloproteinase‐2 Correlates with Activation of Matrix
Metalloproteinase‐2 and Predicts Poor Prognosis in Tongue Squamous Cell
Carcinoma. International Journal of Cancer. 95(1): 44-50.
Zagzag, D., Amirnovin, R., Greco, M.A., Yee, H., Holash, J., Wiegand, S.J., Zabski, S.,
Yancopoulos, G.D. and Grumet, M. (2000) Vascular Apoptosis and Involution
in Gliomas Precede Neovascularization: A Novel Concept for Glioma Growth
and Angiogenesis. Laboratory Investigation. 80(6): 837-849.
Zetter, P., B.R. (1998) Angiogenesis and Tumor Metastasis. Annual Review of
Medicine. 49(1): 407-424.
Zhang, H.G., Wang, J., Yang, X., Hsu, H.C. and Mountz, J.D. (2004) Regulation of
Apoptosis Proteins in Cancer Cells by Ubiquitin. Oncogene. 23(11): 2009-2015.
Zhang, H.J., Zhao, W., Venkataraman, S., Robbins, M.E.C., Buettner, G.R., Kregel,
K.C. and Oberley, L.W. (2002) Activation of Matrix Metalloproteinase-2 by
Overexpression of Manganese Superoxide Dismutase in Human Breast Cancer
Mcf-7 Cells Involves Reactive Oxygen Species. Journal of Biological
Chemistry. 277(23): 20919-20926.
Zhu, Q.S., Rosenblatt, K., Huang, K.L., Lahat, G., Brobey, R., Bolshakov, S., Nguyen,
T., Ding, Z., Belousov, R. and Bill, K. (2010) Vimentin Is a Novel Akt1 Target
Mediating Motility and Invasion. Oncogene. 30(4): 457-470.

224
Ziello, J.E., Jovin, I.S. and Huang, Y. (2007) Hypoxia-Inducible Factor (Hif)-1
Regulatory Pathway and Its Potential for Therapeutic Intervention in
Malignancy and Ischemia. The Yale journal of biology and medicine. 80(2): 51.
Zong, W.X. and Thompson, C.B. (2006) Necrotic Death as a Cell Fate. Genes &
Development. 20(1): 1-15.

225
APPENDICES
APPENDIX I: Reagent and media preparation
(1) Equipment used
- Vertical laminar flow cabinet (Microflow, Birmingham, UK)
- Water bath (SASTEC)
- Electronic balance (SASTEC)
- Analytical balance (SATEC)
- Ultracentrifuge (Eppendorf)
- GloMax®-Multi Detection Reader (Promega, USA)
- Inverted microscope (Olympus CK-40)
- Inverted microscope (Olympus BX41)
- Olympus µ-1040 camera
- UV transilluminator (Vilbert loumat, France)
(2) Preparation of EMEM, DMEM and RPMI-1640
- EMEM supplemented with L-glutamine stock (powder form), (Flowlab, Australia)
- DMEM supplemented with L-glutamine stock (powder form), (Flowlab, Australia)
- RPMI-1640 supplemented with L-glutamine stock (powder form), (Flowlab,
Australia)
- Sterile Fetal Bovine Serum, FBS (Flowlab, Australia)
- Penicillin-Stretomycin, (Gibco-BRL, USA)
- HEPES buffer (Sigma-Aldrich, Ireland Ltd)
- Sodium bicarbonate (NaHCO3) (Sigma-Aldrich, Ireland Ltd)
- Filter unit with 0.2µm membrane filter, (Nalgene, USA)
- Autoclaved double-distilled water
Growth medium (GM) – 1000 ml
Stock media 13.39g
HEPES buffer 4.7g
Sodium bicarbonate 3.7g
Fetal Bovine Serum (inactivated) 50ml
Penicillin-streptomycin 0.2ml
Distilled water Top up to 1000ml
- Mix all the chemicals into a 1000ml reagent bottle and then filter through a 0.2
µm of membrane filter.
- Store at 4°C.

226
(3) Preparation of freezing medium
- Prepared serum free EMEM/RPMI-1640
- Fetal Bovine Serum (Flowlab, Australia)
- DMSO (Sigma-Aldrich, Ireland Ltd)
- Autoclaved double distilled water
- Sterile 50ml falcon bottle (Corning Inc, USA)
Freezing medium – 10ml
Prepared serum free EMEM/RPMI-1640 6ml
Fetal Bovine Serum (inactivated) 3ml
DMSO 1ml
- Mix all the chemicals into a 10ml falcon bottle.
- Store at 4°C.
(4) Preparation of 1X PBS (100ml)
- 1 PBS tablet (Amresco, USA)
- Double distilled water (100ml)
- Dissolve the PBS tablet in the double distilled water
- Autoclave the 1X PBS buffer
(5) Reagents for MTS assay
CellTiter 96® Aqueous Non-Radioactive Cell Proliferation assay kit (Promega,
Madison, WI)
Kit components
- 3-(4,5-dimethylthiazol-2-yl)-5-(3-carboxymethoxyphenyl)-2-(4-sulphonyl)-2H
tetrazolium, inner salt (MTS) solution
- Phenazine methosulphate (PMS) solution
- Store at -20°C
(6) Reagents for DNA staining for cell cycle analysis
- Ice cold 70% ethanol
- PBS
- RNase (1 mg/ml)
- Propidium iodide (PI) (1 mg/ml)
227
(7) Reagents for DNA extraction
- PBS
- Lysis buffer
- Phenol/chloroform/isoamyl alcohol (24:25:1)
- 3M Sodium acetate (pH 5.2)
- Isopropanol
- Deionized water-RNase solution (10 mg/ml)
(8) Preparation of lysis buffer for DNA Fragmentation assay
0.5 M EDTA, pH7.0 40 ml
1 M Tris-Cl buffer, pH 8.0 5 ml
100 % Triton X-100 5 ml
Distilled water 50 ml
(9) Preparation of 0.5 M EDTA, pH7.0
- Disodium EDTA.2H2O (18.61 g)
- Double distilled water (100 ml)
- Fine adjust to the desired pH (7.0) with 1 M NaOH
(10) Preparation of 1 M NaOH
- NaOH (4 g)
- Double distilled water (100 ml)
(11) Preparation of 1M Tris-Cl, pH 8.0
- Tris base (12.11 g)
- Double distilled water (80 ml)
- Fine adjust to the desired pH (8.0) with concentrated HCI
- Distilled water (final volume 100 ml)
(12) Preparation of 3 M sodium acetate, pH 5.2
- Hydrated sodium acetate (20.4 g)
- Double distilled water (40 ml)
- Fine adjust to the desired pH (5.2)
- Distilled water (final volume 50 ml)

228
(13) Reagents for Capsase-3/7 assay
Caspase-Glo 3/7 Assay kit (Promega, Madison, WI)
Kit components
- Caspase-Glo 3/7 substrate
- Caspase-Glo 3/7 buffer
(14) Reagents for TUNEL Assay
ApopTag Plus Peroxidase In Situ Apoptosis Detection Kit (S7101), (Chemical
International, USA).
Kit components
- Equilibration buffer
- Reaction buffer
- TdT enzyme
- Stop/Wash buffer
- Anti-digoxigenin-peroxidase
- DAB substrate
- DAB dilution buffer
Materials required but not supplied in the kit
- Deionized water (dH2O)
- Xylene
- Ethanol:absolute, 90 %, 70 % (diluted in dH2O)
- 100% n-butanol (1-butanol)
- Ethanol:acetic acid 2:1 (v:v)
- 1% paraformaldehyde in PBS (pH 7.4)
- PBS
- Hydrogen peroxide
- 0.5% methyl green
- Triton X-100
- Slide mounting medium
- Silanized glass slides
- Plastic coverslips
- Humidified chamber
- Microcentrifuge tubes
- 37 °C covered water bath
- Light microscope
- Filter through 0.2 m filter unit
- Reagent bottles
(15) Preparation of 0.5% methyl green
- 0.1 M sodium acetate, pH 4.0
- 0.85% methyl green stock (0.425 g)
- Filter through 0.2 m filter unit

229
(16) Reagents for LDH release assay
CytoTox-One Homogeneous Membrane Integrity Assay kit (Promega, Madison, WI)
Kit components
- Substrate mix
- Assay buffer
(17) Preparation of Adhesion Molecules
Fibronectin and Type-IV Collagen
- Mix the lypholized with sterile double distilled water
- Store at -20 °C
ECM (Extracellular Matrix)
- Store at -20°C
- Thaw overnight before use
(18) Preparation of Gels and Buffers for Western Blot Analysis
Preparation of Separting gel (12%) – 2 gels (10.0 ml)
30% Bis/Acrylamide Mix
(29.2% acrylamide and 0.8% N,N’-
methylene-bis-acrylamide)
4.0 ml
1.5M Tris buffer, pH 8.8 2.5 ml
10 % SDS (Sodium Dodecyl Sulfate) 100.0 µl
10% APS (Ammonium Persulfate) 50.0 µl
TEMED (N,N,N’,N’-
tetramethylethylenediamine) 5.0 µl
Double distilled water 3.4 ml
Preparation of Stacking gel – 2 gels (8.0 ml)
30% Bis/Acrylamide Mix
(29.2% acrylamide and 0.8% N,N’-
methylene-bis-acrylamide)
1.32 ml
1M Tris buffer, pH 6.8 2.52 ml
10 % SDS (Sodium Dodecyl Sulfate) 100.0 µl
10% APS (Ammonium Persulfate) 50.0 µl
TEMED (N,N,N’,N’-
tetramethylethylenediamine) 10.0 µl
Double distilled water 6.0 ml

230
Dilution of primary antibodies (All antibodies purchased from Merck, Millipore)
Anti-Pan-Ras (Ab-3) Mouse mAb 1:1000
PhosphoDetect™ Anti-c-Raf (pSer 6 2 ¹)
Mouse mAb
1:1000
PhosphoDetect™ Anti-Elk1 (pSer383)
Rabbit pAb
1:1000
Anti-p90RSK 1:500
Anti-c-Jun/AP-1 (Ab-3) Mouse mAb 1:2000
PhosphoDetect™ Anti-JNK1/2
(pThr¹83/Tyr¹85) Rabbit pAb
1:1000
Anti-Akt1 (88-100) Rabbit pAb 1:2500
PhosphoDetect™ Anti-p38 MAP Kinase
(pThr¹80, pTyr¹82) Rabbit pAb
1:1000
PhosphoDetect™ Anti-GSK3β (pSer9)
Mouse mAb
1:2000
Anti-β-Catenin Mouse mAb (9G10) 1:500
Anti-Dishevelled-3 Antibody (Rabbit) 1:1000
PhosphoDetect™ Anti-c-Myc (pThr58,
Ser62) Rabbit pAb
1:1000
Anti-HIF-1α Antibody (Rabbit) 1:200
Anti-VEGF (Rabbit) 1:500
Anti-NFκB p50 Antibody (Rabbit) 1:1000
Anti-NFκB p52 Antibody (Mouse) 1:1000
Dilution of secondary antibodies (Purchased from Merck, Millipore)
Rabbit Anti-mouse IgG 1:10,000
Goat Anti-rabbit IgG 1:10,000
Lysis buffer
- 50 mM Tric, pH 8.0 SDS
- 150.0 mM NaCI
- 1.0% Triton X®-100
- Protease inhibitor cocktail (P9599, Sigma-Aldrich, Ireland Ltd)
Laemmli 2X sample Buffer
- 4% SDS
- 20% Glycerol
- 125.0 mM Tris, pH 6.8
- 0.02% Bromophenol blue
- 10%βME, β-mercaptoethanol (Add freshly, just before use)
10% SDS solution
-5.0 g SDS
- 50.0 ml of distilled water

231
10% APS (Ammonium Persulfate)
- 1.0 g APS
- 10.0 ml of double distilled water
Gel Electrophoresis Running Buffer
- 25.0 mM Tris base
- 190.0 mM Glycine
- 0.1% SDS
Transfer Buffer
-50.0 mM Tris base
- 380.0 mM Glycine
- 0.1% SDS
- 20% Methanol
TBS buffer
- 8.0 g NaCI
- 0.2 g KCI
- 3.0 g Tris base
- Dissolve in 800 ml double distilled water
- Adjust pH to 8.0 with 1 M HCI
- Top up to final volume of 1 liter
- Sterilize by autoclaving and store at room temperature
Washing buffer (TBST)
- TBS with 0.1% Tween® 20
Blocking buffer (5% Nonfat Dried Milk in TBST)
- 5.0 g nonfat dried milk powder
- 100.0 ml of TBST
(19) Preparation of Buffers in 2D Gel Dimentional
Sample preparation solution (with urea and thiourea)
Final concentration Amount
Urea 7.0 M 10.5 g
Thiourea 2.0 M 3.8 g
CHAPS 2.0% (w/v) 1.0 g
IPG buffer 2.0% (w/v) 500.0 µl
DTT 40.0 mM 154.0 mg
Double distilled water - to 25.0 ml

232
Thiourea rehydration stock solution
Final concentration Amount
Urea 7.0 M 10.5 g
Thiourea 2.0 M 3.8 g
CHAPS 2.0% (w/v) 0.5 g
IPG buffer 2.0% (w/v) 500.0 µl
1% bromophenol blue 0.002% 50.0 µl
Double distilled water - to 25.0 ml
- DTT is added prior to use; 7 mg DTT for 2.5 ml of rehydration stock solution
SDS equilibration buffer solution
Final concentration Amount
Urea 6.0 M 72.1 g
This-HCI, pH 8.8 75.0 mM 10.0 ml
Glycerol (87% w/w) 29.3% (v/v) 69.0 ml
SDS 2.0% (w/v) 4.0 g
1% bromophenol blue 0.002% 400.0 µl
Double distilled water - to 200.0 ml
- First equilibration: Add 100 mg of DTT in 10 ml of SDS equilibration buffer
- Second equilibration: Add 250 mg of Iodoacetamide 10 ml of SDS equilibration
buffer
1X Laemmli SDS electrophoresis buffer
Final concentration Amount
Tris base 25 mM 30.3 g
Glycine 192 mM 144.0 g
SDS 0.1% (w/v) 10.0 g
Double distilled water - to 10.0 liter
30% T, 2.6% C monomer stock solution
Final concentration Amount
Acrylamide 30.0% 300.0 g
N,N’-methylenebisacrylamide 0.8% 8.0 g
Double distilled water - to 1 liter
- Filter solution through a 0.45 µm filter
- Store at 4°C in the dark

233
4X Resolvng gel buffer solution
Final concentration Amount
Tris base 1.5 M 181.7 g
Double distilled water - 750.0 ml
HCI - Adjust to pH 8.8
Double distilled water - to 1 liter
Agarose sealing solution
Final concentration Amount
Laemmli SDS
electrophoresis buffer
100.0 ml
Agarose 0.5% 0.5 g
1% Bromophenol blue 0.002% (w/v) 200.0 µl
Fixation solution
Ethanol 200.0 ml
Acetic acid, glacial 50.0 ml
Double distilled water 250.0 ml
5% Coomassie blue
Coomassie Blue G-250 0.5 g
Double distilled water 10.0 ml

234
APPENDIX II: The fold changes of differentially expressed proteins in treated MeWo cells.
No
UniProtKB/Swiss-
Prot (Accession
number)
Protein
Phyllanthus
PA(H) PN(H) PU(H) PW(H) PA(M) PN(M) PU(M) PW(M)
I Cell Adhesion, Migration, Invasion and Metastasis and Angiogenesis
1 P98172 Ephrin-B1 -1.46 -1.47 -1.53 -1.48 -1.59 -1.58 -1.57 -1.65
2 P61163 Alpha-centractin -1.42 -1.33 -1.57 -1.45 -1.58 -1.75 -1.58 -1.74
3 Q13895 Bystin -1.43 -1.57 -1.34 -1.45 -1.46 -1.59 -1.48 -1.65
4 P13646 Keratin, type I cytoskeletal 13 1.42 1.47 1.46 1.57 1.74 1.58 1.57 1.64
5 P08670 Vimentin -1.73 -1.92 -1.72 -2.01 -1.85 -1.73 -1.72 -1.92
6 P04179
Superoxide dismutase [Mn],
mitochondrial -1.29 -1.54 -1.57 -1.39 -1.58 -1.85 -1.65 -1.48
7 P07437 Tubulin beta chain -1.42 -1.48 -1.67 -1.97 -1.57 -1.58 -1.59 -1.54
8 P47755
F-actin-capping protein subunit
alpha-2 -1.34 -1.33 -1.63 -1.58 -1.68 -1.58 -1.53 -1.63
9 Q8TEW0 Partitioning defective 3 homolog -1.32 -1.49 -1.32 -1.68 -1.50 -1.56 -1.68 -1.58
II Proliferation, Cell Cycle, and Apoptosis
10 P68400 Casein kinase II subunit alpha -2.28 -1.97 -1.83 -2.08 -2.18 -2.08 -1.95 -2.07
11 P50583
Bis(5'-nucleosyl)-tetraphosphatase
[asymmetrical] -1.47 -1.53 -1.48 -1.37 -1.58 -1.74 -1.63 -1.75

235
12 O60220
Mitochondrial import inner
membrane translocase subunit
Tim8 -1.56 -1.35 -1.64 -1.62 -1.63 -1.65 -1.68 -1.58
13 Q9BQ83
Structure-specific endonuclease
subunit SLX1 -1.37 -1.49 -1.57 -1.48 -1.93 -1.57 -1.74 -1.63
14 Q6Q0C0 E3 ubiquitin-protein ligase TRAF7
1.48 1.57 1.65 1.57 1.45 1.78 -1.69 -1.549
15 P0CJ76 Humanin-like protein 9
-1.56 -1.68 -1.58 -1.58 -1.62 1.67 1.73 1.78
16 P17931 Galectin-3 -1.58 -1.75 -1.63 -1.69 -1.68 -1.68 -1.64 -1.78
17 P31943
Heterogeneous nuclear
ribonucleoprotein H -1.49 -1.57 -1.34 -1.63 -1.56 -1.68 -1.58 -1.84
18 P08758 Annexin A5 -1.42 -1.57 -1.73 -1.57 -1.57 -1.47 -1.59 -1.47
19 Q969E4
Transcription elongation factor A
protein-like 3 -1.32 -1.47 -1.57 -1.74 -1.62 -1.48 -1.68 -1.57
20 Q9H930
Nuclear body protein SP140-like
protein -1.32 -1.38 -1.55 -1.57 -1.58 -1.58 -1.57 -1.58
21 P27348 14-3-3 protein theta -1.42 -1.47 -1.29 -1.58 -1.57 -1.67 -1.45 -1.34
22 P62937
Peptidyl-prolyl cis-trans isomerase
A -1.54 -1.23 -1.47 -1.54 -1.58 -1.62 -1.57 -1.46
23 Q14929 Zinc finger protein 169 -1.69 -1.57 -1.33 -1.84 -1.75 -1.55 -1.47 -1.56
24 O75791 GRB2-related adapter protein -1.59 -1.43 -1.4 -1.83 -1.56 -1.48 -1.53 -1.28
25 O00165 HCLS1-associated protein X-1 -1.69 -1.72 -1.97 -1.66 -1.84 -1.86 -1.67 -1.78
26 O95243
Methyl-CpG-binding domain
protein 4 -1.49 -1.63 -1.56 -1.57 -1.66 -1.54 -1.63 -1.64

236
27 P78417 Glutathione transferase omega - 1
-1.45 -1.53 -1.46 -1.57 -1.64 -1.53 -1.48 -1.58
28 Q06830 Peroxiredoxin-1 -1.45 -1.42 -1.46 -1.47 -1.64 -1.74 -1.53 -1.48
29 P50453 Serpin B9 -1.32 -1.31 -1.53 -1.56 -1.57 -1.45 -1.55 -1.63
30 Q8ND25 E3 ubiquitin-protein ligase ZNRF1
-1.48 -1.64 -1.67 -1.57 -1.56 -1.46 -1.53 -1.58
31 Q06210 E3 ubiquitin-protein ligase ARIH2 -1.48 -1.58 -1.64 -1.6 -1.57 -1.65 -1.45 -1.64
32 Q9Y4L5
E3 ubiquitin-protein ligase
RNF115 -1.56 -1.43 -1.66 -1.73 -1.69 -1.58 -1.58 -1.56
III Glycogenesis and glycolysis
33 Q969E3
Glucosamine--fructose-6-
phosphate aminotransferase
[isomerizing] 2 -1.57 -1.58 -1.58 -1.53 -1.65 -1.73 1.67 -1.48
34 P00558
Protein phosphatase 1 regulatory
subunit 3D -1.33 -1.58 -1.53 -1.64 -1.56 -1.37 -1.57 -1.74
35 P06733 Alpha-enolase -1.42 -1.57 -1.74 -1.73 -1.58 -1.57 -1.65 -1.69
36 P04406 Pyruvate kinase isozymes M1/M2
-1.45 -1.67 -1.47 -1.63 -1.78 -1.36 -1.36 -1.75
37
P04075
Phosphoglycerate kinase 1 -1.57 -1.58 -1.61 -1.64 -1.48 -1.53 -1.52 -1.58
IV Protein Synthesis and Energy Metabolism
38 P17174
Aspartate aminotransferase,
cytoplasmic -1.26 -1.67 -1.68 -1.56 -1.57 -1.58 -1.53 -1.58
39 Q9UBC9 Small proline-rich protein 3 -1.63 -1.75 -1.74 -1.56 -1.67 -1.68 -1.73 -1.57

237
40 P41247
Patatin-like phospholipase
domain-containing protein 4 -1.63 -1.32 -1.49 -1.66 -1.53 -1.53 -1.58 -1.64
41 Q9HBU6 Ethanolamine kinase 1 -1.39 -1.75 -1.57 -1.83 -1.48 -1.75 -1.68 -1.74
42 P62195 26S protease regulatory subunit 8 -1.53 -1.64 -1.57 -1.74 -1.75 -1.56 -1.64 -1.54
43 Q5VTE0
Putative elongation factor 1-alpha-
like 3 -1.48 -1.64 -1.64 -1.57 -1.57 -1.64 -1.58 -1.85
44 Q5TGZ0
Mitochondrial inner membrane
organizing system protein 1 -1.53 -1.63 -1.74 -1.56 -1.67 -1.68 -1.64 -1.75
45 P07339 Cathepsin D -1.54 -1.54 -1.65 -1.46 -1.68 -1.68 -1.47 -1.58
46 Q9Y587 AP-4 complex subunit sigma-1 -1.33 -1.57 -1.56 -1.36 -1.68 -1.74 -1.58 -1.67
47 P00568 Adenylate kinase -1.58 -1.39 -1.53 -1.57 -1.56 -1.63 -1.68 -1.58
48 P80294 Metallothionein-1H -1.29 -1.74 -1.73 -1.45 -1.59 -1.58 -1.76 -1.68
49 Q76KX8 Zinc finger protein 534 -1.59 -1.46 -1.57 -1.64 -1.54 -1.63 -1.58 -1.58
50 Q9Y6H3
Mitochondrial inner membrane
protease ATP23 homolog -1.59 -1.56 -1.57 -1.67 -1.68 -1.67 -1.68 -1.63
51 Q8WVM8
Sec1 family domain-containing
protein 1 -1.44 -1.56 -1.64 -1.54 -1.76 -1.65 -1.75 -1.64
52 Q9NVH6
Trimethyllysine dioxygenase,
mitochondrial -1.58 -1.48 -1.58 -1.54 -1.79 -1.68 -1.53 -1.66
(Up-regulation indicated with “+” symbol and down-regulation indicated with “-” symbol)

238
APPENDIX III: The fold changes of differentially expressed proteins in treated PC-3 cells.
No.
UniProtKB/Swiss-
Prot (Accession
number)
Protein
Phyllanthus
PA(H) PN(H) PU(H) PW(H) PA(M) PN(M) PU(M) PW(M)
I Cell Adhesion, Migration, Invasion and Metastasis and Angiogenesis
1 P98172 Ephrin-B1 -1.53 -1.45 -1.21 -1.41 -2.14 -2.21 -2.01 -2.31
2 P05787 Keratin, type II cytoskeletal 8 1.45 1.32 1.38 1.21 1.86 1.74 1.92 1.62
3 P63261 Actin, cytoplasmic 2 -1.43 -1.53 -1.21 -1.53 -1.74 -1.79 -1.72 -1.53
4 Q8NDI1 EH domain-binding protein 1 -1.32 -1.32 -1.21 -1.13 -1.42 -1.32 -1.43 -1.43
5 P04792 Heat shock protein beta-1 -1.43 -1.32 -1.54 -1.54 -1.42 -1.43 -1.32 -1.25
6 P35527 Keratin, type I cytoskeletal 9 1.38 1.32 1.53 1.42 1.64 1.34 1.35 1.37
7 Q9BYR8 Keratin-associated protein 3-1 1.53 1.32 1.47 1.64 1.47 1.53 1.42 1.46
8 P08670 Vimentin -1.43 -1.32 -1.32 -1.11 -1.25 -1.43 -1.32 -1.42
9 Q9NY65 Tubulin alpha-8 chain -1.53 -1.43 -1.48 -1.35 -1.40 -1.43 -1.42 -1.73
10 Q9Y316 Protein MEMO1 -1.43 -1.42 -1.24 -1.32 -1.63 -1.32 -1.42 -1.43
II Proliferation, Cell Cycle, and Apoptosis
11 Q92466 DNA damage-binding protein 2 -1.42 -1.32 -1.43 -1.41 -1.42 -1.37 -1.43 -1.32
12 Q7RTU1 Transcription factor 23 -1.39 -1.33 -1.42 -1.43 -1.53 -1.63 -1.58 -1.42
13 Q9UQ80
Proliferation-associated protein
2G4 -1.37 -1.57 -1.42 -1.47 -1.63 -1.45 -1.53 -1.43
14 P62993
Growth factor receptor-bound
protein 2 -1.42 -1.52 -1.43 -1.32 -1.42 -1.42 -1.43 -1.64

239
15 O60565 Gremlin-1 -1.43 -1.43 -1.33 -1.43 -1.56 -1.43 -1.54 -1.44
16 P27348 14-3-3 protein theta -1.32 -1.43 -1.53 -1.42 -1.42 -1.21 -1.32 -1.42
17 P61981 14-3-3 protein gamma -1.32 -1.32 -1.43 -1.35 -1.32 -1.42 -1.22 -1.32
18 P04083 Annexin A1 -1.52 -1.54 -1.42 -1.43 -1.64 -1.43 -1.43 -1.43
19 Q96LY2
Coiled-coil domain-containing
protein 74B -1.47 -1.34 -1.47 -1.46 -1.33 -1.33 -1.36 -1.57
20 P31943
Heterogeneous nuclear
ribonucleoprotein H -1.47 -1.33 -1.35 -1.21 -1.44 -1.56 -1.43 -1.53
21 P09211 Glutathione S-transferase P -1.96 -1.84 -1.77 -2.05 -1.89 -1.87 -2.01 -1.97
22 P41221 Protein Wnt-5a -1.75 -1.87 -1.87 -1.92 -1.74 -1.84 -1.85 -2.01
23 Q9H0R3 Transmembrane protein 222 -1.57 -1.52 -1.57 -1.42 -1.47 -1.62 -1.57 -1.46
24 Q5MJ09
Sperm protein associated with the
nucleus on the X chromosome N3 -1.45 -1.57 -1.57 -1.57 -1.34 -1.45 -1.32 -1.46
25 P46063 ATP-dependent DNA helicase Q1
-1.57 -1.57 -1.36 -1.46 -1.56 -1.47 -1.46 -1.57
26 P09382 Galectin-1 -1.25 -1.46 -1.57 -1.47 -1.46 -1.33 -1.46 -1.46
27 P04792 Heat shock protein beta-1 -1.37 -1.47 -1.47 -1.46 -1.56 -1.46 -1.34 -1.47
28 P78417 Glutathione transferase omega - 1
-1.46 -1.46 -1.47 -1.47 -1.57 -1.54 -1.68 -1.57
29 Q06830 Peroxiredoxin-1 -1.57 -1.42 -1.29 -1.33 -1.48 -1.62 -1.54 -1.67
30 P30048
Thioredoxin-dependent peroxide
reductase, mitochondrial -1.45 -1.52 -1.12 -1.64 -1.58 -1.44 -1.57 -1.57
31 Q9Y230 RuvB-like 2 -1.46 -1.47 -1.38 -1.32 -1.75 -1.57 -1.64 -1.57
32 P50453 Serpin B9 -1.46 -1.50 -1.36 -1.38 -1.58 -1.67 -1.76 -1.63
33 Q8ND25
E3 ubiquitin-protein ligase
ZNRF1 -1.56 -1.43 -1.47 -1.47 -1.58 -1.67 -1.82 -1.54

240
34 Q6PRD1
Probable G-protein coupled
receptor 179 -1.45 -1.43 -1.47 -1.56 -1.36 -1.37 -1.54 -1.58
35 O43521 Bcl-2-like protein 11 -1.66 -1.52 -1.42 -1.56 -1.57 -1.73 -1.65 1.56
36 P56703 Proto-oncogene Wnt-3 precursor -2.18 -1.92 -2.06 -2.34 -1.79 -1.97 1.83 -2.11
37 Q8N4Z0
Putative Ras-related protein Rab-
42 -2.11 -2.03 -1.79 -1.98 -1.96 -2.1 -2.15 -1.94
38 P01112 GTPase HRas precursor -2.12 -1.99 -1.83 -1.74 -1.85 -2.03 -2.05 -1.92
III Glycogenesis and glycolysis
39 Q969E3 Urocortin-3 -1.37 -1.42 -1.37 -1.46 -1.65 -1.73 1.67 -1.47
40 P00558 Phosphoglycerate kinase 1 -2.01 -2.12 -2.22 -1.93 -1.56 -1.37 -1.57 -1.36
41 P06733 Alpha-enolase -1.42 -1.38 -1.37 -1.36 -1.58 -1.57 -1.65 -1.57
42 P04406
Glyceraldehyde-3-phosphate
dehydrogenase -1.92 -1.88 -1.92 -1.83 -1.78 -1.36 -1.36 -1.56
43 P04075 Fructose-bisphosphate aldolase a -1.63 -1.42 -1.39 -1.36 -1.48 -1.53 -1.52 -1.57
43 P60174 Triosephosphate isomerase -1.47 -1.46 -1.47 -1.76 -1.48 -1.53 -1.49 -1.49
44 Q9NPG2 Neuroglobin -1.47 -1.47 -1.58 -1.47 -1.56 -1.63 -1.74 -1.74
IV Protein Synthesis and Energy Metabolism
45 Q4U2R6 39S ribosomal protein L51 -1.37 -1.47 -1.36 -1.53 -1.64 -1.74 -1.65 -1.67
46 Q93088
Betaine--homocysteine S-
methyltransferase 1 -1.46 -1.47 -1.46 -1.48 -1.67 -1.48 -1.58 -1.57
47 P50583
Bis(5'-nucleosyl)-
tetraphosphatase [asymmetrical] -1.45 -1.57 -1.30 -1.42 -1.39 -1.47 -1.67 -1.87
48 Q96A11 Galactose-3-O-sulfotransferase 3 -1.69 -1.74 -1.67 -1.85 -1.93 -1.74 -1.82 -1.89
49 Q9Y274
Type 2 lactosamine alpha-2,3-
sialyltransferase -1.28 -1.52 -1.58 -1.44 -1.68 -1.64 -1.58 -1.57
50 O43852 Calumenin -1.53 -1.47 -1.47 -1.42 -1.57 -1.65 -1.56 -1.53

241
51 P13667 Protein disulfide-isomerase A4 -1.47 -1.41 -1.44 -1.45 -1.58 -1.64 -1.45 -1.57
52 P27797 Calreticulin -1.54 -1.32 -1.47 -1.48 -1.45 -1.53 -1.57 -1.64
53 P07900 Heat shock protein HSP 90-alpha
-1.64 -1.32 -1.34 -1.43 -1.55 -1.42 -1.32 -1.53
54 P12235 ADP/ATP translocase 1 -1.46 -1.38 -1.45 -1.35 -1.58 -1.68 -1.67 -1.47
55 P52209
6-phosphogluconate
dehydrogenase, decarboxylating -1.46 -1.49 -1.54 -1.45 -1.57 -1.52 -1.48 -1.56
56 Q9Y478
5'-AMP-activated protein kinase
subunit beta-1 -1.38 -1.46 -1.47 -1.47 -1.67 -1.75 -1.47 -1.57
57 P11021 78kDa glucose-regulated protein -1.46 -1.46 -1.47 -1.57 -1.57 -1.54 -1.57 -1.84
58 Q9UI09
NADH dehydrogenase
[ubiquinone] 1 alpha subcomplex
subunit 12 -1.42 -1.36 -1.33 -1.33 -1.57 -1.73 -1.57 -1.46
59 P30101 Protein disulfide-isomerase A3 -1.20 -1.47 -1.37 -1.21 -1.57 -1.63 -1.56 -1.57
60 P49411
Elongation factor Tu,
mitochondrial -1.48 -1.45 -1.57 -1.33 -1.38 -1.54 -1.68 -1.47
61 Q5TGZ0
Mitochondrial inner membrane
organizing system protein 1 -1.47 -1.46 -1.47 -1.49 -1.57 -1.47 -1.67 -1.65
62 P19404
NADH dehydrogenase
[ubiquinone] flavoprotein 2,
mitochondrial -1.21 -1.32 -1.33 -1.43 -1.57 -1.57 -1.57 -1.74
63 Q9H0F7
ADP-ribosylation factor-like
protein 6 -1.76 -1.50 -1.57 -1.54 -1.56 -1.54 -1.49 -1.70
64 O75436
Vacuolar protein sorting-
associated protein 26A -1.46 -1.54 -1.63 -1.76 -1.47 -1.38 -1.57 -1.57
65 Q9NXV2
BTB/POZ domain-containing
protein KCTD5 -1.47 -1.47 -1.33 -1.50 -1.58 -1.65 -1.67 -1.66

242
66 O00429 Dynamin-1-like protein -1.47 -1.63 -1.47 -1.57 -1.56 -1.57 -1.67 -1.73
67 P40261
Nicotinamide N-
methyltransferase -1.29 -1.22 -1.34 -1.28 -1.45 -1.48 -1.83 -1.42
68 P49720 Proteasome subunit beta type-3 -1.53 -1.22 -1.34 -1.47 -1.58 -1.53 -1.67 -1.57
69 Q6IQ16 Speckle-type POZ protein-like -1.42 -1.67 -1.47 -1.47 -1.63 -1.64 -1.68 -1.47
70 P21796
Voltage-dependent anion-
selective channel protein 1 1.57 1.63 1.52 1.79 1.67 1.84 1.77 1.76
71 Q9Y3D8 Adenylate kinase isoenzyme 6 -1.51 -1.33 -1.43 -1.49 -1.46 -1.64 -1.74 -1.76
72 Q14152
Eukaryotic translation initiation
factor 3 subunit 12 -1.40 -1.37 -1.39 -1.49 -1.53 -1.67 -1.63 -1.53
(Up-regulations indicated with “+” symbol and down-regulation indicated with “-” symbol).
243
APPENDIX IV: Additional Outputs of the PHD Project.
Scientific Publications
Tang Y-Q, Jaganath IB, Sekaran SD (2013). Phyllanthus spp. Exerts Anti-Angiogenic
and Anti-Metastatic Effects through Inhibition on Matrix Metalloproteinase
Enzymes. Manuscript submitted to “PLoS ONE”.
Tang Y-Q, Jaganath IB, Sekaran SD (2013). Phyllanthus Suppresses MeWo Cell
Proliferation and Induces Apoptosis through Modulation Multiple Signalling
Pathways. Submitted to “Cellular Signalling”.
Tang Y-Q, Jaganath IB, Sekaran SD (2013). Phyllanthus Suppresses Prostate Cancer
Cell, PC-3 Proliferation and Induces Apoptosis through Multiple Signalling
Pathways (MAPKs, PI3K/Akt, NFκB and Hypoxia). Evidence-Based
Complementary and Alternative Medicine, 609581.
Yin-Quan Tang and Shamala Devi Sekaran. (2011). Evaluation of Phyllanthus, for Its
Anti-Cancer Properties. Prostate Cancer - From Bench to Bedside, ISBN: 978-
953-307-331-6
Tang Y-Q, Jaganath IB, Sekaran SD (2010) Phyllanthus spp. Induces Selective Growth
Inhibition of PC-3 and MeWo Human Cancer Cells through Modulation of Cell
Cycle and Induction of Apoptosis. PLoS ONE 5(9): e12644.
doi:10.1371/journal.pone.0012644
Oral presentations
Tang Y-Q, Jaganath IB, Sekaran SD. Anticarcinogenic and antitumour properties of
phyllanthus spp. against human cancer. Oral presentation by Tang YQ at the
PhD Candidature Defense at Department of Medical Microbiology, Faculty of
Medicine, University of Malaya, Malaysia (2011, June 02).
Tang Y-Q, Jaganath IB, Sekaran SD. The anticancer properties of phyllanthus spp. on
human cancer cell lines. Oral presentation by Tang YQ at the PhD Conversion
Seminar at Department of Medical Microbiology, Faculty of Medicine,
University of Malaya, Malaysia (2010, September 07).
Poster presentations
Lee SH, Tang YQ, Komarasamy TV, Wang SM, Ong KC, Payne BJ, Jaganath and
Sekaran SD. Inhibitory Potential of Malaaysian Medicinal Plant (Phyllanthus)
against Dengue Virus Type 2 (DENV2). Presented at 1st National Postgraduate
Seminar 2012, University of Malaya. (11th
July 2012).
Y.Q.Tang, S.H. Lee, T.V. Komarasamy, A. Rathakrishnan, S.M. Wang, I.B. Jaganath
and S.D Sekaran. Effects of Malaysia Medicinal plant (Phyllanthus) against

244
Dengue Virus Type 2 (DENV2) .Presented at 9th
Asia-Pacific Congress Medical
Virology (APCMV), Adelaide, Australia (6th
– 8th
June 2012)
Yin Quan Tang, Indu Bala Jaganath and Shamala Devi Sekaran. The Anti-Metastasis
and Anti-Angiogenesis Properties of Phyllanthus Species. Presented at 18th
International Student Congress of Medical Sciences (ISCOMS), The Netherlands
(7th
-10th
June 2011).
Tang Yin Quan, Indu Bala Jaganath and Shamala Devi Sekaran. Potential Anticancer
Properties of Phyllanthus against Skin Melanoma and Prostate Cancer Cells.
Presented at Creativity and Innovation Expo University of Malaya 2010,
Malaysia (April, 2010)
Yin-Quan Tang, Indu Bala Jaganath and Shamala Devi Sekaran. Anticarcinogenic
properties of extracts derived from medicinal plant, Phyllanthus on human skin
and prostate cancer cells. Presented at the UK-Malaysia Symposium on Drug
Discovery and Development for Cancer, Kuala Lumpur, Malaysia (24-25
February 2010).
Wee-Chee Tan, Sau-Har Lee, Yin-Quan Tang, Indu-Bala Jaganath, Shamala-Devi
Sekaran. Phyllanthus spp. as potent antiviral agent against Dengue viruses.
Presented at 4th Asian Regional Dengue Research Network Meeting; DUKE-
NUS Emerging Infectious Diseases Inauguration Symposium Meeting in
Singapore (08 Dec 2009 to 11 Dec 2009).
Awards and Recognitions
National Science Fellowships (NSF) from Ministry of Science, Technology and
Innovation, Malaysia (2009 – 2013)
Postgraduate Research Funds from University of Malaya (2009-2010)
Best Poster Presentation (Cell Biology & Medical Biochemistry), 18th
ISCOMS,
The Netherland (2011).
245

246

247

248