photon applications of accelerators - show and share … · test facilities (e.g. scss) ......
TRANSCRIPT
Photon Applications
of Accelerators
Elaine A. Seddon
16th February 2015
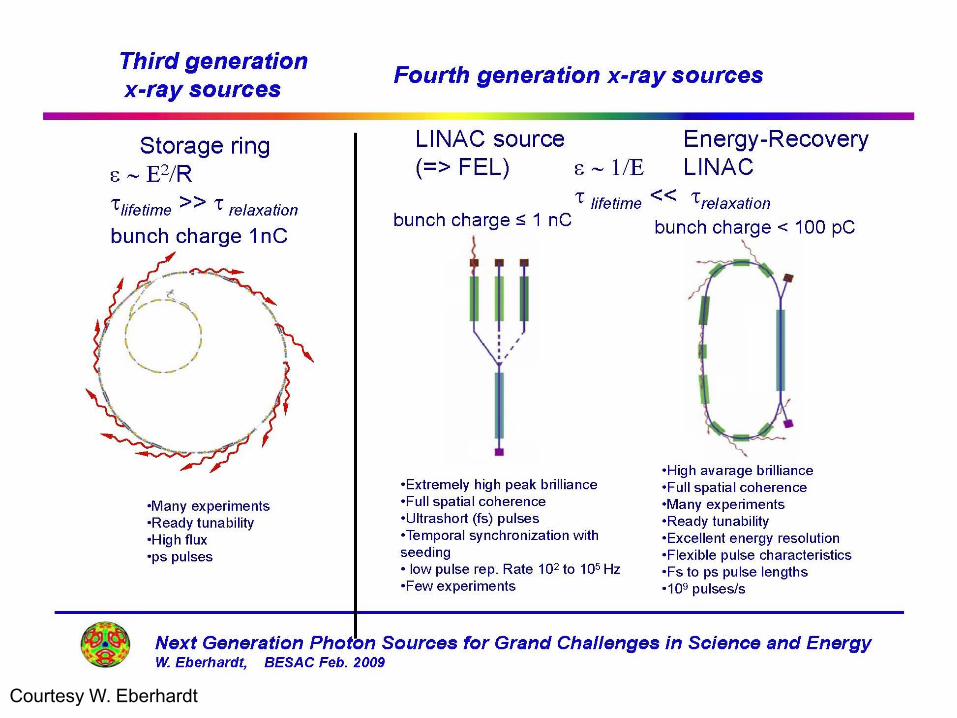
Courtesy W. Eberhardt
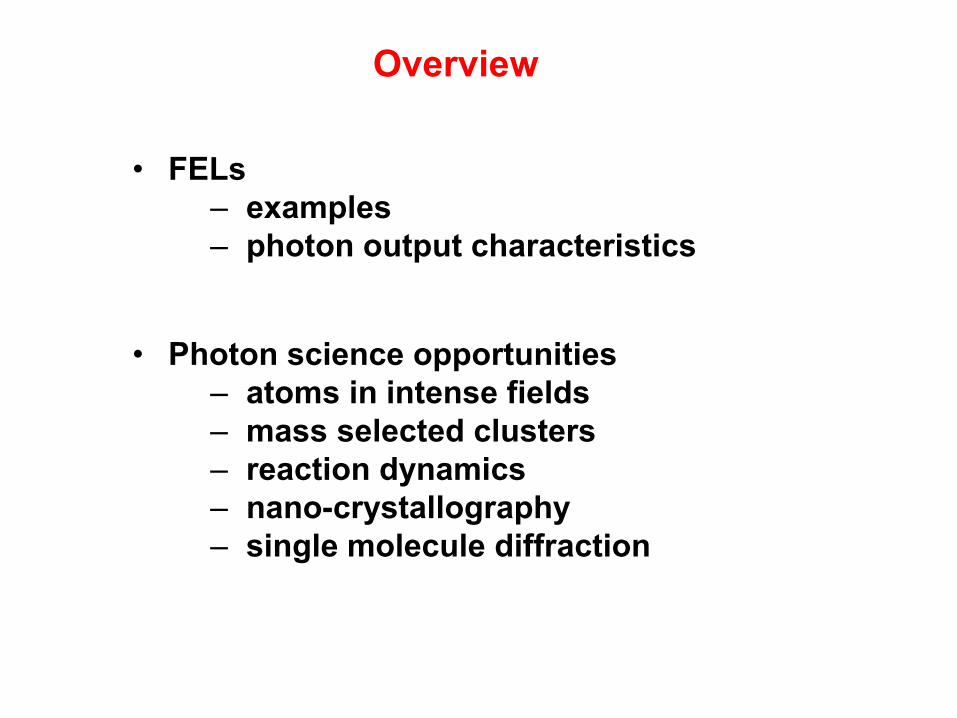
• FELs
– examples
– photon output characteristics
• Photon science opportunities
– atoms in intense fields
– mass selected clusters
– reaction dynamics
– nano-crystallography
– single molecule diffraction
Overview

Overview
The first X-ray FEL LCLS at SLAC
Golden Gate bridge
San Francisco Bay
Pacific Ocean
San Francisco
San Jose
SLAC
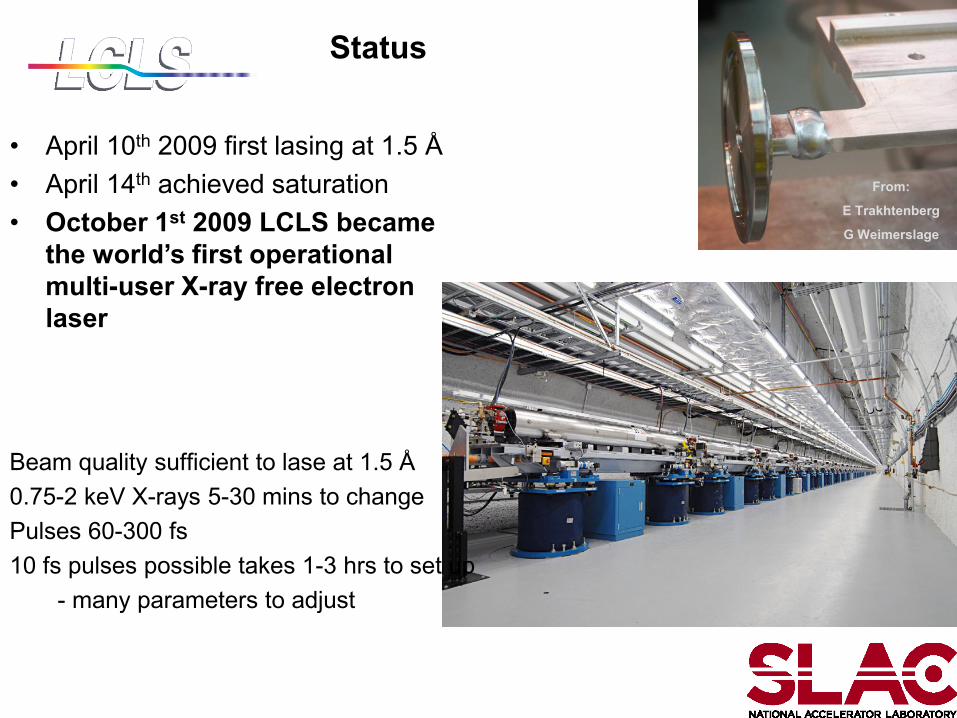
Status
• April 10th 2009 first lasing at 1.5 Å
• April 14th achieved saturation
• October 1st 2009 LCLS became
the world’s first operational
multi-user X-ray free electron
laser
From:
E Trakhtenberg
G Weimerslage
Beam quality sufficient to lase at 1.5 Å
0.75-2 keV X-rays 5-30 mins to change
Pulses 60-300 fs
10 fs pulses possible takes 1-3 hrs to set up
- many parameters to adjust
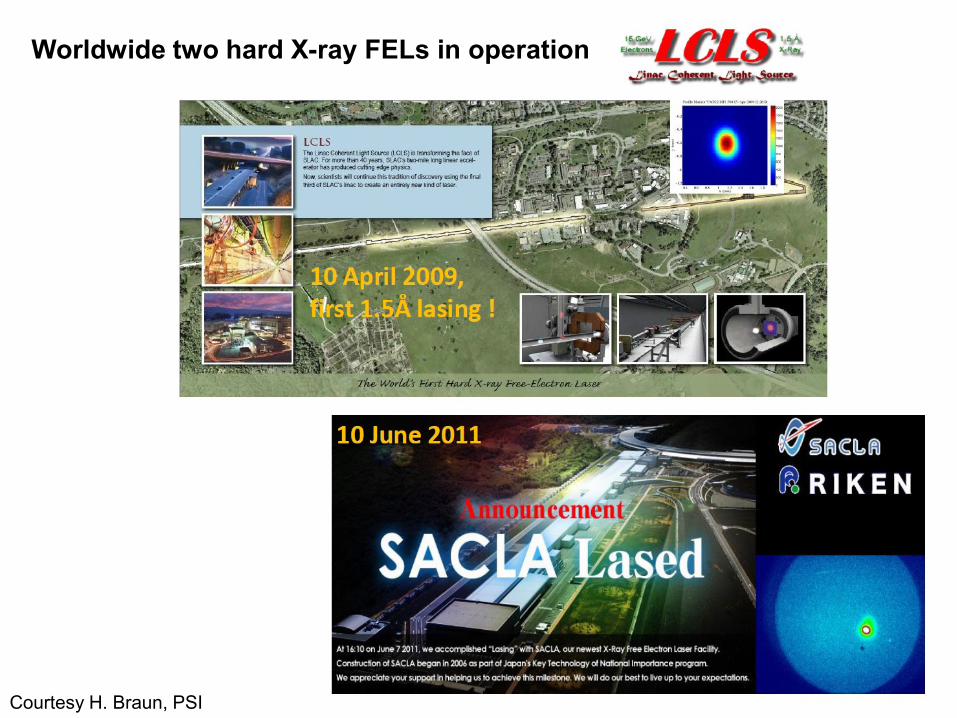
Courtesy H. Braun, PSI
Worldwide two hard X-ray FELs in operation
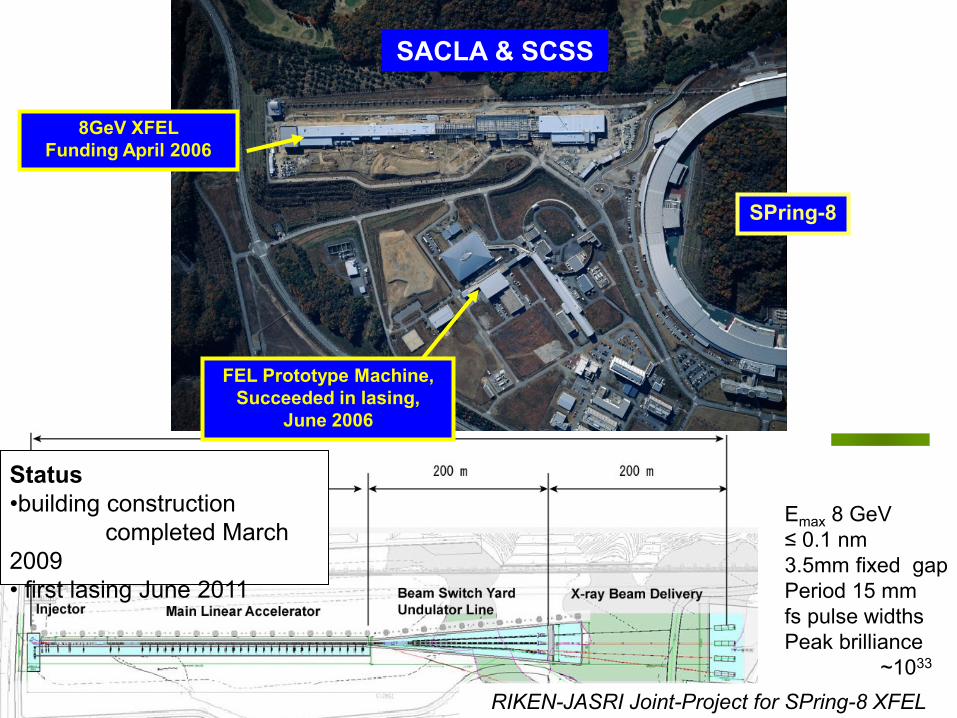
RIKEN-JASRI Joint-Project for SPring-8 XFEL
Emax 8 GeV
≤ 0.1 nm
3.5mm fixed gap
Period 15 mm
fs pulse widths
Peak brilliance
~1033
SACLA & SCSS
SPring-8
8GeV XFEL
Funding April 2006
FEL Prototype Machine,
Succeeded in lasing,
June 2006
Status
•building construction
completed March
2009
• first lasing June 2011
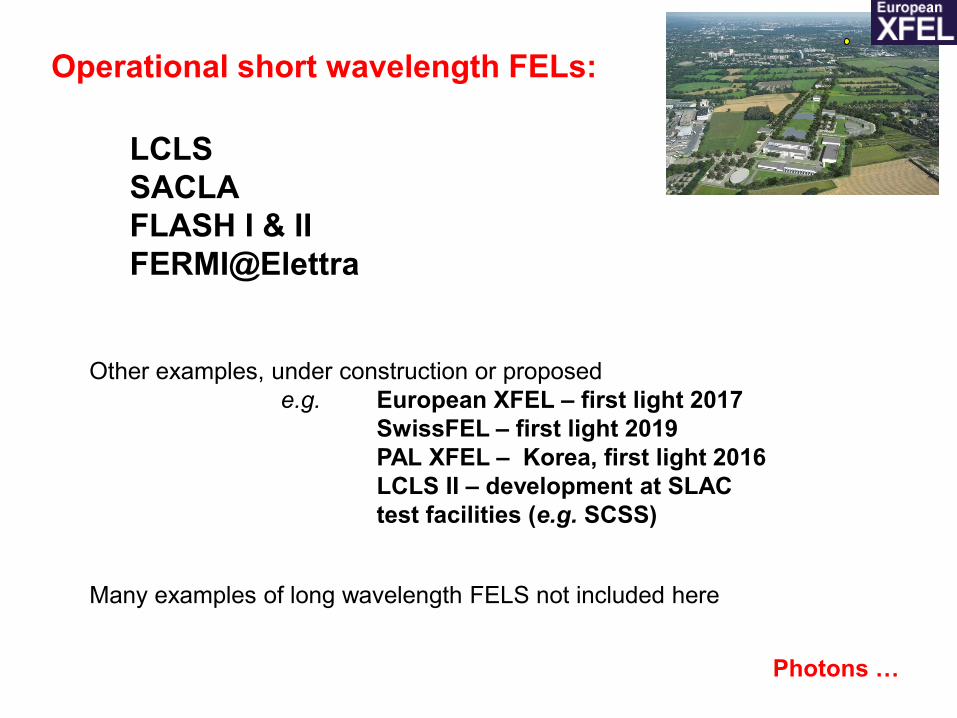
LCLS
SACLA
FLASH I & II
FERMI@Elettra
Operational short wavelength FELs:
Other examples, under construction or proposed
e.g. European XFEL – first light 2017
SwissFEL – first light 2019
PAL XFEL – Korea, first light 2016
LCLS II – development at SLAC
test facilities (e.g. SCSS)
Many examples of long wavelength FELS not included here
Photons …
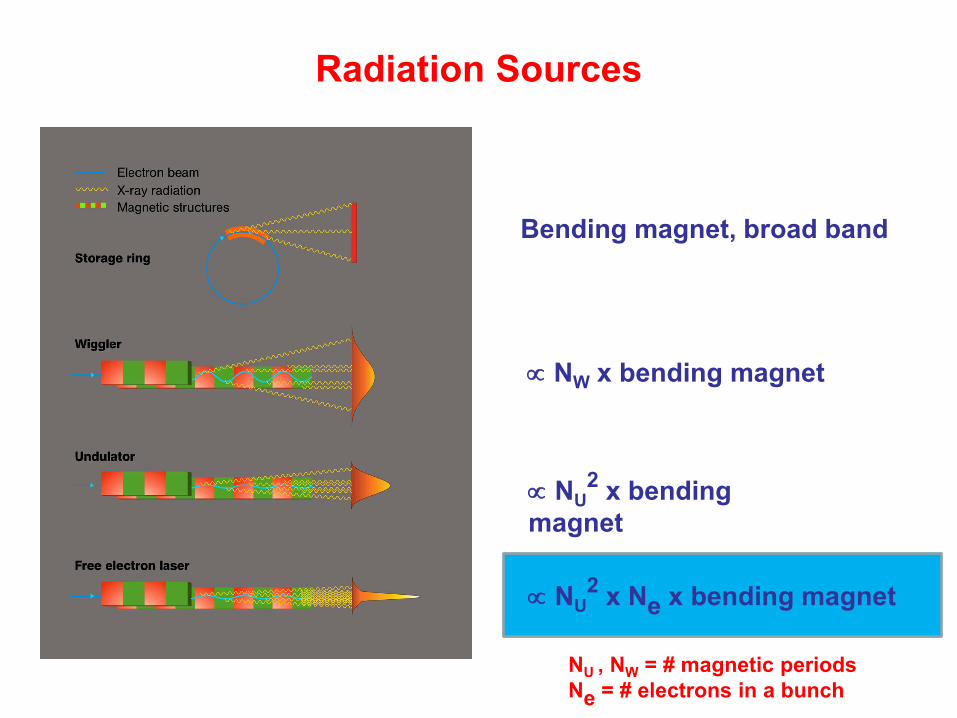
Radiation Sources
Bending magnet, broad band
NW x bending magnet
NU2 x bending
magnet
NU2 x Ne x bending magnet
NU , NW = # magnetic periods
Ne = # electrons in a bunch
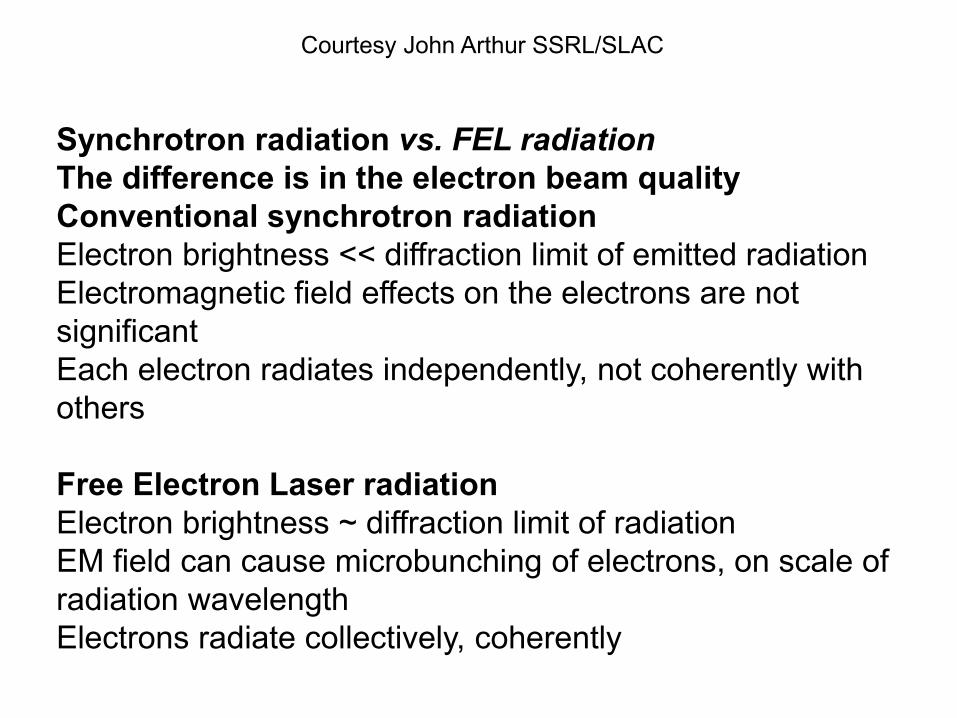
Synchrotron radiation vs. FEL radiation
The difference is in the electron beam quality
Conventional synchrotron radiation
Electron brightness << diffraction limit of emitted radiation
Electromagnetic field effects on the electrons are not
significant
Each electron radiates independently, not coherently with
others
Free Electron Laser radiation
Electron brightness ~ diffraction limit of radiation
EM field can cause microbunching of electrons, on scale of
radiation wavelength
Electrons radiate collectively, coherently
Courtesy John Arthur SSRL/SLAC
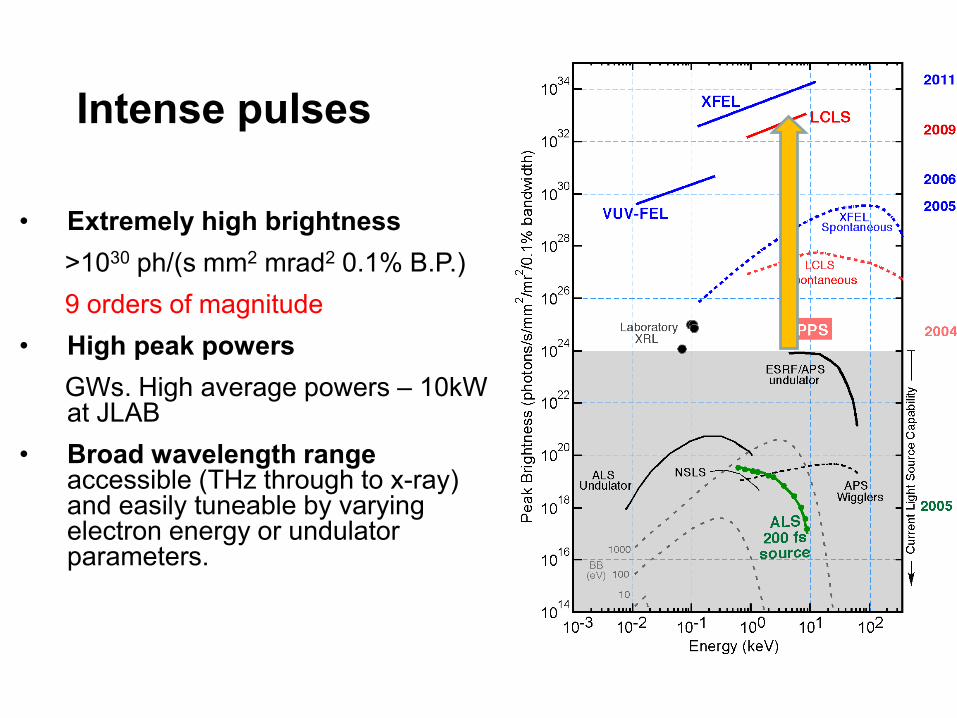
Intense pulses
• Extremely high brightness
>1030 ph/(s mm2 mrad2 0.1% B.P.)
9 orders of magnitude
• High peak powers
GWs. High average powers – 10kW at JLAB
• Broad wavelength range accessible (THz through to x-ray) and easily tuneable by varying electron energy or undulator parameters.
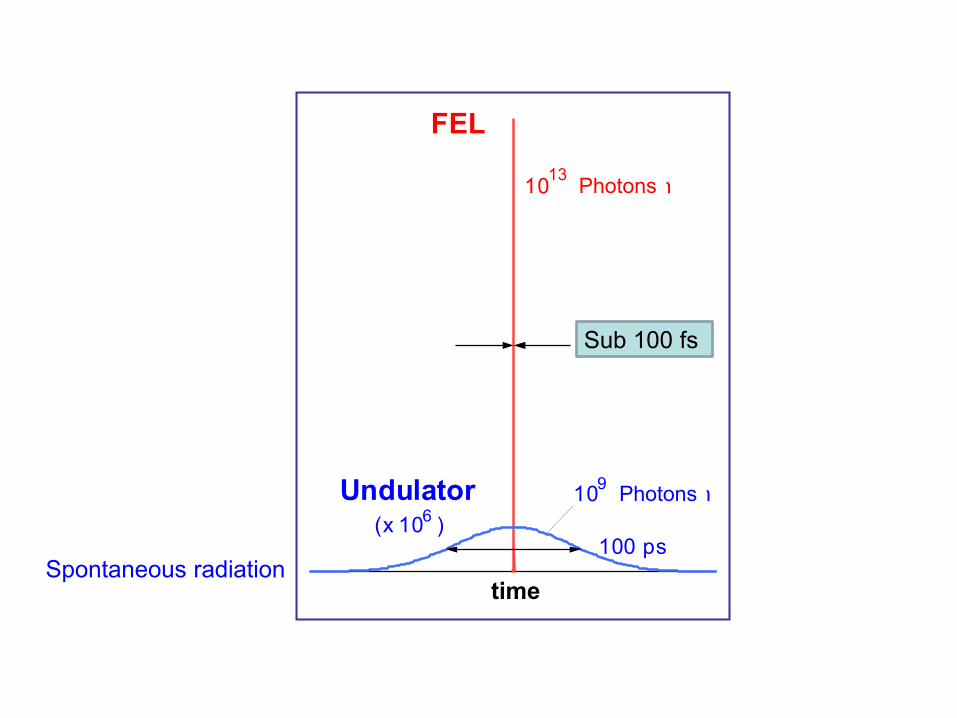
1013
Photonen
109
Photonen
FEL
Undulator (x 10 )
6
100 ps
100 fs
Photons
Photons
time
Sub 100 fs
Spontaneous radiation
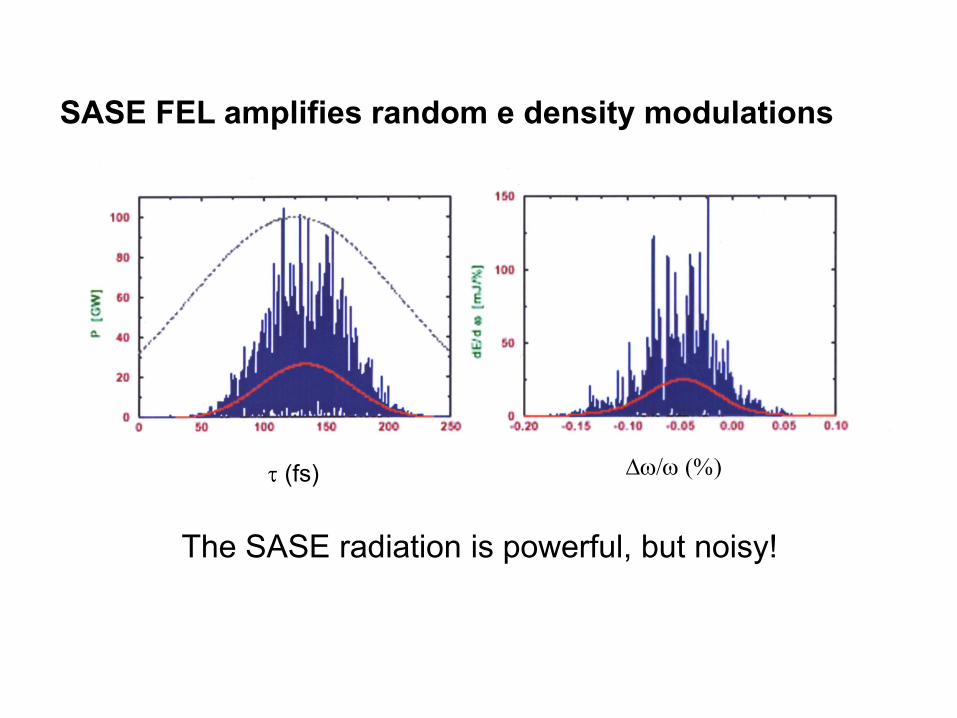
t (fs) Dw/w (%)
The SASE radiation is powerful, but noisy!
SASE FEL amplifies random e density modulations
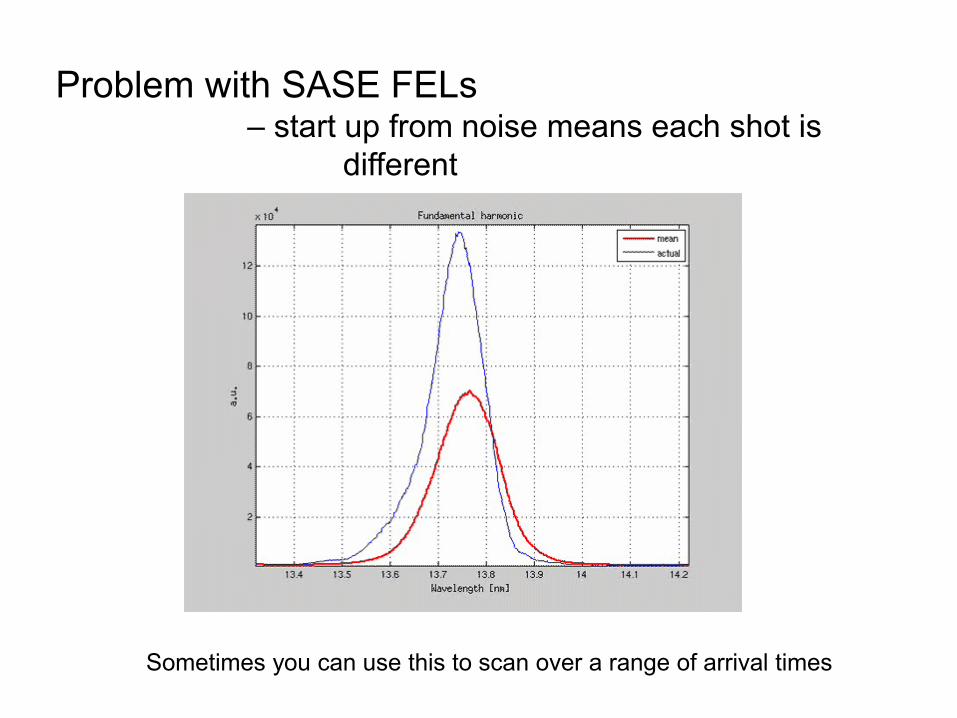
Problem with SASE FELs
– start up from noise means each shot is
different
Sometimes you can use this to scan over a range of arrival times
0 1 2 3 4 5 6 7
0.00
0.05
0.10
0.15
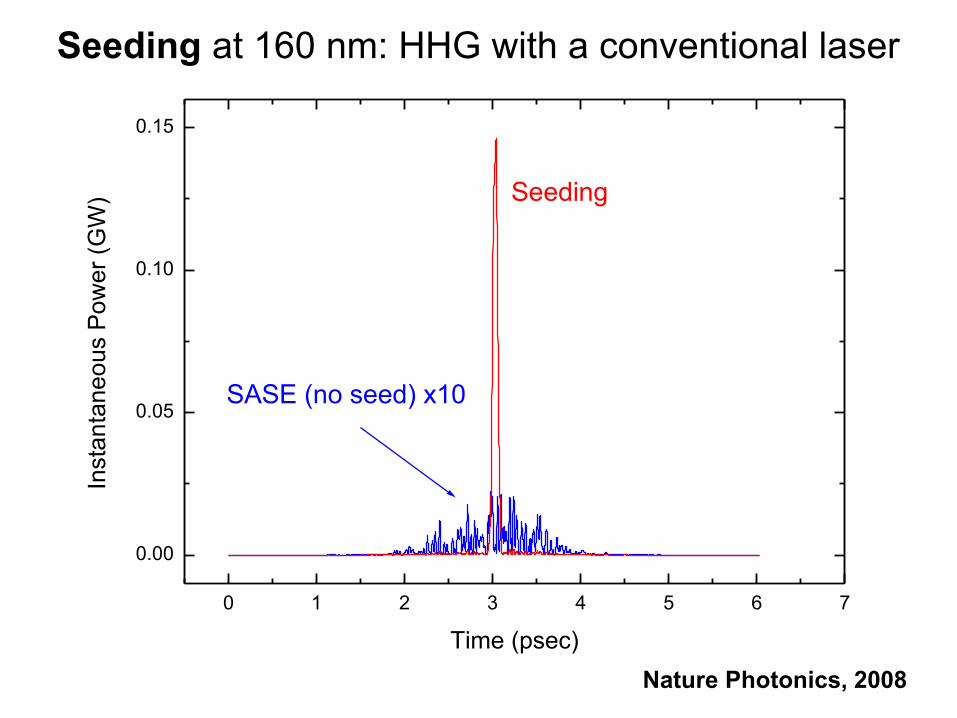
SASE (no seed) x10
Seeding
Insta
nta
ne
ou
s P
ow
er
(GW
)
Time (psec)
Nature Photonics, 2008
Seeding at 160 nm: HHG with a conventional laser
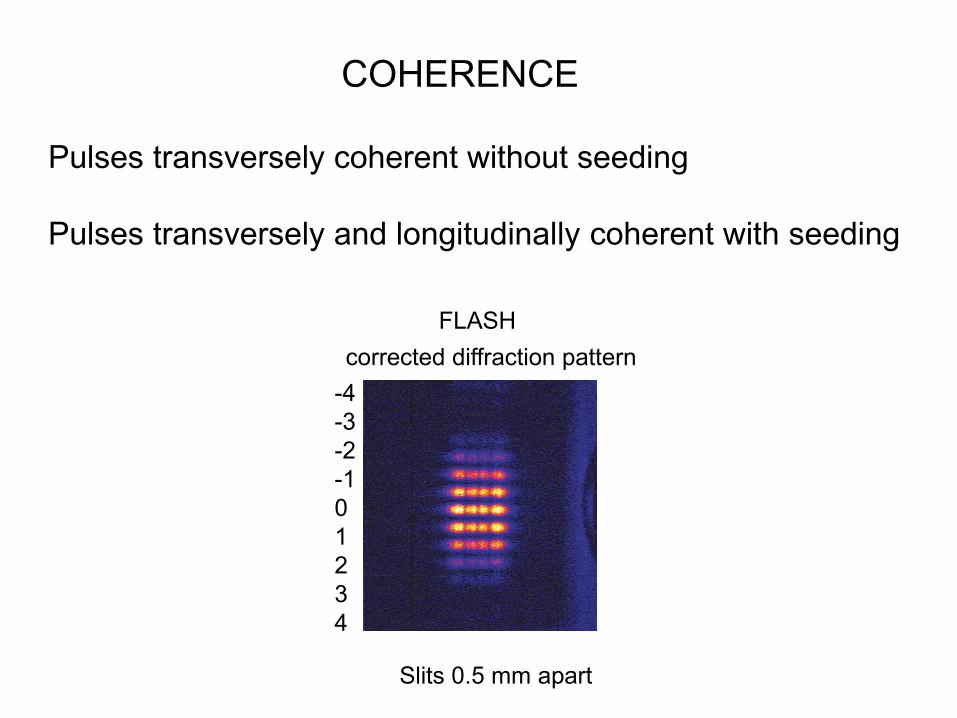
Pulses transversely coherent without seeding
Pulses transversely and longitudinally coherent with seeding
-4
-3
-2
-1
0
1
2
3
4
corrected diffraction pattern
Slits 0.5 mm apart
FLASH
COHERENCE
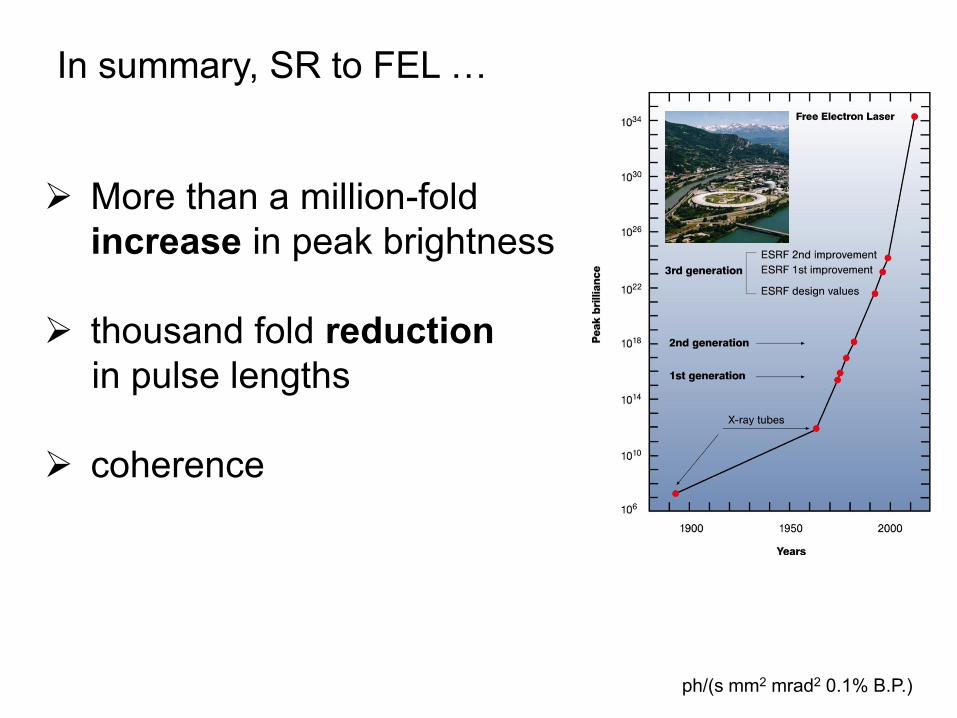
In summary, SR to FEL …
More than a million-fold
increase in peak brightness
thousand fold reduction
in pulse lengths
coherence
ph/(s mm2 mrad2 0.1% B.P.)
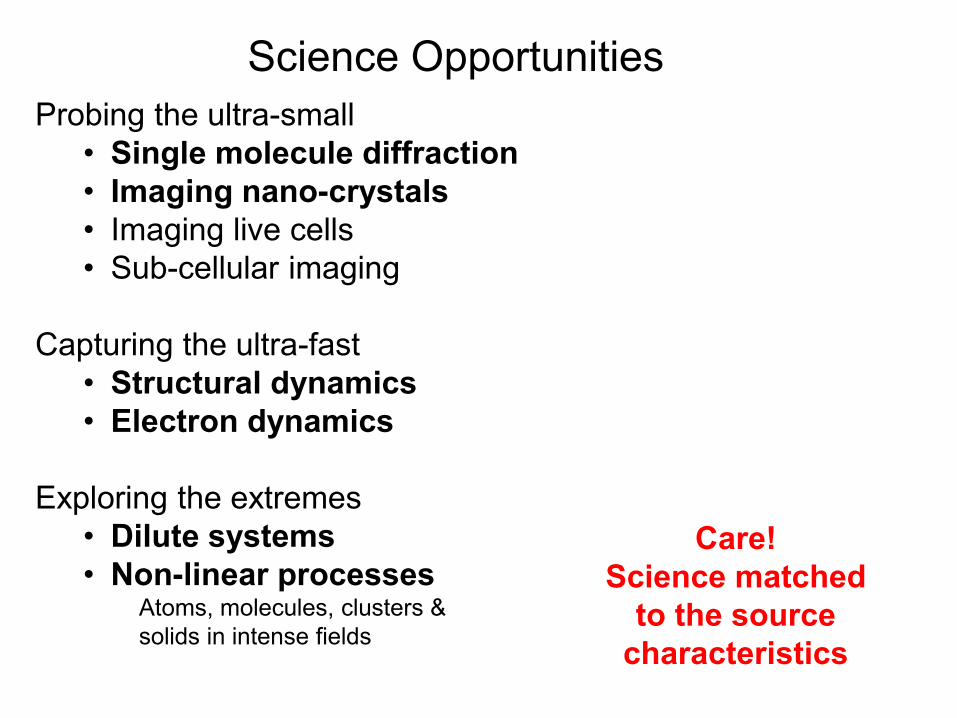
Science Opportunities
Probing the ultra-small
• Single molecule diffraction
• Imaging nano-crystals
• Imaging live cells
• Sub-cellular imaging
Capturing the ultra-fast
• Structural dynamics
• Electron dynamics
Exploring the extremes
• Dilute systems
• Non-linear processes Atoms, molecules, clusters &
solids in intense fields
Care!
Science matched
to the source
characteristics
Atoms in intense X-ray fields: non-linear XPS
Optical regime: many photons required for photoemission
X-ray regime: each photon may carry sufficient energy for ionisation
• Target changes throughout the pulse duration
• Very different from lab- or SR-based XPS
Removal and rearrangement of electrons on fs timescale within
a single X-ray pulse
• fundamental physics
• fs structural determinations
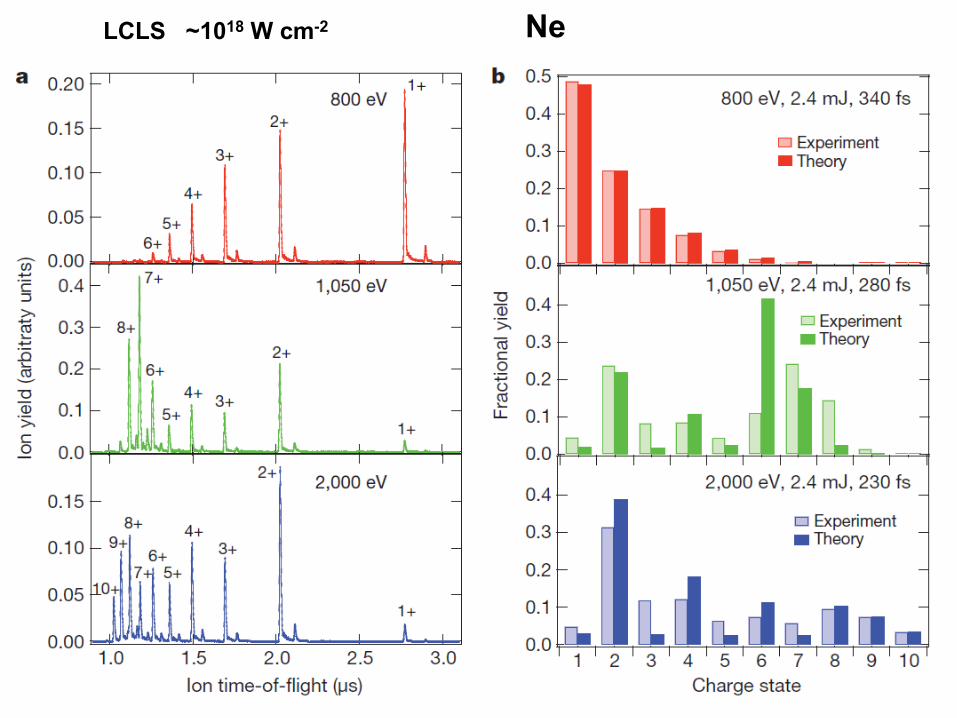
Ne LCLS ~1018 W cm-2
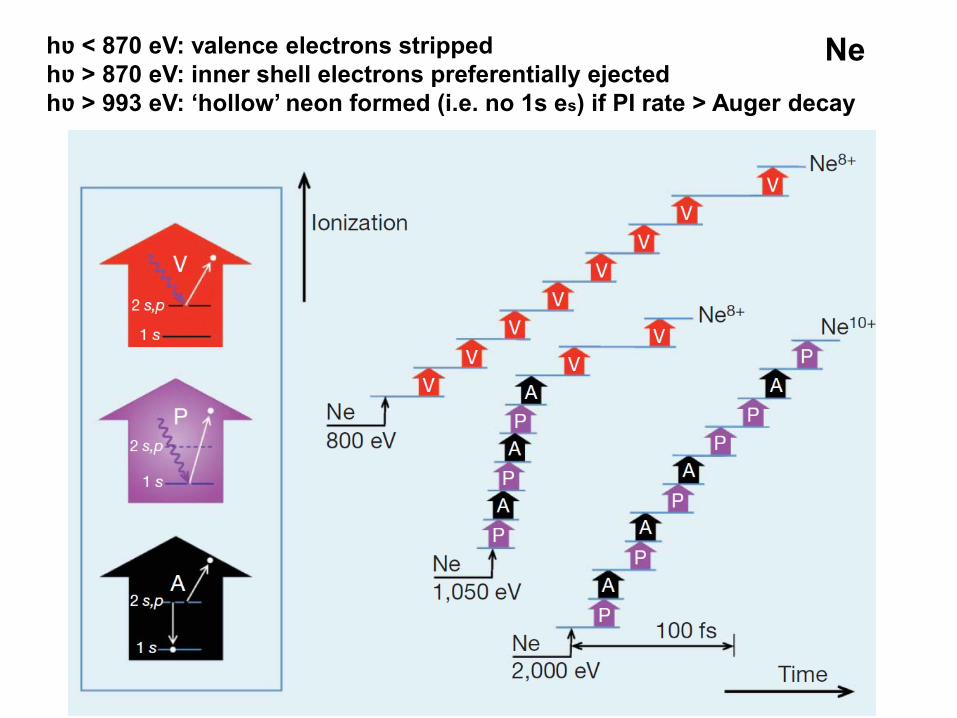
hʋ < 870 eV: valence electrons stripped
hʋ > 870 eV: inner shell electrons preferentially ejected
hʋ > 993 eV: ‘hollow’ neon formed (i.e. no 1s es) if PI rate > Auger decay
Ne
X-ray Transparency
At 2000 eV photoabsorption decreases if pulse length is reduced
from 230 fs to 80 fs
Qualitatively: 1s photoionisation dominant
When both emitted cross-section drops until
they’re replaced by valence electrons.
But
Auger decay very fast, 2.4 fs, why do we see
anything?
Cause: Auger refilling time increases dramatically
with charge state.
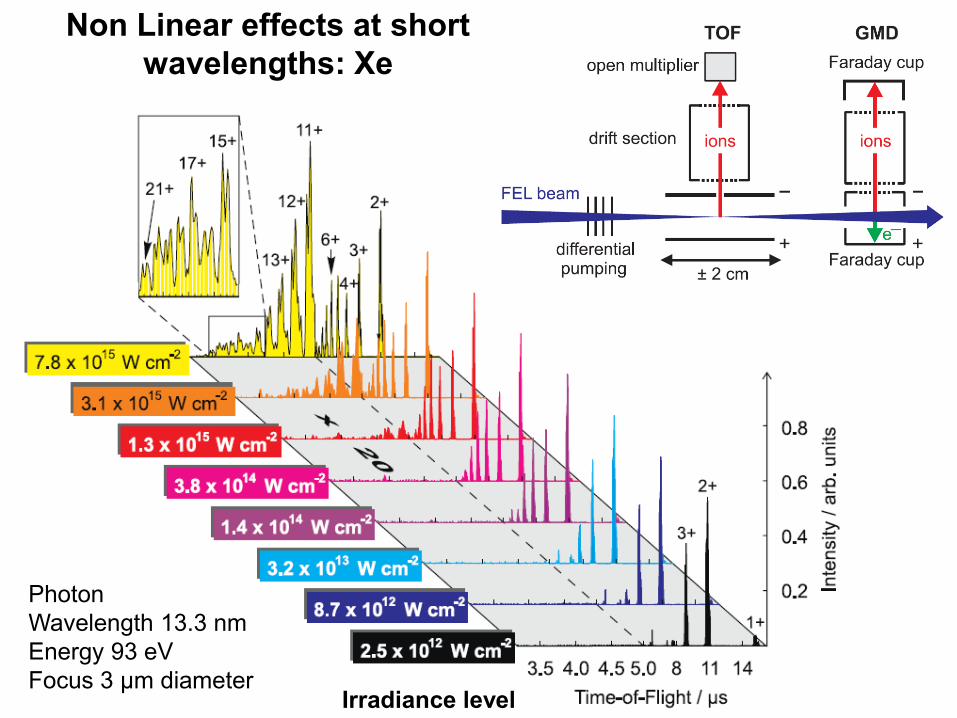
Non Linear effects at short
wavelengths: Xe
Photon
Wavelength 13.3 nm
Energy 93 eV
Focus 3 μm diameter Irradiance level
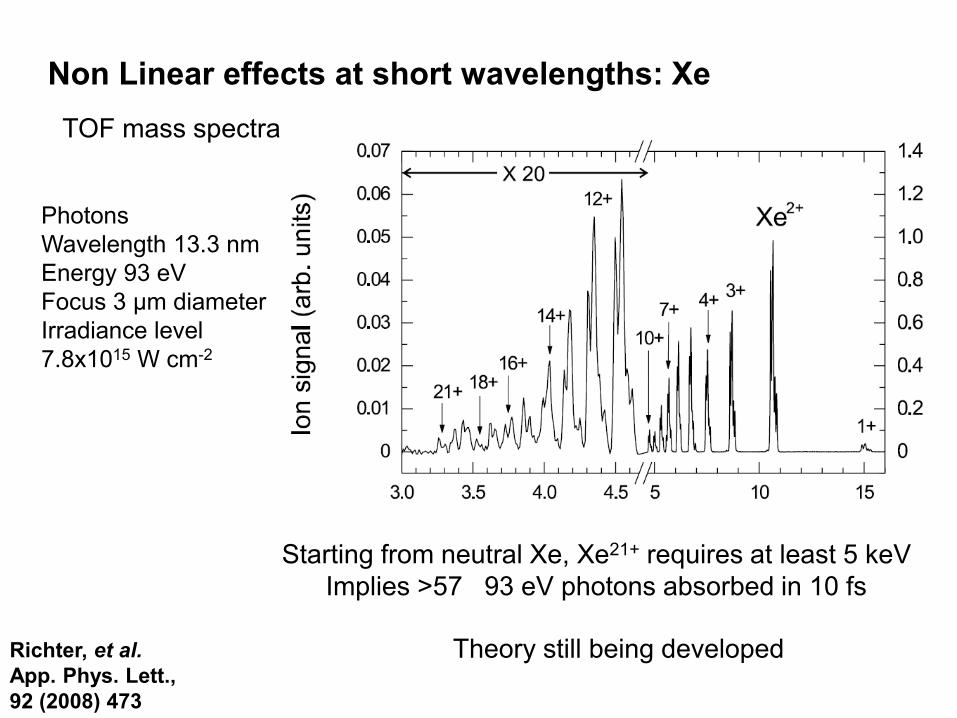
Non Linear effects at short wavelengths: Xe
TOF mass spectra
Starting from neutral Xe, Xe21+ requires at least 5 keV
Implies >57 93 eV photons absorbed in 10 fs
Theory still being developed
Photons
Wavelength 13.3 nm
Energy 93 eV
Focus 3 μm diameter
Irradiance level
7.8x10¹⁵ W cm-2
Richter, et al.
App. Phys. Lett.,
92 (2008) 473
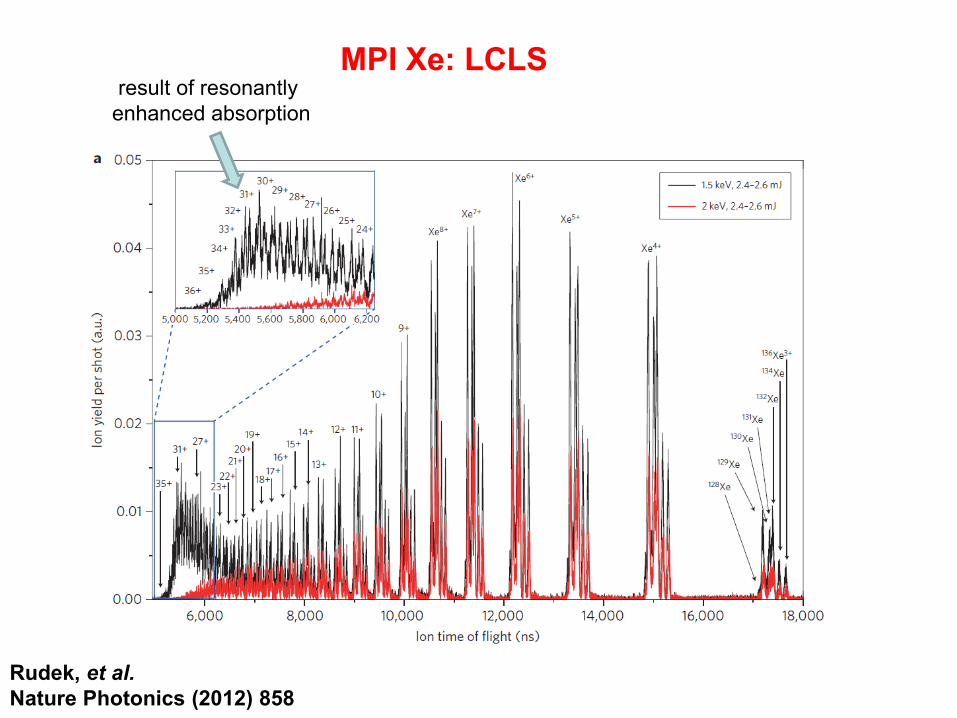
MPI Xe: LCLS
Rudek, et al.
Nature Photonics (2012) 858
result of resonantly
enhanced absorption
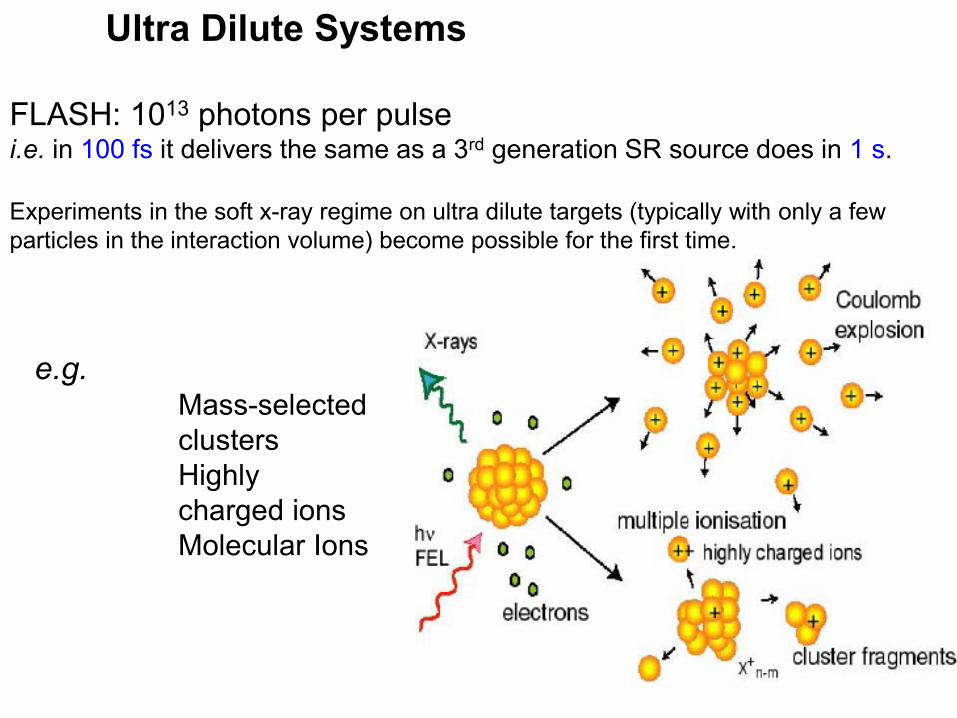
Ultra Dilute Systems
FLASH: 1013 photons per pulse
i.e. in 100 fs it delivers the same as a 3rd generation SR source does in 1 s.
Experiments in the soft x-ray regime on ultra dilute targets (typically with only a few
particles in the interaction volume) become possible for the first time.
e.g. Mass-selected
clusters
Highly
charged ions
Molecular Ions
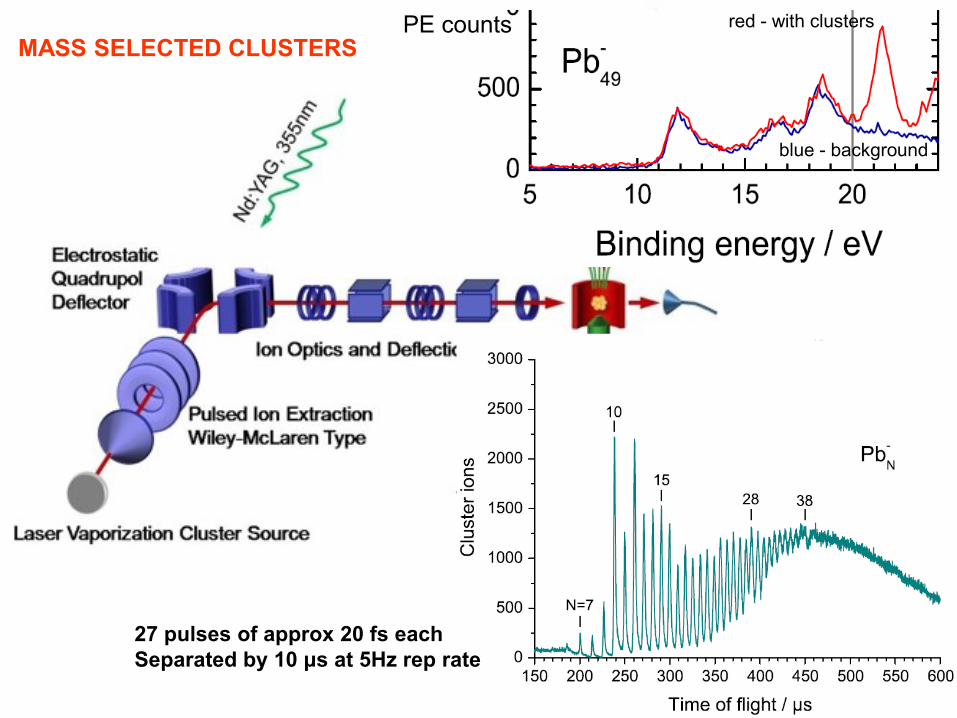
MASS SELECTED CLUSTERS
32.8 nm ~38 eV
27 pulses of approx 20 fs each
Separated by 10 μs at 5Hz rep rate
MASS SELECTED CLUSTERS PE counts red - with clusters
blue - background
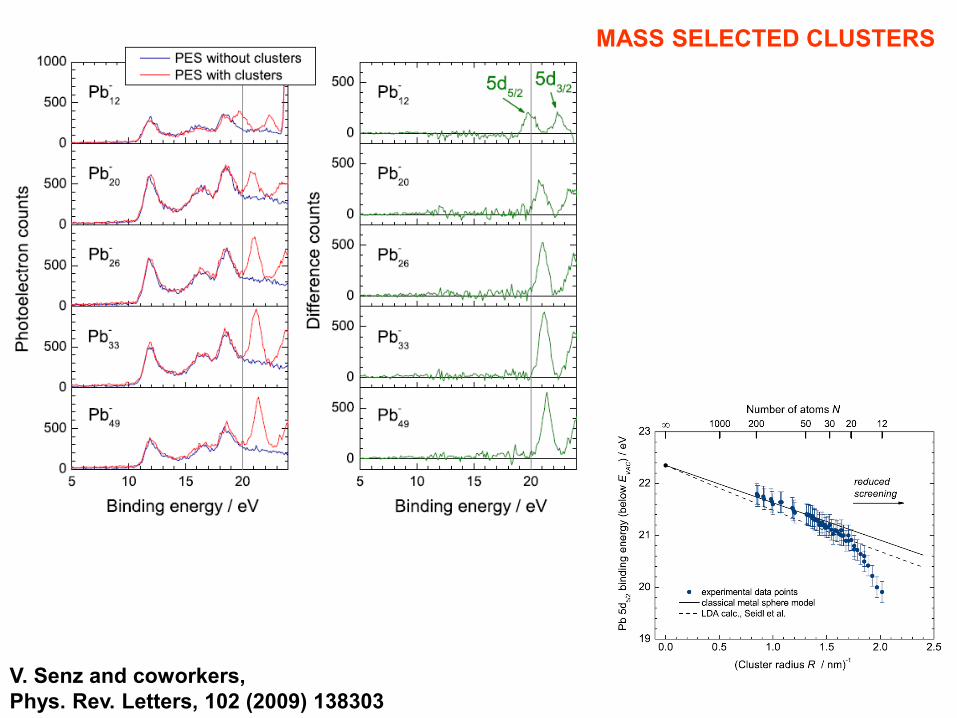
V. Senz and coworkers,
Phys. Rev. Letters, 102 (2009) 138303
MASS SELECTED CLUSTERS
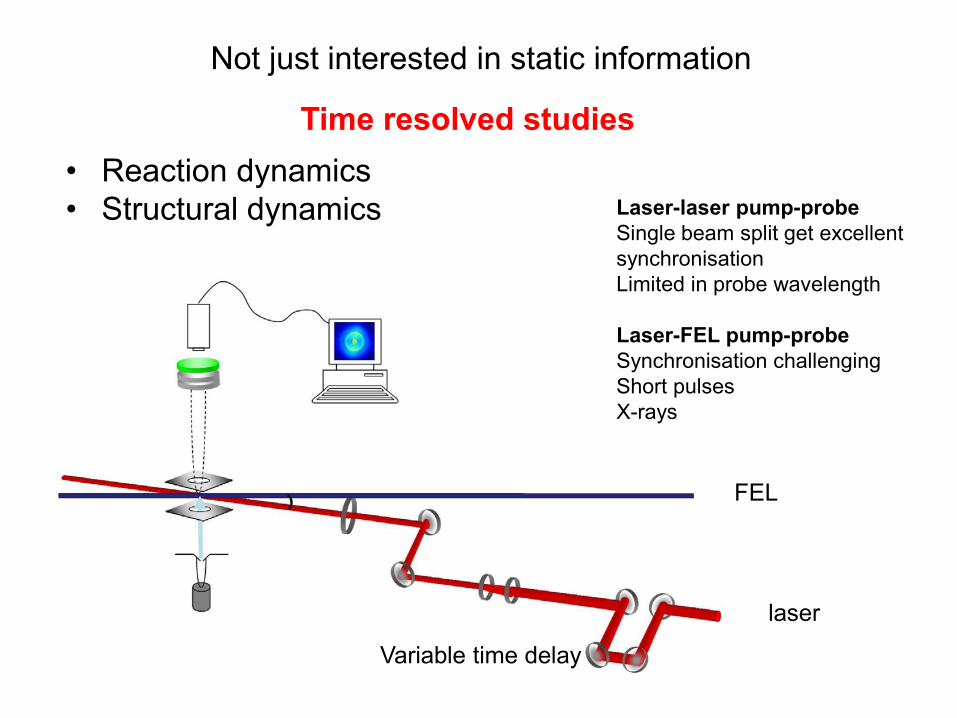
FEL
laser
Variable time delay
Laser-laser pump-probe
Single beam split get excellent
synchronisation
Limited in probe wavelength
Laser-FEL pump-probe
Synchronisation challenging
Short pulses
X-rays
• Reaction dynamics
• Structural dynamics
Time resolved studies
Not just interested in static information
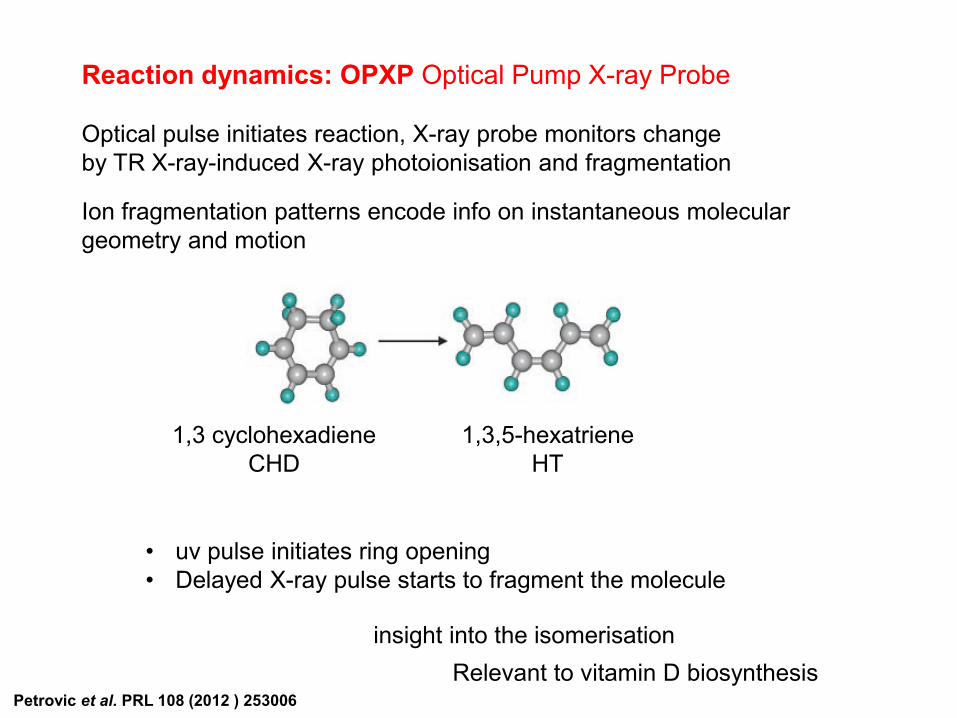
Reaction dynamics: OPXP Optical Pump X-ray Probe
Optical pulse initiates reaction, X-ray probe monitors change
by TR X-ray-induced X-ray photoionisation and fragmentation
Ion fragmentation patterns encode info on instantaneous molecular
geometry and motion
1,3 cyclohexadiene
CHD
• uv pulse initiates ring opening
• Delayed X-ray pulse starts to fragment the molecule
1,3,5-hexatriene
HT
insight into the isomerisation
Relevant to vitamin D biosynthesis Petrovic et al. PRL 108 (2012 ) 253006
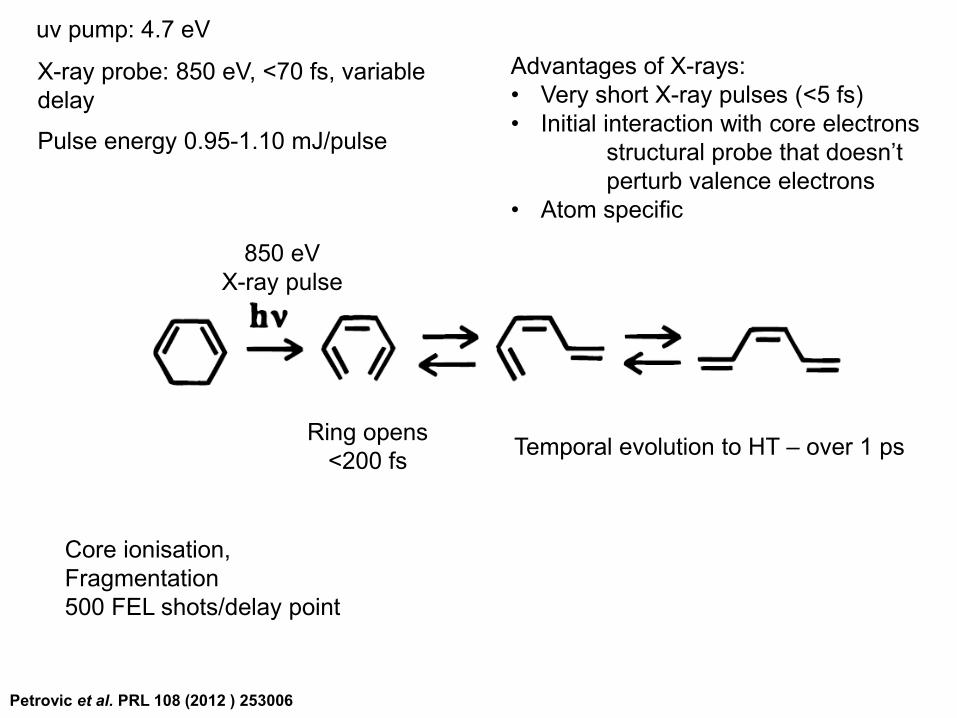
Advantages of X-rays:
• Very short X-ray pulses (<5 fs)
• Initial interaction with core electrons
structural probe that doesn’t
perturb valence electrons
• Atom specific
Ring opens
<200 fs
850 eV
X-ray pulse
Temporal evolution to HT – over 1 ps
X-ray probe: 850 eV, <70 fs, variable
delay
uv pump: 4.7 eV
Core ionisation,
Fragmentation
500 FEL shots/delay point
Pulse energy 0.95-1.10 mJ/pulse
Petrovic et al. PRL 108 (2012 ) 253006
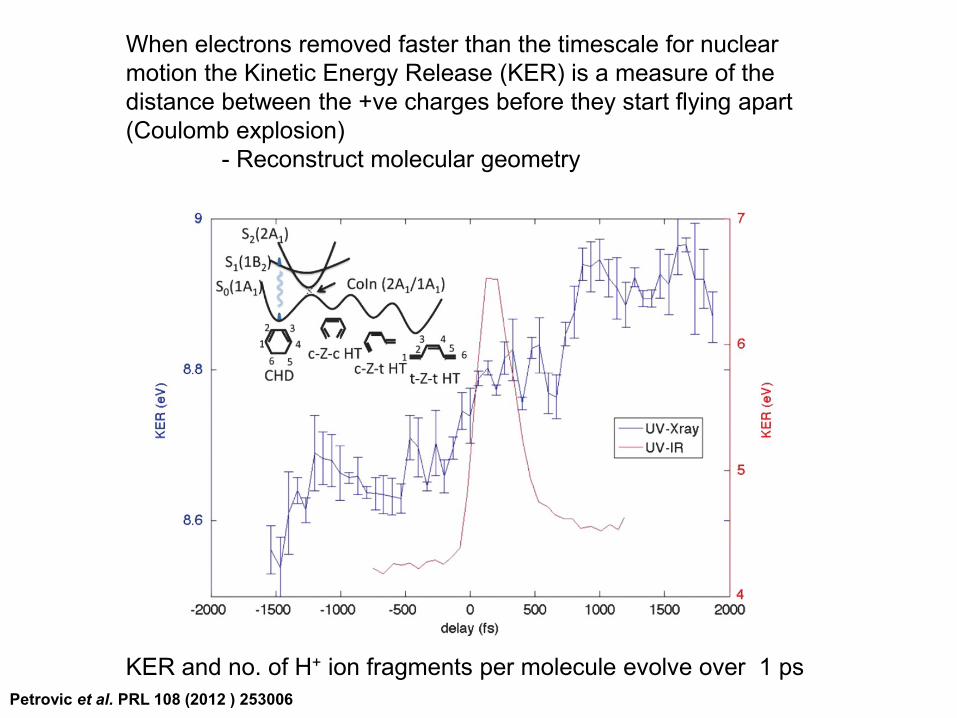
KER and no. of H+ ion fragments per molecule evolve over 1 ps
When electrons removed faster than the timescale for nuclear
motion the Kinetic Energy Release (KER) is a measure of the
distance between the +ve charges before they start flying apart
(Coulomb explosion)
- Reconstruct molecular geometry
Petrovic et al. PRL 108 (2012 ) 253006
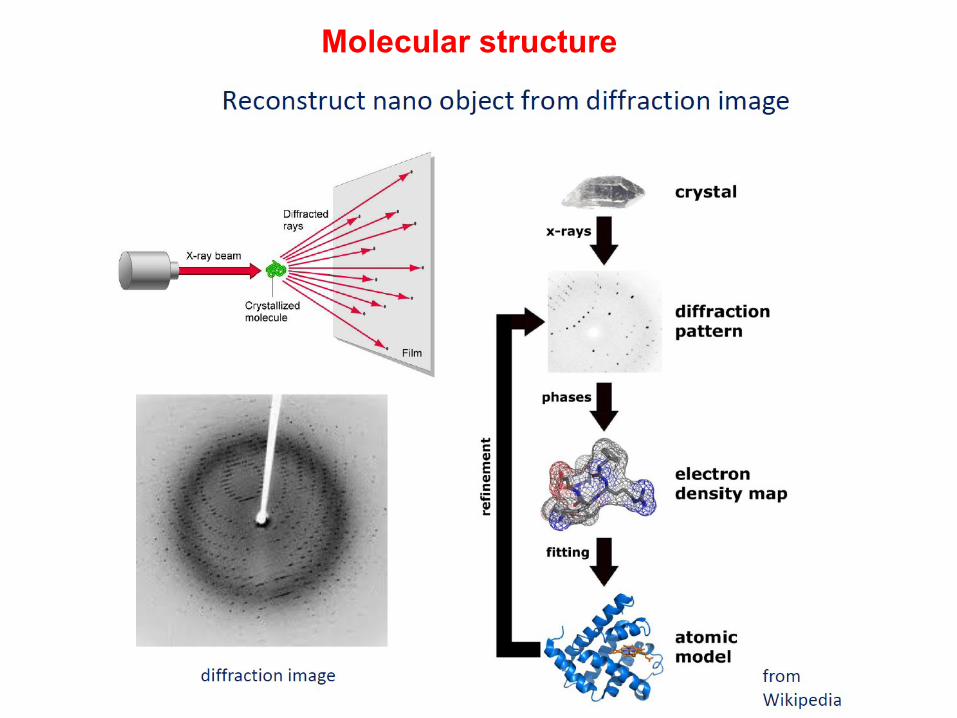
Molecular structure
Data obtained on the Diamond Light Source
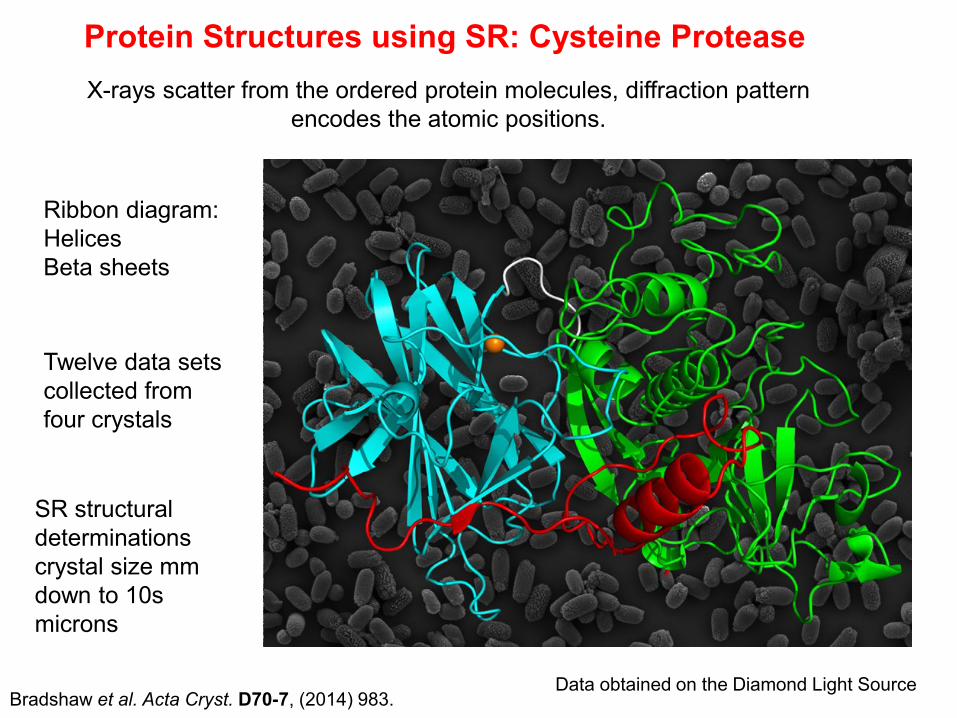
Protein Structures using SR: Cysteine Protease
Ribbon diagram:
Helices
Beta sheets
Bradshaw et al. Acta Cryst. D70-7, (2014) 983.
Twelve data sets
collected from
four crystals
SR structural
determinations
crystal size mm
down to 10s
microns
X-rays scatter from the ordered protein molecules, diffraction pattern
encodes the atomic positions.
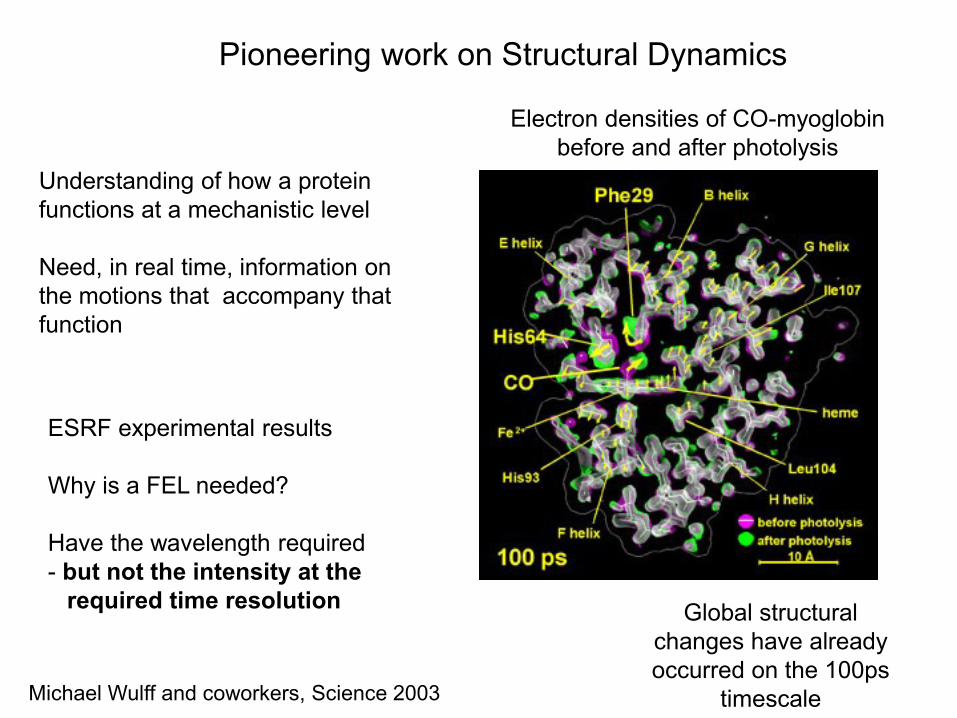
Pioneering work on Structural Dynamics
Michael Wulff and coworkers, Science 2003
Global structural
changes have already
occurred on the 100ps
timescale
ESRF experimental results
Why is a FEL needed?
Have the wavelength required
- but not the intensity at the
required time resolution
Electron densities of CO-myoglobin
before and after photolysis
Understanding of how a protein
functions at a mechanistic level
Need, in real time, information on
the motions that accompany that
function
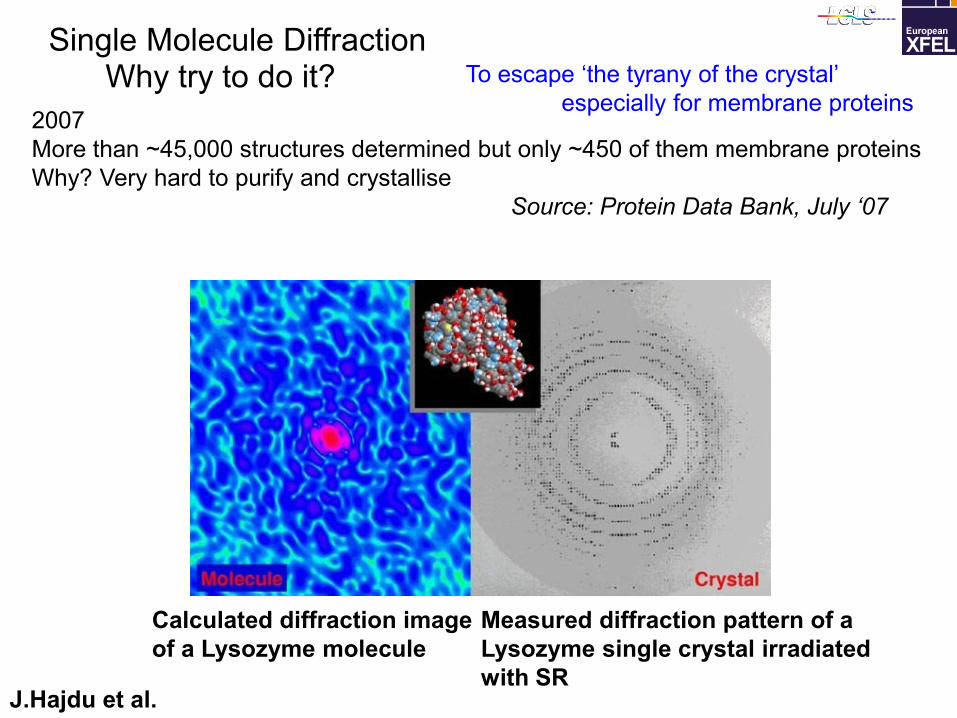
Measured diffraction pattern of a
Lysozyme single crystal irradiated
with SR
Calculated diffraction image
of a Lysozyme molecule
J.Hajdu et al.
Single Molecule Diffraction
2007
More than ~45,000 structures determined but only ~450 of them membrane proteins
Why? Very hard to purify and crystallise
Source: Protein Data Bank, July ‘07
To escape ‘the tyrany of the crystal’
especially for membrane proteins Why try to do it?
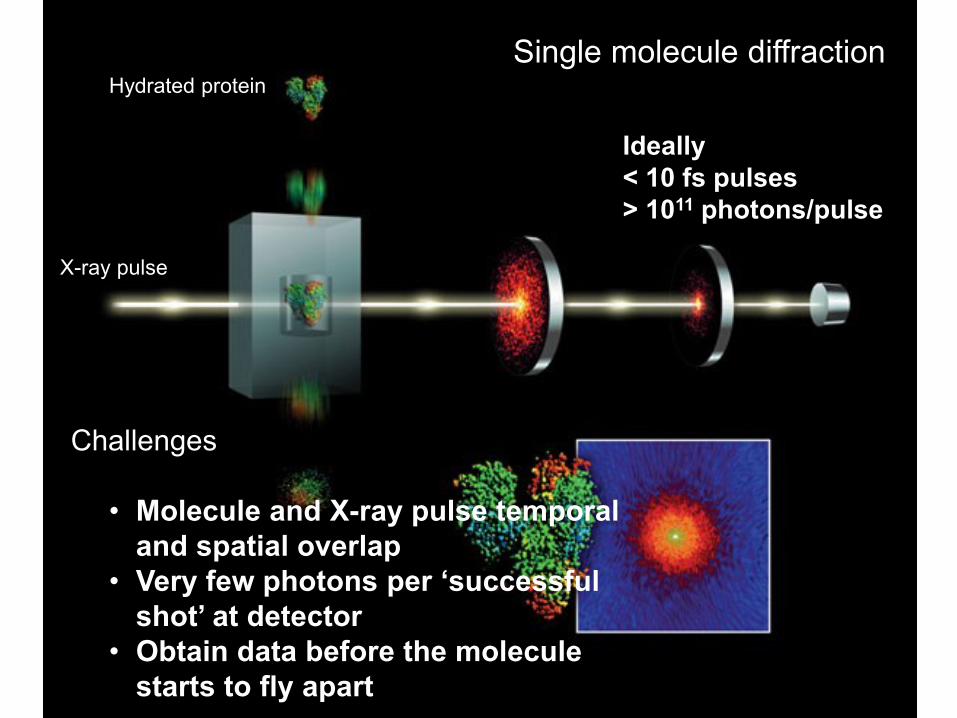
Ideally
< 10 fs pulses
> 1011 photons/pulse
Single molecule diffraction Hydrated protein
X-ray pulse
Challenges
• Molecule and X-ray pulse temporal
and spatial overlap
• Very few photons per ‘successful
shot’ at detector
• Obtain data before the molecule
starts to fly apart
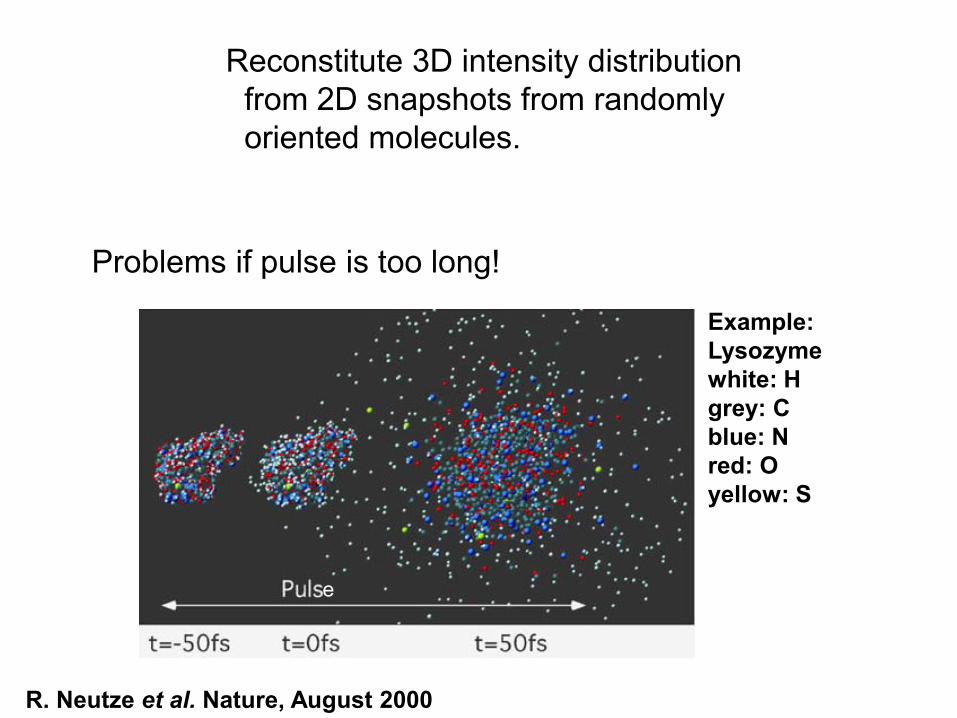
Reconstitute 3D intensity distribution
from 2D snapshots from randomly
oriented molecules.
Example:
Lysozyme
white: H
grey: C
blue: N
red: O
yellow: S
e
Problems if pulse is too long!
R. Neutze et al. Nature, August 2000
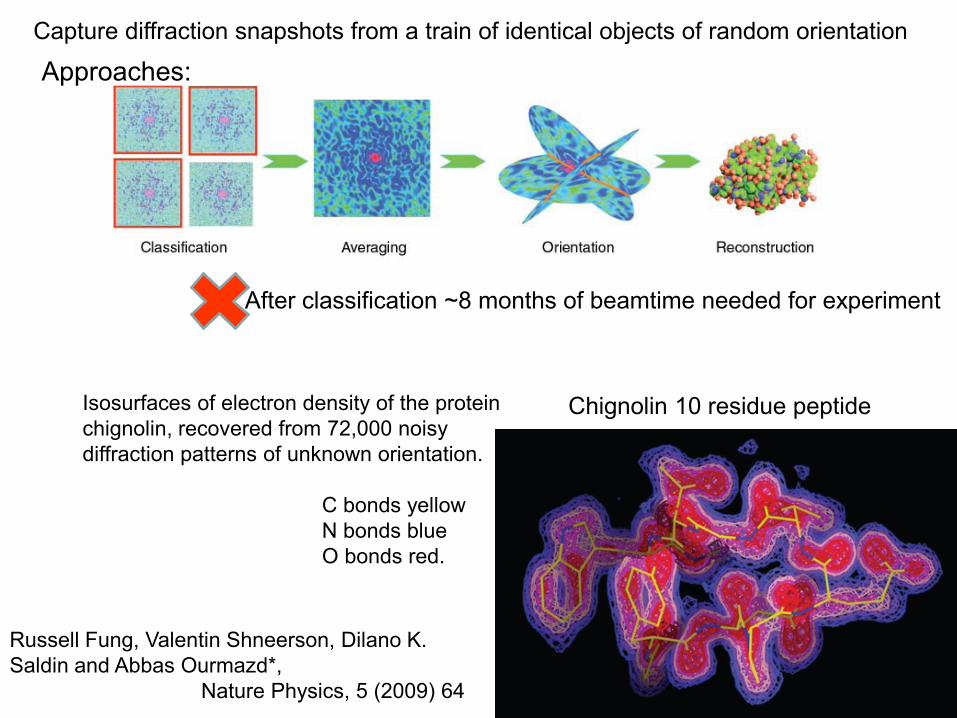
Approaches:
After classification ~8 months of beamtime needed for experiment
Capture diffraction snapshots from a train of identical objects of random orientation
Isosurfaces of electron density of the protein
chignolin, recovered from 72,000 noisy
diffraction patterns of unknown orientation.
C bonds yellow
N bonds blue
O bonds red.
Chignolin 10 residue peptide
Russell Fung, Valentin Shneerson, Dilano K.
Saldin and Abbas Ourmazd*,
Nature Physics, 5 (2009) 64
Single Shot diffraction
http://lcls.slac.stanford.edu/AnimationViewCXIScience.aspx
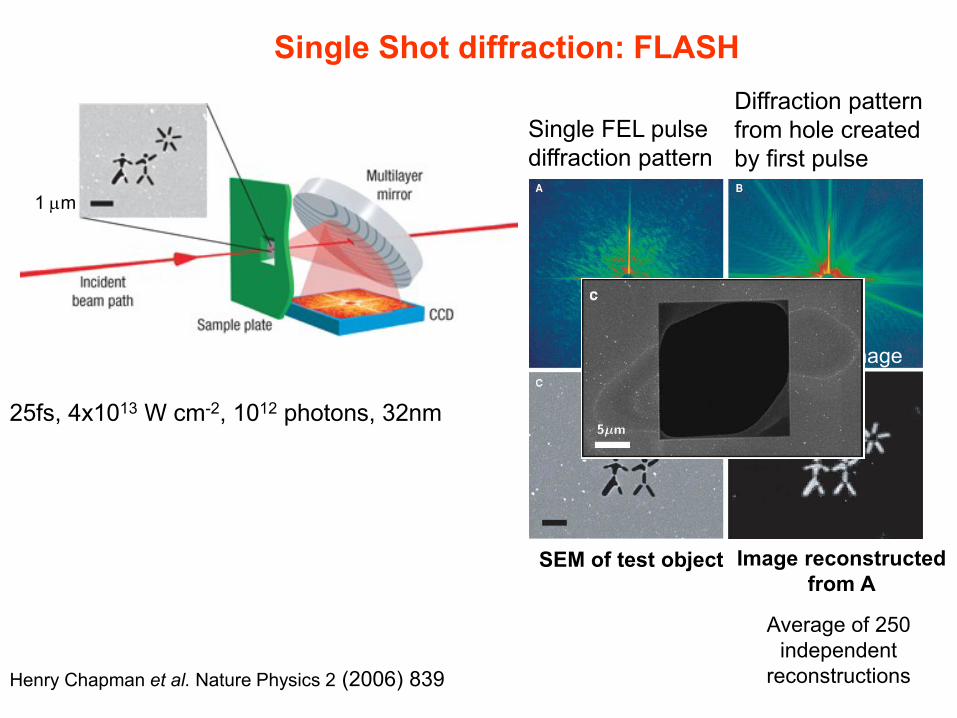
Single Shot diffraction: FLASH
Henry Chapman et al. Nature Physics 2 (2006) 839
1 m
25fs, 4x10¹³ W cm-2, 1012 photons, 32nm
diffraction pattern
SEM of test object Image reconstructed
from A
Single FEL pulse
diffraction pattern
Diffraction pattern
from hole created
by first pulse
Sample damage
Average of 250
independent
reconstructions
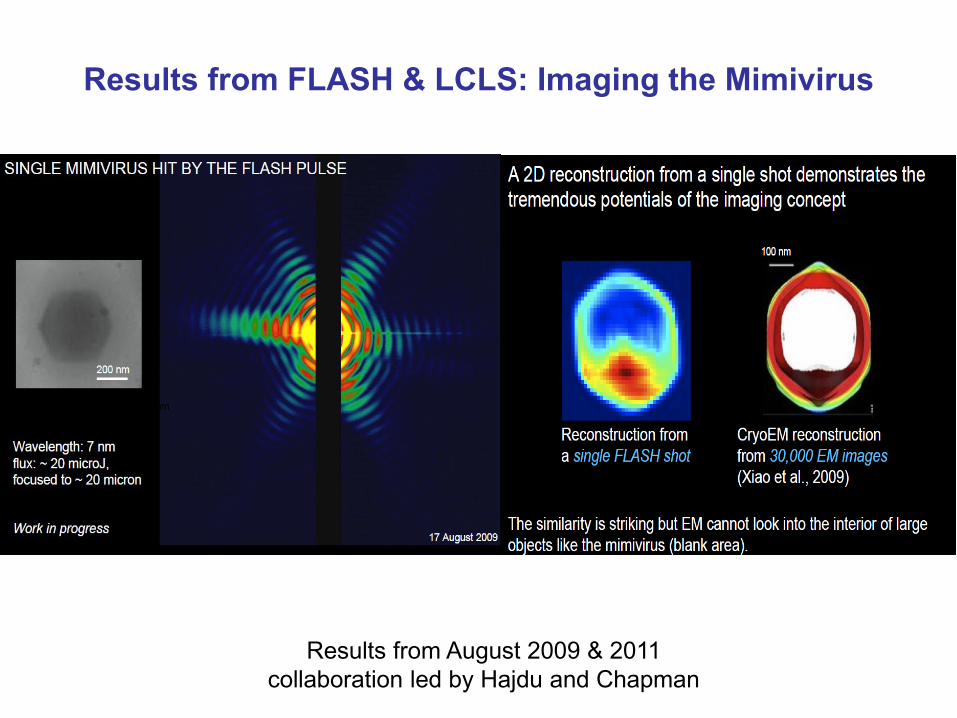
Results from FLASH & LCLS: Imaging the Mimivirus
Results from August 2009 & 2011
collaboration led by Hajdu and Chapman
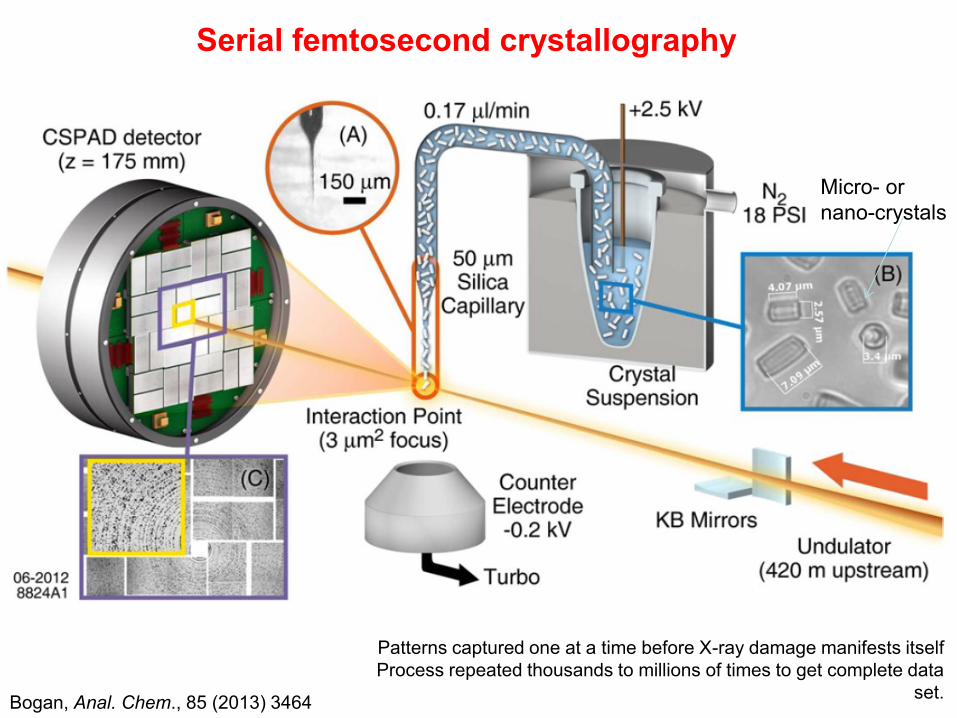
Serial femtosecond crystallography
Bogan, Anal. Chem., 85 (2013) 3464
Micro- or
nano-crystals
Patterns captured one at a time before X-ray damage manifests itself
Process repeated thousands to millions of times to get complete data
set.
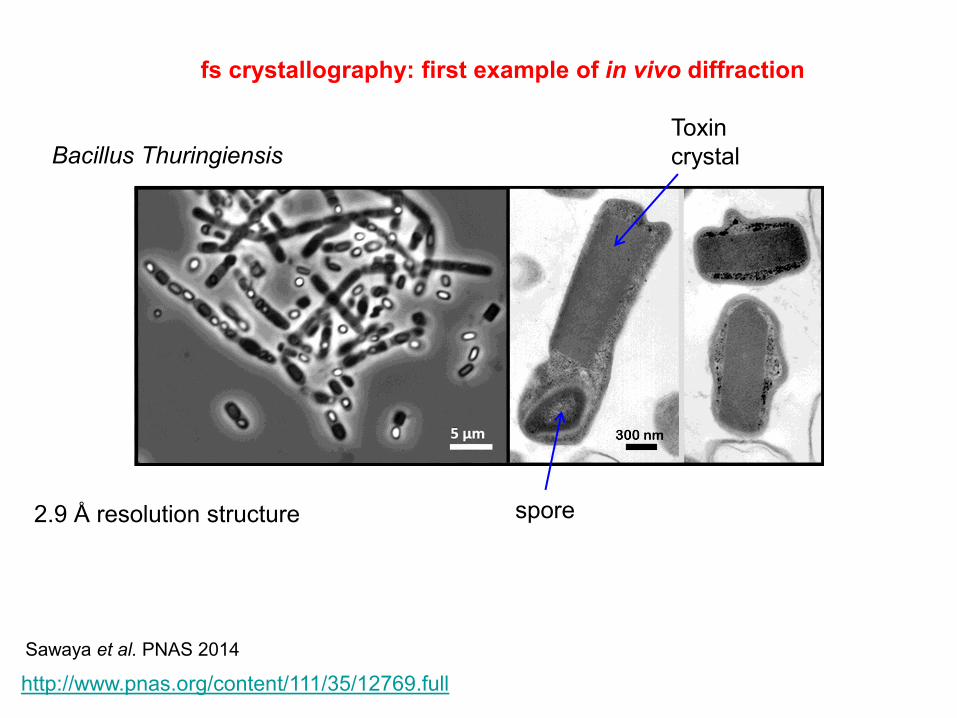
Bacillus Thuringiensis Toxin
crystal
spore
fs crystallography: first example of in vivo diffraction
http://www.pnas.org/content/111/35/12769.full
2.9 Å resolution structure
Sawaya et al. PNAS 2014
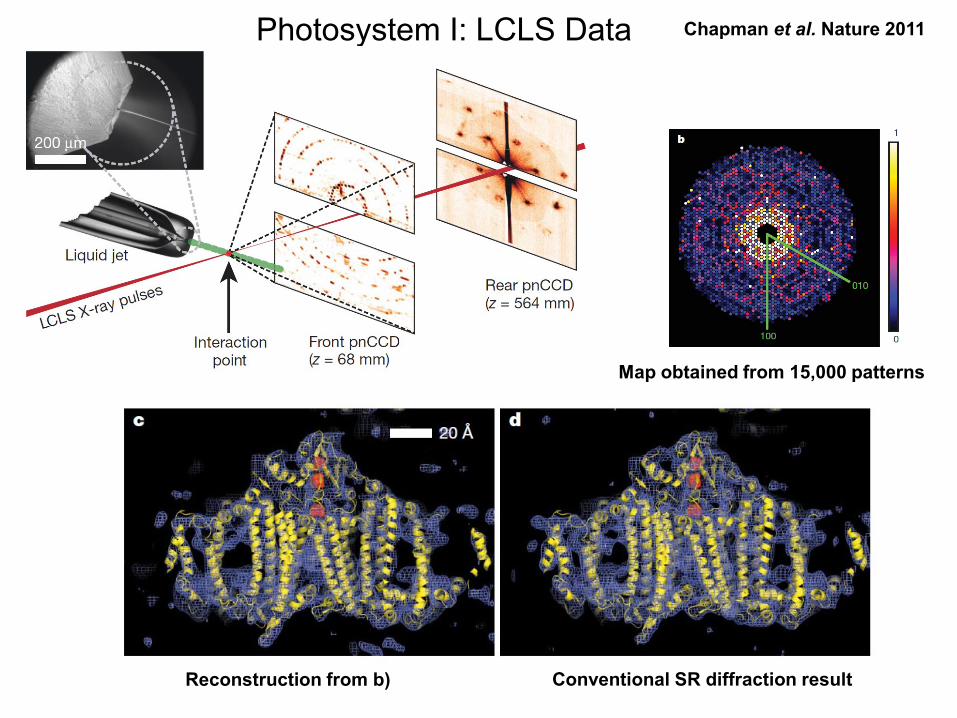
Map obtained from 15,000 patterns
Photosystem I: LCLS Data Chapman et al. Nature 2011
Reconstruction from b) Conventional SR diffraction result
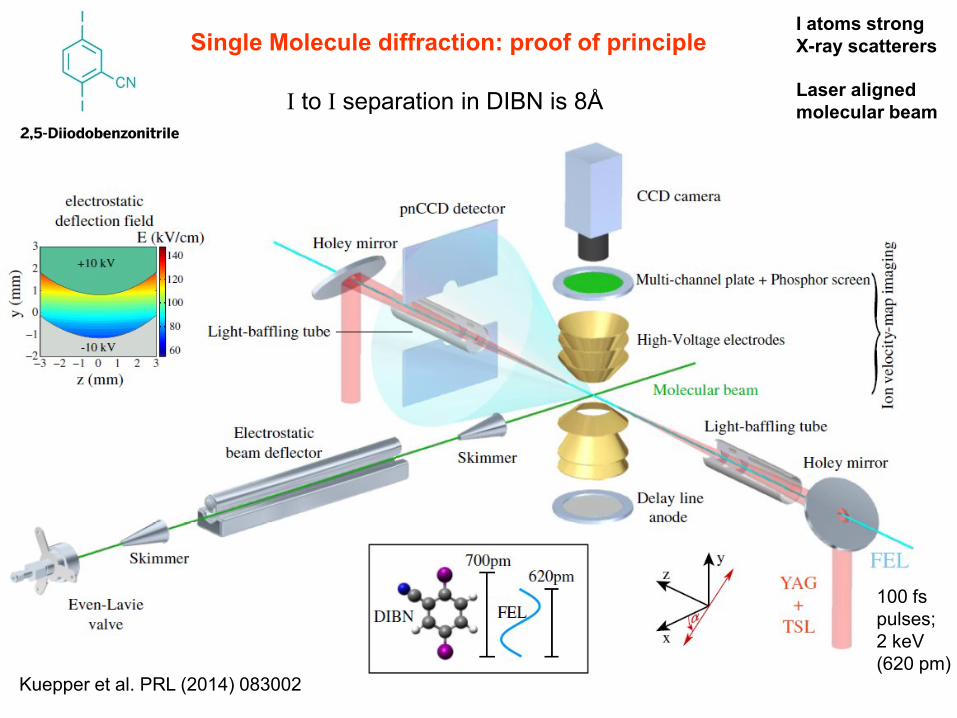
Single Molecule diffraction: proof of principle I atoms strong
X-ray scatterers
Laser aligned
molecular beam
100 fs
pulses;
2 keV
(620 pm) Kuepper et al. PRL (2014) 083002
I to I separation in DIBN is 8Å
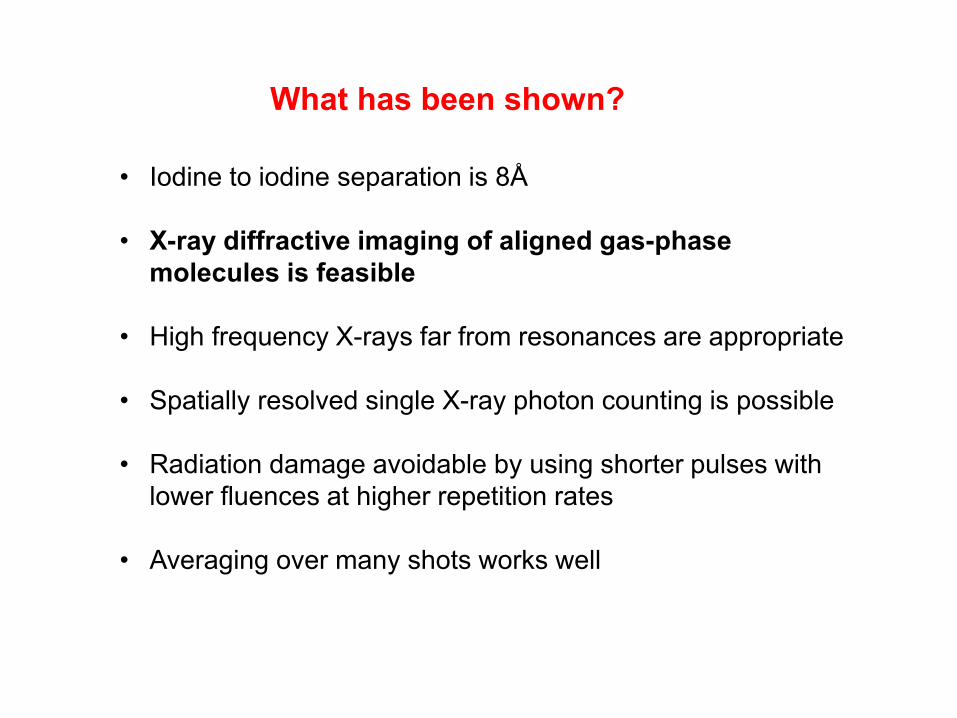
• Iodine to iodine separation is 8Å
• X-ray diffractive imaging of aligned gas-phase
molecules is feasible
• High frequency X-rays far from resonances are appropriate
• Spatially resolved single X-ray photon counting is possible
• Radiation damage avoidable by using shorter pulses with
lower fluences at higher repetition rates
• Averaging over many shots works well
What has been shown?
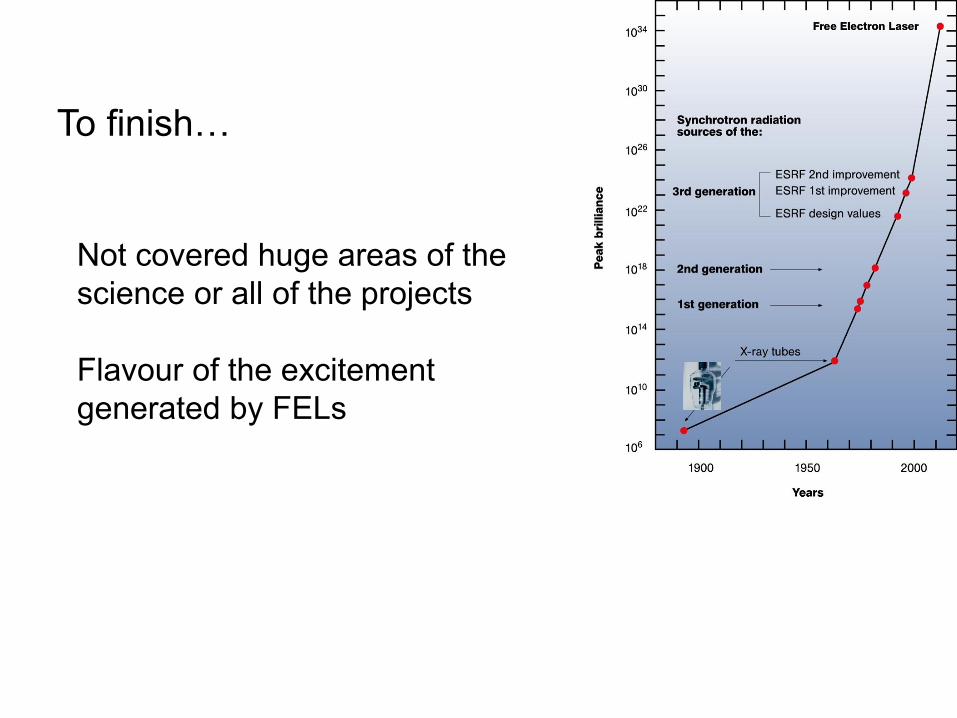
To finish…
Not covered huge areas of the
science or all of the projects
Flavour of the excitement
generated by FELs
References
• Status of FEL projects: http://www.fel2014.ch/prepress/FEL2014/
• Ribik and Margaritondo, J. Phys. D: Appl. Phys., 45 (2012) 213001
• Bostedt et al., J. Phys. B: Mol. Opt. Phys., 46 (2013) 164003
• Feldhaus et al., J. Phys. B: Mol. Opt. Phys., 46 (2013) 164002

With special thanks to:
Wilfried Wurth, Annette
Pietzsch, Volkmar Senz,
Abbas Ourmazd, Mike Poole,
Jon Marangos, David
Dunning, Siegfried Schreiber,
Josef Feldhaus, Thomas
Tschentscher, Fulvio
Parmigiani, Roger Falcone,
John Corlett, Sven Reiche,
Dave Fritz, Tetsuya Ishikawa
…
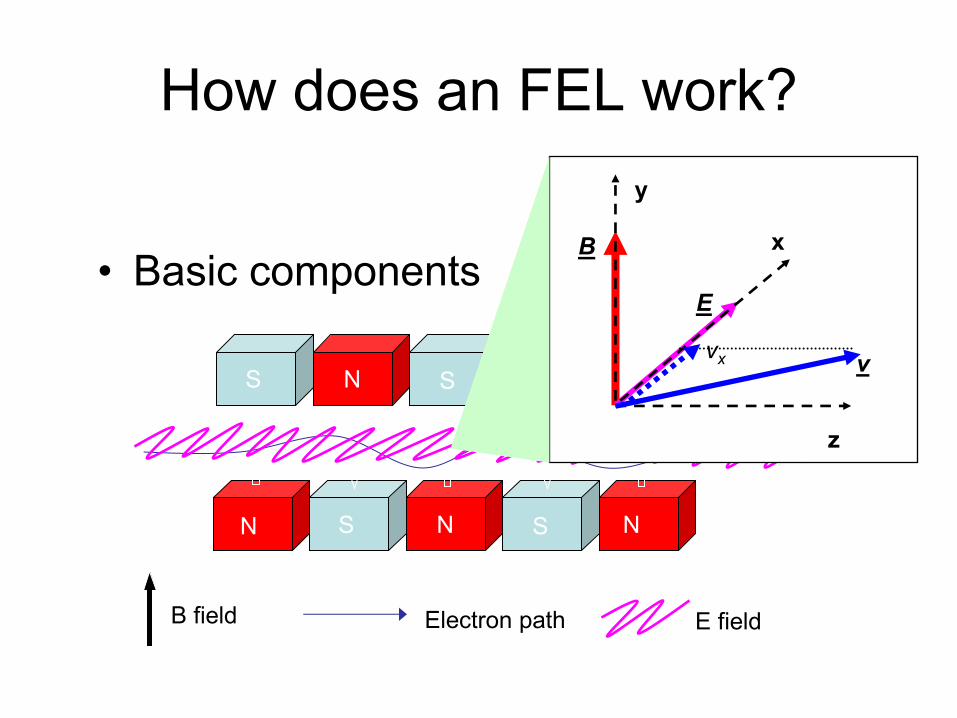
How does an FEL work?
• Basic components
N S S N S
N S N S N
B field Electron path E field
B
E
z
v
x
y
vx
r
e-
u
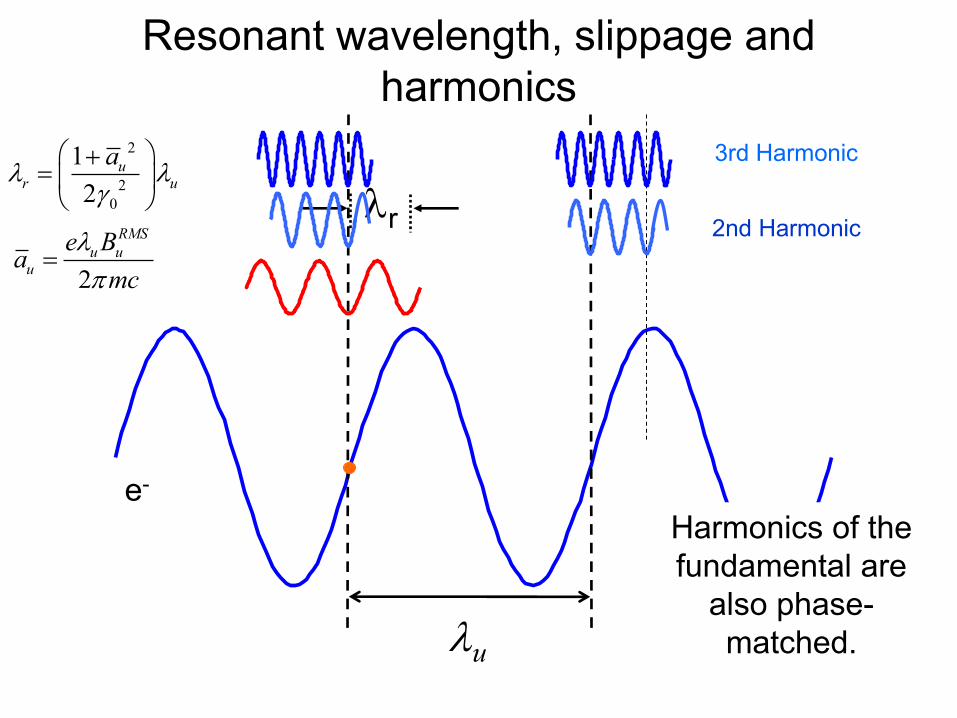
2nd Harmonic
3rd Harmonic
Harmonics of the
fundamental are
also phase-
matched.
Resonant wavelength, slippage and
harmonics
2
RMS
u uu
e Ba
mc
2
2
0
1
2
ur u
a
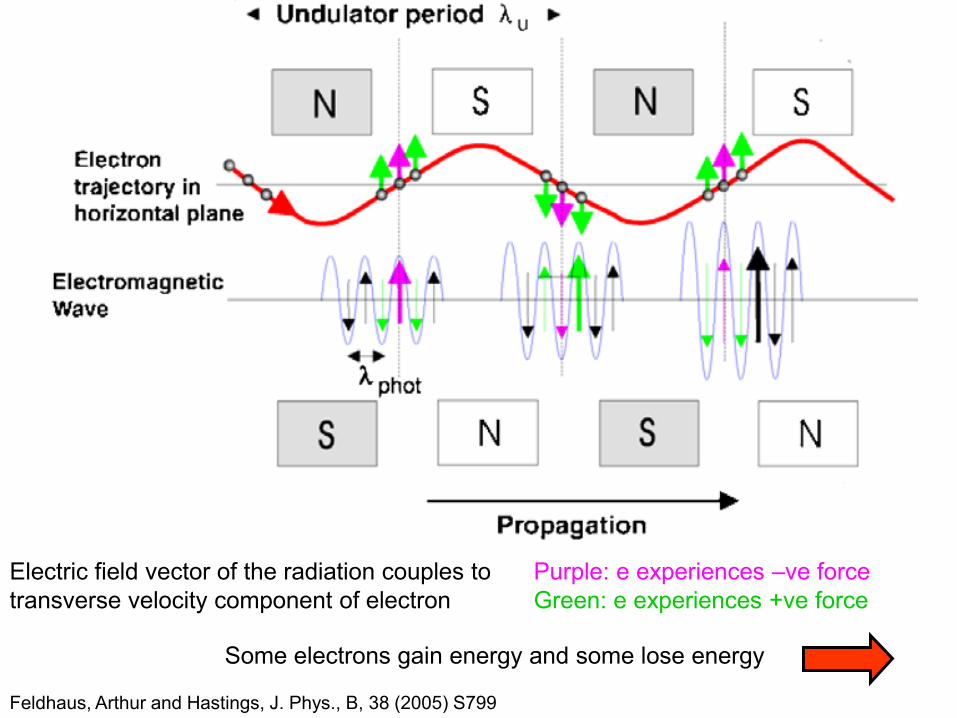
Feldhaus, Arthur and Hastings, J. Phys., B, 38 (2005) S799
Electric field vector of the radiation couples to
transverse velocity component of electron
Purple: e experiences –ve force
Green: e experiences +ve force
Some electrons gain energy and some lose energy
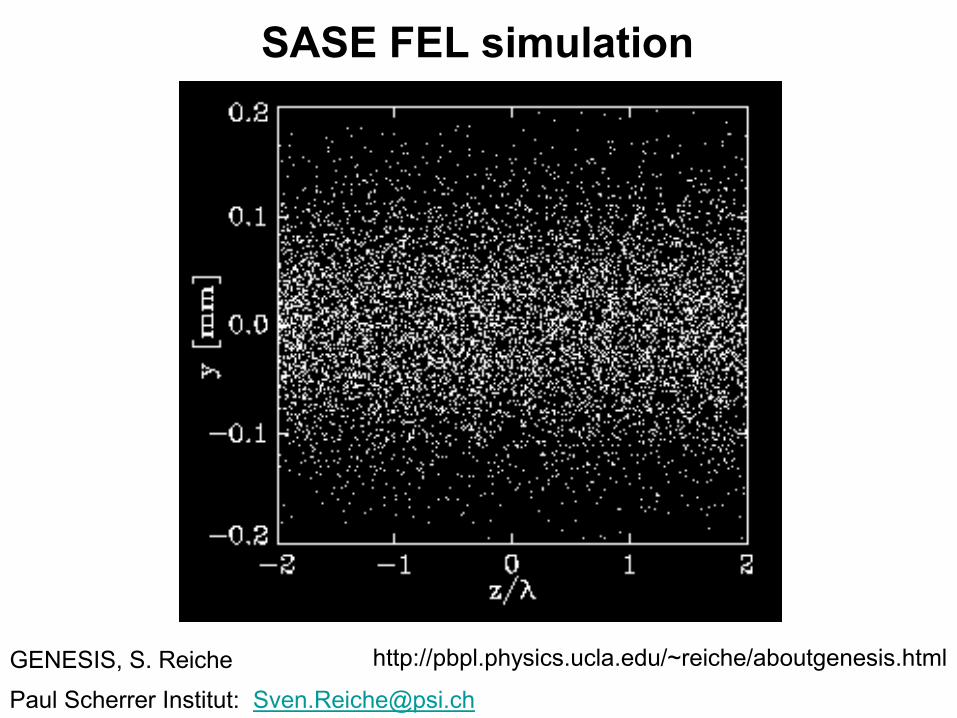
GENESIS, S. Reiche
SASE FEL simulation
Paul Scherrer Institut: [email protected]
http://pbpl.physics.ucla.edu/~reiche/aboutgenesis.html
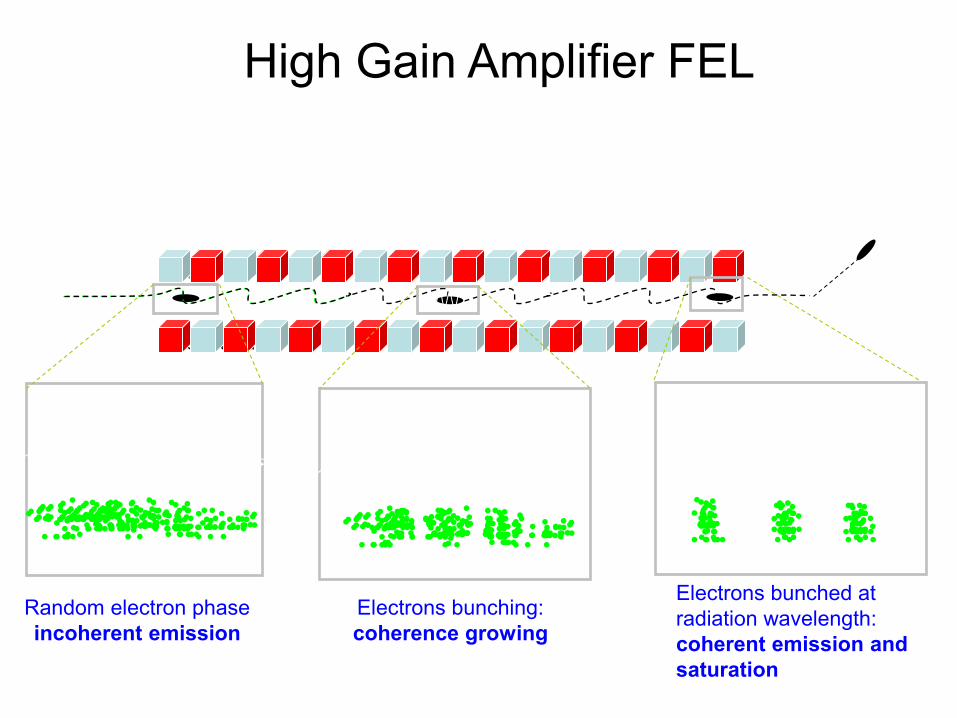
optical pulse
Electrons bunching:
coherence growing
Random electron phase
incoherent emission
Electrons bunched at
radiation wavelength:
coherent emission and
saturation
High Gain Amplifier FEL
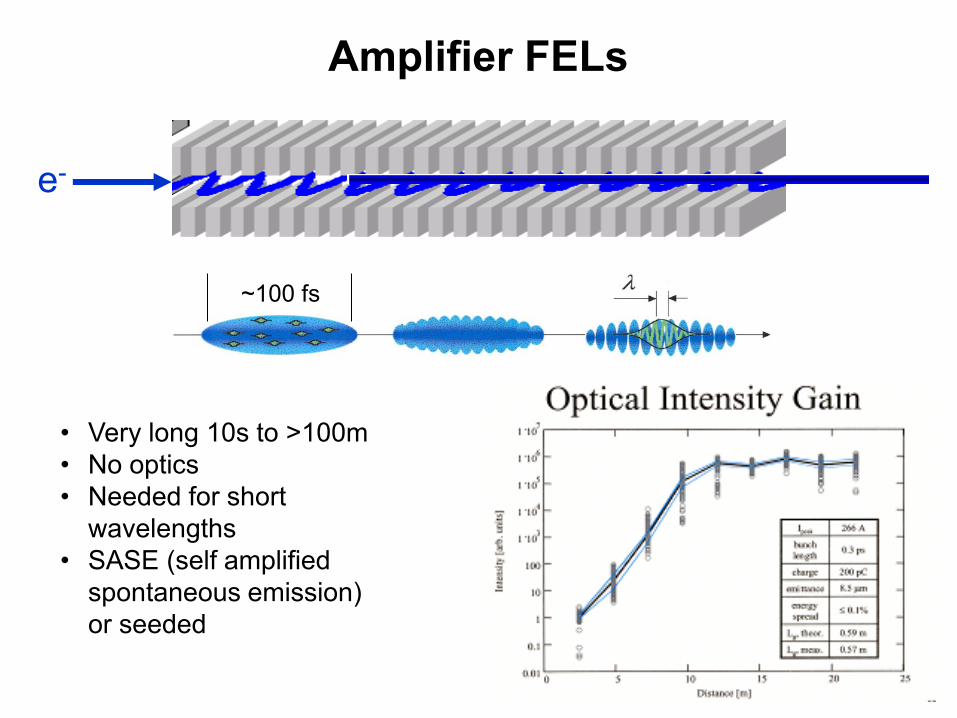
Amplifier FELs
e-
~100 fs
• Very long 10s to >100m
• No optics
• Needed for short
wavelengths
• SASE (self amplified
spontaneous emission)
or seeded
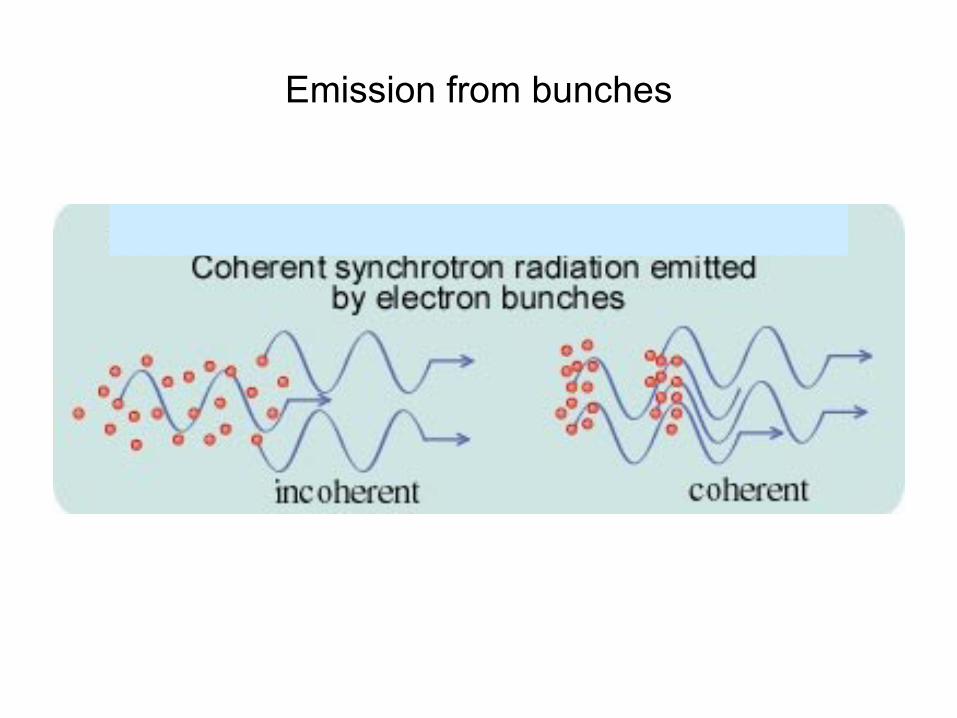
Emission from bunches
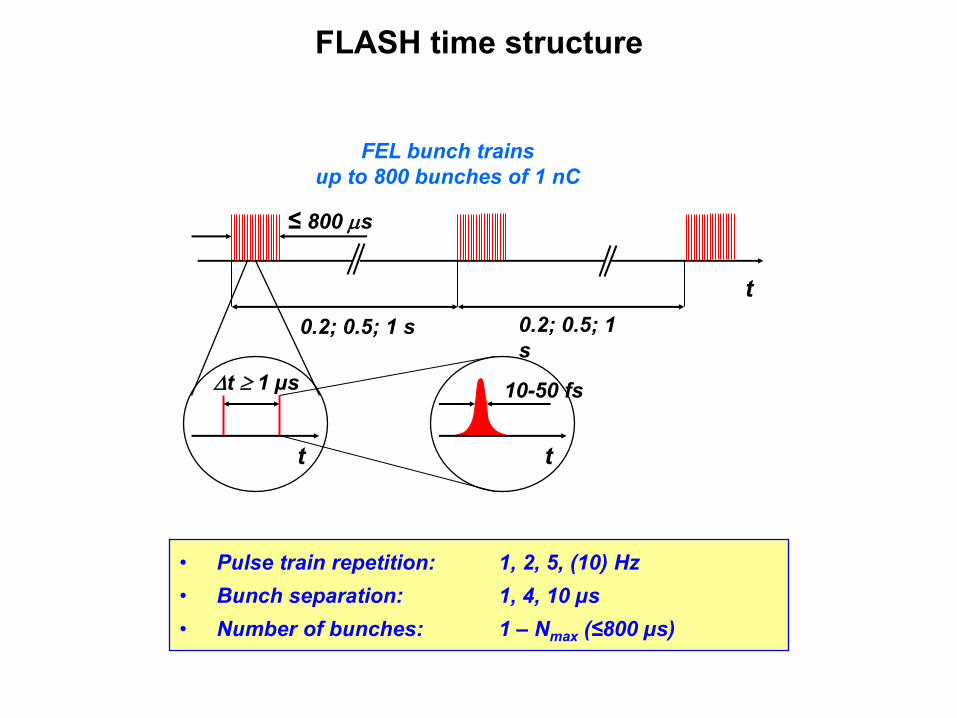
0.2; 0.5; 1 s
t
FEL bunch trains
up to 800 bunches of 1 nC
0.2; 0.5; 1
s
Dt 1 µs
t
≤ 800 s
t
10-50 fs
• Pulse train repetition: 1, 2, 5, (10) Hz
• Bunch separation: 1, 4, 10 µs
• Number of bunches: 1 – Nmax (≤800 µs)
FLASH time structure