philippines economic update: investing in...
TRANSCRIPT
PHILIPPINES ECONOMIC UPDATE:
INVESTING IN THE FUTURE
April 2018
Macroeconomics, Trade and Investment Global Practice
East Asia and Pacific Region

I
PREFACE The Philippines Economic Update summarizes key economic and social developments, important policy changes, and the evolution of external conditions over the past six months. It also presents findings from recent World Bank analysis, situating them in the context of the country’s long-term development trends and assessing their implications for the country’s medium-term economic outlook. The update covers issues ranging from macroeconomic management and financial-market dynamics to the complex challenges of poverty reduction and social development. It is intended to serve the needs of a wide audience, including policymakers, business leaders, private firms and investors, and analysts and professionals engaged in the social and economic development of the Philippines. The Philippines Economic Update is a biannual publication of the World Bank’s Macroeconomics, Trade, and Investment Global Practice (MTI), prepared in partnership with the Poverty & Equity, Finance, Competitiveness & Innovation, and Social Protection & Labor Global Practices (GPs). Birgit Hansl (Lead Economist and Program Leader) and Ndiame Diop (Practice Manager for the MTI GP) guided the preparation of this edition. The team consisted of Kevin Chua (Economist), Kevin Cruz (Research Analyst) and Rong Qian (Senior Economist) from the MTI GP, Isaku Endo (Senior Financial Sector Specialist) from the Finance, Competitiveness and Innovation GP, Gabriel Demombynes (Program Leader), Xubei Luo (Senior Economist) and Sharon Faye Alariao Piza (Economist) from the Poverty & Equity GP. Thilakaratna Ranaweera (Consultant) provided technical support on the growth projection. The report was edited by Oscar Parlback (Сonsultant), and the graphic designer was Robert Waiharo (Сonsultant). Peer reviewers were Jasmin Chakeri (Program Leader, LCC1C) and Yutaka Yoshino (Lead Economist and Program Leader, AFCE1). Logistics and publication support were provided by Maria Consuelo Sy (Program Assistant). The Manila External Communications Team, consisting of David Llorito (Communications Officer) prepared the media release, dissemination plan, and web-based multimedia presentation. The team would like to thank Mara Warwick (Country Director for Brunei, Malaysia, Philippines and Thailand) for her advice and support. The report benefited from the recommendations and feedback of various stakeholders in the World Bank as well as from the government, the business community, labor associations, academic institutions, and civil society. The team is very grateful for their contributions and perspectives. The findings, interpretations, and conclusions expressed in the Philippines Economic Update are those of the World Bank and do not necessarily reflect the views of the World Bank’s executive board or any national government. This report went to press on April 13, 2018. If you wish to be included in the email distribution list for the Philippines Economic Update and related publications, please contact Maria Consuelo Sy ([email protected]). For questions and comments regarding the content of this publication, please contact Birgit Hansl ([email protected]). Questions from the media should be addressed to David Llorito ([email protected]). For more information about the World Bank and its activities in the Philippines, please visit www.worldbank.org/ph.

II
ABBREVIATIONS AND ACRONYMS
2TBA Two-tier budgeting approach
BOP Balance of payments
BPO Business process outsourcing
BSP Bangko Sentral ng Pilipinas
CALABARZON Cavite, Laguna, Batangas, Rizal, and Quezon
CPI Consumer price index
FDI Foreign direct investment
GOCC Government-owned and controlled corporation
IT Information technology
PREXC Program expenditure classification
TFP Total factor productivity
TRAIN Tax Reform for Acceleration and Inclusion
TVET Technical and vocational education and training
UACS Unified accounts code structure
VA Value added

III
Table of Content PREFACE ........................................................................................................................................... I
List of Figures ................................................................................................................................. III
List of Tables ................................................................................................................................... V
List of Boxes ................................................................................................................................... VI
EXECUTIVE SUMMARY .................................................................................................................. VII
Part I: RECENT ECONOMIC AND POLICY DEVELOPMENTS ......................................................... 1
1.1 Growth: Benefitting from the Global Recovery ............................................................... 2
1.2 The Exchange Rate and the External Sector: Impacts from an Improving External Environment................................................................................................................................ 6
1.3 Financial Markets and Monetary Policy: Keeping the Policy Rate Steady despite Rising Inflation ..................................................................................................................................... 10
1.4 Fiscal Policy: Preparing for the Public Investment Increase .......................................... 12
1.5 Employment and Poverty: A Tight Labor Market with Limited Real Wage Growth ...... 16
Part II: OUTLOOK AND RISKS...................................................................................................... 21
2.1 Growth Outlook .............................................................................................................. 22
2.2 Poverty and Shared Prosperity Outlook ........................................................................ 29
2.3 Risks and Policy Challenges ............................................................................................ 30
Part III: THE MISSING LINKS TO HIGHER SHARED PROSPERITY IN THE PHILIPPINES .............. 34
3.1 Introduction.................................................................................................................... 35
3.2 Drivers of Poverty Reduction ......................................................................................... 37
3.3 The Remaining Challenge: Low-quality Jobs and Slow Real Wage Growth ................... 39
3.4 The Importance of Education in Labor Market Participation and Wage Growth .......... 44
3.5 Conclusion ...................................................................................................................... 49
References .................................................................................................................................... 51
List of Figures
Figure 1: Strong Exports Contributed to Growth among Regional Peers in 2017 … ...................... 2
Figure 2: … and Helped Sustain Growth in the Philippines ............................................................ 2
Figure 3: In the Philippines, Exports Drove Growth While Investment Significantly Slowed … ..... 3
Figure 4: … While Manufacturing Expanded and Agriculture Recovered ...................................... 3
Figure 5: Average capacity utilization in the manufacturing sector has reached historic highs in early 2018. ...................................................................................................................................... 5

IV
Figure 6: In 2017, the Peso Has Depreciated in Both Nominal and Real Terms… .......................... 7
Figure 7: … Making It One of the Worst Performing Regional Currencies ..................................... 7
Figure 8: Recovery in the External Environment Supported the Growth in Exports in 2017 ... ..... 9
Figure 9: … Yet Continued Higher Import Growth Led to a Widening Current Account Deficit .... 9
Figure 10: Exports of Electronics (index, 2010 = 100) .................................................................. 10
Figure 11: Inflation Rose Sharply and Surpassed in March 2018 the Ceiling of the Central Bank’s Target Range ................................................................................................................................. 11
Figure 12: Credit Has Sustained Its Double-digit Growth Rates ................................................... 11
Figure 13: National Government Fiscal Balance, 2013-17 ............................................................ 12
Figure 14: Fiscal Balance, Percent of GDP, 2000-17 ..................................................................... 13
Figure 15: Public Expenditures as a Share of Nominal GDP 2013-17 ........................................... 13
Figure 16: Public Expenditures by Economic Classification (Actual Disbursements), Percent of Total Expenditures, 2013-17 ......................................................................................................... 14
Figure 17: Public Expenditures by Functional Classification (Obligation Basis), Percent of Total Expenditures, 2013-17 .................................................................................................................. 14
Figure 18: Government Revenue Efforts, 2006-16 ....................................................................... 15
Figure 19: Tax Revenue Efforts, 2006-16 ...................................................................................... 15
Figure 20: The Government Financed Its Deficit through Domestic Borrowing .......................... 16
Figure 21: The Overall Debt-to-GDP Ratio Remained Unchanged from 2016 to 2017 ................ 16
Figure 22: The Unemployment Rate Remained Around 5 percent ... .......................................... 18
Figure 23: … While the Labor Force Participation Rate Remained Below the 10-year Average .. 18
Figure 24: Changes in Real Daily Wages, 2007-17 ........................................................................ 19
Figure 25: The Philippine Economy is Projected to Grow at 6.7 percent in 2018 and 2019. ....... 22
Figure 26: Global Economic Growth, 2000-20 .............................................................................. 24
Figure 27: Output Gaps, 2000-18.................................................................................................. 24
Figure 28: The Largest Share of Domestic Bank Credit is Channeled to Real Estate and Construction. ................................................................................................................................. 29
Figure 29: The Manufacturing and Finance Sectors are among the Favorite Destinations of Foreign Direct Investment. ........................................................................................................................ 29
Figure 30: Sustained Economic Growth Makes It Likely That Poverty Reduction Will Continue . 30
Figure 31: Selected Macroeconomic Indicators ........................................................................... 32
Figure 32: National Poverty Rates and Number of Poor .............................................................. 35
Figure 33: Poverty Trends Based on National and International Poverty Lines ........................... 35
V
Figure 34: Prosperity Improvement in the Philippines Compared to the East Asia Pacific Region....................................................................................................................................................... 36
Figure 35: Contribution of Income Sources to Poverty Reduction, 2006–2015 ........................... 38
Figure 36: Millions of Workers Transitioned out of Agriculture ................................................... 38
Figure 37: Greater Earnings in Services and Manufacturing than in Agriculture ......................... 38
Figure 38: Poverty Rate by Employment Sector of Household Heads ........................................ 40
Figure 39: Poverty Rate by Employment Status of Household Heads .......................................... 40
Figure 40: Working-age Population, Labor Force, and Employment Growth .............................. 41
Figure 41: GDP, Employment, and Real Wage Growth ................................................................ 41
Figure 42: Share of Employment of the Poor by Sector ............................................................... 42
Figure 43: Share of Employment of an Average Filipino by Sector .............................................. 42
Figure 44: Intersectoral Labor Allocation in Select East Asian Countries ..................................... 42
Figure 45: Countries Changes in the Composition of Employment Status Over Time ................. 44
Figure 46: Rate of Return for Another Year of Education ............................................................ 45
Figure 47: Rate of Return for Education by Education Level ........................................................ 45
Figure 48: Marginal Effect on the Probability of Wage Employment with an Additional Year of Schooling by Gender and Location ............................................................................................... 46
Figure 49: Marginal Effect on the Probability of Wage Employment with an Additional Year of Schooling by Education Level ........................................................................................................ 46
Figure 50: Youth (20–29 years old) Education Levels Across Income Groups .............................. 47
Figure 51: Educational Attainment Rate among 22–24 Year-olds by Income Quintiles, 2006-15 48
Figure 52: Educational Attainment Rate among 22–24 Year-olds by Gender, 2006-15 .............. 48
Figure 53: Reasons for Not Attending Elementary School among 6- to 11-Year-olds in the Poorest Quintile, 2014................................................................................................................................ 48
Figure 54: Reasons for Not Attending High School among 12- to 15-Year-olds in the Poorest Quintile, 2014................................................................................................................................ 48
List of Tables
Table 1: Balance of Payments, 2014-17 .......................................................................................... 8
Table 2: Real GDP Growth Rates, 2015-2020 ............................................................................... 24
Table 3: Economic indicators for the Baseline Projection ............................................................ 28
Table 4. Poverty Rate in Selected East Asian Countries ............................................................... 36

VI
Table 5. Employment and Earnings Status, Percent ..................................................................... 43
Table 6. Employment, Unemployment, and Daily Earnings by Educational Attainment, Perent 44
List of Boxes
Box 1. The Global Economy is Experiencing a Broad-based and Maturing Cyclical Recovery ....... 5
Box 2: Electronics Export Growth in the East Asia Pacific Region .................................................. 9
Box 3: Recent Public Expenditure Profile of the Philippines ........................................................ 13
Box 4: Public Revenue in the East Asia Pacific Region .................................................................. 15
Box 5: Building Human Capital through the K-12 Basic Education Program ................................ 19
Box 6: The Global Economic Outlook............................................................................................ 23
Box 7: Initiatives to Modernize the Budgeting Process ................................................................ 26
Box 8: The Next Steps for the Government’s Tax Reform Program. ............................................ 33

VII
EXECUTIVE SUMMARY In 2017, the Philippines was among the top three growth performers in the East Asia region. Only Vietnam and China performed better. The Philippines growth performance slightly weakened in 2017 to 6.7 percent year-on-year from 6.9 percent in 2016. Growth was anchored in strong exports, while investment growth significantly slowed and consumption growth moderated. The Philippines’ annual exports rose sharply in 2017 and became the main engine of economic growth, while imports continued to grow by double-digits. Investment growth slowed in 2017, following two consecutive years of rapid expansion, and climbing inflation slowed real wage growth and contributed to a moderation in private consumption growth.
Monetary and fiscal policy remained accommodative. Both fiscal expenditure and revenue increased in 2017 compared to 2016. The fiscal deficit narrowed, as the government narrowly missed its expenditure target, despite improved budget execution. Infrastructure expenditures exceeded their programmed target, and focused on repair and rehabilitation projects, while most of the planned flagship investment program has not started construction yet. Revenue collection in the Philippines is still among the lowest in the region, but as a key revenue mobilization policy, the Philippines successfully passed its first package of tax reforms in December 2017, which is estimated to generate an additional Php82.3 billion in public revenue in 2018. Rising inflation started to put a strain on the Bangko Sentral ng Pilipinas’ (BSP) accommodative monetary policy in 2017, and the inflation rate exceeded the ceiling of the inflation target range in early 2018. Nonetheless, the BSP’s monetary board kept the policy rate fixed at 3.0 percent.
The country’s medium-term growth outlook remains positive. The Philippine economy is projected to continue on its expansionary path and grow at an annual rate of 6.7 percent in both 2018 and 2019. In 2020, growth is expected to level at 6.6 percent. The economy is currently growing at its potential, making productive investment in physical and human capital essential for the economy to continue to grow along its current growth trajectory. Investment growth hinges on the government’s ability to effectively and timely implement its ambitious public investment program.
Domestic risks are becoming more prominent. Inflationary pressure is expected to intensify in 2018 due to both domestic and external factors. The Philippine economy is also at risk of overheating. The implementation of the public infrastructure program is vital to the country’s growth outlook, as private investment is expected to weaken. Prudent fiscal management and the implementation of the government’s tax reform agenda could help secure the country’s fiscal sustainability. External risks remain present, especially a faster-than-expected policy normalization in advanced economies that could trigger financial volatility and increase capital outflows from the Philippines. Renewed protectionist sentiments in several advanced economies will also elevate policy uncertainty, which may disrupt trade and investments.
High-quality jobs and faster growth of real wages are essential to achieve shared prosperity and inclusive growth. In recent years, the Philippine economy has made great strides in delivering inclusive growth, evidenced by the declining poverty rates and a falling Gini coefficient. Unemployment has reached historic low rates, but underemployment remains high, near its 18-

VIII
20 percent decade-long average. More importantly, unlike its high-performing East Asian neighbors with booming manufacturing sectors that provide large numbers of labor-intensive jobs, a majority of Filipino workers that transition out of agriculture generally end up in low-end service jobs. Thus, while employment increased between 2006 and 2015, mean wages remained stagnant, with only a four percent increase in real terms over the same period. High-quality jobs and faster growth of real wages are the missing links to higher shared prosperity. More can be done to create high-quality jobs in the Philippines. Delivering inclusive economic growth through better-paying jobs remains the country’s most pressing challenge. The government needs to affirm its commitment to structural reforms that promote competition, secure property rights, lessen regulatory complexities, and improve the country’s investment climate. Investing in the future means prioritizing investment in both physical infrastructure and human capital, such as in education, skills, and health, as this will create better employment opportunities, especially among the poor.

1
Part I: RECENT ECONOMIC AND POLICY DEVELOPMENTS The Philippines’ growth performance slightly weakened in 2017 to 6.7 percent year-on-year from 6.9 percent year-on-year in 2016. The country’s main growth driver was stronger external demand due to the ongoing global recovery. Philippine exports expanded by 19.2 percent year-on-year in 2017 - the highest rate since 2010 - and nearly doubled its 10.7 percent year-on-year growth in 2016. Consumption growth remained strong, close to its seven-year average, but moderated because of higher inflation in 2017. Investment growth slowed significantly in 2017, with fixed capital formation growing at 10.3 percent year-on-year in 2017 compared to 25.2 percent year-on-year in 2016. Monetary policy remained accommodative, as the key policy rate has been maintained at 3.0 percent since June 2016, while the reserve requirement ratio was lowered by one percentage point in March 2018. Fiscal policy remained consistent with the government’s policy to increase human capital and infrastructure investments. However, a faster-than-expected normalization of global policy rates and concerns over a growing current-account deficit in the Philippines diminished investors’ appetite for Philippine assets, leading to capital outflows and a continued weakness in the exchange rate. Nevertheless, sustained economic growth in recent years made it likely that poverty continued to decline, but recent inflation trends might adversely impact the poor.

2
1.1 Growth: Benefitting from the Global Recovery
In 2017, the Philippines was among the top three growth performers in the region, with an annual GDP growth rate of 6.7 percent. The country’s economic growth was anchored in strong exports, while investment growth significantly slowed and consumption growth moderated. 1. The ongoing global economic recovery has raised the demand for Philippine exports, which constituted the country’s main driver of economic growth in 2017. A maturing, broad-based cyclical recovery in advanced economies and a long-awaited rebound in global investment, trade, and manufacturing (Box 1) resulted in favorable external demand conditions that led to more vibrant export activities in the region. As with regional peers such as China, Vietnam, and Malaysia (Figure 1), the Philippines experienced a surge in exports, which partly compensated for the significant fall in domestic demand, especially for investment. As a result, its annual GDP growth rate fell slightly from 6.9 percent in 2016 to 6.7 percent in 2017. Despite a continued inflow of remittances, private consumption growth moderated as inflation continued to climb, limiting real wage growth. Compared to 2016, the Philippines fell by two ranks in the regional growth table in 2017, with China and Vietnam taking over the top ranks (Figure 2).
Figure 1: Strong Exports Contributed to Growth among Regional Peers in 2017 …
Figure 2: … and Helped Sustain Growth in the Philippines
Source: World Bank staff calculations, Haver Analytics, 2015-2017 data.
Source: World Bank staff calculations. Note: Countries in developing East Asia, excluding China, are the Philippines, Indonesia, Malaysia, Thailand, and Vietnam.
2. The Philippines’ annual exports rose sharply in 2017 and became the main engine of economic growth, while imports continued to grow by double-digits. The export growth rate nearly doubled from 10.7 percent year-on-year in 2016 to 19.2 percent year-on-year in 2017 - the highest level since 2010 when exports rose by 21.0 percent year-on-year (Figure 3).1 The country’s strong export performance was fueled by a rebound in the exports of electronics
1 The discussion of net exports in this section assesses values at constant 2000 prices. This differs from the discussion in the balance of payments section, where net exports are assessed based on values at current prices.

3
components – its main export commodities, which grew by 27.5 percent year-on-year, more than three times the growth rate in 2016.2 In particular, the growth in the exports of semiconductor components accelerated from 25.8 percent year-on-year in 2016 to 41.8 percent year-on-year in 2017. The export of electronics components also drove the import of intermediary electronics goods, which grew from 34.0 percent year-on-year in 2016 to 35.2 percent year-on-year in 2017. Overall, the annual import growth rate of 17.6 percent in 2017 remained close to the 2016 level of 18.5 percent.
Figure 3: In the Philippines, Exports Drove Growth While Investment Significantly Slowed …
Figure 4: … While Manufacturing Expanded and Agriculture Recovered
Source: PSA. Source: PSA.
Note: Other industries are mining and quarrying, construction, electricity, gas, and water.
3. Consumption growth, the country’s second engine of economic growth, moderated in 2017. The annual consumption growth rate decelerated from 7.1 percent in 2016 to 6.0 percent in 2017 - close to its seven-year average of 5.8 percent. It was supported by a sustained credit expansion, which benefitted from a continued accommodative monetary policy stance by the Bangko Sentral ng Pilipinas (BSP).3 Private consumption was also supported by a robust growth in remittances from overseas Filipinos from 4.9 percent year-on-year in 2016 to 5.3 percent year-on-year in 2017, totaling US$31.3 billion, or 10.3 percent of GDP in 2017. However, a rising inflation rate gradually weakened consumer sentiment, and a slightly higher unemployment rate likely contributed to a slowdown in private consumption growth in 2017. The annual public consumption growth rate also fell from 8.4 percent in 2016 to 7.3 percent in 2017.4
2 The growth of agricultural exports, driven by the exports of coconut and sugar products, rose from 1.8 percent year-on-year in 2016 to 9.3 percent year-on-year in 2017, as the agriculture sector recovered in 2016. 3 The BSP kept the policy rate unchanged at 3.0 percent in 2017, which maintained low interest rates and contributed to a double-digit expansion in consumer loans in 2017. 4 Domestic spending in 2016 was supported by election-related government spending.

4
4. Investment growth moderated in 2017, following two consecutive years of rapid expansion. Fixed capital formation decelerated from growing by 25.2 percent year-on-year in 2016 to 10.3 percent year-on-year in 2017, as investment growth in durable equipment and construction declined sharply. Investment in durable equipment expanded by 12.2 percent year-on-year in 2017, significantly less than the 34.5 percent year-on-year in 2016, while construction investment growth slowed from 15.1 percent year-on-year in 2016 to 5.7 percent year-on-year in 2017. The annual public construction growth rate fell from 28.0 percent in 2016 to 13.5 percent in 2017, which was likely partly the result of a base effect from the increase in public capital spending during the pre-election period in 2016. Moreover, private construction, which account for nearly three-fourths of all investments in the construction sector, expanded at a much slower pace in 2017 (3.3 percent year-on-year) compared to 2016 (11.5 percent year-on-year). 5. The manufacturing sector grew for a second consecutive year, surpassing the growth performance of the services sector. While growth in the industry sector was robust, it moderated from 8.4 percent year-on-year in 2016 to 7.2 percent year-on-year in 2017 (Figure 4). The manufacturing sector, specifically communication equipment production, food manufacturing, and chemical production, continued to fuel output growth and grew from 7.0 percent year-on-year in 2016 to 8.6 percent year-on-year in 2017.5 While manufacturing output growth (i.e. the volume of production index) was negative in the latter half of 2017, it expanded rapidly in January and February of 2018 (Figure 5). Together with increasing capacity utilization levels, this raises the risk of overheating in the economy (see Part II. Outlook and Risks).6 The services sector constituted another strong growth performer in 2017 and expanded by 6.7 percent year-on-year in 2017, down from 7.4 percent year-on-year in 2016. In the services sector, financial services exhibited the strongest growth and expanded slightly from 7.6 percent year-on-year in 2016 to 7.7 percent year-on-year in 2017.7 6. Following a contraction in 2016, the agriculture sector recovered in 2017 due to favorable weather conditions. The country’s agriculture sector grew by 3.9 percent year-on-year in 2017, reversing a contraction of 1.3 percent year-on-year in 2016. The recovery was primarily the result of a low base in 2016 and more favorable weather conditions for farm output.8 Despite the sector’s recent recovery, it remains vulnerable to weather-related shocks that continue to cause volatility and reduce farm output. For example, damages from typhoon Urduja, which struck the country in December 2017, reached an estimated Php1.0 billion, affecting the
5 However, the mining, construction, and utilities sectors registered lower growth in 2017. 6 Manufacturing output growth in early 2018 was mainly driven by the production of food, petroleum product, and electrical machinery, the last of which, could lead to the expansion of productive capacity. 7 Similarly, wholesale and retail trade, government services subsectors, and real estate all supported the growth in services, with each expanding by more than 7 percent year-on-year in 2017. Wholesale and retail trade grew from 7.2 percent year-on-year in 2016 to 7.1 percent year-on-year in 2017; government services grew from 7.2 percent year-on-year in 2016 to 7.6 percent year-on-year in 2017; and the real estate sector grew at an annual rate of 7.5 percent in 2017, down from 8.9 percent in 2016. 8 The fisheries subsector contracted in 2017 because of supply disruptions, attributed to the limited fishing operations in Zamboanga peninsula in the third quarter, a fishing ban in the Visayas sea that allowed for fish spawning in November and December, and weather disturbances from May to September. The livestock subsector grew at a weaker rate of 1.1 percent year-on-year in 2017, down from 4.6 percent year-on-year in 2016.

5
livelihood of 38,466 farmers and damaging 23,829 metric tons of farm output. 9 A positive development in the agriculture sector is the continued diversification of farm produce into high value export crops such as coconut, coffee, and cacao, which is reflected in growing agricultural exports.
Figure 5: Average capacity utilization in the manufacturing sector has reached historic highs in early 2018.
Source: PSA.
Box 1. The Global Economy is Experiencing a Broad-based and Maturing Cyclical Recovery
The recovery in the global economy went hand in hand with a rebound in investment, manufacturing, and trade. This economic recovery came against the backdrop of benign global financing conditions, generally accommodative public policies, rising confidence, and firming commodity prices. The global GDP growth rate increased from 2.4 percent in 2016 to 3.1 percent in 2017, above the June forecast of 2.7 percent. The economic upturn is broad-based, with growth increasing in more than half of the world’s economies. In particular, the rebound in global investment growth—which accounted for three quarters of the acceleration in global GDP growth from 2016 to 2017—was supported by favorable financing costs, rising profits, and improved business sentiment across both advanced and emerging market and developing economies. This synchronous, investment-led recovery provided a substantial boost to global exports and imports.
In 2017, the GDP growth rate in advanced economies rebounded to an estimated average of 2.2 percent year-on-year, driven by a pickup in capital spending, a turnaround in inventories, and strengthening external demand. The pickup in investment reflected increased capacity utilization, favorable financing conditions, and rising profits and business sentiment. Confidence was supported by the fact that policy uncertainty, albeit still elevated, diminished during the year. While growth accelerated in all major economies, the improvement was markedly stronger than expected in the Euro Area.
9 Geronimo, J. (2017).

6
The average GDP growth rate among emerging market and developing economies accelerated to an estimated 4.4 percent year-on-year in 2017, reflecting firming activity in commodity exporters and continued solid growth in commodity importers. Most emerging market and developing regions benefited from a recovery in exports, as commodity exporters benefited from key economies—such as Brazil and the Russian Federation—emerging from a recession, a rise in commodity prices, improved confidence, diminishing drag from earlier policy tightening measures, and a bottoming out of investment growth after a prolonged period of slow growth. Nonetheless, growth among commodity exporters, estimated at an average of 1.8 percent year-on-year in 2017, was still subdued and insufficient to improve average per capita income, which continued to stagnate after two consecutive years of contraction
Global goods trade volumes have gathered significant momentum since mid-2016, following two years of pronounced weakness. A cyclical rebound in investment contributed to a strong growth in the trade of machinery, electronics, and semiconductors. Global trade growth is estimated to have reached a stronger-than-expected 4.5 percent year-on-year in 2017, as import demand recovered in both advanced economies and emerging market and developing economies. The recovery in global trade has been closely linked to the cyclical upturn in global manufacturing, which in turn was encouraged by an increase in capital spending.
Source: World Bank (2018a), World Bank (2018c), and World Bank (2018d).
1.2 The Exchange Rate and the External Sector: Impacts from an Improving External Environment
A favorable external environment supported export growth but also prompted interest rate hikes in advanced economies in 2017. A faster-than-expected global policy rate normalization and concerns over a growing current-account deficit in the Philippines diminished investors’ appetite for Philippine assets, leading to capital outflows and continued weakness in the exchange rate.
7. The peso experienced heightened volatility in 2017, weakening for most of the year, except in the second quarter and the end of the year when remittances increased. Robust import demand for raw materials and intermediate goods contributed to a rise in demand for US dollars. Increasing capital outflows weakened the exchange rate as a faster-than-expected global policy rate normalization and concerns over a growing current-account deficit in the Philippines diminished investors’ appetite for Philippine assets. As a result, the Philippine peso depreciated in nominal terms by 6.1 percent year-on-year, from an average of Php/US$ 47.51 in 2016 to an average of Php/US$ 50.40 in 2017 (Figure 6). In February 2018, the peso reached its weakest point in twelve years, breaching the Php/US$ 52.00 level, after having ended 2017 just below the Php/US$ 50.00 mark. The real effective exchange rate depreciated by an average of 4.1 percent year-on-year in 2017, more than the average 3.6 percent year-on-year depreciation in 2016.10 This made the peso, along with the Indonesian rupiah, the weakest currency among regional peers (Figure 7), although it may have supported the price-competitiveness of Philippine exports.
10 In real terms, the peso depreciated from 4.1 year-on-year in March 2017 to 6.3 percent year-on-year in March 2018, weakening the real effective exchange rate to Php/US$ 81.34.

7
Figure 6: In 2017, the Peso Has Depreciated in Both Nominal and Real Terms…
Figure 7: … Making It One of the Worst Performing Regional Currencies
Source: BSP. Note: Decrease denotes depreciation.
Source: World Bank staff calculations.
8. The current account ran a higher deficit in 2017 than in 2016, as stronger services exports and remittance receipts could not offset a widening trade deficit (Table 1). The current-account deficit deteriorated from US$1.2 billion (0.4 percent of GDP) in 2016 to US$2.5 billion (0.8 percent of GDP) in 2017, as the merchandise trade deficit widened from 11.7 percent of GDP in 2016 to 13.1 percent in 2017 (Figure 8).11 In 2017, annual import growth of 14.2 percent outstripped healthy export growth of 12.8 percent. However, the growth of imports was higher in 2016 (17.7 percent year-on-year),12 while export growth rebounded from a contraction of 1.1 percent in 2016.13 The weakening trade balance was also not offset by stronger net services exports, which grew at 34.8 percent year-on-year in 2017, supported by strong receipts from the tourism and information technology-business process outsourcing (IT-BPO) industries.14 The flow of personal remittances from overseas Filipinos totaled US31.3 billion in 2017 and grew from 4.9
11 The discussion of net exports in this section assesses values at current prices. This differs from the discussion of net exports in the growth section, where net exports assess values at constant 2000 prices. 12 The import of raw materials and intermediate goods grew from an annual rate of 5.2 percent in 2016 to 11.3 percent in 2017, as intermediate inputs are re-processed and exported abroad. Nonetheless, softer domestic demand significantly moderated the growth of imported capital goods from an annual rate of 46.6 percent in 2016 to 4.2 percent in 2017, and consumer goods from 30.1 percent in 2016 to 8.4 percent in 2017. The country’s international reserves declined, and import coverage shrank from an average of 9.7 months in 2016 to 8.4 months in 2017. In 2017, ASEAN, China, Japan, South Korea, and the United States were the Philippines’ major import partners, while ASEAN, Japan, the United States, Hong Kong, and China were the country’s major export partners. 13 The recovering external demand from advanced economies raised the country’s electronic exports, which accounted for more than half of the export bill and contributed to about two-thirds of export growth (Box 2). 14 Data from the Department of Tourism showed that total visitors to the country increased by almost 11.0 percent to 6.6 million in 2017, which exceeded the administration’s 6.5 million target under its National Tourism Development Plan for 2016-2022. In 2017, earnings from BPO services amounted to US$22.1 billion,they grew by 9.6 percent year-on-year.

8
percent year-on-year in 2016 to 5.3 percent year-on-year in 2017, despite political uncertainties in the Middle East15 - the country’s second largest source of remittances after the United States.
Table 1: Balance of Payments, 2014-17
9. Spurred by net portfolio and other investment outflows, the annual balance of payments (BOP) deficit more than doubled in 2017 (Figure 9). The country’s overall BOP deficit widened from US$0.4 billion (0.1 percent of GDP) in 2016 to US$0.9 billion (0.3 percent of GDP) in 2017. While portfolio and other investment net capital outflows amounted to US$3.9 billion and US$2.0 billion, respectively, foreign direct investment (FDI) increased by 21.4 percent year-on-year and totaled US$10.0 billion in 2017. This was the highest level of net FDI ever recorded in the Philippines, which was driven by strong investments in domestic equity and debt instruments. Compared with neighboring countries in 2017, the Philippines’ net FDI as a share of GDP (3.2 percent) surpassed that of Malaysia (2.9 percent), Indonesia (2.2 percent), and Thailand (1.8 percent).
15 These political uncertainties arose from the continuing conflict in Syria and the diplomatic crisis between Qatar and its neighboring Arab states that started in June 2017. In February 2018, the Philippines issued a ban on deploying overseas Filipino workers in Kuwait, following a series of deaths and injury reports of Filipino workers in the Gulf state. However, the two countries are finalizing a bilateral agreement meant to lift the current ban.
In millions US$ / in percentage of GDP
2014 2015 2016 2017
Current account 10,756 3.8 7,266 2.5 (1,199) (0.4) (2,518) (0.8)
Goods (17,330) (6.1) (23,309) (8.0) (35,549) (11.7) (41,191) (13.1)
Services 4,576 1.6 5,455 1.9 7,043 2.3 9,496 3.0
Primary Income 727 0.3 1,857 0.6 2,579 0.8 3,094 1.0
Secondary Income 22,782 8.0 23,263 7.9 24,728 8.1 26,083 8.3
Capital and Financial accounts (9,523) (3.3) (2,216) (0.8) (113) (0.0) 2,265 0.7
Capital account 108 0.0 84 0.0 62 0.0 57 0.0
Financial account 9,631 3.4 2,301 0.8 175 0.1 (2,208) (0.7)
Direct investment 1,014 0.4 (100) (0.0) (5,883) (1.9) (8,110) (2.6)
Net acquisition of financial assets 6,754 2.4 5,540 1.9 2,397 0.8 1,939 0.6
Net incurrence of liabilities1/ 5,740 2.0 5,639 1.9 8,280 2.7 10,049 3.2
Portfolio investment 2,708 1.0 5,471 1.9 1,480 0.5 3,889 1.2
Financial derivatives 4 0.0 6 0.0 (32) (0.0) (51) (0.0)
Other investments 5,905 2.1 (3,076) (1.1) 4,610 1.5 2,064 0.7
Net unclassified items2/
(4,091) (1.4) (2,433) (0.8) 892 0.3 (610) (0.2)
Overall BOP position (2,858) (1.0) 2,616 0.9 (420) (0.1) (863) (0.3)
Memo:
Basic Balance 9,742 3.4 7,365 2.5 4,684 1.5 5,593 1.8 1/Net incurrence of l iabilities refers to net foreign direct investment to the Philippines.2/The term "Net unclassified items" is a balancing figure. There are two methods of computing the BOP position: the first approach uses the change in net international
reserves due to transactions, while the second approach computes the sum balances of the current account, capital account less financial account. The two measures
do not necessarily tally. The BSP uses the first approach to determine the overall BOP position.
Note: Following the BSP presentation, the BOP balance = Current Account Balance + Capital Account Balance - Financial Account Balance + Net Unclassified Items.

9
Figure 8: Recovery in the External Environment Supported the Growth in Exports in 2017 ...
Figure 9: … Yet Continued Higher Import Growth Led to a Widening Current Account Deficit
Source: PSA. Source: BSP.
Box 2: Electronics Export Growth in the East Asia Pacific Region
An investment-led global recovery has provided a substantial boost to global and regional manufacturing and trade. In 2017, global trade growth benefitted from an acceleration of the global GDP growth rate to around 3.0 percent year-on-year, reflecting investment-led growth in advanced economies and a cyclical recovery in commodity-exporting emerging market and developing economies. As a result, global trade growth is estimated to have reached a stronger-than-expected 4.5 percent year-on-year in 2017, following two years of slow growth. In the East Asia Pacific region, this was driven by a combination of a rise in commodity prices and the bottoming out of the global technology inventory cycle.
The global technological cycle increased exports of machinery, electronics, and integrated circuits. The rise in industrial production and the re-stocking of technology inventory (including mobile phones) were among the most significant determinants of export growth in 2017. 16 China (including Hong Kong), Malaysia, and the Philippines were among the top ten exporters of integrated circuits (with 38.0, 6.4, and 3.4 percent of total exports in 2016, respectively) and semiconductor devices (with 41.0, 8.5, 2.5 percent of total exports in 2016, respectively) in 2016. While their share in global markets is relatively low, exports of broadcasting equipment, computers, and other final electronic products represent more than 10 percent of total exports in Vietnam, Thailand, the Philippines, and Malaysia. These countries benefitted disproportionately from the recovery in the global trade cycle due to their competitiveness and established capacity.
As a result, electronics exports accelerated rapidly in the East Asia Pacific region in 2017, following a muted performance in 2016. The Philippines’ electronics export revenue growth accelerated from 1.0 percent in 2016 to 20.5 percent in 2017 due to a rise in the international demand for integrated circuits, computers, and other electronics, which represent more than half of the country’s merchandise export basket. Similarly, other countries in the EAP region recorded double-digit growth in electronics export revenue in 2017, such as Vietnam (19.5 percent), Thailand (18.4 percent), Malaysia (14.5 percent), and China (10.8 percent) (Figure 10).
16 Meanwhile, the inventory of technology goods in major export destinations accumulated during the recession years and finally reached its trough during the second half of 2015 and the first half of 2016. This start of the technology re-stocking cycle, partly fueled by the pickup in business investment in advanced economies and the anticipated launch of new mobile devices in the second half of 2017, helped boost Asia’s technology exports, including semiconductors and other mobile equipment components. Source: IMF (2017).

10
Figure 10: Exports of Electronics (index, 2010 = 100)
Source: World Bank; IMF WEO, and World Bank staff estimates.
Source: International Monetary Fund (2017), World Bank (2018d).
1.3 Financial Markets and Monetary Policy: Keeping the Policy Rate Steady despite Rising Inflation
In 2017, rising inflation started to put a strain on the BSP’s accommodative monetary policy, and the inflation rate surpassed in early 2018 the 4 percent ceiling of the inflation target range. Credit continued its rapid expansion in 2017 but eased in the fourth quarter.
10. Pressure from the rising inflation rate increased in 2017 while the key policy rate remained unchanged. Despite a newly rebased consumer price index (CPI) series,17 the headline inflation rate climbed from an average of 1.3 percent in 2016 to 2.9 percent in 2017, before reaching 4.3 percent in March 2018, which was beyond the ceiling of the BSP’ inflation target range (Figure 11). Food inflation drove almost half of the CPI inflation increase in 2017 because of higher prices of fish, meat, and fruit products. Energy prices rose in tandem with the global increase in crude oil prices and adjustments in local electricity prices. Excluding the volatile food and energy items, core inflation also rose sharply, partly due to the pass-through effect of a weaker peso. It could also indicate increasing demand side pressure due to the economy operating at its potential, which could be an early sign of the economy overheating. Despite rising domestic inflationary pressure and the three upward adjustments of the U.S. Federal Funds rate in 2017, the BSP monetary board kept the policy rate fixed at 3.0 percent throughout the year, while it lowered the reserve requirement ratio by one percentage point as of March 2, 2018.18
17 In March 2018, the Philippine Statistics Authority rebased the CPI series from 2006 as the base year to the new base year of 2012, changed the weights of the market basket with expenditure data from the 2012 Family Income and Expenditure Survey, and adopted the chain method in the 2012-based CPI series. 18 The BSP maintains that the 1 percentage-point reduction in the reserve requirement ratio was an operational adjustment to support its shift toward a more market-based implementation of monetary policy. The monetary board reaffirmed the BSP’s commitment to gradually reduce its reliance on reserve requirements for managing
0
50
100
150
200
250
300
350
2010 2011 2012 2013 2014 2015 2016 2017
China Vietnam Thailand Malaysia Philippines

11
11. Credit growth remained strong in 2017. Total credit growth accelerated from an annual average of 14.3 percent in 2016 to 17.8 percent in 2017, mirrored largely by a domestic liquidity (M3) increase from an average of 12.5 percent year-on-year in 2016 to an average of 13.2 percent year-on-year in 2017. Moreover, credit to firms grew from 13.5 percent year-on-year in 2016 to 17.4 percent year-on-year in 2017, while the growth in household loans was sustained at an annual rate of 20.3 percent in 2017, which was slightly lower than the 20.5 percent increase in 2016 (Figure 12). The sectoral composition of firms’ loan portfolios has remained broadly unchanged, as credit growth continued to favor the real estate and wholesale and retail trade sectors. Among consumption loans, the largest credit increase in 2017 was for motor vehicle loans, which grew at an annual rate of 24.6 percent (51.0 percent of total consumption loans), followed by a 19.1 percent (20.5 percent) annual increase in credit for salary-based loans and 16.5 percent (24.9 percent) for credit card debt.19 The credit-to-GDP ratio continued to steadily rise from an average of 61.0 percent in 2016 to an average of 64.6 percent in 2017. 12. The Philippines’ financial system remains stable and resilient. The share of non-performing loans declined from an average of 2.2 percent of total loans in 2016 to 1.9 percent in 2017. Philippine banks are well capitalized, with a total capital adequacy ratio at 15.3 in September 2017, well above the 10 percent regulatory minimum. In addition, banks’ return on equity slightly decreased from an average of 10.0 percent in 2016 to 9.9 percent in 2017. Also, the share of interest income to total operating income increased from an average of 73.1 percent in 2016 to 74.7 percent in 2017, while net interest margins remained unchanged at an average of 3.3 percent.
Figure 11: Inflation Rose Sharply and Surpassed in March 2018 the Ceiling of the Central Bank’s Target Range
Figure 12: Credit Has Sustained Its Double-digit Growth Rates
Source: PSA, BSP. Source: BSP.
liquidity in the financial system, and observed that the BSP has ample scope to mitigate the potential liquidity impact of a phased reduction in the reserve requirement via offsetting auction-based monetary operations. 19 Banking industry data reveal that some firms may have started to overleverage in the current environment of fast credit growth and low interest rates. The IMF article IV notes that non-financial corporate leverage has risen but is still moderate compared to peers.

12
1.4 Fiscal Policy: Preparing for the Public Investment Increase
The fiscal deficit narrowed in 2017, as the government missed its expenditure target, despite improved budget execution, and exceeded its revenue target.
13. The government continued to improve budget execution in 2017. Public expenditure increased from 17.6 percent of GDP in 2016 to 17.9 percent in 2017 (Figure 13). Nevertheless, the government’s budget execution fell short of programmed public spending by 2.9 percent in 2017, which was only a slight improvement from the 3.6 percent in 2016.20 Underspending was primarily the result of lower-than-expected recurrent spending on personnel expenditures and maintenance and other operating expenditures. 21 Meanwhile, infrastructure expenditures exceeded their programmed target and increased slightly from 3.4 percent of GDP in 2016 to 3.6 percent in 2017. Infrastructure outlays were directed towards the implementation of various road infrastructure, flood control, and dike and river basin repair projects as well as the repair and rehabilitation of school facilities and the purchase of military equipment under the Armed Forces of the Philippines’ modernization program (Box 3). However, the government has not yet started construction on its large planned flagship infrastructure projects.
Figure 13: National Government Fiscal Balance, 2013-17
Source: Bureau of the Treasury.
20 The government attributes improved budget execution to reforms to shorten the approval process of plans and programs and stricter implementation of project planning, monitoring, and scheduling. Source: https://www.dbm.gov.ph/wp-content/uploads/DBCC/2017/Highlights-of-NG-Disbursements_as-of-December-2017_for-posting.pdf. 21 In 2017, spending on personnel services was 8.4 percent below the programmed budget, while maintenance and other operating expenses was 1.9 percent below their programmed budgets.
14.9 15.115.8 15.2 15.716.3 15.7
16.717.6 17.9
-1.4-0.6 -0.9
-2.4 -2.2-5.0
0.0
5.0
10.0
15.0
20.0
2013 2014 2015 2016 2017
Perc
ent
of
GD
P
Revenues Expenditure
13
Box 3: Recent Public Expenditure Profile of the Philippines
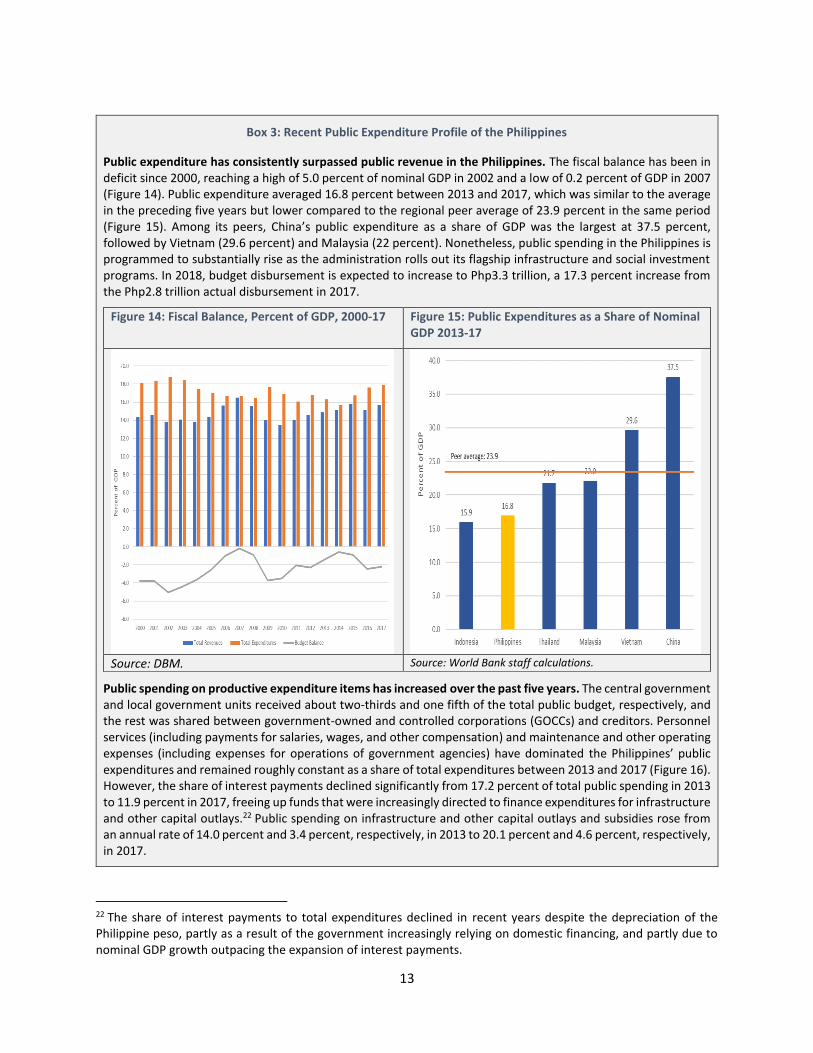
Public expenditure has consistently surpassed public revenue in the Philippines. The fiscal balance has been in deficit since 2000, reaching a high of 5.0 percent of nominal GDP in 2002 and a low of 0.2 percent of GDP in 2007 (Figure 14). Public expenditure averaged 16.8 percent between 2013 and 2017, which was similar to the average in the preceding five years but lower compared to the regional peer average of 23.9 percent in the same period (Figure 15). Among its peers, China’s public expenditure as a share of GDP was the largest at 37.5 percent, followed by Vietnam (29.6 percent) and Malaysia (22 percent). Nonetheless, public spending in the Philippines is programmed to substantially rise as the administration rolls out its flagship infrastructure and social investment programs. In 2018, budget disbursement is expected to increase to Php3.3 trillion, a 17.3 percent increase from the Php2.8 trillion actual disbursement in 2017.
Figure 14: Fiscal Balance, Percent of GDP, 2000-17 Figure 15: Public Expenditures as a Share of Nominal GDP 2013-17
Source: DBM. Source: World Bank staff calculations.
Public spending on productive expenditure items has increased over the past five years. The central government and local government units received about two-thirds and one fifth of the total public budget, respectively, and the rest was shared between government-owned and controlled corporations (GOCCs) and creditors. Personnel services (including payments for salaries, wages, and other compensation) and maintenance and other operating expenses (including expenses for operations of government agencies) have dominated the Philippines’ public expenditures and remained roughly constant as a share of total expenditures between 2013 and 2017 (Figure 16). However, the share of interest payments declined significantly from 17.2 percent of total public spending in 2013 to 11.9 percent in 2017, freeing up funds that were increasingly directed to finance expenditures for infrastructure and other capital outlays.22 Public spending on infrastructure and other capital outlays and subsidies rose from an annual rate of 14.0 percent and 3.4 percent, respectively, in 2013 to 20.1 percent and 4.6 percent, respectively, in 2017.
22 The share of interest payments to total expenditures declined in recent years despite the depreciation of the Philippine peso, partly as a result of the government increasingly relying on domestic financing, and partly due to nominal GDP growth outpacing the expansion of interest payments.
14
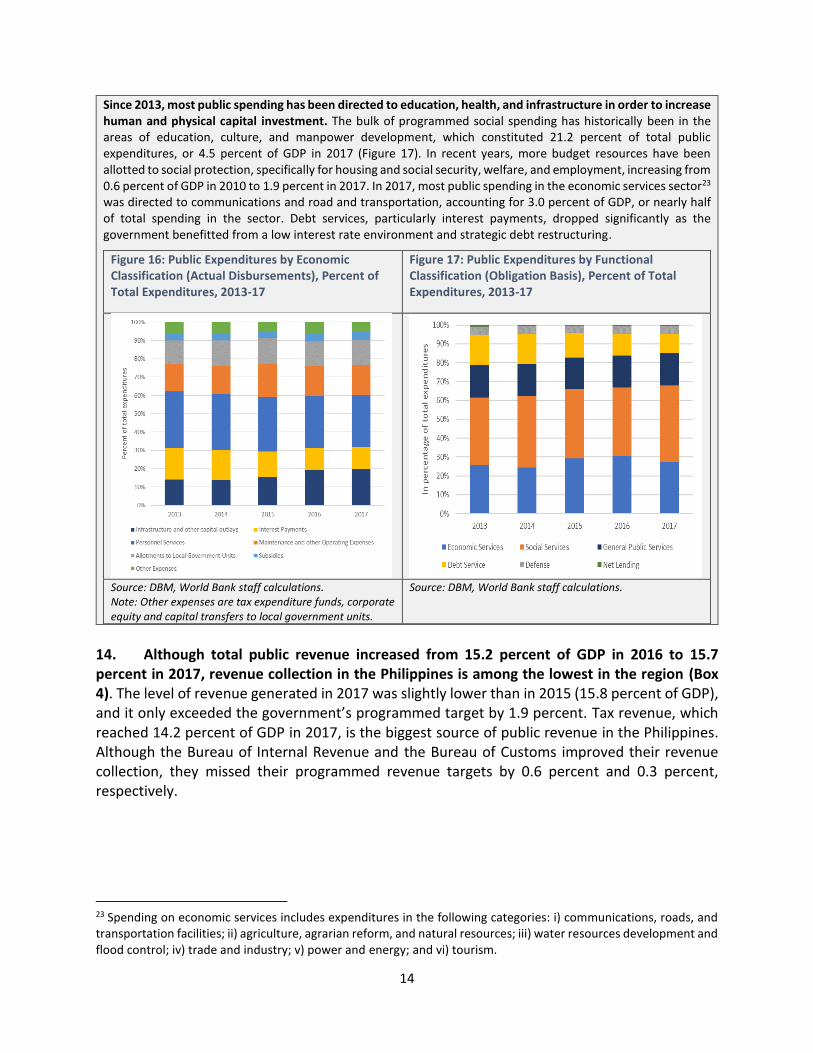
Since 2013, most public spending has been directed to education, health, and infrastructure in order to increase human and physical capital investment. The bulk of programmed social spending has historically been in the areas of education, culture, and manpower development, which constituted 21.2 percent of total public expenditures, or 4.5 percent of GDP in 2017 (Figure 17). In recent years, more budget resources have been allotted to social protection, specifically for housing and social security, welfare, and employment, increasing from 0.6 percent of GDP in 2010 to 1.9 percent in 2017. In 2017, most public spending in the economic services sector23 was directed to communications and road and transportation, accounting for 3.0 percent of GDP, or nearly half of total spending in the sector. Debt services, particularly interest payments, dropped significantly as the government benefitted from a low interest rate environment and strategic debt restructuring.
Figure 16: Public Expenditures by Economic Classification (Actual Disbursements), Percent of Total Expenditures, 2013-17
Figure 17: Public Expenditures by Functional Classification (Obligation Basis), Percent of Total Expenditures, 2013-17
Source: DBM, World Bank staff calculations. Note: Other expenses are tax expenditure funds, corporate equity and capital transfers to local government units.
Source: DBM, World Bank staff calculations.
14. Although total public revenue increased from 15.2 percent of GDP in 2016 to 15.7 percent in 2017, revenue collection in the Philippines is among the lowest in the region (Box 4). The level of revenue generated in 2017 was slightly lower than in 2015 (15.8 percent of GDP), and it only exceeded the government’s programmed target by 1.9 percent. Tax revenue, which reached 14.2 percent of GDP in 2017, is the biggest source of public revenue in the Philippines. Although the Bureau of Internal Revenue and the Bureau of Customs improved their revenue collection, they missed their programmed revenue targets by 0.6 percent and 0.3 percent, respectively.
23 Spending on economic services includes expenditures in the following categories: i) communications, roads, and transportation facilities; ii) agriculture, agrarian reform, and natural resources; iii) water resources development and flood control; iv) trade and industry; v) power and energy; and vi) tourism.
15
Box 4: Public Revenue in the East Asia Pacific Region
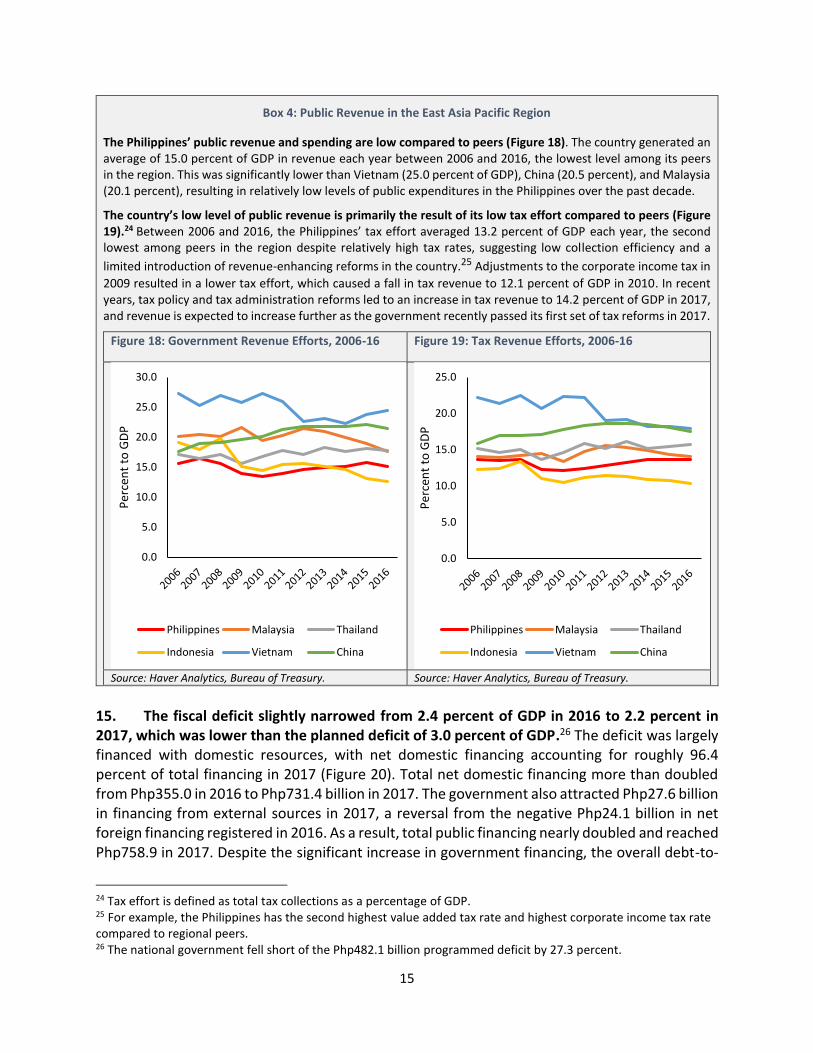
The Philippines’ public revenue and spending are low compared to peers (Figure 18). The country generated an average of 15.0 percent of GDP in revenue each year between 2006 and 2016, the lowest level among its peers in the region. This was significantly lower than Vietnam (25.0 percent of GDP), China (20.5 percent), and Malaysia (20.1 percent), resulting in relatively low levels of public expenditures in the Philippines over the past decade.
The country’s low level of public revenue is primarily the result of its low tax effort compared to peers (Figure 19).24 Between 2006 and 2016, the Philippines’ tax effort averaged 13.2 percent of GDP each year, the second lowest among peers in the region despite relatively high tax rates, suggesting low collection efficiency and a
limited introduction of revenue-enhancing reforms in the country.25 Adjustments to the corporate income tax in
2009 resulted in a lower tax effort, which caused a fall in tax revenue to 12.1 percent of GDP in 2010. In recent years, tax policy and tax administration reforms led to an increase in tax revenue to 14.2 percent of GDP in 2017, and revenue is expected to increase further as the government recently passed its first set of tax reforms in 2017.
Figure 18: Government Revenue Efforts, 2006-16 Figure 19: Tax Revenue Efforts, 2006-16
Source: Haver Analytics, Bureau of Treasury. Source: Haver Analytics, Bureau of Treasury.
15. The fiscal deficit slightly narrowed from 2.4 percent of GDP in 2016 to 2.2 percent in 2017, which was lower than the planned deficit of 3.0 percent of GDP.26 The deficit was largely financed with domestic resources, with net domestic financing accounting for roughly 96.4 percent of total financing in 2017 (Figure 20). Total net domestic financing more than doubled from Php355.0 in 2016 to Php731.4 billion in 2017. The government also attracted Php27.6 billion in financing from external sources in 2017, a reversal from the negative Php24.1 billion in net foreign financing registered in 2016. As a result, total public financing nearly doubled and reached Php758.9 in 2017. Despite the significant increase in government financing, the overall debt-to-
24 Tax effort is defined as total tax collections as a percentage of GDP. 25 For example, the Philippines has the second highest value added tax rate and highest corporate income tax rate compared to regional peers. 26 The national government fell short of the Php482.1 billion programmed deficit by 27.3 percent.
0.0
5.0
10.0
15.0
20.0
25.0
30.0
Per
cen
t to
GD
P
Philippines Malaysia Thailand
Indonesia Vietnam China
0.0
5.0
10.0
15.0
20.0
25.0
Per
cen
t to
GD
P
Philippines Malaysia Thailand
Indonesia Vietnam China

16
GDP ratio remained constant at 42.1 percent in 2017 for the second consecutive year, as nominal GDP growth kept pace with the growth in the national government debt stock (Figure 21).
Figure 20: The Government Financed Its Deficit through Domestic Borrowing
Figure 21: The Overall Debt-to-GDP Ratio Remained Unchanged from 2016 to 2017
Source: Bureau of Treasury. Source: Bureau of Treasury, PSA.
16. In December 2017, the Philippines successfully passed its first package of tax reforms, effective since January 1, 2018. The president signed Republic Act 10963, also known as the Tax Reform for Acceleration and Inclusion (TRAIN), into law on December 19, 2017. TRAIN, also referred to as package 1A of the government’s comprehensive tax reform program, introduced reforms that reduced personal income tax rates, adjusted the estate and donor’s tax, broadened the value-added tax base by limiting exemptions; adjusted excise taxes on tobacco; automobiles, oil, and mineral products; and introduced an excise tax on sugar-sweetened beverages and cosmetic procedures. The law is estimated to bring in an additional Php82.3 billion in public revenue during its first year of implementation in 2018. Additional revenue from the law will be used to help finance the government’s infrastructure program and provide additional resources for social services.
1.5 Employment and Poverty: A Tight Labor Market with Limited Real Wage Growth
The labor market remains tight with the unemployment rate at around 5 percent, but the quality of employment remains a concern.
17. Labor demand remained strong throughout 2017, and the unemployment rate only increased slightly from an average of 5.5 percent in 2016 to an average of 5.7 percent in 2017 (Figure 22). The unemployment rate increased to a two-year high of 6.6 percent in January 2017, likely influenced by the unwinding of temporary election-related jobs created in 2016. The unemployment rate fell to 5 percent in October 2017, before increasing slightly to 5.3 percent in
(120)
(100)
(80)
(60)
(40)
(20)
-
20
40
60
80
100
120
Jan Jul Jan July Jan July
2015 2016 2017
In B
illio
n P
eso
s
Net Foreign FinancingNet Domestic FinancingBudget Surplus/Deficit
30.2 29.632.8 32.4 30.2 29.2 27.2 28.1
22.2 21.418.6 16.9
15.2 15.514.9 14.0
0.0
10.0
20.0
30.0
40.0
50.0
60.0
2010 2011 2012 2013 2014 2015 2016 2017
In p
erce
nt
of
GD
P
Domestic debt
External debt

17
January 2018, driven by higher employment in the country’s three main economic sectors: agriculture, industry, and services.27 Throughout 2017, labor demand was mainly driven by manufacturing and construction activities. The Philippines’ low unemployment rate points to a continued tight labor market and an economy close to full employment.
18. Employment trends varied across regions and sectors during 2017. Unemployment rates declined in the growth centers of Cavite, Laguna, Batangas, Rizal, and Quezon (CALABARZON) and Central Visayas, 28 while they increased in Metro Manila and regions predominantly dependent on agriculture. As a result, there were job losses in the primary sector, mainly in agriculture.29 Most new jobs were created in the secondary sector, primarily in the industry sector, with 200,000 and 100,000 jobs added in construction and manufacturing, respectively, in 2017.30 In January 2018, net job creation in all the three main sectors increased, generating about 2.4 million new jobs, with an almost equal share from all three sectors.31
19. Underemployment, which gives some indication of the quality of jobs, improved in 2017, but sharply deteriorated in early 2018. The underemployment rate declined from an average of 18.4 percent in 2016 to 16.1 percent in 2017. This was accompanied by an increase in the number of wage and salaried workers in the private and public sectors. By the end of 2017, there were about 600,000 more wage and salaried workers compared to the end of 2016. However, the underemployment rate climbed to 18.0 percent in January 2018, with much of the increase coming from the agriculture sector (from 32.8 percent in January 2017 to 36.2 percent in January 2018). Underemployment did decrease in the industry (from 20.3 percent to 19.2 percent) and services (from 46.9 percent to 44.6 percent) sectors in the same period. The pervasiveness of underemployment despite strong economic growth highlights the absence of quality jobs in the Philippines.
20. On the labor supply side, the labor force participation rate fell below its 10-year average in 2017 (Figure 23). It dropped sharply to 60.7 percent in January 2017,32 before increasing to 62.1 percent and 62.2 percent in October 2017 and January 2018, respectively.33 The average
27 This represents the highest first quarter growth in all of the previous January rounds of the Labor Force Survey since 2009. 28 CALABARZON is a growth center and hosts 35 of the 74 manufacturing economic zones in the country. See http://www.peza.gov.ph/index.php/economic-zones/list-of-economic-zones. 29 The primary sector includes activities related to agriculture, hunting, and forestry. 30 The secondary sector includes activities related to manufacturing, processing, metal working, automobile production, textile production, etc. 31 The Labor Force Survey reports that 400,000 jobs were created in January 2018, and the manufacturing sector continued to grow with nearly 300,000 jobs created. 32 Filipino youth accounted for most of the drop in the country’s labor force participation rate, which may be attributed to the implementation of the K-12 program that commenced during the 2016-2017 school year. Based on enrollment records by the Department of Education, 1.5 million students were admitted to grade 11 in June 2016, of which 1.45 million had finished grade 10. This is equivalent to a high school graduate in the old curriculum. Prior to the implementation of the senior high school program, a proportion of these students would have joined the labor market. See World Bank (2017b). 33 The National Economic and Development Authority attributes the rise in labor force participation to an increase in the female labor force participation rate from 45.2 percent in January 2017 to 47.5 percent in January 2018. This

18
labor force participation rate fell from 63.5 percent in 2016 to 61.2 percent in 2017, below the 10-year average of 63.7 percent. Participation in the labor force is expected to increase in 2018, as a portion of the first batch of senior high school graduates under the K-12 program joins the labor force (Box 5).
Figure 22: The Unemployment Rate Remained Around 5 percent ...
Figure 23: … While the Labor Force Participation Rate Remained Below the 10-year Average
Source: Labor Force Survey (various rounds), PSA. Source: Labor Force Survey (various rounds), PSA.
21. Real wages grew slower in 2017 compared to their strong expansion in 2016.34 Between 2007 and 2017, the average overall real wage in the Philippines rose slowly at an annual rate of 0.8 percent, reaching an average of Php262.00. However, the annual overall real wage grew faster in 2016 at 4.3 percent, but slower in 2017 at 0.2 percent. The mean daily wage in the public sector is about 70.0 percent larger than the average overall wage, while the wages of family workers and private household workers remained consistently below the average in the past decade (Figure 24). Private sector workers, which form bulk of wage earners in the country, saw their wages contract by 0.1 percent year-on-year in 2017 from a 5.4 percent year-on-year expansion in 2016. 22. The Philippines’ robust economic growth and labor market characteristics make it likely that poverty will continue to decline, although rising inflation may adversely impact the poor.35 Based on the lower middle-income class poverty line (US$3.20/day in 2011 PPP) used by the World Bank, the country’s poverty rate fell from an estimated 27.0 percent in 2015 to 24.3 percent in 2017. The factors that have been driving poverty reduction in the recent past, including
reflects the sharp decline in the number of economically inactive married women and women who opt out of the labor force due to household duties. 34 The available data for real wages in the Philippines come from the various rounds of the Labor Force Survey, covering 2007 to October 2017. 35 The quarterly self-rated poverty estimates of the Social Weather Station also show a declining trend in recent years.

19
the movement of employment out of agriculture, the recent increase in real wages among private sector workers, and the increase in remittances and government conditional cash transfers, are likely to continue to push the poverty rate down. However, the recent increase in inflation might have a negative impact on poverty alleviation, as inflation has increased largely due to higher prices for food and non-alcoholic beverages – on which poor households spend a significant share of their income.
Figure 24: Changes in Real Daily Wages, 2007-17
Source: Labor Force Survey (various rounds), PSA.
Box 5: Building Human Capital through the K-12 Basic Education Program
The Philippines has made important strides toward improving its human capital in recent years. The 2013 Basic Education Act extended the basic education cycle from 10 to 13 years, adding universal kindergarten and 2 years of senior high school. The first cohort of grade 12 students graduated in March 2018. The education budget also grew markedly, from 2.9 percent of GDP in 2013 to 3.8 percent of GDP in 2016. This increased spending has funded the extension of the education cycle as well as school construction and teacher hiring that have improved school conditions at all grade levels.
The country embarked on an ambitious reform agenda to align its education system with most other systems around the world and raise national competitiveness. The government views a K-12 system as vital for ensuring that all Filipinos are equipped with the basic skills required to play full and productive roles in the society. This is one of many investments in human capital that will be vital to meeting the country’s aspirations for sustained and inclusive growth. Research featured in the World Bank’s 2018 World Development Report shows, however, that simply increasing the number of years of schooling does not in itself boost a country’s economic fortunes. More schooling only improves a country’s economy if it results in greater learning.
Despite a high level of commitment by teachers, the Philippines’ learning outcomes are the weakest among major countries in the East Asia Pacific region. The difference in test scores between the Philippines and high-performing countries like Vietnam is substantial and equivalent to three years’ worth of learning. An important caveat to this picture is that the Philippines test score data date from 2003, the last year the country participated in an international educational assessment. The country is participating in the 2018 Program for International Student

20
Assessment, which will allow for an updated analysis of the performance of the education system relative to other countries.
Quality teachers constitute the principal factor for improved learning outcomes. However, studies have found that teachers in the Philippines do not have the knowledge, support, or materials they need to teach effectively. One critical need is to improve the professional development opportunities for teachers, which will raise the quality of teaching and improve student learning. Important steps will include implementing the recently developed Philippines Professional Standards for Teachers and moving from a mass-training model to one based on a personalized, coaching approach.
The K-12 expansion is the most visible of a series of efforts being made to modernize basic education in the Philippines. If effectively used, the country’s new investments to improve human capital will pay off in greater opportunity for the Filipino people. Over time, increasing the years of schooling, if its results in higher levels of learning, will improve the quality and ultimately productivity of the labor force.

21
Part II: OUTLOOK AND RISKS
The medium-term economic growth outlook for the Philippines remains positive. The economy is expected to continue on its expansionary path, and grow at an annual rate of 6.7 percent in 2018 and 2019. The economy is currently growing at its potential, making productive investment in physical and human capital essential for a continuation of the current growth trajectory. The country is expected to benefit from the global recovery in 2018; however, export growth is expected to level off compared to its strong expansion in 2017, while imports are projected to remain elevated due to high demand for intermediate and capital goods. Domestic risks are more prominent while the key external risk is increasing policy uncertainty in global markets. In line with the Philippines’ growth outlook, poverty levels are expected to continue to fall. However, the missing link to higher shared prosperity is twofold: high-quality jobs and faster growth of real wages. More can be done to create high-quality jobs and accelerate the growth of real wages. Investing in the future means prioritizing investment in both physical infrastructure and human capital, such as in education, skills and health, will create better employment opportunities, especially for the poor.

22
2.1 Growth Outlook The Philippine economy is projected to grow at an annual rate of 6.7 percent in 2018 and 2019. 23. The economic outlook for the Philippines remains positive. The economy is expected to continue on its expansionary path, and the World Bank projects the country’s GDP to grow at an annual rate of 6.7 percent in both 2018 and 2019, before settling at 6.6 percent in 2020 (Figure 25). These projections remain largely unchanged from the growth projections made by the World Bank in October 36 and December 37 2017. The country’s external environment remains accommodative to growth (Box 6). However, the Philippine economy is currently growing at its potential and productive physical and human capital investments are necessary for the economy to continue along its current growth trajectory. The risk of overheating the economy is increasing. Potential signs that the economy is overheating include the rise of core inflation, the high capacity utilization rate in the manufacturing sector, and the tight labor market (See Sections 1.1 and 1.3).
Figure 25: The Philippine Economy is Projected to Grow at 6.7 percent in 2018 and 2019.
Source: PSA, World Bank staff estimates.
36 World Bank, Philippines Economic Update: Preserving Consistency and Policy Commitment, October 2017. 37 World Bank, Philippines Monthly Economic Development, December 2017.

23
Box 6: The Global Economic Outlook
A continuing cyclical recovery will sustain global growth over the next couple of years. Global growth is projected to rise from an estimated annual rate of 3.0 percent in 2017 to 3.2 percent in 2018, as investments, manufacturing activities, and commodity prices continue to recover globally (Figure 26). Global growth is forecasted to settle at an average of annual 3.0 percent in 2019-20. Growth in emerging markets and developing economies is expected to accelerate and reach 4.6 year-on-year in 2018 and an average of 4.7 percent year-on-year in 2019-20. This mainly reflects a further pickup of growth in commodity exporters, as the price of oil and other commodities are expected to firm and the effects of the earlier collapse in commodity prices dissipate (Table 2). Moreover, the cyclical recovery in many regional economies, including in the East Asia Pacific region, is close to running its course. In general, the regional economies are operating around their potential levels, with closing output gaps and tightening labor markets (Figure 27).
The growth momentum in global trade is expected to continue in 2018 but faces risks stemming from renewed protectionist sentiment and policy uncertainty in global markets. Global trade growth is set to moderate from an estimated annual rate of 4.5 percent in 2017 to an average rate of 4.0 percent in 2018-19, in line with the projected deceleration of capital spending in advanced economies and China. Trade is expected to be constrained by structural forces, including the slower pace of global value chain integration and trade liberalization. Global trade, however, is further threatened by the more protectionist stance of some large economies. The United States recently imposed tariffs on solar panels, washing machines, steel, and aluminum. Moreover, trade war rhetoric has amplified between the United States and China. The rising tension creates policy uncertainty that may pose a risk to global trade growth.
Global financing conditions are likely to tighten in 2018, as monetary policies gradually normalize in major advanced economies. In the United States, inflation expectations and prospects of a faster normalization of monetary policy have increased. Global interest rates are expected to continue to rise, as inflation gradually picks up and monetary policies normalize across advanced economies. Also, a continued drawdown of net asset purchases by major central banks will contribute to upward pressure on long-term yields. In advanced economies, a rise in inflation remains incipient despite ongoing tightening in labor markets.
Although growth might accelerate in the near term, the global economic outlook is still subject to substantial downside risks. In the short term, these risks include the possibility of financial stress, increased protectionism, and rising geopolitical tensions. There are also challenges associated with subdued productivity and potential growth. As the global economy is on track to operate at or near full capacity in 2018 for the first year since the 2007-08 financial crisis, supply-side constraints will likely become more binding and global inflation is expected to gradually increase. As a result, global economic activity is expected to decelerate in the medium term. With less economic slack, policymakers need to look beyond monetary and fiscal policies to stimulate economic growth.
Policymakers in both advanced economies and emerging market and developing economies need to pursue structural measures to boost potential long-term growth. With unemployment rates returning to pre-crisis levels and recoveries firming in advanced economies, productivity-enhancing reforms have become increasingly urgent as the pressures on underlying growth from aging populations intensify. Among emerging market and developing economies, output gaps are near zero in commodity importers but remain negative in commodity exporters, suggesting a continuing need to nurture the cyclical recovery in the latter even when fiscal space remains constrained.

24
Figure 26: Global Economic Growth, 2000-20 Figure 27: Output Gaps, 2000-18
Source: World Bank (2018c). Source: World Bank (2018c).
Table 2: Real GDP Growth Rates, 2015-2020
2015 2016 2017e 2018f 2019f 2020f
World 2.8 2.4 3.1 3.2 3.1 2.9
Advanced economies 2.2 1.6 2.2 2.3 2.0 1.7
Emerging market and developing Economies
3.6 3.7 4.4 4.6 4.7 4.7
Developing East Asia & Pacific 6.5 6.3 6.6 6.2 6.1 6.0
Philippines 6.1 6.9 6.7 6.7 6.7 6.6 Note: Developing East Asia & Pacific includes Cambodia, China, Fiji, Indonesia, Lao PDR, Malaysia, Mongolia, Myanmar, Papua New Guinea, Philippines, Solomon Islands, Thailand, Timor-Leste, and Vietnam.
Source: World Bank (2018b), World Bank (2018c), World Bank (2018d).
24. The World Bank forecast assumes higher government spending in 2018-20. The current administration is expected to increase infrastructure and human capital investments to continue the momentum set in 2017. Public spending is expected to increase from 10.8 percent year-on-year in 2017 to 17.3 year-on-year percent in 2018, including a 27.1 percent year-on-year increase on capital outlays (to Php1.0 trillion) and a 5.5 percent year-on-year increase on social sectors (to Php1.4 trillion) in 2018. The government plans to increase the level of public expenditures from 17.7 percent of GDP (Php2.8 trillion) in 2017 to 19.0 percent of GDP (Php3.3 trillion) in 2018, including a 0.9 percentage point increase in infrastructure investment from 5.4 percent of GDP (Php0.9 trillion) in 2017 to 6.3 percent of GDP (Php1.1 trillion) in 2018) and a 0.4 percentage point decrease in social investment (from 8.6 percent of GDP (Php1.4 trillion) in 2017 to 8.2 percent of GDP (Php1.4 trillion) in 2018). Infrastructure spending is programmed to further rise in succeeding years to reach an estimated 6.8 percent of GDP (Php1.3 trillion) in 2019 and 6.9 percent of GDP (Php1.5 trillion) in 2020. The government’s targeted annual fiscal deficit is set at 3.0 percent of GDP in 2018-20, although the World Bank projects narrower budget deficits over the same period (but wider than in 2017). These projections consider longstanding implementation bottlenecks and capacity constraints that may hinder progress in implementing

25
public investment projects. To finance the budget deficits, the administration plans to pursue an 80:20 financing mix in favor of domestic sources. 25. Monetary policy is expected to gradually tighten in the near future as the BSP adjusts to the changing global financial conditions and the closing domestic output gap. Global interest rates are expected to continue to rise, as global inflation picks up and monetary policies normalize across advanced economies.38 In 2017, the BSP did not make a policy adjustment despite three increases in the federal funds rate by the United States’ Federal Reserve, increasing the likelihood that the BSP will raise its key policy rate in 2018. Moreover, the Philippines may be faced with a higher risk of inflation in the short term, as the economy continues to operate near its potential, the output gap is closing, and fiscal spending remains high. Nevertheless, average inflation is projected at 3.3 percent in 2018 and 3.0 percent in 2019 – within the BSP’s 2-4 percent target range. 26. Sustained global growth will support the demand for Philippine exports in 2018. Global growth is expected to peak at 3.2 percent in 2018, before slowing down in succeeding years as economic growth in advanced economies is projected to moderate and the slowdown in China proceeds. Together with the effect of a depreciating peso, this is expected to lead to sustained foreign demand for Philippine products throughout 2018. However, export growth will likely moderate from its expansion of 19.2 percent in 2017 to a projected 15.1 percent in 2018, partly due to the base effect of an exceptionally strong year in 2017. Import growth is projected to outpace exports growth in both 2018 and 2019, as the demand for intermediate goods increases.
39 The demand for capital goods is also expected to intensify, as the government gradually rolls out its infrastructure investment projects. These negative net export trends will likely lead to a higher demand for US dollars, which is expected to further widen the current-account deficit and continue to weaken the peso. As a result, the current account is projected to reach deficits of 1.2 percent of GDP in 2018 and 1.4 percent of GDP in 2019. 27. Driven by public investment, annual investment growth is expected to slightly rise in 2018 and 2019. Gross fixed capital investment is projected to grow from 10.3 percent year-on-year in 2017 to 11.8 percent year-on-year and 11.9 percent year-on-year in 2018 and 2019, respectively. Investment growth will largely depend on public spending and the timely implementation of the government’s infrastructure and human capital investment programs.40 The administration is pursuing a budget reform bill to modernize the budgeting process,
38 World Bank (2018c). 39 Raw materials and intermediate goods imports accounted for roughly two-fifths of the total import bill in 2017, slightly higher than capital goods imports (32.3 percent). Imported materials make up the bulk of electronic goods that the country exports, with only about 25-30 percent as local value added. See Saulon (2017). For a short discussion on the composition of imports and exports in the Philippines, see World Bank (2017b), Box 5. 40 Very few projects have started this year while several are in the preparation stage. Projects currently under implementation are the Philippine National Railways (PNR) North 2 project and sports facilities in New Clark City for the 2019 Southeast Asian games. Approved projects that are still in pre-construction phase include the mega-Manila subway project, Philippine National Railway South Commuter line, Malolos-Clark Railway, and the Metro Manila Flood Control project.

26
accelerate program delivery, and strengthen government focus and accountability (Box 7). Private investment growth may potentially soften in the coming years, considering the decrease in the number of approved building permits and the lower volume of approved foreign investments by investment promotion agencies in 2017 compared to 2016. The prospect of rising domestic interest rates may also discourage private-sector borrowings and lead to lower private-sector investment growth.
Box 7: Initiatives to Modernize the Budgeting Process
On January 3, 2018, the Department of Budget and Management issued the National Budget Call for fiscal year 2019 under the National Budget Memorandum no. 129. The budget memorandum provides general and specific guidance to national government agencies and GOCCs on the preparation of budget proposals for 2019. Agency proposals are mandated to be consistent with the administration’s priority policies embodied in the 0+10-Point Socio Economic Agenda, the Philippine Development Plan, the 2017-2022 Public Investment Program, and the 2019-2021 Three-Year Rolling Infrastructure Program. The budget call followed the macroeconomic assumptions adopted by the Development Budget Coordination Committee in December 2017, including a deficit ceiling pegged at 3.0 percent of GDP for 2019.
The budget call incorporates the proposed shift from a multi-year obligation-based budget to an annual cash-based appropriation system. Under the budget call, the 2019 budget will be an annual cash-based outlay where budgetary performance will be evaluated based on payments of goods and services actually delivered within the fiscal year, with an extended payment period of three months. These are important reforms from past practices, which based payments on obligations and allowed appropriations for up to two years. To ensure a smooth transition to annual cash-based appropriations, infrastructure projects will be allowed a two-year transitory period. In addition, for the initial year of implementation in fiscal year 2019, cash-based appropriations for infrastructure projects shall be available for release, contractual commitment, and disbursement until December 31, 2020. Previous budgetary practices led to low budget utilization rates among government agencies. As the budget planning horizon effectively shortens to a year under the new system, the government expects to accelerate program delivery and on-schedule operations, improve government capacity, and strengthen accountability.
Moreover, the government plans to continue to adopt budget administration reforms to improve transparency and reliability in the budget process. These reforms include the use of a two-tier budgeting approach (2TBA); 41 a unified accounts code structure (UACS); 42 and a program-based budgeting structure through the program expenditure classification (PREXC) approach.43 There are also reforms aimed at disaggregating lump-sum amounts within agency-specific budgets and institutionalizing a monitoring and evaluation system. Likewise, regional and local government agendas and budgets will be streamlined to ensure consistency with national government priorities.
41 The Two-Tier Budget Approach is a system where agency proposals for ongoing and existing programs and projects will be evaluated separately from new ones. Budgetary requirements for ongoing and existing programs are deliberated under Tier 1 and new spending proposals under Tier 2. 42 The Unified Accounts Code Structure (UACS) is a government-wide harmonized classification system for financial transactions, which is used by the Commission on Audit, Bureau of the Treasury, Department of Finance, and DBM. 43 The PREXC classifies all activities and projects and their performance indicators, under the appropriate program or major strategy being pursued by the agency to deliver a core objective or outcome.

27
To institutionalize reform initiatives, the administration is pursuing a budget reform bill that has been approved by the House of Representatives. House Bill 5590, or the Budget Reform Act of 2017, and Senate Bill 1450, or the Budget Reform Act have been separately filed in both chambers of Congress. The acts aim to institutionalize the planned reforms of the budget process, including the shift to an annual, cash-based budget. The comprehensive release of funds to line agencies with the passage of the General Appropriations Act is sought after, including the authorization to conduct early procurement activities short of award to speed up project implementation for line agencies. On March 10, 2018, the House of Representatives approved the budget reform bill, which had been certified as urgent by the president. In the Senate, the sponsorship speech for the bill was made on March 21, and the bill is expected to be approved in May when senators return from recess. The government hopes that the bicameral committee will approve the Budget Reform Act shortly thereafter so it can be enacted into law in June 2018.
Source: The Department of Budget and Management, National Budget Memorandum no. 129. DBM (2016). Guide to the Two-Tier Budget Approach, Manila.
28. Consumption growth is expected around its seven-year average in 2018, before accelerating in 2019 because of election-related spending (Table 3). Private consumption is expected to grow at 5.8 percent year-on-year in 2018, the same growth rate as in 2017 (and similar to the past seven-year average), before accelerating to 6.2 percent year-on-year in 2019, spurred by election-related expenditures. Pre-election activities will likely increase public consumption as early as 2018, with the most visible impact being the additional salaries and wages for election workers. Public consumption is projected to grow from 7.3 percent year-on-year in 2017 to 8.9 percent year-on-year in 2018. Moreover, the value of remittances is likely to increase in 2018 due to a weakening peso, strengthening the purchasing power of the families of overseas workers. However, other factors might weaken consumption growth in 2018. For example, continued high inflation could subdue consumer confidence and weaken consumption activities. The BSP’s latest consumer expectation survey revealed a less upbeat consumer outlook in the first and second quarter of 2018 and in the next 12 months compared to 2017. The impact of the first tax reform package is likely to be neutral on consumption growth. On one hand, higher fuel excise taxes and taxes on sugar-sweetened beverages might increase inflation temporarily and dampen consumption, but on the other hand, lower income tax rates increase workers’ take-home pay, which may increase consumer spending. 29. The service sector is expected to remain the main driver of economic growth. The sector is projected to grow from 6.7 percent year-on-year in 2017 to 6.8 percent year-on-year in 2018-19. During the past five years, it consistently contributed roughly three-fifths of the country’s overall economic growth in 2018 and 2019. Among the service sub-sectors, the IT-BPO industry is expected to grow at an average annual rate of 5.6 percent between 2016 and 2022, with revenues projected to reach US$38.9 billion in 2022.44 This average growth, however, is slower compared to the industry’s double-digit growth in the past decade, signaling the need to increase the share of higher value-added services.
44 ITBPAP (2017).

28
Table 3: Economic indicators for the Baseline Projection
Source: PSA, BTr, BSP, World Bank staff calculations.
30. Manufacturing activities are projected to remain robust. The manufacturing sector continues to be the preferred destination of both FDI and domestic credit. About a third of foreign equity, other than retained earnings, and 14.1 percent of domestic commercial loans were channeled to the sector in 2017 (Figure 28 and Figure 29). However, average capacity utilization remains high, reaching a two-decade high of 84.1 percent in January 2018, with more than half of the 20 major industries operating at near full capacity. Meanwhile, the demand for manufactured goods is expected to be strong, given the projected high external and domestic demand, which could lead to higher prices if capacity constraints are not addressed. 31. Agriculture growth is expected to moderate in 2018-19 compared to its strong expansion in 2017, and the government needs to address structural weaknesses and policy distortions facing the sector. While the agriculture sector grew at a robust annual rate of 3.9 percent in 2017, growth is expected to moderate in succeeding years to 3.7 percent and 3.0 percent in 2018 and 2019, respectively. Remaining constraints to growth in the sector include large input subsidies, insecure property rights for small landholders, and protectionist policies such as the rice self-sufficiency policy that reduces the incentives for the production of fruits and vegetables. These constraints have made the sector unattractive to investors, resulting in low credit and direct investment levels, a vicious cycle of low productivity, and heightened vulnerability to weather-related shocks. Developing the agriculture sector is key for the Philippines to deliver inclusive growth, as the sector employs a disproportionate share of the labor force. 45 Also, food production has a significant influence on domestic inflation. An encouraging prospect in the agriculture sector is the ongoing shift to higher value crops with export potential.
45 The agriculture sector contributed an average of 11.1 percent of GDP between 2007 and 2016, but employed an average of 32.1 percent of the labor force during the same period.
2015 2016 2017 2018f 2019f 2020f
Real GDP growth, at constant market prices 6.1 6.9 6.7 6.7 6.7 6.6
Private Consumption 6.3 7.0 5.8 5.8 6.2 6.1
Government Consumption 7.6 8.4 7.3 8.9 7.1 6.6
Gross Fixed Capital Investment 16.9 25.2 10.3 11.8 11.9 12.6
Exports, Goods and Services 8.5 10.7 19.2 15.1 15.0 15.0
Imports, Goods and Services 14.6 18.5 17.6 15.8 15.8 16.0
Inflation (period average) 0.7 1.3 2.9 3.3 3.0 3.0
National government balance (% of GDP) -0.9 -2.4 -2.2 -2.5 -2.6 -2.8
National government debt (% of GDP) 44.7 42.1 42.1 41.8 41.6 41.4
General government debt (% of GDP) 36.2 34.6 34.6 34.4 34.3 34.3
Current account balance 2.5 -0.4 -0.8 -1.2 -1.4 -1.6

29
Figure 28: The Largest Share of Domestic Bank Credit is Channeled to Real Estate and Construction.
Figure 29: The Manufacturing and Finance Sectors are among the Favorite Destinations of Foreign Direct Investment.
Note: Utilities include Electricity, Gas, Steam, Air-conditioning supply, and water supply. Source: BSP.
Source: BSP.
2.2 Poverty and Shared Prosperity Outlook In line with the Philippines’ growth outlook, poverty levels are expected to continue to fall. While an increase in inflation might slow poverty alleviation, a rebound in agricultural sector growth could accelerate progress in poverty reduction. 32. Sustained economic growth is likely to continue to contribute to poverty reduction. Under the assumption that the responsiveness of the poverty rate to economic growth follows historical trends, the poverty rate, based on the lower middle-income poverty line of US$3.20/day, is projected to decline from 27.0 percent in 2015 to 22.9 percent and 21.7 percent in 2018 and 2019, respectively, as economic growth remains robust (Figure 30). These projections would imply a continuing trend of one million Filipinos being lifted out of poverty each year. Factors that have been driving poverty reduction in the Philippines include the movement of employment out of agriculture, a sustained inflow of remittances, and the government’s conditional cash-transfer program. 33. However, rising inflation may negatively impact the welfare of the poor. The poor are especially vulnerable to the recent increase in inflation since it was largely due to higher prices of food and non-alcoholic beverages, on which poor households spend a significant share of their income. Moreover, the tax reform package risks intensifying the hikes in food and energy prices. To offset the impact of price increases from the tax reform package, the administration has

30
allocated Php25.7 billion, or Php200 per month to each of the poorest 10 million households in 2018. 34. Improving agriculture productivity is key for the Philippines to achieve inclusive growth. Since most poor households live in rural areas where agriculture is the main source of livelihood, a rebound in the agricultural sector is expected to disproportionately benefit the poor. Among poor households, salaries and wages account for over 40 percent of total income, and enterprise income accounts for nearly 30 percent. Also, over a third of their salaries and wages come from agricultural activities, and about two-thirds of enterprises that poor households rely on are related to agriculture. Therefore, improving agricultural productivity is a means to raise wages and salaries for the poor and help accelerate poverty reduction.
Figure 30: Sustained Economic Growth Makes It Likely That Poverty Reduction Will Continue
Source: PSA, World Bank staff estimates
2.3 Risks and Policy Challenges There are several domestic risks facing the Philippines, including higher inflation, an overheating of the economy, and high fiscal deficits. External risks consist of greater policy uncertainty related to growing trade protectionism and increasingly inward-looking sentiments in several advanced and emerging economies, and potential market volatility from faster-than-expected U.S. Federal Reserve rate normalization. 35. Increasing policy uncertainty in global markets is the key external risk facing the Philippine economy. In 2017, the United States’ Federal Reserve raised its federal funds rate three times, which led to episodes of adverse capital outflows from the Philippines, as United States assets became more attractive compared to domestic assets. A faster-than-expected normalization of the policy rate, driven by the reassessment of United States monetary policy expectations, could result in renewed tightening of financing conditions and heightened financial market volatility. The pace of policy normalization did not abate in the beginning of 2018 and the

31
Federal Reserve raised its rate in March in response to a continuation of the strong economic recovery and the stronger-than-expected employment and wage data in the United States.46 36. Renewed protectionist sentiments in advanced economies may disrupt exports and economic growth. Fear of a looming trade war between large economies also raises policy uncertainty. The United States recently announced heavy trade tariffs of 25.0 percent on steel and 10.0 percent on aluminum imports. The European Union is targeting American agricultural products, such as peanut butter and orange juice, in retaliation if the tariffs are implemented. Trade war rhetoric between the United States and China has also intensified. While the United States tariffs are expected to only have a limited impact on Philippine exports, they could potentially signal further restrictions in the future. Since the Philippines is connected to the global production chain, especially through its intermediate electronics exports, an adverse trade policy against neighboring countries could eventually have an impact on the Philippines. 37. Inflationary risks are rising due to external and domestic factors. An improving external environment is coinciding with a rise in global commodity prices. The global price of crude oil is projected to rise from US$52.80/barrel in 2017 to US$58.00/barrel in 2018, which is expected to increase local energy prices. Exacerbating the effects of rising global oil prices, the Philippine peso is expected to further depreciate in 2018, which will pass-through domestic prices. The recently passed first tax reform package could also increase domestic prices. First, lower income taxes will increase workers’ take-home pay, which may build-up demand-side pressures, especially in an environment of limited spare production capacity. Second, higher excise taxes on fuel raise transportation and energy prices. Finally, the next round of rice imports unnecessarily risks contributing to food inflation. 47 Even though the government extended the quantitative restriction for rice imports for three years until June 2020, it may need to reconsider its policy and open up the market to more private-sector participation. 38. The Philippine economy is also at risk of overheating. The economy is currently growing at its potential rate, and the average capacity utilization in the manufacturing industry remains high, with all major industries operating at near full capacity. Moreover, unemployment reached record lows in recent years, signaling less spare labor capacity, although underemployment remains high. Therefore, investment in both capital assets and human capital is urgently needed to increase the economy’s productive capacity. In an environment of increasing fiscal spending and continued high credit growth, the risk of the economy overheating is increasing.
46 World Bank (2018d). 47 Rice imports are largely controlled by the National Food Authority, which is mandated to maintain a 30-day stock during lean season and a 15-day stock at any given time. However, restrictions on rice imports in recent years left the rice supply inadequate at times, and the mistiming of imports has a caused a number of price hikes. For instance, domestic rice prices increased in 2014 because of importation lags, even as world prices fell. As a result, the current NFA rice stocks are reaching critical levels and are estimated to be depleted by April 2018. The next round of rice imports is set to arrive before the end of the second quarter. This mistiming of imports may yet again lead to higher rice prices and consequently higher food inflation.
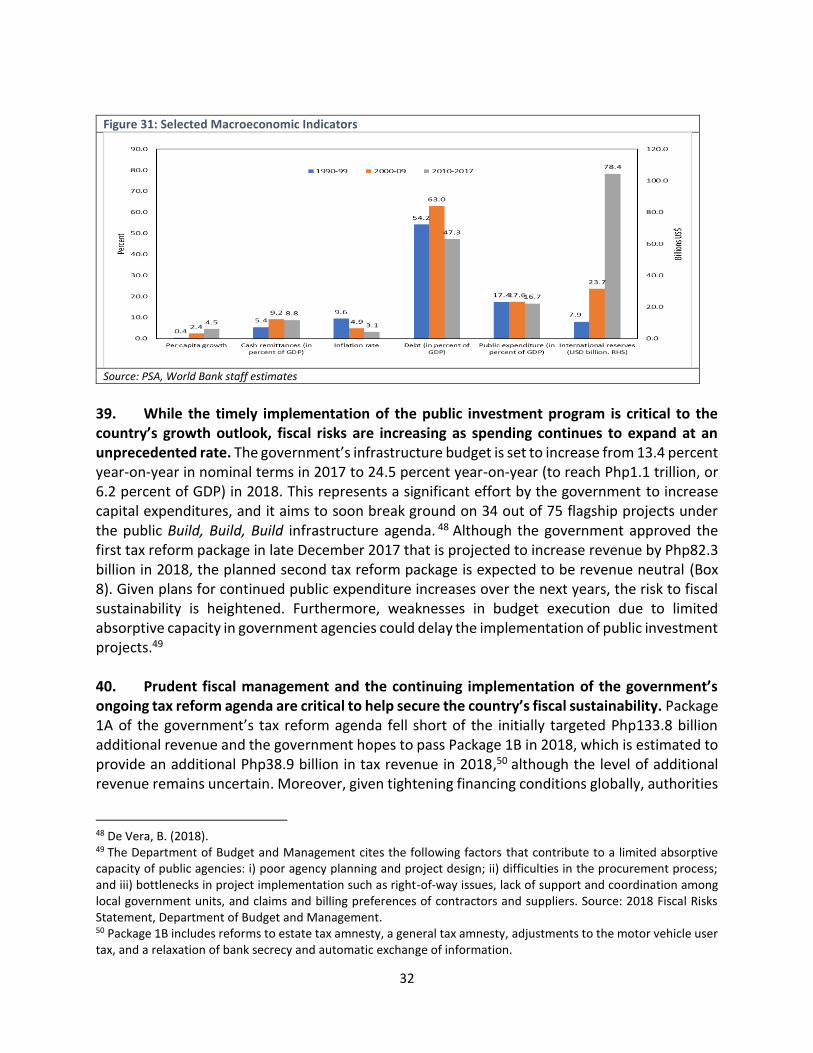
32
Figure 31: Selected Macroeconomic Indicators
Source: PSA, World Bank staff estimates
39. While the timely implementation of the public investment program is critical to the country’s growth outlook, fiscal risks are increasing as spending continues to expand at an unprecedented rate. The government’s infrastructure budget is set to increase from 13.4 percent year-on-year in nominal terms in 2017 to 24.5 percent year-on-year (to reach Php1.1 trillion, or 6.2 percent of GDP) in 2018. This represents a significant effort by the government to increase capital expenditures, and it aims to soon break ground on 34 out of 75 flagship projects under the public Build, Build, Build infrastructure agenda. 48 Although the government approved the first tax reform package in late December 2017 that is projected to increase revenue by Php82.3 billion in 2018, the planned second tax reform package is expected to be revenue neutral (Box 8). Given plans for continued public expenditure increases over the next years, the risk to fiscal sustainability is heightened. Furthermore, weaknesses in budget execution due to limited absorptive capacity in government agencies could delay the implementation of public investment projects.49 40. Prudent fiscal management and the continuing implementation of the government’s ongoing tax reform agenda are critical to help secure the country’s fiscal sustainability. Package 1A of the government’s tax reform agenda fell short of the initially targeted Php133.8 billion additional revenue and the government hopes to pass Package 1B in 2018, which is estimated to provide an additional Php38.9 billion in tax revenue in 2018,50 although the level of additional revenue remains uncertain. Moreover, given tightening financing conditions globally, authorities
48 De Vera, B. (2018). 49 The Department of Budget and Management cites the following factors that contribute to a limited absorptive capacity of public agencies: i) poor agency planning and project design; ii) difficulties in the procurement process; and iii) bottlenecks in project implementation such as right-of-way issues, lack of support and coordination among local government units, and claims and billing preferences of contractors and suppliers. Source: 2018 Fiscal Risks Statement, Department of Budget and Management. 50 Package 1B includes reforms to estate tax amnesty, a general tax amnesty, adjustments to the motor vehicle user tax, and a relaxation of bank secrecy and automatic exchange of information.
33
must continue to exercise fiscal discipline in order to maintain the country’s debt sustainability (Figure 31). 41. Finally, slow progress in the medium term to implement structural policy reforms that would increase investment and create quality employment could prevent the Philippines from achieving more inclusive growth. In recent years, the economy has made great strides in delivering inclusive growth, evidenced by declining poverty levels and a falling Gini coefficient . Underemployment, however, remains near its 18-20 percent decade-long average despite unemployment rates at historic low levels. Therefore, delivering inclusive economic growth remains the country’s most pressing challenge, and more can be done to create high-quality jobs and support poverty reduction. The missing links to higher shared prosperity in the Philippines are high-quality jobs and faster real wage growth (see Chapter 3: Special Focus Note). The government needs to affirm its commitment to structural reforms that promote competition, secure property rights, lessen regulatory complexities, and improve the country’s investment climate. Investing in the future means prioritizing both physical infrastructure and human capital investments such as in education, skills, and health, as this will create better employment opportunities, especially among the poor.
Box 8: The Next Steps for the Government’s Tax Reform Program.
In 2018, the government hopes to pass a number of tax reform packages to make the Philippine tax system more efficient, equitable, and competitive, starting with Package 2 of the comprehensive tax reform program. Package 2 of the reform program, which was submitted to Congress on January 16, 2018, aims to gradually lower the corporate income tax rate from the current 30 percent to 25 percent by 2022. The adjustment of the corporate income tax rate will be offset by the modernization of various investment tax incentives offered by the government, which will be designed to make incentives more performance-based, targeted, time-bound, and transparent. Moreover, package 2 aims to broaden the tax base through the repeal of 123 special laws on investment tax incentives and consolidating these into a single omnibus incentives law. Package 2 will also repeal various exemptions provided through the national internal revenue code, although the Department of Finance has proposed to include value-added tax exemptions for the coal industry and casinos, which were previously removed in the final version of the TRAIN law. The government aims to ratify package 2 in December 2018.
In addition, supplemental packages to packages 1 and 2 are currently being prepared by the Department of Finance. Congress is targeting the passage of supplemental tax package 1B in 2018, which is expected to include a real estate tax amnesty, a general tax amnesty, amendments to the bank-secrecy law, and adjustments to the Motor Vehicle Users Charge. The Department of Finance estimates that Package 1B will generate Php38.9 billion in additional revenue in 2018. Moreover, the Department of Finance is currently in the process of preparing package 2 plus, which consists of an adjustment in tobacco and alcohol excise taxes and taxes on mining activities. Finally, package 3, which focuses on property taxation, and package 4, which focuses on passive income and financial taxes, are targeted to be submitted to Congress in July 2018.
Source: Department of Finance.
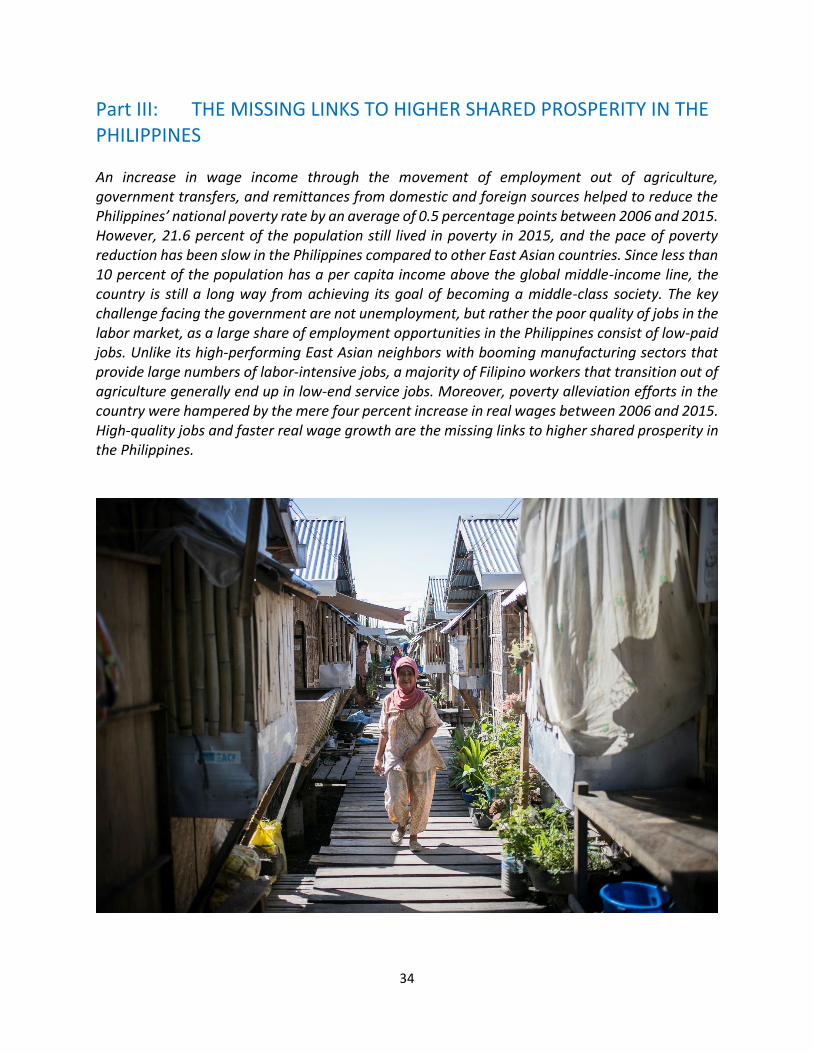
34
Part III: THE MISSING LINKS TO HIGHER SHARED PROSPERITY IN THE PHILIPPINES An increase in wage income through the movement of employment out of agriculture, government transfers, and remittances from domestic and foreign sources helped to reduce the Philippines’ national poverty rate by an average of 0.5 percentage points between 2006 and 2015. However, 21.6 percent of the population still lived in poverty in 2015, and the pace of poverty reduction has been slow in the Philippines compared to other East Asian countries. Since less than 10 percent of the population has a per capita income above the global middle-income line, the country is still a long way from achieving its goal of becoming a middle-class society. The key challenge facing the government are not unemployment, but rather the poor quality of jobs in the labor market, as a large share of employment opportunities in the Philippines consist of low-paid jobs. Unlike its high-performing East Asian neighbors with booming manufacturing sectors that provide large numbers of labor-intensive jobs, a majority of Filipino workers that transition out of agriculture generally end up in low-end service jobs. Moreover, poverty alleviation efforts in the country were hampered by the mere four percent increase in real wages between 2006 and 2015. High-quality jobs and faster real wage growth are the missing links to higher shared prosperity in the Philippines.

35
3.1 Introduction
42. The Government of the Philippines has formulated strategic plans with a clear focus on reducing poverty and improving living standards. To achieve the vision of the Ambisyon 2040 and the Philippines Development Plan 2017-2020 to reduce poverty to 13-15 percent by 2022, authorities need to evaluate best practices and identify the key elements that affect the inclusiveness of growth. This focus note aims to study the impact of growth on the living conditions of Filipinos and provide policy suggestions that address the main constraints to strengthen inclusive growth and accelerate poverty reduction. 43. Economic growth helped to reduce national poverty in the Philippines over the past decade. Between 2006 and 2015, the country’s average annual GDP grew by 5.4 percent and by 3.8 percent in per capita terms. This robust growth rate helped to push the national poverty rate from 26.6 percent in 2006 to 21.6 percent in 2015, declining by an average of 0.6 percentage points per year (Figure 32 and Figure 33).
Figure 32: National Poverty Rates and Number of Poor
Figure 33: Poverty Trends Based on National and International Poverty Lines
Source: World Bank staff estimates using various rounds of the Family Income and Expenditure Survey.
Source: World Bank staff estimates using various rounds of the Family Income and Expenditure Survey.
44. Yet, poverty remains high and the pace of poverty reduction has been slow compared to other East Asian countries. With a Gini coefficient of 45, income inequality is higher in the Philippines than in most developing countries in East Asia. Also, the country’s poverty rate, measured against the international poverty line of US$1.90 per day, declined by an average of 0.9 percentage points per year between 2006 and 2015, far slower than in China (2.4 percentage points), Indonesia (2.2 percentage points), and Vietnam (2.1 percentage points) (Table 4). Measured against the lower middle-class poverty line of US$3.20 per day, the Philippines poverty rate declined by an average of 1.3 percentage points per year in the same period, slower than the average 3–5 percentage points for the group of select East Asian countries.

36
Table 4. Poverty Rate in Selected East Asian Countries
US$1.90/day US$3.20/day
(international poverty line) (lower middle income class poverty line)
Country 2006a 2015a Decline per year 2006a 2015a Decline per year
Thailand 0.7 0.0 0.1 6.2 1.1 0.7
China 18.8 1.9 2.4 43.5 20.2 3.3
Vietnam 19.5 2.8 2.1 51.3 11.6 5.0
Indonesia 27.5 7.5 2.2 65.6 34.0 3.5
Philippines 14.5 6.6 0.9 38.4 27.0 1.3
Source: Staff estimates. a. Data for Thailand are for 2006 and 2013; 2005 and 2012 for China; and 2006 and 2014 for Vietnam.
The Philippines uses income as the welfare measures, other countries use consumption.
45. The Philippines stands out among many East Asian countries for its lack of progress in eliminating poverty and promoting economic security and its middle class (Figure 34). The country’s persistent high level of income inequality has limited the responsiveness of poverty reduction to economic growth. Even at the middle of the spectrum of the country’s income distribution the Philippines’ performance lagged. Many East Asian countries have fared better such as China and Vietnam, which have made significant progress in reducing economic vulnerability. The share of the economically secure in the Philippines increased from 37 percent in 2002 to only 44 percent in 2015, compared to one-fifth to two-thirds in the region. Moreover, the share of the population with per capita income above the global middle-income line of US$15 per day was only 9.2 percent in 2015, lower than in Malaysia (65.7 percent), Thailand (35.4 percent), and China (19.4 percent). As a result, the Philippines is still a long way from achieving its goal of becoming a middle-class society.
Figure 34: Prosperity Improvement in the Philippines Compared to the East Asia Pacific Region
A. Population Distribution by Economic Class in the Philippines, 2002–15
B. Population Distribution by Economic Class in East Asia and Pacific, 2002–15

37
Note: Percent of total population.
Source: East Asia and Pacific Team for Statistical Development.
Note: Percent of total population.
Source: East Asia and Pacific Team for Statistical Development.
46. Unlike in high-performing East Asian countries with booming economies and manufacturing sectors that provide large numbers of labor-intensive jobs, the majority of workers in the Philippines that transition out of agriculture generally end up in low-end service jobs. The anemic 4 percent growth in real wages between 2006 and 2015 brought limited gains for workers following the economy’s structural transformation and limited the impact of economic growth on poverty alleviation. 51 47. The inclusiveness of growth needs to increase if it is to substantially reduce poverty and create a growing middle class. Government policies can help establish mutually reinforcing positive cycles that will accelerate more inclusive growth and create a growing middle class well-integrated with other groups. Creating more well-paying jobs will require interventions across multiple sectors that address both supply- and demand-side constraints.
48. A better understanding of the factors that drive poverty alleviation and the missing links between economic growth and poverty reduction is needed for creating meaningful policy recommendations. Section 2 of this focus note examines achievements in poverty reduction; section 3 discusses the missing links to real wage growth; and section 4 highlights the importance of education in increasing wages and participation in the labor market. Finally, section 5 provides policy recommendations for to accelerate poverty reduction and increase the inclusiveness of growth.
3.2 Drivers of Poverty Reduction
49. In the past, the most important drivers of poverty reduction in the Philippines were increases in wage income due to a transition of workers out of agriculture. Other key factors were government transfers and remittances from domestic and foreign sources (Figure 35). Wages and salaries, entrepreneurial income, and transfers accounted for four-fifths of total household income. 50. The increase in wage income and movement of workers out of agriculture contributed about two-thirds of the decline in poverty between 2006 and 2015. Higher non-agricultural wages were the main contributor, accounting for over 50 percent of the reduction in poverty. While most of the poor in the Philippines continue to work in agriculture, data from the Labor Force Survey indicate that the share of the population in primary production agriculture
51 51 Due to the data limitation, the analysis of real wages covers the workers who reported positive wages only. The earning of those self-employed and who work without pay are not included in the statistics. The results related to wages need to be interpreted with caution. The information collected from the Labor Force Survey is from a sole informant for each household. The respondent is either the household head, the spouse of the household head, or in their absence, any responsible adult member of the household. Second-hand accounts of sensitive information such as wage and salary may be either underestimated or overestimated.

38
(excluding agribusiness) declined by nearly 1 percentage point each year from 2006 to 2015 (Figure 36). Workers that transitioned to non-agricultural jobs increased their living standards, as even lower-end industry and service jobs paid more than agriculture jobs (Figure 37).
Figure 35: Contribution of Income Sources to Poverty Reduction, 2006–2015
Source: Estimates using various rounds of the Family Income and Expenditure Survey. International poverty is defined as
household income per capita below US$1.90 a day (2011 PPP), and lower-middle-income-class poverty is defined as household
income per capita below US$3.20 a day.
Figure 36: Millions of Workers Transitioned out of Agriculture
Figure 37: Greater Earnings in Services and Manufacturing than in Agriculture
Source: Labor Force Survey 2006 and 2015. Source: World Development Indicators.
51. Transfers from government social programs contributed about 25 percent of the reduction in poverty. Pantawid Pamilya, the national conditional cash-transfer program, expanded rapidly over the past years and is now the primary government social assistance program for the

39
poor. It extends cash grants to 77 percent of the country’s poor households and helps to reduce poverty and build human capital. World Bank estimates indicate that the program has reduced the national poverty rate by up to 1.5 percentage points. Pantawid Pamilya also improved school enrollment of older children, encouraged early childhood education, and increased health-seeking behavior among beneficiaries. 52. Remittances from domestic and foreign sources contributed about 12 percent and 6 percent, respectively, of the decline in poverty. Two-thirds of all Filipinos, or 15 million households receive domestic or foreign remittances. While foreign remittances are much higher in value, both types of transfers reduced the poverty rate by up to 4 percentage points. Domestic remittances were more prevalent among the poor, while foreign remittances were more common among the non-poor.
53. Entrepreneurial income had a 15 percent negative effect on poverty reduction. Entrepreneurial activities vary in the Philippines, which may be reflected in their aggregate negative effect on poverty. Poor rural households typically engage in agriculture-related activities, while the urban poor often engage in lower-end services, and the non-poor more commonly participate in businesses. Nevertheless, entrepreneurial income from agriculture-related activities offers an opportunity to reduce rural poverty if efforts are made to address productivity constraints, access to finance, extension services, and climate change.
3.3 The Remaining Challenge: Low-quality Jobs and Slow Real Wage Growth
54. The Philippines’ slow pace of poverty reduction compared to other countries in the region is due to various factors, including less pro-poor economic growth, high inequality of income and wealth, the high frequency of disasters and the presence of conflict. While the role of wage income in poverty reduction is similar to many other developing countries, the Philippines has experienced much slower growth in real wage incomes. The Philippine labor market suffers from a lack of quality jobs, which means that most of the poor are working poor, as low-paying jobs or underemployment prevent them from graduating out of poverty. For example, some households earn as little as 50–100 pesos (US$1–2) a day, and many urban poor are trapped in low-wage and low-productivity jobs in the informal service sector. Therefore, the government needs to make growth more inclusive to make it possible for Filipinos to achieve higher and more stable income through productive employment. 55. Poor-quality jobs (or “in-work poverty”), rather than unemployment, constitute the key challenge for government to reduce poverty. 52 Poverty is closely associated with the employment sector and the activity status of the household head, not whether the household head is employed (Figure 38 and Figure 39). The poverty rate for households with a household head that is employed is close to the national average of 21.6 percent (based on the national poverty line). Households headed by individuals that work in agriculture or are self-employed have the highest rate of poverty, highlighting the importance of job quality and that a job is not
52 World Bank (2016).

40
a ticket out of poverty. As a result, many poor families are headed by the working poor and agricultural workers. Households headed by those not employed, a large share of which are migrants, or family business owners, had the lowest poverty rate.
Figure 38: Poverty Rate by Employment Sector of Household Heads
Figure 39: Poverty Rate by Employment Status of Household Heads
Source: World Bank staff estimates based on the national poverty line using Family Income and Expenditure Survey, 2015.
Source: World Bank staff estimates based on the national poverty line using Family Income and Expenditure Survey, 2015.
56. Labor market development in the past decade was characterized by high growth in the number of jobs. Strong economic growth contributed to the steady decline in the unemployment rate from 8.0 percent in 2006 to 6.9 percent in 2015. With consistent net positive job creation, employment growth was at par with the working-age population growth (both at about 20 percent over the period) and even slightly faster than the growth of the labor force (about 16 percent), resulting in a decline in the unemployment ratio (Figure 40).
57. However, a large share of the jobs created were low-wage jobs. Moreover, the rapid expansion of employment might have also exerted negative pressure on wages. Although employment increased by 20 percent between 2006 and 2015 when the country’s GDP increased by about 60 percent, real wages remained stagnant, with only a four percent increase in real terms over the period (Figure 41).53 While attractive in the short run, the low growth of real wages is likely to have a negative effect on the competitiveness of the country’s economy in the long run, as the most educated Filipinos leave the country for better job opportunities. There are currently 6 million Filipino migrants working abroad, which might be an indication that this human capital flight is already happening.
53 The information collected from the Labor Force Survey is from a sole informant of each household. The respondent is either the household head or the spouse or, in their absence, any responsible adult member of the household. Second-hand accounts of sensitive information such as wage and salary may be underestimated (or overestimated). Due to the data limitation, the analysis of real wage covers the workers who reported positive wage only. The earning of those self-employed and work without paid are not included in the statistics. The results related to wage need to be interpreted with caution.

41
Figure 40: Working-age Population, Labor Force, and Employment Growth
Figure 41: GDP, Employment, and Real Wage Growth
Source: World Bank staff estimates using various rounds of the Labor Force Survey.
Source: World Bank staff estimates using various rounds of the Labor Force Survey.
58. In recent decades, the structural change that started in the 1970s continued as millions of jobs shifted from primary production agriculture to the services sector (Figure 42 and Figure 43). Unlike in many neighboring East Asian countries where surplus agricultural labor moved to the labor-intensive manufacturing sector, the majority of workers in the Philippines who transited out of agriculture were employed in the services sector. The share of agriculture in total employment fell from about 36 percent in 2006 to 28 percent in 2015, while the share of the services sector rose from about 49 percent to 55 percent over the same period. Meanwhile, the share of the labor force working in industry increased from 15 percent in 2006 to just 17 percent in 2015. Between 2006 and 2015, the share of the poor employed in agriculture declined from 67 percent to 58 percent, the share of the poor working in industry increased from 10 percent to just 13 percent, and the share of the poor with services jobs increased from 23 to 29 percent. 59. A large share of the unskilled labor that transitioned to non-agriculture employment ended up in low-wage and low-skilled jobs in the informal services sector. According to the World Bank’s Philippines Development Report,54 more than three-quarters of the services sector is composed of low-paid and low-skilled jobs in areas such as petty retail trade and public transportation. The low productivity of the services sector did not provide the basis for large wage increases, limiting the scope of poverty reduction and shared prosperity. The minimal raise in wages over the last decade suggests that labor gains from the structural shift of workers to non-agricultural sectors have been limited. With a low rate of investment (20 percent of GDP), the Philippines’ consumption-driven pattern of growth may further restrict the potential of structural transformation in the labor market and improvement in labor productivity.
54 World Bank (2013).

42
Figure 42: Share of Employment of the Poor by Sector
Figure 43: Share of Employment of an Average Filipino by Sector
Source: World Bank staff estimates using Labor Force Survey, various rounds.
Source: World Bank staff estimates using Labor Force Survey, various rounds.
60. The Philippines has transitioned from an agricultural economy to a (low-end) services economy without developing a manufacturing sector. The country’s labor productivity growth comes mainly from within-sector productivity growth (Figure 44). This is contrary to the development patterns of many neighboring countries in East Asia, where booming manufacturing sectors created large numbers of labor-intensive jobs, absorbing the surplus labor from agriculture. It is an ongoing debate whether manufacturing can still deliver the same productivity gains and well-paid employment opportunities for the unskilled workers as in the past.
Figure 44: Intersectoral Labor Allocation in Select East Asian Countries
Source: World Bank (2017a), page 66. World Bank staff estimates based on data from the Groningen Growth and Development Centre 10-Sector Database; www.rug.nl/ggdc/productivity/10-sector.

43
61. As a result, the country’s labor market has been characterized by a low unemployment rate, a high underemployment rate, and a limited increase in real wages (Table 5). The average employment and earning status of Philippine households has changed little over the past decade. On average, the ratio of the working-age population to total population was about 66 percent over the past decade. Labor force participation declined slightly from 63 percent in 2009 to 61 percent in 2015. Moreover, the ratio of employment to working-age population was around 58 percent and has changed little over time. The unemployment rate fell from nearly 8 percent in 2006 to 6 percent in 2015, but this masks the challenges associated with low-quality jobs. Despite the decline in unemployment, underemployment—those who work but are willing and available to work “more adequately”— has remained persistently high, in the range of 20-22 percent, since 2006.55
Table 5. Employment and Earnings Status, Percent
Year
Working-age population
(>=15)/total population
Labor force participation
rate
Employment to working-
age population
ratio Unemploy-ment rate
Underem-ployment rate
Daily wage (2006 pesos)
2006 65 63 58 8 22 259
2009 67 63 58 7 20 263
2012 67 62 58 7 21 263
2015 67 61 58 6 20 269
Growth, 2006–15 1 -2 -1 -2 -2 4
62. Between 2006 and 2015, real wages grew by only 1.5 percent for private establishment workers, while they grew by 11 percent and 9 percent for public employees and private household workers, respectively. Over the same period, private establishment jobs in total employment increased, while wage employment in private households, self-employment, and unpaid work declined (Figure 45). In sum, growth in real wages was minimal while there was a shift in the labor market to employment with higher earning potential. The increase in real wages among workers in the public sector was related to legislative changes to public-sector wages, 56 whereas the small increase in real wages for private-sector workers, who constitute the largest
55 Underemployment is defined by the International Labor Organization as, “those who worked or had a job during
the reference week but were willing and available to work “more adequately.” 56 Two laws involving the standardization of public-sector salaries were implemented in the last 10 years. The first was Joint Resolution No. 4 by the Fourteenth Congress that authorized President Gloria Macapagal-Arroyo to modify the compensation package for government, military, and uniformed personnel. The revised compensation took effect 1 year after it was signed in July 2008 for employees in national government offices and after 18 months for employees in local governments. The salary increase was implemented in equal tranches over four years. Another round of salary standardization through Executive Order No. 201 took effect in July 2016. This legislation ensured comparability of public-sector wages, particularly management-level positions, with prevailing rates in the private sector. This new adjustment in wages will take effect in stages through 2019. Another important piece of wage legislation is the Domestic Workers Act or Kasambahay Law, which regulates wages given to household employees and enforces the provision of social and other benefits. Wages of workers in private households have grown by an average of 4.2 percent annually since the law was passed in January 2013.

44
share of employed workers, suggest limited labor gains from the recent structural transformation of the labor market.
Figure 45: Countries Changes in the Composition of Employment Status Over Time
Source: LFS, various rounds
3.4 The Importance of Education in Labor Market Participation and Wage Growth
63. Labor market status is closely associated with a worker’s level of education. While unemployment is lower for individuals with the least education (since the poor cannot afford to be idle and not working), workers with higher educational attainment have significantly higher wages than those with little or no education (Table 6). The share of college-educated individuals who are underemployed is only half of those with lower educational attainment, and their daily wage is nearly 250 percent of those with a high school education, over three times of those with an elementary school education, and over four times of those with no schooling.
Table 6. Employment, Unemployment, and Daily Earnings by Educational Attainment, Perent
Education level Employment-to-working-
age population ratio
Underemployment rate
Unemployment rate
Daily wage (2006 pesos)
No schooling 52 22 3 115
Some elementary 68 27 3 141
Elementary graduate 66 24 4 158
Some high school 46 24 7 166
High school graduate 60 20 9 206
Some college 47 17 10 280
College graduate 67 11 8 506

45
64. Labor markets in the Philippines offer significant returns to education. Educational attainment, particularly secondary school completion, plays an important role not only in an individual’s ability to become employed (particularly in wage employment in private establishments, the government, or government corporations) but also affects his or her wage earnings.57 65. Having another year or level of education is strongly associated with better wage employment in private establishments, the government, and public corporations. However, returns vary by level of education. While the wage returns for an additional year of high school are a modest 6 percent per year, completing high school opens up the possibility of attending college or completing technical and vocational education and training (TVET), which have much higher returns (Figure 46). On average, each year of college boosts wages by 19 percent, and returns to TVET are 11 percent per year of schooling. For example, the rate of return for one additional year of college education is about 19 percent, while it is 6 percent for completing a high school education. Education benefits particularly women who are disadvantaged in the labor market. The gap in the rate of return on education between rural and urban areas is not as large as that between genders (Figure 47).
Figure 46: Rate of Return for Another Year of Education
Figure 47: Rate of Return for Education by Education Level
Source: World Bank staff estimation using the Labor Force Survey, 2015.
Source: World Bank staff estimation using the Labor Force Survey, 2015.
57 This section empirically discusses estimated returns to education using the Mincer (1974) method for education level, gender, rural/urban areas, and island groups, and the role of educational attainment for those who worked for private establishments, government or government corporations, were employers in own family-operated farms or businesses, or worked for pay in own family-operated farms or businesses in the Philippines. The majority of those who worked for private households worked without pay in own family-operated farms or businesses or were self-employed. Those without paid employees do not report wage earnings in the Labor Force Survey, So the discussion here includes only wage earners in the private establishments and government or government corporations.

46
66. Educational attainment is also positively associated with wage employment in private establishments, the government, and government corporations. 58 The probability of wage employment increases by 2.4 percentage points with another year of schooling (Figure 48). Again, this benefits women more than men, and rural areas more than urban areas (Figure 49). More significantly, completion of tertiary education is particularly important for wage employment, as it increases the probability of employment by 4.0 percentage points. The highest marginal increase in the probability of wage employment is observed in rural areas. This may be related to a scarcity of workers with a college education and greater competition for wage jobs in rural areas compared to urban areas. The effect of tertiary education is not significantly different in terms of wage employment for women and men. However, high school completion exhibits a big difference between men and women, as it is particularly important for women to at least complete high school if they intend to apply for wage jobs. Differences in school attainment and learning between children from poor and wealthier families result in differences in their earning power as adults, perpetuating inequality across generations.
Figure 48: Marginal Effect on the Probability of Wage Employment with an Additional Year of Schooling by Gender and Location
Figure 49: Marginal Effect on the Probability of Wage Employment with an Additional Year of Schooling by Education Level
Source: World Bank staff estimation using the Labor Force Survey, 2015.
Source: World Bank staff estimation using the Labor Force Survey, 2015.
67. The labor force has become more educated, and the younger generation is more educated than the older. The share of the labor force with complete tertiary education has gradually increased from 14 percent in 2006 to 17 percent in 2015. In 2015, 24 percent of the 25–34 age group had completed tertiary education, which was double that of the 55–64 age group. Only 2 percent of the labor force in poor households had completed tertiary education in 2015, compared to 20 percent in non-poor households, and the youth in poor household was much less educated that their wealthier counterparts. In 2015, 60 percent of the youth (20–29
58 The estimated returns to education omits individuals who are not wage earners in private establishments, government, or government corporations.
Elementary
High School
Technical and Vocational
College
Rural Urban Female Male All

47
years old) in the bottom income quintile did not have a full secondary education, compared to only 5 percent of the youth in the richest income quintile (Figure 50). Similarly, only 2 percent of the youth from the poorest quintile and 7 percent from the second-poorest quintile had completed tertiary education in 2015, compared to nearly 60 percent from the richest quintile. Workers with less than secondary education earn significantly less and are more likely to fall into poverty. The large gaps in educational attainment of the youth from the poor and non-poor households might perpetuate the gaps in their earning ability and income status.
Figure 50: Youth (20–29 years old) Education Levels Across Income Groups
Source: World Bank staff estimation using the Labor Force Survey, 2015.
68. Despite the overall progress in improving access to basic education, the high dropout rate in secondary education, particularly among the poor, remains a challenge. In 2015, 82 percent of young adults from the richest quintile had attained at least elementary education, compared to 67 percent from the poorest quintile. The gaps in secondary education were much wider, as 81 percent of young adults from the richest quintile had attained secondary education in 2015, compared to 41 percent from the poorest quintile (Figure 51). Moreover, female students completed their elementary and high school studies more often than their male counterparts (Figure 52). The high dropout rate in secondary schools, particularly for poor households, might be related to the perceived lack of learning in school, the increasing teen pregnancy rate, and the financial constraints or opportunity costs of staying in school. 69. Dropout rates are highest among children from households in the bottom income quintile. About half of all boys and a third of all girls in the poorest quintile who dropped out of school cite a “lack of personal interest in education” as the primary reason for exiting school (Figure 53 and Figure 54). This could reflect a perception among both students and parents that there is a low level of learning in the country’s schools, which may be related to high opportunity costs and uncertainty of economic returns to education (or insufficient information about such returns), particularly among boys. Many children from poor households need to contribute to the immediate welfare needs of their families, which often prevents them from staying in school.

48
Figure 51: Educational Attainment Rate among 22–24 Year-olds by Income Quintiles, 2006-15
Figure 52: Educational Attainment Rate among 22–24 Year-olds by Gender, 2006-15
Source: Merged Family Income and Expenditure Survey-Labor Force Survey, various years.
Source: Merged Family Income and Expenditure Survey-Labor Force Survey, various years.
Figure 53: Reasons for Not Attending Elementary School among 6- to 11-Year-olds in the Poorest Quintile, 2014
Figure 54: Reasons for Not Attending High School among 12- to 15-Year-olds in the Poorest Quintile, 2014
Source: APIS 2014. Source: APIS 2014.
70. Poor health and financial constraints are often major reasons for students dropping out of school. The poor health of many elementary school children is a major concern and one of the main reasons for students dropping out of basic education. About 20 percent of boys and girls who are not attending elementary school cited health or disability conditions as the main reasons for dropping out of school. The Department of Education has carried out a school-based feeding program since 2010 to help malnourished children keep their focus in the classroom, and it

49
reached about 1.9 million student beneficiaries in the 2016–17 school year. However, a recent independent impact evaluation revealed mixed results about the program’s effectiveness and sustainability.59 Moreover, financial concerns and the cost of education are also significant issues for households in the bottom income quintile, particularly for attending high school. About half of the girls who were not attending high school pointed to financial concerns as the most significant reason for not attending school, compared to about a third of male dropouts.
3.5 Conclusion
71. The Philippines need to make economic growth more inclusive, particularly through the creation of more well-paying jobs, to reduce poverty and create a growing middle class. A vicious cycle of unequal investment in human capital and a lack of quality job opportunities has trapped generations of households in poverty. To break this cycle, the government needs to adopt mutually reinforcing policies that will create a growing middle class that is well-integrated with other income groups. This should include the implementation of interventions across multiple sectors that address both supply- and demand-side constraints for creating more well-paying jobs in the labor market. 72. Access to more well-paying jobs, particularly semi-skilled jobs that are suited for workers with less than a high school education, will help to reduce poverty and address inequality through higher wage incomes. This will require the government to improve the business environment to attract more investment, upgrade value chains to support strong and sustainable growth, and strengthen backward and forward linkages to take advantage of skilled labor and create jobs for the unskilled.
73. The country’s investment-to-GDP ratio is low compared to its high-performing East Asian neighbors. To attract more private investment, authorities need to improve the business environment, particularly through addressing institutional constraints, strengthening competition in key sectors, securing property rights, providing risk-management solutions, and simplifying business regulations.
74. The Philippines has transitioned from an agricultural economy to a (low-end) service economy without developing a manufacturing sector. Therefore, the country needs to find its specific niches in the services sector and in regional and global value chains to capitalize on its growing service offering and increase the productivity gains from the labor market’s structural transformation. Specifically, authorities need to address both forward and backward linkages between the service, manufacturing, and agriculture sectors to upgrade domestic goods and services. The Philippines could leverage its strong performance in BPO to expand other service-based sectors and create more productive employment opportunities, including jobs with skill requirements compatible with workers from poor households.
59 Tabunda, et.al. (2016).

50
75. The government needs to improve human capital, especially for poor households, to ensure that Filipinos acquire the skills needed in the 21st century economy. It is especially important to invest in children starting in the first 1,000 days and target support to poor households and vulnerable groups to help them mitigate shocks and improve their human capital. Key education and skills challenges facing the Philippines include ensuring that students that are in school learn relevant skills, reducing the high dropout rates for the poor, and developing socioemotional skills. Specifically, public authorities need to boost learning in basic education, increase enrollment and completion rates in secondary education among the poor, and develop socioemotional skills in addition to traditional technical and cognitive skills.

51
References Department of Budget and Management. (2018). National Budget Memorandum no. 129. Available Online: https://www.dbm.gov.ph/index.php/209-latest-issuances/national-budget-memorandum/2018/406-national-budget-memorandum-no-129. March 23, 2018. ___________. (2016). Guide to the Two Tier Budget Approach: 2TBA, A tool for agencies. Available Online: https://www.dbm.gov.ph/index.php/budget-documents/2017/guide-to-the-two-tier-budget-approach-2tba. March 23, 2018. De Vera, B. (2018). Neda: Groundbreaking of 34 ‘flagship’ infra projects set for 2018. Philippine Daily Inquirer. Available Online: http://business.inquirer.net/244373/neda-groundbreaking-34-flagship-infra-projects-set-2018. January 18.
Geronimo, J. (2017). Agriculture damage from Urduja reaches P1 billion. Rappler, Available Online: https://www.rappler.com/business/192090-agriculture-damage-urduja-december-22. December 23. International Monetary Fund. (2017). Regional Economic Outlook Update: Making the most of the Upswing. Washington D.C., International Monetary Fund. IT and Business Process Association of the Philippines. (2017). Accelerate PH: Future Ready Roadmap 2022, The Philippine IT-BPM Sector. Available Online: http://itbpm-roadmap2022.ibpap.org/. March 18, 2018. Mincer, J. (1974). Schooling, Experience and Earnings. New York: Columbia University Press. Philippine Economic Zone Authority. (2018). Operating Economic Zone Map. Available Online: http://www.peza.gov.ph/index.php/economic-zones/list-of-economic-zones. March 18, 2018.
Saulon, V. (2017). Electronics Group wants more Local Content in Export Goods. Business World. Available Online: http://www.bworldonline.com/content.php?section=Corporate&title=electronics-group-wants-more-local-content-in-export-goods&id=147341. April 10, 2018.
Tabunda, A., Albert, J. and I. Angeles-Agdeppa. (2016). Results of an Impact Evaluation Study on DepED's School-Based Feeding Program. Philippines Institute for Development Studies.
World Bank. (2013). Philippine Development Report: Creating More and Better Jobs. Washington, DC: World Bank.
__________. (2016). Republic of the Philippines Labor Market Review: Employment and Productivity. Washington, DC: World Bank.
__________. (2017a). East Asia Pacific Economic Update: Sustaining Resilience. Washington D.C., World Bank. __________. (2017b). Philippines Economic Update: Preserving Consistency and Policy Commitment. Washington D.C., World Bank.

52
__________. (2018a). Global Monthly newsletter, January 2018. Washington D.C., World Bank. __________. (2018b). Global Monthly newsletter, March 2018. Washington D.C., World Bank. __________. (2018c). Global Economic Prospects, January 2018: Broad-Based Upturn, but for How Long? Washington D.C., World Bank. __________. (2018d). East Asia Pacific Economic Update: Enhancing Potential. Washington D.C., World Bank.

53
Table A.1. Key economic indicators (2016 to 2020)
2016 2017 2018 2019 2020
Growth and inflation
Gross domestic product (percent change) 6.9 6.7 6.7 6.7 6.6
Inflation (period average) 1.3 2.9 3.3 3.0 3.0
Savings and investment
Gross domestic savings 15.3 15.4 15.6 15.7 15.9
Gross domestic investment 24.6 25.2 25.5 26.0 26.5
Public sector
National government balance (GFS basis)1/ -2.5 -2.3 -2.6 -2.7 -2.9
National government balance (gov't definition) -2.4 -2.2 -2.5 -2.6 -2.8
Total revenue (government definition) 15.2 15.7 16.3 16.8 17.0
Tax revenue 13.7 14.2 14.8 15.2 15.4
Total spending (government definition) 17.6 17.9 18.8 19.6 20.0
National government debt 42.1 42.1 41.4 40.8 40.3
Balance of payments
Merchandise exports (percent change) -1.1 12.8 9.8 9.9 10.0
Merchandise imports (percent change) 17.7 14.2 17.8 18.4 19.0
Remittances (percent change of US$ remittance) 4.9 5.3 5.5 5.5 5.5
Current account balance -0.4 -0.8 -1.2 -1.4 -1.6
Foreign direct investment (billions of dollars) 8.3 10.0 8.0 8.5 9.0
Portfolio Investment (billions of dollars) 0.4 -0.2 -0.4 -0.5 -0.6
International reserves
Gross official reserves2/ (billions of dollars) 83.5 81.3 81.0 80.5 80.0
Gross official reserves (months of imports)3/ 9.7 8.4 8.2 8.0 7.8
External debt4/ 24.5 23.3 23.0 22.8 22.6
1/ Excludes privatization receipts and includes CB-BOL restructuring revenues and expenditures (in accordance with GFSM)
2/ Includes gold
3/ Defined as the total of goods and services imports
4/ Central Bank definition
Sources: Government of the Philippines for historical and World Bank for projections.
Actual Projected
(in percent of GDP, unless otherwise indicated)

54
Table A.2. National government cash accounts (GFS basis) (2016-2018)
2016 2017 2018
Actual Actual Budget
Revenue and grant 15.2 15.7 16.3
Tax revenue 13.7 14.2 15.3
Net income and profits 6.4 6.5 6.4
Excise tax 1.1 1.3 1.4
Sales taxes and licenses 2.3 2.3 2.5
Others 1.1 1.2 1.4
Collection from Customs 2.7 2.9 3.6
Nontax revenue1/ 1.5 1.9 1.0
Grant 0.0 0.0 0.0
Total expenditure 17.6 17.9 19.3
Current expenditures 13.2 13.4 13.4
Personnel services 5.2 5.1 5.13/
MOOE 2.9 2.9 3.2
Allotment to LGUs2/
2.4 2.5 2.4
Subsidies 0.5 0.8 0.7
Tax expenditures 0.0 0.1 0.0
Interest payment 2.1 2.0 2.0
Capital outlays 4.4 4.8 5.8
Net lending 0.1 0.1 0.1
Balance (GFS definition) -2.5 -2.3 -3.1
Balance (GOP definition) -2.4 -2.2 -3.0
Primary Balance (GFS) -0.3 -0.2 -1.0
Memorandum items
Privatization receipts (PHP billions) 0.7 2.0 2.0
Nominal GDP (PHP trillion) 14.5 15.8 17.5
1/ Excludes privatization receipts (these are treated as financing items in accordance with GFSM).
(in percent of GDP, unless otherwise indicated)
Sources: Department of Finance, Bureau of Treasury, and Department of Budget and Management, and
World Bank staff calculations
2/ Allocation to local government units (LGUs) excludes capital transfers, which are included in capital
outlays.
3/ Based on national government cash budget. On an obligation basis, personnel services make up 6.2
percent of GDP.