phenomena – a visual environment for querying heterogenous spatial data
TRANSCRIPT
ARTICLE IN PRESS
Contents lists available at ScienceDirect
Journal of Visual Languages and Computing
Journal of Visual Languages and Computing 20 (2009) 420–436
1045-92
doi:10.1
� Cor
E-m
(M. Seb
robert.l1 Te
journal homepage: www.elsevier.com/locate/jvlc
Phenomena – A visual environment for querying heterogenousspatial data
Luca Paolino a, Monica Sebillo a,�, Genoveffa Tortora a, Giuliana Vitiello a, Robert Laurini b,1
a Dipartimento di Matematica e Informatica, Universita di Salerno, via ponte don Melillo, 84084 Fisciano (SA), Italyb LIRIS, INSA de Lyon, 69621 – Villeurbane Cedex, France
a r t i c l e i n f o
Article history:
Received 24 April 2008
Received in revised form
8 May 2009
Accepted 22 June 2009
Keywords:
Visual environments
Visual query languages
Geographic information systems
Continuous fields
Usability evaluation
6X/$ - see front matter & 2009 Elsevier Ltd. A
016/j.jvlc.2009.06.002
responding author. Tel.: +39 89963324.
ail addresses: [email protected] (L. Paolino), m
illo), [email protected] (G. Tortora), gvitiello@u
[email protected] (R. Laurini).
l.: +33 472438172.
a b s t r a c t
The need to perform complex analysis and decision making tasks has motivated growing
interest in Geographic Information Systems (GIS) as a means to compare different
scenarios and simulate the evolution of a phenomenon. However, data and function
complexity may critically affect human interaction and system performances during
planning and prevention activities. This is especially true when the scenarios of interest
involve continuous fields, besides discrete objects.
In the present paper we describe the visual environment Phenomena, where
continuous and discrete data may be handled through a uniform approach. We illustrate
how users’ activity is supported by a visual framework where they can interact with,
manipulate and query heterogeneous data, with a very small training effort. A
preliminary experimental study suggests that when users perform complex tasks, a
higher usability degree may be achieved compared to the adoption of a textual spatial
SQL.
& 2009 Elsevier Ltd. All rights reserved.
1. Introduction
Geographic Information Systems (GIS) are raisinggrowing interest among environmental experts andterritorial organizations, for their ability to manage spatialdata [21,22]. As a matter of fact, several applicationdomains may benefit from this capability, which resultscrucial when it is meant to perform complex analysistasks and provide decision making support. Indeed,providing professionals and researchers with a means tocompare different scenarios and simulate the evolution ofa phenomenon may represent a significant support toplanning and prevention tasks, where data and function
ll rights reserved.
nisa.it (G. Vitiello),
complexity affects human interaction and system perfor-mances.
1.1. Motivation
In order to reach this aim, the present research facesdifferent challenges. First of all, the specification of moreand more advanced spatial analysis procedures is a crucialrequirement, which arises from the complexity of real-world scenarios. Moreover, in order to handle theheterogeneity of spatial data, which may refer to bothdiscrete objects and continuous fields, a uniform frame-work has to be defined, where the specified data structuremay be queried in agreement with the standard SQLformalism, properly extended to spatial specifications.Last but not least, much attention has to be devoted todesign systems that are able to effectively support experts’activity through usable yet powerful interfaces, whichpresent several functionalities through a uniform
ARTICLE IN PRESS
L. Paolino et al. / Journal of Visual Languages and Computing 20 (2009) 420–436 421
approach, so hiding the inner complexity of data andfunctions.
As for the first issue, expert user communities areinvolved in the definition of algorithms and functions tobetter understand and represent the status of the Earth’ssurface and the evolution of phenomena related to it. Theinterest in such activities is also proved by the conspic-uous investments made by European and US organiza-tions in terms of projects [36].
As for the management of data and the specification ofquery languages, much work has been done with respectto discrete data. Leading companies offer different solu-tions for data management and querying, while literatureproposes several approaches towards the definition ofspatial query languages. In particular, when users need toquery spatial information systems to locate or computespatial data, two main approaches are available. The firstone allows to discover information by using programminglanguages. This is the case of ArcGISTM, which providesusers with the ability to navigate and select spatial databy means of specific API developed according to severalprogramming languages such as Visual Basic, Java, etc.[35]. This kind of approach is certainly hard to most usersbecause it requires specific computer science expertise.On the other side, spatial data may be organized asdatabases in specific DBMS and queried through high levelspatial query languages, defined in agreement with theOpen Geospatial Consortium specification [38]. Thisapproach is easier than the previous one because it allowsusers to find out information through a method thatemploys natural language-like sentences in a declarativeway. However, this still represents a complex solution formost categories of GIS end users, especially for advancedspatial analysis tasks.
A different approach should be considered whendealing with continuous fields. They represent featureswhich are continuously distributed over an area, withouta specific extent, such as temperature and other environ-mental indicators.
The idea of defining a continuous field as an abstract datatype involving all the information necessary to simulatecontinuity was first introduced by one of the authors, RobertLaurini, and by Silvia Gordillo in [13]. They defined aframework for modelling continuous fields, based on theobject-oriented paradigm. Within such a framework, con-tinuous data are managed in terms of samplings, on which aquery can be posed in order to build an interpolatingfunction characterizing the resulting field.
Since then, different proposals have been definedwhich take into account several aspects, ranging fromthe underlying query languages to data visualization, fromarchitectures aimed to store samples and geometries ofcontinuous fields to functions managing complex queries.
Finally, as for the design of systems able to both embedspatial data and functionality and support expert userswith a quite intuitive approach, visual query languagesand environments represent a well recognized solution.Indeed, several studies have shown that visual metaphorsreveal a promising means for allowing unskilled users toquery geographic databases and to interpret and possiblyreuse recorded queries [29].
Solutions about visual environments for discrete dataare well-established [2–5,16,26,27,29,31,34]. Visual querylanguages are used to associate data and functions with avisual representation which users may manipulate andspatially arrange in order to compose visual queries. Theunderlying query languages are then automatically in-voked for determining the resulting sets.
Much work has been done also to develop query-by-example methodologies based on iconic, diagrammatic,graph-based or multi-modal approaches [19,24]. Addi-tionally, some work about spatial DBMS allows users tosketch queries on specific interfaces [10,15].
Anyway, an integrated management of continuous anddiscrete data is still missing in most systems aimed atsupporting expert users in analysis and decision makingabout real-world scenarios. As a matter of fact, increasingattention is being devoted to interpret the mental modelwhich users adopt when dealing with continuous phe-nomena. Acquiring samples, applying interpolating func-tions and computing data require a tailored expertisewhich goes beyond the common abilities required tomanage information systems.
1.2. Goals of the present research
The research we have carried out is meant to provideusers with a visual environment where heterogeneousdata may be handled through a uniform approach. Inparticular, we aim to support users’ activity by means of aframework where they can interact with, manage andquery discrete objects and continuous data, with a verysmall training effort.
In order to reach this aim, in [28] we have firstintroduced an extended OpenGeospatial-based architec-ture able to store continuous data along with their spatialand temporal properties. Moreover, the associated querylanguage ESSQL extends the OpenGeospatial specificationwith respect to either the binary or the numeric strategy,depending on the SQL specifications of the underlyingDBMS.
In this paper we present Phenomena, a visual environ-ment embedding a visual query language, which inheritsfeatures of the extended OpenGeospatial specification andassociates visual representations with its components fordiscrete objects as well as continuous data manipulation.
Our previous work on visual representations fordiscrete data [8,27,29] forms the basis for the presentproposal, and our investigation started from the researchon modelling continuous fields carried out in [13].
The main extension we propose with Phenomena
consists in querying a continuous field by manipulatingit directly as a geographic data, which is characterized by adomain and its geometry and by a function describing itsbehaviour. This allows us to consider also topologicalrelationships, and, generally speaking, to handle contin-uous fields and discrete objects in a uniform way. Inparticular, the visual environment of Phenomena providesusers with a uniform style of interaction with the world,which is conceptually modelled as a composition ofcontinuous fields and discrete objects. Fields and data
ARTICLE IN PRESS
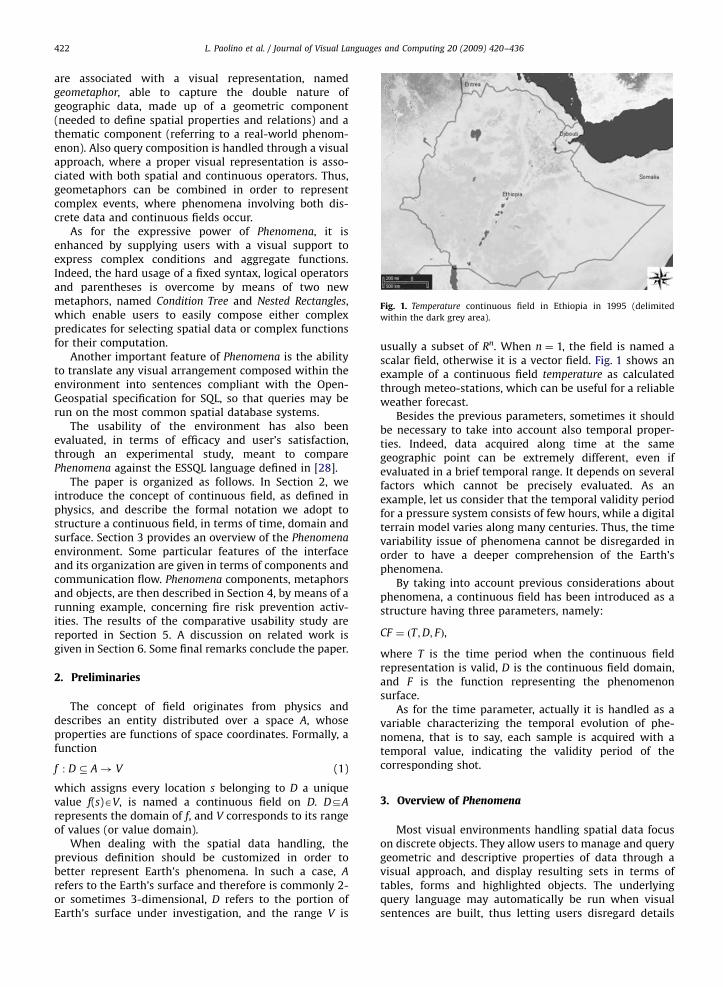
Fig. 1. Temperature continuous field in Ethiopia in 1995 (delimited
within the dark grey area).
L. Paolino et al. / Journal of Visual Languages and Computing 20 (2009) 420–436422
are associated with a visual representation, namedgeometaphor, able to capture the double nature ofgeographic data, made up of a geometric component(needed to define spatial properties and relations) and athematic component (referring to a real-world phenom-enon). Also query composition is handled through a visualapproach, where a proper visual representation is asso-ciated with both spatial and continuous operators. Thus,geometaphors can be combined in order to representcomplex events, where phenomena involving both dis-crete data and continuous fields occur.
As for the expressive power of Phenomena, it isenhanced by supplying users with a visual support toexpress complex conditions and aggregate functions.Indeed, the hard usage of a fixed syntax, logical operatorsand parentheses is overcome by means of two newmetaphors, named Condition Tree and Nested Rectangles,which enable users to easily compose either complexpredicates for selecting spatial data or complex functionsfor their computation.
Another important feature of Phenomena is the abilityto translate any visual arrangement composed within theenvironment into sentences compliant with the Open-Geospatial specification for SQL, so that queries may berun on the most common spatial database systems.
The usability of the environment has also beenevaluated, in terms of efficacy and user’s satisfaction,through an experimental study, meant to comparePhenomena against the ESSQL language defined in [28].
The paper is organized as follows. In Section 2, weintroduce the concept of continuous field, as defined inphysics, and describe the formal notation we adopt tostructure a continuous field, in terms of time, domain andsurface. Section 3 provides an overview of the Phenomena
environment. Some particular features of the interfaceand its organization are given in terms of components andcommunication flow. Phenomena components, metaphorsand objects, are then described in Section 4, by means of arunning example, concerning fire risk prevention activ-ities. The results of the comparative usability study arereported in Section 5. A discussion on related work isgiven in Section 6. Some final remarks conclude the paper.
2. Preliminaries
The concept of field originates from physics anddescribes an entity distributed over a space A, whoseproperties are functions of space coordinates. Formally, afunction
f : D � A! V (1)
which assigns every location s belonging to D a uniquevalue f(s)AV, is named a continuous field on D. DDA
represents the domain of f, and V corresponds to its rangeof values (or value domain).
When dealing with the spatial data handling, theprevious definition should be customized in order tobetter represent Earth’s phenomena. In such a case, A
refers to the Earth’s surface and therefore is commonly 2-or sometimes 3-dimensional, D refers to the portion ofEarth’s surface under investigation, and the range V is
usually a subset of Rn. When n ¼ 1, the field is named ascalar field, otherwise it is a vector field. Fig. 1 shows anexample of a continuous field temperature as calculatedthrough meteo-stations, which can be useful for a reliableweather forecast.
Besides the previous parameters, sometimes it shouldbe necessary to take into account also temporal proper-ties. Indeed, data acquired along time at the samegeographic point can be extremely different, even ifevaluated in a brief temporal range. It depends on severalfactors which cannot be precisely evaluated. As anexample, let us consider that the temporal validity periodfor a pressure system consists of few hours, while a digitalterrain model varies along many centuries. Thus, the timevariability issue of phenomena cannot be disregarded inorder to have a deeper comprehension of the Earth’sphenomena.
By taking into account previous considerations aboutphenomena, a continuous field has been introduced as astructure having three parameters, namely:
CF ¼ ðT;D; FÞ,
where T is the time period when the continuous fieldrepresentation is valid, D is the continuous field domain,and F is the function representing the phenomenonsurface.
As for the time parameter, actually it is handled as avariable characterizing the temporal evolution of phe-nomena, that is to say, each sample is acquired with atemporal value, indicating the validity period of thecorresponding shot.
3. Overview of Phenomena
Most visual environments handling spatial data focuson discrete objects. They allow users to manage and querygeometric and descriptive properties of data through avisual approach, and display resulting sets in terms oftables, forms and highlighted objects. The underlyingquery language may automatically be run when visualsentences are built, thus letting users disregard details
ARTICLE IN PRESS
L. Paolino et al. / Journal of Visual Languages and Computing 20 (2009) 420–436 423
about its syntax, as well as the inner complexity ofgeographic data.
A similar approach may be followed in order to provideexpert users with a visual support for the management ofcontinuous fields. As a matter of fact, besides effortsrelated to the specification of data models, structures andfunctions devoted to data visualization and processing,recent literature has emphasized an increasing attentiontowards the interpretation of the mental model whichusers adopt when dealing with spatially continuousphenomena such as temperature, population density orsurface elevation [13,17,18,28]. Indeed, given the capabilityof such continuous fields to describe and representvariations across the Earth’s surface, it is crucial tounderstand how people perceive them in order to obtaina more realistic view of the involved phenomena and theireffective management.
In this section we describe the visual environmentPhenomena, which embeds a visual query language, ableto handle both discrete and continuous data, with theirdouble descriptive and spatial nature. Within Phenomena,users may query discrete objects and continuous datathrough a uniform approach, based on homogeneousvisual iconic representations and on two new metaphors,named Condition Tree and Nested Rectangles, which may beused to compose complex query conditions and invokespatial operators, respectively.
Moreover, Phenomena offers the additional capabilityto associate the structure of frequent/complex querieswith visual representations, which may be subsequentlyselected any time those queries must be invoked, possiblysetting some parameters.
As for the design of the graphical user interface (GUI),we aimed to guarantee a high-level graphical access to thesystem and provide efficient communication facilities fordatabase querying and analysis, thus assuring a crucialrequirement for the fields of GIS and Spatial DecisionSupport Systems (SDSS), where the inner complexity ofdata strongly affects human–computer interaction.
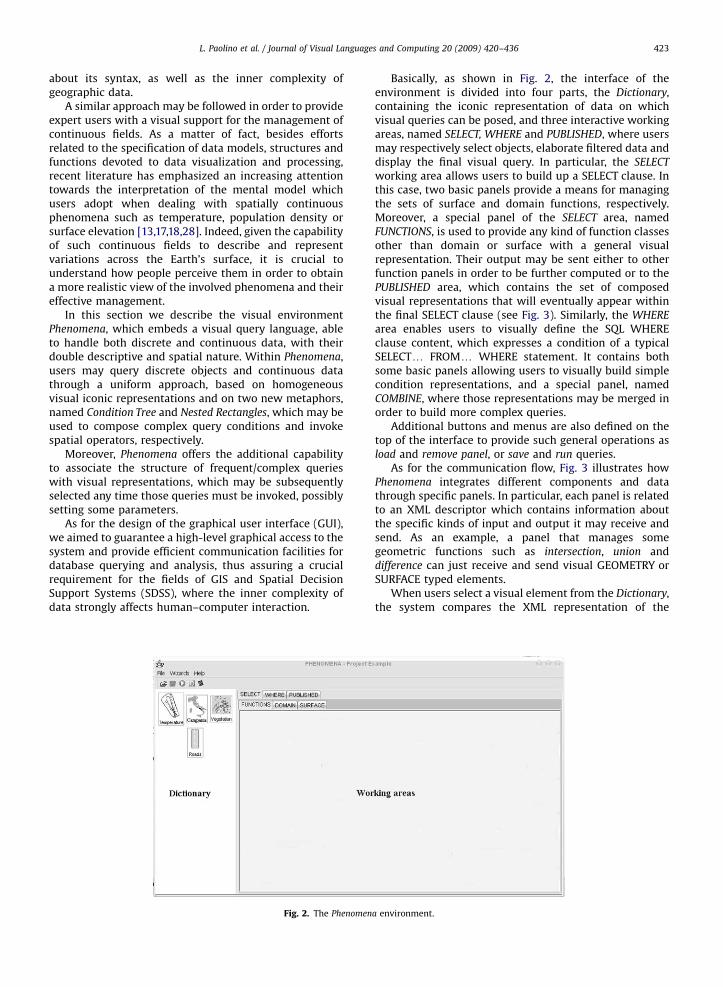
Fig. 2. The Phenomen
Basically, as shown in Fig. 2, the interface of theenvironment is divided into four parts, the Dictionary,containing the iconic representation of data on whichvisual queries can be posed, and three interactive workingareas, named SELECT, WHERE and PUBLISHED, where usersmay respectively select objects, elaborate filtered data anddisplay the final visual query. In particular, the SELECT
working area allows users to build up a SELECT clause. Inthis case, two basic panels provide a means for managingthe sets of surface and domain functions, respectively.Moreover, a special panel of the SELECT area, namedFUNCTIONS, is used to provide any kind of function classesother than domain or surface with a general visualrepresentation. Their output may be sent either to otherfunction panels in order to be further computed or to thePUBLISHED area, which contains the set of composedvisual representations that will eventually appear withinthe final SELECT clause (see Fig. 3). Similarly, the WHERE
area enables users to visually define the SQL WHEREclause content, which expresses a condition of a typicalSELECTy FROMy WHERE statement. It contains bothsome basic panels allowing users to visually build simplecondition representations, and a special panel, namedCOMBINE, where those representations may be merged inorder to build more complex queries.
Additional buttons and menus are also defined on thetop of the interface to provide such general operations asload and remove panel, or save and run queries.
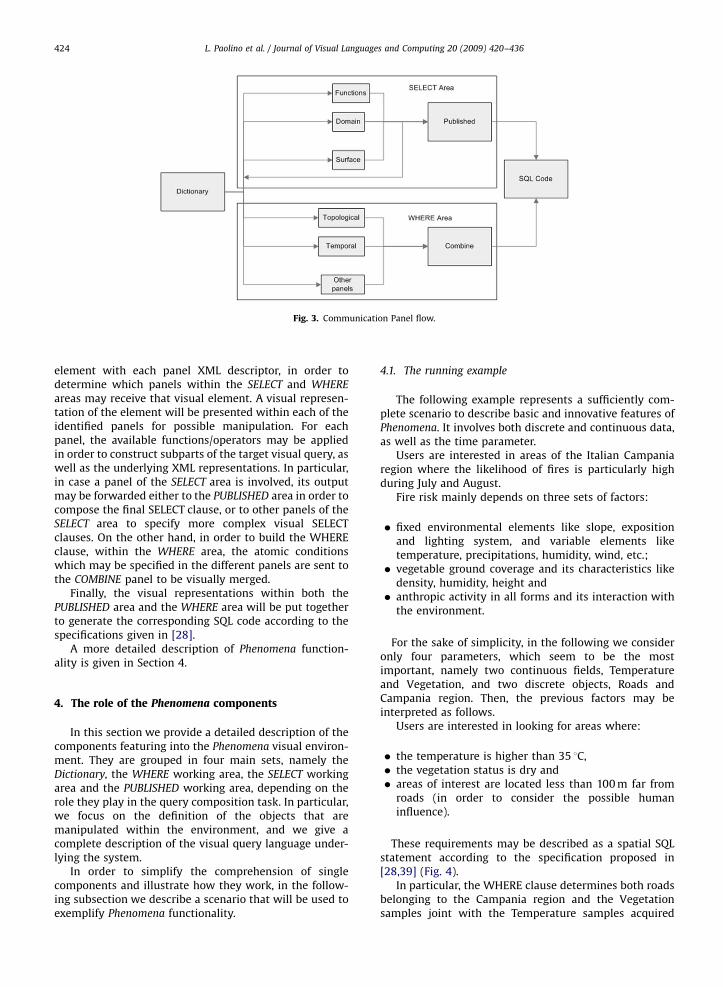
As for the communication flow, Fig. 3 illustrates howPhenomena integrates different components and datathrough specific panels. In particular, each panel is relatedto an XML descriptor which contains information aboutthe specific kinds of input and output it may receive andsend. As an example, a panel that manages somegeometric functions such as intersection, union anddifference can just receive and send visual GEOMETRY orSURFACE typed elements.
When users select a visual element from the Dictionary,the system compares the XML representation of the
a environment.
ARTICLE IN PRESS
Fig. 3. Communication Panel flow.
L. Paolino et al. / Journal of Visual Languages and Computing 20 (2009) 420–436424
element with each panel XML descriptor, in order todetermine which panels within the SELECT and WHERE
areas may receive that visual element. A visual represen-tation of the element will be presented within each of theidentified panels for possible manipulation. For eachpanel, the available functions/operators may be appliedin order to construct subparts of the target visual query, aswell as the underlying XML representations. In particular,in case a panel of the SELECT area is involved, its outputmay be forwarded either to the PUBLISHED area in order tocompose the final SELECT clause, or to other panels of theSELECT area to specify more complex visual SELECTclauses. On the other hand, in order to build the WHEREclause, within the WHERE area, the atomic conditionswhich may be specified in the different panels are sent tothe COMBINE panel to be visually merged.
Finally, the visual representations within both thePUBLISHED area and the WHERE area will be put togetherto generate the corresponding SQL code according to thespecifications given in [28].
A more detailed description of Phenomena function-ality is given in Section 4.
4. The role of the Phenomena components
In this section we provide a detailed description of thecomponents featuring into the Phenomena visual environ-ment. They are grouped in four main sets, namely theDictionary, the WHERE working area, the SELECT workingarea and the PUBLISHED working area, depending on therole they play in the query composition task. In particular,we focus on the definition of the objects that aremanipulated within the environment, and we give acomplete description of the visual query language under-lying the system.
In order to simplify the comprehension of singlecomponents and illustrate how they work, in the follow-ing subsection we describe a scenario that will be used toexemplify Phenomena functionality.
4.1. The running example
The following example represents a sufficiently com-plete scenario to describe basic and innovative features ofPhenomena. It involves both discrete and continuous data,as well as the time parameter.
Users are interested in areas of the Italian Campaniaregion where the likelihood of fires is particularly highduring July and August.
Fire risk mainly depends on three sets of factors:
�
fixed environmental elements like slope, expositionand lighting system, and variable elements liketemperature, precipitations, humidity, wind, etc.; � vegetable ground coverage and its characteristics likedensity, humidity, height and
� anthropic activity in all forms and its interaction withthe environment.
For the sake of simplicity, in the following we consideronly four parameters, which seem to be the mostimportant, namely two continuous fields, Temperatureand Vegetation, and two discrete objects, Roads andCampania region. Then, the previous factors may beinterpreted as follows.
Users are interested in looking for areas where:
�
the temperature is higher than 35 1C, � the vegetation status is dry and � areas of interest are located less than 100 m far fromroads (in order to consider the possible humaninfluence).
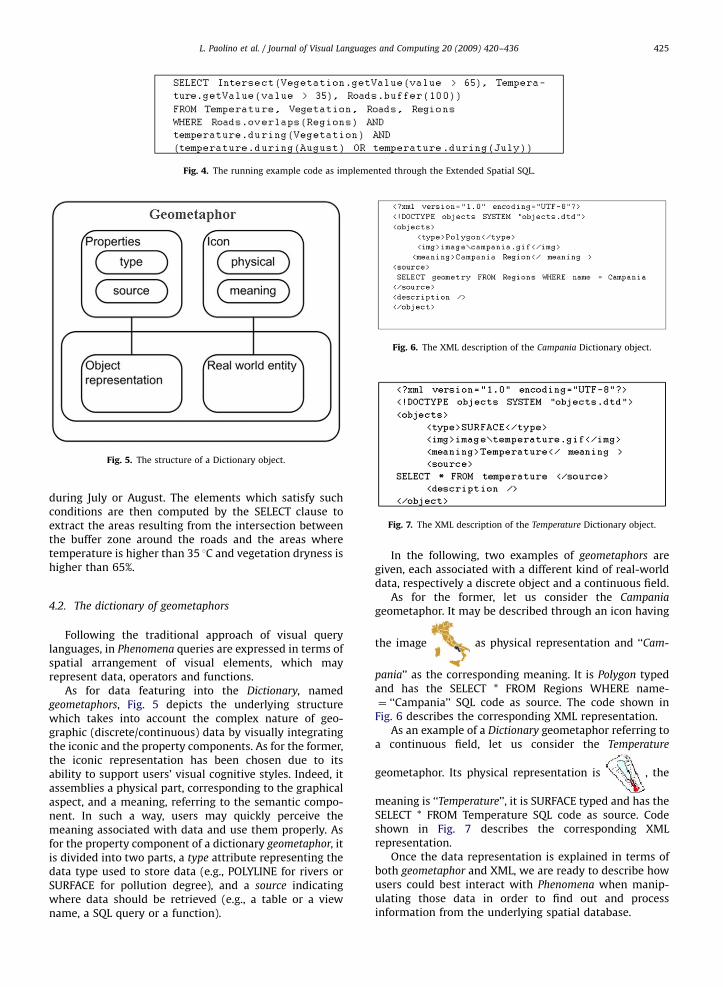
These requirements may be described as a spatial SQLstatement according to the specification proposed in[28,39] (Fig. 4).
In particular, the WHERE clause determines both roadsbelonging to the Campania region and the Vegetationsamples joint with the Temperature samples acquired
ARTICLE IN PRESS
Fig. 4. The running example code as implemented through the Extended Spatial SQL.
Fig. 5. The structure of a Dictionary object.
Fig. 6. The XML description of the Campania Dictionary object.
Fig. 7. The XML description of the Temperature Dictionary object.
L. Paolino et al. / Journal of Visual Languages and Computing 20 (2009) 420–436 425
during July or August. The elements which satisfy suchconditions are then computed by the SELECT clause toextract the areas resulting from the intersection betweenthe buffer zone around the roads and the areas wheretemperature is higher than 35 1C and vegetation dryness ishigher than 65%.
4.2. The dictionary of geometaphors
Following the traditional approach of visual querylanguages, in Phenomena queries are expressed in terms ofspatial arrangement of visual elements, which mayrepresent data, operators and functions.
As for data featuring into the Dictionary, namedgeometaphors, Fig. 5 depicts the underlying structurewhich takes into account the complex nature of geo-graphic (discrete/continuous) data by visually integratingthe iconic and the property components. As for the former,the iconic representation has been chosen due to itsability to support users’ visual cognitive styles. Indeed, itassemblies a physical part, corresponding to the graphicalaspect, and a meaning, referring to the semantic compo-nent. In such a way, users may quickly perceive themeaning associated with data and use them properly. Asfor the property component of a dictionary geometaphor, itis divided into two parts, a type attribute representing thedata type used to store data (e.g., POLYLINE for rivers orSURFACE for pollution degree), and a source indicatingwhere data should be retrieved (e.g., a table or a viewname, a SQL query or a function).
In the following, two examples of geometaphors aregiven, each associated with a different kind of real-worlddata, respectively a discrete object and a continuous field.
As for the former, let us consider the Campania
geometaphor. It may be described through an icon having
the image as physical representation and ‘‘Cam-
pania’’ as the corresponding meaning. It is Polygon typedand has the SELECT * FROM Regions WHERE name-¼ ‘‘Campania’’ SQL code as source. The code shown in
Fig. 6 describes the corresponding XML representation.As an example of a Dictionary geometaphor referring to
a continuous field, let us consider the Temperature
geometaphor. Its physical representation is , the
meaning is ‘‘Temperature’’, it is SURFACE typed and has theSELECT * FROM Temperature SQL code as source. Codeshown in Fig. 7 describes the corresponding XMLrepresentation.
Once the data representation is explained in terms ofboth geometaphor and XML, we are ready to describe howusers could best interact with Phenomena when manip-ulating those data in order to find out and processinformation from the underlying spatial database.
ARTICLE IN PRESS
L. Paolino et al. / Journal of Visual Languages and Computing 20 (2009) 420–436426
It is worth to note that when geometaphors areselected from the Dictionary, each working area receivesthem or subparts of them, in order to prearrange its panelsfor interaction required by users, which may consist ofbuilding up a subpart of a query or merging the subpartstogether. In the following subsections more details aboutthe working areas are given.
4.3. The WHERE working area
The running example described in Section 4.1 embedsthe three kinds of conditions that can be expressed in aWHERE clause, namely alphanumeric, spatial and tempor-al conditions. The requirements specified by users in theexample may be translated in terms of conditions asfollows:
�
Figsha
roads contained within the Campania region and
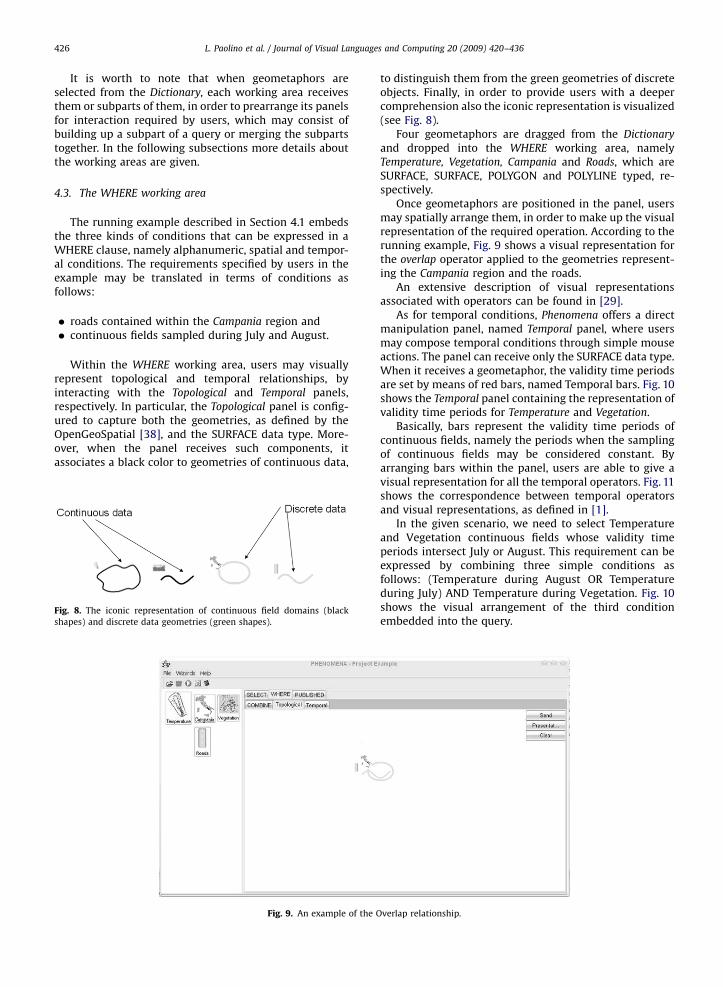
� continuous fields sampled during July and August.Within the WHERE working area, users may visuallyrepresent topological and temporal relationships, byinteracting with the Topological and Temporal panels,respectively. In particular, the Topological panel is config-ured to capture both the geometries, as defined by theOpenGeoSpatial [38], and the SURFACE data type. More-over, when the panel receives such components, itassociates a black color to geometries of continuous data,
. 8. The iconic representation of continuous field domains (black
pes) and discrete data geometries (green shapes).
Fig. 9. An example of the O
to distinguish them from the green geometries of discreteobjects. Finally, in order to provide users with a deepercomprehension also the iconic representation is visualized(see Fig. 8).
Four geometaphors are dragged from the Dictionary
and dropped into the WHERE working area, namelyTemperature, Vegetation, Campania and Roads, which areSURFACE, SURFACE, POLYGON and POLYLINE typed, re-spectively.
Once geometaphors are positioned in the panel, usersmay spatially arrange them, in order to make up the visualrepresentation of the required operation. According to therunning example, Fig. 9 shows a visual representation forthe overlap operator applied to the geometries represent-ing the Campania region and the roads.
An extensive description of visual representationsassociated with operators can be found in [29].
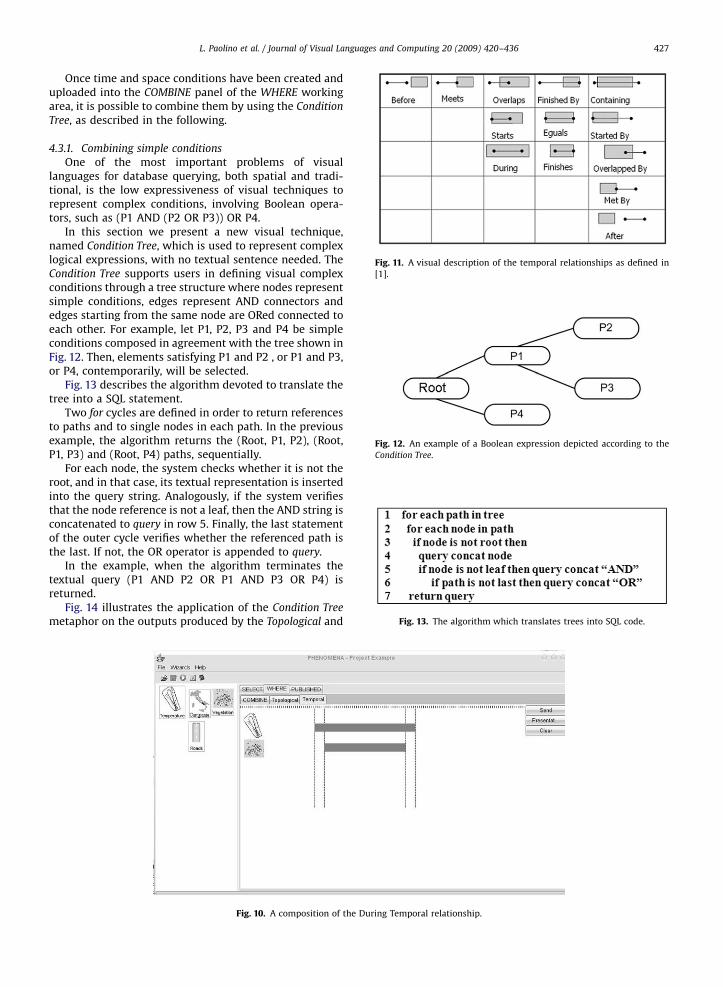
As for temporal conditions, Phenomena offers a directmanipulation panel, named Temporal panel, where usersmay compose temporal conditions through simple mouseactions. The panel can receive only the SURFACE data type.When it receives a geometaphor, the validity time periodsare set by means of red bars, named Temporal bars. Fig. 10shows the Temporal panel containing the representation ofvalidity time periods for Temperature and Vegetation.
Basically, bars represent the validity time periods ofcontinuous fields, namely the periods when the samplingof continuous fields may be considered constant. Byarranging bars within the panel, users are able to give avisual representation for all the temporal operators. Fig. 11shows the correspondence between temporal operatorsand visual representations, as defined in [1].
In the given scenario, we need to select Temperatureand Vegetation continuous fields whose validity timeperiods intersect July or August. This requirement can beexpressed by combining three simple conditions asfollows: (Temperature during August OR Temperatureduring July) AND Temperature during Vegetation. Fig. 10shows the visual arrangement of the third conditionembedded into the query.
verlap relationship.
ARTICLE IN PRESS
Fig. 11. A visual description of the temporal relationships as defined in
[1].
Fig. 12. An example of a Boolean expression depicted according to the
Condition Tree.
Fig. 13. The algorithm which translates trees into SQL code.
L. Paolino et al. / Journal of Visual Languages and Computing 20 (2009) 420–436 427
Once time and space conditions have been created anduploaded into the COMBINE panel of the WHERE workingarea, it is possible to combine them by using the Condition
Tree, as described in the following.
4.3.1. Combining simple conditions
One of the most important problems of visuallanguages for database querying, both spatial and tradi-tional, is the low expressiveness of visual techniques torepresent complex conditions, involving Boolean opera-tors, such as (P1 AND (P2 OR P3)) OR P4.
In this section we present a new visual technique,named Condition Tree, which is used to represent complexlogical expressions, with no textual sentence needed. TheCondition Tree supports users in defining visual complexconditions through a tree structure where nodes representsimple conditions, edges represent AND connectors andedges starting from the same node are ORed connected toeach other. For example, let P1, P2, P3 and P4 be simpleconditions composed in agreement with the tree shown inFig. 12. Then, elements satisfying P1 and P2 , or P1 and P3,or P4, contemporarily, will be selected.
Fig. 13 describes the algorithm devoted to translate thetree into a SQL statement.
Two for cycles are defined in order to return referencesto paths and to single nodes in each path. In the previousexample, the algorithm returns the (Root, P1, P2), (Root,P1, P3) and (Root, P4) paths, sequentially.
For each node, the system checks whether it is not theroot, and in that case, its textual representation is insertedinto the query string. Analogously, if the system verifiesthat the node reference is not a leaf, then the AND string isconcatenated to query in row 5. Finally, the last statementof the outer cycle verifies whether the referenced path isthe last. If not, the OR operator is appended to query.
In the example, when the algorithm terminates thetextual query (P1 AND P2 OR P1 AND P3 OR P4) isreturned.
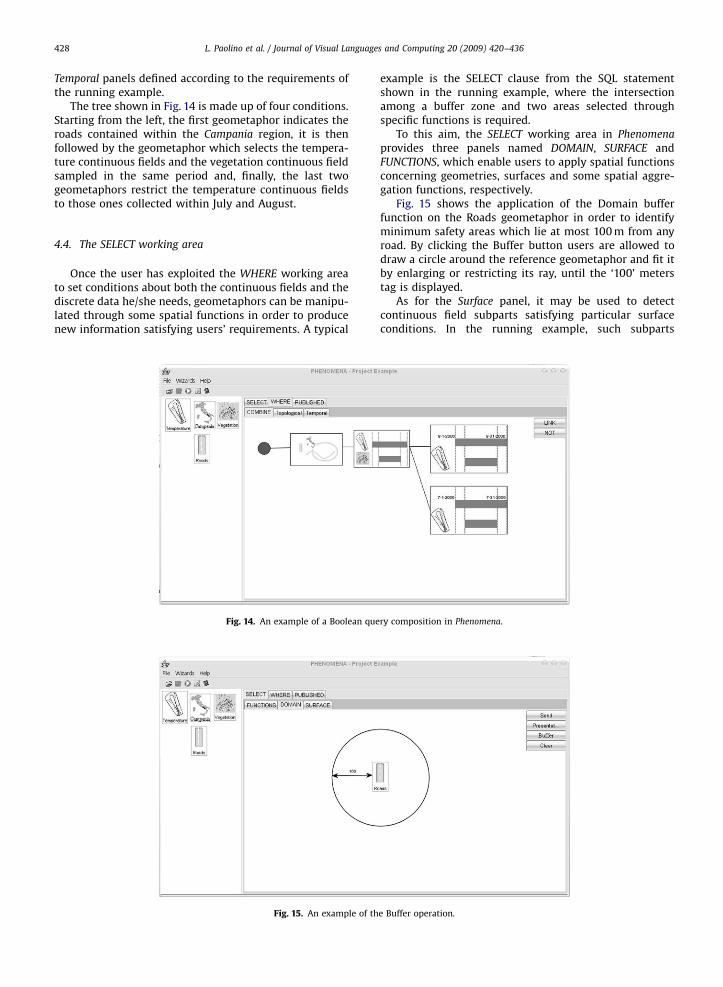
Fig. 14 illustrates the application of the Condition Tree
metaphor on the outputs produced by the Topological and
Fig. 10. A composition of the During Temporal relationship.
ARTICLE IN PRESS
L. Paolino et al. / Journal of Visual Languages and Computing 20 (2009) 420–436428
Temporal panels defined according to the requirements ofthe running example.
The tree shown in Fig. 14 is made up of four conditions.Starting from the left, the first geometaphor indicates theroads contained within the Campania region, it is thenfollowed by the geometaphor which selects the tempera-ture continuous fields and the vegetation continuous fieldsampled in the same period and, finally, the last twogeometaphors restrict the temperature continuous fieldsto those ones collected within July and August.
4.4. The SELECT working area
Once the user has exploited the WHERE working areato set conditions about both the continuous fields and thediscrete data he/she needs, geometaphors can be manipu-lated through some spatial functions in order to producenew information satisfying users’ requirements. A typical
Fig. 15. An example of th
Fig. 14. An example of a Boolean que
example is the SELECT clause from the SQL statementshown in the running example, where the intersectionamong a buffer zone and two areas selected throughspecific functions is required.
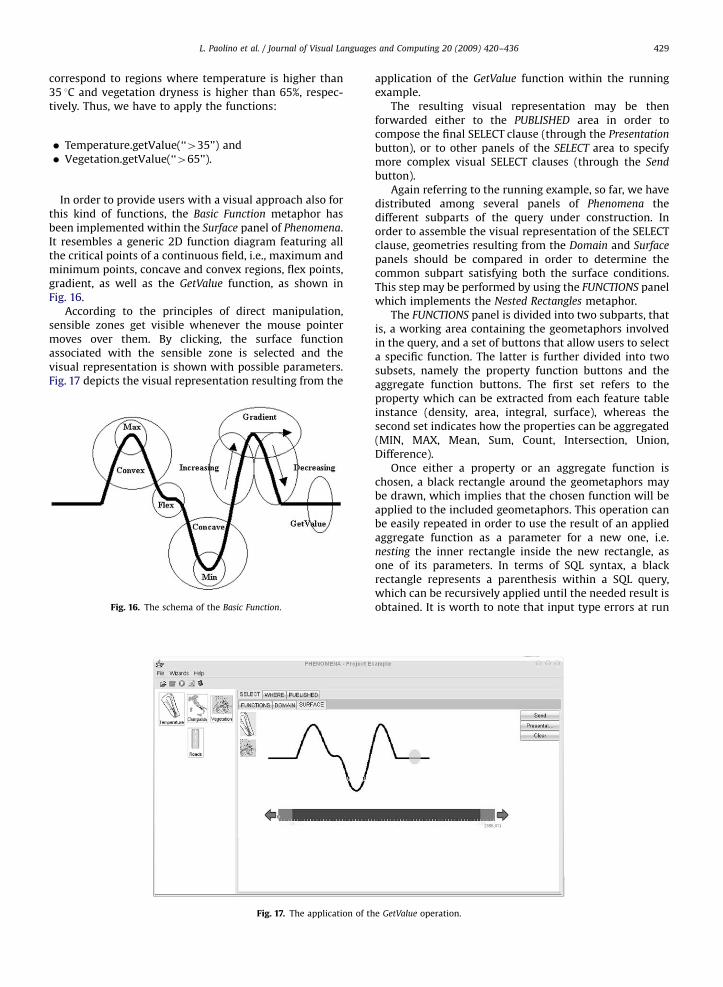
To this aim, the SELECT working area in Phenomena
provides three panels named DOMAIN, SURFACE andFUNCTIONS, which enable users to apply spatial functionsconcerning geometries, surfaces and some spatial aggre-gation functions, respectively.
Fig. 15 shows the application of the Domain bufferfunction on the Roads geometaphor in order to identifyminimum safety areas which lie at most 100 m from anyroad. By clicking the Buffer button users are allowed todraw a circle around the reference geometaphor and fit itby enlarging or restricting its ray, until the ‘100’ meterstag is displayed.
As for the Surface panel, it may be used to detectcontinuous field subparts satisfying particular surfaceconditions. In the running example, such subparts
e Buffer operation.
ry composition in Phenomena.
ARTICLE IN PRESS
L. Paolino et al. / Journal of Visual Languages and Computing 20 (2009) 420–436 429
correspond to regions where temperature is higher than35 1C and vegetation dryness is higher than 65%, respec-tively. Thus, we have to apply the functions:
�
Temperature.getValue(‘‘435’’) and � Vegetation.getValue(‘‘465’’).In order to provide users with a visual approach also forthis kind of functions, the Basic Function metaphor hasbeen implemented within the Surface panel of Phenomena.It resembles a generic 2D function diagram featuring allthe critical points of a continuous field, i.e., maximum andminimum points, concave and convex regions, flex points,gradient, as well as the GetValue function, as shown inFig. 16.
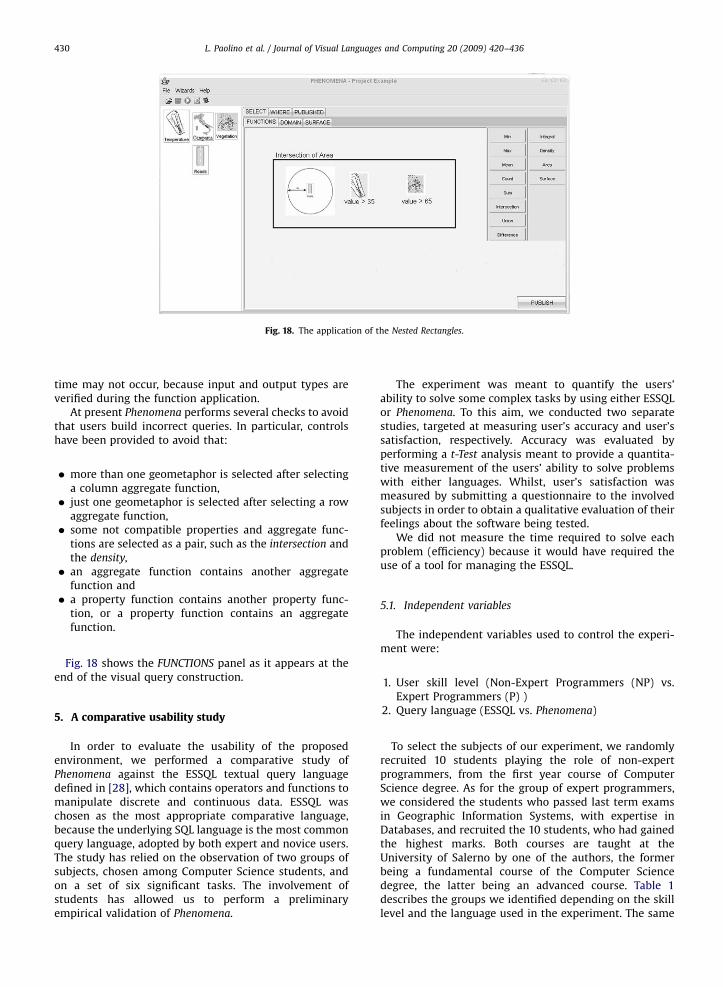
According to the principles of direct manipulation,sensible zones get visible whenever the mouse pointermoves over them. By clicking, the surface functionassociated with the sensible zone is selected and thevisual representation is shown with possible parameters.Fig. 17 depicts the visual representation resulting from the
Fig. 16. The schema of the Basic Function.
Fig. 17. The application of th
application of the GetValue function within the runningexample.
The resulting visual representation may be thenforwarded either to the PUBLISHED area in order tocompose the final SELECT clause (through the Presentation
button), or to other panels of the SELECT area to specifymore complex visual SELECT clauses (through the Send
button).Again referring to the running example, so far, we have
distributed among several panels of Phenomena thedifferent subparts of the query under construction. Inorder to assemble the visual representation of the SELECTclause, geometries resulting from the Domain and Surface
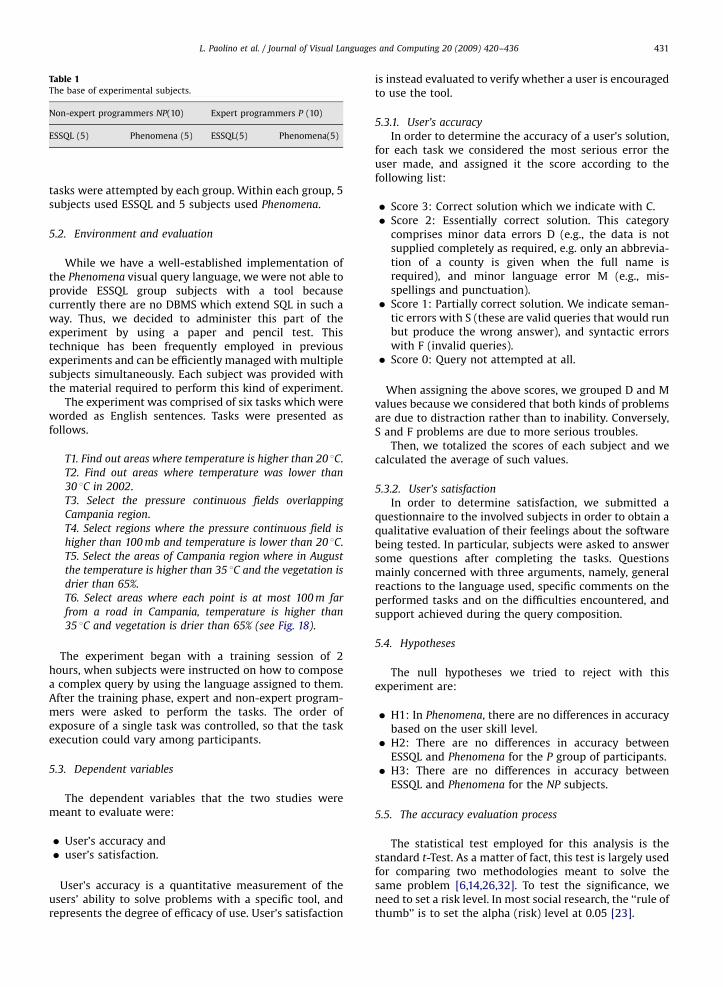
panels should be compared in order to determine thecommon subpart satisfying both the surface conditions.This step may be performed by using the FUNCTIONS panelwhich implements the Nested Rectangles metaphor.
The FUNCTIONS panel is divided into two subparts, thatis, a working area containing the geometaphors involvedin the query, and a set of buttons that allow users to selecta specific function. The latter is further divided into twosubsets, namely the property function buttons and theaggregate function buttons. The first set refers to theproperty which can be extracted from each feature tableinstance (density, area, integral, surface), whereas thesecond set indicates how the properties can be aggregated(MIN, MAX, Mean, Sum, Count, Intersection, Union,Difference).
Once either a property or an aggregate function ischosen, a black rectangle around the geometaphors maybe drawn, which implies that the chosen function will beapplied to the included geometaphors. This operation canbe easily repeated in order to use the result of an appliedaggregate function as a parameter for a new one, i.e.nesting the inner rectangle inside the new rectangle, asone of its parameters. In terms of SQL syntax, a blackrectangle represents a parenthesis within a SQL query,which can be recursively applied until the needed result isobtained. It is worth to note that input type errors at run
e GetValue operation.
ARTICLE IN PRESS
Fig. 18. The application of the Nested Rectangles.
L. Paolino et al. / Journal of Visual Languages and Computing 20 (2009) 420–436430
time may not occur, because input and output types areverified during the function application.
At present Phenomena performs several checks to avoidthat users build incorrect queries. In particular, controlshave been provided to avoid that:
�
more than one geometaphor is selected after selectinga column aggregate function, � just one geometaphor is selected after selecting a rowaggregate function,
� some not compatible properties and aggregate func-tions are selected as a pair, such as the intersection andthe density,
� an aggregate function contains another aggregatefunction and
� a property function contains another property func-tion, or a property function contains an aggregatefunction.
Fig. 18 shows the FUNCTIONS panel as it appears at theend of the visual query construction.
5. A comparative usability study
In order to evaluate the usability of the proposedenvironment, we performed a comparative study ofPhenomena against the ESSQL textual query languagedefined in [28], which contains operators and functions tomanipulate discrete and continuous data. ESSQL waschosen as the most appropriate comparative language,because the underlying SQL language is the most commonquery language, adopted by both expert and novice users.The study has relied on the observation of two groups ofsubjects, chosen among Computer Science students, andon a set of six significant tasks. The involvement ofstudents has allowed us to perform a preliminaryempirical validation of Phenomena.
The experiment was meant to quantify the users’ability to solve some complex tasks by using either ESSQLor Phenomena. To this aim, we conducted two separatestudies, targeted at measuring user’s accuracy and user’ssatisfaction, respectively. Accuracy was evaluated byperforming a t-Test analysis meant to provide a quantita-tive measurement of the users’ ability to solve problemswith either languages. Whilst, user’s satisfaction wasmeasured by submitting a questionnaire to the involvedsubjects in order to obtain a qualitative evaluation of theirfeelings about the software being tested.
We did not measure the time required to solve eachproblem (efficiency) because it would have required theuse of a tool for managing the ESSQL.
5.1. Independent variables
The independent variables used to control the experi-ment were:
1.
User skill level (Non-Expert Programmers (NP) vs.Expert Programmers (P) )2.
Query language (ESSQL vs. Phenomena)To select the subjects of our experiment, we randomlyrecruited 10 students playing the role of non-expertprogrammers, from the first year course of ComputerScience degree. As for the group of expert programmers,we considered the students who passed last term examsin Geographic Information Systems, with expertise inDatabases, and recruited the 10 students, who had gainedthe highest marks. Both courses are taught at theUniversity of Salerno by one of the authors, the formerbeing a fundamental course of the Computer Sciencedegree, the latter being an advanced course. Table 1describes the groups we identified depending on the skilllevel and the language used in the experiment. The same
ARTICLE IN PRESS
Table 1The base of experimental subjects.
Non-expert programmers NP(10) Expert programmers P (10)
ESSQL (5) Phenomena (5) ESSQL(5) Phenomena(5)
L. Paolino et al. / Journal of Visual Languages and Computing 20 (2009) 420–436 431
tasks were attempted by each group. Within each group, 5subjects used ESSQL and 5 subjects used Phenomena.
5.2. Environment and evaluation
While we have a well-established implementation ofthe Phenomena visual query language, we were not able toprovide ESSQL group subjects with a tool becausecurrently there are no DBMS which extend SQL in such away. Thus, we decided to administer this part of theexperiment by using a paper and pencil test. Thistechnique has been frequently employed in previousexperiments and can be efficiently managed with multiplesubjects simultaneously. Each subject was provided withthe material required to perform this kind of experiment.
The experiment was comprised of six tasks which wereworded as English sentences. Tasks were presented asfollows.
T1. Find out areas where temperature is higher than 20 1C.T2. Find out areas where temperature was lower than
30 1C in 2002.T3. Select the pressure continuous fields overlapping
Campania region.T4. Select regions where the pressure continuous field is
higher than 100 mb and temperature is lower than 20 1C.T5. Select the areas of Campania region where in August
the temperature is higher than 35 1C and the vegetation is
drier than 65%.T6. Select areas where each point is at most 100 m far
from a road in Campania, temperature is higher than
35 1C and vegetation is drier than 65% (see Fig. 18).
The experiment began with a training session of 2hours, when subjects were instructed on how to composea complex query by using the language assigned to them.After the training phase, expert and non-expert program-mers were asked to perform the tasks. The order ofexposure of a single task was controlled, so that the taskexecution could vary among participants.
5.3. Dependent variables
The dependent variables that the two studies weremeant to evaluate were:
�
User’s accuracy and � user’s satisfaction.User’s accuracy is a quantitative measurement of theusers’ ability to solve problems with a specific tool, andrepresents the degree of efficacy of use. User’s satisfaction
is instead evaluated to verify whether a user is encouragedto use the tool.
5.3.1. User’s accuracy
In order to determine the accuracy of a user’s solution,for each task we considered the most serious error theuser made, and assigned it the score according to thefollowing list:
�
Score 3: Correct solution which we indicate with C. � Score 2: Essentially correct solution. This categorycomprises minor data errors D (e.g., the data is notsupplied completely as required, e.g. only an abbrevia-tion of a county is given when the full name isrequired), and minor language error M (e.g., mis-spellings and punctuation).
� Score 1: Partially correct solution. We indicate seman-tic errors with S (these are valid queries that would runbut produce the wrong answer), and syntactic errorswith F (invalid queries).
� Score 0: Query not attempted at all.When assigning the above scores, we grouped D and Mvalues because we considered that both kinds of problemsare due to distraction rather than to inability. Conversely,S and F problems are due to more serious troubles.
Then, we totalized the scores of each subject and wecalculated the average of such values.
5.3.2. User’s satisfaction
In order to determine satisfaction, we submitted aquestionnaire to the involved subjects in order to obtain aqualitative evaluation of their feelings about the softwarebeing tested. In particular, subjects were asked to answersome questions after completing the tasks. Questionsmainly concerned with three arguments, namely, generalreactions to the language used, specific comments on theperformed tasks and on the difficulties encountered, andsupport achieved during the query composition.
5.4. Hypotheses
The null hypotheses we tried to reject with thisexperiment are:
�
H1: In Phenomena, there are no differences in accuracybased on the user skill level. � H2: There are no differences in accuracy betweenESSQL and Phenomena for the P group of participants.
� H3: There are no differences in accuracy betweenESSQL and Phenomena for the NP subjects.
5.5. The accuracy evaluation process
The statistical test employed for this analysis is thestandard t-Test. As a matter of fact, this test is largely usedfor comparing two methodologies meant to solve thesame problem [6,14,26,32]. To test the significance, weneed to set a risk level. In most social research, the ‘‘rule ofthumb’’ is to set the alpha (risk) level at 0.05 [23].
ARTICLE IN PRESS
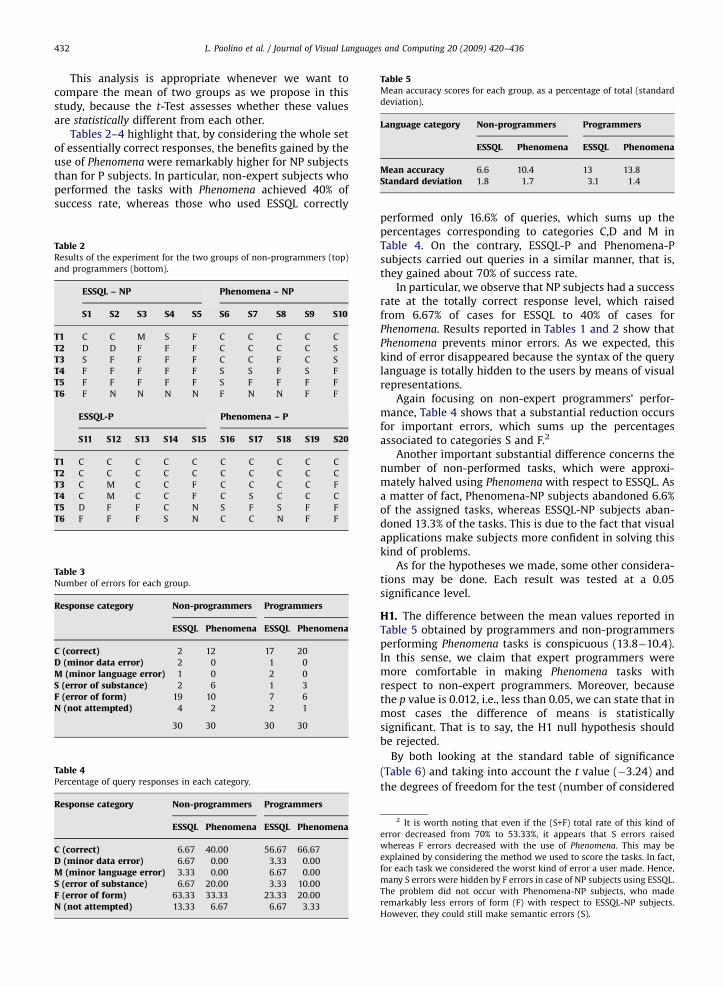
Table 5Mean accuracy scores for each group, as a percentage of total (standard
deviation).
Language category Non-programmers Programmers
ESSQL Phenomena ESSQL Phenomena
Mean accuracy 6.6 10.4 13 13.8
Standard deviation 1.8 1.7 3.1 1.4
L. Paolino et al. / Journal of Visual Languages and Computing 20 (2009) 420–436432
This analysis is appropriate whenever we want tocompare the mean of two groups as we propose in thisstudy, because the t-Test assesses whether these valuesare statistically different from each other.
Tables 2–4 highlight that, by considering the whole setof essentially correct responses, the benefits gained by theuse of Phenomena were remarkably higher for NP subjectsthan for P subjects. In particular, non-expert subjects whoperformed the tasks with Phenomena achieved 40% ofsuccess rate, whereas those who used ESSQL correctly
Table 2Results of the experiment for the two groups of non-programmers (top)
and programmers (bottom).
ESSQL – NP Phenomena – NP
S1 S2 S3 S4 S5 S6 S7 S8 S9 S10
T1 C C M S F C C C C C
T2 D D F F F C C C C S
T3 S F F F F C C F C S
T4 F F F F F S S F S F
T5 F F F F F S F F F F
T6 F N N N N F N N F F
ESSQL-P Phenomena – P
S11 S12 S13 S14 S15 S16 S17 S18 S19 S20
T1 C C C C C C C C C C
T2 C C C C C C C C C C
T3 C M C C F C C C C F
T4 C M C C F C S C C C
T5 D F F C N S F S F F
T6 F F F S N C C N F F
Table 3Number of errors for each group.
Response category Non-programmers Programmers
ESSQL Phenomena ESSQL Phenomena
C (correct) 2 12 17 20
D (minor data error) 2 0 1 0
M (minor language error) 1 0 2 0
S (error of substance) 2 6 1 3
F (error of form) 19 10 7 6
N (not attempted) 4 2 2 1
30 30 30 30
Table 4Percentage of query responses in each category.
Response category Non-programmers Programmers
ESSQL Phenomena ESSQL Phenomena
C (correct) 6.67 40.00 56.67 66.67
D (minor data error) 6.67 0.00 3.33 0.00
M (minor language error) 3.33 0.00 6.67 0.00
S (error of substance) 6.67 20.00 3.33 10.00
F (error of form) 63.33 33.33 23.33 20.00
N (not attempted) 13.33 6.67 6.67 3.33
performed only 16.6% of queries, which sums up thepercentages corresponding to categories C,D and M inTable 4. On the contrary, ESSQL-P and Phenomena-Psubjects carried out queries in a similar manner, that is,they gained about 70% of success rate.
In particular, we observe that NP subjects had a successrate at the totally correct response level, which raisedfrom 6.67% of cases for ESSQL to 40% of cases forPhenomena. Results reported in Tables 1 and 2 show thatPhenomena prevents minor errors. As we expected, thiskind of error disappeared because the syntax of the querylanguage is totally hidden to the users by means of visualrepresentations.
Again focusing on non-expert programmers’ perfor-mance, Table 4 shows that a substantial reduction occursfor important errors, which sums up the percentagesassociated to categories S and F.2
Another important substantial difference concerns thenumber of non-performed tasks, which were approxi-mately halved using Phenomena with respect to ESSQL. Asa matter of fact, Phenomena-NP subjects abandoned 6.6%of the assigned tasks, whereas ESSQL-NP subjects aban-doned 13.3% of the tasks. This is due to the fact that visualapplications make subjects more confident in solving thiskind of problems.
As for the hypotheses we made, some other considera-tions may be done. Each result was tested at a 0.05significance level.
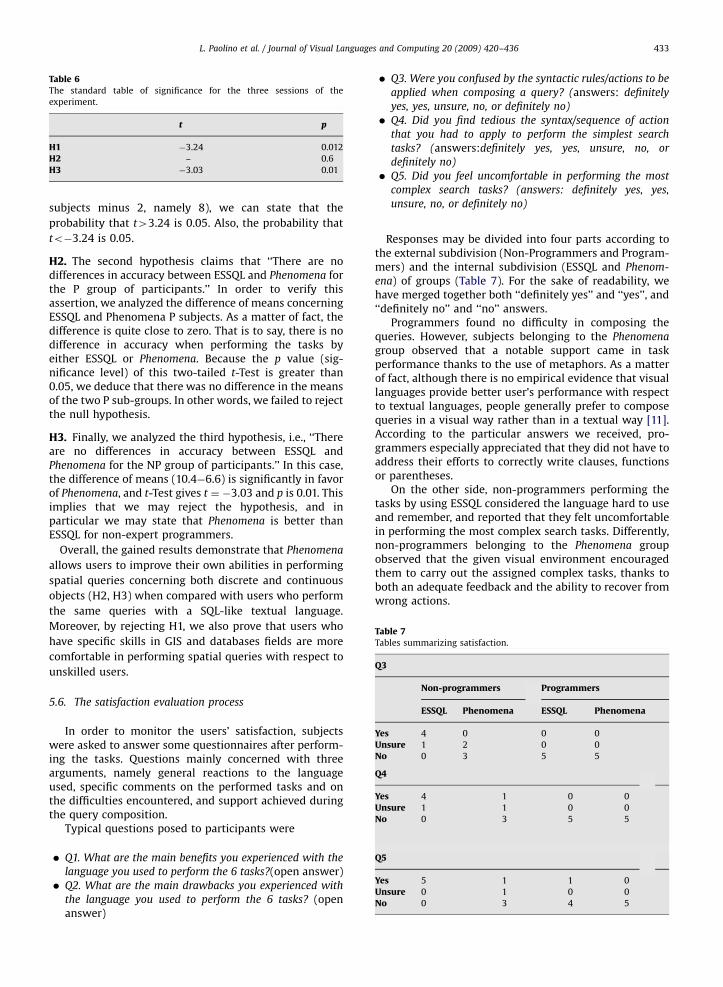
H1. The difference between the mean values reported inTable 5 obtained by programmers and non-programmersperforming Phenomena tasks is conspicuous (13.8�10.4).In this sense, we claim that expert programmers weremore comfortable in making Phenomena tasks withrespect to non-expert programmers. Moreover, becausethe p value is 0.012, i.e., less than 0.05, we can state that inmost cases the difference of means is statisticallysignificant. That is to say, the H1 null hypothesis shouldbe rejected.
By both looking at the standard table of significance
(Table 6) and taking into account the t value (�3.24) and
the degrees of freedom for the test (number of considered
2 It is worth noting that even if the (S+F) total rate of this kind of
error decreased from 70% to 53.33%, it appears that S errors raised
whereas F errors decreased with the use of Phenomena. This may be
explained by considering the method we used to score the tasks. In fact,
for each task we considered the worst kind of error a user made. Hence,
many S errors were hidden by F errors in case of NP subjects using ESSQL.
The problem did not occur with Phenomena-NP subjects, who made
remarkably less errors of form (F) with respect to ESSQL-NP subjects.
However, they could still make semantic errors (S).
ARTICLE IN PRESS
Table 6The standard table of significance for the three sessions of the
experiment.
t p
H1 �3.24 0.012
H2 – 0.6
H3 �3.03 0.01
Table 7Tables summarizing satisfaction.
Q3
Non-programmers Programmers
ESSQL Phenomena ESSQL Phenomena
Yes 4 0 0 0
Unsure 1 2 0 0
No 0 3 5 5
Q4
Yes 4 1 0 0
Unsure 1 1 0 0
No 0 3 5 5
L. Paolino et al. / Journal of Visual Languages and Computing 20 (2009) 420–436 433
subjects minus 2, namely 8), we can state that the
probability that t43.24 is 0.05. Also, the probability that
to�3.24 is 0.05.
H2. The second hypothesis claims that ‘‘There are nodifferences in accuracy between ESSQL and Phenomena forthe P group of participants.’’ In order to verify thisassertion, we analyzed the difference of means concerningESSQL and Phenomena P subjects. As a matter of fact, thedifference is quite close to zero. That is to say, there is nodifference in accuracy when performing the tasks byeither ESSQL or Phenomena. Because the p value (sig-nificance level) of this two-tailed t-Test is greater than0.05, we deduce that there was no difference in the meansof the two P sub-groups. In other words, we failed to rejectthe null hypothesis.
H3. Finally, we analyzed the third hypothesis, i.e., ‘‘Thereare no differences in accuracy between ESSQL andPhenomena for the NP group of participants.’’ In this case,the difference of means (10.4�6.6) is significantly in favorof Phenomena, and t-Test gives t ¼ �3.03 and p is 0.01. Thisimplies that we may reject the hypothesis, and inparticular we may state that Phenomena is better thanESSQL for non-expert programmers.
Overall, the gained results demonstrate that Phenomena
allows users to improve their own abilities in performing
spatial queries concerning both discrete and continuous
objects (H2, H3) when compared with users who perform
the same queries with a SQL-like textual language.
Moreover, by rejecting H1, we also prove that users who
have specific skills in GIS and databases fields are more
comfortable in performing spatial queries with respect to
unskilled users.
5.6. The satisfaction evaluation process
In order to monitor the users’ satisfaction, subjectswere asked to answer some questionnaires after perform-ing the tasks. Questions mainly concerned with threearguments, namely general reactions to the languageused, specific comments on the performed tasks and onthe difficulties encountered, and support achieved duringthe query composition.
Typical questions posed to participants were
Q5
� Q1. What are the main benefits you experienced with thelanguage you used to perform the 6 tasks?(open answer)
Yes 5 1 1 0�
Unsure 0 1 0 0No 0 3 4 5
Q2. What are the main drawbacks you experienced with
the language you used to perform the 6 tasks? (openanswer)
�
Q3. Were you confused by the syntactic rules/actions to beapplied when composing a query? (answers: definitely
yes, yes, unsure, no, or definitely no)
�
Q4. Did you find tedious the syntax/sequence of actionthat you had to apply to perform the simplest search
tasks? (answers:definitely yes, yes, unsure, no, or
definitely no)
�
Q5. Did you feel uncomfortable in performing the mostcomplex search tasks? (answers: definitely yes, yes,
unsure, no, or definitely no)
Responses may be divided into four parts according tothe external subdivision (Non-Programmers and Program-mers) and the internal subdivision (ESSQL and Phenom-
ena) of groups (Table 7). For the sake of readability, wehave merged together both ‘‘definitely yes’’ and ‘‘yes’’, and‘‘definitely no’’ and ‘‘no’’ answers.
Programmers found no difficulty in composing thequeries. However, subjects belonging to the Phenomena
group observed that a notable support came in taskperformance thanks to the use of metaphors. As a matterof fact, although there is no empirical evidence that visuallanguages provide better user’s performance with respectto textual languages, people generally prefer to composequeries in a visual way rather than in a textual way [11].According to the particular answers we received, pro-grammers especially appreciated that they did not have toaddress their efforts to correctly write clauses, functionsor parentheses.
On the other side, non-programmers performing thetasks by using ESSQL considered the language hard to useand remember, and reported that they felt uncomfortablein performing the most complex search tasks. Differently,non-programmers belonging to the Phenomena groupobserved that the given visual environment encouragedthem to carry out the assigned complex tasks, thanks toboth an adequate feedback and the ability to recover fromwrong actions.
ARTICLE IN PRESS
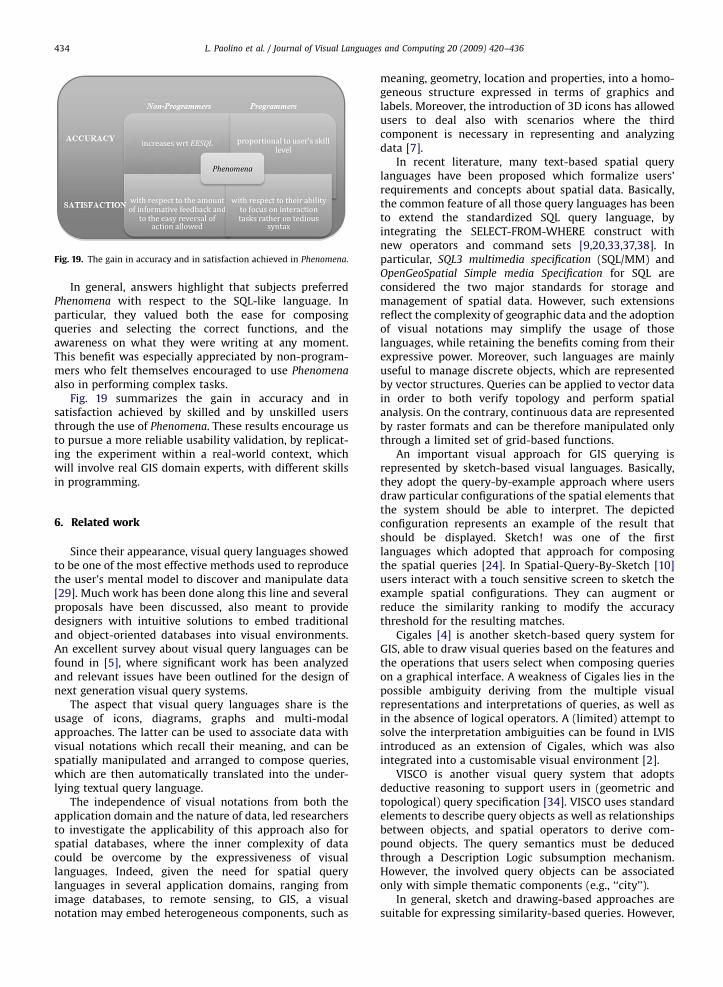
Fig. 19. The gain in accuracy and in satisfaction achieved in Phenomena.
L. Paolino et al. / Journal of Visual Languages and Computing 20 (2009) 420–436434
In general, answers highlight that subjects preferredPhenomena with respect to the SQL-like language. Inparticular, they valued both the ease for composingqueries and selecting the correct functions, and theawareness on what they were writing at any moment.This benefit was especially appreciated by non-program-mers who felt themselves encouraged to use Phenomena
also in performing complex tasks.Fig. 19 summarizes the gain in accuracy and in
satisfaction achieved by skilled and by unskilled usersthrough the use of Phenomena. These results encourage usto pursue a more reliable usability validation, by replicat-ing the experiment within a real-world context, whichwill involve real GIS domain experts, with different skillsin programming.
6. Related work
Since their appearance, visual query languages showedto be one of the most effective methods used to reproducethe user’s mental model to discover and manipulate data[29]. Much work has been done along this line and severalproposals have been discussed, also meant to providedesigners with intuitive solutions to embed traditionaland object-oriented databases into visual environments.An excellent survey about visual query languages can befound in [5], where significant work has been analyzedand relevant issues have been outlined for the design ofnext generation visual query systems.
The aspect that visual query languages share is theusage of icons, diagrams, graphs and multi-modalapproaches. The latter can be used to associate data withvisual notations which recall their meaning, and can bespatially manipulated and arranged to compose queries,which are then automatically translated into the under-lying textual query language.
The independence of visual notations from both theapplication domain and the nature of data, led researchersto investigate the applicability of this approach also forspatial databases, where the inner complexity of datacould be overcome by the expressiveness of visuallanguages. Indeed, given the need for spatial querylanguages in several application domains, ranging fromimage databases, to remote sensing, to GIS, a visualnotation may embed heterogeneous components, such as
meaning, geometry, location and properties, into a homo-geneous structure expressed in terms of graphics andlabels. Moreover, the introduction of 3D icons has allowedusers to deal also with scenarios where the thirdcomponent is necessary in representing and analyzingdata [7].
In recent literature, many text-based spatial querylanguages have been proposed which formalize users’requirements and concepts about spatial data. Basically,the common feature of all those query languages has beento extend the standardized SQL query language, byintegrating the SELECT-FROM-WHERE construct withnew operators and command sets [9,20,33,37,38]. Inparticular, SQL3 multimedia specification (SQL/MM) andOpenGeoSpatial Simple media Specification for SQL areconsidered the two major standards for storage andmanagement of spatial data. However, such extensionsreflect the complexity of geographic data and the adoptionof visual notations may simplify the usage of thoselanguages, while retaining the benefits coming from theirexpressive power. Moreover, such languages are mainlyuseful to manage discrete objects, which are representedby vector structures. Queries can be applied to vector datain order to both verify topology and perform spatialanalysis. On the contrary, continuous data are representedby raster formats and can be therefore manipulated onlythrough a limited set of grid-based functions.
An important visual approach for GIS querying isrepresented by sketch-based visual languages. Basically,they adopt the query-by-example approach where usersdraw particular configurations of the spatial elements thatthe system should be able to interpret. The depictedconfiguration represents an example of the result thatshould be displayed. Sketch! was one of the firstlanguages which adopted that approach for composingthe spatial queries [24]. In Spatial-Query-By-Sketch [10]users interact with a touch sensitive screen to sketch theexample spatial configurations. They can augment orreduce the similarity ranking to modify the accuracythreshold for the resulting matches.
Cigales [4] is another sketch-based query system forGIS, able to draw visual queries based on the features andthe operations that users select when composing querieson a graphical interface. A weakness of Cigales lies in thepossible ambiguity deriving from the multiple visualrepresentations and interpretations of queries, as well asin the absence of logical operators. A (limited) attempt tosolve the interpretation ambiguities can be found in LVISintroduced as an extension of Cigales, which was alsointegrated into a customisable visual environment [2].
VISCO is another visual query system that adoptsdeductive reasoning to support users in (geometric andtopological) query specification [34]. VISCO uses standardelements to describe query objects as well as relationshipsbetween objects, and spatial operators to derive com-pound objects. The query semantics must be deducedthrough a Description Logic subsumption mechanism.However, the involved query objects can be associatedonly with simple thematic components (e.g., ‘‘city’’).
In general, sketch and drawing-based approaches aresuitable for expressing similarity-based queries. However,
ARTICLE IN PRESS
L. Paolino et al. / Journal of Visual Languages and Computing 20 (2009) 420–436 435
such methods become uncomfortable in the case ofcomposite queries, because it may be difficult to sketchthe sample query so that it includes all and only thecharacterizing elements the user is looking for. Besides,sketch and drawing-based approaches rely on user’sability to express spatial relationships in a sketch. Indeed,even if some approaches offer support to the user duringthe drawing phase, exact queries can be generallyambiguous due to the several possible interpretations ofthe visual configurations [12].
A different approach, very close to our work, wasfollowed with the Spatial Exploration Environment (SEE)[16]. SEE is an integrated framework that adopts the visualparadigm for spatial query specification and resultvisualization. It relies on a visual query interface fortwo-dimensional spatial data and an underlying visualquery system, SVIQUEL, which allows the specification oftopological and directional relationships between objectsthrough direct manipulation. As for Phenomena, thesystem allows for incremental query specification andrefinement, and benefits from the adoption of directmanipulation paradigm [30], to query spatial data.However, only relationships between two sets of objectsat a time can be specified in SEE, and no graphicalnotation is provided to compose complex query condi-tions and invoke compound spatial computations, as isthe case for Phenomena with the Condition Tree and theNested Rectangles metaphors, respectively.
The issue of specifying any complex spatial queryconditions connected by Boolean operators, has beenmainly faced with two basic approaches in the literature.In the former, single conditions are combined just by theAND operator, and the final result indicates all conditionsthat must be satisfied to select objects. The visual querylanguage Spatial Query-by-Sketch is an example of such anapproach. It allows users to sketch a drawing illustratingall the spatial conditions that must be satisfied. As for thesecond approach, a combination of visual and textualrepresentations is used. Simple conditions are visuallybuilt, while logical operators are applied through thecorresponding buttons. By selecting visual operators andpressing buttons, the corresponding textual SQL conditionappears, which may be used to check the query construc-tion. An example of such an approach is the query builderof the desktop ArcGIS component, named ArcView. Afurther, merely visual, approach is proposed withFilter/Flow, where users use the pipe metaphor todescribe Boolean logics [25]. Each condition is like afilter for the water flow: if two conditions must besatisfied at the same time (AND), then they are located asa sequence of cocks, while if at least one condition mustbe satisfied, then the flow is divided into two minor flowswhich may be interrupted by cocks, representing theconditions.
What mainly distinguishes Phenomena from the pre-vious systems is that the users may benefit from directmanipulation of visual elements (i.e., Nested Rectangles)also when performing complex spatial computationaltasks. The latter may require handling discrete as well ascontinuous geographic information, making Phenomena
an effective visual environment for GIS management, able
to support experts’ activity through usable yet powerfulinterfaces.
7. Conclusion
In this paper we have presented a visual environment,named Phenomena, where heterogeneous data may behandled through a uniform approach. We have shown thatthis environment allows users to compose queries meantto answer a wider range of problems involving spatialdata, because, differently from other approaches, itenables users to visually build conditions concerningdiscrete data as well as continuous data.
The intended users of the system are domain experts(e.g., geologists, meteorologists, archaeologists, sociolo-gists, etc.), who accomplish their analyses on their own,supported by a visual query language. The friendly andeasy-to-learn environment provided by Phenomena allowssuch users to perform complex computations, also oncontinuous fields, which have so far required the inter-vention of expert computer scientists.
The effectiveness of Phenomena has been describedthrough a running example concerning a typical real-world problem, namely the detection of fire risk zones. Itsusability has also been evaluated, in terms of efficacy anduser’s satisfaction, through a comparative experimentalstudy, which has suggested Phenomena superiority againstan extension of the spatial SQL, the ESSQL language.
Let us conclude by remarking that further analysis isneeded for the usability assessment of Phenomena. Indeed,in the present paper, we have provided a preliminaryempirical evaluation, which has relied on the observationof two groups of subjects, chosen among ComputerScience students, and on a set of six significant tasks.The results of the comparative analysis are quite encoura-ging. Nevertheless, we are aware that the involvement ofstudents may threaten the external validity of theexperiment and that in order to achieve a more reliableusability validation, the experiment should be replicated,involving real GIS domain experts, with different skills inprogramming. The real-world GIS applications we aredeveloping in the context of a scientific cooperation withthe Agriculture Council Department of Campania Region,will provide a suitable experimental environment forfuture tasks.
References
[1] J.F. Allen, Maintaining knowledge about temporal intervals, Com-munication of the ACM 26 (1983) 832–843.
[2] M.A. Aufaure-Portier, C. Bonhomme, A high level visual language forspatial data management, in: Lecture Notes in Computer Science,vol. 161m4, Springer, Amsterdam, Netherlands, 1999, pp. 325–332.
[3] D. Blaser, M. Egenhofer, A visual tool for querying geographicdatabases, in: Proceedings of the 5th Conference on AdvancedVisual Interfaces, ACM Press, Palermo, Italy, 2000, pp. 211–216.
[4] D. Calcinelli, M. Mainguenaud, Cigales, a visual query language for ageographical information system: the user interface, Journal ofVisual Languages and Computing 5 (2) (1994) 113–132.
[5] T. Catarci, M.F. Costabile, S. Levialdi, C. Batini, Visual query systemsfor databases: a survey, Journal of Visual Languages and Computing8 (2) (1997) 215–260.
[6] T. Catarci, What happened when database researchers metusability, Information System 25 (3) (2000) 177–212.
ARTICLE IN PRESS
L. Paolino et al. / Journal of Visual Languages and Computing 20 (2009) 420–436436
[7] V. Del Fatto, L. Paolino, F. Pittarello, M.Sebillo, G. Vitiello,WebMGISQL 3D – Iterating the design process passing through ausability study, in: Proceedings of the 20th Human ComputerInteraction conference (HCI Engage!), London, September 11–15,2006, pp. 69–73.
[8] V. Del Fatto, L. Paolino, F. Pittarello, A usability-driven approach tothe development of a 3D web-GIS environment, Journal of VisualLanguages and Computing, Special Issue on Visual Languages andTechniques for Human-GIS Interaction 18 (3) (2007) 280–314.
[9] M. Egenhofer, Spatial SQL: a query and presentation language, IEEETransactions on Knowledge and Data Engineering 6 (1) (1994)86–95.
[10] M. Egenhofer, Query processing in spatial query by sketch, Journalof Visual Languages and Computing 8 (4) (1997) 403–424.
[11] F.Ferri, Visual Languages for Interactive Computing: Definitions andFormalizations, IGI Global, 2007.
[12] F. Ferri, E. Pourabbas, M. Rafanelli, The syntactic and semanticcorrectness of pictorial configuration query geographic databases byPQL, in: Proceedings of the 17th ACM Annual Symposium on AppliedComputing (ACM SAC2002), Madrid, Spain, 2002, pp. 432–437.
[13] S. Gordillo, R. Laurini, Field orientation for continuous spatio-temporal phenomena, in: Proceedings of International Workshopon Emerging Technologies for Geo-Based Applications, Ascona,Switzerland, 2000, pp. 77–101.
[14] D.P. Groth, An Evaluation of a Rule-Based Language for ClassificationQueries, LNCS 3392 Applications of Declarative Programming andKnowledge Management, Springer, Berlin/Heidelberg, 2005, pp. 79–97.
[15] V. Haarslev, M. Wessel, Querying GIS with animated spatialsketches, in: Proceedings of IEEE Symposium on Visual Languages,Capri, Italy, 1997, pp. 201–208.
[16] S. Kaushik, E.A. Rundensteiner, SEE: a spatial exploration environ-ment based on a direct-manipulation paradigm, IEEE Transactionson Knowledge and Data Engineering 13 (4) (2001) 654–670.
[17] K.K. Kemp, Fields as a framework for integrating GIS and environ-mental process models. Part one: representing spatial continuity,Transactions in GIS 1 (3) (1997) 219–234.
[18] K.K. Kemp, Fields as a framework for integrating GIS and environ-mental process models. Part two: specifying field variables,Transactions in GIS 1 (3) (1997) 235–246.
[19] Y.C. Lee, F.L. Chin, An iconic query language for topologicalrelationships in GIS, International Journal of GIS 9 (1) (1995) 25–46.
[20] H. Lin, B. Huang, SQL/SDA: a query language for supporting spatialdata analysis and its web-based implementation, IEEE Transactionson Knowledge and Data Engineering 13 (4) (2001) 671–682.
[21] C.P. Lo, A.K.W. Yeung, Concepts and Techniques of GeographicInformation Systems, Prentice-Hall, ISBN 0130804274, 2002.
[22] P.A. Longley, M.F. Goodchild, D.J. Maguire, D.W. Rhind, GeographicInformation. Systems and Science, Wiley, ISBN 0471495212, 2001.
[23] W. Mendenhall, R.J. Beaver, B.M. Beaver, Introduction to Probabilityand Statistics, 12th ed., Duxbury Press, 2002.
[24] Meyer B, Beyond icons: towards new metaphors for visual querylanguages for spatial information systems, In: Proceedings ofInternational Workshop on Interfaces to Database Systems (IDS92), Glasgow, UK, 1992, pp. 113–135.
[25] A.J. Morris, A.I. Abdelmoty, B.A. El-Geresy, C.B. Jones, A filter flowvisual querying language and interface for spatial databases,GeoInformatica 8 (2) (2004) 107–141.
[26] N. Murray, N.W. Paton, C.A. Goble, J. Bryce, Kaleidoquery – a flow-based visual language and its evaluation, Journal of VisualLanguages and Computing 11 (2) (2000) 151–189.
[27] L. Paolino, F. Pittarello, M. Sebillo, G. Tortora, G. Vitiello, WebM-GISQL – A 3D visual environment for GIS querying, in: Proceedingsof International Conference on Visual Languages and Computing(VLC’03), Miami, Florida, USA, 2003, pp. 294–299.
[28] L. Paolino, M. Sebillo, G. Tortora, G. Vitiello, Extending the OpenGIS&
for managing discrete and continuous time dependent data, in: TheEuropean Information Society Leading the Way with Geo-informa-tion, LNGC, Springer, Berlin, 2007, pp. 265–286.
[29] M. Sebillo, G. Tortora, G. Vitiello, The metaphor GIS query language,Journal of Visual Languages and Computing 11 (4) (2000)439–454.
[30] B. Shneiderman, Designing the User Interface – Strategies forEffective Human–Computer Interaction, 3rd ed., Addison-Wesley,1998.
[31] K. Silvervarg, E. Jungert, A visual query language for uncertainspatial and temporal data, in: Proceedings of the Conference onVisual Information Systems 2005 (VISUAL 2005), Amsterdam, TheNetherlands, July 2005, pp. 163–176.
[32] M. Yi-Miin Yen, R.W. Scamell, A human factors experimentalcomparison of SQL and QBE, IEEE Transactions on SoftwareEngineering 19 (4) (1993) 390–409.
[33] F. Wang, J. Sha, H. Chen, S. Yang, GeoSQL: A spatial query languageof object-oriented GIS, in: Proceedings of 2nd International Work-shop on Computer Science and Information Technologies(CSIT’2000), Ufa, Russia, 2000, pp. 215–219.
[34] M. Wessel, V. Haarslev, VISCO: Bringing visual spatial querying toreality, in: Proceedings of the IEEE Symposium on Visual Languages,Nova Scotia, Canada, 1998, pp. 170–177.
[35] ArcGIS /http://www.esri.comS.[36] Seventh Research Framework Programme (FP7), programme on
‘Cooperation’ – Thematic area ‘‘Environment’’. /http://cordis.eur-opa.eu/fp7/cooperation/environment_enS.
[37] SQL Multimedia and Application Packages (SQLMM, Part3: Spatial),ISO Working.
[38] The Open Geospatial Consortium, Inc.s (OGC) /http://www.opengeospatial.org/S.