phase separation in ternary polymer solutions induced by solvent loss
TRANSCRIPT

Phase Separation in Ternary Polymer Solutions Induced by SolventLoss
Ian Hopkinson* and Matthew Myatt
Cavendish Laboratory, University of Cambridge, Madingley Road,Cambridge CB3 0HE, United Kingdom
Received December 27, 2001
ABSTRACT: Laser scanning confocal microscopy and image analysis have been used to study the phaseseparation behavior of ternary solutions of dextran, poly(ethylene glycol), and water during drying. Themorphology development is strongly affected by the inhomogeneous nature of the solvent quench and bygravitational sedimentation. A range of transient structures is seen in which the morphology varies withdepth into the sample. The origin and development of these structures are explained using simple models.For mixtures where the overall volume fraction of the dextran-rich phase, φs, is 0.1 or 0.34 a dropletmorphology is observed whose development is analyzed in detail. The mean radius of the largest dropletsis found to increase linearly with time. For mixtures with φs ) 0.5, a bicontinuous morphology is seen inwhich the characteristic length scale decreases with depth into the sample as a result of the inhomogeneousdistribution of water in the drying film.
Introduction
Phase separation in polymer blends and solutions isof great technological and theoretical interest. Suchsystems have been widely used for studies of phaseseparation as the characteristic length and time scalesare large compared to other “model” systems of phaseseparation, such as binary metals and simple liquids.The mechanisms of phase separation are therefore moreexperimentally accessible. However, because of thenature of polymers and their solutions, hydrodynamiceffects are often significant, thus increasing the com-plexity of these systems.
In the vast majority of phase separation studies ofpolymer solutions, the experiment involves a “homoge-neous” (i.e., spatially invariant) step quench, often oftemperature. In industrial polymer processing, however,quenches are often nonuniform; for example, thermalgradients are a feature of most melt processing methods.Solvent quenching, which occurs in such importantprocesses as spin-coating, film-casting, spray-drying,and freeze-drying, has received little scientific attention.Because of the very nature of solvent loss, which occursat the sample-air interface, solvent quenches willusually be inhomogeneous, leading to variations ofsolvent concentration within the sample. A furthercomplication of drying processes is that solvent loss iscontinuous, and hence the equilibrium phase composi-tions are constantly changing. It is clearly of greatimportance to understand the effect of such “nonideal”quenches on the morphology and the resulting proper-ties of phase-separated blends. This investigation isintended to probe these effects.
In this work, we study the evolution of phase-separated morphologies in films of an aqueous ternarypolymer mixture undergoing drying. Films with a rangeof initial compositions were dried, under a controlled
flow of dry nitrogen, at different rates. While drying,the films were noninvasively imaged in three dimen-sions using laser scanning confocal microscopy.
Previous studies of dried films of ternary polymersolutions by Kumacheva,1 Mitov,2 Serrano,3 and Muller-Buschbaum4 have focused on the final morphology of adried layer. Kumacheva and Mitov, studying filmsformed by the evaporation of polystyrene/poly(methylmethacrylate)/toluene, found regular arrays of dropletsof one phase at the air-film interface above a layerdepleted in that phase; they attributed this behavior toBenard-Marangoni convection. Muller-Buschbaum, onthe other hand, concentrated on the surface topology offilms prepared by the drying of polystyrene/poly(bro-mostyrene)/solvent solutions using a wide range ofsolvents to study their effect on the final morphology.In this work we look at the dynamics of the dryingprocess to establish mechanisms of phase coarsening inthis type of system. This gives us access to furthertransient structures which are not probed in studies offinal film morphology.
In general, the presence of gravitational effects in thelate stages of phase separation has been a confoundingfactor in the study of phase separation. Studies havebeen performed on the structural evolution of phase-separated systems following vigorous stirring,5,6 whichessentially amounts to a sedimentation process. Thesestudies find a moving front between the two finalphases, with a distribution of droplet sizes close to thefront. The size of droplets is greater close to the movingfront, but their growth is limited at long times byhydrodynamic effects. The characteristic demixing timeis found to scale with the reduced temperature.
Phase separation occurring in a gravitational field hasbeen examined in a number of studies involving bothsimulation7,8 and experiment.9 Puri7 sought anisotropyin the early stages of phase separation and explicitlyexcluded the effects of gravitational sedimentation.Lacasta8 focused on the evolution of a critical mixturein the context of model B, i.e., with no hydrodynamics.Lattice Boltzmann simulations of fluid flow and phase
* To whom correspondence should be addressed. Current ad-dress: Department of Physics, UMIST, P.O. Box 88, ManchesterM60 1QD, U.K. E-mail: [email protected], fax +44 (0)-161 200 3941.
5153Macromolecules 2002, 35, 5153-5160
10.1021/ma012244p CCC: $22.00 © 2002 American Chemical SocietyPublished on Web 05/24/2002

separation10,11 clearly have the potential to model thesystem we have; however, to date, calculations appearnot to have been done. Therefore, these simulationstudies, although interesting, are not directly relevantto the behavior we observe. There have also been studiesof phase separation in the presence of temperaturegradients, for example Assenheimer12 and Platten.13
Assenheimer found a wide range of morphologies de-pending on the applied temperature gradient in thedirection of gravity, while Platten applied a temperaturegradient in the horizontal direction. In both cases thethermally driven convection was strong and dominatedthe behavior; in this work, we anticipate rather weakereffects driven by a water concentration gradient.
Laser scanning confocal microscopy14-16 (LSCM) is anoptical microscopy whose key feature is the exclusionof out of focus light from the final image by the use ofa “confocal” pinhole in the detection pathway. Conse-quently, the image obtained is a very thin “opticalsection” through the specimen at the focal plane. Bytaking a series of 2D optical sections at different depthsin the specimen, a 3D image can be built up. Such 3Dimaging is invaluable to the current investigation,allowing the morphology development throughout thewhole depth of the film to be studied. The noninvasivenature of the imaging process is also important, permit-ting the in situ observation of films during drying.
LSCM has been used extensively in the biologicalsciences, where fluorescent labeling of particular cellcomponents is a very powerful tool, and there is alwaysa need to achieve higher resolution to image eversmaller biological structures. In the physical sciences,LSCM has been used rather less, although there is agrowing community of users. Particularly notable arethe studies of colloidal materials by van Blaaderen etal.17,18 and phase-separated morphology in polymersystems by Ribbe et al.,19,20 Jinnai et al.,21-23 andTakeno.24 In these experiments fluorescence labelinghas been key because refractive index contrast isdifficult to engineer. Furthermore, techniques such asdifferential interference contrast and phase contrastthat are often used in materials science studies aredifficult to achieve in LSCM due, in part, to thethickness of the sample and the complexity of thenecessary optics.
While LSCM is undoubtedly a very valuable tool forthe study of phase separation in polymeric systems, itslimited length- and time-scale resolution mean that itcannot be used to study the early stage of phaseseparation (usually defined as the period 0.1 < qê < 1.0,where q is the scattering vector for the characteristiclength scale and ê is the correlation length). In thisstudy, the smallest structures that can be resolved havea length scale of around 1.8 µm, giving a maximumvalue of q of 3.5 µm-1. The correlation length is of theorder of 10 nm, as we are typically far from the criticalpoint, and so the maximum value of qê is approximately0.035. Consequently, the structure developments de-scribed in this work are related to late-stage coarseningprocesses.
Experimental SectionDextran (Mw ) 148 000, Sigma D-4876) and poly(ethylene
glycol) (PEG) (Mw ) 8000, Sigma P-4463) were purchased andused as received. In all experiments, the dextran was fluores-cently labeled by the addition of 1.0 wt % fluorescein isothio-cyanate (FITC)-dextran conjugate (Mw ) 150 000, FITC:glucose ) 1:160, Fluka 46946).
Figure 1 shows the phase diagram for our system, obtainedusing UV/vis spectrometry; we will describe these results inmore detail elsewhere. These results for fluorescently labeledpolymers are consistent with phase diagrams for dextran/PEG/water solutions published in Zaslavsky.25
Solutions of dextran, PEG, and water were prepared withthree different dextran:PEG ratios. The ratios were set so that,when macroscopically phase separated, the equilibrium volumefraction of the dextran-rich phase, φs, equaled 0.1, 0.34, and0.5. The water content was then adjusted so that each solutionwas in the single-phase region, just above the coexistencecurve. The solutions were stirred for a minimum of 24 h toensure complete mixing.
A fixed volume of solution was injected into a 30 mmdiameter polystyrene Petri dish to give a film with an initialthickness of 245 ( 15 µm. The sample was placed onto thestage of a Zeiss LSM 510 upright confocal microscope readyfor observation with a ×20 dry objective lens (NA 0.5). A higherresolution oil-immersion lens could not be used in this studyas the surface of the film had to open to the atmosphere toallow evaporation. The use of such a lens, which would allowobservations of morphology on a much smaller scale, mightbe possible if an inverted microscope is used. The sample andobjective lens were surrounded with a polycarbonate enclosurethrough which dry nitrogen was passed at a known flow rate.Drying rate was varied by altering the flow rate of thenitrogen. A pipe heater was used to keep the temperature ofthe nitrogen flow at 22 ( 1 °C. To minimize mass transportin the sample within the horizontal (x, y) directions, themicroscope stage was carefully leveled so the sample washorizontal. The meniscus between the film and the sides ofthe Petri dish extended only a few millimeters away from thedish, leaving a large area in the middle of the film where thesurface was flat.
The film was imaged several times as it dried. Contrast wasprovided by the FITC-dextran component which was excitedusing the 488 nm line of the microscope’s argon ion laser.Reflected light was excluded by the use of a long-pass 505 nmfilter. 3D image stacks covering the entire depth of the filmwere captured at intervals of 1 min or more. Each image stackconsisted of 30 horizontal image slices with 256 × 256 pixelsand covering an area of 230 µm × 230 µm. The vertical spacingof the image slices was gradually reduced during the experi-ment, as the sample became thinner due to water loss,typically ranging between 11 and 6 µm. The thickness of thefocal plane, which depends on the numerical aperture of theobjective lens and the pinhole diameter, was approximately5.3 µm. The laser intensity, scan speed, and pixel averaging
Figure 1. Phase diagram for the dextran/PEG/buffer systemaxes in terms of weight percentage polymer.
5154 Hopkinson and Myatt Macromolecules, Vol. 35, No. 13, 2002

were carefully chosen to obtain the best compromise betweenimage stack size, acquisition time, image noise, and samplebleaching. The resulting acquisition time was slightly under30 s per stack.
The control parameter in this work is the drying rate, Γ,which is defined as the rate of water loss per unit area ofsample surface. By assuming that the volumes of the threecomponents are simply additive, the drying rate can becalculated from the reduction of film thickness as measureddirectly from the microscope images. The drying rate is foundto be linear and hence independent of the water concentrationat the sample surface. This implies that the rate-controllingstep in the drying process is the removal of water vapor fromthe atmosphere immediately above the sample and not thevaporization of water at the sample surface. It is also foundthat the drying rate is linear with the rate of air flow acrossthe sample.
It should be noted that in these experiments, due to thesurface characteristics of the Petri dishes holding the sample,the films always dewet the substrate before a solid film hadformed.
Results and Discussion
The bulk of this discussion concerns the phase sepa-ration of samples with φs ) 0.1 and 0.34, both of whichexhibit a droplet morphology. First we give a qualitativedescription of the observed morphology development,and then we present and discuss results from a quan-titative analysis of the images obtained.
Figure 2 shows cross sections through a typicalsample, with φs ) 0.34, at various times during thedrying experiment. After 15 min of drying (Figure 2a),the composition of the sample is still in the single-phaseregion, and the film is a homogeneous solution. Phaseseparation occurs first at the surface, the bright dropletsof dextran-rich material being clearly evident in theimage taken after 20 min (Figure 2b). These dropletsgrow and, being more dense than the surrounding PEG-rich matrix, begin to sediment under the action ofgravity. As drying continues, spontaneous phase sepa-ration occurs at increasing depths into the sample. After25 min of drying, phase separation has occurred through-out the whole film (Figure 2c).
Figure 3 shows a vertical cross section and fourhorizontal slices through the image stack taken at 25min. It is apparent that the droplet size varies signifi-cantly with depth through the film. In the bottom halfof the film, the droplets, which have appeared recently,are small and densely packed. In contrast, in the tophalf of the film, the size of the droplets increases withdepth, and the density is somewhat lower. The develop-ment of the structure in the upper half of the film canbe understood by considering the first droplets toappear. These appeared, as we have seen, at the surface
and are more dense than the surrounding PEG-richmatrix. After a short time, they have grown to a sizesuch that gravitational forces become significant, andthey start to sink through the film. As they fall, theycoalesce with each other and with the smaller dropletsthat are forming below them, and their size increasesrapidly. In the meantime, more droplets have appearedat the surface, and the process repeats itself, resultingin the structure noted above. Figure 3d clearly shows abimodal distribution of droplets, the much larger drop-lets falling from above through a sea of smaller, recentlynucleated droplets.
Eventually, the large sinking droplets hit the bottomof the film (as seen in Figure 2d) where they continueto grow as they coalesce with each other and also withdroplets falling into them from above. Nucleation of
Figure 2. xz cross sections through a film showing the development of phase-separated microstructure during drying. Dryingtimes are (a) 15, (b) 20, (c) 25, and (d) 25 min. Water is evaporating from the top surface.
Figure 3. (a) xz cross section through a sample with φs )0.34 some time after phase separation has commenced. (b-e)xy sections at different depths, as marked in (a). The dextran-rich phases are bright.
Macromolecules, Vol. 35, No. 13, 2002 Ternary Polymer Solutions 5155

droplets throughout the film continues but slows downas the concentration of dextran in the matrix decreases.
At later times, dextran-rich droplets grow on the topsurface of the film without sinking and with littlerelative movement between them. It is likely that theviscosity at the surface has become very high, effectivelyforming a skin and trapping the droplets. Their growthwill therefore be purely diffusion-driven with no coa-lescence events. In contrast, the large droplets on thebottom of the film continue to grow by coalescence.However, the rate of coalescence slows dramatically, andin some cases, large droplets (>100 µm radius) areobserved pressed together such that they distort oneanother, yet they remain stable for some time (Figure4). This can be explained by the combination of theincreasing viscosity of the matrix layer between thedroplets and the decreasing driving force for coalescenceas droplet size increases.
It is also evident from Figure 4 that smaller PEG-rich droplets have appeared in the large dextran-richdroplets. These are a result of secondary phase separa-tion. As the large droplets continue to lose water, theequilibrium phase composition changes, and there is adriving force to expel PEG from the droplet. With verylarge droplets and high viscosities, the diffusion of PEGout of the droplets is not sufficient and so subdomainsof PEG-rich material are formed within the dextran-rich droplets.
It is clear that the morphology development is stronglyinfluenced by the effect of gravitational sedimentation.Droplet growth is dominated by coalescence of thesinking droplets with the smaller droplets below them.Another important aspect of the structure developmentis the gradual onset of phase separation through thefilm, starting at the surface and occurring at greaterdepths as drying progresses. Bearing in mind that phaseseparation will first occur when the local water contentreaches a critical value, this strongly suggests that thesolvent quench is inhomogeneous and that the localwater content varies with depth into the film. As wateris lost only from the upper surface, it is to be expectedthat there is a profile of water concentration throughthe depth of the film, the sample being depleted in waternear the surface.
The vertical distribution of water in the film beforephase separation occurs can be estimated by consideringone-dimensional diffusion of water out of an infinitesheet.26 The sheet initially has a uniform water con-centration, C0. The base of the sheet, at x ) 0, isimpermeable, and the top surface, at x ) l, is subject toa constant flux of water, F0. Ignoring the decrease in
film thickness due to the loss of water, the waterconcentration, C, at height, x, and time, t, is given by
where D is the diffusion coefficient of water in thesample. D cannot easily be measured, but a reasonableapproximation may be made by using the diffusioncoefficient of water in a 10% glucose solution (1.66 ×10⁻⁹ m2 s-1).27 From a typical drying experiment, thevalues l ) 235 µm and F0 ) -8.59 × 10⁻⁸ kg m-2 s-1
were measured and used to calculate the water concen-tration profiles shown in Figure 5. While this is asimplistic calculation, which takes no account of theconcentration dependence of D and also ignores convec-tion, it clearly shows that a significant depletion in thewater content of the sample near the surface is reason-able. These calculations also predict that the degree ofdepletion of water at the surface increases with dryingrate. This is supported by the finding that more rapidlydried films exhibit phase separation at a higher overallwater content than those dried more slowly (Figure 6).
If significant convection occurs in the sample, it wouldserve to equalize the diffusion imposed compositiongradients, and the above calculation would be invalid.However, we believe this is not the case. The onset ofthermally activated convection is identified using theRayleigh number:2,28
where R is the thermal expansivity, ∆T is the temper-ature difference, L is a characteristic length scale, g isthe acceleration due to gravity, ø is the thermal diffu-sivity (ø ) κ/(Fcp), where F is density, κ is thermalconductivity, and cp is the heat capacity), and ν is thekinematic viscosity. We assume that the temperaturedifference across the sample due to evaporative coolingis of the order 1 °C. This is an upper bound estimate
Figure 4. Horizontal section through a sample showing largedextran-rich droplets squashed together without coalescing.Small PEG-rich droplets are evident within the larger dextran-rich domains.
Figure 5. Water concentration profiles of a film during atypical drying experiment calculated at 2 min intervals from0 to 20 min. The highest profile shows the initial uniformconcentration, and the concentration falls as evaporationproceeds.
C ) C0 +F0l
D [Dt
l2
+3x2 - l2
6l2-
2
π2∑n )1
∞ (-1)n
n2exp(-Dn2π 2t
l2 ) cos(nπx
l )] (1)
Ra ) R∆TL3gøν
(2)
5156 Hopkinson and Myatt Macromolecules, Vol. 35, No. 13, 2002
based on the findings by Mitov2 that a toluene solutionof similar thickness developed a temperature differenceof 0.4 °C. The solution viscosity is approximated by 3mPa s, the viscosity of a 10 wt % PEG solution.29 Usingthese values and the properties of water, we estimatethe Rayleigh number in our system is around 1, whichis very much lower than the critical value for convection,Ra > 1100.
Similarly, convection driven by interfacial tensiongradients (Benard-Marangoni convection) is usuallyidentified using the Marangoni number:2,30
where ∂γ/∂T is the temperature derivative of the inter-facial tension (0.15 mN m-1 K-1 for water31). Here wefind that Ma ) 90, slightly above the generally quotedthreshold for instability, at Ma ) 80. However, it hasbeen noted that the Marangoni instability is frequentlynot observed until considerably higher values of Ma arereached;30 this is due to the presence of interfaciallyactive species. In this system PEG is interfacially active;therefore, we do not expect Benard-Marangoni convec-tion to occur. This is supported by our observations; inthe work by Mitov2 Benard-Marangoni convection leadsto the formation of regular arrays of phase separateddroplets at the interface which are not observed in oursystem.
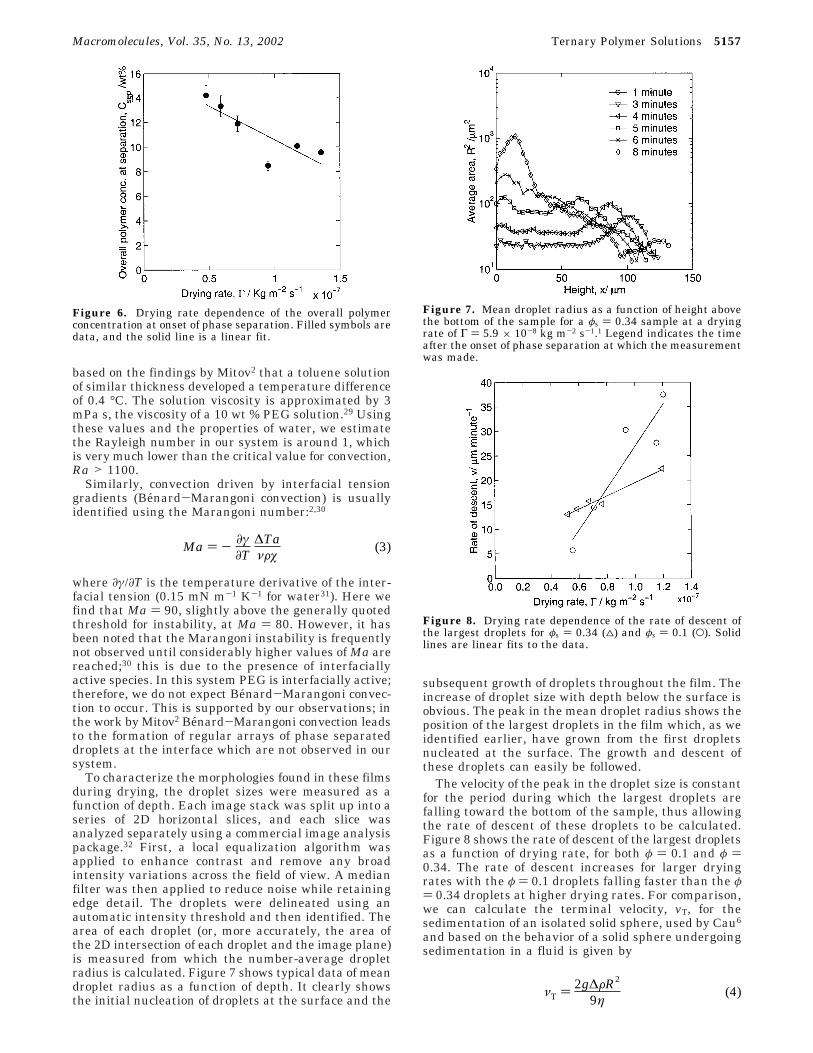
To characterize the morphologies found in these filmsduring drying, the droplet sizes were measured as afunction of depth. Each image stack was split up into aseries of 2D horizontal slices, and each slice wasanalyzed separately using a commercial image analysispackage.32 First, a local equalization algorithm wasapplied to enhance contrast and remove any broadintensity variations across the field of view. A medianfilter was then applied to reduce noise while retainingedge detail. The droplets were delineated using anautomatic intensity threshold and then identified. Thearea of each droplet (or, more accurately, the area ofthe 2D intersection of each droplet and the image plane)is measured from which the number-average dropletradius is calculated. Figure 7 shows typical data of meandroplet radius as a function of depth. It clearly showsthe initial nucleation of droplets at the surface and the
subsequent growth of droplets throughout the film. Theincrease of droplet size with depth below the surface isobvious. The peak in the mean droplet radius shows theposition of the largest droplets in the film which, as weidentified earlier, have grown from the first dropletsnucleated at the surface. The growth and descent ofthese droplets can easily be followed.
The velocity of the peak in the droplet size is constantfor the period during which the largest droplets arefalling toward the bottom of the sample, thus allowingthe rate of descent of these droplets to be calculated.Figure 8 shows the rate of descent of the largest dropletsas a function of drying rate, for both φ ) 0.1 and φ )0.34. The rate of descent increases for larger dryingrates with the φ ) 0.1 droplets falling faster than the φ) 0.34 droplets at higher drying rates. For comparison,we can calculate the terminal velocity, vT, for thesedimentation of an isolated solid sphere, used by Cau6
and based on the behavior of a solid sphere undergoingsedimentation in a fluid is given by
Figure 6. Drying rate dependence of the overall polymerconcentration at onset of phase separation. Filled symbols aredata, and the solid line is a linear fit.
Ma ) - ∂γ∂T
∆TaνFø
(3)
Figure 7. Mean droplet radius as a function of height abovethe bottom of the sample for a φs ) 0.34 sample at a dryingrate of Γ ) 5.9 × 10⁻⁸ kg m-2 s-1.1 Legend indicates the timeafter the onset of phase separation at which the measurementwas made.
Figure 8. Drying rate dependence of the rate of descent ofthe largest droplets for φs ) 0.34 (4) and φs ) 0.1 (O). Solidlines are linear fits to the data.
νT ) 2g∆FR2
9η(4)
Macromolecules, Vol. 35, No. 13, 2002 Ternary Polymer Solutions 5157

The time to reach terminal velocity is of order 10FR2/(9η); for our system this time is negligible (,1 s). Theterminal velocity is around 145 µm min-1, assumingdroplets of 8 µm radius, a density mismatch of 50 kgm-3 (measured using a Paar densitometer), and acontinuous phase viscosity of 3 mPa s. This estimate israther higher than the observed values for the velocityof descent. At least some of the discrepancy can beaccounted for by the enhancement of the suspensionviscosity over the continuous phase viscosity, as de-scribed by Einstein and Batchelor.33 They predict
where φ is the volume fraction of the suspension, η isthe continuous phase viscosity, and η* is the observedviscosity. This effect could account for approximately ahalving of the estimated terminal velocity, but the effectshould be much bigger for the φ ) 0.34 data. We notethat even with extreme values of the volume fraction itcannot account for the variation of the descent velocitywith drying rate. An alternative explanation is thatdescent rate is limited by drainagesfor droplets todescend, fluid below the droplets must flow up pastthem. Such effects are not incorporated into the Ein-stein-Batchelor expression. It is to be expected thatthese effects are larger for higher volume fractions. Thismay also account for the dependence of descent rate ondrying rate. At lower drying rates, it takes longer forphase separation to occur throughout the whole film,and so the volume fraction of the smaller droplets belowthe largest droplets is smaller.
The expected time dependence of the maximumdroplet size can be deduced using a simple model. Letus assume that a droplet, radius R, has formed at thesurface of the sample and has started to fall toward thebottom of the sample through a matrix which containssmall droplets, radius r, with an overall phase volumeφs. We assume that the big droplet will absorb eachsmall droplet that it falls upon. If the big droplet fallsby a small distance, dx, then the increase in volume ofthe droplet, dV, through absorbing the small dropletsis given by
dV is related to the change in radius of the big droplets;in fact, dV ) 4 πR2 dR. By substituting this into (6) andintegrating, we find that
The leading term in R dominates, and so we expectR ∼ φsx. Where x is the distance from the surface, wehave shown that the droplets descend at a constantvelocity and so x ∼ t. Therefore, R ∼ φst, and we expectthat plots of the maximum droplet size Rmax vs φstshould be universal and scale data from differentvolume fractions and drying rates onto one straight line.Such a plot is shown in Figure 9. Values of φs weremeasured from the image stacks, although their mea-surement was somewhat uncertain. The proposed modeltakes no account of whether the droplets are the largestin the system and should apply to any of the droplets.Figure 10 shows results of measurements on dropletsmade below the largest ones, in the same manner asFigure 9. Although the number of data points in each
series is limited, both sets of data are consistent with alinear growth rate. However, the data do not collapseonto a universal curve, and so the predicted dependenceon φs is not supported. This is discussed in more detailbelow.
We note that, for moderately concentrated systems,Siggia34 predicts a linear growth regime, in the absenceof gravity, based on dimensional analysis and qualita-tive arguments of a hydrodynamic nature. Furthermore,both the droplet collision mechanism proposed by Binderand Stauffer35 and the coarsening of droplets by diffu-sion as described by Liftshitz and Slyozov36 produce alinear growth rate in the late stages of phase separation.
Extrapolating the linear fits in Figure 9 back to thetime at which phase separation was first observed givesa finite initial droplet size which appears to be inde-pendent of drying rate and in the region 1.8 µm < r <2.5 µm. We can interpret this nonzero intercept asindicating that there is a critical size beyond whichdroplets must grow before they start to sediment. Thiscritical size can be estimated by balancing the thermal
η* ) η(1 + 2.5φ + 6.2φ2) (5)
dV ) dx2π(r + R)2φs (6)
R - r2
r + R- 2r log(r + R) )
xφs
2(7)
Figure 9. Maximum mean droplet radius vs φ t for φs )0.34: Γ ) 13.5 × 10⁻⁸ kg m-2 s-1 ()), Γ ) 11.9 × 10⁻⁸ kg m-2
s-1 (3), Γ ) 6.7 × 10⁻⁸ kg m-2 s-1 (4), Γ ) 5.9 × 10⁻⁸ kg m-2
s-1 (1), Γ ) 5.2 × 10⁻⁸ kg m-2 s-1 (2), Γ ) 4.7 × 10⁻⁸ kg m-2
s-1 (0); for φs ) 0.1: Γ ) 12.0 × 10⁻⁸ kg m-2 s-1 (×), Γ )9.3 × 10⁻⁸ kg m-2 s-1 (/), Γ ) 7.1 × 10⁻⁸ kg m-2 s-1 (+), Γ )5.55 × 10⁻⁸ kg m-2 s-1 (b). Solid lines are linear fits to thedata.
Figure 10. Mean droplet radius vs φt for droplets lower inthe sample than the largest droplets, all with φs ) 0.34 anddrying rates Γ ) 6.7 × 10⁻⁸ kg m-2 s-1 (O), Γ ) 5.9 × 10⁻⁸ kgm-2 s-1 (×), and Γ ) 5.2 × 10⁻⁸ kg m-2 s-1 (/). Solid lines arelinear fits to data.
5158 Hopkinson and Myatt Macromolecules, Vol. 35, No. 13, 2002

energy of the droplets to their gravitational potentialenergy, i.e.
where r is the critical droplet radius, ∆F is the differencein density between the phases, g is the acceleration dueto gravity, T is the temperature, kB is the Boltzmannconstant, and h is the height through which a dropletmust fall for sedimentation to be considered significant.In this system it seems reasonable to approximate h )1 µm, giving a value of rcrit ≈ 1.4 µm, which is broadlyconsistent with the observed intercept behavior.
While plots of Rmax vs φst are linear they do notcollapse onto a common line, suggesting that the modeloversimplifies the matrix through which the dropletsare falling. This is unsurprising since we have takenno account of the possible hydrodynamic interactionsin the system. In particular a “coalescence inducedcoalescence” mechanism37,38 has been proposed, in whichdroplet coalescence causes hydrodynamic flows leadingto further coalescence. This means that the “effective”volume fraction of material through which a droplet isfalling differs from the measured volume fraction φs.
At dextran volume fractions φs ) 0.5, a bicontinuousmorphology is observed, as is anticipated from a widebody of literature. In contrast to systems subjected to ahomogeneous quench, this system exhibits a bicontinu-ous structure whose length scale varies with depth intothe sample. This is illustrated in Figure 11, which showsx-y planes at selected distances from the surface alongwith an x-z plane. A very thin surface layer consists of
PEG-rich droplets. Whether this is the result of thebreakup of the bicontinuous structure or whether themorphology is affected by the sample-air interface isunclear. The graded bicontinuous structure is seenshortly (within 1-2 min) after the first signs of phaseseparation. It rapidly disappears as the sample coarsensby gravity-induced drainage of the bicontinuous phases.This leads to further heterogeneous structures withareas that are bicontinuous and others that are PEG-rich droplet phases or dextran-rich droplet phase.
We can obtain a measure of the characteristic lengthscale of the graded bicontinuous structure by applyinga 2D FFT to individual x-y planes in the sample. Thisresulting transforms are analogous to static light scat-tering patterns and are circularly symmetric, exhibitinga maximum intensity as a function of q. The position ofthe maxima in the transforms shifts to higher q withincreasing depth from the drying surface, d, as il-lustrated in Figure 12. Characteristic length scales areobtained from the positions of the maxima. The varia-tion of characteristic length scale with d-1/2 for twoidentical samples is illustrated in Figure 13.
The variation of length scale with depth can berationalized by making the following assumptions.Phase separation will be initiated when the local water
Figure 11. Bicontinuous morphology for φs ) 0.5, 2 min afterthe onset of phase separation: (a) x-z section, (b-e) x-ysections at the positions marked in (a). Bright areas are thedextran-rich phase.
34kBT ) 4
3πr3∆Fgh (8)
Figure 12. Radially averaged FFT’s of x-y sections of thebicontinuous morphology for the sample shown in Figure 11.Data from successive slices are offset for clarity.
Figure 13. Characteristic length scales obtained from thepositions of the maxima in the radially averaged FFT’s shownin Figure 12, plotted as a function of 1/d1/2 where d is thedistance from the air surface.
Macromolecules, Vol. 35, No. 13, 2002 Ternary Polymer Solutions 5159

content reaches a critical concentration. The waterconcentration profile normal to the surface is expectedto have a length scale that varies as the square root oftime, as is consistent with a diffusion process. As weare observing the late-stage coarsening region of phaseseparation, the growth of the characteristic length scaleshould be linear with time. Consequently, we expect thecharacteristic length scale to vary as 1/(const + d1/2),and hence the plots of length scale vs d-1/2 (Figure 13)should be linear as long as the constant is small.
Deviations from linearity are likely to occur at smalldepths, corresponding to large d-1/2, where the size ofthe constant will be large compared to the depth.Examining Figure 13, we see that the data are consis-tent with such assumptions with a linear region at smalld-1/2 and deviations at higher d-1/2. The lines on thefigure are linear fits to all but the two smallest depthvalues, constrained to pass through the origin. Clearly,there are insufficient data to be absolutely confidentthat these simple arguments embody the key physicalprocesses at work in the system, but they at leastprovide a plausible explanation of the observed data.The graded structure is only observed at times shortlyafter phase separation has started and before significantdensity driven sedimentation can take place so it is notnecessary to consider such effects in our crude model ofthe observed length scale.
ConclusionsWe have measured quantitatively the morphology
development in a ternary polymer mixture undergoingphase separation, induced by solvent loss, using confocalmicroscopy. As expected, the behavior is strongly influ-enced by gravitational sedimentation and by the inho-mogeneous nature of the quench. Solvent loss byevaporation from the upper surface leads to a variationin local water concentration through the depth of thesample, the water content being lower nearer the uppersurface. Phase separation thus occurs initially at thesurface and then gradually at greater depths as dryingcontinues. The resulting transient structures showconsiderable variation with depth into the sample forboth droplet and bicontinuous morphologies. Confocalmicroscopy is an excellent tool for observing suchcomplex structures in three dimensions and, whencombined with standard image analysis tools, can yieldquantitative information about the structures and theirdevelopment.
At volume fractions of the dextran-rich phase, φs )0.1 and 0.34 droplet morphologies were observed withphase separation commencing at the upper surface ofthe sample. The resulting droplets sediment through thesample under the action of gravity and grow by coales-cence with smaller droplets that recently formed belowthem. The growth law was found to be linear in time,which could be justified using a simple collision argu-ment. At volume fractions of dextran φs ) 0.5, abicontinuous structure was observed in which thecharacteristic length scale decreased with increasingdistance from the upper, drying surface. This behaviorresults from the range of times at which phase separa-tion initiates because of the profile of water concentra-tion.
Although simple models can be used to describe thebroad character of phase separation behavior observed,there are details, particularly in the drying rate depen-dence of the growth rate, which are not understood.
Acknowledgment. We thank Brad Thiel for hismany helpful suggestions, and we are grateful toUnilever plc and EPSRC for funding this work.
References and Notes
(1) Kumacheva, E.; Li, L.; Winnik, M. A.; Shinozaki, D. M.;Cheng, P. C. Langmuir 1997, 13, 2483-2489.
(2) Mitov, Z.; Kumacheva, E. Phys. Rev. Lett. 1998, 81, 3427-3430.
(3) Serrano, B.; Baselga, J.; Bravo, J.; Mikes, F.; Sese, L.;Esteban, I.; Pierola, I. F. J. Fluoresc. 2000, 10, 135-139.
(4) Muller-Buschbaum, P.; Gutmann, J. S.; Wolkenhauer, M.;Kraus, J.; Stamm, M.; Smilgies, D.; Petry, W. Macromolecules2001, 34, 1369-1375.
(5) To, K. W.; Chan, C. K. Europhys. Lett. 1992, 19, 311-316.(6) Cau, F.; Lacelle, S. Phys. Rev. E 1993, 47, 1429-1432.(7) Puri, S.; Binder, K.; Dattagupta, S. Phys. Rev. B 1992, 46,
98-105.(8) Lacasta, A. M.; Hernandez-Machado, A.; Sancho, J. M. Phys.
Rev. B 1993, 48, 9418-9425.(9) Chan, C. K.; Goldburg, W. I. Phys. Rev. Lett. 1987, 58, 674-
677.(10) Kono, K.; Ishizuka, T.; Tsuda, H.; Kurosawa, A. Comput.
Phys. Commun. 2000, 129, 110-120.(11) Swift, M. R.; Osborn, W. R.; Yeomans, J. M. Phys. Rev. Lett.
1995, 75, 830-833.(12) Assenheimer, M.; Khaykovich, B.; Steinberg, V. Physica A
1994, 208, 373-393.(13) Platten, J. K.; Chavepeyer, G. Phys. Lett. A 1993, 174, 325-
328.(14) Wilson, T., Ed. Confocal Microscopy, 1st ed.; Academic
Press: London, 1990; p 426.(15) Chestnut, M. H. Curr. Opin. Colloid Interface Sci. 1997, 2,
158-161.(16) Ribbe, A. E. Trends Polym. Sci. 1997, 5, 333-337.(17) Blaaderen, A. v.; Wiltzius, P. Science 1995, 270, 1177-1179.(18) Kegel, W. K.; Blaaderen, A. v. Science 2000, 287, 290-293.(19) Ribbe, A. E.; Hashimoto, T. Macromolecules 1997, 30, 3999-
4009.(20) Ribbe, A. E.; Hayashi, M.; Weber, M.; Hashimoto, T. Polymer
1998, 39, 7149-7151.(21) Jinnai, H.; Yoshida, H.; Kimishima, K.; Funaki, Y.; Hirokawa,
Y.; Ribbe, A. E.; Hashimoto, T. Macromolecules 2001, 34,5186-5191.
(22) Jinnai, H.; Nishikawa, Y.; Morimoto, H.; Koga, T.; Hashimoto,T. Langmuir 2000, 16, 4380-4393.
(23) Jinnai, H.; Koga, T.; Nishikawa, Y.; Hashimoto, T.; Hyde, S.T. Phys. Rev. Lett. 1997, 78, 2248-2251.
(24) Takeno, H.; Iwata, M.; Takenaka, M.; Hashimoto, T. Mac-romolecules, in press.
(25) Zaslavsky, B. Y. Aqueous Two-Phase Partitioning; MarcelDekker: New York, 1995.
(26) Crank, J. The Mathematics of Diffusion; Oxford UniversityPress: Oxford, 1975.
(27) Luyben, K. C. A. M.; Olieman, J. J.; Bruin, S. Concentrationdependent diffusion coefficients derived from experimentaldrying curves. In Drying ’80; Musumda, A. S., Ed.; Hemi-sphere Publishing Corporation: New York, 1980; pp 233-243.
(28) Faber, T. E. Fluid Dynamics for Physicists; CambridgeUniversity Press: Cambridge, 1995.
(29) Brandrup, J., Immergut, E. H., Grulke, E. A., Eds. PolymerHandbook, 4th ed.; John Wiley & Sons: Chichester, 1999.
(30) Miller, C. A.; Neogi, P. Interfacial Phenomena-Equilibriumand Dynamic Effects; Marcel Dekker: New York, 1985.
(31) Kaye, G. W. C., Laby, T. H., Eds. Tables of Physical andChemical Constants, 16th ed.; Longman: London, 1995.
(32) Media Cybernetics, Image-Pro Plus, 1997.(33) Hunter, R. J. Foundations of Colloid Science; Oxford Uni-
versity Press: Oxford, 2001.(34) Siggia, E. D. Phys. Rev. A 1979, 20, 595-605.(35) Binder, K.; Stauffer, D. Phys. Rev. Lett. 1974, 33, 1006-1009.(36) Lifshitz, I. M.; Slyozov, V. V. Phys. Chem. Solids 1961, 19,
35-50.(37) Tanaka, H. Phys. Rev. Lett. 1994, 72, 1702-1705.(38) Nikolayev, V. S.; Beysens, D.; Guenoun, P. Phys. Rev. Lett.
1996, 76, 3144-3147.
MA012244P
5160 Hopkinson and Myatt Macromolecules, Vol. 35, No. 13, 2002