phase 1 groundwater injury assessment sauget industrial ... · phase 1 groundwater injury...
TRANSCRIPT
Phase 1 Groundwater Injury Assessment Sauget Industrial Corridor Area, Sauget, Illinois
Submitted to:
Tom Heavisides Illinois Department of Natural Resources
One Natural Resources Way Springfield, IL 62702-1271
Gerald T. Karr
Illinois Attorney General’s Office 69 West Washington Street, Suite 1800
Chicago, IL 60602
Submitted by:
Abt Associates Inc.
1881 Ninth Street, Suite 201 Boulder, CO 80302
303.381.8000
Contacts:
Jamie Holmes, MS Connie Travers, MS
February 15, 2018 14277

Table of Contents
Abt Associates 14277 February 15, 2018 | ii
Contents List of Acronyms and Abbreviations .......................................................................... iv
S. Executive Summary ........................................................................................ S-1
1. Introduction ...................................................................................................... 1-1 1.1 Responsible Parties .............................................................................................. 1-2 1.2 Coordination with Remedial Investigation/Feasibility Study .............................. 1-2 1.3 Assessment Approach .......................................................................................... 1-2 1.4 Data Sources ........................................................................................................ 1-3 1.5 Report Organization ............................................................................................. 1-3
2. Sources of Hazardous Substances ................................................................ 2-1 2.1 Monsanto/W.G. Krummrich ................................................................................ 2-3
2.1.1 Site History .............................................................................................. 2-3 2.1.2 Hazardous Substance Releases ................................................................ 2-4
2.2 Clayton Chemical ................................................................................................. 2-7 2.2.1 Site History .............................................................................................. 2-7 2.2.2 Hazardous Substance Releases ................................................................ 2-7
2.3 Cerro Flow Products ............................................................................................ 2-7 2.3.1 Site History .............................................................................................. 2-7 2.3.2 Hazardous Substance Releases ................................................................ 2-8
2.4 Phillips Petroleum ................................................................................................ 2-8 2.4.1 Site History .............................................................................................. 2-8 2.4.2 Hazardous Substance Releases .............................................................. 2-10
2.5 Moss-American .................................................................................................. 2-10 2.5.1 Site History ............................................................................................ 2-10 2.5.2 Hazardous Substance Releases .............................................................. 2-11
2.6 Former Sauget Terminal .................................................................................... 2-11 2.6.1 Site History ............................................................................................ 2-11 2.6.2 Hazardous Substance Releases .............................................................. 2-11
2.7 Sauget Area 1 ..................................................................................................... 2-12 2.7.1 Site G ..................................................................................................... 2-12 2.7.2 Site H ..................................................................................................... 2-15 2.7.3 Site I ....................................................................................................... 2-15 2.7.4 Other Sites .............................................................................................. 2-15
2.8 Sauget Area 2 ..................................................................................................... 2-15 2.8.1 Site O ..................................................................................................... 2-17 2.8.2 Site P ...................................................................................................... 2-17 2.8.3 Site Q ..................................................................................................... 2-17 2.8.4 Site R ...................................................................................................... 2-18 2.8.5 Site S ...................................................................................................... 2-18
2.9 Summary ............................................................................................................ 2-18
3. Groundwater Resources and Pathways ........................................................ 3-1 3.1 Pathways to Groundwater .................................................................................... 3-1 3.2 American Bottoms Aquifer .................................................................................. 3-1

Table of Contents
Abt Associates 14277 February 15, 2018 | iii
3.3 Baseline Conditions and Lost Use ....................................................................... 3-3 3.4 Direction of Groundwater Flow ........................................................................... 3-6
3.4.1 Westward Flow toward the River ............................................................ 3-6 3.4.2 Gradient Changes during High River Stage............................................. 3-6 3.4.3 Northward toward IDOT Pumping Wells .............................................. 3-10
3.5 Summary ............................................................................................................ 3-15
4. Groundwater Injury ......................................................................................... 4-1 4.1 Definition of Injury .............................................................................................. 4-1 4.2 Groundwater Contaminants ................................................................................. 4-1 4.3 Extent of Injured Groundwater ............................................................................ 4-4
4.3.1 RI/FS Data ............................................................................................... 4-4 4.3.2 USACE Well Clusters............................................................................ 4-12 4.3.3 Phillips Petroleum .................................................................................. 4-14 4.3.4 Moss-American ...................................................................................... 4-19 4.3.5 Former Sauget Terminal ........................................................................ 4-19 4.3.6 RCRA Data from Solutia ....................................................................... 4-22 4.3.7 Extent of Integrated Commingled Plume .............................................. 4-28
4.4 Temporal Extent................................................................................................. 4-31 4.4.1 Historical Extent of Groundwater Injury ............................................... 4-31 4.4.2 Projected Future Extent of Groundwater Contamination ...................... 4-32
4.5 Data Gaps ........................................................................................................... 4-35 4.6 Summary ............................................................................................................ 4-37
References ............................................................................................................... R-1

Acronyms and Abbreviations
Abt Associates 14277 February 15, 2018 | iv
Acronyms and Abbreviations
AOC area of concern AST above ground storage tank bgs below ground surface BTEX benzene, toluene, ethylbenzene, and xylenes CERCLA Comprehensive Environmental Resource, Compensation, and Liability Act CWA Clean Water Act CWS Chemical Warfare Service DAT Dichloramine-T DDT dichlorodiphenyltrichloroethane DHU deep hydrogeologic unit DNAPL dense non-aqueous phase liquid DOI U.S. Department of the Interior FS feasibility study FWS United States Fish and Wildlife Service GMCS Groundwater Migration Control System gpm gallons per minute IDNR Illinois Department of Natural Resources IDOT Illinois Department of Transport IEPA Illinois Environmental Protection Agency KMCC Kerr McGee Chemical Corporation LNAPL light non-aqueous phase liquid LUST leaking underground storage tank MCL Maximum Contaminant Level mgd million gallons per day MHU middle hydrological unit MoDNR Missouri Department of Natural Resources MTBE methyl tertiary-butyl ether NAPL non-aqueous phase liquid NPL National Priorities List NRDA natural resource damage assessment PAH polycyclic aromatic hydrocarbon PCB polychlorinated biphenyl ppb parts per billion

Acronyms and Abbreviations
Abt Associates 14277 February 15, 2018 | v
PRP potentially responsible party PVC polyvinyl chloride RCRA Resource Conservation and Recovery Act RI remedial investigation RRG Resource Recovery Group SDWA Safe Drinking Water Act SHU shallow hydrogeologic unit SIC Sauget Industrial Corridor SRP Site Remediation Program SVOC semivolatile organic compound SWMU solid waste management unit USACE U.S. Army Corps of Engineers U.S. EPA U.S. Environmental Protection Agency USGS U.S. Geological Survey UST underground storage tank VOC volatile organic compound WWTP Wastewater Treatment Plant

Executive Summary
Abt Associates 14277 February 15, 2018 | S-1
S. Executive Summary
The United States Fish and Wildlife Service, the Illinois Environmental Protection Agency (IEPA), the Illinois Department of Natural Resources (IDNR) (IEPA and IDNR are collectively referred to as the Illinois State Trustees), and the Missouri Department of Natural Resources, collectively referred to as the “Trustees,” have initiated a natural resource damage assessment (NRDA) to address natural resource injuries resulting from the release of oil and hazardous substances1 at the Sauget Industrial Corridor (SIC) site and adjacent sites in St. Clair County, Illinois. The goal of the NRDA is to restore natural resources to the condition they would have been in had the pollution not occurred, and to compensate the public for the losses of natural resources up to the time that such restoration is complete. Restoration can be accomplished by directly restoring the injured resource; or by rehabilitating, replacing, or acquiring equivalent resources.
The Trustees formally initiated the assessment with the publication of the Preassessment Screen for the SIC in 2009 (SIC Natural Resource Trustees, 2009). In 2013, the Trustees released an Assessment Plan documenting their basis for conducting a damage assessment and setting forth the proposed approaches for quantifying natural resource injuries and calculating damages resulting from those injuries (SIC Natural Resource Trustees, 2013). In 2016, the Trustees published a report that discusses the pathways by which hazardous substances released at the site have reached terrestrial and aquatic natural resources (Lewis and Arthur, 2016). The Trustees are currently evaluating injuries and damages to terrestrial and aquatic natural resources.
This document is a Phase 1 assessment of injuries to groundwater resources in Illinois, including a review of hazardous substance sources and the pathways by which hazardous substances have reached groundwater resources. As specified in the Assessment Plan, this injury assessment is based entirely on existing data collected as part of existing monitoring and remediation programs. The Illinois State Trustees may collect additional data to address data gaps in the future. If so, the Trustees may issue an addendum to the Assessment Plan for public review. This assessment of groundwater injuries may be updated in the future as new data become available.
Consistent with the DOI NRDA regulations, this Phase 1 groundwater injury assessment report presents (1) injury determination [43 CFR § 11.62], (2) pathway [43 CFR § 11.63], and (3) injury quantification [43 CFR § 11.70] data. Injury quantification is limited to the spatial extent of groundwater injury plus a qualitative discussion of the past and future injuries. Subsequent phases of this groundwater assessment may include a quantitative estimate of injury over time, including estimates of the volume of injured groundwater in addition to the spatial extent. Subsequent phases will also include an estimate of the appropriate compensation (damages) to offset the injuries.
1. The U.S. Department of the Interior (DOI) NRDA regulations provide that “natural resources trustees may assess damages to natural resources resulting from a discharge of oil or a release of a hazardous substance” [43 CFR § 11.10]. Oil is defined in Section 311(a)(1) of the Clean Water Act, 33 U.S.C. § 1251 et seq. Hazardous substance is defined in Section 101(14) of the Comprehensive Environmental Resource, Compensation, and Liability Act, 42 U.S.C. § 9601 et seq. In this assessment, the Trustees’ use of the terms “oil” (or “petroleum”) and “hazardous substance” assumes to include both or either.

Executive Summary
Abt Associates 14277 February 15, 2018 | S-2
S.1 Sources of Hazardous Substances
The Village of Sauget was originally incorporated as the Village of Monsanto in 1926, a village created by and for Monsanto, where the chemical company could operate without restrictions on noxious odors or toxic waste disposal. Other chemical and petroleum companies were also in Monsanto. For decades, liquid wastes were discharged directly into the Mississippi River without treatment, and solid wastes were landfilled in Dead Creek, waste pits, and other unlined landfills.
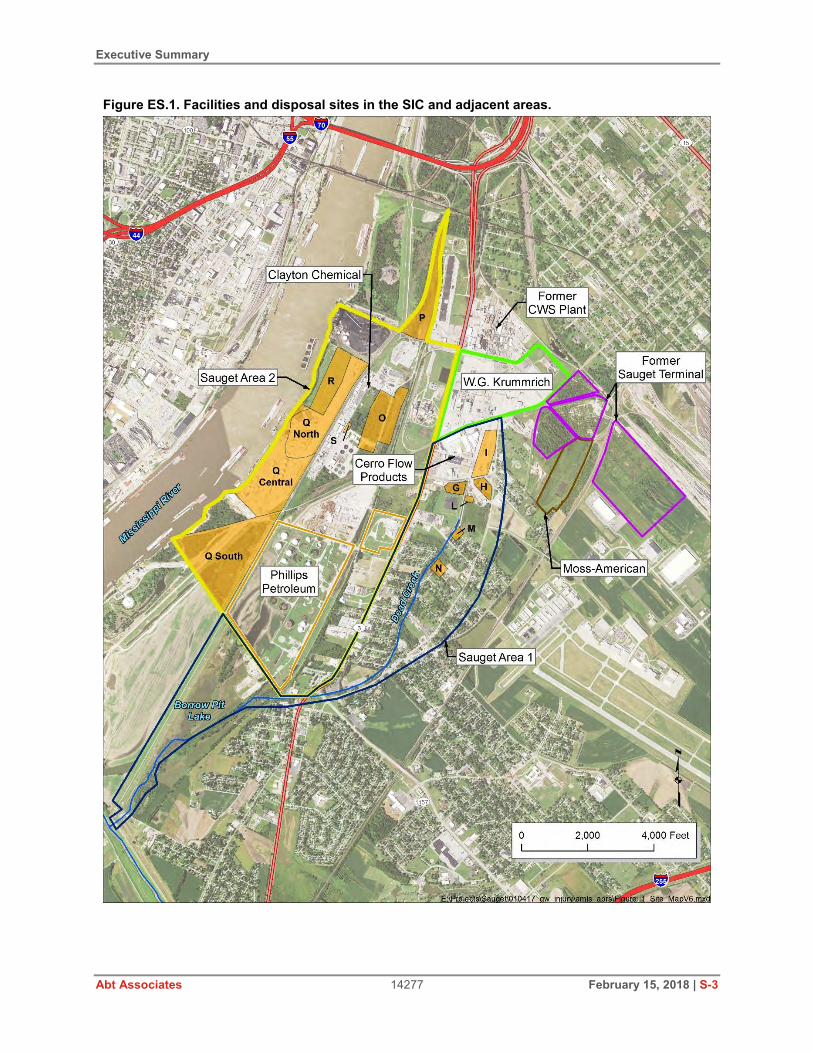
Eventually, the toxic wastes released in the Sauget area became the target of remediation. The SIC and adjacent sites include Sauget Area 1, Sauget Area 2, Monsanto’s W.G. Krummrich and former Chemical Warfare Service (CWS) plants, the Clayton Chemical site, Cerro Flow Products, and numerous other facilities (Figure ES.1). Sauget Areas 1 and 2 comprise numerous landfills that received industrial waste from dozens of facilities both within and outside of the SIC. Sauget Areas 1 and 2 were proposed for listing on the U.S. Environmental Protection Agency National Priorities List in 2001, but neither site was officially listed. Clayton Chemical, Cerro Flow Products, Phillips 66 Pipe Line Company (Phillips Petroleum), Moss-American, and the ExxonMobil Former Sauget Terminal are all facilities in or adjacent to the SIC where releases of hazardous substances have occurred. At each facility, contamination has been found in groundwater, and for the facilities adjacent to the SIC, the groundwater contamination is commingled with SIC groundwater contamination.
The historical industrial operations, spills, and contaminant disposal practices in the SIC area have resulted in numerous and widespread sources of hazardous substances. For example, XDD (2011a, 2011b, 2011c) estimated that over one million pounds of benzene and chlorobenzenes were still present in the vadose zone at the W.G. Krummrich property alone in 2011. In addition, thousands of gallons of toxic waste were buried in unlined landfills and waste pits in the SIC.
The most prominent sources of hazardous substances extend from the W.G. Krummrich property and Site I west to Site Q and Site R along the Mississippi River, an area that encompasses Cerro Flow Products and Clayton Chemical (see Figure ES.1). Prior to the construction of a Groundwater Migration Control System (GMCS) at Site R, the U.S. EPA (2002) estimated that some 484,000 lbs of volatile organic compounds and semivolatile organic compounds were discharged from Sauget groundwater into the Mississippi River every year. East of W.G. Krummrich, benzene and other petroleum releases at Moss-American and the Former Sauget Terminal have commingled with benzene releases from W.G. Krummrich and the SIC. Additional releases have occurred at Phillips Petroleum, where benzene and methyl tertiary-butyl ether (MTBE) appear to be commingled.
S.2 Groundwater Resources and Pathways
In the DOI regulations, groundwater is defined as water in a saturated zone or stratum beneath the surface of land or water, and the rocks or sediments through which groundwater moves. It includes groundwater resources that meet the definition of drinking water supplies [43 CFR § 11.14(t)]. A pathway is the route or medium through which…a hazardous substance is or was transported from the source of the discharge or release to the injured resource [43 CFR § 11.14(dd)].
Executive Summary
Abt Associates 14277 February 15, 2018 | S-3
Figure ES.1. Facilities and disposal sites in the SIC and adjacent areas.

Executive Summary
Abt Associates 14277 February 15, 2018 | S-4
Groundwater has played an important role as an industrial and municipal water supply in the Sauget area. Millions of gallons per day were used to support Sauget industries through the 1960s. Many municipalities still depend on the American Bottoms aquifer for their public water supply.
The DOI regulations define baseline as “the condition or conditions that would have existed at the assessment area had the discharge of oil or release of the hazardous substance under investigation not occurred” [43 CFR § 11.14(e)]. The American Bottoms aquifer in the Sauget area is an important potable water source under baseline conditions. In recent years, the Village of Caseyville (about 8 miles from Sauget) investigated switching from Mississippi River water to American Bottoms groundwater for its public water supply, indicating that groundwater is a superior water source. That is not an option near Sauget, as groundwater ordinances in East St. Louis, Sauget, and Cahokia all prohibit the use of groundwater as a potable water supply because of the contamination. Groundwater is also no longer a viable option for industrial use in Sauget. In 2011, Center Ethanol in Sauget contacted IEPA to discuss using groundwater for their industrial operations, but they apparently abandoned those plans after they were informed of the contamination. Thus, absent the releases of hazardous substances from the industries in the Sauget area, particularly the benzene and chlorobenzene releases from Monsanto, the groundwater resources in the SIC area would be potable and would likely provide both municipal and industrial water use services. The pathways by which hazardous substances reached groundwater include direct deposition of liquid and solid chemical wastes into pits that extended into the water table, as well as infiltration and percolation of wastes deposited in the vadose zone above the water table. The data from the 2008 Sauget Area 2 Remedial Investigation (RI; URS, 2008) and other data confirm that both unsaturated geologic resources (soils) and saturated resources serve as pathways for the transport of hazardous substances, as defined in the DOI regulations [43 CFR § 11.63(c, e)]. While the pathways for hazardous substances to reach groundwater are clear, the flow paths once those contaminants are in groundwater are less clear. Much of the contamination flows west from disposal areas to the GMCS along the Mississippi River at Site R (see Figure ES.1). However, the Illinois Department of Transportation (IDOT) maintains a network of high-capacity pumping wells north and northeast of the SIC. These wells pump millions of gallons of groundwater per day to ensure that the water table remains below the road beds of the Interstate highways. This pumping has created a cone of depression that has drawn benzene and chlorobenzene north and northwest from source areas such as the W.G. Krummrich plant and the Former Sauget Terminal. The regional contaminant transport models that Solutia’s contractors have proposed are inaccurate; injured groundwater extends considerably farther north than the regional flow and contaminant transport models predict.
S.3 Groundwater Injury Groundwater resources include water beneath the surface of land or water and the rocks or sediment through which it moves, and include any groundwater that meets the definition of drinking water supplies [43 CFR § 11.14(t)], which are any raw or finished water sources that may be used by the public or by one or more individuals [43 CFR § 11.14(o)]. As mentioned previously, under baseline conditions, the groundwater resources in the SIC area would be potable and would likely provide both municipal and industrial water resource services in the Sauget area, despite the availability of an alternative water supply from the Mississippi River.

Executive Summary
Abt Associates 14277 February 15, 2018 | S-5
Relevant injury definitions for groundwater resources in the DOI regulations include concentrations and duration of hazardous substances in excess of drinking water standards as established by Sections 1411–1416 of the Safe Drinking Water Act (SDWA) or state laws or regulations that establish such standards for drinking water, in groundwater that was potable before the release [43 CFR § 11.62(c)(1)(i)]. For this assessment, groundwater is considered injured if the concentrations of hazardous substances exceed the SDWA Maximum Contaminant Levels and/or Illinois Class I drinking water standards for groundwater [32 IAC 620]. Although numerous contaminants exceed these thresholds, we estimated the extent of groundwater contamination based solely on benzene and chlorobenzene, which are the most ubiquitous hazardous substances in the groundwater. The Sauget Area 2 RI (URS, 2008) provided an initial estimate of the extent of benzene in the shallow hydrogeologic unit (SHU; Figure ES.2) and the deep hydrologic unit (DHU; Figure ES.3), and the extent of chlorobenzene in the SHU (Figure ES.4) and DHU (Figure ES.5). These figures underestimate the extent of the plumes because (1) the lowest contour for benzene is 10 µg/L when the benzene injury threshold is 5 µg/L, and (2) the contractor placed dashed lines in areas where the plume extended beyond the areas shown in the figures. The current spatial extent of injured groundwater includes, at a minimum, the extent of chlorobenzene exceeding 100 µg/L and the extent of benzene exceeding 10 µg/L as depicted in the RI (noting again that the injury threshold for benzene is 5 µg/L). The benzene plume suggests commingling of benzene from W.G. Krummrich source areas and benzene from areas east of W.G. Krummrich, such as Moss-American and the Former Sauget Terminal. While it is likely that injured groundwater under Clayton Chemical and Site R flows predominantly westward toward the GMCS and the river, it is clear from Solutia’s Supplemental Groundwater Monitoring Program that some of the benzene and chlorobenzene released at W.G. Krummrich and areas east of W.G. Krummrich is flowing north/northwest. The supplemental groundwater data strongly suggest that IDOT dewatering wells north and northeast of the W.G. Krummrich facility, in conjunction with variations in groundwater flow caused by changes in the Mississippi River stage, create groundwater gradients that have allowed SIC-related contamination to migrate to the north.
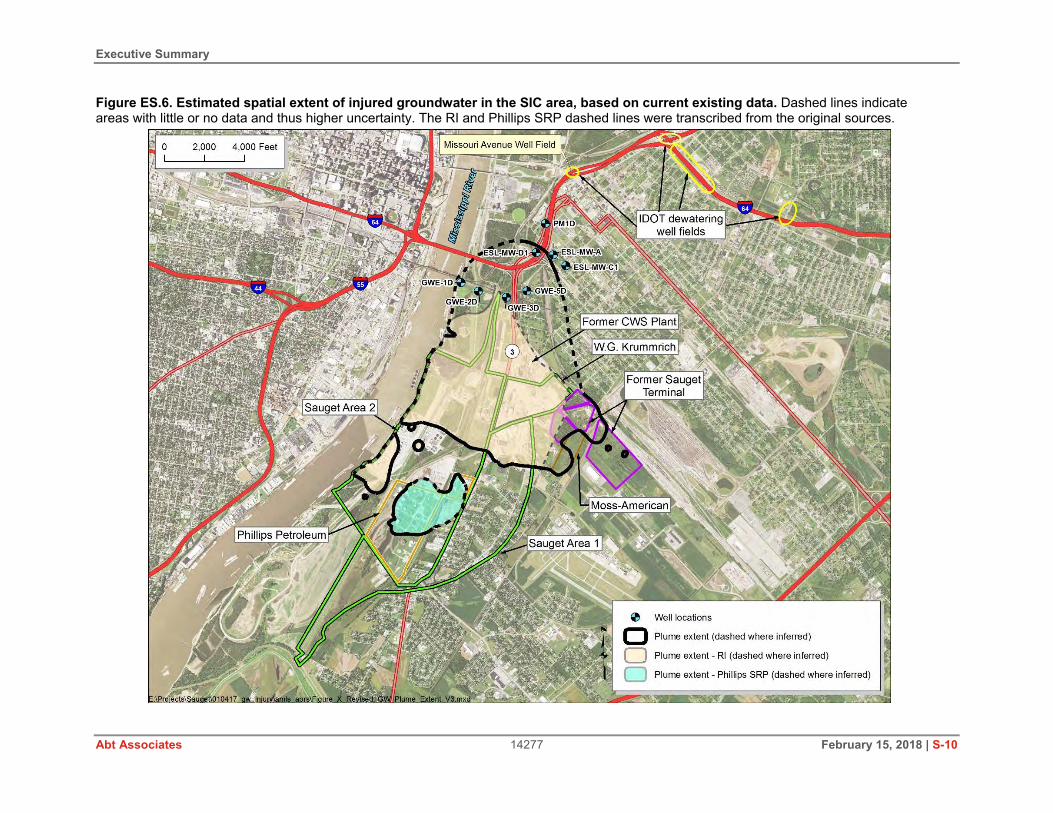
The spatial extent of injured groundwater in the SIC is still uncertain in many areas. However, based on currently available data, the spatial extent of injury includes the areas depicted as injured in the RI using the 100-µg/L contour for chlorobenzene and the 10-µg/L contour for benzene (URS, 2008). In addition, the plume of injured groundwater includes areas injured at Moss-American and the Former Sauget Terminal using the 5-µg/L injury threshold for benzene, and injured groundwater below Phillips Petroleum as depicted in recent Illinois Site Remediation Program (SRP) reports using a 5-µg/L benzene threshold and 70-µg/L MTBE threshold. The plume extends northward toward the IDOT pumping wells on Missouri Ave., but to date, no groundwater samples from the northernmost well have exceeded an injury threshold. Based on these data, we estimated the northeastern extent of injury based on our professional judgment of the likely flow path (Figure ES.6).

Executive Summary
Abt Associates 14277 February 15, 2018 | S-6
Figure ES.2. Estimated extent of benzene contamination in the SHU, as depicted in the Sauget Area 2 RI. Note that north is to the left. The injury threshold for benzene is 5 parts per billion (ppb); the lowest contoured concentration shown in this figure is 10 ppb.
Source: Modified from URS, 2008, Figure 7-26.

Executive Summary
Abt Associates 14277 February 15, 2018 | S-7
Figure ES.3. Estimated extent of benzene contamination in the DHU, as depicted in the Sauget Area 2 RI. Note that north is to the left. The injury threshold for benzene is 5 ppb; the lowest contoured concentration shown in this figure is 10 ppb.
Source: Modified from URS, 2008, Figure 7-28.

Executive Summary
Abt Associates 14277 February 15, 2018 | S-8
Figure ES.4. Chlorobenzene in the SHU, as depicted in the Sauget Area 2 RI. Note that north is to the left. The injury threshold for chlorobenzene is 100 ppb, which is contour level “2” in this figure.
Source: Modified from URS, 2008, Figure 7-29.

Executive Summary
Abt Associates 14277 February 15, 2018 | S-9
Figure ES.5. Chlorobenzene in the DHU, as depicted in the Sauget Area 2 RI. Note that north is to the left. The injury threshold for chlorobenzene is 100 ppb, which is contour level “2” in this figure.
Source: Modified from URS, 2008, Figure 7-31.
Executive Summary
Abt Associates 14277 February 15, 2018 | S-10
Figure ES.6. Estimated spatial extent of injured groundwater in the SIC area, based on current existing data. Dashed lines indicate areas with little or no data and thus higher uncertainty. The RI and Phillips SRP dashed lines were transcribed from the original sources.

Executive Summary
Abt Associates 14277 February 15, 2018 | S-11
While several data gaps still exist, including areas with dashed lines from the RI where no new data have been collected, the initial estimate of the spatial extent of injured groundwater for this Phase 1 analysis (Figure ES.6) is about 1,875 acres, or 2.9 square miles. If new data become available, the State Trustees may revise this estimate of the spatial extent of groundwater injury in the future.
In subsequent phases of the groundwater assessment, the State Trustees may address data gaps such as the extent and depth of benzene contamination in groundwater north/northwest of W.G. Krummrich and in the DHU near Phillips Petroleum. The State Trustees may also assess potential changes to the groundwater injury extent over time, both in the past and in the future (accounting for remedial activities and response actions). In addition, the State Trustees are likely to assess the quantity (volume) of injured groundwater over time, and they will assess the appropriate compensation (damages) to offset the groundwater injury and make the public whole.
References
Lewis, C. and C. Arthur. 2016. Sauget Industrial Corridor Sites Natural Resource Damage Assessment: Pathway Report for Terrestrial and Aquatic Resources. Prepared for U.S. Fish and Wildlife Service. Prepared by Industrial Economics, Cambridge, MA. Available: https://www.fws.gov/midwest/es/ec/nrda/Sauget/pdf/SaugetPathwayReport20160715final.pdf. Accessed 8/23/2017.
SIC Natural Resource Trustees. 2009. Sauget Industrial Corridor Sites, Sauget, Cahokia and East St. Louis, IL Preassessment Screen and Determination. Prepared by the United States Fish and Wildlife Service, Illinois Environmental Protection Agency, Missouri Department of Conservation, and Illinois Department of Natural Resources.
SIC Natural Resource Trustees. 2013. Final Draft Assessment Plan for the Natural Resource Damage Assessment of the Sauget Industrial Corridor Sites, St. Clair County, Illinois. Prepared by the United States Fish and Wildlife Service, Illinois Environmental Protection Agency, Illinois Department of Natural Resources and Missouri Department of Natural Resources. January.
URS. 2008. Sauget Area 2, Sauget, Illinois Remedial Investigation Report. Prepared for Sauget Area 2 Sites Group. October. URS Corporation, St. Louis, MO.
U.S. EPA. 2002. Record of Decision for the Groundwater Operable Unit (OU-2), Sauget Area 2 Superfund Site, Sauget, Illinois. September.
XDD. 2011a. 100% Design – Enhanced Aerobic Bioremediation at Former Chlorobenzene Process Area, W.G. Krummrich Facility, Sauget, IL. Prepared for Solutia Inc., St. Louis, MO. November.
XDD. 2011b. 100% Design – Thermally Enhanced Soil Vapor Extraction System at Former Chlorobenzene Process Area, W.G. Krummrich Facility, Sauget, IL. Prepared for Solutia Inc., St. Louis, MO. November.
XDD. 2011c. 100% Soil Vapor Extraction System Design – Big Mo & Former Benzene Pipeline Areas, W.G. Krummrich Facility, Sauget, IL. Prepared for Solutia Inc., St. Louis, MO. September.

Introduction
Abt Associates 14277 February 15, 2018 | 1-1
1. Introduction
The United States Fish and Wildlife Service (FWS or the Federal Trustee), the Illinois Environmental Protection Agency (IEPA), the Illinois Department of Natural Resources (IDNR) (IEPA and IDNR are collectively referred to as the Illinois State Trustees), and the Missouri Department of Natural Resources (MoDNR or the Missouri State Trustee), collectively referred to as the “Trustees,” have initiated a natural resource damage assessment (NRDA) to address natural resource injuries resulting from the release of oil and hazardous substances1 at the Sauget Industrial Corridor (SIC) site and adjacent sites in St. Clair County, Illinois. The goal of the NRDA is to restore natural resources to the condition they would have been in had the pollution not occurred, and to compensate the public for the losses of natural resources up to the time that such restoration is complete. Restoration can be accomplished by directly restoring the injured resource; or by rehabilitating, replacing, or acquiring equivalent resources.
The Trustees formally initiated the assessment with the publication of the Preassessment Screen for the SIC in 2009 (SIC Natural Resource Trustees, 2009). In 2013, the Trustees released an Assessment Plan documenting their basis for conducting a damage assessment and setting forth the proposed approaches for quantifying natural resource injuries and calculating damages resulting from those injuries. The Assessment Plan informed the potentially responsible parties (PRPs) and the public of the proposed assessment methods so stakeholders can participate in the assessment process productively.
As described in the Assessment Plan (SIC Natural Resource Trustees, 2013), the Trustees will conduct assessments in separate phases as follows:
The Illinois State Trustees will assess groundwater resources The Illinois State Trustees and the Missouri State Trustee will assess State natural resources
in the Mississippi River The Illinois State Trustees and the Federal Trustee will assess State and Federal natural
resources in surface habitat resources (e.g., Dead Creek, terrestrial uplands, wetlands, ponds, small streams).
The Illinois State Trustees are pursuing damages consistent with DOI NRDA regulations at 43 CFR Part 11 under the authority of the CERCLA.2 These regulations are not mandatory. However, assessments performed in compliance with these regulations have the force and effect of a rebuttable presumption in any administrative or judicial proceeding under CERCLA [42 U.S.C. § 9607(f)(2)(C)].
1. The U.S. Department of the Interior (DOI) NRDA regulations provide that “natural resources trustees may assess damages to natural resources resulting from a discharge of oil or a release of a hazardous substance” [43 CFR § 11.10]. Oil is defined in Section 311(a)(1) of the Clean Water Act (CWA), 33 U.S.C. § 1251 et seq. Hazardous substance is defined in Section 101(14) of the Comprehensive Environmental Resource, Compensation, and Liability Act (CERCLA), 42 U.S.C. § 9601 et seq. In this assessment, the Trustees’ use of the terms “oil” (or “petroleum”) and “hazardous substance” assumes to include both or either.
2. The DOI authored 43 CFR Part 11, referred to as the DOI regulations in this document.
Introduction
Abt Associates 14277 February 15, 2018 | 1-2
In 2016, the Trustees published a report that discusses the pathways by which hazardous substances released at the SIC site have reached terrestrial and aquatic natural resources (Lewis and Arthur, 2016). The Trustees are currently evaluating injuries and damages to terrestrial and aquatic natural resources.
This document is a Phase 1 assessment of injuries to groundwater resources in Illinois, including a review of hazardous substance sources and the pathways by which hazardous substances have reached groundwater resources. As specified in the Assessment Plan, this injury assessment is based entirely on existing data collected as part of existing monitoring and remediation programs. The Illinois State Trustees may collect additional data to address data gaps in the future. If so, the Trustees may issue an addendum to the Assessment Plan for public review. This assessment of groundwater injuries may be updated in the future as new data become available.
1.1 Responsible Parties
The Preassessment Screen (SIC Natural Resource Trustees, 2009) contains a list of PRPs at the SIC, based on a list that the U.S. Environmental Protection Agency (U.S. EPA) compiled. These PRPs may be liable for damages to natural resources resulting from releases of hazardous substances at the SIC site and adjacent sites. Not all of these PRPs may be liable for groundwater injuries and damages, and additional PRPs may be identified in the future. The majority of the groundwater contamination stems from historical waste disposal from Monsanto’s manufacturing activities at the W.G. Krummrich facility. Monsanto is currently represented by its successor, Solutia Inc.
1.2 Coordination with Remedial Investigation/Feasibility Study
This preliminary groundwater injury assessment relies upon existing data, including data that were collected as a part of remedial investigation/feasibility study (RI/FS) reports for the SIC site. As required by the DOI regulations, the assessment is being coordinated with other response actions and investigation activities under CERCLA, the CWA, the Resource Conservation and Recovery Act (RCRA), and other environmental initiatives. The assessment of past, current, and future injuries to groundwater relies upon data and planned remediation activities for areas, facilities, and operable units within the site. IEPA serves as both a Trustee and a coordinating agency for cleanup at the site. The Illinois State Trustees are also working closely with the U.S. EPA, the lead remedial agency at the SIC.
1.3 Assessment Approach
The purpose of the assessment phase is to:
1. Determine whether injuries have occurred [43 CFR § 11.62] 2. Identify the environmental pathways through which injured resources have been exposed
to hazardous substances and/or petroleum products released from the site [43 CFR § 11.63]
3. Quantify the degree and extent (spatial and temporal) of injury in terms of a reduction of the quantity and quality of services from baseline conditions [43 CFR § 11.70]
4. Establish appropriate compensation for those injuries [43 CFR § 11.80].
This Phase 1 groundwater injury assessment report presents (1) injury determination, (2) pathway, and (3) injury quantification data. Injury quantification in this report is limited to

Introduction
Abt Associates 14277 February 15, 2018 | 1-3
the spatial extent of groundwater injury plus a qualitative discussion of the past and future injuries. Subsequent phases of this groundwater assessment are likely to include a quantitative estimate of injury over time, including estimates of the volume of injured groundwater in addition to the spatial extent. Subsequent phases will also include an estimate of the appropriate compensation (damages) to offset the injuries.
1.4 Data Sources
As specified in the Assessment Plan (SIC Natural Resource Trustees, 2013), this assessment of groundwater injuries at the SIC relies entirely on existing data. These data come from primarily from CERCLA RI/FS documents, U.S. EPA RCRA program documents, and IEPA Site Remediation Program (SRP) documents.
Specific sources of groundwater data and analyses include the following:
Final RI/FS for Sauget Area 2 (URS, 2008) Final RI/FS for Sauget Area 1 (GSI, 2012) W.G. Krummrich quarterly groundwater monitoring reports, including data from several
newer wells north of the W.G. Krummrich facility, collected as part of the RCRA activities Other W.G. Krummrich documents that U.S. EPA provided to IEPA, including narrative
emails and water level data A U.S. Geological Survey (USGS) assessment of hydrogeology and water quality data near
the SIC (USGS, 2012) U.S. Army Corps of Engineers (USACE) sampling of well clusters to evaluate potential risk
to workers engaged in constructing relief wells and cutoff trenches (ARDL, 2011, 2015, 2016)
IEPA SRP and other documents describing investigations at specific facilities in and near the SIC, including Clayton Chemical Company, Cerro Flow Products, Moss-American, the ExxonMobil Former Sauget Terminal, and the Phillips 66 Pipeline Company East St. Louis Terminal.
As will be discussed, these documents provide groundwater injury data for most of the extent of the SIC groundwater contamination plume. However, several data gaps exist where no groundwater data have been collected to determine the full extent of the plume. For this Phase 1 injury quantification, we have made reasonable estimates of the extent of the plume in areas where we have no data. Those data gaps will be discussed in this report. The State Trustees may elect to address data gaps with additional groundwater sampling in the future, as specified in the Assessment Plan (SIC Natural Resource Trustees, 2013).
1.5 Report Organization
The remainder of the report is organized as follows.
Chapter 2 describes sources of hazardous substances at the SIC site and adjacent sites Chapter 3 describes pathways by which hazardous substances migrate from source areas to
groundwater Chapter 4 summarizes the spatial and temporal extent of groundwater injuries, based on
existing data References cited in the text are listed at the end of the document.

Sources of Hazardous Substances
Abt Associates 14277 February 15, 2018 | 2-1
2. Sources of Hazardous Substances
The SIC (including sites immediately to the east of the CERCLA areas) comprise several current and former industrial facilities, with numerous landfills and other waste disposal sites. Much of the industrial and waste disposal history of the SIC has been documented as part of RCRA and CERCLA investigations (e.g., U.S. EPA, 2007; URS, 2008; GSI, 2012) and was described in the Assessment Plan (SIC Natural Resource Trustees, 2013). Colten and Samsel (1988) described historical waste disposal of the area. Some of this information is briefly summarized here.
The SIC sites are within the villages of Sauget, Cahokia, and East St. Louis, in St. Clair County, Illinois. As discussed below (Section 2.1), Monsanto began operating a chemical plant in the area in the early 1900s. The Village of Sauget was originally incorporated as the Village of Monsanto in 1926 and was one of several entities in the area incorporated by and for a particular industry. As noted in Colten and Samsel (1988, p. 24), “Because many manufacturers were located in towns with a negligible base of opposition, they were essentially exempt from any nuisance laws and were thus free to operate without any restrictions on noxious odors or objectionable wastes. Such freedoms both attracted nuisance-causing industries to the east side and encouraged them to remain.”
In 1932, after the incorporation of the Village of Monsanto, the village connected the Monsanto plant to a sewer system that discharged directly to the Mississippi River. This direct discharge of untreated liquid industrial waste continued for over 30 years, until a treatment plant was constructed in 1966 (Colten and Samsel, 1988).
According to Monsanto’s facility plans from the 1940s, solid industrial wastes and some liquid wastes were placed in “toxic dumps” and a phenol residue dump (Colten and Samsel, 1988). Additionally, some industrial wastes in the Village of Monsanto were discharged directly into Dead Creek. In the early 1940s, despite residents along Dead Creek winning a $4,000 nuisance judgment against industries dumping into the creek, a Sanitary Water Board report concluded that “even though industrial wastes would have a slight odor, their discharge to the ditch would be beneficial since the great volume would flush settled solids into the Mississippi” (Colten and Samsel, 1988, p. 43).
Eventually, the toxic wastes released in the Sauget area became the target of remediation. The SIC and adjacent sites include Sauget Area 1, Sauget Area 2, Monsanto’s W.G. Krummrich and former Chemical Warfare Service (CWS) area plants, the Clayton Chemical Site, Cerro Flow Products, and numerous other facilities (Figure 2.1). Sauget Areas 1 and 2 comprise numerous landfills that received industrial waste from dozens of facilities both within and outside of the SIC. Sauget Areas 1 and 2 were proposed for listing on the U.S. EPA National Priorities List (NPL) in 2001, but neither site was officially listed.
This chapter includes brief site histories and hazardous substance release data from some of the facilities in the SIC, as well as the landfills within Sauget Areas 1 and 2. This groundwater investigation includes a discussion of petroleum and hazardous substance releases both within and adjacent to the SIC, including facilities that were not previously discussed in the Preassessment Screen and Assessment Plan (SIC Natural Resource Trustees, 2009, 2013). It covers the majority of hazardous substance source areas in the SIC area, but it is not a comprehensive discussion of all facilities and waste areas that contribute hazardous substances to SIC groundwater.

Sources of Hazardous Substances
Abt Associates 14277 February 15, 2018 | 2-2
Figure 2.1. Facilities and disposal sites in the SIC and adjacent areas.

Sources of Hazardous Substances
Abt Associates 14277 February 15, 2018 | 2-3
2.1 Monsanto/W.G. Krummrich 2.1.1 Site History
The W.G. Krummrich facility at 500 Monsanto Ave. in Sauget has been a chemical manufacturing site since 1907, when a commercial acid manufacturing facility started operations. Monsanto purchased the Commercial Acids Company in 1917 and renamed the site Plant B. By the 1930s, Monsanto had added numerous chemicals to the product line, including chlorine, chlorobenzene, chlorophenol, benzyl chloride, and polychlorinated biphenyls (PCBs) under the trade name Aroclor. In 1932, the Village of Monsanto installed sewer lines, and the Plant B process sewers were connected to the village system that discharged directly to the Mississippi River without treatment (Colten and Samsel, 1988; Solutia, 2000).
In the 1940s, Plant B manufactured chemicals for the war effort. Monsanto also built and operated the “North Plant” on a 22-acre U.S. Army CWS site north of the current W.G. Krummrich boundary (Figure 2.1). At their plant on the CWS property, Monsanto manufactured various organic chloramine compounds that protected soldiers from chemical agents such as sulfur mustard and Lewisite. These included products such as Impregnite I (or CC-2), which was incorporated into military clothing; and Dichloramine-T (DAT) and S-330, which were neutralizing ointments. Between 1942 and 1945, production at the CWS site included approximately 10,850,000 lbs of CC-2, over 755,000 lbs of DAT, and roughly 900,000 lbs of S-330 (TCT-St. Louis, 1994).
After the war, the Army no longer needed the CWS for Impregnite and S-330, and it leased the “North Plant” site to Monsanto. From 1946 through the 1950s, Monsanto manufactured insecticides, herbicides, pharmaceuticals, and petroleum product additives at the CWS site. Former employees stated that Monsanto manufactured Agent Orange (2,4-D/2,4,5-T), dichlorodiphenyl-trichloroethane (DDT), and a triple-chlorinated benzyl chloride product used in tear gas (TCT-St. Louis, 1994). Across the street at Plant B (renamed W.G. Krummrich in 1951 to honor a plant manager), Monsanto added more chemical product lines through the 1950s and 1960s. In 1960, Monsanto expanded the “North Plant” after purchasing the site from the Army. Also in about 1960, Monsanto constructed a terminal on the Mississippi River. Several pipeline racks transferred liquid products such as benzene, toluene, chlorobenzene, and sulfuric acid to the terminal on the river (Solutia, 2000). In 1964, the village name changed from Monsanto, the prominent company in the village, to Sauget, the prominent family in the village (Solutia, 2000).
In 1970, Monsanto sold the former CWS property to Edwin-Cooper, a petroleum additive manufacturer. Ethyl Corporation acquired Edwin-Cooper in 1975 and has since operated at the CWS site as Ethyl Corporation, Ethyl Petroleum Additives, and now Afton Chemical (TCT-St. Louis, 1994; Afton Chemical, 2017).
The product lines at W.G. Krummrich changed starting in the 1970s. Monsanto ceased operations of the Phenol Department in 1970. PCB production was falling through the 1970s, although total production in Sauget was still about 40 million pounds in 1974. Monsanto subsequently ended and dismantled PCB manufacturing in 1977, as well as butyl benzyl chloride manufacturing in 1981, and chlorine manufacturing in the mid-1980s. Also in the 1980s, the terminal along the river ceased operations. Additional product lines shut down in the 1990s. In 2000, the active plant area covered 131 acres of the 314-acre property (ATSDR, 2000; Solutia, 2000).
Sources of Hazardous Substances
Abt Associates 14277 February 15, 2018 | 2-4
Prior to 1997, Monsanto operated a chemicals business, a pharmaceuticals business, and an agricultural business. In 1997, Monsanto spun off the chemicals business to form Solutia, and the W.G. Krummrich plant became part of Solutia. In 2000, the pharmaceuticals business became Pharmacia Corporation, which became a wholly owned subsidiary of Pfizer in 2003 and a limited liability company (Pharmacia LLC) in 2012. The agricultural products business became a new company that retained the Monsanto name (Monsanto Ag Company, which later became just Monsanto Company). Solutia filed for bankruptcy in 2003, reorganized, and emerged in 2008. In 2012, Solutia became a wholly owned subsidiary of Eastman Chemical Corporation. The environmental liabilities of the chemical business of the original (pre-1997) Monsanto are shared among the successor companies (Monsanto, 2017). Solutia manages environmental response activities at W.G. Krummrich.
2.1.2 Hazardous Substance Releases
Many of the products that were manufactured at W.G. Krummrich contained benzene and chlorinated compounds such as chlorobenzene. Waste products from the W.G. Krummrich plant were disposed of onsite and in landfills within the SIC. Benzene and chlorobenzene releases from Monsanto operations are responsible for the vast majority of hazardous substances in Sauget area groundwater.
The RCRA facility assessment in 1992 identified 81 solid waste management units (SWMUs) and 20 areas of concerns (AOCs) on the W.G. Krummrich property. The 1996 RCRA permit included 33 SWMUs that required corrective action, including 4 hazardous waste management units (Solutia, 2000).
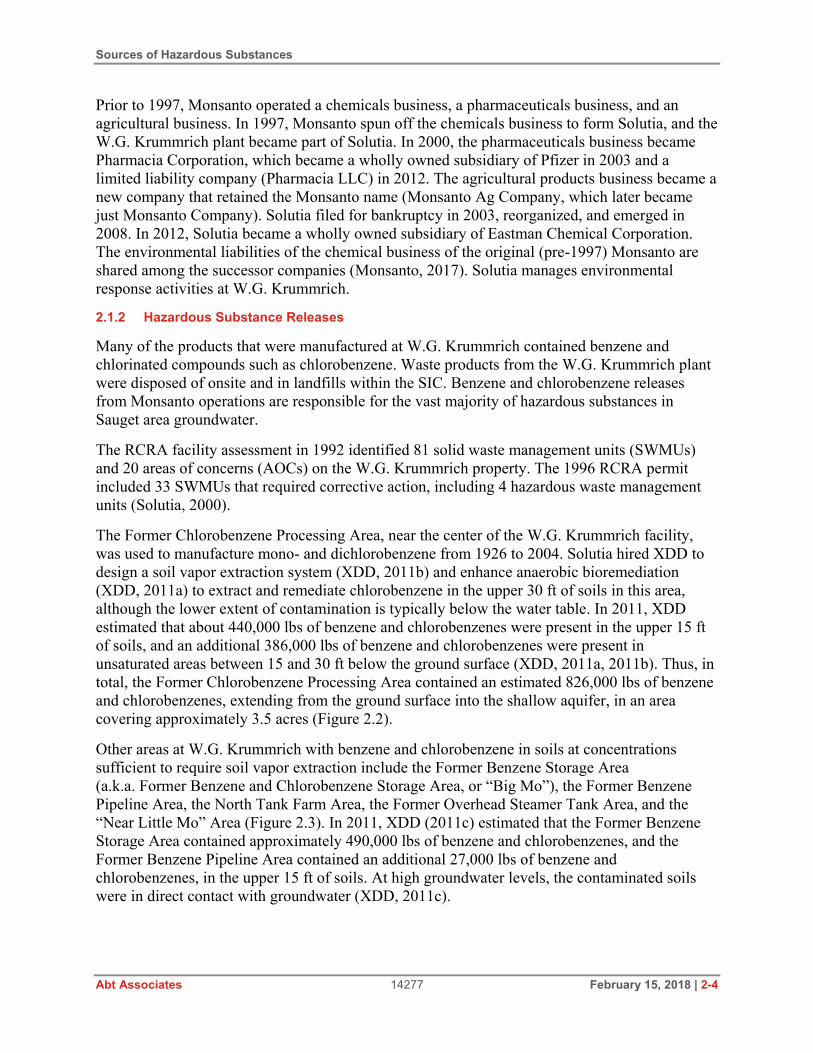
The Former Chlorobenzene Processing Area, near the center of the W.G. Krummrich facility, was used to manufacture mono- and dichlorobenzene from 1926 to 2004. Solutia hired XDD to design a soil vapor extraction system (XDD, 2011b) and enhance anaerobic bioremediation (XDD, 2011a) to extract and remediate chlorobenzene in the upper 30 ft of soils in this area, although the lower extent of contamination is typically below the water table. In 2011, XDD estimated that about 440,000 lbs of benzene and chlorobenzenes were present in the upper 15 ft of soils, and an additional 386,000 lbs of benzene and chlorobenzenes were present in unsaturated areas between 15 and 30 ft below the ground surface (XDD, 2011a, 2011b). Thus, in total, the Former Chlorobenzene Processing Area contained an estimated 826,000 lbs of benzene and chlorobenzenes, extending from the ground surface into the shallow aquifer, in an area covering approximately 3.5 acres (Figure 2.2).
Other areas at W.G. Krummrich with benzene and chlorobenzene in soils at concentrations sufficient to require soil vapor extraction include the Former Benzene Storage Area (a.k.a. Former Benzene and Chlorobenzene Storage Area, or “Big Mo”), the Former Benzene Pipeline Area, the North Tank Farm Area, the Former Overhead Steamer Tank Area, and the “Near Little Mo” Area (Figure 2.3). In 2011, XDD (2011c) estimated that the Former Benzene Storage Area contained approximately 490,000 lbs of benzene and chlorobenzenes, and the Former Benzene Pipeline Area contained an additional 27,000 lbs of benzene and chlorobenzenes, in the upper 15 ft of soils. At high groundwater levels, the contaminated soils were in direct contact with groundwater (XDD, 2011c).
Sources of Hazardous Substances
Abt Associates 14277 February 15, 2018 | 2-5
Figure 2.2. Area with elevated benzene and chlorobenzene between 15 and 30 ft below ground in the Former Chlorobenzene Processing Area at W.G. Krummrich. The area of elevated contaminant concentrations in the 0–15 ft interval looks similar (XDD, 2011b).
Source: XDD, 2011a, Figure ES-1.

Sources of Hazardous Substances
Abt Associates 14277 February 15, 2018 | 2-6
Figure 2.3. Areas at W.G. Krummrich containing soil benzene and chlorobenzene concentrations sufficient to require soil vapor extraction remediation.
Source: XDD, 2011c, Figure 1.

Sources of Hazardous Substances
Abt Associates 14277 February 15, 2018 | 2-7
With an estimated 1.3 million lbs of benzene and chlorobenzenes in soils as of 2011 (XDD, 2011a, 2011b, 2011c), the Former Chlorobenzene Processing Area and the Former Benzene and Chlorobenzene Storage Area are two of the largest contaminant sources to SIC groundwater.
2.2 Clayton Chemical 2.2.1 Site History
The Clayton Chemical facility covers 7.3 acres at 1 Mobile Ave. in Sauget (Figure 2.1). The site was a railroad repair yard from 1930 to 1962. In 1962, the site hosted a crude oil separator that produced white gas and fuel oils. Clayton Chemicals then operated a solvent reclamation facility from the mid-1960s to 1978. Trade Waste Incineration then operated a hazardous waste incinerator at the site from 1980 to 1983. Clayton Chemicals subsequently restarted the solvent reclamation plant, operating from 1983 to 1998. Emerald Environmental purchased Clayton Chemical in 1993 and changed the name to Resource Recovery Group (RRG). In 1998, IEPA denied an operating permit to RRG/Clayton Chemical, and reclamation operations ceased thereafter (URS, 2004; U.S. EPA, 2017).
2.2.2 Hazardous Substance Releases
When the site operated as a crude oil separator, residual tank bottoms (which typically contain mixtures of petroleum products) and white gas were dumped on the ground and in pits onsite (Clayton Chemical, 1984; URS, 2004). These pits were unlined and therefore provided (and may continue to provide) a continuous source of contaminants to groundwater.
From approximately 1962 to 1973, Clayton Chemical sent residual solvent sludges (“wet still bottoms”) to the Sauget Landfill (now Site Q in the Sauget Area 2 CERCLA site – see Section 2.8). In 1973, at the request of Clayton Chemical employees, Mayor Paul Sauget sent a crew to dig three pits south of Clayton Chemical (in the area now known as Site S in Sauget Area 2 – see Section 2.8). Clayton Chemical filled the first pit with approximately 35,000 gallons of solvent sludge and filled the second pit with approximately 150,000 gallons of solvent sludge. The third pit had the capacity to hold 860,000 gallons of sludge; the amount disposed in the third pit is unknown (Haney, 1986). None of these pits were permitted, and none were lined. This surface disposal of solvent and other petroleum waste products likely has been a continuous source of contaminants to SIC groundwater.
2.3 Cerro Flow Products 2.3.1 Site History
Cerro Flow Products has operated a 61-acre copper tubing manufacturing facility at 3000 Mississippi Ave. in Sauget (Figure 2.1) since the 1920s. Lewin Metals originally constructed an electrolytic copper plant at the site in 1927. In 1957, Lewin became part of Cerro de Pasco Corporation, and a new plant was constructed at the site. The facility operated as Cerro Copper, which became part of the Marmon Group in 1975 but continued to operate as Cerro Copper. In 2004, multiple companies were consolidated to form Cerro Flow Products, the current operator at the site (Chachakis, 2001; Cerro Flow, 2017).

Sources of Hazardous Substances
Abt Associates 14277 February 15, 2018 | 2-8
2.3.2 Hazardous Substance Releases
According to Solutia (2000), Cerro Flow Products historically discharged their wastewater to Dead Creek, which flowed through the site property. Cerro Flow Products conducted a site investigation in the 1980s and subsequently removed 27,000 tons of sediment from Dead Creek (Segment A) in 1990 and 1991. Numerous hazardous substances were detected in Dead Creek sediments including 16 metals; 13 volatile organic compounds (VOCs), including benzene; and 19 semivolatile organic compounds (SVOCs), including polycyclic aromatic hydrocarbons (PAHs; Solutia, 2000).
Site I in Sauget Area 1 is on the Cerro Flow Products property. This landfill apparently received waste from many different sources (see the Sauget Area 1 discussion in Section 2.7).
2.4 Phillips Petroleum 2.4.1 Site History
The Phillips 66 Pipe Line Company East St. Louis Terminal (a.k.a. Phillips Petroleum) is a bulk fuel storage and transfer facility at 3300 Mississippi Ave. in the Village of Cahokia. It lies east of Site Q South and north of Borrow Pit Lake, within the boundaries of Sauget Area 2 (Figure 2.1).
According to Terracon (1999), the terminal has operated since 1930. In 1999, it had 58 above ground petroleum storage tanks with a total capacity of 2,309,235 barrels (about 97 million gallons). Petroleum products stored onsite included unleaded gasoline, premium unleaded gasoline, No. 2 low-sulfur distillate, No. 2 high-sulfur distillate, overhead gasoline, 100 aviation fuel, K-1 (kerosene), butane, propane, oil mix, sulfur distillate, and ethanol. Petroleum was brought into the facility via pipeline, rail tankers, and trailer trucks; and products were shipped from the facility via tank trucks and pipelines (Terracon, 1999).
IEPA Compliance Evaluation Inspection reports indicate that Phillips Petroleum took many tanks out of service after 1999. Phillips Petroleum had only 31 tanks in use in 2006 (Cahnovsky, 2006) and 17 tanks in use in 2012 (Vieregge, 2012). The pads for some of the decommissioned tanks are still evident.
The Phillips Petroleum site includes two separate areas (Figure 2.4). The northeastern parcel on Mississippi Ave. (Highway 3) appears to contain an administration building and a petroleum loading and unloading rack for tanker trucks. The southwestern parcel appears to be primarily petroleum storage tanks. The two areas combined cover approximately 250 acres.
For many years, the Phillips Pipe Line Company owned the site. In 2002, Phillips Petroleum merged with Conoco, and the company name became ConocoPhillips. In 2012, ConocoPhillips split the upstream (exploration) and downstream (production) businesses. The downstream company became Phillips 66, according to the company website (Phillips 66, 2017). The site is now called the Phillips 66 Pipe Line Company East St. Louis Terminal. For simplicity, we call the site Phillips Petroleum, consistent with the name in the Sauget Area 2 RI/FS (URS, 2008).

Sources of Hazardous Substances
Abt Associates 14277 February 15, 2018 | 2-9
Figure 2.4. Areas at Phillips Petroleum where air sparging and soil vapor extraction are or have been used to address subsurface petroleum releases. The western area is the original “Phase 1” system, and the smaller eastern area is the “Phase 2” system.
Source: Modified from GHD, 2016, Figure 2. Red boxes added.

Sources of Hazardous Substances
Abt Associates 14277 February 15, 2018 | 2-10
2.4.2 Hazardous Substance Releases
For this Phase 1 groundwater report, we had limited information on the nature and extent of petroleum and methyl tertiary-butyl ether (MTBE) releases at Phillips Petroleum. The site entered the IEPA SRP in 1999, following a 1,595-bbl kerosene spill in 1998. In response to this spill, Phillips Petroleum installed five new shallow monitoring wells and six “deep” monitoring wells, although the deep wells at this site were screened at 25–40 ft below ground surface (bgs), which likely places them barely below the shallow aquifer (see Chapter 3). IEPA personnel noted that these new wells supplemented an existing network of 16 monitoring wells and 42 piezometers installed at the site in 1993–1994 (Cummings, 2004). For this report, we did not have any data from the site that pre-dated the 1998 spill.
According to IEPA personnel (Cummings, 2004), Phillips Petroleum installed an air sparging and soil vapor extraction system after an investigation of historical releases that occurred after the kerosene spill. However, a recent report from a Phillips Petroleum contractor states that this system started operating in October 1997 (GHD, 2016). If that is correct, the system was operating before the spill occurred, which indicates that earlier releases were sufficient to require remediation.
The air sparging and soil vapor extraction system was constructed along the southwestern side of the tank farm area (Figure 2.4). The system apparently operated from 1997 to 2004. Despite the continued presence of hydrocarbons, Phillips Petroleum decommissioned the system because of operational difficulties (GHD, 2016). GHD (2016) refers to this old system as the Phase 1 Area system.
The Phase 2 Area system also uses soil vapor extraction, surrounding a small area called the Control Room (smaller red box in Figure 2.4). From January 2014 to June 2016, GHD (2016) estimated that the system extracted and treated 1,783 lbs of hydrocarbons from the subsurface.
As will be discussed in Chapter 4, the groundwater underlying Phillips Petroleum contains elevated concentrations of several VOCs (including benzene) and SVOCs. In addition, MTBE is commingled with petroleum in the groundwater throughout much of the site (GHD, 2016). Some of the petroleum and MTBE in groundwater occurs at the northeastern corner of the site, which suggests a separate source upgradient of Phillips. Other areas with high MTBE concentrations in groundwater (see Chapter 4) suggest that MTBE was released at the site as well.
2.5 Moss-American 2.5.1 Site History
The Moss-American facility covers approximately 60 acres east of W.G. Krummrich and Sauget Area 1 (Figure 2.1). The T.J. Moss Tie Company treated wood with creosote and pentachlorophenol from 1927 until 1965, when T.J. Moss merged with the American Creosoting Company to form Moss-American, Inc. The products generated at the site included milled and treated railroad wood products (including cross ties and switch ties), fence posts, lumber, utility poles, and construction pilings (ERT, 1986; Philip Services, 1998).
Moss-American closed operations in 1969. In 1973, Moss-American sold 40.1 acres of the site to Lefton Iron and Metal Company, retaining the remaining 19.5 acres. In 1974, Moss-American merged with Kerr McGee Chemical Corporation (KMCC). Neither Lefton Iron and Metal nor

Sources of Hazardous Substances
Abt Associates 14277 February 15, 2018 | 2-11
Moss-American/KMCC conducted additional industrial activities at the site after 1969 (ERT, 1986; Philip Services, 1998).
2.5.2 Hazardous Substance Releases
Moss-American/KMCC released hazardous substances related to wood-treating operations, resulting in contaminated soils, groundwater, and ponds at the site. Contaminants found during RI activities in the early 1990s included benzene, toluene, ethylbenzene, and xylenes (BTEX); phenol and pentachlorophenol; total cresols; and naphthalene and other PAHs. Free petroleum product was encountered in four shallow monitoring wells adjacent to the ponds, process, and drip track areas, and 2–3 ft of free product was observed above the top of the bedrock in the deep monitoring wells adjacent to the north pond and process area (Burlington, 1995).
2.6 Former Sauget Terminal 2.6.1 Site History
The Former Sauget Terminal is located to the east of the SIC within the Village of Sauget (Figure 2.1), although the mailing address is East St. Louis. The facility comprises four separate parcels: the East Tank Farm (115 acres), the West Tank Farm (26 acres), and the North Tank Farm and Process Block (42 acres combined). The North Tank Farm and Process Block were part of a historical petroleum refinery that operated from 1917 to 1973. The tank farms were used for bulk storage of petroleum products, including gasoline, diesel, kerosene, heating oil, and crude oil, until the facility closed in 1993 (Amec Foster Wheeler, 2014, 2016a, 2016b). Mobil Oil operated the refinery and terminal until it closed; the owner of the facility became ExxonMobil in 1999 after the merger of Exxon and Mobil.
According to Solutia (2000), the refinery at the Process Block reached a maximum capacity of 55,000 bbls per day in 1961, while also producing up to 13,000 tons of coke per month. After the refinery shut down, Mobil expanded the Sauget Terminal operations. Prior to shutting down in 1993, “the Sauget Terminal operated a barge dock that transported product from Joliet to Sauget, handled 200,000,000 gallons of #1 and #2 fuel oil and gasoline for several petroleum companies and ultimately generated 100 to 1,000 kilograms per month of hazardous wastes” (Solutia, 2000, p. 3-7).
The East Tank Farm, which contained 11 above ground storage tanks (ASTs) and 2 underground storage tanks (USTs), entered the IEPA SRP in 2007 (Amec Foster Wheeler, 2016a). All tanks and infrastructure were removed by 2012.
The West Tank Farm contained 17 ASTs for bulk fuel storage. All ASTs and other infrastructure were removed by 1988. The West Tank Farm entered the SRP in 2009 (Amec Foster Wheeler, 2014).
The Process Block and North Tank Farm entered the SRP in 2013. The Process Block included four USTs that were removed in 1994 (Amec Foster Wheeler, 2016b).
2.6.2 Hazardous Substance Releases
Various spills and leaks at the Former Sauget Terminal resulted in petroleum product discharges that contaminated underlying groundwater. All of the tank farms have had leaking underground storage tank (LUST) incidents (Amec Foster Wheeler, 2014, 2016a, 2016b).

Sources of Hazardous Substances
Abt Associates 14277 February 15, 2018 | 2-12
Soils and groundwater within the three tank farms and the Process Block are contaminated with petroleum hydrocarbons. Most of the soil samples collected from the North Tank Farm and Process Block contained elevated BTEX concentrations (Figure 2.5), confirming widespread releases of petroleum products (Amec Foster Wheeler, 2016b). Similarly, in the East Tank Farm, Amec Foster Wheeler (2016a) collected nearly 50 soil samples that contained elevated BTEX and/or PAHs, at depths ranging from near the surface to 20 ft below the surface.
Solutia (2000) cites several operations at the refinery that resulted in hazardous substance releases to soils and groundwater, including numerous waste piles, petroleum sludge deposited in ponds or lagoons, and tank bottoms deposited in trenches. An investigation of the North Tank Farm in 1981 concluded that past spills and buried sludges had resulted in contaminated groundwater (Solutia, 2000).
As will be discussed in subsequent chapters, light non-aqueous phase liquids (LNAPLs) are present above the groundwater in many wells in the Process Block/North Tank Farm, and many others wells that did not contain free product above the groundwater contained dissolved BTEX and PAHs in the groundwater (Amec Foster Wheeler, 2016b). Benzene concentrations are also elevated in groundwater under the East Tank Farm (Amec Foster Wheeler, 2016a). BTEX and PAHs are elevated in groundwater, and several wells contain measurable LNAPLs, under the West Tank Farm (Amec Foster Wheeler, 2014; IEPA, 2015).
2.7 Sauget Area 1
Sauget Area 1 comprises Dead Creek as well as Sites G, H, I, L, M, and N (Figure 2.6). Industrial waste buried in some of the landfills have served as sources of hazardous substances to SIC groundwater.
The Area 1 RI/FS (GSI, 2012) contains a detailed summary of the site history and contamination in each of the waste areas. The SIC Assessment Plan (SIC Natural Resource Trustees, 2013) includes a site history and a table of hazardous substances found in each area. This section briefly summarizes Sauget Area 1 information. Each of these sites in Area 1 may be or may have been a source of hazardous substances to groundwater. As will be discussed in Chapter 4, existing data clearly show some sites as sources, while groundwater data from other sites are less clear or currently nonexistent.
2.7.1 Site G
According to GSI (2012), Site G (including Site G West – see Figure 2.6) was an active landfill from about 1940 to 1966, and received additional waste intermittently until 1982. Site G covers approximately 3.3 acres. Prior to removal actions, the site contained approximately 60,000 cubic yards of waste, including oil pits located on the east side of Site G, buried drums containing wastes (including pyrophoric materials), paper wastes, and laboratory equipment waste. Some of these wastes spontaneously combusted in 1994. U.S. EPA conducted a removal action to address the most contaminated areas in 1995 (GSI, 2012).

Sources of Hazardous Substances
Abt Associates 14277 February 15, 2018 | 2-13
Figure 2.5. Soil samples from the North Tank Farm and Process Block with elevated BTEX concentrations. Each sample location with a grey callout box is a location where BTEX concentrations exceeded a regulatory threshold.
Source: Amec Foster Wheeler, 2016b, Figure 4.

Sources of Hazardous Substances
Abt Associates 14277 February 15, 2018 | 2-14
Figure 2.6. Waste disposal areas in Sauget Area 1. Note that north is to the left in this orientation.
Source: GSI, 2012, Figure 1-3.

Sources of Hazardous Substances
Abt Associates 14277 February 15, 2018 | 2-15
2.7.2 Site H
Site H covers approximately 4.9 acres; the town line between Sauget and Cahokia runs through the middle of the site (Figure 2.6). Site H and Site I were apparently the same landfill, until a road bisected the site in the 1940s. Site H received industrial wastes from approximately 1931 to 1957. Wastes included solvents, PCBs, para-nitroaniline, chlorine, phosphorous pentasulfide, and hydrofluosilic acid. The estimated volume of waste in Site H prior to any response actions was 110,000 cubic yards (GSI, 2012).
2.7.3 Site I
Site I includes Site I North and Site I South (Figure 2.6). Site I is on the Cerro Flow Products property. In total, Site I covers approximately 14.7 acres; of this, Site I South covers about 8.8 acres. Together with Site H, it received industrial wastes from 1931 to 1957, when the two sites together were known as the “Sauget-Monsanto Landfill.” According to GSI (2012), workers who excavated materials from Site I to install a pole required hospitalization, suggesting the presence of VOCs and/or SVOCs. Prior to any response action, the estimated volume of waste in Site I South was 250,000 cubic yards (GSI, 2012).
2.7.4 Other Sites
Other sites in Sauget Area 1 are less likely to be substantial sources of hazardous substances to groundwater.
Site L received wastewater from a truck cleaning operation between 1971 and 1981. The wastewater impoundment covered 7,600 square ft (0.17 acres). The volume of contamination prior to response actions is not known (GSI, 2012). Site M is a former borrow pit from the 1940s that became an impoundment on Dead Creek. It contained an estimated 3,600 cubic yards of contaminated Dead Creek sediment prior to a removal action that was completed in 2001 (GSI, 2012).
Site N is also a former borrow pit from the 1940s, covering about four acres (Figure 2.6). It was used for disposal of concrete rubble and demolition debris, with some drum waste, painting wastes, and/or chemical wastes. The volume of contamination is not known, but fill was estimated to be as much as 30-ft deep prior to any removal actions (GSI, 2012).
Dead Creek is the surface drainage for many of these facilities and landfills. According to Solutia (2000, p. 3-3), “Historically, Dead Creek served as an industrial drainage ditch and received point and non-point discharges from adjacent properties.” Cerro Copper (now Cerro Flow Products) removed 27,500 tons of contaminated sediment from the upper segment (Segment A) and filled in the channel in 1990. Solutia removed 58,400 cubic yards of contaminated sediment from the lower segments between 2001 and 2006 (GSI, 2012).
2.8 Sauget Area 2
Sauget Area 2 includes multiple waste areas (Sites O, P, Q, R, and S) and a groundwater “plume discharge area” to the Mississippi River near Site R (Figure 2.1). In the RI/FS, URS (2008) identified widespread areas within Area 2 where industrial waste was buried (Figure 2.7).

Sources of Hazardous Substances
Abt Associates 14277 February 15, 2018| 2-16
Figure 2.7. Areas with buried industrial waste (shaded) in Sauget Area 2. Note that north is to the left in this orientation.
Source: URS, 2008, Figure ES-1.

Sources of Hazardous Substances
Abt Associates 14277 February 15, 2018 | 2-17
The Area 2 RI/FS (URS, 2008) contains a detailed summary of the site history and contamination in each of the waste areas. The SIC Assessment Plan (SIC Natural Resource Trustees, 2013) includes a site history and a table of hazardous substances found in each area. This section briefly summarizes the information from these sources. Each of these sites in Area 2 may be or may have been a source of hazardous substances to groundwater. As will be discussed in Chapter 4, existing data clearly show some sites as sources, while groundwater data from other sites are less clear or currently nonexistent.
2.8.1 Site O
Site O comprises four former sludge lagoons that were part of the former Sauget Wastewater Treatment Plant (WWTP). Site O covers approximately 28 acres west of W.G. Krummrich’s Lot F (Figure 2.7). The unlined lagoons were used from 1966 to 1978 to dry sludge from the Sauget WWTP. During that time, the WWTP treated approximately 10 million gallons per day of industrial wastewater from local industries. Soil samples from Site O and groundwater under Site O contain highly elevated concentrations of VOCs, PAHs, chlorobenzene, metals, and other contaminants (URS, 2008).
2.8.2 Site P
Site P is northwest of W.G. Krummrich, in a 32-acre triangular lot that extends into East St. Louis (Figure 2.7). Site P is a former landfill that received waste from W.G. Krummrich and Edwin Cooper (a former manufacturer of organic chemicals such as petroleum additives) from approximately 1973 to 1984. Soil samples from Site P contain elevated concentrations of VOCs, chlorobenzene and other SVOCs, and metals. Much of Site P is covered, including a 3-acre area covered with asphalt and a nightclub (URS, 2008).
2.8.3 Site Q
Site Q comprises multiple landfills, fly ash impoundments from Union Electric Co., and other dumping sites. It is the largest of the alphabetical sites in Sauget Areas 1 and 2, covering about 206 acres. For management purposes, the site is divided into sections: Site Q South (87 acres, including 13 acres of ponds), Site Q Central (67 acres), and Site Q North (52 acres). The extension of Site Q North along the eastern boundary of Site R (Figure 2.7) is called Site Q Dogleg.
Site Q North/Dogleg and Site Q Central were historically the “Sauget Municipal Landfill” (the village did not operate the site; the landfill operator was a private firm called Sauget & Company). This landfill received a wide variety of wastes from the 1950s to the 1970s, including industrial, commercial, and municipal wastes; septic tank pumpings; drums; organic and inorganic wastes; solvents; pesticides; paint sludges; and construction and demolition debris. Most disposal was in Site Q North until the early 1970s, when the landfill expanded southward into Site Q Central (URS, 2008).
From 1952 to 1974, fly ash and other waste from coal combustion at the Union Electric Cahokia power plant were piped to impoundments in Site Q North and Site Q Central (URS, 2008).
As noted in the RI/FS (URS, 2008), chemical wastes, including drums and hazardous wastes, were discarded in the Sauget Municipal Landfill without appropriate approval. In the 1970s, Sauget & Company received several citations for open burning, disposal of liquid wastes, and capping with cinders and other inappropriate materials. At least two underground fires burned for

Sources of Hazardous Substances
Abt Associates 14277 February 15, 2018 | 2-18
multiple weeks despite repeated attempts to extinguish them. Numerous areas with 55-gallon drums of toxic waste have been identified in the landfill. Clayton Chemical reportedly disposed of 655,200 gallons of solvent waste in this landfill (URS, 2008).
Site Q South was a separate landfill, known as the Cahokia or Milam Landfill (or “Old Milam”). The operating landfill area covered approximately 7.5 acres. The 13 acres of ponds were former borrow pits that were subsequently filled with waste. Site investigations have revealed other areas of waste dumping in the northern part of Site Q South; these may have been the result of the Sauget Municipal Landfill extending beyond its permitted borders. Barrels of toxic waste were buried in Site Q South (URS, 2008).
Several removal actions occurred in Site Q Central and South between 1995 and 2000. U.S. EPA removed 3,271 drums and over 17,000 tons of PCB-contaminated soils and waste from Site Q South (URS, 2008). Soils and groundwater in Site Q are highly contaminated with BTEX, chlorobenzenes, PCBs, and metals (URS, 2008).
2.8.4 Site R
The landfill at Site R (Figure 2.7) was historically called the “Sauget Toxic Dump,” “Monsanto Landfill,” and “River’s Edge Landfill.” From 1957 to 1977, Site R received industrial and chemical waste from W.G. Krummrich and Monsanto/Pharmacia’s Queeny plant. Wastes included phenols, chlorinated aromatic hydrocarbons, carboxylic acids, solvents, pesticides, heavy metals, and various other organic and inorganic wastes. The Queeny plant disposed of 178,000 cubic ft and the W.G. Krummrich plant disposed of 7.8 million cubic ft of waste in Site R. Samples from Site R contain high concentrations of chlorobenzenes, chlorophenols, PCBs, metals, and dioxins (URS, 2008).
In the early 1980s, IEPA discovered contaminated leachate seeping from Site R into the Mississippi River. Illinois sued Monsanto seeking an injunction to stop releasing contaminants into the river. Twenty years later, U.S. EPA issued a Record of Decision for an interim groundwater remedy at the site. Completed in 2004, the Groundwater Migration Control System (GMCS) was constructed between Site R and the Mississippi River. This system includes a slurry wall extending to bedrock to inhibit groundwater migration, plus pumping wells to draw contaminated groundwater into the capture zone. The pumped groundwater is sent to the American Bottoms water treatment plant for decontamination and disposal (URS, 2008).
2.8.5 Site S
Site S includes part of the illegal solvent sludge waste pits that Mayor Sauget’s crew dug and Clayton Chemical used in the 1970s (see Section 2.2). The area of Site S is less than one acre and primarily covers the largest of the three waste pits (Pit #3). As discussed previously, the capacity of Pit #3 was 860,000 gallons, but the actual volume of waste deposited in Pit #3 is not known. Photographs from 1974 showed about 200 drums in the pit, in addition to liquid wastes. Soil samples contained highly elevated concentrations of VOCs (including BTEX), SVOCs, pesticides, PCBs, and metals (URS, 2008).
2.9 Summary
The SIC and adjacent properties to the east have been highly industrialized for decades. Common waste disposal practices of the past included dumping and burying toxic waste in

Sources of Hazardous Substances
Abt Associates 14277 February 15, 2018 | 2-19
unlined waste pits or landfarming the waste on the ground surface. This has resulted in many sources of hazardous substances to SIC groundwater.
While this chapter presents a brief summary of many of the sources of hazardous substances to SIC groundwater, it is not meant to serve as a comprehensive analysis of all hazardous substance sources in the area. The facilities discussed previously are some of the more prominent industries with known waste streams in the SIC. Over the years, the SIC has hosted dozens of facilities across a broad array of industries; each of these facilities may have released hazardous substances on site and/or contributed to hazardous substances that were buried in SIC landfills.

Groundwater Resources and Pathways
Abt Associates 14277 February 15, 2018 | 3-1
3. Groundwater Resources and Pathways
In the DOI regulations, groundwater is defined as water in a saturated zone or stratum beneath the surface of land or water, and the rocks or sediments through which groundwater moves. It includes groundwater resources that meet the definition of drinking water supplies [43 CFR § 11.14(t)]. A pathway is the route or medium through which…a hazardous substance is or was transported from the source of the discharge or release to the injured resource [43 CFR § 11.14(dd)]. The Trustees previously published a report that discusses the pathways by which hazardous substances released at the SIC site have reached terrestrial and aquatic natural resources (Lewis and Arthur, 2016).
This chapter describes the pathways by which hazardous substances reach groundwater from source areas. It then describes the affected groundwater resources, and discusses the flow paths within groundwater that have transported hazardous substances from the source areas to cover a broad aquifer area within the SIC.
3.1 Pathways to Groundwater
As described in the previous chapter, hazardous substances were spilled, deposited, or landfilled in numerous locations in the SIC. In some cases, liquid chemical wastes were deposited in pits that were in direct contact with underlying groundwater. In other cases, wastes were deposited near the ground surface and infiltrated or percolated through the vadose zone to the water table.
Some of the hazardous substances released in the SIC are non-aqueous phase liquids (NAPLs). LNAPLs are less dense than water and tend to accumulate on the groundwater table. Dense non-aqueous phase liquids (DNAPLs) are denser than water and tend to sink through the aquifer, accumulating on low permeability layers. These NAPL sources are present in many areas of the SIC and provide a long-term source of contaminants to groundwater. Figure 3.1 provides a URS (2008) conceptual site model for the transport of hazardous substances from disposal areas through the vadose zone and into groundwater.
In addition to these subsurface pathways, hazardous substances were also transported by runoff to surface water drainages such as Dead Creek. This contaminated surface water may have infiltrated into the groundwater.
3.2 American Bottoms Aquifer
The SIC lies within the American Bottoms floodplain of the Mississippi River. The floodplain comprises glacial outwash overlain with deposits of sand, silt, and clay from the Mississippi River. The uppermost stratigraphic layer in the American Bottoms is the Cahokia Alluvium, comprising approximately 40–50 ft of unconsolidated, fine-grained silty sand at the surface that becomes coarser with depth. Below the Cahokia Alluvium is the Henry Formation, composed of coarser-grained sand and gravel glacial outwash deposits. The Henry Formation is approximately 40–80 ft thick and also becomes coarser with depth. These unconsolidated units overlie limestone and dolomite bedrock (URS, 2008).
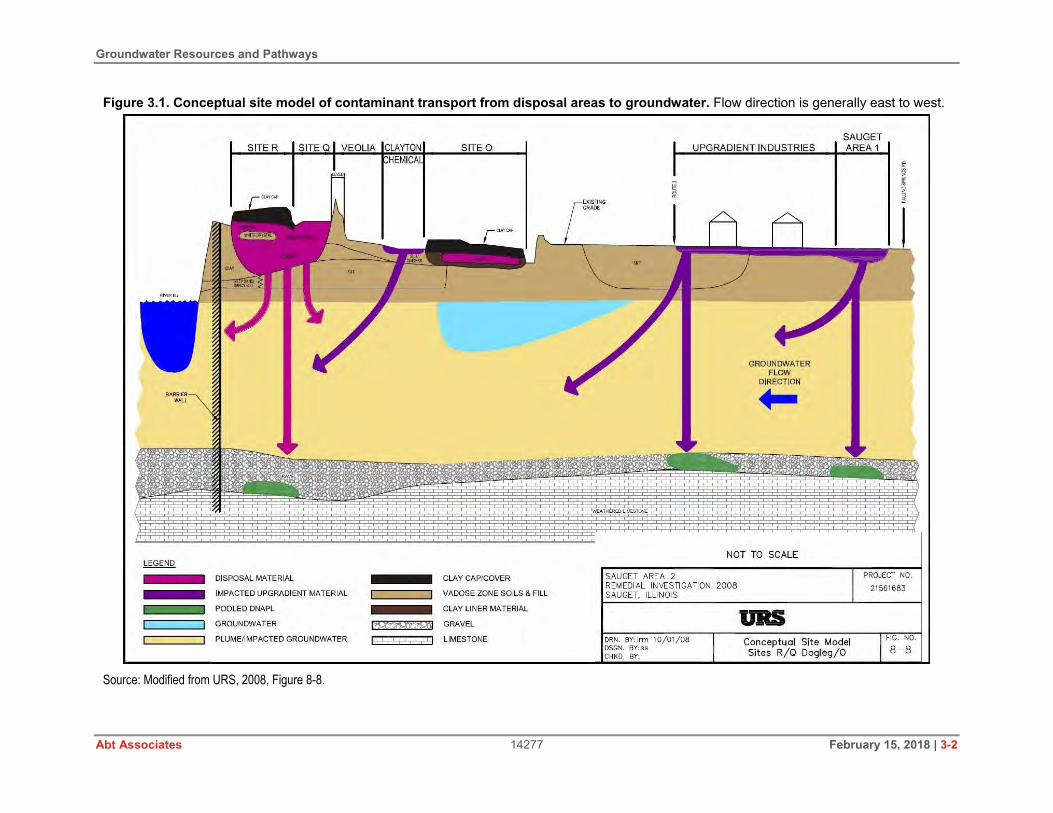
Groundwater Resources and Pathways
Abt Associates 14277 February 15, 2018 | 3-2
Figure 3.1. Conceptual site model of contaminant transport from disposal areas to groundwater. Flow direction is generally east to west.
Source: Modified from URS, 2008, Figure 8-8.
Groundwater Resources and Pathways
Abt Associates 14277 February 15, 2018 | 3-3
The RI documents segregate groundwater into three vertical hydrogeologic units: the shallow hydrogeologic unit (SHU), the middle hydrogeologic unit (MHU), and the deep hydrogeologic unit (DHU) (Figure 3.2). All of these units have gradational contacts. The SHU is composed of floodplain deposits and is a part of the Cahokia Formation with a thickness of approximately 15 to 30 ft. The MHU and DHU are part of the Henry Formation. Generally, the MHU extends from depths of 30–70 ft below ground surface, and the DHU typically extends from depths of 70–110 ft (GSI, 2008; Andrews Engineering, 2014).
Consistent with the representation in Figure 3.2, URS (2008) describes both the MHU and the DHU as medium/high permeability coarse-grained deposits in the Henry Formation with the same hydraulic conductivity. For the purposes of assessing groundwater injuries, we have treated the MHU and DHU as a single hydrogeologic unit.
3.3 Baseline Conditions and Lost Use
The DOI regulations define baseline as “the condition or conditions that would have existed at the assessment area had the discharge of oil or release of the hazardous substance under investigation not occurred” [43 CFR § 11.14(e)]. Under baseline conditions, the groundwater resources in the SIC area would be potable and would likely provide both municipal and industrial water resource services.
Historically, groundwater provided the primary water supply to the SIC. Use of groundwater in the East St. Louis area increased steadily over time into the 1960s. From the mid-1950s to the early 1960s, more than 100 million gallons per day (mgd) was pumped from the American Bottoms aquifer near East St. Louis, of which 91.1% was for industrial purposes, 6.4% was for public water supply, 2.3% was for domestic use, and 0.2% was for irrigation (Schicht, 1965). Between 30 and 35 mgd was pumped in the Sauget area, much of which was used at the W.G. Krummrich and the Mobil Oil refinery. By the early 1960s, groundwater levels had decreased by about 50 ft because of the heavy pumping (Schicht, 1965).
Groundwater pumping around East St. Louis declined steadily after the mid-1960s, decreasing from 110 mgd in 1964 to 54.4 mgd in 1981. Pumping increased slightly in the 1980s, ranging from 58.7 to 62.8 mgd between 1986 and 1990 (Schicht and Buck, 1995). In 1990, groundwater pumping near East St. Louis was 58.7 mgd, of which 76.2% (or 44.7 mgd) was for industrial purposes, 20.8% (or 12.2 mgd) was for public water supply, 2.0% (or 1.2 mgd) was for irrigation, and 1.0% (or 0.6 mgd) was for domestic use (Schicht and Buck, 1995). In the Sauget area, groundwater pumping virtually ceased by 1990, with the decline of industry and the connection of remaining industries to a Mississippi River-derived water supply. Industrial groundwater pumping declined by over 27 mgd between 1966 and 1990, resulting in a 65-ft increase in groundwater levels in the Sauget area (Schicht and Buck, 1995).
The aquifer continues to be an important source of water in the American Bottoms region. In 2011, the American Bottoms aquifer system provided 14.64 mgd for public water supply, defined as systems providing water for human consumption for at least 15 service connections or at least 25 people for at least 60 days per year (Hlinka et al., 2014). In fact, some communities that use Mississippi River water for their public water supply would prefer to use American Bottoms groundwater. For example, in 2009, the Town of Caseyville (approximately eight miles northeast of Sauget) investigated the feasibility of switching from Mississippi River water to American Bottoms groundwater (Curry and Associates, 2009, p. 1):

Groundwater Resources and Pathways
Abt Associates 14277 February 15, 2018 | 3-4
Figure 3.2. Hydrogeologic units in the American Bottoms aquifer near the SIC.
Source: GSI, 2008, Figure 2.

Groundwater Resources and Pathways
Abt Associates 14277 February 15, 2018 | 3-5
“The Village [of Caseyville] presently purchases treated water from Illinois American Water Company, which obtains raw water from the Mississippi River. The Village desires to construct its own wells and water treatment plant to supply treated groundwater to their customers, and discontinue water purchase from Illinois American, for the following reasons:
Frequent and continuous cost increases, which are perceived to be arbitrary and uncontrollable, for the water purchased.
Desire for autonomy and control of its own destiny. The Village is aware of the fact that the quality of groundwater
from wells is far superior to the raw water quality from the Mississippi River.”
Although Caseyville remains on Illinois American water because of the prohibitive cost of building and servicing the debt on a new water plant (Curry and Associates, 2009), this narrative clearly demonstrates a preference for uncontaminated groundwater over Mississippi River water for the public water supply.
In the SIC area, groundwater can no longer provide public water supply services. The use of groundwater as a potable water supply is no longer permitted in East St. Louis, Sauget, or Cahokia because of the extensive contamination:
The Village of Sauget passed Ordinance 99-5 in 1999, prohibiting the drilling of wells intended to produce groundwater as a potable water supply
The Village of Cahokia passed Ordinance No. 981 in 2000, prohibiting the use of groundwater as a potable water supply
The City of East St. Louis passed Ordinance 97-10066 in 1997, prohibiting the use of groundwater as a potable water supply.
All three ordinances cite groundwater contamination as the reason for the prohibition.
In addition to public water supply, in 2011, the American Bottoms aquifer system provided 26.7 mgd for “self-supplied industry,” which covers nearly everything that does not fit the definition of public water supply (Hlinka et al., 2014). Center Ethanol in Sauget had hoped to increase this amount, proposing in January 2011 to install two pumping wells to a depth of 80 ft. These wells would have provided both process water and non-contact cooling water for the plant, at a rate of 400 gallons per minute (gpm), or about 0.6 mgd (Lake, 2011; Newton, 2011). After IEPA described the contamination in Sauget groundwater (Lake, 2011), Center Ethanol apparently did not pursue this proposal any further. This provides an example of lost use services resulting from the hazardous substances in Sauget groundwater, despite the existence of an alternative water supply from the Mississippi River.
As will be discussed in the next section, the largest self-supplied industrial user of American Bottoms groundwater is the Illinois Department of Transport (IDOT). When the Mississippi River is not flooding, IDOT pumps about 12 mgd in the East St. Louis area to ensure that groundwater levels remain below the interstate roadbeds (Schicht and Buck, 1995; TBirdie Consulting, 2009).

Groundwater Resources and Pathways
Abt Associates 14277 February 15, 2018 | 3-6
Groundwater provides a range of other services in addition to direct human use, including in situ services such as water filtration and nonuse services such as existence or bequest value (NRC, 1997; Lane et al., 2009). In subsequent phases of this assessment, the State Trustees may evaluate more comprehensively the lost groundwater services as a result of the hazardous substance releases at the SIC.
3.4 Direction of Groundwater Flow
In the SIC area, groundwater generally flows west toward the Mississippi River, but the flow pathways are variable. The USGS (2012) identified the primary source of the variability as the stage of the Mississippi River, with other factors such as pumping, variable recharge, and operations at the GMCS along the river at Site R also influencing the groundwater flow direction.
3.4.1 Westward Flow toward the River
Absent a cone of depression from groundwater pumping or a high river stage, groundwater in the SIC flows west toward the Mississippi River. At moderate or low river stages, groundwater levels are higher in the floodplain and lower near the river, creating a gradient where groundwater flows generally westward toward the GMCS and the Mississippi River (Figure 3.3).
3.4.2 Gradient Changes during High River Stage
When the river stage is high, groundwater levels near the river are higher than groundwater levels in the floodplain. This alters the groundwater gradient, causing groundwater to flow in a more northerly direction. When the river stage is substantially higher than the groundwater levels, the groundwater gradient reverses entirely, and groundwater flows east, away from the river (Figures 3.4 to 3.6). The GMCS pumping wells shut off under these conditions; contaminants in groundwater also likely flow north and east when the river stage is high.
To investigate the potential influence of river stage on groundwater flow direction, GSI and URS (2014) collected hourly water level data in a monitoring well north of Site P (see Figure 2.1) during a four-month period over the winter. Water levels in this well responded to changes in river stage with a lag of approximately one week, indicating a clear connection between the river and the groundwater, and verifying the influence of river stage on groundwater flow direction.
GSI and URS (2014) also evaluated the timing of gradient reversals in the SIC. They found that 7 of the previous 20 quarterly monitoring events had a component of northerly flow, and that the northerly flow component was more pronounced when the Mississippi River levels were rising rapidly. GSI and URS (2014) concluded that the northerly component of flow occurred only when the river elevation was 396.7 ft (a gage height of approximately 17 ft) or higher. However, recent data show a northerly component of flow at a river stage of 394.4 ft (Figure 3.4).
GSI and URS (2014) found that the component of northerly flow based on river stage occurred in 35% (7 of 20) of the sampling events. This is consistent with the number of days that the Mississippi River stage exceeded an elevation of 396.7 ft. According to the USGS gauge in St. Louis, between January 1, 2005 and February 28, 2017, the Mississippi River stage exceeded 396.7 ft approximately 31% of the time, and it exceeded 394.4 ft approximately 37.5% of time (Figure 3.7; USGS, 2017).

Groundwater Resources and Pathways
Abt Associates 14277 February 15, 2018 | 3-7
Figure 3.3. Estimated groundwater surface and flow direction in the DHU when the Mississippi River elevation was ~ 383.5 ft between June 20 and June 22, 2006. Note that north is to the left and that contours have been extrapolated into areas with no underlying data.
Source: URS, 2008, Figure 6-18c (flow arrows added).

Groundwater Resources and Pathways
Abt Associates 14277 February 15, 2018 | 3-8
Figure 3.4. Estimated groundwater surface and flow direction in the MHU/DHU when the Mississippi River elevation was ~ 394.42 ft on April 29, 2016. Note that north is to the left.
Source: Golder, 2016b, Figure 3 (flow arrows added).

Groundwater Resources and Pathways
Abt Associates 14277 February 15, 2018 | 3-9
Figure 3.5. Estimated groundwater surface and flow direction in the MHU/DHU when the Mississippi River elevation was 406.06 ft on July 31, 2015. Note that north is to the left.
Source: Golder, 2015c, Figure 3 (flow arrows added).

Groundwater Resources and Pathways
Abt Associates 14277 February 15, 2018 | 3-10
Figure 3.6. Estimated groundwater surface and flow direction in the MHU/DHU when the Mississippi River elevation was 410.8 ft on May 9, 2013. Note that north is to the left.
Source: URS, 2013b, Figure 3 (flow arrows added).
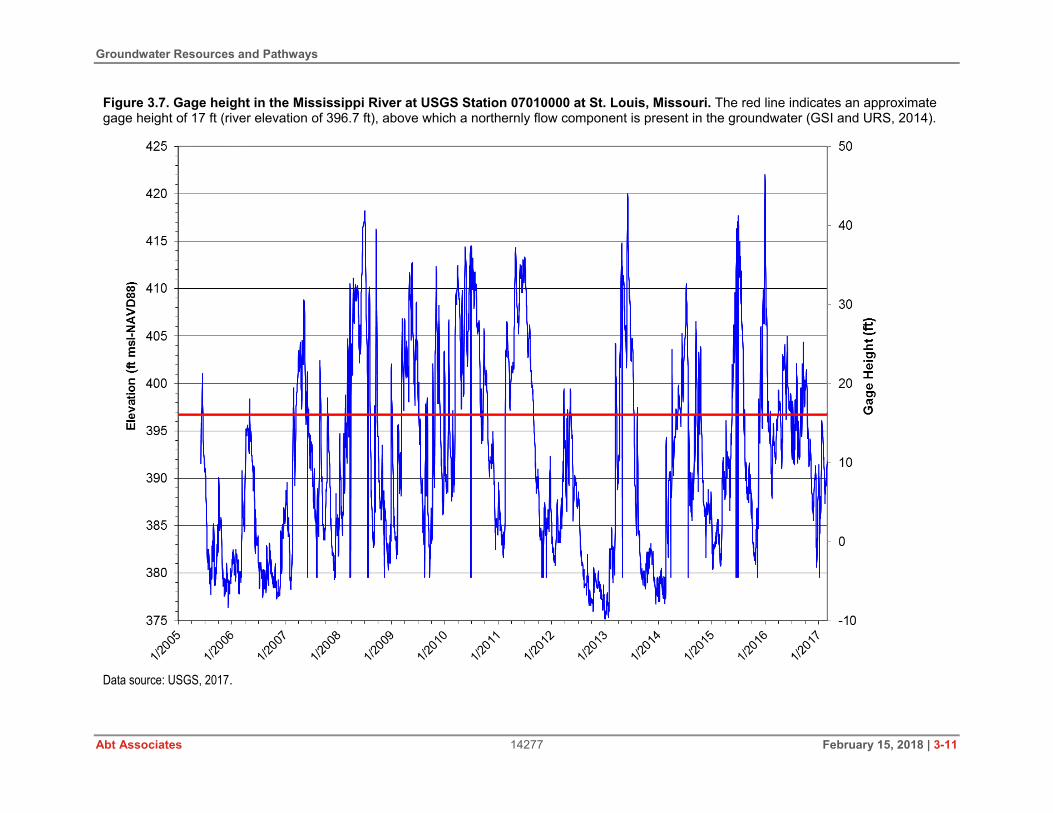
Groundwater Resources and Pathways
Abt Associates 14277 February 15, 2018 | 3-11
Figure 3.7. Gage height in the Mississippi River at USGS Station 07010000 at St. Louis, Missouri. The red line indicates an approximate gage height of 17 ft (river elevation of 396.7 ft), above which a northernly flow component is present in the groundwater (GSI and URS, 2014).
Data source: USGS, 2017.

Groundwater Resources and Pathways
Abt Associates 14277 February 15, 2018 | 3-12
When the Mississippi River stage substantially exceeds 396.7 ft, the reversal of the groundwater gradient becomes more pronounced. In these cases, groundwater can flow east, away from the river, rather than flowing northwest. Between January 1, 2005 and February 28, 2017, the Mississippi River stage in St. Louis exceeded 406 ft (e.g., Figure 3.5) approximately 11% of the time, and exceeded 410 ft (e.g., Figure 3.6) approximately 5.7% of the time (USGS, 2017). This contrasts with estimates from the 2014 Periodic Technical Review of the Solutia’s Long Term Monitoring Program under the RCRA. In that report, GSI and URS (2014) include a table of river stage values from the same USGS gauge from years 1861 to 2002, in which they estimate that the stage exceeds 396.6 ft (0.1 ft less than the 396.7 ft where they conclude that groundwater flow paths are altered) approximately 3.6% of the time. As discussed previously, the river stage over the past 12 years exceeded 396.6 ft about 31% of the time (USGS, 2017), suggesting that GSI and URS (2014) greatly underestimate the percentage of days that exceed their proposed flow path alteration threshold.
3.4.3 Northward toward IDOT Pumping Wells
As mentioned previously, since the 1960s, IDOT has pumped groundwater from a series of well fields to prevent groundwater levels from reaching the roadbeds of several highways north and northeast of the SIC (Figure 3.8). The combined pumping rate for the four well fields shown in Figure 3.8 is approximately 12 mgd (8,300 gpm), except during high flood stages of the Mississippi River, when pumping can increase up to 20 mgd (13,900 gpm) (TBirdie Consulting, 2009). The pumped water from all well fields is released at Outfall 001 (Figure 3.8), where it flows north to the Cahokia Canal and then west into the Mississippi River.
The closest well field to Sauget is the Missouri Avenue well field, approximately 2 miles north of the W.G. Krummrich plant, at the intersection of East Missouri Avenue and North 2nd Street. The pumping rates for the Missouri Avenue well field depends on the stage of the Mississippi River, with an estimated pumping rate of about 2,400 to 3,800 gpm (3.5–5.5 mgd) when the river is below flood stage. Pumping at Missouri Avenue could increase up to 6,600 gpm (9.5 mgd) if the Mississippi River were at a very high flood stage (432 ft) near the top of levee (TBirdie Consulting, 2009). In addition to lowering the water table near the roadbeds, this pumping creates a cone of depression that extends to the SIC.
In the Regional Groundwater Flow and Contaminant Transport Model for the American Bottoms Aquifer, GSI (2008) modeled the IDOT cone of depression using a scenario in which they assumed IDOT wells were pumping at 6,250 gpm (9 mgd), or about 75% of the typical IDOT pumping rate of 8,300 gpm (12 mgd) (TBirdie Consulting, 2009). Even assuming 75% of the normal pumping rate in 2000, the GSI (2008) regional flow model shows a clear cone of depression extending to the vicinity of W.G. Krummrich, resulting in a chlorobenzene plume flowing north toward Missouri Ave. rather than west toward the Mississippi River (Figure 3.9).
The GSI (2008) regional flow model assumed that IDOT pumping was ending. In the simulations, GSI decreased the IDOT pumping rate from years 2000 to 2010, ending all pumping in 2010, and by 2006, the simulated cone of depression no longer reached the SIC (GSI, 2008). This decreased pumping rate was based on erroneous personal communications with Solutia suggesting that planned road construction projects would obviate the need for pumping (GSI, 2008, p. FLOW-13). To date, no road construction projects have occurred that have resulted in decreased pumping. In fact, IDOT’s contractor suggested that pumping rates should increase (TBirdie Consulting, 2009).
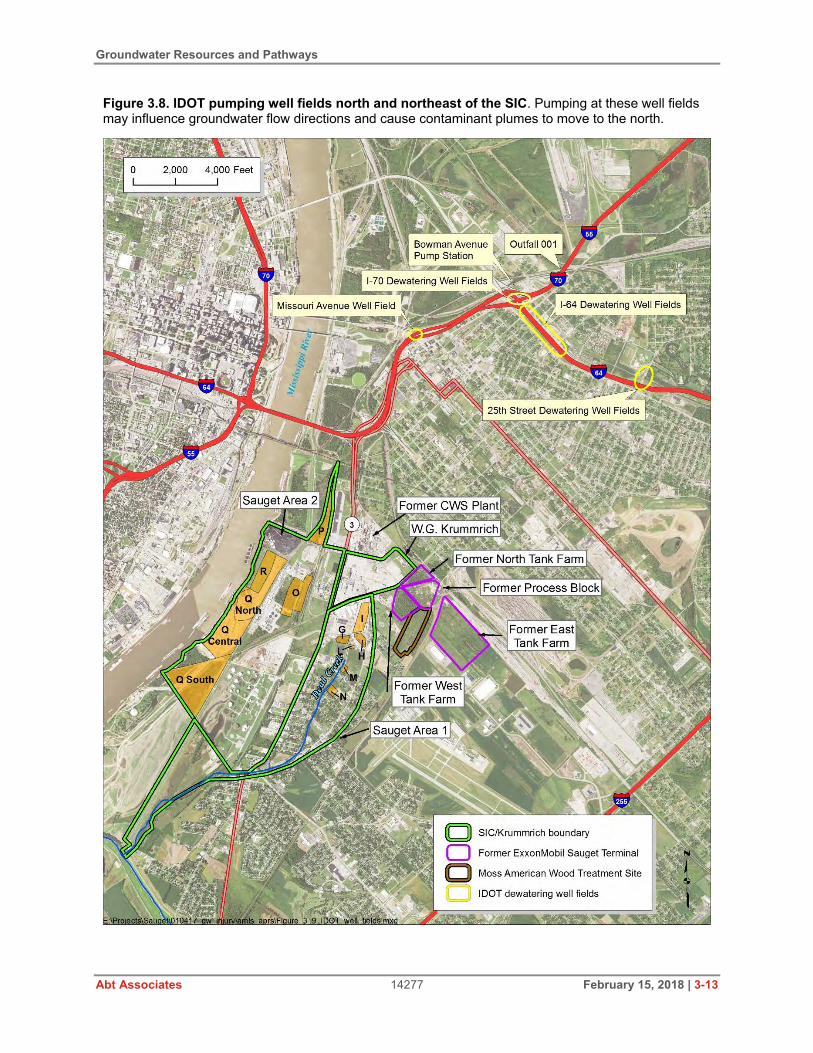
Groundwater Resources and Pathways
Abt Associates 14277 February 15, 2018 | 3-13
Figure 3.8. IDOT pumping well fields north and northeast of the SIC. Pumping at these well fields may influence groundwater flow directions and cause contaminant plumes to move to the north.

Groundwater Resources and Pathways
Abt Associates 14277 February 15, 2018 | 3-14
Figure 3.9. Modeled chlorobenzene plume in the DHU. The American Bottoms regional flow model includes a model run simulating the potentiometric surface (in 2000) when the model assumed IDOT wells were pumping at approximately 75% of their normal pumping rate. The cone of depression from the north-northeast is evident in the potentiometric surface.
Source: GSI, 2008, Figure 37.
When U.S. EPA notified Solutia of the error in the flow model (Bardo, 2012), GSI made insignificant revisions (Farhat and Newell, 2012), and the revised output for 2006 closely resembled the original output for 2006 (Figure 3.10). This model is inaccurate. The contaminant plume from W.G. Krummrich has a northerly flow component. In fact, as will be discussed in Chapter 4, the actual extent of 0.1 mg/L concentrations of chlorobenzene in the DHU is over one mile north of the modeled extent in Figure 3.10.

Groundwater Resources and Pathways
Abt Associates 14277 February 15, 2018 | 3-15
Figure 3.10. Modeled chlorobenzene plume in the DHU in the revised groundwater model for 2006, compared to the results from the GSI (2008) original model.
Source: Farhat and Newell, 2012, Figure 5.
Groundwater Resources and Pathways
Abt Associates 14277 February 15, 2018 | 3-16
3.5 Summary
Groundwater has played an important role as an industrial and municipal water supply in the Sauget area. Millions of gallons per day were used to support Sauget industries through the 1960s. Many municipalities still depend on the American Bottoms aquifer for their public water supply.
The DOI regulations define baseline as “the condition or conditions that would have existed at the assessment area had the discharge of oil or release of the hazardous substance under investigation not occurred” [43 CFR § 11.14(e)]. Absent the releases of hazardous substances from the industries in the Sauget area, particularly the benzene and chlorobenzene releases from Monsanto, the groundwater resources in the SIC area would be potable and would likely be an important municipal and industrial water source.
The pathways by which hazardous substances reached groundwater include direct deposition of liquid and solid chemical wastes into pits that extended into the water table, as well as infiltration and percolation of wastes deposited in the vadose zone above the water table. Chapter 2 discusses the concentrations and quantities of some of the hazardous substances deposited in the waste pits. These data confirm that both the unsaturated zone and groundwater serve as pathways for the transport of hazardous substances, as defined in the DOI regulations [43 CFR § 11.63(c, e)].
While the pathways for hazardous substances to reach groundwater are clear, the flow paths once those contaminants are in groundwater are less clear. Much of the contamination flows west from disposal areas to the GMCS at Site R. However, IDOT pumping has created a cone of depression that has resulted in benzene and chlorobenzene migrating north and northeast from disposal areas near the W.G. Krummrich plant. The regional contaminant transport models that Solutia’s contractors have proposed are inaccurate. As will be discussed in Chapter 4, injured groundwater extends considerably farther north than the regional flow and contaminant transport model predicts.

Groundwater Injury
Abt Associates 14277 February 15, 2018 | 4-1
4. Groundwater Injury
The releases of hazardous substances in the SIC have resulted in widespread injury to groundwater resources. This chapter first discusses groundwater injury as defined in the DOI regulations. It then presents evidence that groundwater has been injured, followed by a preliminary estimate of the extent of injured groundwater in the SIC based on existing data. The chapter concludes with a discussion of data gaps and uncertainties in this preliminary estimate.
4.1 Definition of Injury
Groundwater resources include water beneath the surface of land or water and the rocks or sediment through which it moves, and include any groundwater that meets the definition of drinking water supplies [43 CFR § 11.14(t)], which are any raw or finished water sources that may be used by the public or by one or more individuals [43 CFR § 11.14(o)]. As discussed in the previous chapter, millions of gallons of American Bottoms aquifer water are used in public water supplies every day.
Relevant injury definitions for groundwater resources in the DOI regulations include the following:
Concentrations and duration of hazardous substances in excess of drinking water standards as established by Sections 1411–1416 of the SDWA (Safe Drinking Water Act), or by other federal or state laws or regulations that establish such standards for drinking water, in groundwater that was potable before the release [43 CFR § 11.62(c)(1)(i)].
Concentrations and duration of hazardous substances sufficient to have caused injury to other resources when exposed to groundwater [43 CFR § 11.62(c)(1)(iv)].
Relevant injury thresholds for groundwater include concentrations in excess of Sections 1411–1416 of the SDWA and Illinois Class I drinking water standards for groundwater [32 IAC 620]. The aquifer under the SIC meets the definition of Class I Potable Resource Groundwater [32 IAC 620.210]; the groundwater remedial objectives for the SIC are based on the Class I criteria (URS, 2008).
4.2 Groundwater Contaminants
To evaluate groundwater injuries in the SIC, we relied upon existing data, including the RI/FS documents for Sauget Area 1 (GSI, 2012) and Area 2 (URS, 2008); the groundwater sections of these reports are substantially the same. The RI/FS documents focus on five “indicator” contaminants (alternative names provided in parentheses):
Benzene Chlorobenzene (monochlorobenzene) 1,4-Dichlorobenzene (p-dichlorobenzene, para-dichlorobenzene) 2,4-Dichlorophenol p-Chloroaniline (4-chloroaniline).
According to URS (2008), the U.S. EPA selected these five contaminants because they were the most widely distributed contaminants, with the highest concentrations in the groundwater.

Groundwater Injury
Abt Associates 14277 February 15, 2018 | 4-2
However, the RI/FS reports also identified other contaminants in groundwater, including the following:
Nitrobenzene 2,4-D (2,4-dichlorophenoxyacetic acid) 2,4,6-Trichlorophenol Tetrachloroethene (tetrachloroethylene, perchloroethylene, “perc”) Trichloroethene (trichloroethylene) 1,2-Dichloroethene (cis-1,2-dichloroethylene) Vinyl chloride 1,2-Dichloroethane Methyl tertiary-butyl ether (MTBE) Arsenic.
Benzene and chlorobenzene are the most widespread contaminants in SIC groundwater. There are numerous sources of these contaminants, and both have spread over a broad area (see Section 4.3). As discussed in Chapter 2, Monsanto used benzene for many of its product lines manufactured at W.G. Krummrich. Petroleum products containing benzene were also released at the ExxonMobil Sauget Terminal, the Moss-American wood treatment site, and Phillips Petroleum. Many of the benzene releases at these facilities have commingled into single large benzene plume (Section 4.3). The Maximum Contaminant Level (MCL) under the SDWA and the Class I groundwater standard under 32 IAC 620 is 5.0 µg/L for benzene (Table 4.1).
Table 4.1. Groundwater injury thresholds for groundwater contaminants identified in RI/FS documents (URS, 2008; GSI, 2012) plus MTBE. Concentrations are in µg/L. Contaminant SDWA MCL 32 IAC 620 Class I standard
Benzene 5.0 5.0
Chlorobenzene 100 100
1,4-dichlorobenzene 75 75
Nitrobenzene – 14
p-chloroaniline – –
2,4-D 70 70
2,4-dichlorophenol – –
2,4,6-trichlorophenol – –
Tetrachloroethene 5.0 5.0
Trichloroethene 5.0 5.0
1,2-dichloroethene 70 70
Vinyl chloride 2.0 2.0
1,2-dichloroethane 5.0 5.0
MTBE – 70
Arsenic 10 10
If no value is given, there is no groundwater standard.
Monsanto used chlorobenzene to manufacture PCBs, pesticides, and other products. Most or all of the chlorobenzene in SIC groundwater comes from spills and waste disposal from the W.G. Krummrich facility. The chemical p-chloroaniline is a nitrated form of chlorobenzene used

Groundwater Injury
Abt Associates 14277 February 15, 2018 | 4-3
in the manufacturing of pharmaceuticals and pesticides; nitrobenzene is an intermediate product. The SDWA MCL and the Class I standard is 100 µg/L for chlorobenzene. The Class I standard for nitrobenzene is 14 µg/L (Table 4.1). There is no MCL for nitrobenzene. There is no MCL or Class I standard for p-chloroaniline, although Illinois has derived a Class I groundwater remediation objective of 28 µg/L [35 IAC 742].
Other groundwater contaminants listed above that are pesticides or are derived during the manufacturing of pesticides include 1,4-dichlorobenzene, 2,4-dichlorophenol, 2,4,6-trichlorophenol, and 2,4-D. The SDWA MCL and the Class I standards are 75 µg/L for 1,4-dichlorobenzene and 70 µg/L for 2,4-D (Table 4.1). There is no MCL or Class I standard for 2,4-dichlorophenol or 2,4,6-trichlorophenol, although Illinois has derived Class I groundwater remediation objectives of 21 µg/L and 10 µg/L, respectively [35 IAC 742].
Tetrachloroethene is a solvent that was widely used for dry cleaning, metal degreasing, and other operations. It degrades to trichloroethene, dichloroethene, and vinyl chloride. The primary source of these products in groundwater is likely Clayton Chemical. Most of the elevated concentrations of these contaminants in groundwater are near Clayton Chemical’s disposal sites (URS, 2008). The SDWA MCL and the Class I standards are 5.0 µg/L for both tetra- and trichloroethene, 70 µg/L for 1,2-dichloroethene, and 2.0 µg/L for vinyl chloride (Table 4.1).
1,2-dichloroethane is an organic chemical that is formed in the manufacturing of several organic chemicals, including polyvinyl chloride (PVC). In the SIC, it is found in groundwater primarily under Site R (URS, 2008). The SDWA MCL and the Class I standard is 5.0 µg/L for 1,2-dichloroethane (Table 4.1).
MTBE was not identified as a particular contaminant of concern in the Sauget Area 2 RI/FS report (URS, 2008). However, the RI/FS groundwater analysis does include an estimate of the extent of benzene at Phillips Petroleum. As discussed in Chapter 2, Phillips Petroleum has released petroleum products and MTBE, which have commingled in the groundwater plume under that facility. There is no SDWA MCL for MTBE; the Class I standard is 70 µg/L (Table 4.1).
The arsenic MCL and Class I standard is 10 µg/L (Table 4.1). Concentrations exceeding this threshold are found throughout the SIC, but apparently the U.S. EPA did not select arsenic as an “indicator” contaminant for the RI/FS evaluation of groundwater contamination (URS, 2008). The areas with the highest arsenic concentrations (exceeding 100 µg/L) are coincident with known disposal areas. Areas in or near the SIC where arsenic concentrations are between 10 and 100 µg/L generally overlap with areas where benzene and/or chlorobenzene concentrations exceed the MCL.
Arsenic may have been disposed of in the toxic waste landfills and is following the same flow paths as benzene and chlorobenzene. Alternately, naturally occurring arsenic in the aquifer materials may be mobilized when dissolution of hydroxide minerals occurs under the reducing conditions typical of aquifers with organic contamination (Bahr et al., 2004). In a regional study of arsenic concentrations in American Bottoms wells, Voelker (1984) found that the vast majority of wells contained less than 5 µg/L arsenic, suggesting that arsenic concentrations do not typically exceed the MCL under baseline conditions (i.e., absent the release of anthropogenic arsenic and/or organic contaminants causing reducing conditions). Because the areas in and near the SIC where arsenic concentrations exceed the MCL generally overlap with areas where

Groundwater Injury
Abt Associates 14277 February 15, 2018 | 4-4
benzene and/or chlorobenzene concentrations exceed the MCL, arsenic was excluded from this evaluation of the spatial extent of injured groundwater.
4.3 Extent of Injured Groundwater
As discussed previously, this Phase 1 groundwater injury assessment relies entirely on existing data collected from the SIC vicinity. The initial basis for estimating the extent of injury comes from the RI/FS documents for Sauget Area 1 and Area 2. However, the RI/FS documents limit the spatial analysis to the areas covered by Sauget Area 1, Sauget Area 2, and W.G. Krummrich. The plume of injured groundwater extends well beyond these borders. To supplement the RI/FS data, we examined long-term monitoring data from Solutia’s RCRA program at W.G. Krummrich, as well as data from the former ExxonMobil Sauget Terminal, the Moss-American site, and other ancillary groundwater data.
4.3.1 RI/FS Data
The RI/FS documents for Sauget Area 1 (GSI, 2012) and Area 2 (URS, 2008) included numerous figures presenting contractors’ estimates of the spatial extent of groundwater contamination. Most of the contaminants listed in Section 4.2 are elevated in areas where large quantities of chemicals were dumped in the past. In particular, areas with groundwater criteria exceedances for numerous hazardous substances include (Figure 4.1):
W.G. Krummrich (multiple disposal areas) Site G, south of W.G. Krummrich Clayton Chemical area, including Site O and Site Q Dogleg Site R.
The estimated extent of 2,4-dichlorophenol (Figure 4.2) and 1,2-dichloroethene (Figure 4.3) from the Sauget Area 2 RI (URS, 2008) are representative examples of the extent of many of the SIC hazardous substances that exceed groundwater criteria. As portrayed in the RI, the spatial extent of benzene and chlorobenzene plumes is substantially greater than and generally encompasses the spatial extent of any of the other contaminant plumes. Therefore, for this Phase 1 estimate of the spatial extent of groundwater injury, we have focused solely on the extent of benzene and chlorobenzene plumes.
The benzene and chlorobenzene plumes depicted in the RI documents cover a broad area of both the SHU and the DHU (Figures 4.4 to 4.7). Generally, high concentrations of benzene or chlorobenzene in the SHU suggests a source area nearby. These contaminants spread laterally as they spread vertically, creating larger, more diffuse plumes in the DHU. The plumes shown in Figures 4.4 to 4.7 suggest the following:
The primary sources of benzene in the SIC are the Former Benzene Storage and Pipeline areas at W.G. Krummrich, Site G, Clayton Chemical, Site R, Site Q, and Phillips Petroleum (Figure 4.4). The extent of the plume east of W.G. Krummrich, and the extent of the plume in the area of Phillips Petroleum, was shown as a data gap in 2008. In the RI figure, this data gap was depicted with a dashed line (Figure 4.4).

Groundwater Injury
Abt Associates 14277 February 15, 2018 | 4-5
Figure 4.1. Most groundwater contaminants other than benzene and chlorobenzene are located in an area that extends from W.G. Krummrich, Site I, and Site G westward to Site Q and Site R along the Mississippi River.

Groundwater Injury
Abt Associates 14277 February 15, 2018 | 4-6
Figure 4.2. Estimated extent of 2,4-dichlorophenol contamination in the SHU, as depicted in the Sauget Area 2 RI. Note that north is to the left. The majority of groundwater contamination appears to be at W.G. Krummrich, Site G, and Clayton Chemical/Site R.
Source: Modified from URS, 2008, Figure 7-38.

Groundwater Injury
Abt Associates 14277 February 15, 2018 | 4-7
Figure 4.3. Estimated extent of 1,2-dichloroethene contamination in the MHU, as depicted in the Sauget Area 2 RI. Note that north is to the left. The majority of groundwater contamination appears to be at Site I, W.G. Krummrich, Clayton Chemical, and Site R.
Source: Modified from URS, 2008, Figure 7-57.

Groundwater Injury
Abt Associates 14277 February 15, 2018 | 4-8
Figure 4.4. Estimated extent of benzene contamination in the SHU, as depicted in the Sauget Area 2 RI. Note that north is to the left. The injury threshold for benzene is 5 parts per billion (ppb); the lowest contoured concentration shown in this figure is 10 ppb.
Source: Modified from URS, 2008, Figure 7-26.

Groundwater Injury
Abt Associates 14277 February 15, 2018 | 4-9
Figure 4.5. Estimated extent of benzene contamination in the DHU, as depicted in the Sauget Area 2 RI. Note that north is to the left. The injury threshold for benzene is 5 ppb; the lowest contoured concentration shown in this figure is 10 ppb.
Source: Modified from URS, 2008, Figure 7-28.

Groundwater Injury
Abt Associates 14277 February 15, 2018 | 4-10
Figure 4.6. Chlorobenzene in the SHU, as depicted in the Sauget Area 2 RI. Note that north is to the left. The injury threshold for chlorobenzene is 100 ppb, which is contour level “2” in this figure.
Source: Modified from URS, 2008, Figure 7-29.
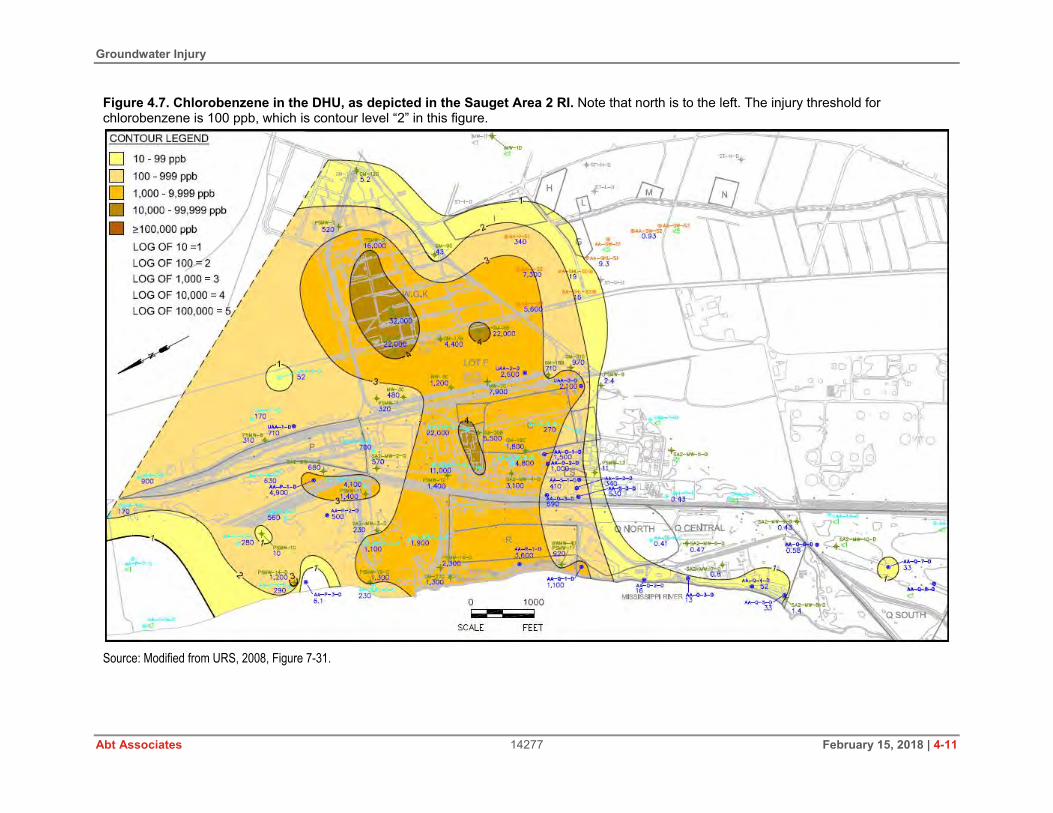
Groundwater Injury
Abt Associates 14277 February 15, 2018 | 4-11
Figure 4.7. Chlorobenzene in the DHU, as depicted in the Sauget Area 2 RI. Note that north is to the left. The injury threshold for chlorobenzene is 100 ppb, which is contour level “2” in this figure.
Source: Modified from URS, 2008, Figure 7-31.

Groundwater Injury
Abt Associates 14277 February 15, 2018 | 4-12
The highest benzene concentrations in the DHU are near Clayton Chemical/Site O and north of Site R. Benzene concentrations increase from west to east (away from the river) under W.G. Krummrich (Figure 4.5), suggesting potential eastward movement of the plume and/or alternate sources of benzene east of W.G. Krummrich (such as Moss-American and the ExxonMobil Former Sauget Terminal). The extent of the DHU benzene plume northeast of W.G. Krummrich was shown as a data gap in 2008. In the RI figure, this data gap was depicted with a dashed line (Figure 4.5).
In the 2008 RI, there were no DHU wells near Phillips Petroleum (Figure 4.5). As mentioned in Chapter 3, the “deep” wells that are monitored for the IEPA SRP apparently do not extend to the DHU either. Therefore, based on the review of the data available for this analysis, the extent of any benzene contamination in the DHU under Phillips Petroleum is unknown.
The highest concentrations of chlorobenzene in the SHU appear to be under W.G. Krummrich, Cerro Flow Products, Clayton Chemical, and Site R (Figure 4.6). For the 2008 RI, there were no wells in the SHU at Site I (Figure 4.6), where some of the chlorobenzene under Cerro Flow Products may have originated.
Chlorobenzene concentrations in the DHU exceed 100 µg/L over a broad area that includes much of W.G. Krummrich, Cerro Flow Products, Site O, Clayton Chemical, Site Q Dogleg, and Site R (Figure 4.7). For the 2008 RI, the northern extent of the DHU chlorobenzene plume was shown as a data gap. The chlorobenzene concentration at the north end of Site P (the northern extent of Sauget Area 2) was 900 µg/L concentration, or nine times the injury threshold. In the RI figure, this data gap at the north end of Area 2 was depicted with a dashed line (Figure 4.7).
The contaminant contours shown in the RI documents (e.g., URS, 2008) suggest that contaminants generally migrate from the source areas west toward the Mississippi River, with a component of flow to the north/northwest. This is consistent with variability in groundwater flow patterns that are influenced by the stage of the Mississippi River and IDOT pumping north of the SIC (see discussion in Section 3.4).
To estimate the overall extent of an integrated benzene and chlorobenzene plume, we overlaid the 10-µg/L benzene contours and the 100-µg/L chlorobenzene contours from both the SHU and DHU, as depicted in the RI (Figure 4.8). The 10-µg/L benzene contour shows the estimated extent of benzene at twice the injury threshold, and thus likely underestimates the spatial extent of injury. The spatial extent of the combined plumes in Figure 4.8 assumes vertical integration of the contamination (i.e., there is no differentiation between the spatial extent of SHU plumes and the spatial extent of DHU plumes). The dashed lines in Figure 4.8 were transcribed from the RI figures, showing areas where the plume boundaries were (and mostly still are) highly uncertain.
4.3.2 USACE Well Clusters
The USACE has conducted recent sampling near the levee that runs through Sauget Area 2, confirming the presence of chlorobenzene in multiple locations. In late 2010, USACE consultant ARDL installed a series of wells along the east side of the Mississippi River levee to evaluate potential risk to workers exposed to groundwater during a levee construction project. ARDL installed eight well clusters of three wells each, completed to depths of 20, 50, and 100 ft. The deep wells had 50-ft screen intervals (screened from 50 ft to 100 ft bgs). Samples from these wells included water from both the DHU and the MHU.

Groundwater Injury
Abt Associates 14277 February 15, 2018 | 4-13
Figure 4.8. Extent of 10-µg/L benzene plume and 100-µg/L chlorobenzene plume in the SHU and DHU (see previous four figures), as depicted in Sauget RI documents. Note that north is up in this orientation. Dashed lines were transcribed from the original figures.

Groundwater Injury
Abt Associates 14277 February 15, 2018 | 4-14
In 2010, 2011, 2014, and 2016, ARDL analyzed groundwater samples from these wells for VOCs, SVOCs, and metals (ARDL, 2011, 2015, 2016). In addition to confirming the presence of contaminants in SIC groundwater, some of these wells have provided information about contaminant concentrations in areas without many site-related monitoring wells.
Between 2010 and 2016, chlorobenzene was detected in the deep wells from all of the well clusters in and near the SIC (Figure 4.9). The chlorobenzene concentration at the northernmost well cluster (Well Cluster 1) was 84 g/L in 2010 and 43 µg/L in 2016 (Figure 4.10). These concentrations are below the chlorobenzene MCL (100 g/L) but indicate that the chlorobenzene plume is detectable northwest of the primary source areas.
Chlorobenzene concentrations at Well Clusters 2, 3, and 4 in the DHU (screened from 50 to 100 ft bgs) have increased by more than an order of magnitude since the wells were first sampled in 2010 (Figure 4.10). In recent sampling, chlorobenzene concentrations in all three wells exceeded the MCL of 100 µg/L. The concentrations of chlorobenzene in Well Cluster 4 in 2016 was 2,120 µg/L, or 21 times greater than the MCL. These wells confirm the 100-µg/L chlorobenzene plume extent in the DHU as depicted in the RI (Figures 4.7 and 4.9). The trend of increasing chlorobenzene concentrations with time could indicate that higher concentrations are migrating west toward the levee.
4.3.3 Phillips Petroleum
The Sauget Area 2 RI (URS, 2008) included an estimate of the spatial extent of benzene exceeding 10 µg/L in the Phillips Petroleum area (Figure 4.4). Phillips Petroleum is in the IEPA SRP and is required to monitor groundwater for the presence of petroleum, VOCs, SVOCs, and MTBE annually. In addition, Phillips Petroleum has implemented remedial programs to address LNAPL on the water table, which historically was multiple feet thick in places. SRP data for the site include more wells and more detail than was provided in the Area 2 RI/FS. Recent data from the SRP groundwater sampling confirm the following (GHD, 2016):
Benzene concentrations have been and continue to be highly elevated in multiple areas on the Phillips Petroleum property (Figure 4.11). In the 2015 sampling, there were three locations where benzene concentrations exceeded 10,000 µg/L, or more than 2,000 times higher than the injury threshold, including the PZ-4 area in the southwestern corner of the northeastern parcel (Figure 4.11).
MTBE concentrations exceed the 70-µg/L injury threshold at multiple locations, with multiple wells containing concentrations exceeding 10,000 µg/L (Figure 4.12).
Contaminant concentrations over time can vary by orders of magnitude each year, suggesting flow paths that vary with river stage and infiltrating rainfall, among other factors.
Some wells on the upgradient boundary of the site exceed MCLs for benzene and other contaminants, suggesting additional sources of contaminants north and east of the site. This is consistent with the spatial extent of the SHU benzene plume depicted in the 2008 RI (URS, 2008).

Groundwater Injury
Abt Associates 14277 February 15, 2018 | 4-15
Figure 4.9. Maximum chlorobenzene concentrations in USACE DHU wells sampled four times between 2010 and 2016. The plume outlined in black is the 100-µg/L DHU chlorobenzene plume contour as depicted in the Sauget Area 2 RI (URS, 2008 – see Figure 4.7).
Data sources: ARDL, 2011, 2015, 2016.

Groundwater Injury
Abt Associates 14277 February 15, 2018 | 4-16
Figure 4.10. Chlorobenzene concentrations in deep wells (50–100 ft bgs) from USACE well clusters in 2011, 2014, and 2016.
Data sources: ARDL, 2011, 2015, 2016.
The original wells drilled at Phillips Petroleum were almost entirely in the SHU. The water table is close to the ground surface in the area; for wells drilled in the 1990s, the “shallow” wells were completed to about 15 ft bgs, and the “deep” wells were completed to about 40 ft bgs. For this Phase 1 assessment, we did not have complete information on some of the more recent wells drilled at the site. However, we have no information suggesting that any wells were completed into the DHU, and thus any potential vertical contaminant transport to the DHU and subsequent lateral transport within the DHU is unknown (see Section 4.3.7 for additional discussion).

Groundwater Injury
Abt Associates 14277 February 15, 2018 | 4-17
Figure 4.11. Estimated spatial extent of benzene at the Phillips Petroleum site in May 2015. High concentrations at the upgradient property boundaries suggest other potential sources in the area. The dashed lines indicate data gaps.
Source: Modified from GHD, 2016, Figure 6b.

Groundwater Injury
Abt Associates 14277 February 15, 2018 | 4-18
Figure 4.12. Estimated spatial extent of MTBE at the Phillips Petroleum site in May 2016. Note that the lowest concentration contour is 100 µg/L and the injury threshold is 70 µg/L; there are additional wells south of the plume in this figure that exceed 70 µg/L.
Source: Modified from GHD, 2016, Figure 7c.

Groundwater Injury
Abt Associates 14277 February 15, 2018 | 4-19
4.3.4 Moss-American
Groundwater beneath the former Moss-American site (see Figure 2.1) is contaminated with hydrocarbons. Dissolved organic contaminants such as benzene and PAHs are present at concentrations exceeding injury thresholds (SDWA MCLs), In addition, LNAPL is present on the water table.
Groundwater under the Moss-American site has been contaminated with BTEX and PAHs since at least the 1980s. Three different wells have exceeded groundwater injury thresholds for benzene (Figure 4.13), spread throughout the site. The well at the southern end of the property (MAG101 in Figure 4.13) has exceeded the benzene and naphthalene injury thresholds by more than an order of magnitude for years, with benzene concentrations 50 times higher than the injury threshold and naphthalene concentrations up to 78 times higher than the injury threshold (AquAeTer, 2011, 2015). During the remedial investigation of the Moss-American site in the 1980s, benzene concentrations exceeded the injury threshold of 5 µg/L in many of the wells near the north and south ponds, but concentrations were generally low or below detection in the northern part of the site (John Mathes & Associates, 1989). In 1995, the benzene concentration at an intermediate groundwater depth near the North Pond (MAG103 in Figure 4.13) was 1,230 µg/L, nearly 250 times higher than the injury threshold (Kerr-McGee, 1995). Sampling in 2015 indicated that benzene still exceeded MCLs in some of the wells (e.g., MAG-101 and deeper wells at the same site), and DNAPL was present in the southern part of the site (AquAeTer, 2015).
Two offsite wells approximately 1,000 ft west (downgradient) of the Moss-American site also contained benzene and other hydrocarbons, but the investigators noted that these concentrations may be related to other potential sources of contaminants in the area, including former petroleum storage tanks and an abandoned landfill (Burlington, 1995). As mentioned previously, there are numerous sources of benzene in and near W.G. Krummrich and the SIC; over time, the benzene has commingled into a single large plume. For this preliminary estimate of injured groundwater, we included the southern half of the Moss-American facility within the estimated extent of injured groundwater (see Section 4.3.7).
4.3.5 Former Sauget Terminal
At the ExxonMobil Former Sauget Terminal, groundwater under the three tank farms and the Process Block is contaminated with petroleum hydrocarbons. Groundwater in the North Tank Farm and Process Block has LNAPL present in many wells (Amec Foster Wheeler, 2016b). Groundwater samples typically are not collected from wells with LNAPL, but dissolved petroleum hydrocarbons such as benzene are highly likely to be present in the water under the LNAPL. Other wells in the North Tank Farm and Process Block confirm the presence of dissolved benzene (Figure 4.14) and PAHs in groundwater when LNAPL is not present. Given the large number of wells throughout the North Tank Farm and Process Block containing either LNAPL or dissolved benzene concentrations exceeding the injury threshold of 5 µg/L (Amec Foster Wheeler, 2016b), we included the entire North Tank Farm and Process Block within the estimated extent of injured groundwater (see Section 4.3.7).

Groundwater Injury
Abt Associates 14277 February 15, 2018 | 4-20
Figure 4.13. Monitoring wells at the Moss-American site where benzene and other petroleum products have exceeded water quality criteria (red circles). Although the figure shows shallow wells, each well shown also includes intermediate and deep wells. The circle with no wells is an area where two wells historically exceeded the benzene criterion; those wells were not sampled in 2011.
Data sources: John Mathes & Associates, 1989; AquAeTer, 2011. Background figure: AquAeTer, 2011, Figure 1.

Groundwater Injury
Abt Associates 14277 February 15, 2018 | 4-21
Figure 4.14. Wells in the North Tank Farm and Process Block with LNAPL (red text) or benzene concentrations exceeding the SDWA MCL injury threshold of 5 µg/L (grey rectangles).
Source: Modified from Amec Foster Wheeler, 2016b, Figure 6.

Groundwater Injury
Abt Associates 14277 February 15, 2018 | 4-22
Groundwater in the East Tank Farm also contains concentrations of benzene exceeding the 5.0-µg/L injury threshold. These exceedances occur at the north end of the tank farm, the center of the tank farm, and the north end of the former Borrow Pit Area (Figure 4.15). In recent sampling (Amec Foster Wheeler, 2016a), the benzene concentration in the center of the tank farm was 2,490 µg/L, and benzene concentrations at the north end of the tank farm were as high as 3,960 µg/L. We included portions of the East Tank Farm in the spatial extent of injured groundwater (see Section 4.3.7).
Groundwater in the West Tank Farm exceeds Class I groundwater criteria for benzene and other hazardous substances. The 5-µg/L benzene MCL is exceeded throughout most of the West Tank Farm, by more than three orders of magnitude in some areas (Figure 4.16; Amec Foster Wheeler, 2017). The western portion of the West Tank Farm was already included within the extent of groundwater contamination as depicted in the RI (see Figure 4.8; URS, 2008). Because of the widespread benzene contamination throughout the West Tank Farm, we included the entire area within the spatial extent of injured groundwater.
4.3.6 RCRA Data from Solutia
Under RCRA authority, U.S. EPA requires Solutia to conduct quarterly or semiannual groundwater monitoring of selected wells at W.G. Krummrich and points north, northwest, and west of W.G. Krummrich. As discussed in Section 3.4, U.S. EPA recognized that benzene and chlorobenzene released at the W.G. Krummrich facility appeared to be flowing considerably farther north than had been predicted in the regional flow and contaminant transport model. In 2011, U.S. EPA requested that Solutia implement a Supplemental Groundwater Monitoring Program to assess the northward plume migration. In addition, U.S. EPA amended the Administrative Record to show that the migration of contaminated groundwater may not be under control (Bardo, 2012).
In response to this U.S. EPA request, Solutia installed several additional groundwater wells north and northeast of the SIC in 2011. These newer wells include an east-west line of wells (labeled with the prefix GWE) that generally follow a railroad corridor north of Site P, three new wells (labeled with the prefix ESL) near the Highway 3 intersection with Interstate 55/64/70, and one nested well (in the MHU and DHU) labeled with the prefix PM (Figure 4.17). The Supplemental Groundwater Monitoring Program includes data from the following wells:
Wells GWE-1, GWE-2, GWE-3, and GWE-5, which are nested wells that were completed in the SHU, MHU, and DHU in the last quarter of 2011 (URS, 2012a). Quarterly sampling at GWE-3 and GWE-5 has occurred consistently since that time. Data from GWE-1 and GWE-2 were sporadic between 2012 and 2014, before quarterly sampling resumed. In early 2016, sampling of wells completed in the SHU and MHU was discontinued, and sampling from GWE-1D was moved from a quarterly to a semiannual basis (Bury, 2016).
Monitoring wells ESL-MW-A, ESL-MW-C1, and ESL-MW-D1, which were installed in November 2012 to monitor the DHU (Bardo, 2012; URS, 2013b). Groundwater data from these wells were collected quarterly until 2016. Groundwater data are now collected quarterly at ESL-MW-D1 and semiannually at ESL-MW-A. Sampling at ESL-MW-C1 has been discontinued (Bury, 2016).

Groundwater Injury
Abt Associates 14277 February 15, 2018 | 4-23
Figure 4.15. Wells in the East Tank Farm where benzene concentrations exceed the 5.0-µg/L MCL (red circles).
Source: Modified from Amec Foster Wheeler, 2016a, Figure 3.

Groundwater Injury
Abt Associates 14277 February 15, 2018 | 4-24
Figure 4.16. Benzene concentrations in the West Tank Farm. Shaded areas are the areas estimated to exceed the 5.0-µg/L (0.005 mg/L) MCL.
Source: Modified from Amec Foster Wheeler, 2017, Figure 11.

Groundwater Injury
Abt Associates 14277 February 15, 2018 | 4-25
Figure 4.17. New wells north of the SIC and W.G. Krummrich that Solutia has sampled since late 2011. Maximum chlorobenzene concentrations measured between 2011 and 2017 are shown.
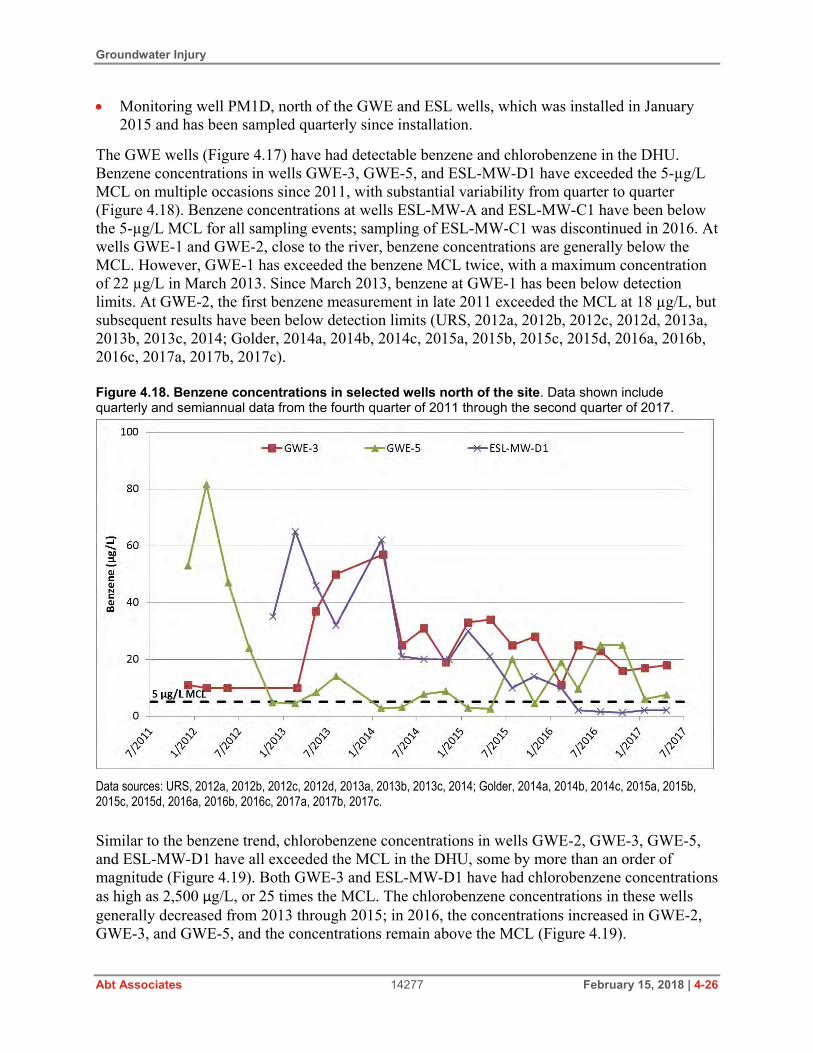
Groundwater Injury
Abt Associates 14277 February 15, 2018 | 4-26
Monitoring well PM1D, north of the GWE and ESL wells, which was installed in January 2015 and has been sampled quarterly since installation.
The GWE wells (Figure 4.17) have had detectable benzene and chlorobenzene in the DHU. Benzene concentrations in wells GWE-3, GWE-5, and ESL-MW-D1 have exceeded the 5-µg/L MCL on multiple occasions since 2011, with substantial variability from quarter to quarter (Figure 4.18). Benzene concentrations at wells ESL-MW-A and ESL-MW-C1 have been below the 5-µg/L MCL for all sampling events; sampling of ESL-MW-C1 was discontinued in 2016. At wells GWE-1 and GWE-2, close to the river, benzene concentrations are generally below the MCL. However, GWE-1 has exceeded the benzene MCL twice, with a maximum concentration of 22 µg/L in March 2013. Since March 2013, benzene at GWE-1 has been below detection limits. At GWE-2, the first benzene measurement in late 2011 exceeded the MCL at 18 µg/L, but subsequent results have been below detection limits (URS, 2012a, 2012b, 2012c, 2012d, 2013a, 2013b, 2013c, 2014; Golder, 2014a, 2014b, 2014c, 2015a, 2015b, 2015c, 2015d, 2016a, 2016b, 2016c, 2017a, 2017b, 2017c).
Similar to the benzene trend, chlorobenzene concentrations in wells GWE-2, GWE-3, GWE-5, and ESL-MW-D1 have all exceeded the MCL in the DHU, some by more than an order of magnitude (Figure 4.19). Both GWE-3 and ESL-MW-D1 have had chlorobenzene concentrations as high as 2,500 µg/L, or 25 times the MCL. The chlorobenzene concentrations in these wells generally decreased from 2013 through 2015; in 2016, the concentrations increased in GWE-2, GWE-3, and GWE-5, and the concentrations remain above the MCL (Figure 4.19).
Figure 4.18. Benzene concentrations in selected wells north of the site. Data shown include quarterly and semiannual data from the fourth quarter of 2011 through the second quarter of 2017.
Data sources: URS, 2012a, 2012b, 2012c, 2012d, 2013a, 2013b, 2013c, 2014; Golder, 2014a, 2014b, 2014c, 2015a, 2015b, 2015c, 2015d, 2016a, 2016b, 2016c, 2017a, 2017b, 2017c.

Groundwater Injury
Abt Associates 14277 February 15, 2018 | 4-27
Figure 4.19. Chlorobenzene concentrations in selected wells north of the site. Data shown include quarterly and semiannual data from the fourth quarter of 2011 through the second quarter of 2017.
Data sources: URS, 2012a, 2012b, 2012c, 2012d, 2013a, 2013b, 2013c, 2014; Golder, 2014a, 2014b, 2014c, 2015a, 2015b, 2015c, 2015d, 2016a, 2016b, 2016c, 2017a, 2017b, 2017c.
Chlorobenzene concentrations in wells GWE-1, ESL-MW-A, and ESL-MW-C1 have not exceeded the MCL, although chlorobenzene has been detected in all three wells at concentrations below the MCL (URS, 2012a, 2012b, 2012c, 2012d, 2013a, 2013b, 2013c, 2014; Golder, 2014a, 2014b, 2014c, 2015a, 2015b, 2015c, 2015d, 2016a, 2016b, 2016c, 2017a, 2017b, 2017c). As noted previously, sampling of ESL-MW-C1 was discontinued in 2016 (Bury, 2016).
As described in Chapter 3, groundwater flow paths are highly variable, with flow direction changing as a function of river stage in the Mississippi River and intensity of IDOT pumping. Such a scenario likely has created benzene and chlorobenzene plumes that generally move west toward the river and north toward the IDOT well field, with highly variable lateral movement. Such a scenario would result in contaminant concentrations changing over time in wells that are far from the original contaminant source, including the GWE and ESL wells described here.
The PM1M and PM1D wells, in the MHU and DHU, respectively, were installed more recently to further assess the northern extent of the benzene and chlorobenzene plumes. Since the installation of these wells in early 2015, chlorobenzene has been detected in PM1D at concentrations ranging from 12 to 55 µg/L (Golder, 2015a, 2015b, 2015c, 2015d, 2016a, 2016b, 2016c, 2017a, 2017b, 2017c). These concentrations are currently below the MCL of 100 µg/L, so existing data indicate that the plume of injured groundwater extends northward beyond ESL-MW-D1 but not as far north as PM1D.
The Supplemental Groundwater Monitoring Program has greatly expanded the groundwater data from north of the SIC, compared to the data originally presented in the RI. Benzene and

Groundwater Injury
Abt Associates 14277 February 15, 2018 | 4-28
chlorobenzene concentrations in wells ESL-MW-A, ESL-MW-C1, and PM1D have never exceeded the MCL for these contaminants; thus, these wells are outside of the spatial extent of injured groundwater. Wells GWE-3, GWE-5, and ESL-MW-D1 have consistently exceeded MCLs for benzene and chlorobenzene throughout the sampling duration, often exceeding the MCL by more than an order of magnitude (Figures 4.18 and 4.19). Benzene and chlorobenzene concentrations in wells GWE-1 and GWE-2 have been variable. At GWE-1, benzene concentrations in the DHU exceeded the MCL in 2011 and 2013 but have not exceeded since. At GWE-2, benzene concentrations in the DHU exceeded the MCL in 2012 and have not since, while chlorobenzene concentrations did not exceed the MCL in 2012 but have consistently exceeded the MCL since early 2016 (Figures 4.18 and 4.19). Both wells were included in the spatial extent of injured groundwater for this analysis.
4.3.7 Extent of Integrated Commingled Plume
The current spatial extent of injured groundwater includes at a minimum the extent of chlorobenzene exceeding 100 µg/L as depicted in the RI (URS, 2008), and the extent of benzene exceeding 10 µg/L as depicted in the RI (noting again that the injury threshold for benzene is 5 µg/L, so the RI plume depiction is an underestimate). The benzene plume suggests commingling of benzene from W.G. Krummrich source areas and benzene from areas east of W.G. Krummrich, such as Moss-American and the Former Sauget Terminal. While it is likely that injured groundwater under Clayton Chemical and Site R flows predominantly westward toward the GMCS and the river, it is clear from the Supplemental Groundwater Monitoring Program that some of the benzene and chlorobenzene released at W.G. Krummrich and areas east of W.G. Krummrich is flowing north/northwest. The supplemental groundwater data strongly suggest that IDOT dewatering wells north and northeast of the W.G. Krummrich facility, in conjunction with variations in groundwater flow caused by changes in the Mississippi River stage, create groundwater gradients that have allowed SIC-related contamination to migrate to the north.
As noted in previous sections, the spatial extent of injured groundwater in the SIC is still uncertain in many areas (see Section 4.5). However, based on currently available data, the spatial extent of injury includes the areas in the SHU and DHU depicted as injured in the RI using the 100-µg/L contour for chlorobenzene and the 10-µg/L contour for benzene (URS, 2008). In addition, the plume of injured groundwater includes areas injured at Moss-American and the Former Sauget Terminal using the 5-µg/L injury threshold for benzene, and injured groundwater below Phillips Petroleum as depicted in recent SRP reports using a 5-µg/L benzene threshold and 70-µg/L MTBE threshold. The plume of injured groundwater extends northward past the ESL wells but not yet as far north as the PM1D well (Figure 4.20).
There are few if any groundwater wells between the eastern source areas and the GWE wells; for this initial injury estimate based on existing data, we estimated the northeastern extent of injury based on our professional judgment of a probable flow path (Figure 4.20). It is highly likely that benzene and chlorobenzene are in groundwater below a residential area in East St. Louis (Figure 4.21); the data from the RI (Figure 4.4) and the recent data from new wells north of the SIC (Figure 4.18) suggest that the contamination is in the DHU. However, both the vertical and the spatial extent of benzene and chlorobenzene injuries is uncertain in this area. The State Trustees will work to address this data gap in subsequent phases of this assessment.

Groundwater Injury
Abt Associates 14277 February 15, 2018 | 4-29
Figure 4.20. Estimated spatial extent of injured groundwater in the SIC area, based on current existing data. Dashed lines indicate areas with little or no data and thus higher uncertainty. The RI and Phillips SRP dashed lines were transcribed from the original sources.

Groundwater Injury
Abt Associates 14277 February 15, 2018 | 4-30
Figure 4.21. Existing groundwater data suggest that benzene and chlorobenzene plumes extend beneath residential areas of East St. Louis. The lack of data from this area is a data gap that the State Trustees intend to address.

Groundwater Injury
Abt Associates 14277 February 15, 2018 | 4-31
The American Bottoms aquifer extends below the Mississippi River. U.S. EPA found river sediments contaminated with site-related constituents about 300 ft from the riverbank, demonstrating that contaminated groundwater extended well beyond the riverbank (U.S. EPA, 2002). Although the GMCS was installed in 2005 to reduce discharge of contaminated groundwater to the river, not all of the contaminated water in the area is captured, and plumes still discharge to the river (Arcadis, 2009). Thus, the extent of the plumes beneath the river is unknown. The plume boundaries along the riverbank (Figure 4.20) likely underestimate the western extent of the plumes; the boundary line is dashed to indicate this uncertainty.
Similarly, the vertical extent of injured groundwater near Phillips Petroleum is not well-defined. The wells at the site are mostly or entirely in the SHU. As a result, the spatial extent of the contamination may be underestimated, as the data from the northern areas of the SIC suggest that much of the benzene released from W.G. Krummrich has been transported within the DHU. The vertical extent of benzene and MTBE injury in the Phillips Petroleum area, and the potential spatial extent of injury resulting from contaminant transport within the DHU, remain data gaps (see Section 4.5).
The spatial extent of the integrated commingled groundwater plume shown in Figure 4.20 is approximately 1,875 acres, or 2.9 square miles. If new data become available, the State Trustees may revise this estimate of the spatial extent of groundwater injury in the future.
4.4 Temporal Extent
Trustees may include a damages claim for interim losses, from the time of the release until the time that the injured resources recover to baseline conditions. For losses to groundwater resources in the SIC, the State Trustees will need to estimate past, present, and future losses, based on current information.
This Phase 1 assessment does not include a thorough review of available information to estimate the amount of injured groundwater prior to the Sauget Area 2 RI/FS in 2008, nor does it include a thorough investigation of the effectiveness of remediation at contaminant source areas that could lead to demonstrable decreases in plume size in the future. This Phase 1 document does include some preliminary observations on historical and future plume extent in the following sections. The State Trustees will conduct additional research as part of future assessment work.
4.4.1 Historical Extent of Groundwater Injury
As described in Chapter 2, the SIC has been industrialized since the early 1900s. Operations at most of the facilities in the SIC started long ago, with the industrial heyday occurring prior to the 1970s (URS, 2008). Although data are not available to evaluate groundwater contamination in the early years, facility site histories indicate that releases to groundwater and the resulting groundwater contamination likely began decades ago.
Historically, the groundwater under the SIC was used extensively for industrial processes, primarily at W.G. Krummrich and the Mobil Sauget Terminal (see Chapter 3). As industrial use declined in the 1960s, IDOT installed pumping wells to keep the water table well below the Interstate roadbeds. Data presented in Chapter 3 suggest that groundwater levels in the SIC were rising from the 1960s into the 1990s. Extension of the injured groundwater plume to areas north

Groundwater Injury
Abt Associates 14277 February 15, 2018 | 4-32
of the SIC may have occurred during this time period. The State Trustees will examine the timing of the northward progression of the groundwater plume as part of future assessment work.
The spatial extent of the plumes portrayed in the Sauget Area 2 RI has not changed substantially in recent years. As part of a 2014 Periodic Technical Review for Solutia’s groundwater monitoring program under RCRA, GSI and URS (2014) compared the concentrations of benzene and chlorobenzene under W.G. Krummrich in 2006 and 2013 (Figure 4.22). Generally, the spatial extent of the plumes did not change substantially over that eight-year period. Concentrations in some wells had increased, others had decreased, but the overall plume footprint near the W.G. Krummrich facility was similar.
Concentrations of contaminants such as chlorobenzene in the USACE levee well clusters have increased in recent years, but these changes have not altered the overall plume footprint (see Figure 4.10). Concentrations of benzene and chlorobenzene in the wells north of the SIC declined for several years, although with a high degree of variability; contaminant concentrations increased in 2016 in some of the wells (see Figures 4.18 and 4.19).
The spatial extent of petroleum and MTBE contamination at Phillips Petroleum has been evaluated regularly since the early 2000s. Like in other areas of the SIC, the spatial extent of contamination has not changed appreciably, although the concentrations in individual wells can vary greatly from year to year, depending on hydrologic conditions. One well with a long history of sampling at Phillips Petroleum (DPZ-2) has had benzene concentrations consistently between 12,000 and 17,000 µg/L since 2002 (Figure 4.23). In the same well, however, MTBE concentrations were not detectable until 2004, then rapidly rose to more than 5,000 µg/L in 2008, declined slightly after a few years, and rose again from 2012 to 2016 (Figure 4.23). The MTBE concentration exceeded 20,000 µg/L in 2016 (GHD, 2016).
4.4.2 Projected Future Extent of Groundwater Contamination
As discussed previously, the future spatial extent of groundwater contamination will depend on many factors including the contaminant mass remaining in source areas, rates of release (leaching) of contaminants to groundwater and natural attenuation, and the effectiveness of remedial activities. Some subsurface remediation has occurred in source areas at W.G. Krummrich and Phillips Petroleum. Remediation of some areas in Sauget Area 1 and Area 2 have yet to be decided or implemented. Final remedies for Area 1 and Area 2 groundwater are likely to be many years in the future.
While source control will certainly improve groundwater conditions, it is difficult to remove a DNAPL such as chlorobenzene from groundwater. Because chlorobenzene in the DHU is the largest individual contaminant plume in the SIC, it is likely that the spatial extent of injured groundwater will continue to be substantial for the foreseeable future. In fact, GSI (2009) estimated the “Time to Clean,” or the time required for the aquifer to be free of contamination from chlorobenzene and 1,4-dichlorobenzene in Sauget Area 1, is on the order of hundreds of years.

Groundwater Injury
Abt Associates 14277 February 15, 2018 | 4-33
Figure 4.22. Estimated extent of chlorobenzene contamination in W.G. Krummrich groundwater in 2006 and 2013. Note that the injury threshold for chlorobenzene is 100 µg/L; the dashed lines indicate that the extent of injury was unknown based on this limited dataset.
Source: Modified from GSI and URS, 2014, Figure 4.

Groundwater Injury
Abt Associates 14277 February 15, 2018 | 4-34
Figure 4.23. Benzene and MTBE concentrations over time in Well DPZ-2 at Phillips Petroleum. Note the Y-axis is logarithmic.
Data source: GHD, 2016.
1
10
100
1,000
10,000
100,000C
on
cen
trat
ion
(µ
g/L
) Benzene MTBE
Benzene MCL (5 µg/L)
MTBE Class I Standard (70 µg/L)

Groundwater Injury
Abt Associates 14277 February 15, 2018 | 4-35
In a future injury quantification and damage determination phase, the State Trustees will examine remedial actions and contaminant trends to determine to what extent, if any, the plume of injured groundwater is likely to contract in the future.
4.5 Data Gaps
This Phase 1 groundwater assessment relies on existing data to quantify the extent of injured groundwater. However, as noted in many cases in the prior narrative, the spatial extent of the injured groundwater in the SIC area is not well-defined in some areas where contamination is highly likely to be present. Two areas in particular are not well-defined, based on the data reviewed for this report (see dashed lines in Figure 4.20):
Northeast of W.G. Krummrich and the Former Sauget Terminal DHU under Phillips Petroleum.
The benzene plume in the northeastern area may extend under a residential area (see Figure 4.21). Addressing this data gap is a high priority.
As mentioned previously, the deepest wells at Phillips Petroleum appear to be screened to a maximum depth of 40 ft bgs, which might capture contamination in the MHU, but do not provide data from the DHU. Based on evidence from the W.G. Krummrich area (see Figure 4.5), benzene can migrate vertically to and then spread widely in the DHU. The extent of injured groundwater in the DHU near Phillips Petroleum is currently unknown.
Finally, we note that the methods used to report the concentrations of some contaminants of concern have resulted in data gaps for the assessment of groundwater injury even when groundwater samples have been collected and analyzed. As noted previously with the benzene plume figures in the RI (URS, 2008), the lowest contour interval in the plume is higher than the MCL and Class I standard. In addition, when concentrations of some contaminants are particularly high in a sample, laboratories must dilute the sample to reduce the concentrations to be within specifications of the mass spectrometer. Each dilution increases the detection limit. In many cases, this has caused the detection limit for some contaminants to exceed the SDWA MCL or Illinois Class I groundwater standards.
The vinyl chloride plume depicted in the Sauget Area 2 RI/FS (URS, 2008) provides an example of both issues. The lowest contour interval for the vinyl chloride plume in the DHU (Figure 4.24) is 10 µg/L (ppb), which is five times higher than the MCL and the Class I standard. Areas near Clayton Chemical exceed 2 µg/L but are not included in the plume. Moreover, wells near Site G, W.G. Krummrich, and areas north of the primary source areas indicate no detectable vinyl chloride, when the detection limits exceed the MCL (Figure 4.24). Under W.G. Krummrich, the detection limit reported in the figure is 200 µg/L, or two orders of magnitude greater than the drinking water standard and the groundwater remediation objective.
High detection limits in diluted samples are common not only in the RI/FS documents, but also in Solutia’s RCRA Long Term Monitoring documents for W.G. Krummrich. Reporting only data from diluted samples can inhibit the utility of the samples for estimating the extent of injured groundwater.

Groundwater Injury
Abt Associates 14277 February 15, 2018 | 4-36
Figure 4.24. Vinyl chloride in the DHU, as depicted in the Sauget Area 2 RI/FS. The MCL and the Class I standard for vinyl chloride is 2 µg/L (ppb). In this figure, the wells near Clayton Chemical all exceed 2 µg/L but are not highlighted because the lowest contour interval is 10 µg/L. Areas where detection limits exceed the MCL include the well line near Site G (10 µg/L), areas under W.G. Krummrich (200 µg/L), and several wells north of the indicated plume extent (5–50 µg/L).
Source: Modified from URS, 2008, Figure 7-64.

Groundwater Injury
Abt Associates 14277 February 15, 2018 | 4-37
4.6 Summary
The releases of hazardous substances from multiple sources in the SIC and adjacent areas have resulted in widespread injury to groundwater resources. Consistent with DOI regulations, this Phase 1 assessment describes releases of hazardous substances (including “oil” and “petroleum” as specified in Chapter 1), pathways by which the hazardous substances were transported to groundwater, and the spatial extent of the resulting groundwater injuries.
Historical industrial operations, spills, and contaminant disposal practices in the SIC area have resulted in numerous and widespread sources of hazardous substances. XDD (2011a, 2011b, 2011c) estimated that over one million pounds of benzene and chlorobenzenes were still present in the vadose zone at the W.G. Krummrich property alone in 2011. Thousands of gallons of toxic waste were buried in unlined landfills and waste pits in the SIC.
The most prominent sources of hazardous substances extend from W.G. Krummrich and Site I west to Site Q and Site R along the Mississippi River, an area that encompasses Cerro Flow Products and Clayton Chemical (see Figure 4.1). Prior to the construction of the GMCS at Site R, the U.S. EPA (2002) estimated that some 484,000 lbs of VOCs and SVOCs were discharged from Sauget groundwater into the Mississippi River every year. East of W.G. Krummrich, benzene and other petroleum releases at Moss-American and the Former Sauget Terminal have commingled with benzene releases from W.G. Krummrich and the SIC. Additional releases have occurred at Phillips Petroleum, where benzene and MTBE appear to be commingled.
The pathways by which hazardous substances reached American Bottoms groundwater include direct deposition of liquid and solid chemical wastes into pits that extended below the water table, as well as infiltration and percolation of wastes deposited in the vadose zone above the water table. These hazardous substances have spread vertically (through the SHU to the DHU) and laterally (west toward the Mississippi River, and north/northwest when gradient reversals during high river stage and IDOT pumping influence the flow paths). The result is a mostly continuous commingled plume of injured groundwater (see Figure 4.20).
This Phase 1 groundwater assessment is based on existing data that show the extent of benzene and chlorobenzene in both the SHU and DHU; the extent of groundwater contamination from other hazardous substances falls within the benzene/chlorobenzene plume area. Where data gaps exist, we have used reasonable interpolation of the plume extent. The estimated extent of the injured groundwater plume (Figure 4.20) is about 1,875 acres, or 2.9 square miles. The State Trustees may revise this estimate in the future.
In subsequent phases of the groundwater assessment, the State Trustees may address data gaps such as the extent and depth of benzene contamination in groundwater north/northwest of W.G. Krummrich and in the DHU near Phillips Petroleum. The State Trustees may also assess potential changes to the groundwater injury extent over time, both in the past and in the future (accounting for remedial activities and response actions). In addition, the State Trustees are likely to assess the quantity (volume) of injured groundwater over time, and they will assess the appropriate compensation (damages) to offset the groundwater injury and make the public whole.

References
Abt Associates 14277 February 15, 2018 | R-1
References
Afton Chemical. 2017. Afton Chemical History. Available: http://www.aftonchemical.com/Generic/History. Accessed June 29, 2017.
Amec Foster Wheeler. 2014. Supplemental Site Investigation Workplan, Former Sauget Terminal, West Tank Farm, 2000 S. 20th Street, East St. Louis, Illinois 62207. Prepared for ExxonMobil Oil Corporation by Amec Foster Wheeler Environment & Infrastructure, Lisle, IL. August 15.
Amec Foster Wheeler. 2016a. Remediation Objectives Report, Former Sauget Terminal East Tank Farm, 2000 S. 20th Street, Sauget, Illinois, 62207, IEPA#1631215008. Prepared for ExxonMobil Oil Corporation by Amec Foster Wheeler Environment & Infrastructure, Lisle, IL. August 12.
Amec Foster Wheeler. 2016b. Site Investigation Status Update Report, Former Sauget Terminal, Process Block/Terminal Yard, 2000 S. 20th Street, East St. Louis, Illinois 62207, IEPA#1631215008. Prepared for ExxonMobil Oil Corporation by Amec Foster Wheeler Environment & Infrastructure, Lisle, IL.
Amec Foster Wheeler. 2017. Supplemental Focused Site Investigation Report, Former Sauget Terminal West Tank Farm, 2000 S. 20th Street, East St. Louis, Illinois 62207, IEPA#1631215008. Prepared for ExxonMobil Oil Corporation and Illinois Environmental Protection Agency by Amec Foster Wheeler Environment & Infrastructure, Lisle, IL. February 7.
Andrews Engineering. 2014. Draft Work Plan for Installation of Monitoring Wells in the Vicinity of Bowman Pump Station, FAI 55/64/70 Tri-Level Interchange, East St. Louis, St. Clair County, Illinois. Prepared for the Illinois Department of Transportation by Andrews Engineering. August 22.
AquAeTer. 2011. Former Moss-American Property – Sauget, Illinois: 2011 Annual Groundwater Quality Report. Prepared for Greenfield Environmental Multistate Trust, LLC, by AquAeTer, Centennial, CO. July 28.
AquAeTer. 2015. 2015 Annual Groundwater Quality Assessment Report, 2702 Ogden Avenue, Village of Sauget, St. Clair County, Sauget, Illinois. Prepared for Greenfield Environmental Multistate Trust, LLC, by AquAeTer, Centennial, CO. December 18.
Arcadis. 2009. Evaluation of Potential Impact on the Mississippi River Sauget Area 1 and Combined Groundwater Plumes, Sauget, Illinois. Letter from L. Lefkowitz and R. Bartelt at Arcadis to S. Smith at Solutia. July 1.
ARDL. 2011. HTRW Preassessment Screen Phase II ESA Design Deficiency Corrections for East St. Louis, Illinois Flood Protection Project, Final Report. Prepared for the U.S. Army Corps of Engineers by ARDL Inc., Mount Vernon, IL March 10.
ARDL. 2015. Well Cluster Drilling, Sampling & Analysis Phase II ESA Design Deficiency Corrections for East St. Louis, Illinois Flood Protection Project, Final Report. Prepared for the U.S. Army Corps of Engineers by ARDL Inc., Mount Vernon, IL January 26.

References
Abt Associates 14277 February 15, 2018 | R-2
ARDL. 2016. Sauget Well Cluster Sampling & Analysis, August 2016, Final Report. Prepared for the U.S. Army Corps of Engineers. Prepared by ARDL Inc., Mount Vernon, IL. October 6.
ATSDR. 2000. Toxicological Profile of Polychlorinated Biphenyls (PCBs). Prepared by U.S. Department of Health and Human Services, Public Health Service, Agency for Toxic Substances and Disease Registry. November.
Bahr, J.M., M.B. Gotkowitz, and T.L. Root. 2004. Arsenic Contamination in Southeast Wisconsin: Sources of Arsenic and Mechanisms of Arsenic Releases. University of Wisconsin, Water Resources Institute, Project WR02R003. December.
Bardo, K. 2012. U.S.EPA Region 5. Letter re: Additional Activities for the Supplemental Groundwater Monitoring Program. Solutia Inc., ILD 000 802 702.
Burlington. 1995. Brownfield Redevelopment Plan and Feasibility Study Report, Former Moss-American Site, Sauget, Illinois. Prepared for Kerr-McGee Chemical Corporation by Burlington Environmental Inc., Columbia, IL. March 6.
Bury, C. 2016. U.S. EPA Region 5. Letter re: Modification of Long-Term Groundwater Monitoring Network. Solutia Inc., ILD 000 802 702. February 6.
Cahnovsky, C. 2006. Illinois Environmental Protection Agency Bureau of Land/Field Operations Section RCRA Inspection Report.
Cerro Flow. 2017. Company Background. Cerro Flow Products LLC. Available: http://www.cerroflow.com/about%20us. Accessed June 5, 2017.
Chachakis, D. 2001. RCRA Compliance Evaluation Inspection. Prepared by Daniel Chachakis, U.S. Environmental Protection Agency. October 31.
Clayton Chemical. 1984. Comprehensive Environmental Report: Clayton Chemical Co. Sauget Plant Site. March 14.
Colten, C.E. and T.B. Samsel. 1988. Historical Assessment of Hazardous Waste Management in Madison and St. Clair Counties, Illinois, 1890–1980. Report RR·E31. Prepared by the Waste Management and Research Center, Illinois Department of Natural Resources. October.
Cummings, M. 2004. Memo re: Phillips Pipe Line, Cahokia – East St. Louis Terminal, Involvement in the Site Remediation Program (SRP) from Marc Cummings, BOL, RPMS, VSRU; to Sandra Bron, BOL, NPL. April 14.
Curry and Associates. 2009. Cursory Feasibility Review: New Wells and Water Treatment Plant for Village of Caseyyille, St. Clair County, IL. Prepared by Curry and Associates Engineers, Nashville, IL. May.
ERT. 1986. Preliminary Report of the Former Moss-American Site, Sauget, IL. Prepared for Kerr-McGee Chemical Corporation and Lefton Iron and Metal Company by ERT. November.
Farhat, S. and C. Newell. 2012. Memorandum to Steve Smith re: 2012 Update of Regional Groundwater Flow and Transport Model American Bottoms Aquifer from GSI Environmental Inc., Houston, TX. February 24.

References
Abt Associates 14277 February 15, 2018 | R-3
GHD. 2016. January 2014–June 2016 Site Progress Report: East St. Louis Terminal, Cahokia, Illinois. Rosemont, IL. October 3.
Golder. 2014a. Groundwater Monitoring Report, 2nd Quarter 2014 Data Report, Long-Term Monitoring Program, Solutia Inc., W.G. Krummrich Facility, Sauget, IL. Prepared for Solutia Inc. by Golder Associates Inc., St. Charles, MO.
Golder. 2014b. Groundwater Monitoring Report, 3rd Quarter 2014 Data Report, Long-Term Monitoring Program, Solutia Inc., W.G. Krummrich Facility, Sauget, IL. Prepared for Solutia Inc. by Golder Associates Inc., St. Charles, MO.
Golder. 2014c. Groundwater Monitoring Report, 4th Quarter 2014 Data Report, Long-Term Monitoring Program, Solutia Inc., W.G. Krummrich Facility, Sauget, IL. Prepared for Solutia Inc. by Golder Associates Inc., St. Charles, MO.
Golder. 2015a. Groundwater Monitoring Report, 1st Quarter 2015 Data Report, Long-Term Monitoring Program, Solutia Inc., W.G. Krummrich Facility, Sauget, IL. Prepared for Solutia Inc. by Golder Associates Inc., St. Charles, MO.
Golder. 2015b. Groundwater Monitoring Report, 2nd Quarter 2015 Data Report, Long-Term Monitoring Program, Solutia Inc., W.G. Krummrich Facility, Sauget, IL. Prepared for Solutia Inc. by Golder Associates Inc., St. Charles, MO.
Golder. 2015c. Groundwater Monitoring Report, 3rd Quarter 2015 Data Report, Long-Term Monitoring Program, Solutia Inc., W.G. Krummrich Facility, Sauget, IL. Prepared for Solutia Inc. by Golder Associates Inc., St. Charles, MO.
Golder. 2015d. Groundwater Monitoring Report, 4th Quarter 2015 Data Report, Long-Term Monitoring Program, Solutia Inc., W.G. Krummrich Facility, Sauget, IL. Prepared for Solutia Inc. by Golder Associates Inc., St. Charles, MO.
Golder. 2016a. Groundwater Monitoring Report, 1st Quarter 2016 Data Report, Long-Term Monitoring Program, Solutia Inc., W.G. Krummrich Facility, Sauget, IL. Prepared for Solutia Inc. by Golder Associates Inc., St. Charles, MO.
Golder. 2016b. Groundwater Monitoring Report, 2nd Quarter 2016 Data Report, Long-Term Monitoring Program, Solutia Inc., W.G. Krummrich Facility, Sauget, IL. Prepared for Solutia Inc. by Golder Associates Inc., St. Charles, MO. July.
Golder. 2016c. Groundwater Monitoring Report, 3rd Quarter 2016 Data Report, Long-Term Monitoring Program, Solutia Inc., W.G. Krummrich Facility, Sauget, IL. Prepared for Solutia Inc. by Golder Associates Inc., St. Charles, MO. October.
Golder. 2017a. Groundwater Monitoring Report, 4th Quarter 2016 Data Report, Long-Term Monitoring Program, Solutia Inc., W.G. Krummrich Facility, Sauget, IL. Prepared for Solutia Inc. by Golder Associates Inc., St. Charles, MO. January.
Golder. 2017b. Groundwater Monitoring Report, 1st Quarter 2017 Data Report, Long-Term Monitoring Program, Solutia Inc., W.G. Krummrich Facility, Sauget, IL. Prepared for Solutia Inc. by Golder Associates Inc., St. Charles, MO. April.

References
Abt Associates 14277 February 15, 2018 | R-4
Golder. 2017c. Groundwater Monitoring Report, 2nd Quarter 2017 Data Report, Long-Term Monitoring Program, Solutia Inc., W.G. Krummrich Facility, Sauget, IL. Prepared for Solutia Inc. by Golder Associates Inc., St. Charles, MO. July.
GSI. 2008. Regional Groundwater Flow and Contaminant Transport Model: American Bottoms Aquifer. GSI Environmental, Houston, TX.
GSI. 2009. Time to Clean Estimates for Chlorobenzene and 1,4-Dichlorobenzene. Sauget Area 1 Meeting. Presented August 18, 2009 by GSI Environmental, Houston TX.
GSI. 2012. Remedial Investigation/Feasibility Study, Sauget Area 1, Sauget and Cahokia, Illinois. Prepared by GSI Environmental, Houston TX. November 6.
GSI and URS. 2014. 2014 Periodic Technical Review of Long-Term Monitoring Program, Solutia Inc., W.G. Krummrich Facility, Sauget, Illinois. Prepared for SOLUTIA Inc., by GSI Environmental Inc., Houston, TX, and URS Corporation, St. Louis, MO. January.
Haney, B. 1986. Off-Site Disposal South of the Clayton Chemical Company Plant Property: Expansion of Information on Pages 4, 5, 8, and 9 of the Comprehensive Environmental Report, 3/15/86. Prepared by Bud R. Haney, Clayton Chemical Company employee. February 3.
Hlinka, K.J., S. Wilson, C. Smith, G. Rogers, K. Bridges, S. Meyer, G. Roadcap, C. Healy, and T. Bryant. 2014. Water Withdrawals in Illinois, 2011. Illinois State Water Survey. Prairie Research Institute. Available: https://www.ideals.illinois.edu/bitstream/handle/2142/88413/ISWSC-186.pdf. Accessed 8/22/2017.
IEPA. 2015. Letter from Dean Studer at Illinois Environmental Protection Agency to the National Building Arts Center, Re: Right-to-Know Notification (File Code 02A), Sauget/ExxonMobil West Tank Farm (LPC No. 1631215008/St. Clair Co.), 2000 S. 20th St. East St. Louis, IL 62207. August 28.
John Mathes & Associates. 1989. Technical Memorandum for the Former Moss-American Site Remedial Investigation, Sauget, Illinois. Volume II – Technical Report. Prepared for Kerr-McGee Chemical Corporation by John Mathes & Associates, Inc., Columbia, IL.
Kerr-McGee. 1995. Former Moss-American Site – Sauget. Illinois, Project 121535, Groundwater Quality Report – January 1995. Prepared by A.K. Watson, Kerr-McGee, Oklahoma City, OK, for Illinois Environmental Protection Agency. June 27.
Lake, P. 2011. Re: Well Water Question. Email from Paul Lake, IEPA to Tony Newton, Director of Technical Operations, Center Ethanol, Sauget, IL. January 20.
Lane, D., K. Carney, and D. Chapman. 2009. Identifying, scaling, and evaluating groundwater restoration projects as compensation for groundwater injuries. International Journal of Soil,
Sediment and Water 2(1): Article 3.
Lewis, C. and C. Arthur. 2016. Sauget Industrial Corridor Sites Natural Resource Damage Assessment: Pathway Report for Terrestrial and Aquatic Resources. Prepared for U.S. Fish and Wildlife Service. Prepared by Industrial Economics, Cambridge, MA. July 15. Available:
References
Abt Associates 14277 February 15, 2018 | R-5
https://www.fws.gov/midwest/es/ec/nrda/Sauget/pdf/SaugetPathwayReport20160715final.pdf. Accessed 8/23/2017.
Monsanto. 2017. Corporate Relationships among Monsanto Company, Pharmacia LLC, Pfizer Inc., Solutia Inc., and Eastman Chemical Company. Available: http://www.monsanto.com/whoweare/pages/monsanto-relationships-pfizer-solutia.aspx. Accessed February 28, 2017.
Newton, T. 2011. Well Water Question. Email from Tony Newton, Director of Technical Operations, Center Ethanol, Sauget, IL to Paul Lake, IEPA. January 11.
NRC. 1997. Valuing Ground Water: Economic Concepts and Approaches. National Research Council, Committee on Valuing Groundwater. Available: http://www.nap.edu/catalog/5498.html. Accessed 8/29/2017.
Philip Services. 1998. TACO Corrective Action Report, Former Moss-American Site, Sauget Illinois. Prepared for Kerr-McGee Chemical Corporation by Philip Services Corporation, Columbia, IL. September 21.
Phillips 66. 2017. Our History. Available: http://www.phillips66.com/EN/about/history/Pages/index.aspx. Accessed March 17, 2017.
Schicht, R.J. 1965. Ground-Water Development in East St Louis Area, Illinois. Report of Investigation 51.
Schicht, R.J. and A.G. Buck. 1995. Ground-Water Levels and Pumpage in the Metro-East Area, Illinois, 1986–1990. Circular 80.
SIC Natural Resource Trustees. 2009. Sauget Industrial Corridor Sites, Sauget, Cahokia and East St. Louis, IL Preassessment Screen and Determination. Prepared by the United States Fish and Wildlife Service, Illinois Environmental Protection Agency, Missouri Department of Conservation, and Illinois Department of Natural Resources.
SIC Natural Resource Trustees. 2013. Final Draft Assessment Plan for the Natural Resource Damage Assessment of the Sauget Industrial Corridor Sites, St. Clair County, Illinois. Prepared by the United States Fish and Wildlife Service, Illinois Environmental Protection Agency, Illinois Department of Natural Resources and Missouri Department of Natural Resources. January.
Solutia. 2000. Description of Current Conditions: W.G. Krummrich Plant, Sauget, Illinois. Draft. 2000. Solutia Inc., Sauget, IL.
TBirdie Consulting. 2009. Computer Simulation of Groundwater Flow, Illinois Department of Transportation, Dewatering Wellfield, East Saint Louis, Illinois. I-70 Tri-Level Connection, FAP 998, Section 82-1, D-98-058-089, St. Clair County, Illinois. Prepared for AECOM USA Inc. by TBirdie Consulting Inc. March 26.
TCT-St. Louis. 1994. Archives Search Report: Preliminary Assessment of Chemical Warfare Materials Contamination at the Former St. Louis Chemical Warfare Service Plant (Site
References
Abt Associates 14277 February 15, 2018 | R-6
No. E05IL328500), Sauget, Illinois. Prepared for the U.S. Department of the Army, St. Louis, MO and Huntsville, AL. February.
Terracon. 1999. Combined Site Investigation and Remedial Action Completion Report. Volume 1 of 2. IEPA Incident No. 982776. Terracon Project No. 42987139. Prepared for Phillips Pipe Line Company, Bartlesville, OK, by Terracon, Rock Island, IL. February 15.
URS. 2004. Sauget Area 2, Sauget, Illinois Remedial Investigation/Feasibility Study Report. Prepared for Sauget Area 2 Sites Group. October. URS Corporation, St. Louis, MO. Draft.
URS. 2008. Sauget Area 2, Sauget, Illinois Remedial Investigation Report. Prepared for Sauget Area 2 Sites Group. October. URS Corporation, St. Louis, MO.
URS. 2012a. Long-Term Monitoring Program 1st Quarter 2013 Data Report. Solutia Inc., W.G. Krummrich Facility, Sauget, IL. Prepared for Solutia Inc. by URS, St. Louis, MO. April.
URS. 2012b. Long-Term Monitoring Program 2nd Quarter 2013 Data Report. Solutia Inc., W.G. Krummrich Facility, Sauget, IL. Prepared for Solutia Inc. by URS, St. Louis, MO. July.
URS. 2012c. Long-Term Monitoring Program 3rd Quarter 2013 Data Report. Solutia Inc., W.G. Krummrich Facility, Sauget, IL. Prepared for Solutia Inc. by URS, St. Louis, MO. October.
URS. 2012d. Long-Term Monitoring Program 4th Quarter 2013 Data Report. Solutia Inc., W.G. Krummrich Facility, Sauget, IL. Prepared for Solutia Inc. by URS, St. Louis, MO.
URS. 2013a. Long-Term Monitoring Program 1st Quarter 2013 Data Report. Solutia Inc., W.G. Krummrich Facility, Sauget, IL. Prepared for Solutia Inc. by URS, St. Louis, MO. May.
URS. 2013b. Long-Term Monitoring Program 2nd Quarter 2013 Data Report. Solutia Inc., W.G. Krummrich Facility, Sauget, IL. Prepared for Solutia Inc. by URS, St. Louis, MO. July.
URS. 2013c. Long-Term Monitoring Program 3rd Quarter 2013 Data Report. Solutia Inc., W.G. Krummrich Facility, Sauget, IL. Prepared for Solutia Inc. by URS, St. Louis, MO. October.
URS. 2014. Long-Term Monitoring Program 1st Quarter 2014 Data Report. Solutia Inc., W.G. Krummrich Facility, Sauget, IL. Prepared for Solutia Inc. by URS, St. Louis, MO. May.
U.S. EPA. 2002. Record of Decision for the Groundwater Operable Unit (OU-2), Sauget Area 2 Superfund Site, Sauget, Illinois. September.
U.S. EPA. 2007. Statement of Basis for Solutia Inc., Sauget, Illinois. E.P.A.I.D. No. ILD 000 802 702. July.
U.S. EPA. 2017. Resource Recovery Group (aka Clayton Chemical) Site. Available: https://response.epa.gov/site/site_profile.aspx?site_id=Pending. Accessed 8/29/2017.
USGS. 2012. Assessment of the State of Characterization of the Hydrogeology and Water Quality at the Solutia Facility in Sauget, Illinois. U.S. Geological Survey. Provided to Paul Lake, IEPA, by Ken Bardo, U.S. Environmental Protection Agency.

References
Abt Associates 14277 February 15, 2018 | R-7
USGS. 2017. National Water Information Service, Gaging Station 07010000, Mississippi River at St. Louis, MO. United States Geological Survey. Available: https://waterdata.usgs.gov/usa/nwis/uv?07010000. Accessed March 1, 2017.
Vieregge, K. 2012. RCRA Inspection Report, Conoco Phillips Pipeline Company, Cahokia, Illinois. Illinois Environmental Protection Agency, Bureau of Land/Field Operations Section. June 7.
Voelker, D.C. 1984. Quality of Water in the Alluvial Aquifer, American Bottoms, East St. Louis, Illinois. U.S. Geological Survey Water Resources Investigation Report 84-4180.
XDD. 2011a. 100% Design – Enhanced Aerobic Bioremediation at Former Chlorobenzene Process Area, W.G. Krummrich Facility, Sauget, IL. Prepared for Solutia Inc., St. Louis, MO. November.
XDD. 2011b. 100% Design – Thermally Enhanced Soil Vapor Extraction System at Former Chlorobenzene Process Area, W.G. Krummrich Facility, Sauget, IL. Prepared for Solutia Inc., St. Louis, MO. November.
XDD. 2011c. 100% Soil Vapor Extraction System Design – Big Mo & Former Benzene Pipeline Areas, W.G. Krummrich Facility, Sauget, IL. Prepared for Solutia Inc., St. Louis, MO. September.