pharmeceutical screening of surface water, … · pharmeceutical screening of surface water, ground...
TRANSCRIPT
PHARMECEUTICAL SCREENING OF SURFACE WATER, GROUND WATER, AND STREAM BED SEDIMENT IN GALLATIN VALLEY, MONTANA
Final Report for NRCS-CIG Agreement #65-0325-06-023
Suzanna Carrithers1/, Holly Sessoms1/, and Tammy Crone2/
___________________________________________________________________________ 1/ Water Quality Research Associates, Department of Land Resources and Environmental Sciences, Montana State University, Bozeman, MT 59717-3120 2/ Water Quality Specialist, Gallatin Local Water Quality District, Bozeman, MT 59715
2
TABLE OF CONTENTS
REPORT
Executive Summary Page 3
Background Page 3
Goals and Objectives Page 4
Compound List and Method Development Page 5
Sample Site Selection Page 7
Field Sample Collection Page 9
Laboratory QA/QC Results Page 10
Field Sample Results Page 10
Discussion Page 13
Conclusion Page 16
References Page 17
APPENDICES
Appendix A. Expense Summary Page 19
Appendix B. Complete Pharmaceutical Compound List Page 20
Appendix C. Detail Maps of Sampling Sites Page 21
Appendix D. Standard Operating Procedures (SOPs) Page 25
Appendix E. Complete Field Parameter Data for all Sites Page 31
3
Executive Summary
In 2006, a research team from Montana State University Extension Water Quality Program (MSUEWQ) and the Gallatin Local Water Quality District (GLWQD) received a Natural Resource Conservation Service (NRCS) - Conservation Initiative Grant (CIG) to screen surface and ground water within the Gallatin Valley for veterinary pharmaceutical compounds. The team, consisting of MSUEWQ, GLWQD, and NRCS representatives, identified thirteen ground water and thirteen surface water sites for screening based on proximity to agricultural livestock operations and agriculture/urban interface. Water and sediment samples from the sites were collected in the fall of 2007 and tested for a suite of veterinary antibiotics and hormonally active compounds. Results from the Montana Department of Agriculture (MT DOA) lab indicated no detection of veterinary pharmaceutical compounds in surface water and ground water samples. Lack of detections may indicate that animal waste management practices in the valley are effectively preventing veterinary pharmaceuticals from entering the sampled water resources, but may also be a function of the season and climate in which sampling took place, or of landscape and chemical conditions existing during the time of sampling. In order to conclusively determine the presence or absence of veterinary pharmaceuticals in water resources of Gallatin Valley, further research is needed. The outcomes of this project have indicated there may be minimal risk of veterinary pharmaceutical contamination during low flow conditions and provides the tools necessary for additional studies. The following report details the process of compound selection, sampling site selection, analytical development, and development of field sampling protocols completed by the research team.
Background
Recent research reveals that surface and ground waters worldwide are contaminated with low level pharmaceuticals and personal care products (PPCPs). The origin of PPCP contamination of surface and ground water is considered to be both point and non-point discharges of municipal, domestic, and agricultural wastewater. Of specific concern are antibiotics and hormonally active agents which have been found in many domestic water sources (Koplin et al. 2002). These non-metabolized compounds are excreted and/or disposed of by humans or animals and enter into private, agricultural, or municipal waste water treatment systems which may not be equipped to treat antibiotic and hormone residue. The parent compounds and metabolites may then be available to enter the environment through discharge from water treatment or septic systems, leakage from effluent lagoons or from leaching and runoff of land applied manure.
A primary concern related to presence of human and agricultural antibiotic residue in the environment is the potential emergence of antibiotic-resistant bacteria (Kumar et al. 2005) and environmental impairments associated with hormonally active compounds. Data on acute aquatic toxicity of many commonly used veterinary medicines are publicly available for daphnids, small aquatic organisms, and to a lesser extent, for fish and algae. However, concentrations required for acute toxicity are usually much higher than those levels reported in surface waters. Chronic effects from long term, low-level exposure to pharmaceutical compounds appear to be of greater concern. For example, a Canadian study introduced common agricultural and human use hormone compounds to a water body populated by fathead minnows. Over time, male fish showed signs of feminization resulting in a rapid decline of the species (Kidd 2007). In another study, researchers studying wild fathead minnows exposed to feedlot
4
effluent observed significant alterations to reproductive biology (Orlando et al. 2004). Another concern is the lack of understanding about how these compounds interact in the environment. These concerns, among others, have spurred a recent increase in PPCP related studies throughout the world.
Antibiotics and pharmaceutical compounds are extensively used in veterinary medicine and were the primary focus for the Gallatin Valley project. Past research by Balter (1999) estimates that hormone supplements are used in the production of approximately 90% of beef cattle. Literature also suggests that as much as 90% of veterinary antibiotics may be excreted in animal waste (Hirsh et al. 1999). Excreted compounds can enter the environment through direct defecation into a stream, runoff from the soil surface, leaching of effluent applied to crops, or from confined feeding operations. Once a compound enters the environment, its behavior is highly dependent on its physio-chemical characteristics and characteristics of the matrix where it resides (i.e. soil, water, vegetation). Recent research has indicated that while some compounds move readily within the water column, others are hydrophobic and tend to adsorb onto sediment (Sanders et al. 2008). Thus, to account for both hydrophylic and hydrophobic compounds, it is necessary to sample the water column and stream bed sediment.
In addition to surface water concerns, pharmaceutical contamination of ground water is an emerging issue. Pharmaceutical occurrence in ground water has not been studied to the extent of surface waters, but available research indicates that some compounds are entering ground water systems. In 2005, a U.S. Geological Survey (USGS) study detected nine organic wastewater compounds in a shallow unconfined sandy aquifer near La Pine, Oregon (Hinkle). Recent work conducted in the Helena Valley of Montana documents the detection of 22 pharmaceutically active compounds, personal care products, and endocrine disrupting compounds in public and private water supply wells (Miller and Meek 2005). Occurrence of pharmaceuticals in ground water systems often represents a direct conduit from aquifer to end-user (human consumption).
Agencies and researchers in Montana have been progressive in analyzing pharmaceutical occurrence in Montana’s water resources. These studies have focused on both animal and human influenced locations, with an emphasis on human-sourced compounds. In the Gallatin Valley, no studies have been performed since a USGS screening on Godfrey Creek in 2000, an agriculture influenced tributary to the Gallatin River. Results of this study indicated the presence of caffeine, cholesterol, and coprostanol (carnivore fecal steroid) in the creek. This limited data, along with generations of agricultural activity within the region, made the Gallatin Valley a prime location for more intensive veterinary pharmaceutical screening. Additionally, the agriculture/urban interface in the area facilitates the need to assess surface and ground water resources within the valley.
Goals and Objectives
MSUEWQ and GLWQD applied for and received competitive NRCS-CIG funds to initiate a two-year project to conduct the first large-scale screening of veterinary pharmaceutical compounds in water resources of the Gallatin Valley. The purpose of the CIG is to “stimulate the development and adoption of innovative conservation approaches and technologies while leveraging Federal investment in environmental enhancement and projection, in conjunction with agricultural production” (USDA 2006). Objectives of the project were: 1) to screen for the
5
occurrence of selected pharmaceutical compounds in surface and ground waters at agriculturally influenced sites and at the agriculture/urban interface throughout the Gallatin Valley, and 2) contingent on pharmaceutical detection from water sampling efforts, create technical standards regarding animal waste management aimed at preventing contamination of Montana waterways from veterinary pharmaceuticals. Information obtained through this study was intended to help NRCS assess the effectiveness of current recommended practices and programs, and aid in identification of additional information needs.
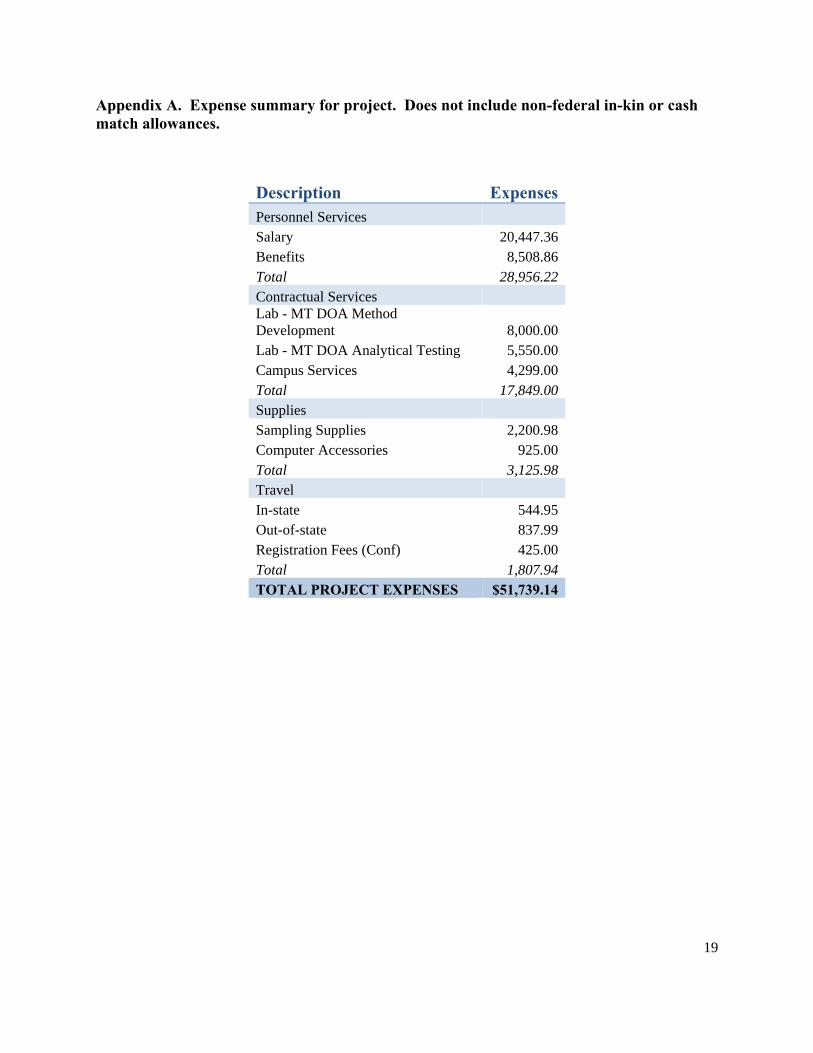
Five phases of the project were implemented and included: 1) a review of existing literature to determine predominant pharmaceuticals compounds found in waterways and their behavior in the environment; 2) a survey of local veterinarians to determine the most commonly used antibiotic and hormonally active compounds in the valley; 3) development of sample collection protocols based on literature findings and consultation with professionals who have experience in pharmaceutical sampling; 4) development of a cost effective, low-level detection method for determination of pharmaceutical compounds in water; and 5) a sample survey of 13 agriculturally influenced surface water, ground water, and sediment sites. A synopsis of project expenses is included in Appendix A and does not include the non-federal in-kind or cash match allowances, which were matched on a one-to-one basis.
Compound List and Method Development
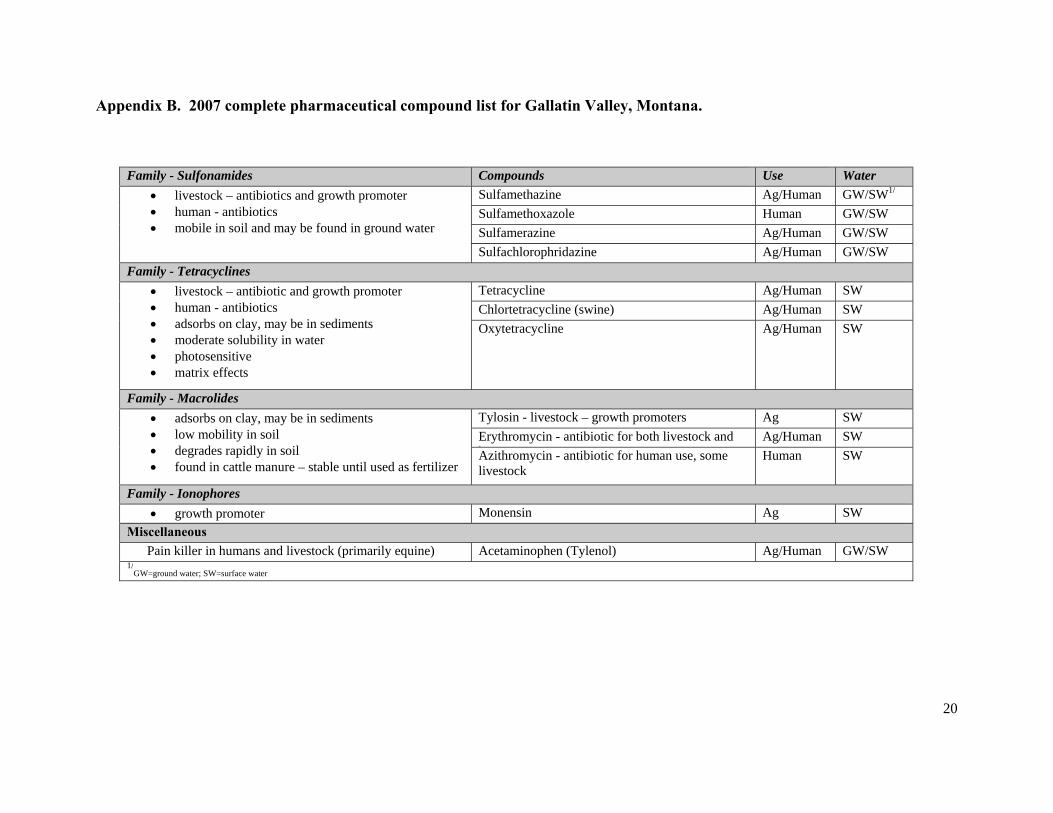
A thorough literature review of common veterinary pharmaceuticals used for livestock operations was initiated at the onset of the project. Through the literature review, researchers indentified veterinary compounds that were commonly detected in similar studies, indicating both the mobility and extensive use of those compounds. The compound list derived from the literature review served as the basis for a survey sent to three local veterinarians who work primarily with large animals and interact with the agricultural community. Two of the three veterinarians responded and based on their input, the literature review, and consultation with other professionals, a short list was developed. A complete list of these compounds with descriptions can be found in Appendix B.
To be consisted with laboratory analytical methods found in other studies, the Montana Department of Agriculture Analytical Laboratory (MT DOA) was contracted to develop an Ultra Performance Liquid Chromatography/Mass Spectrometry/Mass Spectrometry (LC-MS/MS) method for analysis of pharmaceutical compounds in water. The MT DOA laboratory is housed at Montana State University making it convenient in terms of sample delivery and timely analytical results. In addition, the lab costs for analysis were dramatically lower than other labs within the region with these analytical capabilities making analysis costs prohibitive for future studies. The MT DOA developed and validated an efficient method that can reliably measure and confirm results at detection levels in the part per trillion (ppt) range for as many compounds on the short list as possible.
Though the MT DOA laboratory was the contracted laboratory for this study, two other labs coordinated with the research team to provide additional analytical services complimentary to the studies focus. An agreement with EPA Region 8 Laboratory in Golden, Colorado was established for analysis of duplicate water samples, hormone analysis, and all sediment samples. These compounds, used for both animal and human needs, include diethylstibesterol, estriol,
6
trenbolone, and zeranol. Analytical results are pending at the time of this report for analysis of hormones in water and sediment samples. Also, duplicate ground water samples were collected in cooperation with the Montana Bureau of Mines and Geology (MBMG) as part of a state-wide ground water monitoring effort and an opportunity for their laboratory to evaluate the effectiveness of ELISA (enzyme-linked immunosorbent assay) in analyzing these pharmaceutical compounds. MBMG tested wells in the Gallatin Valley for both inorganic and pharmaceutical compounds using the ELISA method. The ELISA method developed used by the MBMG is available by contacting the MBMG Laboratory in Butte, Montana. These additional analytical resources were a strategic collaboration that reduced duplication of sampling efforts and may provide other analytical option for veterinary pharmaceutical analysis in water and sediment samples.
Samples from the Gallatin River and domestic wells in the valley near Hyalite Canyon and Wheatland Hills were used in the MT DOA method development process. Specific concentrations of each compound on the short list were added to the sample water, which is an analytical quality control/quality assurance (QA/QC) process known as “spiking” a sample. For method development, samples were spiked at a concentration based upon a limit of quantitation (LOQ), the concentration at which quantitative results can be reported with a high degree of confidence for each compound. Samples were also spiked at ten times the LOQ.
Matrix blank (non-spiked) and matrix standards were also included in the validation process. These were initially derived from laboratory grade de-ionized water. However, this did not account for potential matrix effects of the different water samples. Matrix effects are occurrences where the condition of the sample water, such as naturally occurring chemical or physical constituents, interfere or alter the behavior of a specific compound that is being processed through the method. Matrix effects must be studied for all compounds in all matrices. To account for matrix effects, blank extracts of each matrix were spiked at LOQ and 10 X LOQ concentrations and compared to equal concentrations of standards in every sample set. If percent recovery outside of the 80-120% range, matrix was concluded to have an interfering affect. No effects were noted for sulfamethoxazole, sulfachloropyridazine, tetracycline, oxytetracycline, and acetaminophen in any matrix. Tylosine and monensin demonstrated significant enhancement in all matrices studied while sulfamethazine, sulfamerazine, and chlortetracycline indicated enhancement in some matrices but not consistently. Azythromycin was the only compound to demonstrate matrix suppression.
To reduce the bias of matrix effects, standards made from matrix are incorporated into the method for quantification of results and to measure instrument response to a compound in the presence of matrix. As it is not practical to evaluate each sample matrix during routine analysis, the laboratory designated the Hyalite well water to be used for standards. It is readily available and demonstrates average matrix affects compared to other matrices studied.
Based on the recovery of compounds during method development, the final list of pharmaceuticals used in agriculture practices was composed (Table 1.). Compounds with little to no recovery during method development included penicillin and amoxicillin and thus were not included in the final list. The MT DOA method, Determination of 12 Pharmaceutical Compounds in Ground Water and Surface Water Using Solid Phase Extraction and Ultra
7
Performance Liquid Chromatography/Mass Spectrometry/Mass Spectrometry, is available by contacting the MT DOA laboratory in Bozeman, Montana.
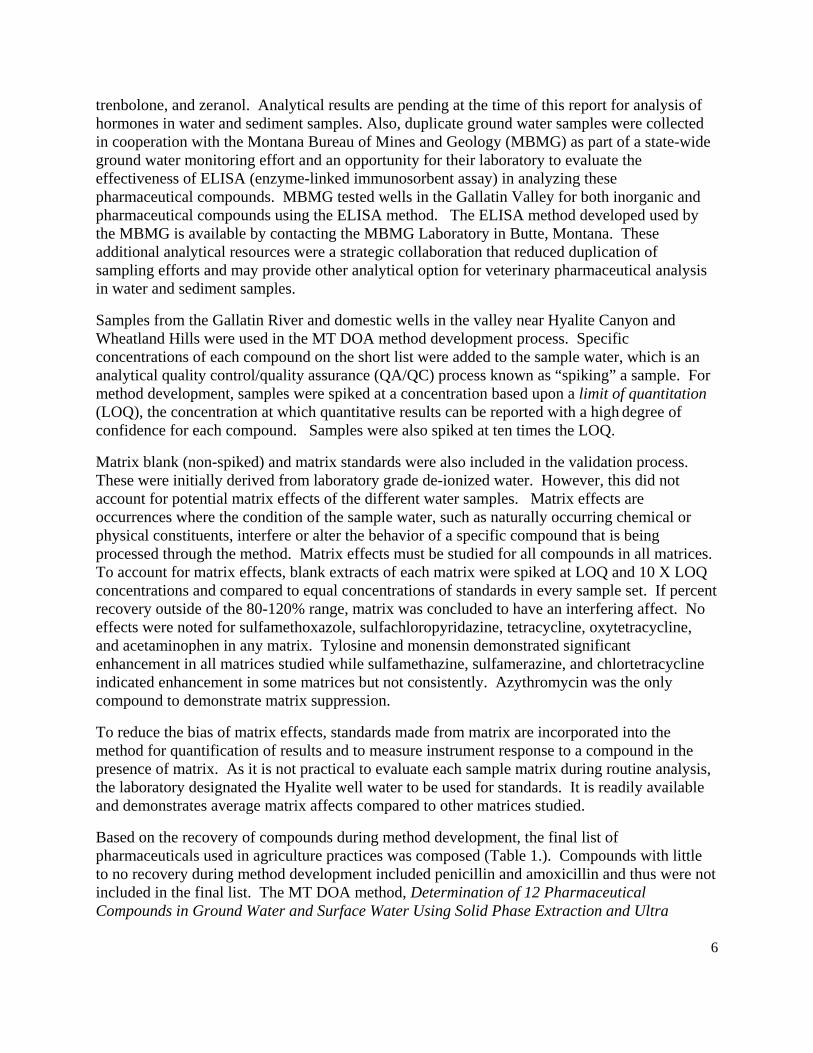
Table 1. 2007 pharmaceutical sampling short list for Gallatin Valley.
Family Origin/Source Water Source Sulfonamides Sulfamethazine Ag/Human GW/SW1/ Sulfamethoxazole Human GW/SW Sulfamerazine Ag/Human GW/SW Sulfachlorophridazine Ag/Human GW/SW Tetracyclines Tetracycline Ag/Human SW Chlortetracycline Ag/Human SW Oxytetracycline Ag/Human SW Macrolides Tylosin Ag SW Erythromycin Ag/Human SW Azithromycin Human SW Ionophores Monensin Ag SW Miscellaneous Acetaminophen (Tylenol) Ag/Human GW/SW 1/
GW=ground water; SW=surface water
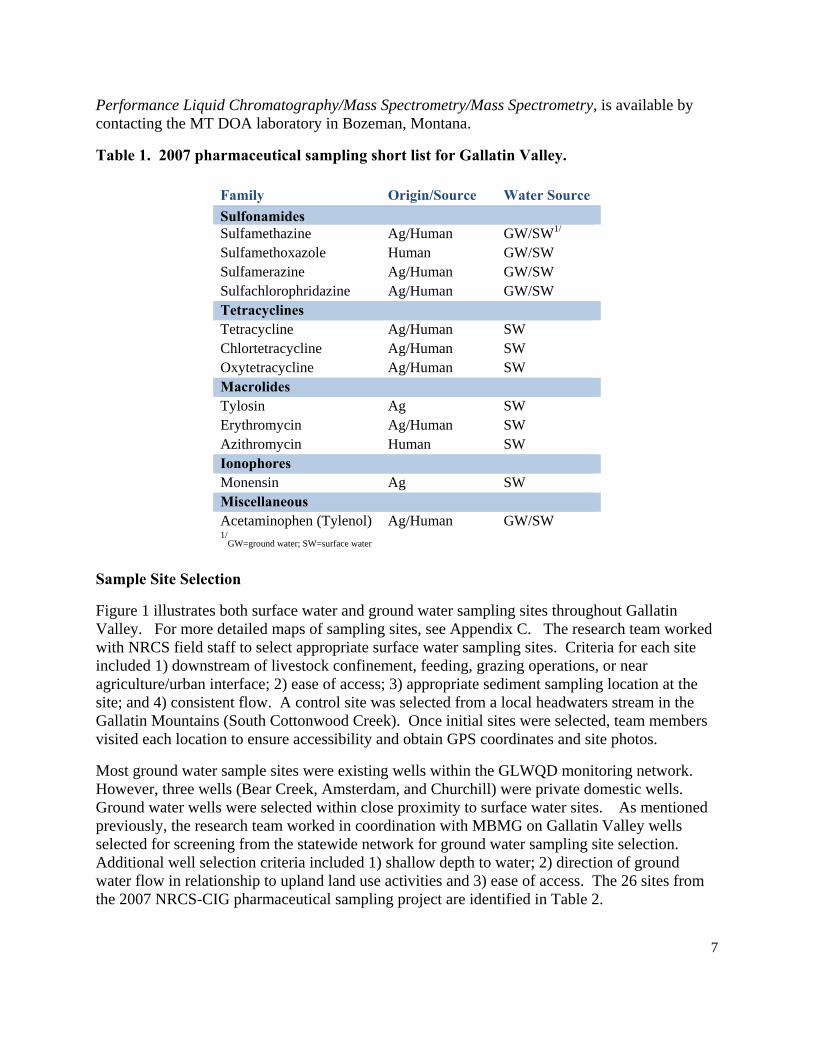
Sample Site Selection
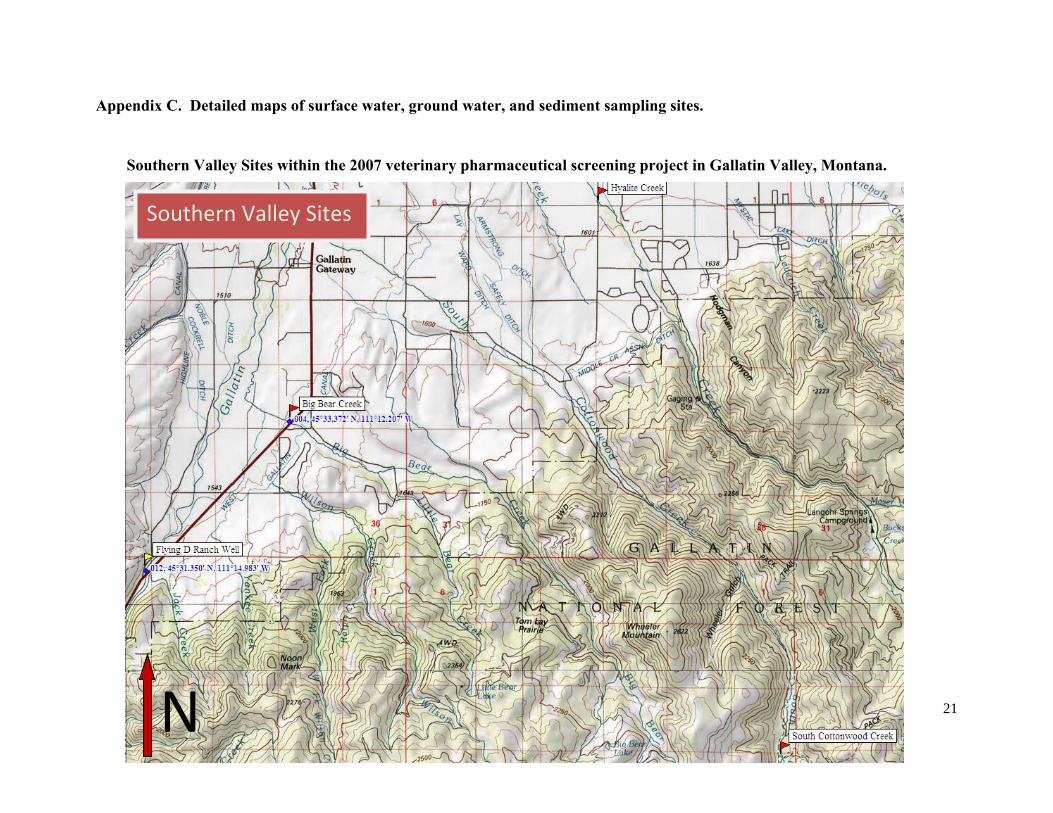
Figure 1 illustrates both surface water and ground water sampling sites throughout Gallatin Valley. For more detailed maps of sampling sites, see Appendix C. The research team worked with NRCS field staff to select appropriate surface water sampling sites. Criteria for each site included 1) downstream of livestock confinement, feeding, grazing operations, or near agriculture/urban interface; 2) ease of access; 3) appropriate sediment sampling location at the site; and 4) consistent flow. A control site was selected from a local headwaters stream in the Gallatin Mountains (South Cottonwood Creek). Once initial sites were selected, team members visited each location to ensure accessibility and obtain GPS coordinates and site photos.
Most ground water sample sites were existing wells within the GLWQD monitoring network. However, three wells (Bear Creek, Amsterdam, and Churchill) were private domestic wells. Ground water wells were selected within close proximity to surface water sites. As mentioned previously, the research team worked in coordination with MBMG on Gallatin Valley wells selected for screening from the statewide network for ground water sampling site selection. Additional well selection criteria included 1) shallow depth to water; 2) direction of ground water flow in relationship to upland land use activities and 3) ease of access. The 26 sites from the 2007 NRCS-CIG pharmaceutical sampling project are identified in Table 2.
8
Figure 1. 2007 veterinary pharmaceutical surface and ground water sampling sites for Gallatin Valley, MT.
9
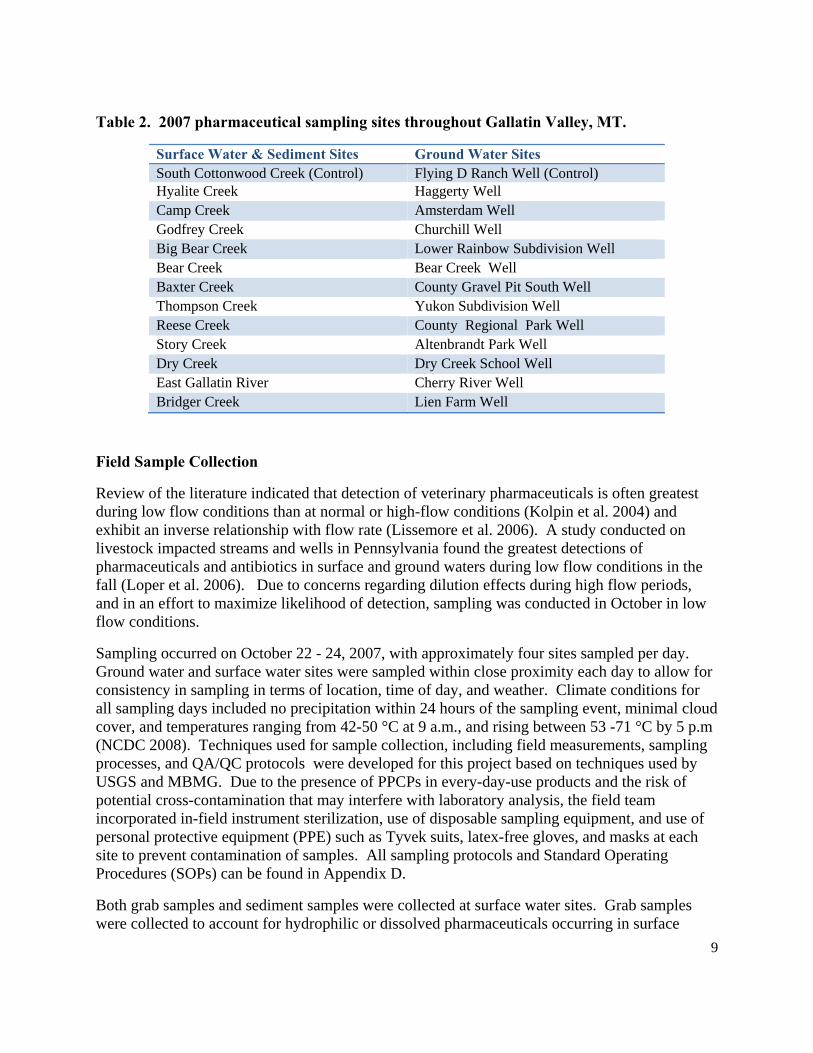
Table 2. 2007 pharmaceutical sampling sites throughout Gallatin Valley, MT.
Surface Water & Sediment Sites Ground Water Sites South Cottonwood Creek (Control) Flying D Ranch Well (Control) Hyalite Creek Haggerty Well Camp Creek Amsterdam Well Godfrey Creek Churchill Well Big Bear Creek Lower Rainbow Subdivision Well Bear Creek Bear Creek Well Baxter Creek County Gravel Pit South Well Thompson Creek Yukon Subdivision Well Reese Creek County Regional Park Well Story Creek Altenbrandt Park Well Dry Creek Dry Creek School Well East Gallatin River Cherry River Well Bridger Creek Lien Farm Well
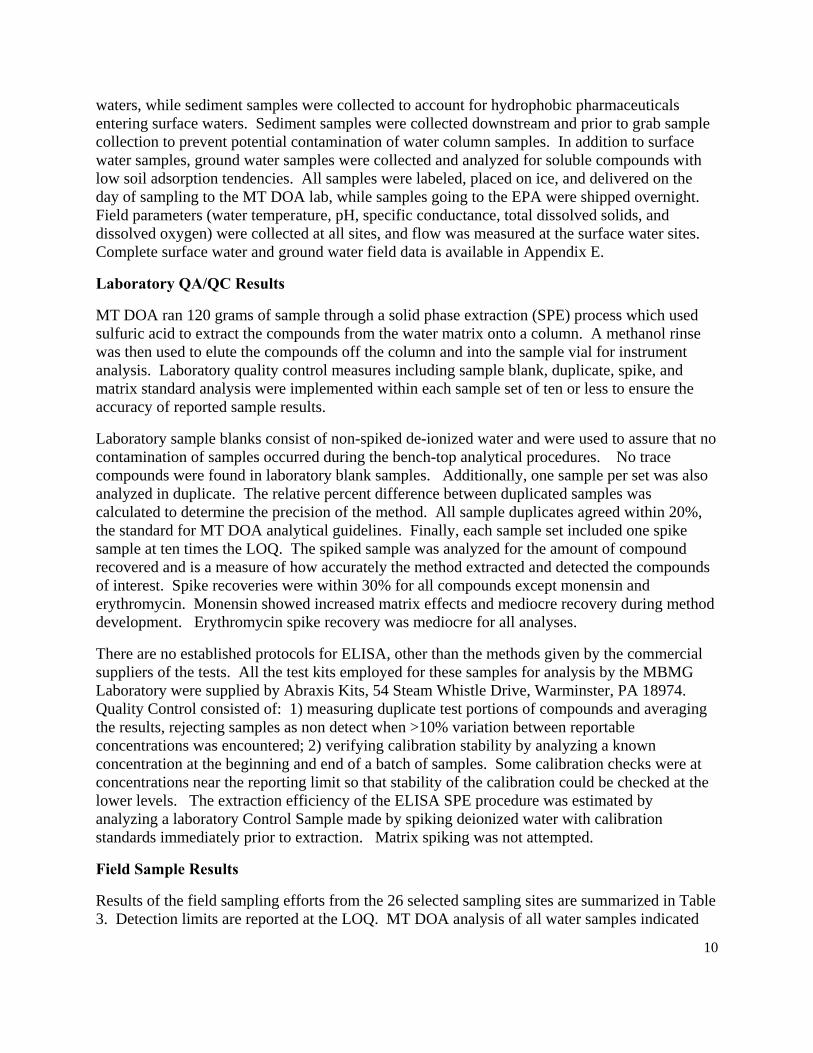
Field Sample Collection
Review of the literature indicated that detection of veterinary pharmaceuticals is often greatest during low flow conditions than at normal or high-flow conditions (Kolpin et al. 2004) and exhibit an inverse relationship with flow rate (Lissemore et al. 2006). A study conducted on livestock impacted streams and wells in Pennsylvania found the greatest detections of pharmaceuticals and antibiotics in surface and ground waters during low flow conditions in the fall (Loper et al. 2006). Due to concerns regarding dilution effects during high flow periods, and in an effort to maximize likelihood of detection, sampling was conducted in October in low flow conditions.
Sampling occurred on October 22 - 24, 2007, with approximately four sites sampled per day. Ground water and surface water sites were sampled within close proximity each day to allow for consistency in sampling in terms of location, time of day, and weather. Climate conditions for all sampling days included no precipitation within 24 hours of the sampling event, minimal cloud cover, and temperatures ranging from 42-50 °C at 9 a.m., and rising between 53 -71 °C by 5 p.m (NCDC 2008). Techniques used for sample collection, including field measurements, sampling processes, and QA/QC protocols were developed for this project based on techniques used by USGS and MBMG. Due to the presence of PPCPs in every-day-use products and the risk of potential cross-contamination that may interfere with laboratory analysis, the field team incorporated in-field instrument sterilization, use of disposable sampling equipment, and use of personal protective equipment (PPE) such as Tyvek suits, latex-free gloves, and masks at each site to prevent contamination of samples. All sampling protocols and Standard Operating Procedures (SOPs) can be found in Appendix D.
Both grab samples and sediment samples were collected at surface water sites. Grab samples were collected to account for hydrophilic or dissolved pharmaceuticals occurring in surface
10
waters, while sediment samples were collected to account for hydrophobic pharmaceuticals entering surface waters. Sediment samples were collected downstream and prior to grab sample collection to prevent potential contamination of water column samples. In addition to surface water samples, ground water samples were collected and analyzed for soluble compounds with low soil adsorption tendencies. All samples were labeled, placed on ice, and delivered on the day of sampling to the MT DOA lab, while samples going to the EPA were shipped overnight. Field parameters (water temperature, pH, specific conductance, total dissolved solids, and dissolved oxygen) were collected at all sites, and flow was measured at the surface water sites. Complete surface water and ground water field data is available in Appendix E.
Laboratory QA/QC Results
MT DOA ran 120 grams of sample through a solid phase extraction (SPE) process which used sulfuric acid to extract the compounds from the water matrix onto a column. A methanol rinse was then used to elute the compounds off the column and into the sample vial for instrument analysis. Laboratory quality control measures including sample blank, duplicate, spike, and matrix standard analysis were implemented within each sample set of ten or less to ensure the accuracy of reported sample results.
Laboratory sample blanks consist of non-spiked de-ionized water and were used to assure that no contamination of samples occurred during the bench-top analytical procedures. No trace compounds were found in laboratory blank samples. Additionally, one sample per set was also analyzed in duplicate. The relative percent difference between duplicated samples was calculated to determine the precision of the method. All sample duplicates agreed within 20%, the standard for MT DOA analytical guidelines. Finally, each sample set included one spike sample at ten times the LOQ. The spiked sample was analyzed for the amount of compound recovered and is a measure of how accurately the method extracted and detected the compounds of interest. Spike recoveries were within 30% for all compounds except monensin and erythromycin. Monensin showed increased matrix effects and mediocre recovery during method development. Erythromycin spike recovery was mediocre for all analyses.
There are no established protocols for ELISA, other than the methods given by the commercial suppliers of the tests. All the test kits employed for these samples for analysis by the MBMG Laboratory were supplied by Abraxis Kits, 54 Steam Whistle Drive, Warminster, PA 18974. Quality Control consisted of: 1) measuring duplicate test portions of compounds and averaging the results, rejecting samples as non detect when >10% variation between reportable concentrations was encountered; 2) verifying calibration stability by analyzing a known concentration at the beginning and end of a batch of samples. Some calibration checks were at concentrations near the reporting limit so that stability of the calibration could be checked at the lower levels. The extraction efficiency of the ELISA SPE procedure was estimated by analyzing a laboratory Control Sample made by spiking deionized water with calibration standards immediately prior to extraction. Matrix spiking was not attempted.
Field Sample Results
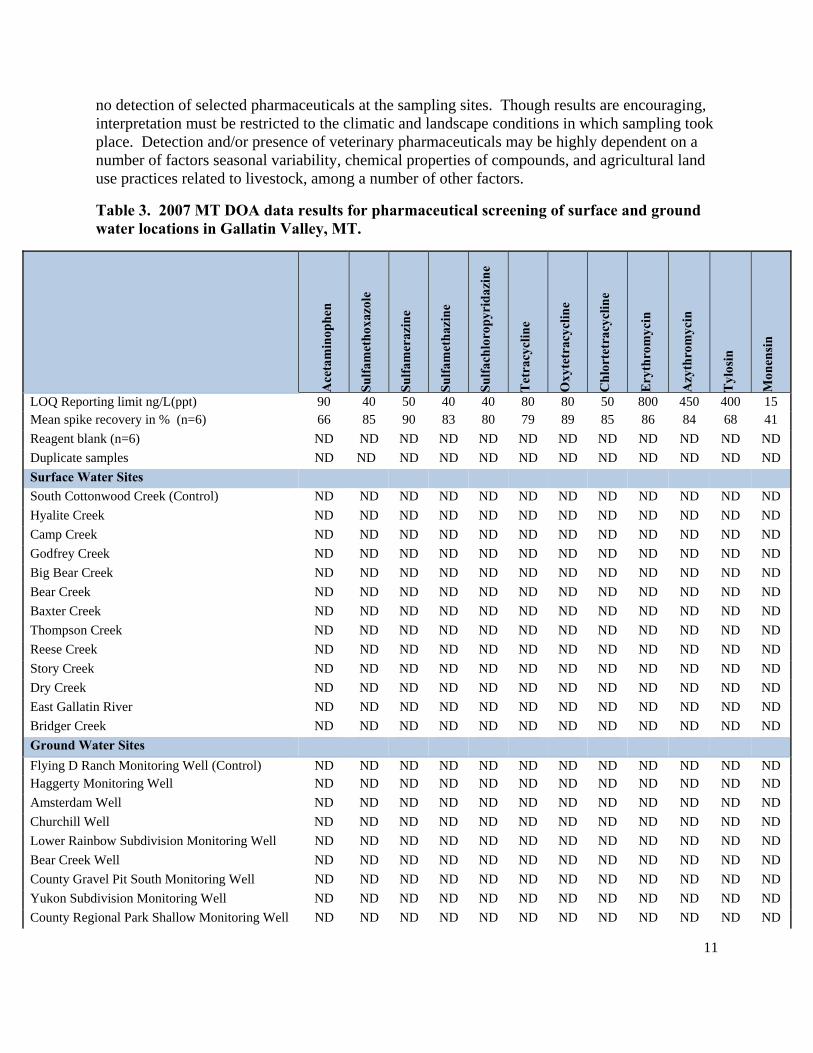
Results of the field sampling efforts from the 26 selected sampling sites are summarized in Table 3. Detection limits are reported at the LOQ. MT DOA analysis of all water samples indicated
11
no detection of selected pharmaceuticals at the sampling sites. Though results are encouraging, interpretation must be restricted to the climatic and landscape conditions in which sampling took place. Detection and/or presence of veterinary pharmaceuticals may be highly dependent on a number of factors seasonal variability, chemical properties of compounds, and agricultural land use practices related to livestock, among a number of other factors.
Table 3. 2007 MT DOA data results for pharmaceutical screening of surface and ground water locations in Gallatin Valley, MT.
Ace
tam
inop
hen
Sulfa
met
hoxa
zole
Sulfa
mer
azin
e
Sulfa
met
hazi
ne
Sulfa
chlo
ropy
rida
zine
Tet
racy
clin
e
Oxy
tetr
acyc
line
Chl
orte
trac
yclin
e
Ery
thro
myc
in
Azy
thro
myc
in
Tyl
osin
Mon
ensi
n
LOQ Reporting limit ng/L(ppt) 90 40 50 40 40 80 80 50 800 450 400 15 Mean spike recovery in % (n=6) 66 85 90 83 80 79 89 85 86 84 68 41 Reagent blank (n=6) ND ND ND ND ND ND ND ND ND ND ND ND Duplicate samples ND ND ND ND ND ND ND ND ND ND ND ND Surface Water Sites South Cottonwood Creek (Control) ND ND ND ND ND ND ND ND ND ND ND ND Hyalite Creek ND ND ND ND ND ND ND ND ND ND ND ND Camp Creek ND ND ND ND ND ND ND ND ND ND ND ND Godfrey Creek ND ND ND ND ND ND ND ND ND ND ND ND Big Bear Creek ND ND ND ND ND ND ND ND ND ND ND ND Bear Creek ND ND ND ND ND ND ND ND ND ND ND ND Baxter Creek ND ND ND ND ND ND ND ND ND ND ND ND Thompson Creek ND ND ND ND ND ND ND ND ND ND ND ND Reese Creek ND ND ND ND ND ND ND ND ND ND ND ND Story Creek ND ND ND ND ND ND ND ND ND ND ND ND Dry Creek ND ND ND ND ND ND ND ND ND ND ND ND East Gallatin River ND ND ND ND ND ND ND ND ND ND ND ND Bridger Creek ND ND ND ND ND ND ND ND ND ND ND ND Ground Water Sites Flying D Ranch Monitoring Well (Control) ND ND ND ND ND ND ND ND ND ND ND ND Haggerty Monitoring Well ND ND ND ND ND ND ND ND ND ND ND ND Amsterdam Well ND ND ND ND ND ND ND ND ND ND ND ND Churchill Well ND ND ND ND ND ND ND ND ND ND ND ND Lower Rainbow Subdivision Monitoring Well ND ND ND ND ND ND ND ND ND ND ND ND Bear Creek Well ND ND ND ND ND ND ND ND ND ND ND ND County Gravel Pit South Monitoring Well ND ND ND ND ND ND ND ND ND ND ND ND Yukon Subdivision Monitoring Well ND ND ND ND ND ND ND ND ND ND ND ND County Regional Park Shallow Monitoring Well ND ND ND ND ND ND ND ND ND ND ND ND
12
Altenbrandt Park Monitoring Well ND ND ND ND ND ND ND ND ND ND ND ND Dry Creek School Monitoring Well ND ND ND ND ND ND ND ND ND ND ND ND Cherry River Shallow Monitoring Well ND ND ND ND ND ND ND ND ND ND ND ND Lien Monitoring Well ND ND ND ND ND ND ND ND ND ND ND ND
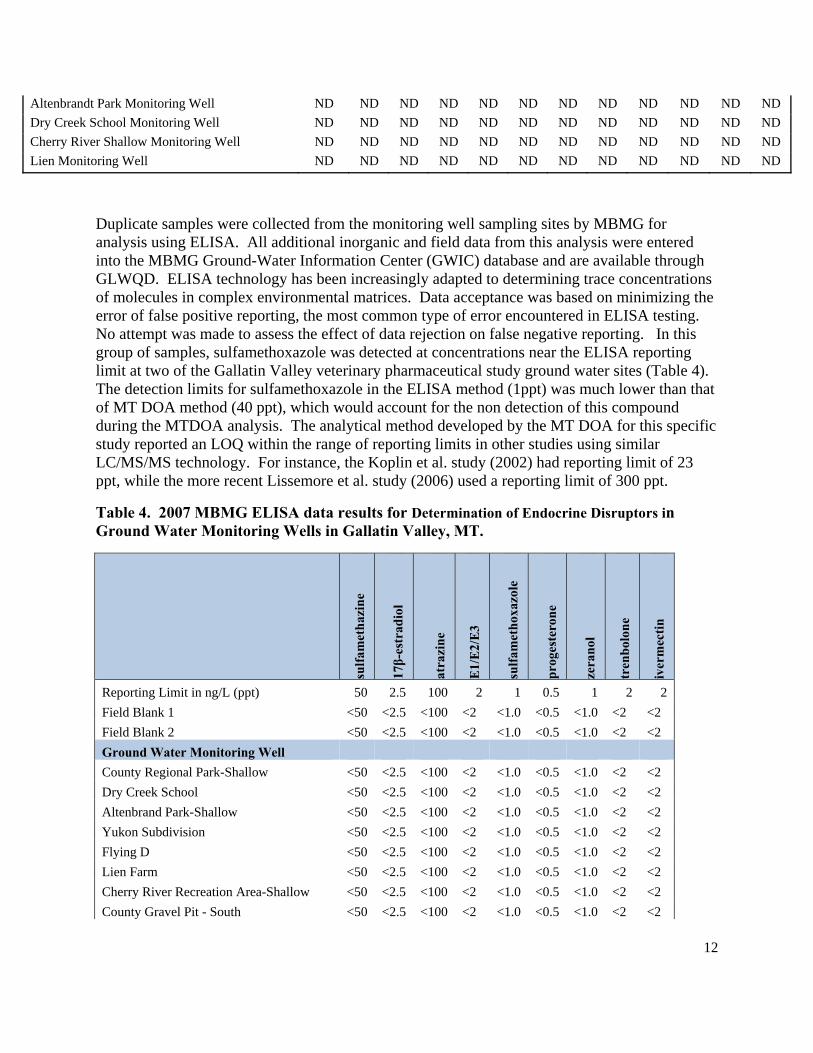
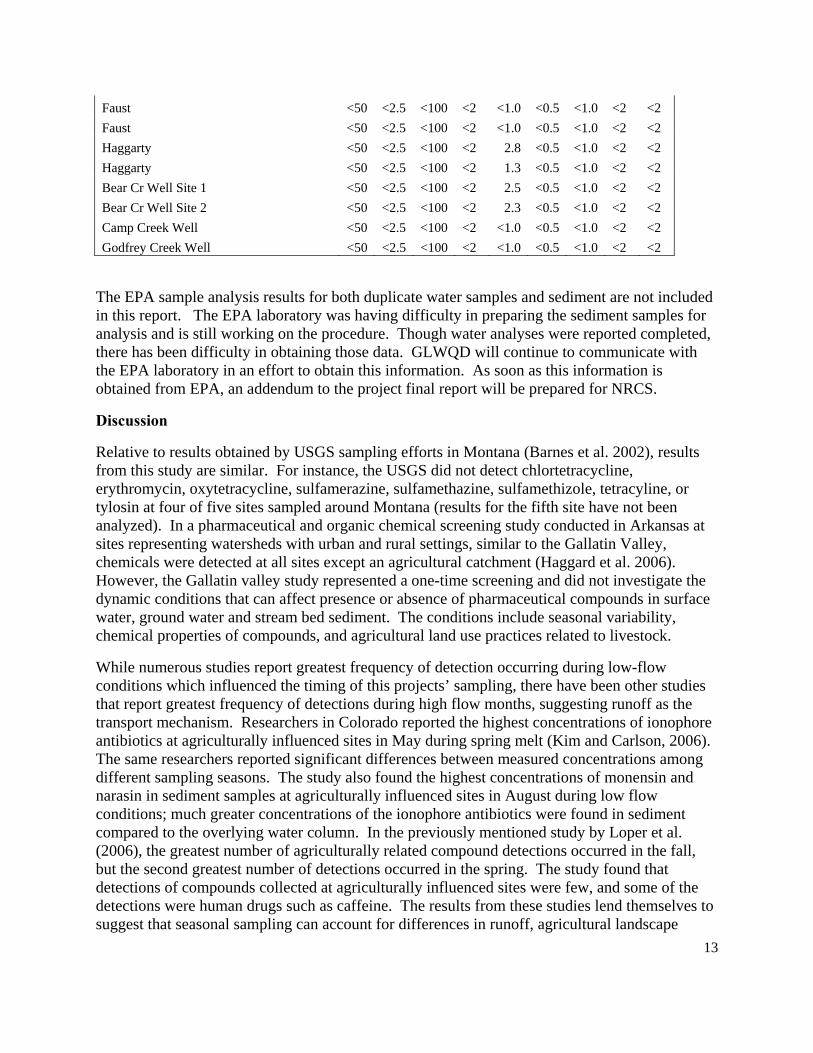
Duplicate samples were collected from the monitoring well sampling sites by MBMG for analysis using ELISA. All additional inorganic and field data from this analysis were entered into the MBMG Ground-Water Information Center (GWIC) database and are available through GLWQD. ELISA technology has been increasingly adapted to determining trace concentrations of molecules in complex environmental matrices. Data acceptance was based on minimizing the error of false positive reporting, the most common type of error encountered in ELISA testing. No attempt was made to assess the effect of data rejection on false negative reporting. In this group of samples, sulfamethoxazole was detected at concentrations near the ELISA reporting limit at two of the Gallatin Valley veterinary pharmaceutical study ground water sites (Table 4). The detection limits for sulfamethoxazole in the ELISA method (1ppt) was much lower than that of MT DOA method (40 ppt), which would account for the non detection of this compound during the MTDOA analysis. The analytical method developed by the MT DOA for this specific study reported an LOQ within the range of reporting limits in other studies using similar LC/MS/MS technology. For instance, the Koplin et al. study (2002) had reporting limit of 23 ppt, while the more recent Lissemore et al. study (2006) used a reporting limit of 300 ppt.
Table 4. 2007 MBMG ELISA data results for Determination of Endocrine Disruptors in Ground Water Monitoring Wells in Gallatin Valley, MT.
sulfa
met
hazi
ne
17β-
estr
adio
l
atra
zine
E1/
E2/
E3
sulfa
met
hoxa
zole
prog
este
rone
zera
nol
tren
bolo
ne
iver
mec
tin
Reporting Limit in ng/L (ppt) 50 2.5 100 2 1 0.5 1 2 2 Field Blank 1 <50 <2.5 <100 <2 <1.0 <0.5 <1.0 <2 <2 Field Blank 2 <50 <2.5 <100 <2 <1.0 <0.5 <1.0 <2 <2 Ground Water Monitoring Well County Regional Park-Shallow <50 <2.5 <100 <2 <1.0 <0.5 <1.0 <2 <2 Dry Creek School <50 <2.5 <100 <2 <1.0 <0.5 <1.0 <2 <2 Altenbrand Park-Shallow <50 <2.5 <100 <2 <1.0 <0.5 <1.0 <2 <2 Yukon Subdivision <50 <2.5 <100 <2 <1.0 <0.5 <1.0 <2 <2 Flying D <50 <2.5 <100 <2 <1.0 <0.5 <1.0 <2 <2 Lien Farm <50 <2.5 <100 <2 <1.0 <0.5 <1.0 <2 <2 Cherry River Recreation Area-Shallow <50 <2.5 <100 <2 <1.0 <0.5 <1.0 <2 <2 County Gravel Pit - South <50 <2.5 <100 <2 <1.0 <0.5 <1.0 <2 <2
13
Faust <50 <2.5 <100 <2 <1.0 <0.5 <1.0 <2 <2 Faust <50 <2.5 <100 <2 <1.0 <0.5 <1.0 <2 <2 Haggarty <50 <2.5 <100 <2 2.8 <0.5 <1.0 <2 <2 Haggarty <50 <2.5 <100 <2 1.3 <0.5 <1.0 <2 <2 Bear Cr Well Site 1 <50 <2.5 <100 <2 2.5 <0.5 <1.0 <2 <2 Bear Cr Well Site 2 <50 <2.5 <100 <2 2.3 <0.5 <1.0 <2 <2 Camp Creek Well <50 <2.5 <100 <2 <1.0 <0.5 <1.0 <2 <2 Godfrey Creek Well <50 <2.5 <100 <2 <1.0 <0.5 <1.0 <2 <2
The EPA sample analysis results for both duplicate water samples and sediment are not included in this report. The EPA laboratory was having difficulty in preparing the sediment samples for analysis and is still working on the procedure. Though water analyses were reported completed, there has been difficulty in obtaining those data. GLWQD will continue to communicate with the EPA laboratory in an effort to obtain this information. As soon as this information is obtained from EPA, an addendum to the project final report will be prepared for NRCS.
Discussion
Relative to results obtained by USGS sampling efforts in Montana (Barnes et al. 2002), results from this study are similar. For instance, the USGS did not detect chlortetracycline, erythromycin, oxytetracycline, sulfamerazine, sulfamethazine, sulfamethizole, tetracyline, or tylosin at four of five sites sampled around Montana (results for the fifth site have not been analyzed). In a pharmaceutical and organic chemical screening study conducted in Arkansas at sites representing watersheds with urban and rural settings, similar to the Gallatin Valley, chemicals were detected at all sites except an agricultural catchment (Haggard et al. 2006). However, the Gallatin valley study represented a one-time screening and did not investigate the dynamic conditions that can affect presence or absence of pharmaceutical compounds in surface water, ground water and stream bed sediment. The conditions include seasonal variability, chemical properties of compounds, and agricultural land use practices related to livestock.
While numerous studies report greatest frequency of detection occurring during low-flow conditions which influenced the timing of this projects’ sampling, there have been other studies that report greatest frequency of detections during high flow months, suggesting runoff as the transport mechanism. Researchers in Colorado reported the highest concentrations of ionophore antibiotics at agriculturally influenced sites in May during spring melt (Kim and Carlson, 2006). The same researchers reported significant differences between measured concentrations among different sampling seasons. The study also found the highest concentrations of monensin and narasin in sediment samples at agriculturally influenced sites in August during low flow conditions; much greater concentrations of the ionophore antibiotics were found in sediment compared to the overlying water column. In the previously mentioned study by Loper et al. (2006), the greatest number of agriculturally related compound detections occurred in the fall, but the second greatest number of detections occurred in the spring. The study found that detections of compounds collected at agriculturally influenced sites were few, and some of the detections were human drugs such as caffeine. The results from these studies lend themselves to suggest that seasonal sampling can account for differences in runoff, agricultural landscape
14
practices, and differing climatic conditions, and would perhaps show the presence of the tested compounds not captured in this one time screening event such as the Gallatin valley project.
Solubility and sorption tendencies of the selected compounds can also vary greatly, which in turn may affect the ability to detect the compound in the water column. Kim and Carlson (2006) found that season and flow conditions in interaction with compound solubility can strongly influence sediment partitioning of the compounds. They reported higher sediment partitioning at low stream flow conditions, which they surmised may be due to antibiotic sorption to suspended solids which would be suspended during high flows, but not during low flows. They also reported that in the spring sampling event, monensin concentrations were approximately three times greater in the sediments than the water matrix, while salinomycin was about 500 times greater in the sediment than the water column and narasin was 100 times greater in sediment than water. Davis et al. (2006) reported that antibiotic concentrations in sediment may be as much as 100 times greater than concentrations in the water column. These studies among others indicate that sediment analysis, in conjunction with water analysis, may be critical in accurately identifying antibiotic/pharmaceutical presence in water resources. Because sampling occurred in the fall for the Gallatin Valley study, high sediment partitioning may be affecting results, though this is inconclusive and dependent upon pending sediment results.
Timing of agricultural land use practices such as manure application can also impact the occurrence of veterinary pharmaceutical compounds in soil and water resources. Dolliver and Gupta (2008) reported that in a study of leaching and runoff losses of antibiotics from land application of hog manure, during years of high snowmelt runoff accounted for almost 100% of antibiotic losses, while in years of minimal snowmelt, runoff accounted for approximately 40% of antibiotic losses. Overall they found that the majority of antibiotic loss occurred during the non-growing season, likely due to fall application of manure. From their work, one may conjecture that timing of manure application and following precipitation events may strongly influence pharmaceutical detection in surface waters. The Gallatin Valley study was a one-time screening event and does not represent typical climatic conditions in the region that could influence contaminant movement. Though persistent drought during the sampling period could have created concentrated contaminate conditions, compound movement that might occur via overland flow and deep percolation in typical climate conditions may not have occurred in 2007. Further screening during normal precipitation years may yield different results.
In addition to manure application practices, animal density within a watershed may also impact the potential hazard of pharmaceutical contamination of surface and ground waters. The study conducted in Southern Ontario by Lissemore et al. (2006) in which there were a high number of detections reported livestock densities within the watershed of 98,000 cattle, 150,000 swine, and 2.8 million poultry. The Colorado study conducted on the Poudre River reported numerous detections in the vicinity of Greeley, Colorado located in Weld County (Kim and Carlson, 2006). According to the most recently available statistics from Colorado Agricultural Statistics Service, there were approximately 585,000 head of cattle in Weld County in 2008, 33,500 hogs in 1985, and 11,500 sheep in 1986 (USDA 2008). While all these operations are unlikely to occur within the Poudre watershed, the study reported several CAFOs within the watershed and multiple lower density cattle operations. In contrast, livestock density statistics available for Gallatin County, Montana reveal much lower densities. The most recently available statistics from
15
Montana Agricultural Statistics Service report approximately 64,000 head of cattle in the county in 2008, 141,000 chickens in 1982, 4,100 hogs in 1998, and 29,000 sheep in 2008 (USDA 2008). It is possible that the livestock densities within Gallatin Valley are lower than many studies reporting veterinary pharmaceutical detections.
Compounds selected in this study were chosen, in part, because of the reported frequency in which they have been detected in other agriculturally influenced watersheds. A number of factors, individually or in concurrence, may have contributed to the lack of pharmaceutical detection in Gallatin Valley water resources. One possibility is that current animal waste management methods employed in the valley are adequately preventing pharmaceuticals from entering surface and ground water resources. Another possibility is that animal densities within the valley are lower than those situations in which detections are reported, such that the risk of contamination is low. However, most studies lack information regarding animal densities and spatial relationships relative to the sampling site and information regarding the likelihood of detections based on animal demographics is limited. A third explanation for the lack of detections is that the transport mechanism of pharmaceuticals within the valley is primarily overland flow, possibly resulting from snow melt. If this is the case, a fall sampling effort may have missed any pulses of pharmaceuticals through surface waters, or compounds are residing in the sediment. Other factors influencing pharmaceutical detection include physical and chemical properties of the water body of interest. Lissemore et al. (2006) found that variations in pH, along with variations in organic carbon, affected solubility of pharmaceuticals, thereby affecting elution cycles within the stream.
While an abundance of research is being conducted regarding pharmaceuticals in the environment, there is still a limited amount of information regarding transport mechanisms, animal/landscape characteristics, and stream or ground water behavior of specific compounds, making it difficult to target sampling efforts or even determine if a risk of veterinary pharmaceutical occurrence in surface and ground water resources exists. More targeted research must be implemented to gather conclusive evidence for pharmaceutical presence in surface water, ground water, and sediment resources in Gallatin Valley. Such studies may be based on current or emerging research, but focused in on the conditions specific to Gallatin Valley’s climate, landscape, and livestock agricultural practices. Based upon these aspects the following suggestions for future research can be considered:
• Seasonal sampling to determine if there are variances in high and low flow periods and compound presence in the Gallatin Valley. This could be combined with event sampling to capture potential compound mobility after rain events or irrigation events.
• A study specific to sediment and soil column sampling in areas of manure application, along with development of reliable sediment and soil analytical methods, would provide more conclusive evidence of veterinary pharmaceutical presence and persistence in the Gallatin Valley.
• Working with livestock producers to sample areas adjacent to feed lots or manure application sites would provide an alternative approach to determination if veterinary pharmaceuticals are entering surface water, ground water, and or steam
16
bed sediment resources of the valley. If compounds are detected, producers could work with researcher and managers to implement best management practices that would prevent veterinary pharmaceutical contamination of local water and soil resources.
Conclusion
Results of this study indicate no detection of pharmaceutical compounds in selected surface and ground water sites in the Gallatin Valley, with the exception of low level detection of sulfamethoxazole at 3 ground water sites via the MBMG ELISA analysis, and may suggest that current waste management practices are effectively preventing veterinary pharmaceutical contamination during low flow periods. These finding are similar to USGS findings in Godfrey Creek in 2000 and studies in other agricultural influenced watersheds, yet contradictory to studies which suggest veterinary pharmaceuticals are entering water resources. The first step in conclusively determining absence or presence of these compounds in Gallatin Valley may be a seasonal study in which sampling occurs under a range of flow and climatic conditions. Complimentary to this effort would be emphasis on method development and analysis of stream-bed sediment samples, or on-farm specific screening projects. The lack of positive results from the fall 2007 sampling events currently precludes the need for development of further waste management techniques and standards.
Though detection of pharmaceutical compounds in selected surface water and ground water sites in Gallatin Valley is an indication that the selected compounds may not be affecting local water resources, education about the potential for veterinary pharmaceutical contamination in water resources is still necessary to maintain good water quality for agricultural and human use. As a result of this study, several outreach opportunities enabled the research team to present the objectives of the study and discuss the research methods used for the analysis. In all, over fifty agricultural and environmental professionals were presented with information pertaining to the study. In addition a lecture was developed on the topic for two undergraduate courses within the MSU Land Resources and Environmental Sciences Department.
The study design and deliverables represent an innovative and timely approach to addressing an emerging environmental concern and developing readily available veterinary pharmaceutical analysis methods. Sampling protocols incorporate research findings from other institutions and agencies, and were adapted to represent the in-field standards and techniques performed by the research team. In addition, a LC/MS/MS analysis method developed by the MT DOA lab and an ELISA method developed by the MBMG Laboratory can provide other projects with reliable results at the lowest detection limits and most competitive costs known to date. Studies surrounding veterinary pharmaceutical presence in water resources of Montana, and those throughout the nation, will continue to increase to fill the existing knowledge gaps. The outputs of this study will serve as valuable resources to future efforts pertaining to detection of pharmaceutical compounds in water.
17
References:
Balter, M. 1999. Scientific cross-claims fly in continuing beef war. Science 284:1453-1455.
Barnes, K. K., D. W. Kolpin, M. T. Meyer, E. M. Thurman, E. T. Furlong, S. D. Zaugg, and L. B. Barber. U.S. Geological Survey, 2002. Water-quality data for pharmaceuticals, hormones, and other organic wastewater contaminants (OWC) in U.S. streams, 1999- 2000. Open-File Report 02-94.
Davis, J.G., C.C. Truman, S.C. Kim, J.C. Ascough, and K. Carlson. 2006. Antibiotic transport via runoff and soil loss. J. Environ. Qual. 35:2250-2260.
Dolliver, Holly and Satish Gupta. 2008. Antibiotic losses in leaching and surface runoff from manure-amended agricultural land. J. Environ. Qual. 37:1227-1237.
Haggard, Brian E., Joel M. Galloway, W. Reed Green, and Michael T. Meyer. 2006. Pharmaceuticals and other organic chemicals in selected north-central and northwestern Arkansas streams. J. Environ. Qual. 35:1078-1087.
Hinkle, S.R., R.J. Weick, J.M. Johnson, J.D. Cahill, S.B. Smith, and B.J. Rich. 2005. Organic waste water compounds, pharmaceuticals, and coliphage in ground water receiving discharge from onsite wastewater treatment systems near La Pine, Oregon: Occurrence and implications for transport. U.S.G.S. Scientific Inv. Report 2005-5055, 98 p.
Hirsch, R. T. Ternes, K. Haberer and K.-L. Kratz. 1999. Occurrence of antibiotics in the aquatic environment, Sci. Total Environ. 225, pp. 109–118.
Kidd, K., P. Blanchfield, K. Mills, V. Palace, R. Evans, J. Lazorchak, and R. Flick. 2007. Collapse of a fish population after exposure to a synthetic estrogen. In Proc. The National Academy of Sciences of the United States of America. Published online on May 21, 2007, 10.1073/pnas.0609568104.
Kim, Sung-Chul, and Kenneth Carlson. 2006. Occurrence of ionophore antibiotics in water and sediments of a mixed-landscape watershed. Water Res. 40: 2549-2560.
Koplin, Dana W., Edward T. Furlong, Michael T. Meyer, E. Michael Thurman, Steven D. Zaugg, Larry B. Barber, and Herbert T. Buxton. 2002. Pharmaceuticals, hormones, and other wastewater contaminants in U.S. streams, 1999-2000: A national reconnaissance. Environ. Sci. Technol. 36:1202-1211.
Koplin D., M. Skopec, Edward T. Furlong, Michael T. Meyer, Steven D. Zaugg. 2004. Urban contribution of pharmaceuticals and other organic wastewater contaminants to stream during differing flow conditions, Sci Tot Environ. 32, 119-130.
Kumar, Kuldip, Satish C. Gupta, Yogesh Chander, and Ashok K. Singh. 2005. Antibiotic use in agriculture and its impact on the terrestrial environment. Advances in Agronomy 87: 1- 54.
18
Lissemore, Linda, Chunyan Hao, Paul Yang, Paul K. Sibley, Scott Mabury, and Keith R. Solomon. 2006. An exposure assessment for selected pharmaceuticals within a watershed in southern Ontario. Chemosphere 64: 717-729.
Loper, Connie A., J. Kent Crawford, Kim L. Otto, Rhonda L. Manning, Michael T. Meyer, and Edward T. Furlong. 2006. Concentrations of selected pharmaceuticals and antibiotics in south-central Pennsylvania waters, March 2006 through September 2006. USGS Data Series 300. Available at http://pubs.usgs/ds/300/ (verified 19 Aug. 2008).
Miller, Kathleen and Joseph Meek. 2005. Pharmaceuticals, personal care products, endocrine disruptors (PPCPs) and microbial indicators of fecal contamination in ground water in the Helena Valley, Montana, USA. In Proc. Nat. Ground Water Assoc. Int. Conf. on Pharmaceuticals and Endocrine Disrupting Chemicals in Water, 5th, Costa Mesa, CA, Mar. 13-15 2006.
National Climatic Data Center. 2008. Radar data inventories. Available online: http://www4.ncdc.noaa.gov/cgi-win/wwcgi.dll?WWDI~getstate~USA
Orlando, Edward F., Alan S. Kolok, Gerry A. Binzcik, Jennifer L. Gates, Megan K. Horton, Christy S. Lambright, L. Earl Gra, Jr., Ana M. Soto and Louis J. Guillette, Jr. 2004. Endocrine-disrupting effects of cattle feedlot effluent on an aquatic sentinel species, the fathead minnow. Env. Health Persp. 1 March.
Sanders, S. M., P. Srivastava, Y. Feng, J. H. Dane, J. Basile and M. O. Barnett. 2008. Sorption of the Veterinary Antimicrobials Sulfadimethoxine and Ormetoprim in Soil. J. Environ. Qual. 37:1510-1518.
U.S. Department of Agriculture – Natural Resource Conservation Service. 2006. Conservation Innovation Grants Fiscal Year 2006 Announcement of Program Funding. CFDA Number: 10.912.
U.S. Department of Agriculture – National Agricultural Statics Service. 2008. Census of Agriculture. Available online: http://www.agcensus.usda.gov/index.asp
19
Appendix A. Expense summary for project. Does not include non-federal in-kin or cash match allowances.
Description ExpensesPersonnel Services Salary 20,447.36Benefits 8,508.86Total 28,956.22Contractual Services Lab - MT DOA Method Development 8,000.00Lab - MT DOA Analytical Testing 5,550.00Campus Services 4,299.00Total 17,849.00Supplies Sampling Supplies 2,200.98Computer Accessories 925.00Total 3,125.98Travel In-state 544.95Out-of-state 837.99Registration Fees (Conf) 425.00Total 1,807.94TOTAL PROJECT EXPENSES $51,739.14
20
Appendix B. 2007 complete pharmaceutical compound list for Gallatin Valley, Montana.
Family - Sulfonamides Compounds Use Water • livestock – antibiotics and growth promoter • human - antibiotics • mobile in soil and may be found in ground water
Sulfamethazine Ag/Human GW/SW1/
Sulfamethoxazole Human GW/SW Sulfamerazine Ag/Human GW/SW Sulfachlorophridazine Ag/Human GW/SW
Family - Tetracyclines • livestock – antibiotic and growth promoter • human - antibiotics • adsorbs on clay, may be in sediments • moderate solubility in water • photosensitive • matrix effects
Tetracycline Ag/Human SW Chlortetracycline (swine) Ag/Human SW Oxytetracycline Ag/Human SW
Family - Macrolides • adsorbs on clay, may be in sediments • low mobility in soil • degrades rapidly in soil • found in cattle manure – stable until used as fertilizer
Tylosin - livestock – growth promoters Ag SW Erythromycin - antibiotic for both livestock and h
Ag/Human SW Azithromycin - antibiotic for human use, some livestock
Human SW
Family - Ionophores • growth promoter Monensin Ag SW
Miscellaneous Pain killer in humans and livestock (primarily equine) Acetaminophen (Tylenol) Ag/Human GW/SW
1/GW=ground water; SW=surface water
21
Appendix C. Detailed maps of surface water, ground water, and sediment sampling sites.
Southern Valley Sites
N
Southern Valley Sites within the 2007 veterinary pharmaceutical screening project in Gallatin Valley, Montana.
22
Eastern Valley Sites
N
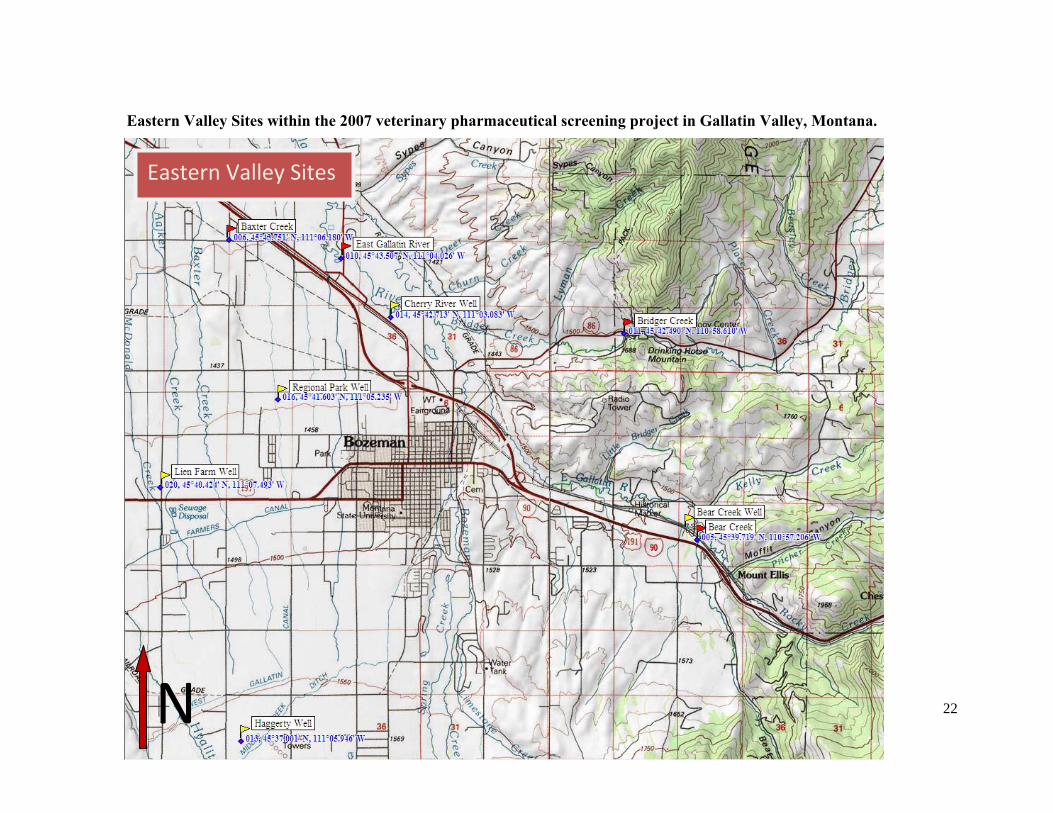
Eastern Valley Sites within the 2007 veterinary pharmaceutical screening project in Gallatin Valley, Montana.
23
Western Valley Sites
N
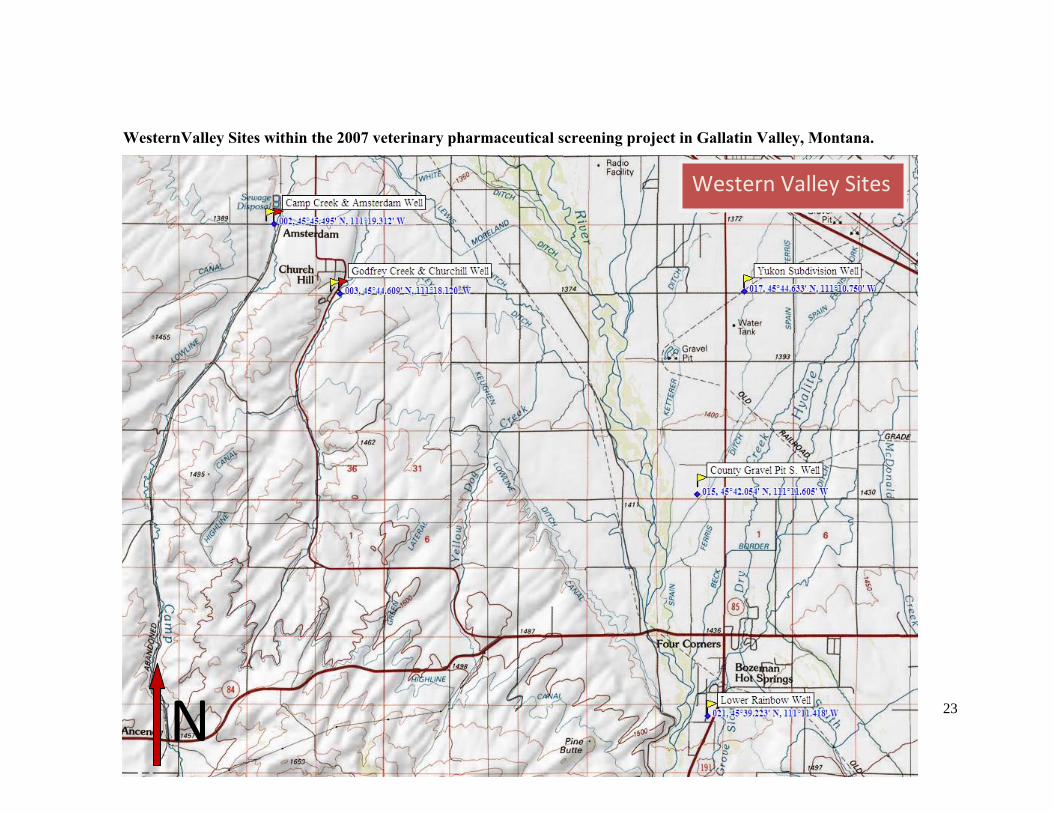
WesternValley Sites within the 2007 veterinary pharmaceutical screening project in Gallatin Valley, Montana.
24
Northern Valley Sites
N
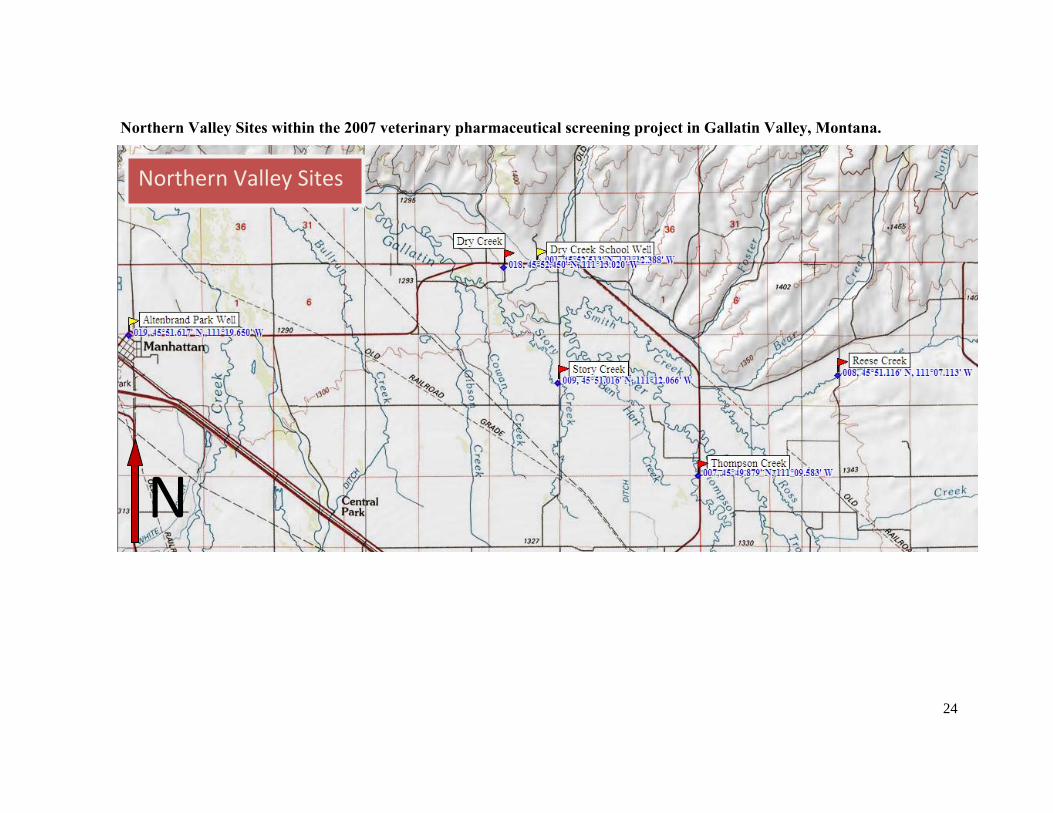
Northern Valley Sites within the 2007 veterinary pharmaceutical screening project in Gallatin Valley, Montana.
25
Appendix D. Surface water, ground water, and sediment sampling protocols.
Surface Water Sample Collection Protocol for Analysis of Pharmaceuticals and Personal Care Products (PPCPs)
Prepared by Suzanna Carrithers, Montana State University Extension Water Quality Program
A. PURPOSE The purpose is to obtain a representative sample of surface water from selected sites that are potentially influenced by livestock activity. The goal is to obtain a representative sample of surface water in agriculturally influenced regions for analysis of PPCPs.
B. EQUIPMENT & SUPPLIES
1. Baked, narrow-mouth, 1-liter amber glass bottles with Teflon lids. Sufficient for Montana Department of Agriculture, analysis and EPA Region 8 Laboratory, Golden, CO.
2. Water quality parameter field meters for pH, temperature, and specific conductance. 3. Marsh Mcbirney flow meter (Flo-Mate 2000) 4. Personal Protective Equipment (PPE) 5. Fiberglass measuring tape 6. Gallon-size Ziploc bags for sample containers and ice. 7. Ice and coolers
C. GENERAL
1. Identify accessible surface water locations downstream from agricultural activity for sampling.
2. Surface water sampling should be completed prior to or upstream of any other stream activity such as flow readings, water quality testing, sediment sampling, macroinvertebrate sampling, etc.
3. Surface water sampling locations should be located in straight channel with uniform flow and collected at the center of the stream.
4. Surface water samples should not be collected within a ripple, pond or downstream of a bridge if possible.
D. PRECAUTIONS
1. Put on personal protective equipment (PPE) prior to working with the sampling equipment and handling sample bottles. This includes powder free nitrile gloves, full Tyvek suit with hood and booties, and face mask.
2. Avoid the use of sunscreens, lotions, caffeine, etc. prior to the sampling event.
26
E. SAMPLE COLLECTION
1. Put on new, clean personal protective equipment (PPE). 2. Select bottles for location – All sites: 1 for MTDOA analysis, 1 for EPA Region 8
Lab analysis. QC sites: every 5th site take trip blank and duplicate samples. 3. Prepare sample bottle labels. 4. Select appropriate sample location within stream. 5. Rinse sample bottle(s) and cap(s) three times with native water. 6. Take a grab sample for streams. Submerge entire bottle in stream and turn it upright
while lifting it out of water. Ensure bottle is full and tightly secure cap. 7. Record field parameters prior to sampling event, upstream from location.
F. SAMPLE PROCESSING
1. Samples are not filtered or preserved. 2. Place label on sample bottle and cover with clear tape to secure. 3. Place bottles for each laboratory in 1-gallon zip lock bags, store in cooler on ice. 4. Do not remove PPE until samples have been placed in cooler 5. Deliver samples to MT DOA lab that afternoon and ship samples to EPA Region 8 lab the
same day as collected, via standard overnight delivery to laboratory.
G. DUPLICATES
When collecting duplicate surface water samples, all steps performed in collecting one sample are repeated. Duplicate samples should be collected immediately after filling initial sample bottle.
H. REFERENCES This protocol was developed based on modification of the following:
1. Shelton, Larry. 1997. Field Guide for Collecting Samples for Analysis of Volatile Organic Compounds in Stream Water for the National Water-Quality Assessment Program. U.S. Geological Survey Open File report 97-401. . [URL: http://pubs.er.usgs.gov/usgspubs/ofr/ofr97401 , accessed 8/2007]
2. Sando, Steve. 2007. Personal communication. U.S. Geological Survey – Montana Water Science Center.
Ground Water Sample Collection Protocol for Analysis of Pharmaceuticals and Personal Care Products (PPCPs) Prepared by Alan English, Gallatin Local Water Quality District A. PURPOSE To focus on obtaining fresh ground water samples from domestic wells and dedicated monitoring wells. The goal is to obtain a representative sample of ground water from selected wells for analysis of PPCPs.
27
B. EQUIPMENT & SUPPLIES
1. Baked, narrow-mouth, 1-liter amber glass bottles for samples submitted to the Montana Department of Agriculture laboratory, and wide mouth, 500-ml amber glass bottles for samples submitted to the EPA Region 8 Laboratory, Golden, CO.
2. Portable gasoline powered electrical generator to power well pump (monitor wells only). 3. Standard 4-inch, ½ horsepower, submersible well pump to purge and sample monitoring
wells, with 90-feet of electrical wire. 4. One-inch diameter PVC drop pipe in 10-foot lengths for well pump discharge. 5. Flow control valve assembly, drop pipe clamp, and pipe wrenches to install well water
discharge line. 6. Water-level monitoring probe (e-tape) to measure static water level and pumping water levels
in sampled wells. 7. Five-gallon plastic bucket to measure pumping rate and field water quality parameters (pH,
specific conductance, temperature). 8. Water quality parameter field meters for pH, temperature and specific conductance. 9. Disposable 2-inch diameter Teflon bailers with polypropylene rope (for hand bailing 2-inch
monitoring wells only).
C. GENERAL 1. Identify suitable domestic wells and monitoring wells for sampling. 2. For domestic wells use existing well pump and plumbing to purge and sample well. 3. For 4-inch diameter monitoring wells use portable well pumping system to purge and sample
well. 4. For 2-inch diameter monitoring wells use 2-inch disposable Teflon bailer with new
polypropylene line to purge and sample well.
D. PRECAUTIONS
1. Put on personal protective equipment (PPE) prior to working with the sampling equipment and handling sample bottles.
2. Avoid the use of sunscreens, lotions, caffeine, etc. prior to the sampling event. E. SAMPLE COLLECTION
1. Put on new, clean personal protective equipment (PPE). This should include powder free nitrile gloves, full Tyvek suit with hood and booties, and face mask.
2. Remove well cap and measure starting static water level using water-level probe. 3. For domestic wells, hook standard garden hose to outside tap closest to sample well and run
hose to 5-gallon bucket. For monitoring wells, install submersible well pump with drop pipe. Install flow control valve assembly to top of drop pipe. Hook standard garden hose to flow control valve assembly and run to 5-gallon bucket.
4. Begin pumping well, measure initial pumping rate with bucket and record initial pH, specific conductane and temperature of discharge water.
5. Record field parameters at least every five minutes. Purge well until field parameters stabilize and a minimum of three well-volumes of water have been pumped from the well (typically 30 minutes at 10-20 gallons per minute). Check flow rate at least once during well purging, and at end of purging to verify flow rate.
28
6. Disconnect garden hose from sampling tap. Flush tap and reduce flow as much as practical (do not sample from garden hose).
F. SAMPLE PROCESSING
1. Fill sample bottles, cap, check for leaking cap. 2. Samples are not filtered. 3. No preservatives are added to sample bottles. 4. Place filled sample bottles for each laboratory in 1-gallon zip lock bags, store in cooler on
ice. 5. Do not remove PPE until samples have been placed in cooler 6. Ship samples the same day as collected, via standard overnight delivery to laboratory.
G. DUPLICATES
Duplicate ground water samples should be collected from 10-20 percent of sampling sites. Duplicate samples should be collected immediately after filling initial sample bottles. Use the same sample bottles supplied by each laboratory for duplicate samples, following the same sample processing methods.
H. REFERENCES This protocol was developed based on modification of the following:
1. Lewis, M.E. and Zaugg, S.D. (2003) Processing of Water Samples, (version 1.1, 4/03) Wastewater, pharmaceutical and antibiotic compounds. U.S. Geological Survey
Stream Bed Sediment Collection Protocol for Analysis of Pharmaceuticals and Personal Care Products (PPCPs) Prepared by Tammy Crone, Gallatin Local Water Quality District
A. PURPOSE To focus on obtaining fine-grained sediment samples from natural depositional zones of wadeable streams during low-flow conditions. The goal is to obtain a representative sample of streambed sediment in a given stream reach for analysis of PPCPs.
B. EQUIPMENT & SUPPLIES
1. Sample bottles (sterilized, wide-mouth glass jars and Teflon caps, sized for the volume required for analysis, provided by EPA Region 8 Laboratory, Golden, CO).
2. Nylon mesh, 64 micron opening, 150 mm diameter. (Spectra/Mesh Nylon, Item #145570. www.spectrumlabs.com).
3. Spoons, sterilized, disposable, individually-wrapped. (Item #88353, www.labsafety.com). 4. Disposable beakers, 600 ml (Item #17445, www.labsafety.com). 5. Heavy duty aluminum foil. 6. Gallon-size Ziploc bags for sample containers and ice.
29
C. GENERAL
1. Identify a stream reach of 100 meters in length. For multiple sites on the same stream, samples should be taken progressively from the least contaminated site to the most contaminated site.
2. Water sampling activities (grab samples, stream flow measurements, etc.) should be conducted either after the sediment sampling or downstream of all sediment sampling locations.
3. Sediment samples should be collected from depositional zones (areas downstream of rocks, boulders, shallow waters near streambanks, etc.).
4. Samples should be collected from 10 depositional zones within the stream reach. These zones should include the left bank, right bank, center of the channel, and different stream depths if possible.
5. Each depositional zone must be subsampled several times. 6. The depositional zones chosen must be underwater.
D. PRECAUTIONS
1. Put on PPE prior to working with the sampling equipment. 2. Avoid collecting sediment samples near or downstream of bridges or large debris areas. 3. Avoid the use of sunscreens, lotions, caffeine, etc. prior to the sampling event.
E. SAMPLE COLLECTION
1. Put on personal protective equipment (PPE) (nitrile gloves, Tyvek suit, face mask). 2. Prior to collecting the sediment sample at each site, set-up a sample processing area (cooler,
portable table, etc.). Cover the workbench surface with heavy-duty aluminum foil. 3. Rinse sampling equipment (spoon, nylon membrane, beaker) with native water from the site. 4. Wade to the depositional zone, approaching from downstream. 5. Using the spoon, remove the top layer of fine-sediment carefully. 6. Avoid losing the fines when bringing the sample to the surface. 7. Composite the material in the beaker. 8. Repeat this process for a total of 10 times from the depositional zones within the stream
reach.
F. SAMPLE PROCESSING
1. Homogenize the composite sample by mixing with the spoon. 2. Fill the sample bottle approximately 1/3 full of native water from the site. 3. Add an aliquot (1-2 tablespoons) of the homogenized sample to a 64-micron mesh nylon
membrane. 4. Draw up the corners of the membrane to form a bag. 5. Dip, shake, and squeeze into the sample bottle. Continually dipping and squeezing will help
separate the fines. Do not stretch or damage the membrane during this process. 6. Sieve until the sediment is approximately 2 cm deep in the sample bottle. 7. Secure the cap on the sample bottle, place in a Ziplock bag, pack on ice, and transfer to
laboratory for analysis. 8. Discard nylon membrane, beaker, spoon, and PPE.
30
G. DUPLICATES
When collecting duplicate sediment samples, all steps performed in collecting one sediment sample shall be repeated so that two sediment samples have been collected.
H. REFERENCES This protocol was derived from the following:
1. Shelton, L.R. and Capel, P.D. (1994) Guidelines for Collecting and Processing Samples of Stream Bed Sediment for Analysis of Trace Elements and Organic Contaminants for the National Water-Quality Assessment Program: U.S. Geological Survey Open-File Report 94-458, 26 pgs. [URL: http://ca.water.usgs.gov/pnsp/pest.rep/bs-t.html, accessed 9/21/2007]
2. Alberta Environment. (March 2006) Aquatic Ecosystems Field Sampling Protocols, 135 pgs. [URL: http://environment.gov.ab.ca/info/home.asp
31
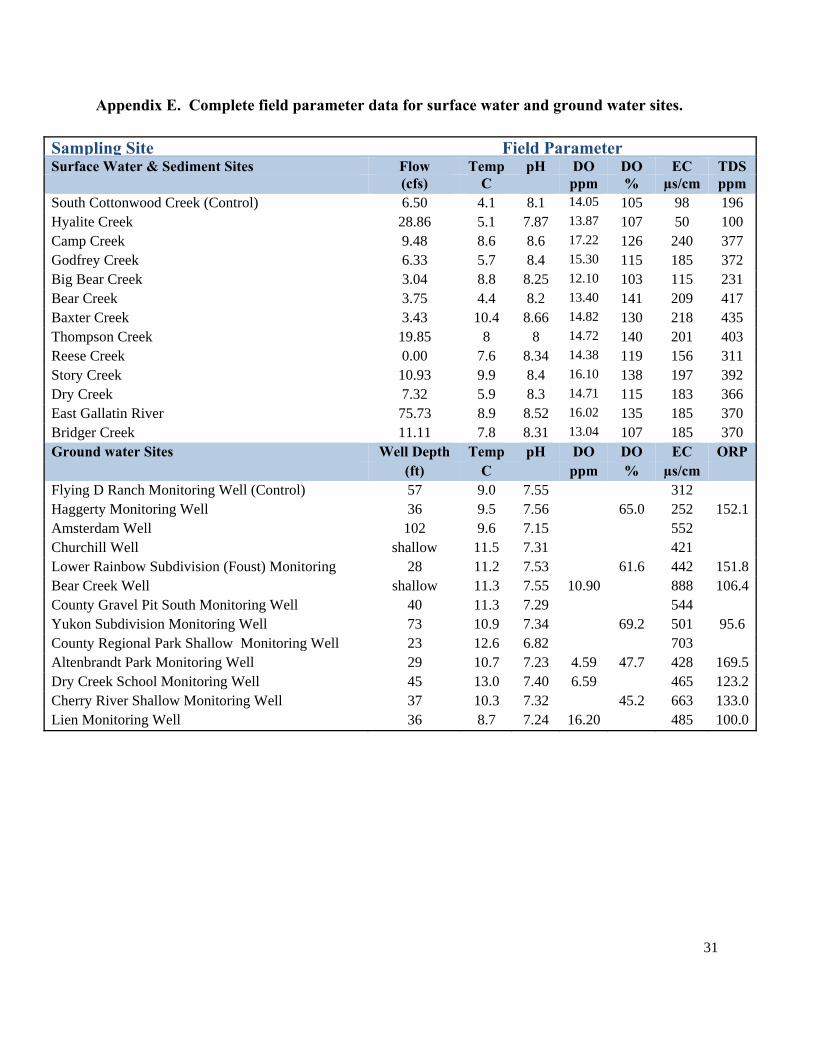
Appendix E. Complete field parameter data for surface water and ground water sites.
Sampling Site Field Parameter Surface Water & Sediment Sites Flow Temp pH DO DO EC TDS (cfs) C ppm % µs/cm ppm South Cottonwood Creek (Control) 6.50 4.1 8.1 14.05 105 98 196 Hyalite Creek 28.86 5.1 7.87 13.87 107 50 100 Camp Creek 9.48 8.6 8.6 17.22 126 240 377 Godfrey Creek 6.33 5.7 8.4 15.30 115 185 372 Big Bear Creek 3.04 8.8 8.25 12.10 103 115 231 Bear Creek 3.75 4.4 8.2 13.40 141 209 417 Baxter Creek 3.43 10.4 8.66 14.82 130 218 435 Thompson Creek 19.85 8 8 14.72 140 201 403 Reese Creek 0.00 7.6 8.34 14.38 119 156 311 Story Creek 10.93 9.9 8.4 16.10 138 197 392 Dry Creek 7.32 5.9 8.3 14.71 115 183 366 East Gallatin River 75.73 8.9 8.52 16.02 135 185 370 Bridger Creek 11.11 7.8 8.31 13.04 107 185 370 Ground water Sites Well Depth Temp pH DO DO EC ORP (ft) C ppm % µs/cm Flying D Ranch Monitoring Well (Control) 57 9.0 7.55 312 Haggerty Monitoring Well 36 9.5 7.56 65.0 252 152.1Amsterdam Well 102 9.6 7.15 552 Churchill Well shallow 11.5 7.31 421 Lower Rainbow Subdivision (Foust) Monitoring 28 11.2 7.53 61.6 442 151.8Bear Creek Well shallow 11.3 7.55 10.90 888 106.4County Gravel Pit South Monitoring Well 40 11.3 7.29 544 Yukon Subdivision Monitoring Well 73 10.9 7.34 69.2 501 95.6 County Regional Park Shallow Monitoring Well 23 12.6 6.82 703 Altenbrandt Park Monitoring Well 29 10.7 7.23 4.59 47.7 428 169.5Dry Creek School Monitoring Well 45 13.0 7.40 6.59 465 123.2Cherry River Shallow Monitoring Well 37 10.3 7.32 45.2 663 133.0Lien Monitoring Well 36 8.7 7.24 16.20 485 100.0