ph and salt-induced reversible aggregation of nonionic synthetic glycolipid vesicles
TRANSCRIPT

Colloids and Surfaces
A: Physicochemical and Engineering Aspects 207 (2002) 215–221
pH and salt-induced reversible aggregation of nonionicsynthetic glycolipid vesicles
Li-Qiang Zheng a,*, Ling-ling Shui a, Qiang Shen a, Gan-Zuo Li a,Teruhiko Baba b, Hiroyuki Minamikawa b, Masakatsu Hato b
a Key Laboratory of Colloid and Interface Chemistry of State Education Ministry, Shandong Uni�ersity, Jinan 250100, Chinab Surface Engineering Laboratory, Department of Polymer Physics, National Institute of Materials and Chemical Research,
1-1 Higashi, Tsukuba, Ibaraki 305-8565, Japan
Received 20 July 2001; accepted 5 March 2002
Abstract
Salt and pH can induce reversible aggregation of vesicles composed of a nonionic synthetic glycolipid, 1,3-di-o-phy-tanyl-2-o-(�-maltotriosyl) glycerol. The aggregation of the vesicles appears reversible with respect to a change in thepH value of the medium as seen from the reversible change in the turbidity. It was also found that in an acidic region(pH 4–6), the size of the aggregated vesicles are well above 1000 nm, an indication of vesicle aggregation. But in analkaline region (pH 8–10), the sizes are 110–130 nm, close to their original size of 100–110 nm, which stronglysuggests the reversible disaggregation and also confirms the lack of vesicle fusion. The �-potentials of vesicles aremeasured in the presence of NaCl with the pH changes of the vesicle suspension. It is seen that the �-potential ofvesicles changes with the pH value. The surface charges of the Mal3(Phyt)2 vesicles arise from two independentmechanisms; one is excess ‘adsorption’ of OH− ions at the vesicle–water interfaces and the other is dissociation ofhydroxyl groups in a high pH region (pH �11). The changes of the surface charges are thought to be the majorfactor which induces the aggregation and disaggregation of this nonionic glycolipid vesicle. © 2002 Elsevier ScienceB.V. All rights reserved.
Keywords: Glycolipid; Vesicle; Aggregation; Disaggregation; �-Potential; Surface charge
www.elsevier.com/locate/colsurfa
1. Introduction
Most bilayer lipids found in biological systemshave two hydrocarbon chains attached to a polargroup, which is usually a glycerol derivative. Inplants and bacteria, the dominant membrane
lipids are the glycolipids, with monosugar or dis-ugar attached to the glycerol. Lipid bilayers arethe basic building units of biological membranes.A planar membrane can curve and generate areticulum structure or curve cylindrically into mi-crotubules. Abundant biological processes involvetransformations between such bilayer structures.Glycolipids are one of the major components ofcell membranes and believed to be involved in
* Corresponding authorE-mail address: [email protected] (L.-Q. Zheng).
0927-7757/02/$ - see front matter © 2002 Elsevier Science B.V. All rights reserved.
PII: S0 927 -7757 (02 )00118 -8

L.-Q. Zheng et al. / Colloids and Surfaces A: Physicochem. Eng. Aspects 207 (2002) 215–221216
variety of physiological events [1] such as molecu-lar recognition at cell surfaces [2–5]. It is believedthat glycolipids are progressively gaining impor-tance in biology and technology [1,2,6–9].
But, to our knowledge, very few studies onglycolipid vesicle aggregation have been made sofar. Webb, Menikh, Fragata and coworkers haverecently investigated a salt-induced aggregation ofvesicles of thylakoid galactolipid digalactosyldiglyceride (DGDG) and monogalactosyl diglyce-ride (MGDG) [10–13]. Webb and coworkersfound that salt can induce the reversible aggrega-tion of DGDG vesicles and this phenomena wasexplained in terms of salt-induced change in hy-dration of the bilayer surfaces that leads to areduction of hydration repulsion [10]. Fragataand his coworkers later proposed a similar mecha-nism in which the initial step in DGDG aggrega-tion is an ion-induced decrease in interfacialpolarity [13].
In this paper, We have investigated the stabilityof the vesicles composed of a nonionic glycolipidin the presence of salt and with the changes ofpH. It was found that pH and salt can induce thereversible aggregation–disaggregation of the non-ionic glycolipid vesicles we have investigated. Themechanism of this process was been researched bymeans of the �-potential measurement. To ourknowledge, the aggregation behaviour of a non-ionic synthesized glycolipid vesicles has not beenstudied before.
2. Materials and methods
2.1. Materials
Synthetic glycolipid, 1,3-di-o-phytanyl-2-o-(�-maltotriosyl) glycerol, Mal3(Phyt)2 (Fig. 1) are the
same materials described in the previous paper[14,15]. The purity of this glycolipid has beenconfirmed to be better than 96% by thin-layerchromatography, 1H-NMR and elemental analy-sis. The glycolipid was stored as a stock solutionin CHCl3/CH3OH (2:1 by volume) at −20 °C.CHCl3 and CH3OH were purchased from Do-jindo. They were of a spectroscopic reagent gradeand were used without further purification. Waterwas prepurified with a house made purificationsystem (RO membrane, ion-exchange column and0.22 �m filter) and further purified with an ElgaUHQ unit just before experiments.
2.2. Preparation of glycolipid �esicles
Glycolipid vesicles with uniform size (110 nm indiameter) were prepared by extrusion of frozen–thawed vesicles based on the method described byMayer et al. [16].
A thin film of Mal3(Phyt)2 was formed on thewall of a test tube by removing CHCl3 in vacuumfor at least 24 h. Multilamellar vesicles were ob-tained by dispersing the dried glycolipid thin filmin pure water with vortexing and sonication for 5min in an USC-1 bath-type sonicator at 65 Woutput and at room temperature. The resultingvesicles were then frozen in liquid nitrogen andthawed in a water bath at 30 °C. The freeze–thaw cycle was usually repeated five times. Thefrozen– thawed vesicles were then extruded morethan ten times through doubly stacked polycar-bonate filters with 0.1 �m pore size (NucleoporeCorp., Pleasanton, CA) by an extruder (LipexBiomembranes Inc., Vancouver). Polycarbonatefilters were extensively washed with pure waterbeforehand in order to remove amphiphilic poly-meric materials. Most of the operations for vesiclepreparation were performed in an atmosphere ofHEPA filtered air in order to minimize dust con-tamination. The finally obtained vesicles werejudged as unilamellar vesicles by NBD-PE/dithionite method [17].
Unless otherwise noted, the final concentrationsof glycolipid in suspensions were around 0.5 mMfor both vesicle aggregation and vesicle size mea-surements and around 0.1 mM for �-potentialmeasurements, respectively.
Fig. 1. Chemical structure of the synthetic glycolipid 1,3-di-o-phytanyl-2-o-(�-maltotriosyl) glycerol (Mal3(Phyt)2).
L.-Q. Zheng et al. / Colloids and Surfaces A: Physicochem. Eng. Aspects 207 (2002) 215–221 217
2.3. Turbidity measurements and quasi-elasticlight scattering
Turbidity readings at 600 nm were obtained ona UVIDEC-320 double beam spectrophotometerusing pure water as blanks. Vesicles were dilutedto 0.5 mM with pure water just before experi-ment, then small amounts of concentrated saltsolutions were added and A600 were recorded im-mediately. The pH of suspension was estimatedby parallel pH titration measurements in a saltsolution on an HM-30S pH meter
Vesicle (and aggregated vesicles) diameters wereestimated by quasi-elastic light scattering with theELS-800TS (Photal, Otsuka Electronics). Sampleswere irradiated by a 5 mV Helium–Neon laser at632.8 nm and the autocorrelation function used toobtain the mean vesicle diameter as describedpreviously [16].
2.4. �-potential measurement
The �-potential of Mal3(Phyt)2 vesicles wasmeasured by an ELS-800TS electrophoretic lightscattering apparatus. The cell was made air-tightto prevent the absorption of CO2 into the samplesolutions. The concentration of the vesicles wasusually adjusted to around 0.1 mM in order toachieve an optimum light scattering intensity. Themeasurements were usually repeated at least threetimes and then the averaged values were obtained.Calibration measurements for �-potential wereperformed with uniform size (0.204 �m in diame-ter) polystyrene latex beads (Dow Chemical Co.)suspended in a 1.5 mg ml−1 sodium dodecylsul-fate with 10 mM aqueous solution.
3. Results and discussions
3.1. pH-dependent aggregation–disaggregation ofMal3(Phyt)2 �esicles: turbidity and particle sizes
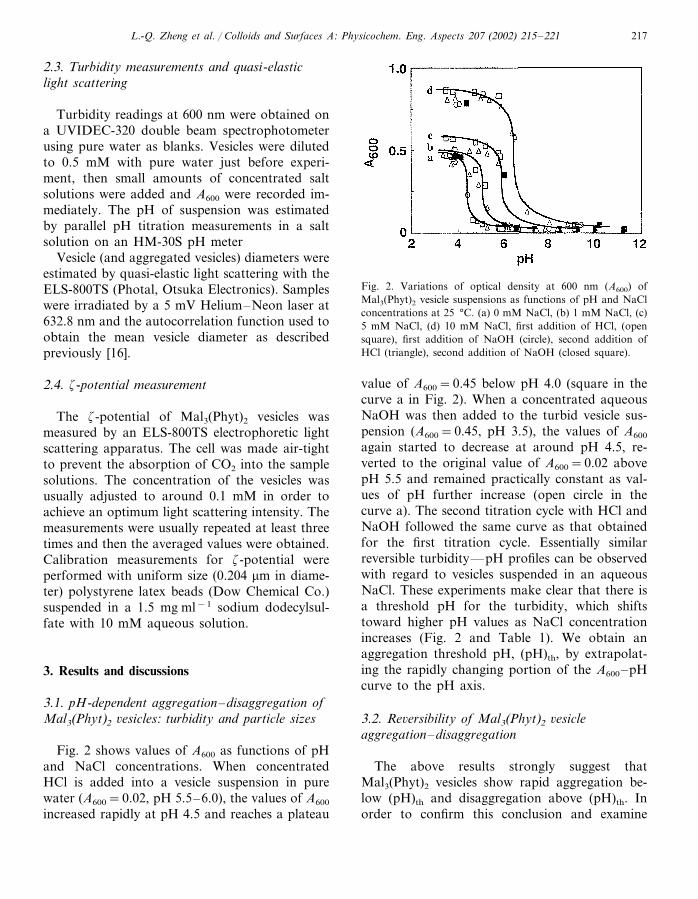
Fig. 2 shows values of A600 as functions of pHand NaCl concentrations. When concentratedHCl is added into a vesicle suspension in purewater (A600=0.02, pH 5.5–6.0), the values of A600
increased rapidly at pH 4.5 and reaches a plateau
Fig. 2. Variations of optical density at 600 nm (A600) ofMal3(Phyt)2 vesicle suspensions as functions of pH and NaClconcentrations at 25 °C. (a) 0 mM NaCl, (b) 1 mM NaCl, (c)5 mM NaCl, (d) 10 mM NaCl, first addition of HCl, (opensquare), first addition of NaOH (circle), second addition ofHCl (triangle), second addition of NaOH (closed square).
value of A600=0.45 below pH 4.0 (square in thecurve a in Fig. 2). When a concentrated aqueousNaOH was then added to the turbid vesicle sus-pension (A600=0.45, pH 3.5), the values of A600
again started to decrease at around pH 4.5, re-verted to the original value of A600=0.02 abovepH 5.5 and remained practically constant as val-ues of pH further increase (open circle in thecurve a). The second titration cycle with HCl andNaOH followed the same curve as that obtainedfor the first titration cycle. Essentially similarreversible turbidity—pH profiles can be observedwith regard to vesicles suspended in an aqueousNaCl. These experiments make clear that there isa threshold pH for the turbidity, which shiftstoward higher pH values as NaCl concentrationincreases (Fig. 2 and Table 1). We obtain anaggregation threshold pH, (pH)th, by extrapolat-ing the rapidly changing portion of the A600–pHcurve to the pH axis.
3.2. Re�ersibility of Mal3(Phyt)2 �esicleaggregation–disaggregation
The above results strongly suggest thatMal3(Phyt)2 vesicles show rapid aggregation be-low (pH)th and disaggregation above (pH)th. Inorder to confirm this conclusion and examine
L.-Q. Zheng et al. / Colloids and Surfaces A: Physicochem. Eng. Aspects 207 (2002) 215–221218
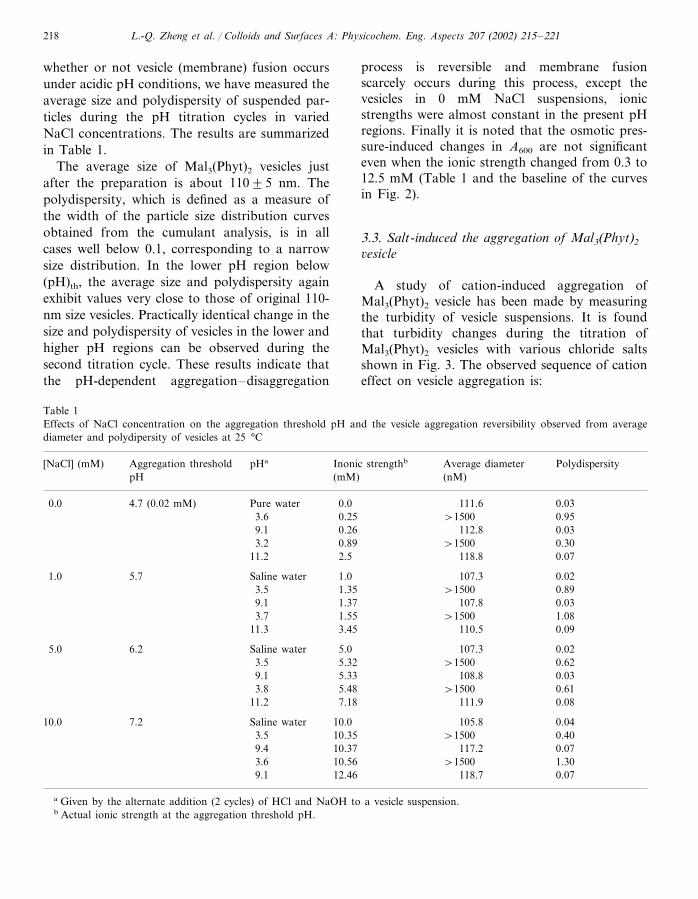
whether or not vesicle (membrane) fusion occursunder acidic pH conditions, we have measured theaverage size and polydispersity of suspended par-ticles during the pH titration cycles in variedNaCl concentrations. The results are summarizedin Table 1.
The average size of Mal3(Phyt)2 vesicles justafter the preparation is about 110�5 nm. Thepolydispersity, which is defined as a measure ofthe width of the particle size distribution curvesobtained from the cumulant analysis, is in allcases well below 0.1, corresponding to a narrowsize distribution. In the lower pH region below(pH)th, the average size and polydispersity againexhibit values very close to those of original 110-nm size vesicles. Practically identical change in thesize and polydispersity of vesicles in the lower andhigher pH regions can be observed during thesecond titration cycle. These results indicate thatthe pH-dependent aggregation–disaggregation
process is reversible and membrane fusionscarcely occurs during this process, except thevesicles in 0 mM NaCl suspensions, ionicstrengths were almost constant in the present pHregions. Finally it is noted that the osmotic pres-sure-induced changes in A600 are not significanteven when the ionic strength changed from 0.3 to12.5 mM (Table 1 and the baseline of the curvesin Fig. 2).
3.3. Salt-induced the aggregation of Mal3(Phyt)2
�esicle
A study of cation-induced aggregation ofMal3(Phyt)2 vesicle has been made by measuringthe turbidity of vesicle suspensions. It is foundthat turbidity changes during the titration ofMal3(Phyt)2 vesicles with various chloride saltsshown in Fig. 3. The observed sequence of cationeffect on vesicle aggregation is:
Table 1Effects of NaCl concentration on the aggregation threshold pH and the vesicle aggregation reversibility observed from averagediameter and polydipersity of vesicles at 25 °C
Aggregation threshold Inonic strengthb Average diameter[NaCl] (mM) PolydispersitypHa
(nM)pH (mM)
0.0Pure water 0.034.7 (0.02 mM)0.0 111.63.6 0.25 �1500 0.95
0.039.1 0.26 112.8�1500 0.303.2 0.89
118.8 0.0711.2 2.5
107.31.0Saline water 0.025.71.00.893.5 1.35 �1500
9.1 1.37 107.8 0.033.7 1.08�15001.55
0.09110.53.4511.3
6.2 Saline water5.0 5.0 107.3 0.020.623.5 5.32 �1500
9.1 5.33 108.8 0.033.8 5.48 �1500 0.61
11.2 7.18 111.9 0.08
Saline water7.2 0.0410.0 105.810.00.40�150010.353.5
9.4 10.37 117.2 0.071.30�150010.563.6
118.712.46 0.079.1
a Given by the alternate addition (2 cycles) of HCl and NaOH to a vesicle suspension.b Actual ionic strength at the aggregation threshold pH.

L.-Q. Zheng et al. / Colloids and Surfaces A: Physicochem. Eng. Aspects 207 (2002) 215–221 219
Fig. 3. Variations of optical density at 600 nm (A600) duringthe sequential addition of chloride salts to 100 nm Mal3(Phyt)2
vesicles dispersed in water. (e) Ca2+, (a) Cs+, (b) K+, (c) Li+,(d) Na+. Data show the means of three or four replicates froma representative experiment. The measurements were done atneutral pH.
properties of distearoyl derivatives of MGDG andDGDG. These authors interpreted their data asindicating that hydrated ions penetrate into theregion between adjacent headgroups and causemonolayer expansion. Since these investigatorsdid not report a difference between the efficaciesof Na+ and Ca2+, it is likely that they investi-gated a different phenomena from that reportedhere. A direct analogy between these results andours is, of course, difficult because of the differ-ences in structures of the glycolipids. Clearly,however, glycolipid– ion interactions areextensive.
3.4. The surface charge of Mal3(Phyt)2 �esicles
Fig. 4 shows the �-potential of Mal3(Phyt)2
vesicles as functions of pH and NaCl concentra-tions. It is seen that the �-potentials ofMal3(Phyt)2 vesicles strongly depend on the valuesof both pH and ionic strength of the aqueousphase; negative values of the �-potential initiallyrise as pH increases, and then go through amaximum at pH�10. Finally, they decrease aspH further increases. In the aqueous 10 mMNaCl, a maximum of the �-potential decreases inthe pH 6–11 region. Above pH 12, �-potential isapproximately constant at around −40 mV irre-spective of NaCl concentrations because the ionicstrength is now mainly determined by NaOHrather than by NaCl concentrations. In an acidicregion below pH 4, estimation of precise values of
Ca2+ �Cs+�K+�Li+�Na+
For the aggregation of glycolipid vesicles, themost effective cations are those with small hy-drated radii or large crystal radii (Ca2+, Cs+ andK+), while the least effective are those with largehydrated radii or small crystal radii (Na+ andLi+) [18]. The above result fully corresponds withthe previous conclusion [18].
It is thought that interactions between ap-proaching membranes in aqueous solutions aredominated by attractive Van der Waals forces,repulsive electrostatic forces, and repulsive hydro-static forces [19]. Obviously, there is no electro-static repulsive forces in nonionic glycolipidbilayers, so the major repulsive force preventingMal3(Phyt)2 vesicle aggregation is the hydrationforce. Supporting evidence for such a view wasobtained by Johnston et al. [20] who observedglycolipid– ion interactions in cerebroside mono-layers and concluded that ion-induced changes inwater structure could explain observed effects ofsalts on gluco- and galacto-cerebroside monolayerexpansion. Wieslander et al. [21] reported effectsof CaCl2 and MgCl2 on the degree of hydration ofAcholeplasma laidlawii diglucosyldiacylgycerol asdetected by 2H-NMR. Tomoaia-Cotisel et al. [22]have observed effects of salts on the monolayer
Fig. 4. �-potentials of Mal3(Phyt)2 vesicles as functions of pHand NaCl concentration at 25 °C.

L.-Q. Zheng et al. / Colloids and Surfaces A: Physicochem. Eng. Aspects 207 (2002) 215–221220
�-potential becomes difficult on account of theaggregation of Mal3(Phyt)2 vesicles. Neverthelesswe have estimated �-potentials of Mal3(Phyt)2
vesicles using highly diluted vesicles (0.03–0.01mM lipid) to minimize the effects of large aggre-gates. It is found that as pH decreases below 4,the decrease in �-potential seems to level off; the�-potentials are about −3�3 mV at pH 3.6 and0�3 mV at pH 1.6.
The �-potential measurements have demon-strated that the Mal3(Phyt)2 vesicle–water inter-faces are negatively charged. Though it has beencommonly recognized that virtually all solid– liq-uid (and vapor– liquid) interfaces acquire chargesby dissociation or adsorption of ionic constituentsof the systems [23], the present observations againraise the question, what is the molecular origin ofthe interfacial charges at the sugar–water inter-face? In this context, it is worthwhile to resolveanalogous negative charging phenomena observedfor nonpolar oil–water and gas bubble–waterinterfaces both in the presence and in the absenceof nonionic surfactants. The common interpreta-tion of the phenomena is that the charges arisefrom an excess adsorption of hydroxyl ions ontothe interface concerned. This hypothesis is mainlybased on the reduction of interfacial charges asthe solution pH is lowered. This is also the casefor the present system. Marinova et al. [24] havecritically examined different hypotheses about theorigin of interfacial charges of nonpolar oil–waterinterfaces and concluded that hydroxyl ions werereleased by the dissociation–association equi-librium of water adsorb at oil–water interface insupport for the OH− adsorption hypothesis.
Taking account of the pH dependence of theinterfacial charges of Mal3(Phyt)2 vesicles, we hereassume that interfacial charges of the Mal3(Phyt)2
arise from two independent mechanisms; one isexcess adsorption of OH− ions at the vesicle–wa-ter interfaces and the other is dissociation ofhydroxyl groups of the maltotriose headgroup ina high pH regime (�pH 11). That is becausedissociation of hydroxyl group of sugar groupsoccurs in high pH conditions: a value of pKa ofhydroxyl groups in amylose is estimated as about13 [25]. Thus the main contribution of the surface
charge comes from the adsorption of OH− groupin the system.
4. Conclusions
The main conclusions are summarized asfollows,1. Large unilamellar vesicles made from a non-
ionic synthetic glycolipid, 1,3-di-o-phytanyl-2-o-(�-maltotriosyl) glycerol showed thepH-dependent aggregation–disaggregationprocess; the vesicle aggregation occurs in thelower pH region and the vesicle disaggregationoccurs in the higher pH region. This process isalmost reversible and the aggregationthreshold pH is dependent on NaCl concen-tration.
2. Large unilamellar vesicles of Mal3(Phyt)2 ag-gregate strongly in the presence of physiologi-cally relevant levels of aqueous saltsolutions.The mechanism in which vesicle ag-gregation occurs is probably related to thedegree of hydration of the bilayer surface andthe charging of the vesicle surface.
3. The negative surface charge on apparentlynonionic glycolipid vesicle was observed byusing the electrophoretic mobility measure-ments. The value of �-potential was dependenton pH and NaCl concentration. Charge rever-sal point of vesicle can not be evidently ob-served between pH 1.6 and 13, which meansthat proton little adsorb on the vesicle surfacein contrast to hydroxyl ion.
4. The adsorption of hydroxyl ions and dissocia-tion of hydroxyl groups of the saccharide moi-ety of a glycolipid molecule are considered tobe the most probable causes of the charging ofthe vesicle surface.
Acknowledgements
We wish to thank to the Natural Sciences FundFoundation of China (Grant No. 29973023,China) and the New Energy and Technology De-velopment Organization (NEDO, Japan) forfinancial support.
L.-Q. Zheng et al. / Colloids and Surfaces A: Physicochem. Eng. Aspects 207 (2002) 215–221 221
References
[1] (a) W. Curatolo, Biochim. Biophys. Acta 906 (1987) 111;(b) W. Curatolo, Biochim. Biophys. Acta 906 (1987) 137references therein.
[2] S. Hakomori, Pure Appl. Chem. 63 (1991) 473.[3] L. Eggens, B.A. Fenderson, T. Toyokuni, B. Dean, M.R.
Stroud, S. Hakomori, J. Biol. Chem. 264 (1989) 9476.[4] N. Kojima, Trends Glycosci. Glycotechnol. 4 (1992) 491.[5] K. Kates, in: M. Kates (Ed.), Handbook of Lipid Re-
search 6, Glycolipids, Phosphoglycolipids, and Sulfogly-colipids, Plenum Press, New York, London, 1990, pp.1–122.
[6] H.-J. Hinz, L. Six, K.-P. Ruess, M. Lieflander, Biochem-istry 24 (1985) 806.
[7] R. Koynova, M. Caffrey, Chem. Phys. Lipids 69 (1994)181 references therein.
[8] W. Von Rybinski, Curr. Opin. Coll. Int. Sci. 1 (1996) 587references therein.
[9] F. Nilsson, O. Soderman, I. Johansson, Langmuir 12(1996) 902.
[10] M.S. Webb, C.P.S. Tilcock, B.R. Green, Biochim. Bio-phys. Acta 938 (1988) 323.
[11] M.S. Webb, B.R. Green, Biochim. Biophys. Acta 1030(1990) 231.
[12] A. Menikh, M. Fragata, Eur. Biophys. J. 22 (1993) 249.
[13] M. Fragata, A. Menikh, S. Robert, J. Phys. Chem. 97(1993) 13920.
[14] Hato, M., Minamikawa, H., Tamada, K., Baba, T., Tan-abe, Y., Adv. Coll. Int. Sci., in press.
[15] H. Minamikawa, M. Hato, Langmuir 16 (1998) 4503.[16] L.D. Mayer, M.J. Hope, P.R. Cullis, Biochim. Biophys.
Acta 858 (1986) 161.[17] H.J. Gruber, H. Schindler, Biochim. Biophys. Acta 1189
(1994) 212.[18] M.S. Webb, C.P.S. Tilcock, B.R. Green, Biochim. Bio-
phys. Acta 938 (1988) 323.[19] J.N. Israelachvilli, in: V. Degiorgio, M. Corti (Eds.),
Physics of Amphiphiles: Micelles, Vesicles and Microe-mulsions, North-Holland, Amsterdam, 1985, pp. 24–58.
[20] D.S. Johnston, E. Coppard, D. Chapman, Biochim. Bio-phys. Acta 815 (1985) 325.
[21] A. Wieslander, J. Ulmius, G. Lindblom, K. Fontell,Biochim. Biophys. Acta 512 (1978) 241.
[22] M. Tomoaia-Cotisel, J. Zsako, E. Chifu, P.J. Quinn,Chem. Phys. Lipids 34 (1983) 55.
[23] D.F. Evans, H. Wennerstrom, The Colloidal Domain,VCH Publishers, Inc, New York, 1994.
[24] K.G. Marinova, R.G. Alargova, N.D. Denkov, O.D.Velev, D.N. Petsev, I.B. Ivanov, R.P. Borwankar, Lang-muir 12 (1996) 2045.
[25] H.L. Doppert, A.J. Staverman, J. Polym. Sci. A-1 (4)(1966) 2367–2372.